| A Clear and Simple Commercial Bank, Revolving Around Customers, Combining Technology With Human Touch Siena, 6th August 2024 2Q-24 & 1H-24 Results & Business Plan 2024-2028 |

| 2 Disclaimer THIS DOCUMENT IS BEING PROVIDED TO YOU SOLELY FOR YOUR INFORMATION. THIS DOCUMENT, WHICH WAS PREPARED BY BANCA MONTE DEI PASCHI DI SIENA S.P.A. (THE “COMPANY” OR “BMPS” AND TOGETHER WITH ITS CONSOLIDATED SUBSIDIARIES, THE “GROUP”), IS PRELIMINARY IN NATURE AND MAY BE SUBJECT TO UPDATING, REVISION AND AMENDMENT. IT MAY NOT BE REPRODUCED IN ANY FORM, FURTHER DISTRIBUTED OR PASSED ON, DIRECTLY OR INDIRECTLY, TO ANY OTHER PERSON, OR RE-PUBLISHED IN ANY MANNER, IN WHOLE OR IN PART, FOR ANY PURPOSE. ANY FAILURE TO COMPLY WITH THESE RESTRICTIONS MAY CONSTITUTE A VIOLATION OF APPLICABLE LAWS AND VIOLATE THE COMPANY’S RIGHTS. IMPORTANT: You must read the following before continuing. The following applies to this document, the oral presentation of the information in this document by the Company or any person on behalf of the Company, and any question-and-answer session that follows the oral presentation (collectively, the “Information”). In accessing the Information, you agree to be bound by the following terms and conditions. This document was prepared by the Company solely for information purposes and for use in presentations of the Group’s strategies and financials. The Information contained herein provides a summary of the Group’s 2024 half year financial statements (“1H-24”), which are subject to audit, and is not complete. 1H-24 complete interim financialstatements will be available on the Company’s website at www.gruppomps.it. The information, statements and opinions contained in this presentation are for information purposes only and do not constitute (and are not intended to constitute) an offer of securities for sale, or solicitation of an offer to purchase or subscribe securities, nor shall it or any part of it form the basis of or be relied upon in connection with or act as any inducement or recommendation to enter into any contract or commitment or investment decision whatsoever. Neither this document nor any part of it nor the fact of its distribution may form the basis of or be relied upon in connection with any contract or investment decision in relation thereto. Any recipient is therefore responsible for his own independent investigations and assessments regarding the risks, benefits, adequacy and suitability of any operation carried out after the date of this document. Any securities referred to herein have not been registered and will not be registered in the United States under the U.S. Securities Act of 1933, as amended (the “Securities Act”) or under the securities laws of any State or other jurisdiction of the United States or in United Kingdom, Australia, Canada or Japan or any other jurisdiction where such an offer or solicitation would be unlawful (the “Other Countries”). No securities may be offered or sold in the United States unless such securities are registered under the Securities Act, or an exemption from the registration requirements of the Securities Act is available. The Company does not intend to register or conduct any public offer of securities in the United States or in Other Countries. This document does not constitute or form a part of any offer or solicitation to purchase or subscribe for securities in the United States or in Other Countries. To the extent applicable, any industry and market data contained in this document has come from official or third-party sources. Third-party industry publications, studies and surveys generally state that the data contained therein has been obtained from sources believed to be reliable, but that there is no guarantee of the fairness, quality, accuracy, relevance, completeness or sufficiency of such data. The Company has not independently verified such data contained therein. In addition, some industry and market data contained in this document may come from the Company’s own internal research and estimates, based on the knowledge and experience of the Company’s management in the market in which the Company operates. Any such research and estimates, and their underlying methodology and assumptions, have not been verified by any independent source for accuracy or completeness and are subject to change without notice. Accordingly, undue reliance should not be placed on any of the industry or market data contained in this document. This document also contains a summary of the Group’s 2024-2028 Business Plan and may include certain forward-looking statements, projections, objectives and estimates reflecting the current views of the management of the Company and the Group with respect to future events. Forward-looking statements, projections, objectives, estimates and forecasts are generally identifiable by the use of the words “may”, “will”, “should”, “plan”, “expect”, “anticipate”, “estimate”, “believe”, “intend”, “project”, “goal” or “target” or the negative of these words or other variations on these words or comparable terminology. These forward-looking statements include, but are not limited to, all statements other than statements of historical facts, including, without limitation, those regarding the Company’s and/or Group’s future financial position and results of operations, strategy, plans, objectives, goals and targets and future developments in the markets where the Group participates or is seeking to participate. Any forward-looking statements in this document are subject to a number of risks and uncertainties. Due to such uncertainties and risks, readers are cautioned not to place undue reliance on such forward-looking statements as a prediction of actual results. The Group’s ability to achieve its projected objectives or results is dependent on many factors which are outside the Group’s control. Actual results may differ materially from those projected or implied in the forward-looking statements. Such forward-looking information involves risks and uncertainties that could significantly affect expected results and is based on certain key assumptions. Moreover, such forward-looking information contained herein has been prepared on the basis of a number of assumptions which may prove to be incorrect and, accordingly, actual results may vary. All forward-looking statements included herein are based on information available to the Company as at the date hereof. The Company undertakes no obligation to update publicly or revise any forward-looking statement, whether as a result of new information, future events or otherwise, except as may be required by applicable law. Neither the Company nor any member of the Group nor any of its or their respective representatives, directors, or employees shall be liable at any time in connection with this presentation or any of its contents for any damages including, but not limited to, loss of profits or loss of opportunity, or any other liability whatsoever which may arise in connection with any use and/or reliance placed on this presentation. The Company, the Group and their representatives undertake no obligation to provide the recipients with access to any additional information or to update or revise this document or to correct any inaccuracies or omissions contained herein that may become apparent. This presentation shall remain the property of the Company. Pursuant to paragraph 2, article 154-bis of the Consolidated Finance Act, the Financial Reporting Officer, Mr. Nicola Massimo Clarelli, declares that the accounting information contained in this document corresponds to the document results, books and accounting records. |
| 3 Agenda 1. 2Q-24 & 1H-24 Results 2. Business Plan 2024-2028 3. Closing Remarks and Q&A Session Appendix – Supporting Materials A. Our Evolving Journey: Strategic Highlights Luigi Lovaglio B. Updated Financial Targets Chief Executive Officer, General Manager |

| 4 1. 2Q-24 & 1H-24 Results |
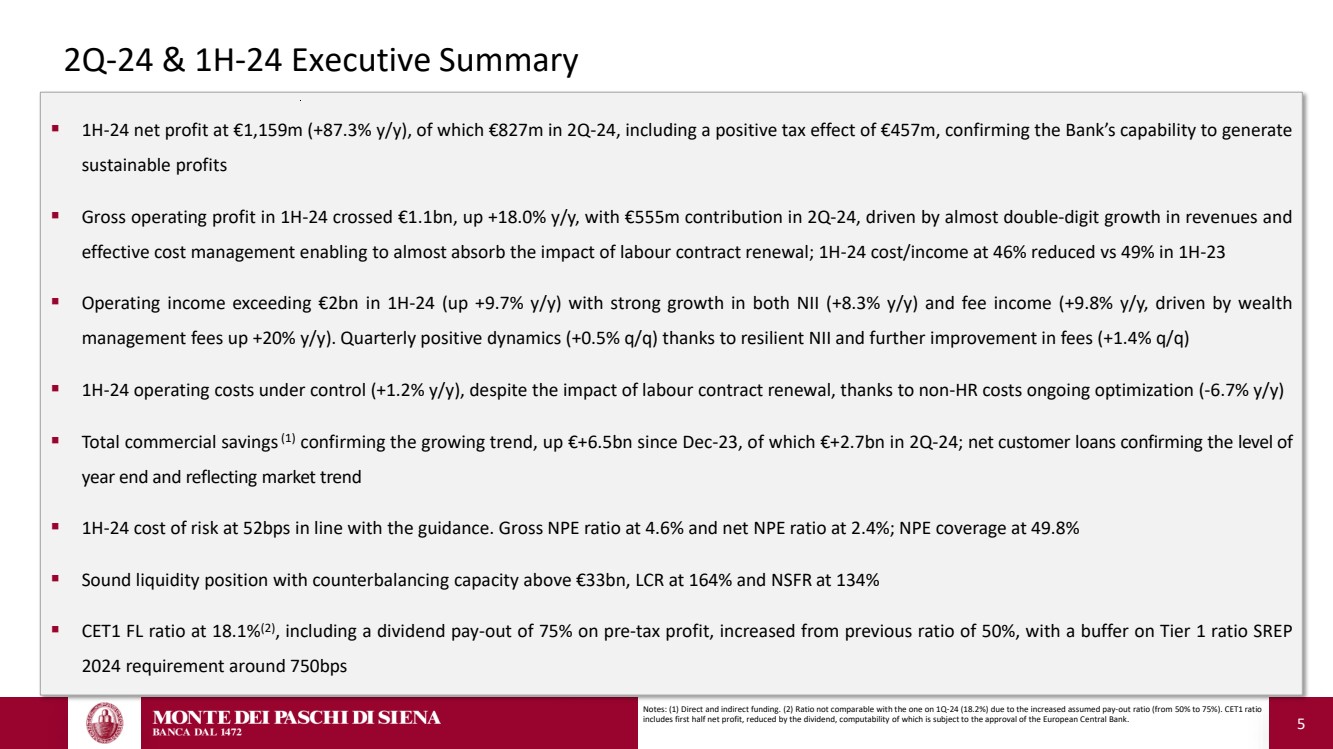
| 5 2Q-24 & 1H-24 Executive Summary Notes: (1) Direct and indirect funding. (2) Ratio not comparable with the one on 1Q-24 (18.2%) due to the increased assumed pay-out ratio (from 50% to 75%). CET1 ratio includes first half net profit, reduced by the dividend, computability of which is subject to the approval of the European Central Bank. ▪ 1H-24 net profit at €1,159m (+87.3% y/y), of which €827m in 2Q-24, including a positive tax effect of €457m, confirming the Bank’s capability to generate sustainable profits ▪ Gross operating profit in 1H-24 crossed €1.1bn, up +18.0% y/y, with €555m contribution in 2Q-24, driven by almost double-digit growth in revenues and effective cost management enabling to almost absorb the impact of labour contract renewal; 1H-24 cost/income at 46% reduced vs 49% in 1H-23 ▪ Operating income exceeding €2bn in 1H-24 (up +9.7% y/y) with strong growth in both NII (+8.3% y/y) and fee income (+9.8% y/y, driven by wealth management fees up +20% y/y). Quarterly positive dynamics (+0.5% q/q) thanks to resilient NII and further improvement in fees (+1.4% q/q) ▪ 1H-24 operating costs under control (+1.2% y/y), despite the impact of labour contract renewal, thanks to non-HR costs ongoing optimization (-6.7% y/y) ▪ Total commercial savings(1) confirming the growing trend, up €+6.5bn since Dec-23, of which €+2.7bn in 2Q-24; net customer loans confirming the level of year end and reflecting market trend ▪ 1H-24 cost of risk at 52bps in line with the guidance. Gross NPE ratio at 4.6% and net NPE ratio at 2.4%; NPE coverage at 49.8% ▪ Sound liquidity position with counterbalancing capacity above €33bn, LCR at 164% and NSFR at 134% ▪ CET1 FL ratio at 18.1%(2) , including a dividend pay-out of 75% on pre-tax profit, increased from previous ratio of 50%, with a buffer on Tier 1 ratio SREP 2024 requirement around 750bps |
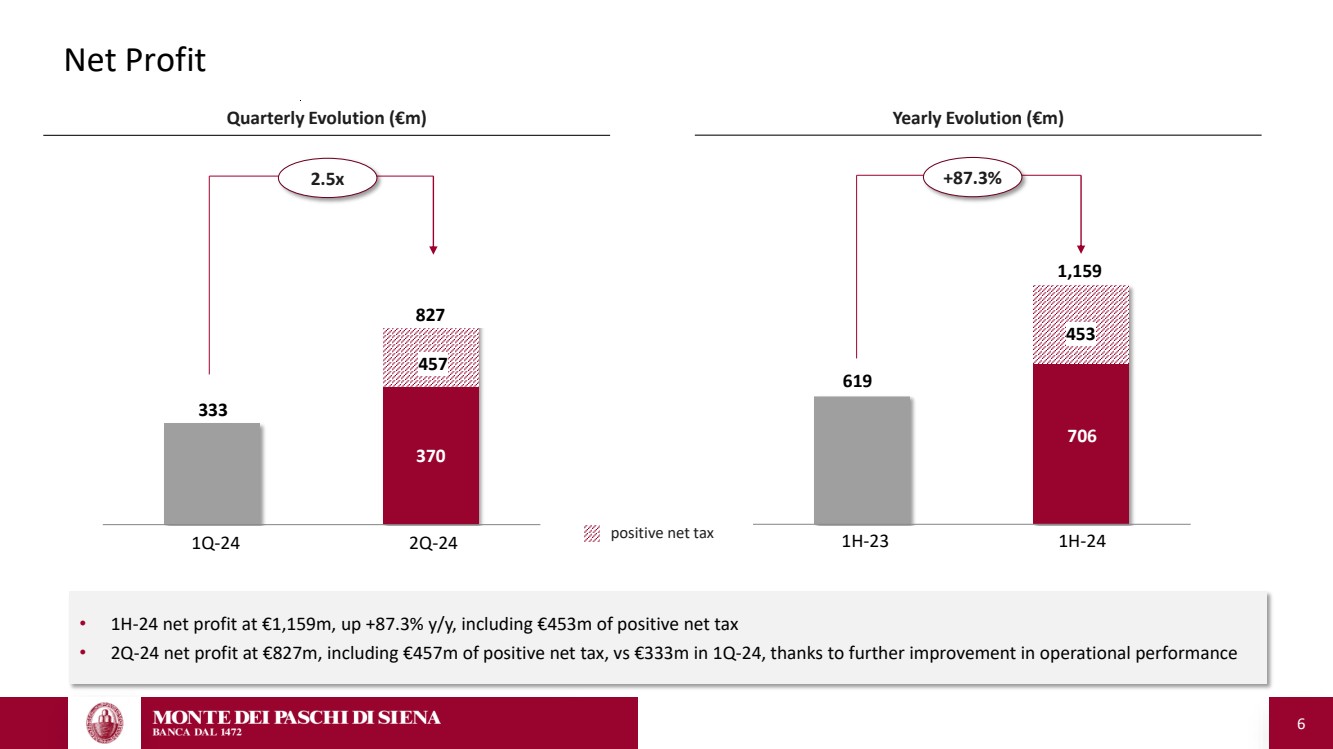
| 6 Net Profit 2.5x +87.3% Quarterly Evolution (€m) Yearly Evolution (€m) 333 370 827 619 706 1,159 positive net tax • 1H-24 net profit at €1,159m, up +87.3% y/y, including €453m of positive net tax • 2Q-24 net profit at €827m, including €457m of positive net tax, vs €333m in 1Q-24, thanks to further improvement in operational performance 1Q-24 2Q-24 1H-23 1H-24 457 453 370 706 |
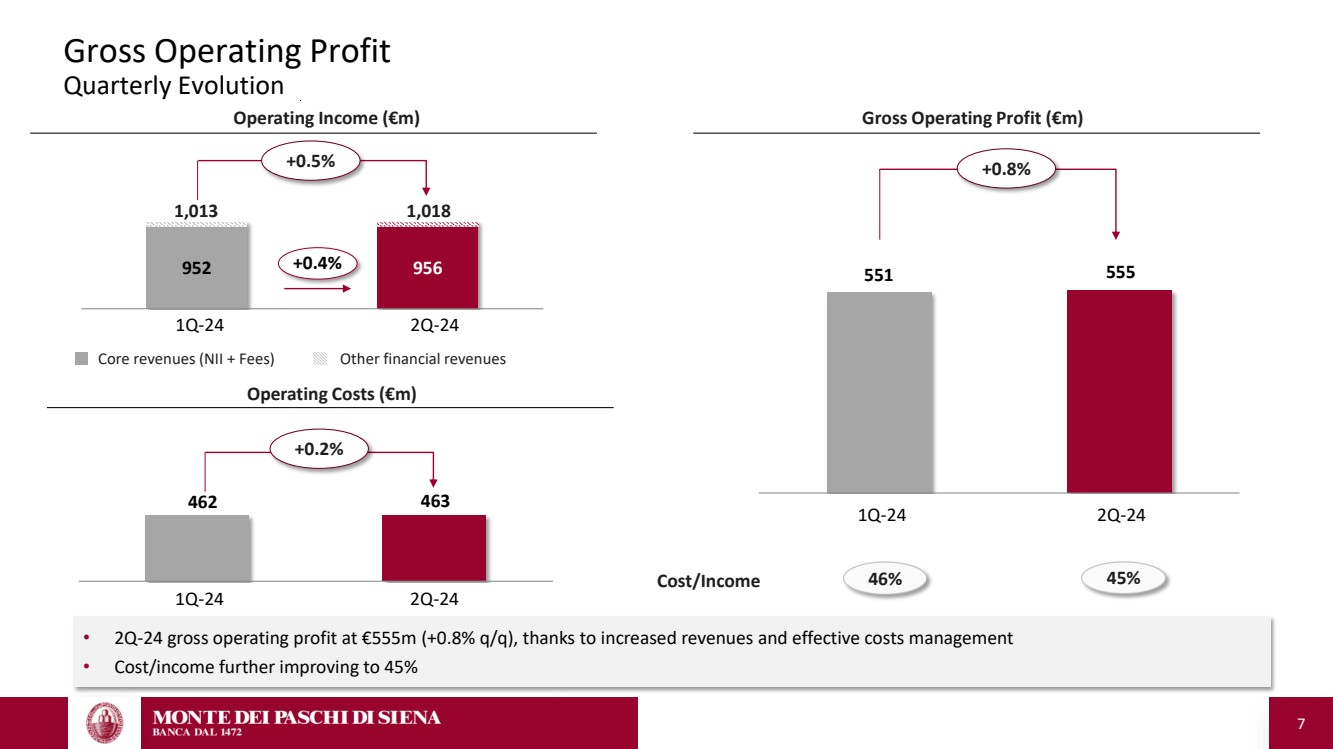
| 7 Gross Operating Profit Quarterly Evolution 551 555 Operating Income (€m) Gross Operating Profit (€m) Operating Costs (€m) 45% Core revenues (NII + Fees) Other financial revenues Cost/Income 46% +0.5% 462 463 +0.8% +0.2% 952 956 +0.4% 1,013 1,018 1Q-24 2Q-24 1Q-24 2Q-24 1Q-24 2Q-24 • 2Q-24 gross operating profit at €555m (+0.8% q/q), thanks to increased revenues and effective costs management • Cost/income further improving to 45% |
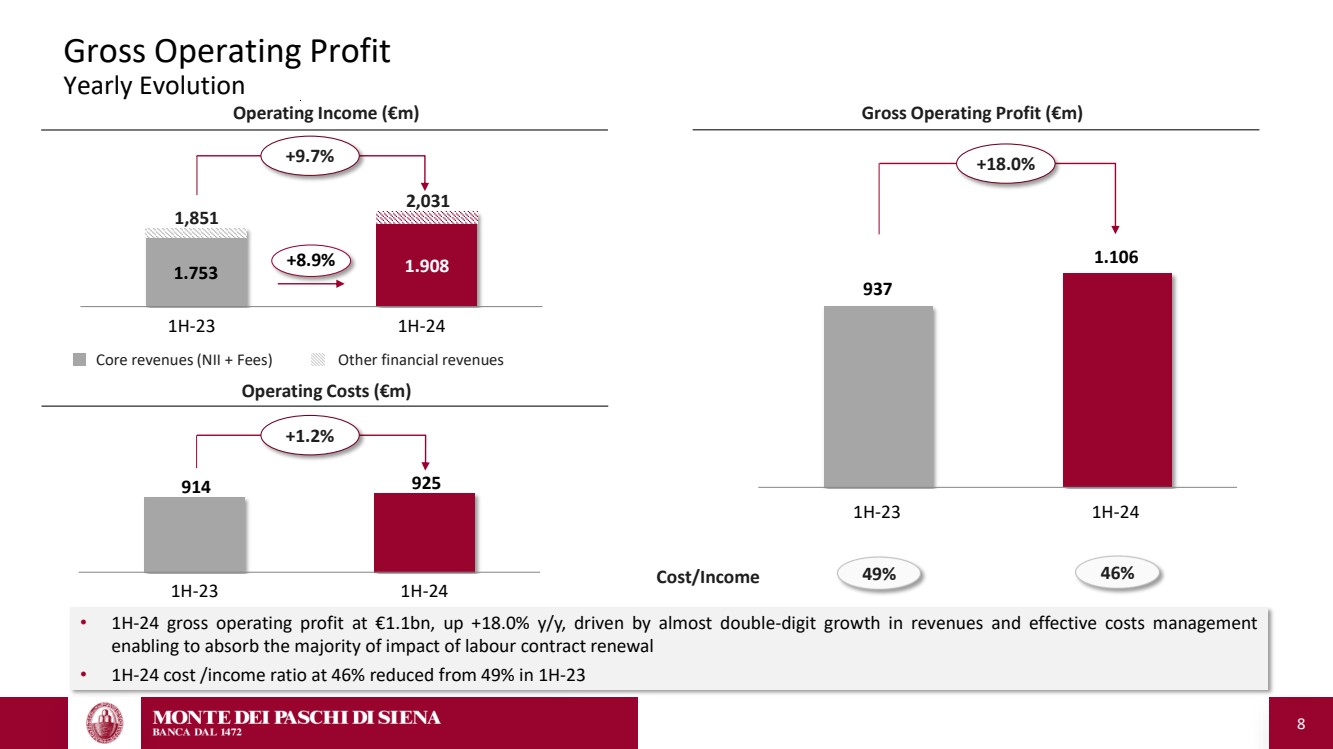
| 8 Gross Operating Profit Yearly Evolution 937 1.106 1.753 1.908 Operating Income (€m) Gross Operating Profit (€m) Operating Costs (€m) 46% Core revenues (NII + Fees) Other financial revenues Cost/Income 49% +9.7% +18.0% +1.2% +8.9% 914 925 1,851 2,031 1H-23 1H-24 1H-23 1H-24 1H-23 1H-24 • 1H-24 gross operating profit at €1.1bn, up +18.0% y/y, driven by almost double-digit growth in revenues and effective costs management enabling to absorb the majority of impact of labour contract renewal • 1H-24 cost /income ratio at 46% reduced from 49% in 1H-23 |
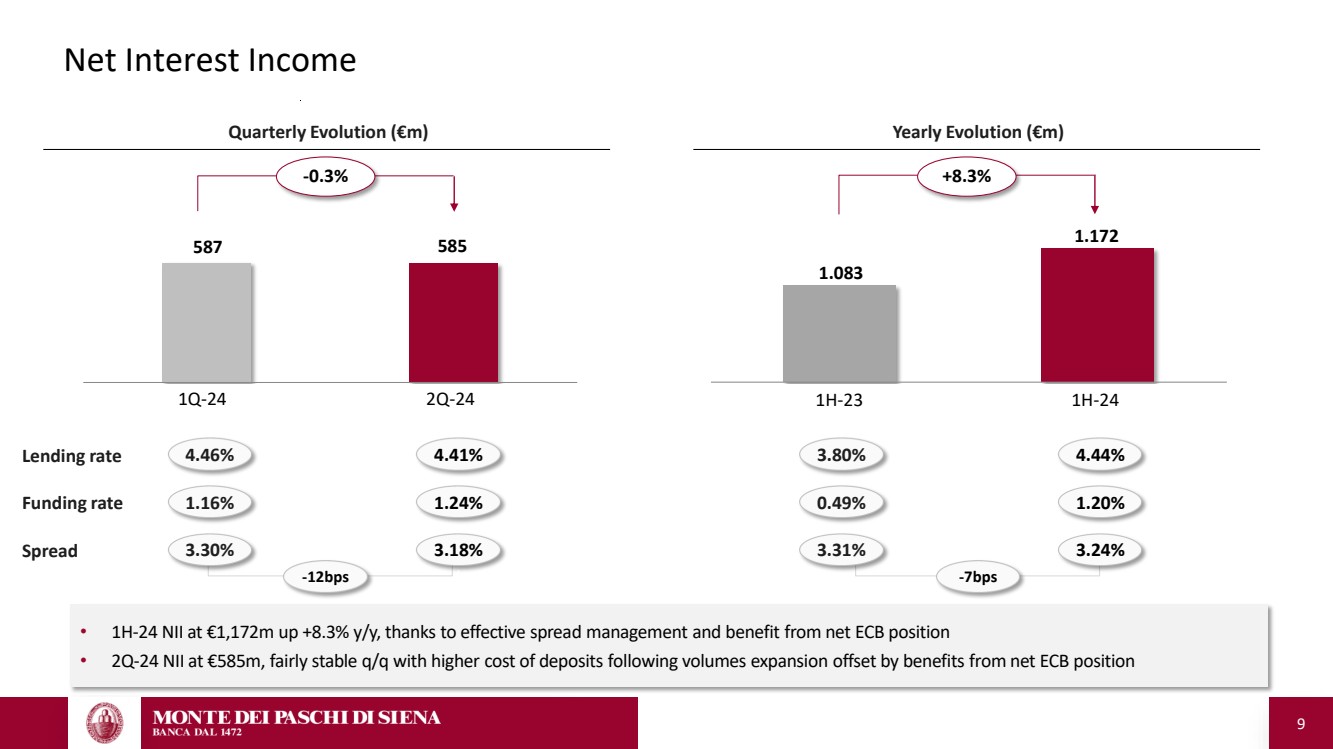
| 9 Net Interest Income 587 585 Lending rate Funding rate Spread 4.41% 1.24% 3.18% 4.46% 1.16% 3.30% Yearly Evolution (€m) 3.80% 0.49% 3.31% 4.44% 1.20% 3.24% -12bps -7bps +8.3% Quarterly Evolution (€m) -0.3% 1.083 1.172 1Q-24 2Q-24 1H-23 1H-24 • 1H-24 NII at €1,172m up +8.3% y/y, thanks to effective spread management and benefit from net ECB position • 2Q-24 NII at €585m, fairly stable q/q with higher cost of deposits following volumes expansion offset by benefits from net ECB position |
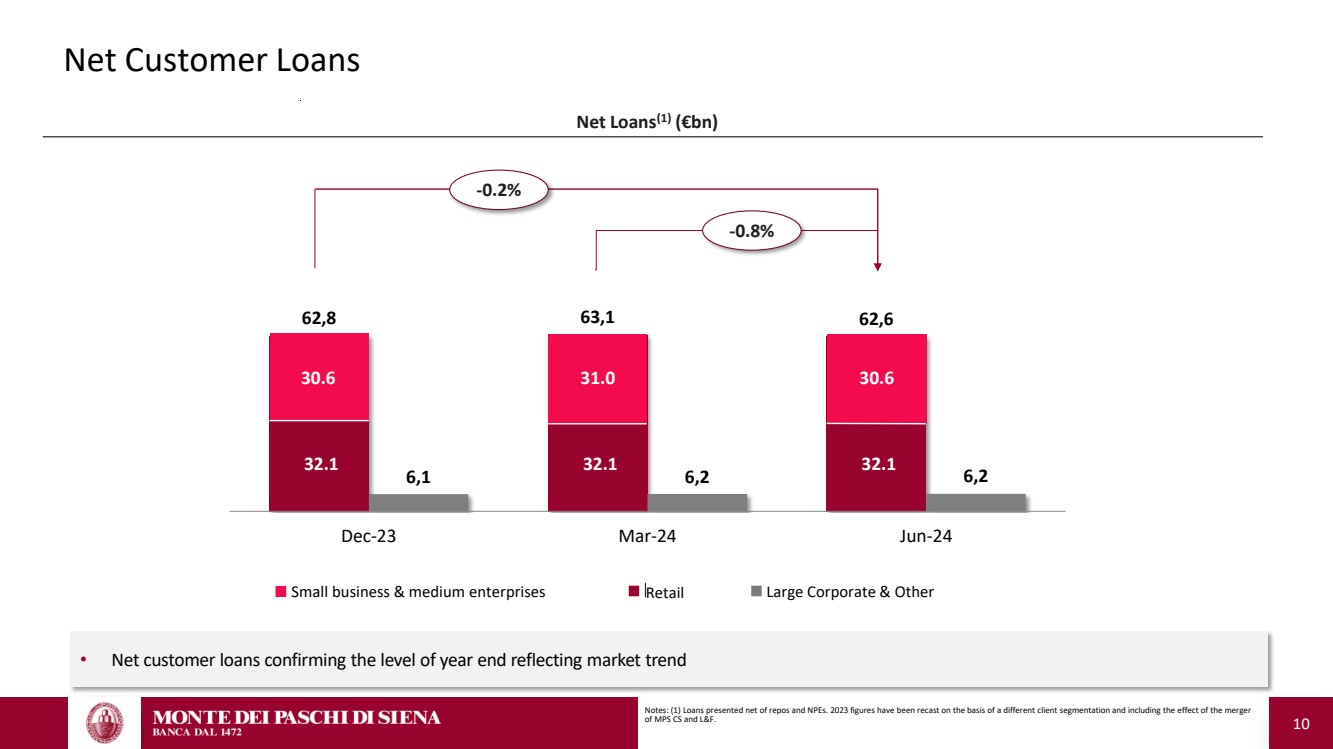
| 10 Net Customer Loans Notes: (1) Loans presented net of repos and NPEs. 2023 figures have been recast on the basis of a different client segmentation and including the effect of the merger of MPS CS and L&F. 62,8 63,1 62,6 6,1 6,2 6,2 Dec-23 Mar-24 Jun-24 -0.2% -0.8% Net Loans(1) (€bn) 32.1 30.6 31.0 30.6 32.1 32.1 Small business & medium enterprises Retail Large Corporate & Other • Net customer loans confirming the level of year end reflecting market trend |
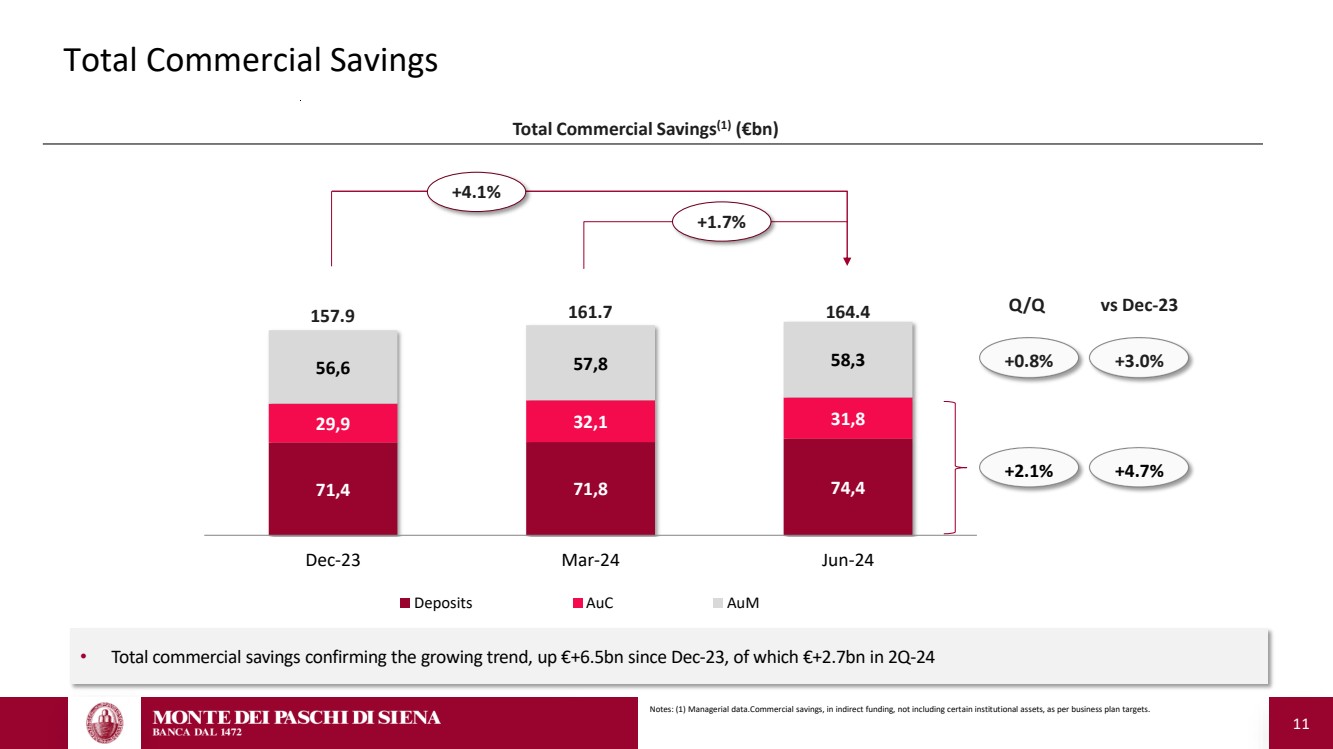
| 11 Total Commercial Savings Notes: (1) Managerial data.Commercial savings, in indirect funding, not including certain institutional assets, as per business plan targets. Total Commercial Savings(1) (€bn) 71,4 71,8 74,4 29,9 32,1 31,8 56,6 57,8 58,3 Dec-23 Mar-24 Jun-24 Deposits AuC AuM +2.1% +0.8% Q/Q +3.0% vs Dec-23 +4.7% +4.1% 157.9 161.7 164.4 +1.7% • Total commercial savings confirming the growing trend, up €+6.5bn since Dec-23, of which €+2.7bn in 2Q-24 |
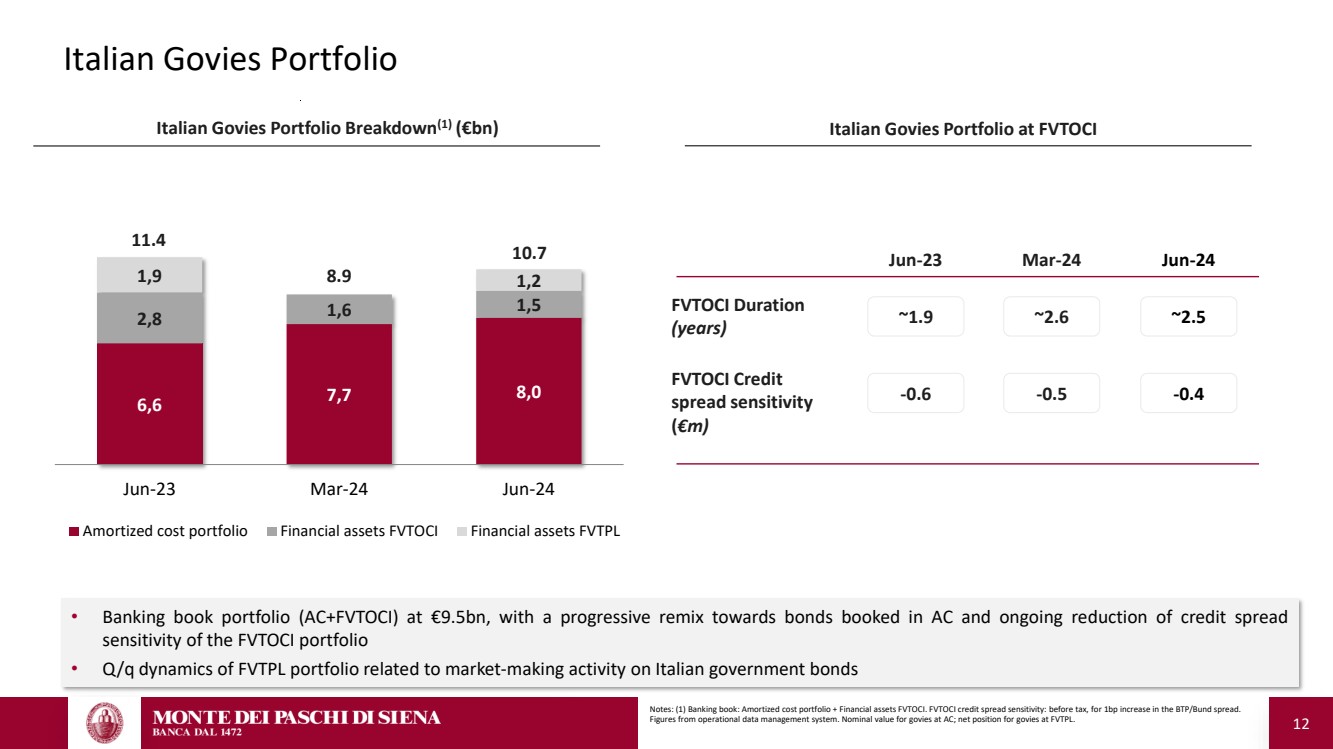
| 12 Italian Govies Portfolio Notes: (1) Banking book: Amortized cost portfolio + Financial assets FVTOCI. FVTOCI credit spread sensitivity: before tax, for 1bp increase in the BTP/Bund spread. Figures from operational data management system. Nominal value for govies at AC; net position for govies at FVTPL. Italian Govies Portfolio Breakdown(1) (€bn) Italian Govies Portfolio at FVTOCI FVTOCI Duration (years) Jun-23 Jun-24 FVTOCI Credit spread sensitivity (€m) 6,6 7,7 8,0 2,8 1,6 1,5 1,9 1,2 Jun-23 Mar-24 Jun-24 Amortized cost portfolio Financial assets FVTOCI Financial assets FVTPL 11.4 8.9 ~1.9 ~2.5 -0.6 -0.4 10.7 ~2.6 Mar-24 -0.5 • Banking book portfolio (AC+FVTOCI) at €9.5bn, with a progressive remix towards bonds booked in AC and ongoing reduction of credit spread sensitivity of the FVTOCI portfolio • Q/q dynamics of FVTPL portfolio related to market-making activity on Italian government bonds |
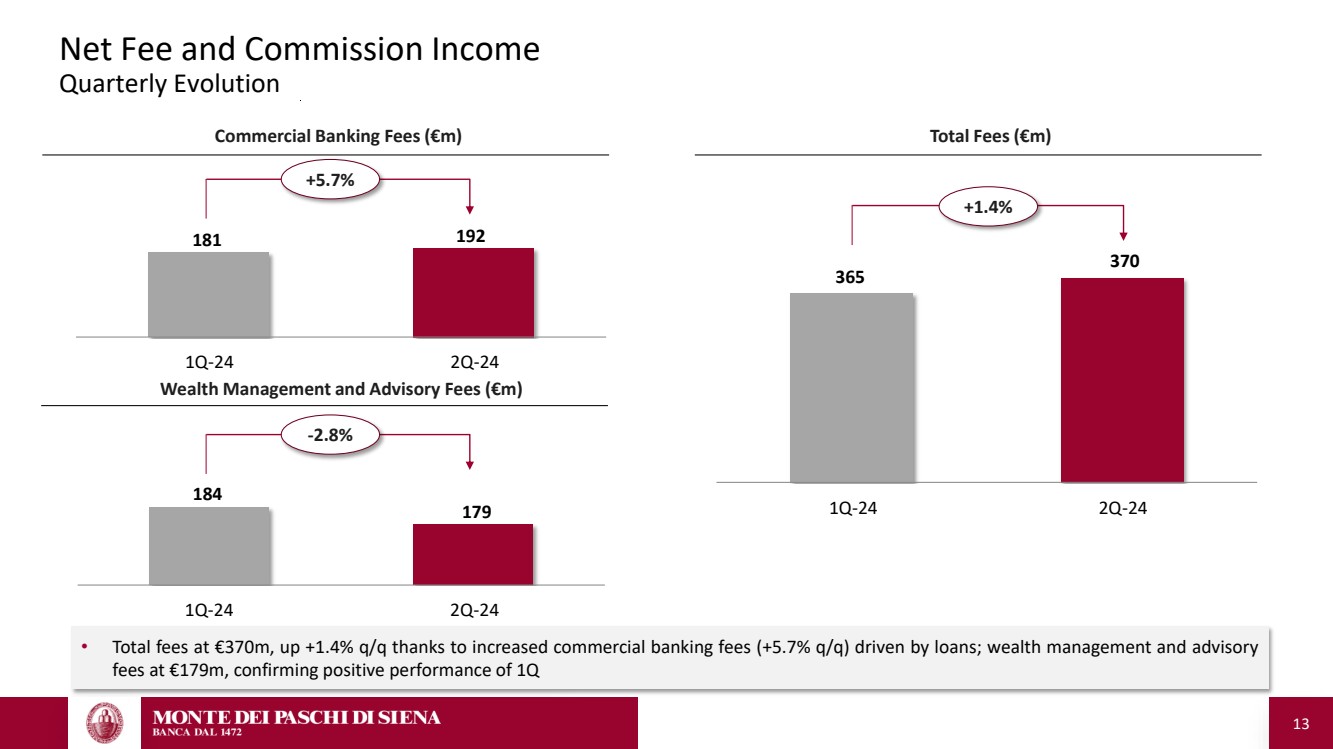
| 13 181 192 Net Fee and Commission Income Quarterly Evolution 184 179 Commercial Banking Fees (€m) Total Fees (€m) Wealth Management and Advisory Fees (€m) +1.4% 365 370 -2.8% +5.7% 1Q-24 2Q-24 1Q-24 2Q-24 1Q-24 2Q-24 • Total fees at €370m, up +1.4% q/q thanks to increased commercial banking fees (+5.7% q/q) driven by loans; wealth management and advisory fees at €179m, confirming positive performance of 1Q |
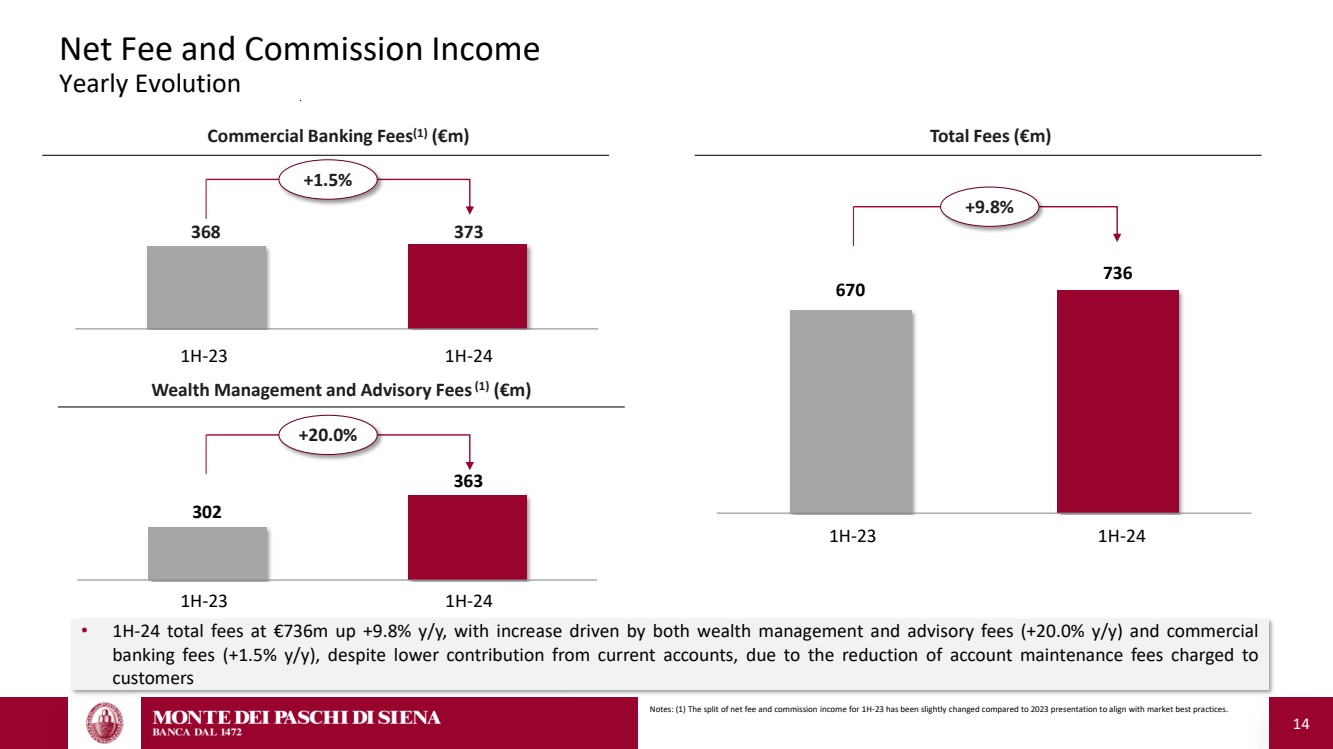
| 14 Total Fees (€m) Notes: (1) The split of net fee and commission income for 1H-23 has been slightly changed compared to 2023 presentation to align with market best practices. 670 736 302 363 368 373 Commercial Banking Fees(1) (€m) Wealth Management and Advisory Fees(1) (€m) +9.8% +1.5% +20.0% Net Fee and Commission Income Yearly Evolution 1H-23 1H-24 1H-23 1H-24 1H-23 1H-24 • 1H-24 total fees at €736m up +9.8% y/y, with increase driven by both wealth management and advisory fees (+20.0% y/y) and commercial banking fees (+1.5% y/y), despite lower contribution from current accounts, due to the reduction of account maintenance fees charged to customers |
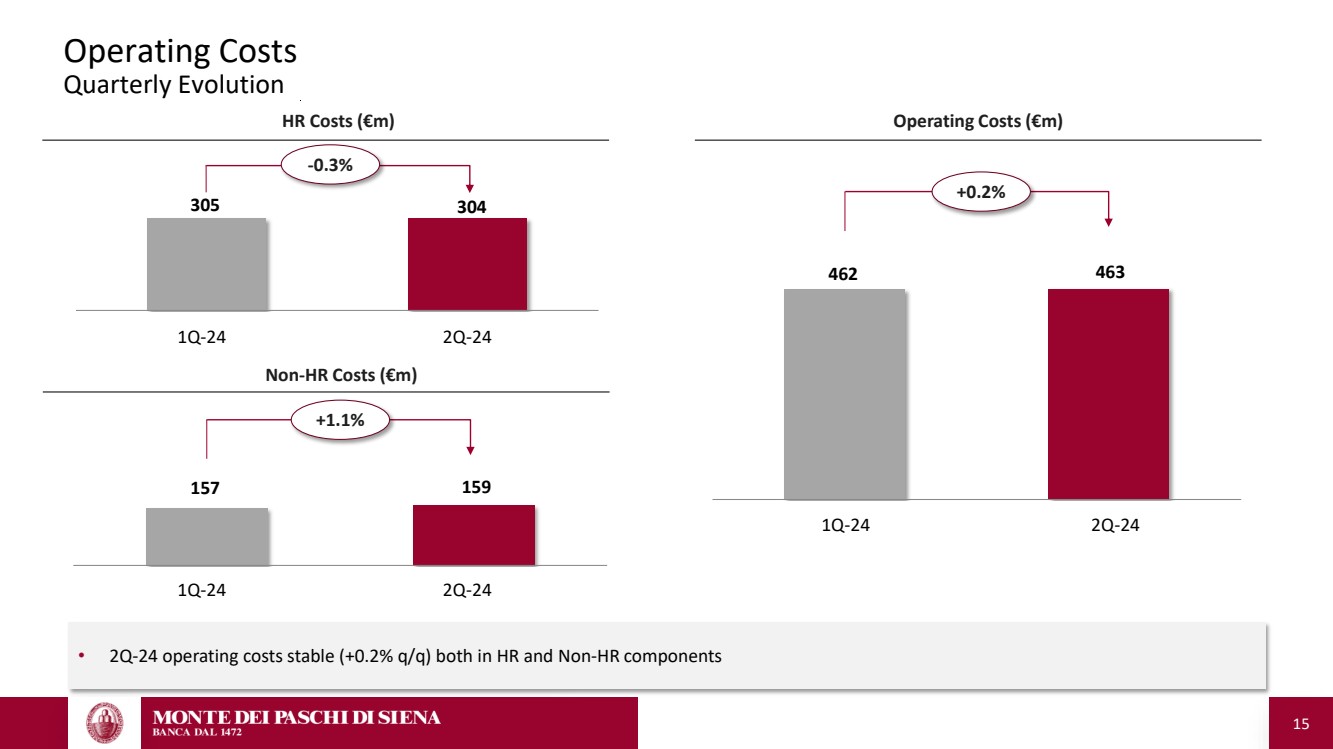
| 15 Operating Costs Quarterly Evolution 157 159 HR Costs (€m) Operating Costs (€m) Non-HR Costs (€m) 462 463 305 304 -0.3% +1.1% +0.2% 1Q-24 2Q-24 1Q-24 2Q-24 1Q-24 2Q-24 • 2Q-24 operating costs stable (+0.2% q/q) both in HR and Non-HR components |
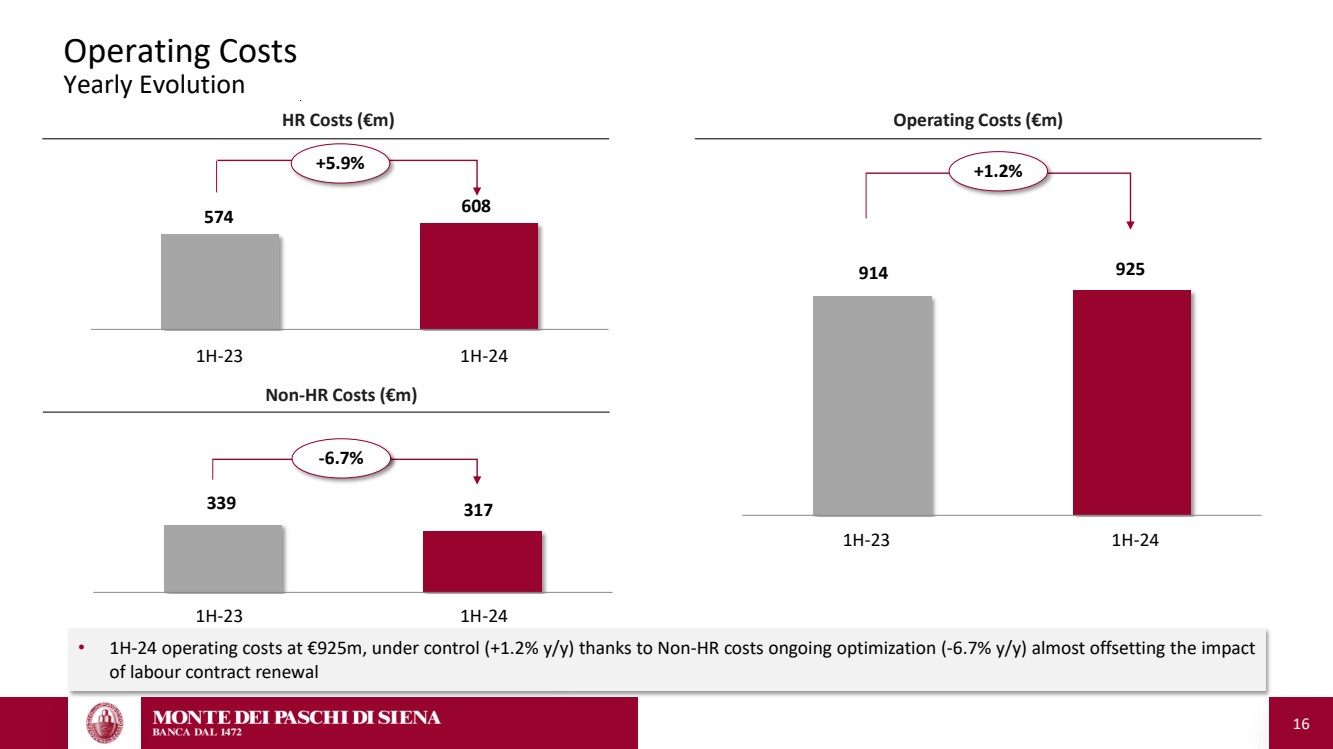
| 16 339 317 -7.2% 574 608 HR Costs (€m) Operating Costs (€m) Non-HR Costs (€m) 914 925 +1.2% -6.7% +5.9% Operating Costs Yearly Evolution 1H-23 1H-24 1H-23 1H-24 1H-23 1H-24 • 1H-24 operating costs at €925m, under control (+1.2% y/y) thanks to Non-HR costs ongoing optimization (-6.7% y/y) almost offsetting the impact of labour contract renewal |
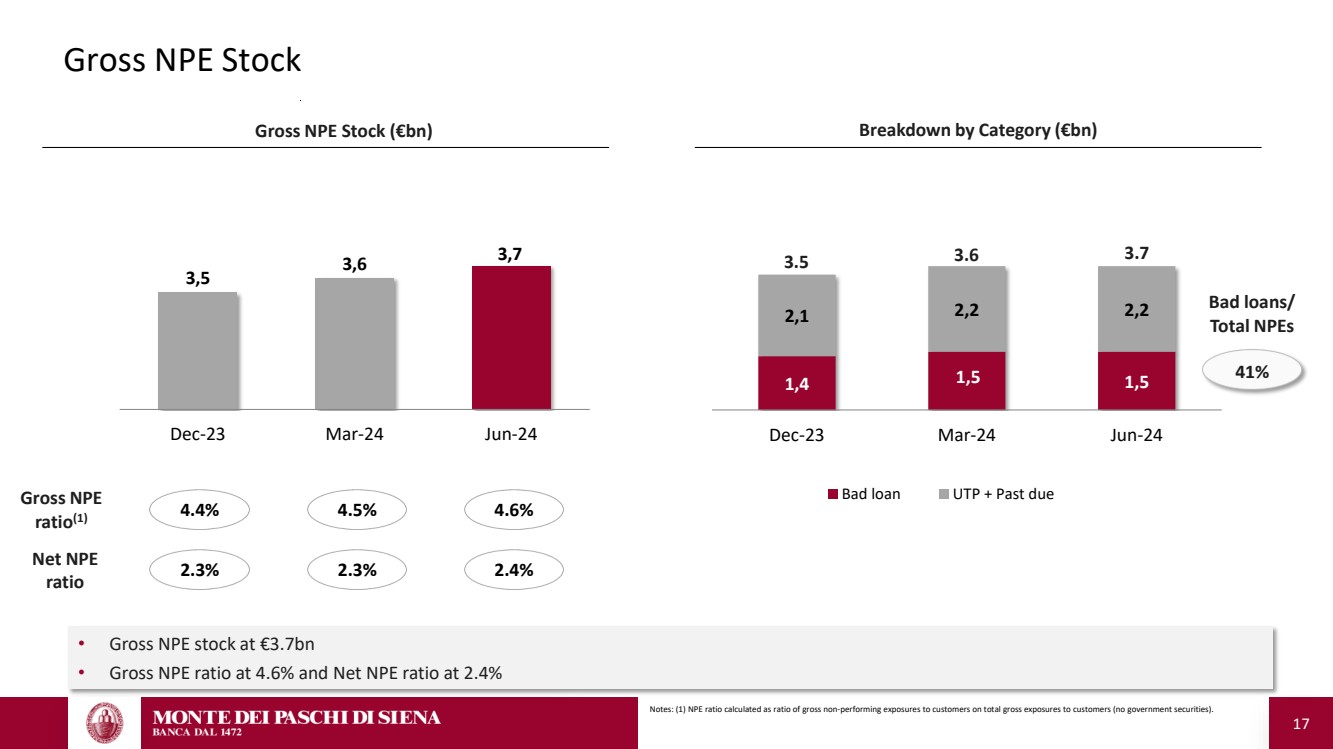
| 17 Notes: (1) NPE ratio calculated as ratio of gross non-performing exposures to customers on total gross exposures to customers (no government securities). 1,4 1,5 1,5 2,1 2,2 2,2 Dec-23 Mar-24 Jun-24 Bad loan UTP + Past due 3,5 3,6 3,7 Dec-23 Mar-24 Jun-24 Gross NPE Stock (€bn) Breakdown by Category (€bn) Gross NPE ratio(1) 4.6% Net NPE ratio 2.4% 4.4% 2.3% 3.6 3.5 4.5% 2.3% 3.7 41% Bad loans/ Total NPEs Gross NPE Stock • Gross NPE stock at €3.7bn • Gross NPE ratio at 4.6% and Net NPE ratio at 2.4% |
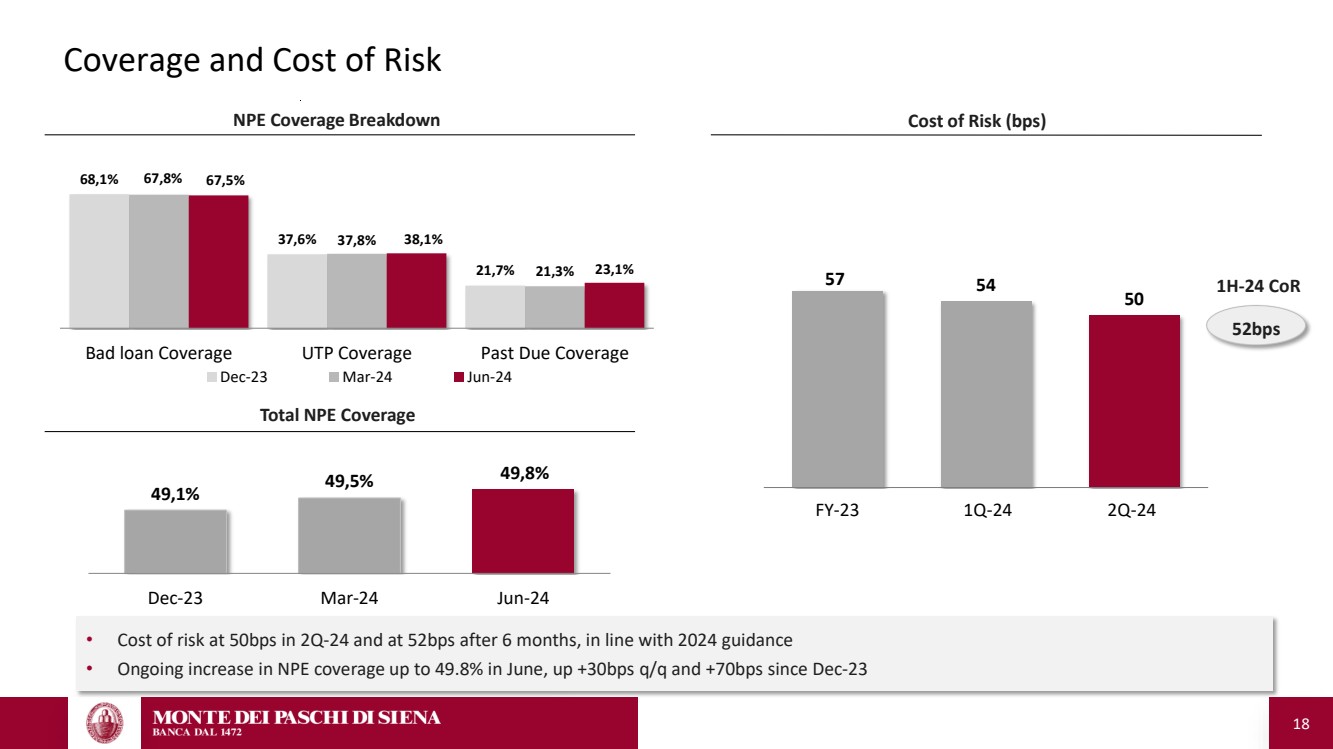
| 18 NPE Coverage Breakdown Cost of Risk (bps) 49,1% 49,5% 49,8% Dec-23 Mar-24 Jun-24 Total NPE Coverage 68,1% 37,6% 21,7% 67,8% 37,8% 21,3% 67,5% 38,1% 23,1% Bad loan Coverage UTP Coverage Past Due Coverage Dec-23 Mar-24 Jun-24 57 54 50 1H-24 CoR 52bps Coverage and Cost of Risk FY-23 1Q-24 2Q-24 • Cost of risk at 50bps in 2Q-24 and at 52bps after 6 months, in line with 2024 guidance • Ongoing increase in NPE coverage up to 49.8% in June, up +30bps q/q and +70bps since Dec-23 |
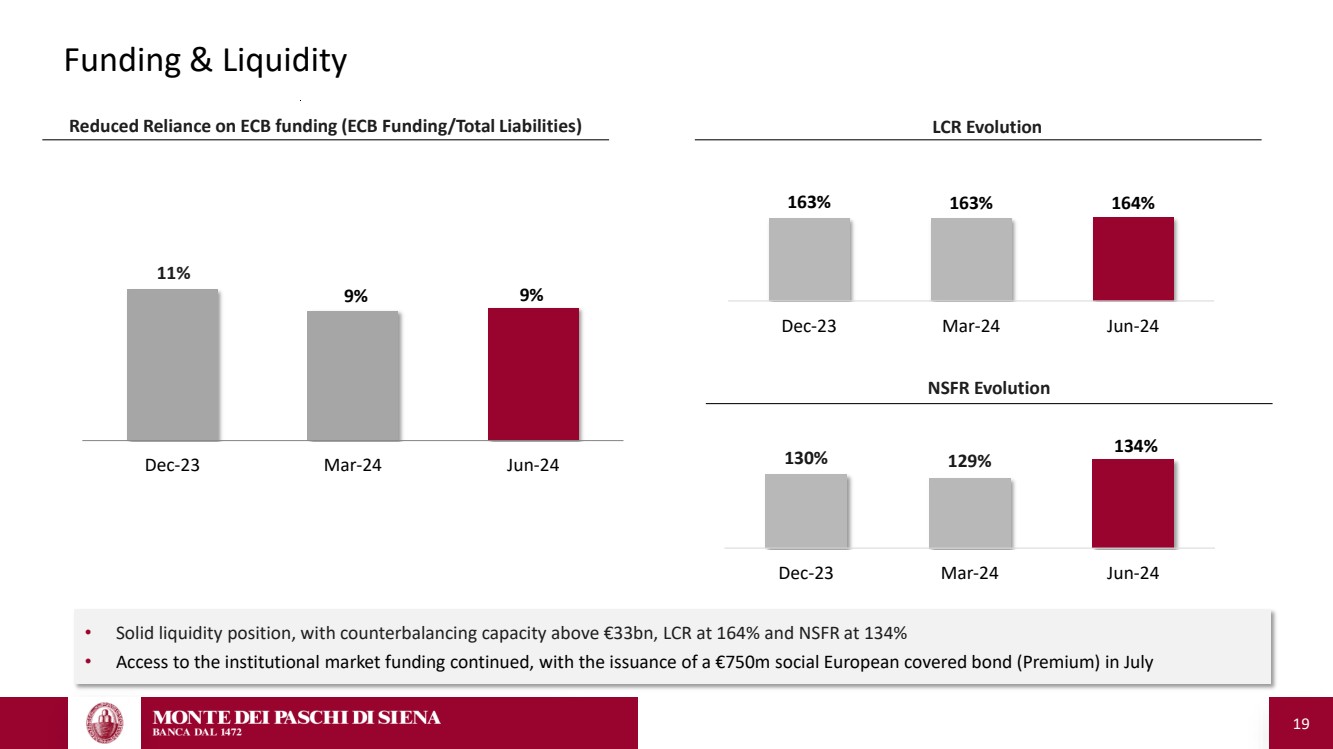
| 19 130% 129% 134% Dec-23 Mar-24 Jun-24 163% 163% 164% Dec-23 Mar-24 Jun-24 9% 9% Dec-23 Mar-24 Jun-24 Funding & Liquidity NSFR Evolution Reduced Reliance on ECB funding (ECB Funding/Total Liabilities) LCR Evolution 11% • Solid liquidity position, with counterbalancing capacity above €33bn, LCR at 164% and NSFR at 134% • Access to the institutional market funding continued, with the issuance of a €750m social European covered bond (Premium) in July |
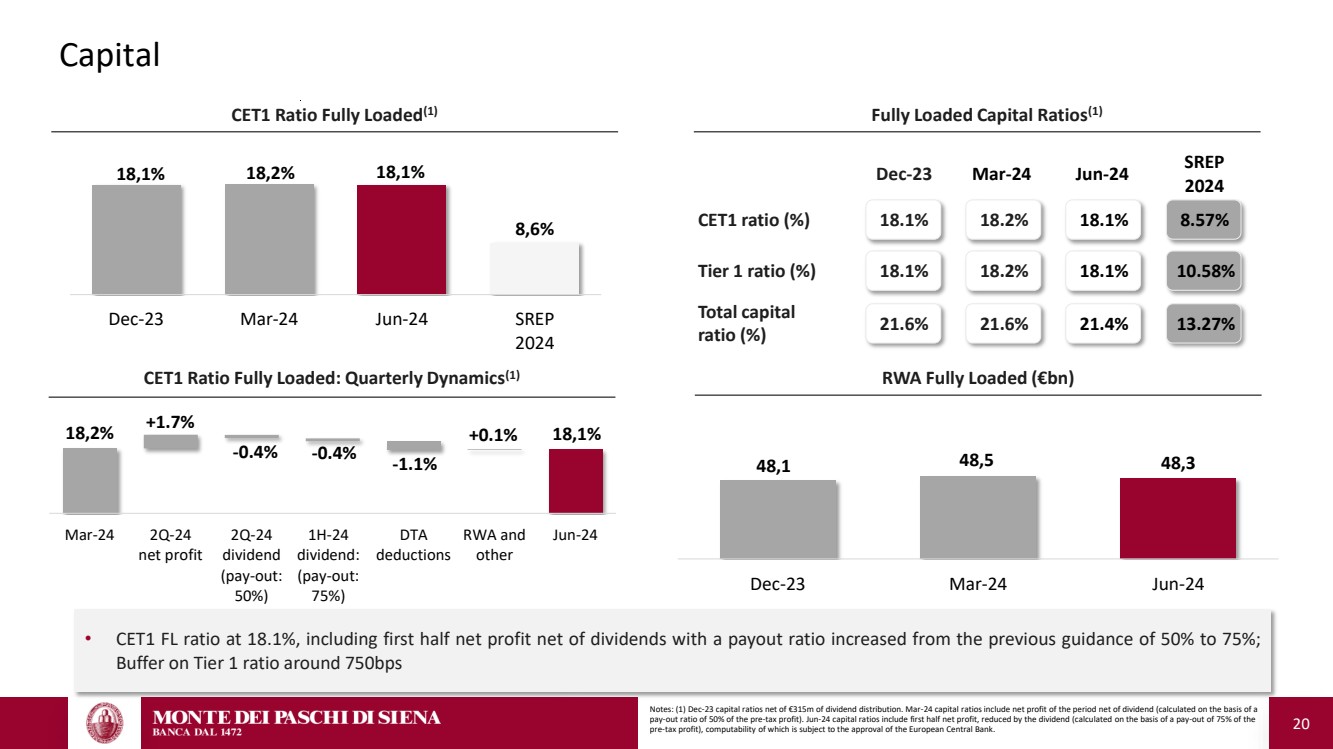
| 20 18,2% 18,1% +1.7% -0.4% -0.4% -1.1% +0.1% Mar-24 2Q-24 net profit 2Q-24 dividend (pay-out: 50%) 1H-24 dividend: (pay-out: 75%) DTA deductions RWA and other Jun-24 Capital Notes: (1) Dec-23 capital ratios net of €315m of dividend distribution. Mar-24 capital ratios include net profit of the period net of dividend (calculated on the basis of a pay-out ratio of 50% of the pre-tax profit). Jun-24 capital ratios include first half net profit, reduced by the dividend (calculated on the basis of a pay-out of 75% of the pre-tax profit), computability of which is subject to the approval of the European Central Bank. RWA Fully Loaded (€bn) 48,1 48,5 48,3 Dec-23 Mar-24 Jun-24 Fully Loaded Capital Ratios(1) CET1 ratio (%) Jun-24 SREP 2024 Tier 1 ratio (%) Total capital ratio (%) 18,1% 18,2% 18,1% 8,6% Dec-23 Mar-24 Jun-24 SREP 2024 CET1 Ratio Fully Loaded(1) CET1 Ratio Fully Loaded: Quarterly Dynamics(1) Dec-23 Mar-24 18.1% 18.1% 21.4% 8.57% 10.58% 13.27% 18.1% 18.1% 21.6% 18.2% 18.2% 21.6% • CET1 FL ratio at 18.1%, including first half net profit net of dividends with a payout ratio increased from the previous guidance of 50% to 75%; Buffer on Tier 1 ratio around 750bps |
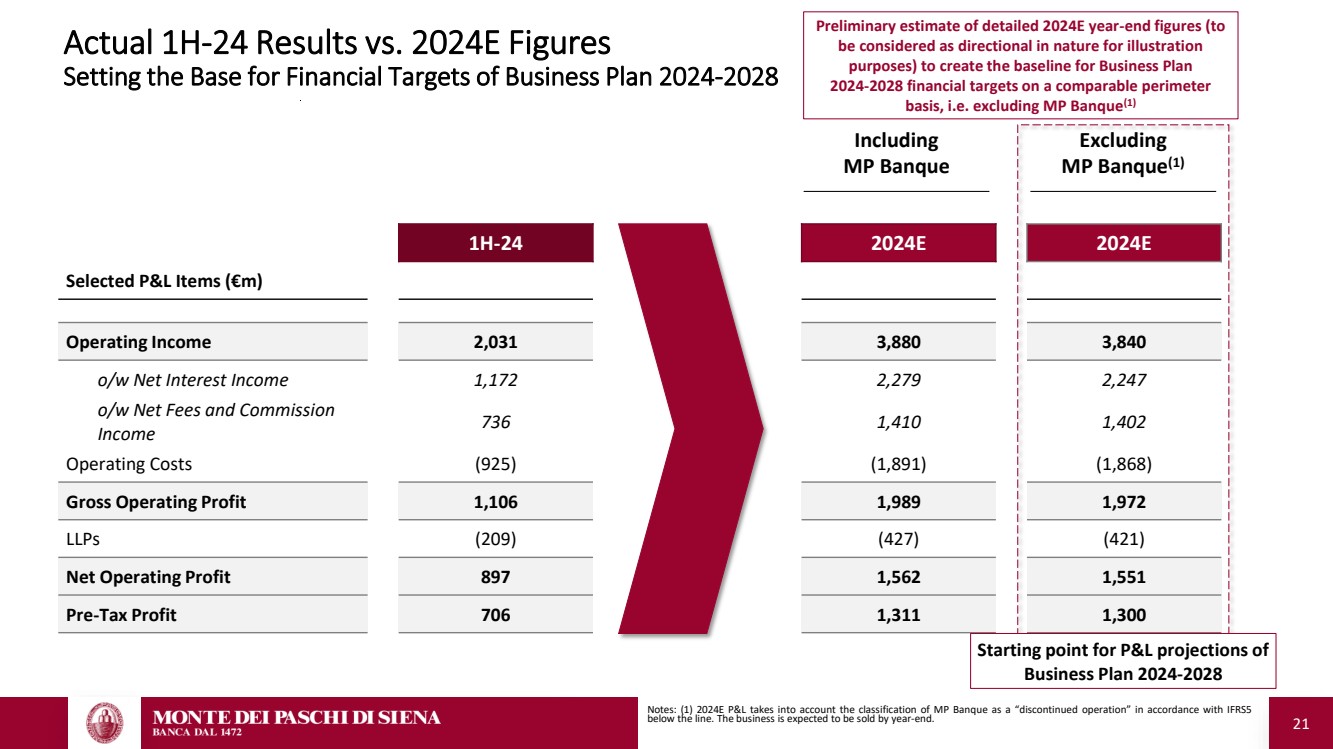
| 21 Actual 1H-24 Results vs. 2024E Figures Setting the Base for Financial Targets of Business Plan 2024-2028 1H-24 2024E 2024E Selected P&L Items (€m) Operating Income 2,031 3,880 3,840 o/w Net Interest Income 1,172 2,279 2,247 o/w Net Fees and Commission Income 736 1,410 1,402 Operating Costs (925) (1,891) (1,868) Gross Operating Profit 1,106 1,989 1,972 LLPs (209) (427) (421) Net Operating Profit 897 1,562 1,551 Pre-Tax Profit 706 1,311 1,300 Including MP Banque Excluding MP Banque(1) Notes: (1) 2024E P&L takes into account the classification of MP Banque as a “discontinued operation” in accordance with IFRS5 below the line. The business is expected to be sold by year-end. Starting point for P&L projections of Business Plan 2024-2028 Preliminary estimate of detailed 2024E year-end figures (to be considered as directional in nature for illustration purposes) to create the baseline for Business Plan 2024-2028 financial targets on a comparable perimeter basis, i.e. excluding MP Banque(1) |
| 22 2. Business Plan 2024-2028 Notes: in the following slides, where applicable, 2024E P&L takes into account the classification of MP Banque as a “discontinued operation” in accordance with IFRS5 below the line. No contribution of MP Banque envisaged from 2025E onwards as the business is expected to be sold by year-end. |
| 23 A clear and simple commercial Bank, revolving around customers, combining technology with human touch “ ” “ ” Enrich business model sustainability through enhancing and innovating initiatives, underpinned by digitalisation and new technologies, leveraging our strong historic franchise and talented people driven by our ESG culture Business Plan 2024-2028 |
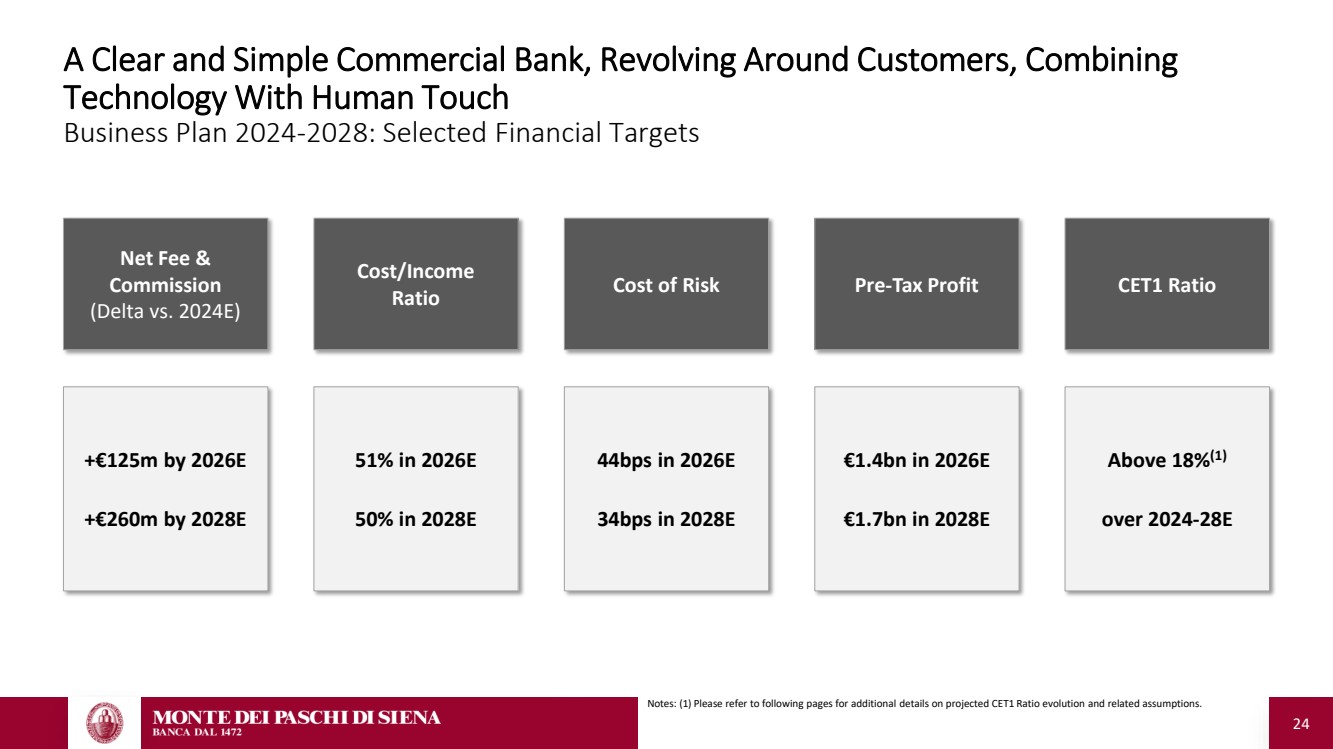
| 24 A Clear and Simple Commercial Bank, Revolving Around Customers, Combining Technology With Human Touch Business Plan 2024-2028: Selected Financial Targets Notes: (1) Please refer to following pages for additional details on projected CET1 Ratio evolution and related assumptions. +€125m by 2026E +€260m by 2028E 51% in 2026E 50% in 2028E 44bps in 2026E 34bps in 2028E Above 18%(1) over 2024-28E €1.4bn in 2026E €1.7bn in 2028E Net Fee & Commission (Delta vs. 2024E) Cost/Income Ratio Cost of Risk Pre-Tax Profit CET1 Ratio |
| 25 2. Business Plan 2024-2028 A. Our Evolving Journey: Strategic Highlights Notes: in the following slides, where applicable, 2024E P&L takes into account the classification of MP Banque as a “discontinued operation” in accordance with IFRS5 below the line. No contribution of MP Banque envisaged from 2025E onwards as the business is expected to be sold by year-end. |
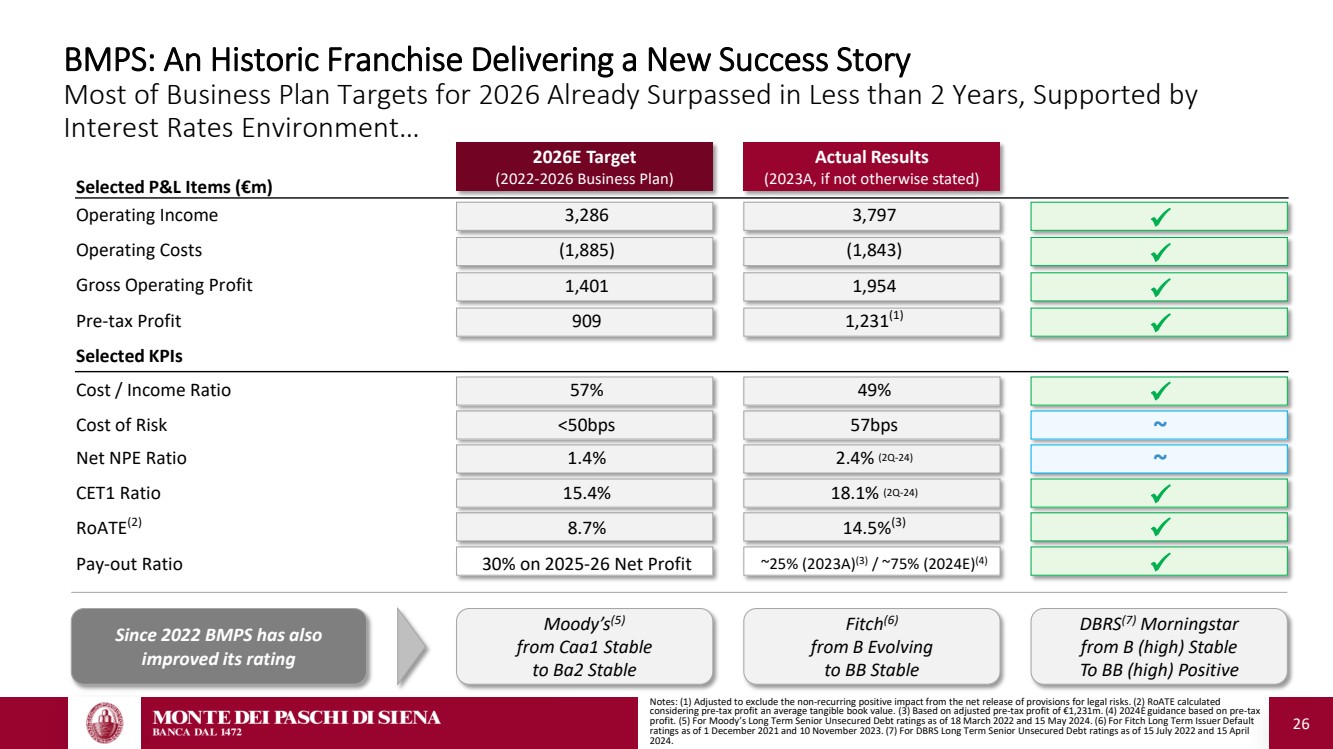
| 26 BMPS: An Historic Franchise Delivering a New Success Story Most of Business Plan Targets for 2026 Already Surpassed in Less than 2 Years, Supported by Interest Rates Environment… Since 2022 BMPS has also improved its rating Moody’s(5) from Caa1 Stable to Ba2 Stable Fitch(6) from B Evolving to BB Stable DBRS(7) Morningstar from B (high) Stable To BB (high) Positive 2026E Target (2022-2026 Business Plan) Actual Results (2023A, if not otherwise stated) Selected P&L Items (€m) Operating Income 3,286 3,797 Operating Costs (1,885) (1,843) Gross Operating Profit 1,401 1,954 Pre-tax Profit 909 1,231(1) Selected KPIs Cost / Income Ratio 57% 49% Cost of Risk <50bps 57bps Net NPE Ratio 1.4% 2.4% (2Q-24) CET1 Ratio 15.4% 18.1% (2Q-24) RoATE(2) 8.7% 14.5%(3) Pay-out Ratio 30% on 2025-26 Net Profit ~25% (2023A)(3) / ~75% (2024E)(4) Notes: (1) Adjusted to exclude the non-recurring positive impact from the net release of provisions for legal risks. (2) RoATE calculated considering pre-tax profit an average tangible book value. (3) Based on adjusted pre-tax profit of €1,231m. (4) 2024E guidance based on pre-tax profit. (5) For Moody’s Long Term Senior Unsecured Debt ratings as of 18 March 2022 and 15 May 2024. (6) For Fitch Long Term Issuer Default ratings as of 1 December 2021 and 10 November 2023. (7) For DBRS Long Term Senior Unsecured Debt ratings as of 15 July 2022 and 15 April 2024. ✓ ✓ ✓ ✓ ✓ ✓ ✓ ✓ ~ ~ |
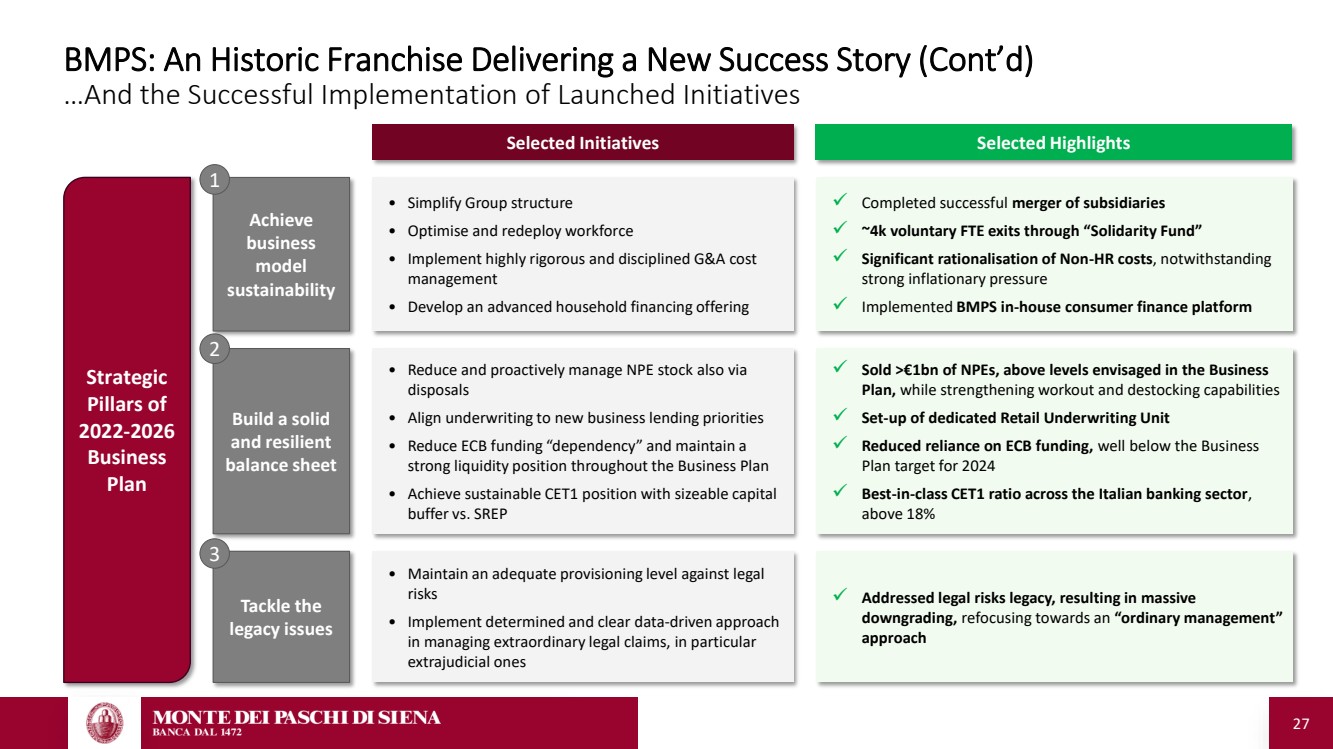
| 27 BMPS: An Historic Franchise Delivering a New Success Story (Cont’d) …And the Successful Implementation of Launched Initiatives Selected Initiatives Selected Highlights • Simplify Group structure • Optimise and redeploy workforce • Implement highly rigorous and disciplined G&A cost management • Develop an advanced household financing offering ✓ Completed successful merger of subsidiaries ✓ ~4k voluntary FTE exits through “Solidarity Fund” ✓ Significant rationalisation of Non-HR costs, notwithstanding strong inflationary pressure ✓ Implemented BMPS in-house consumer finance platform • Reduce and proactively manage NPE stock also via disposals • Align underwriting to new business lending priorities • Reduce ECB funding “dependency” and maintain a strong liquidity position throughout the Business Plan • Achieve sustainable CET1 position with sizeable capital buffer vs. SREP ✓ Sold >€1bn of NPEs, above levels envisaged in the Business Plan, while strengthening workout and destocking capabilities ✓ Set-up of dedicated Retail Underwriting Unit ✓ Reduced reliance on ECB funding, well below the Business Plan target for 2024 ✓ Best-in-class CET1 ratio across the Italian banking sector, above 18% • Maintain an adequate provisioning level against legal risks • Implement determined and clear data-driven approach in managing extraordinary legal claims, in particular extrajudicial ones ✓ Addressed legal risks legacy, resulting in massive downgrading, refocusing towards an “ordinary management” approach Achieve business model sustainability 1 Build a solid and resilient balance sheet 2 Tackle the legacy issues 3 Strategic Pillars of 2022-2026 Business Plan |
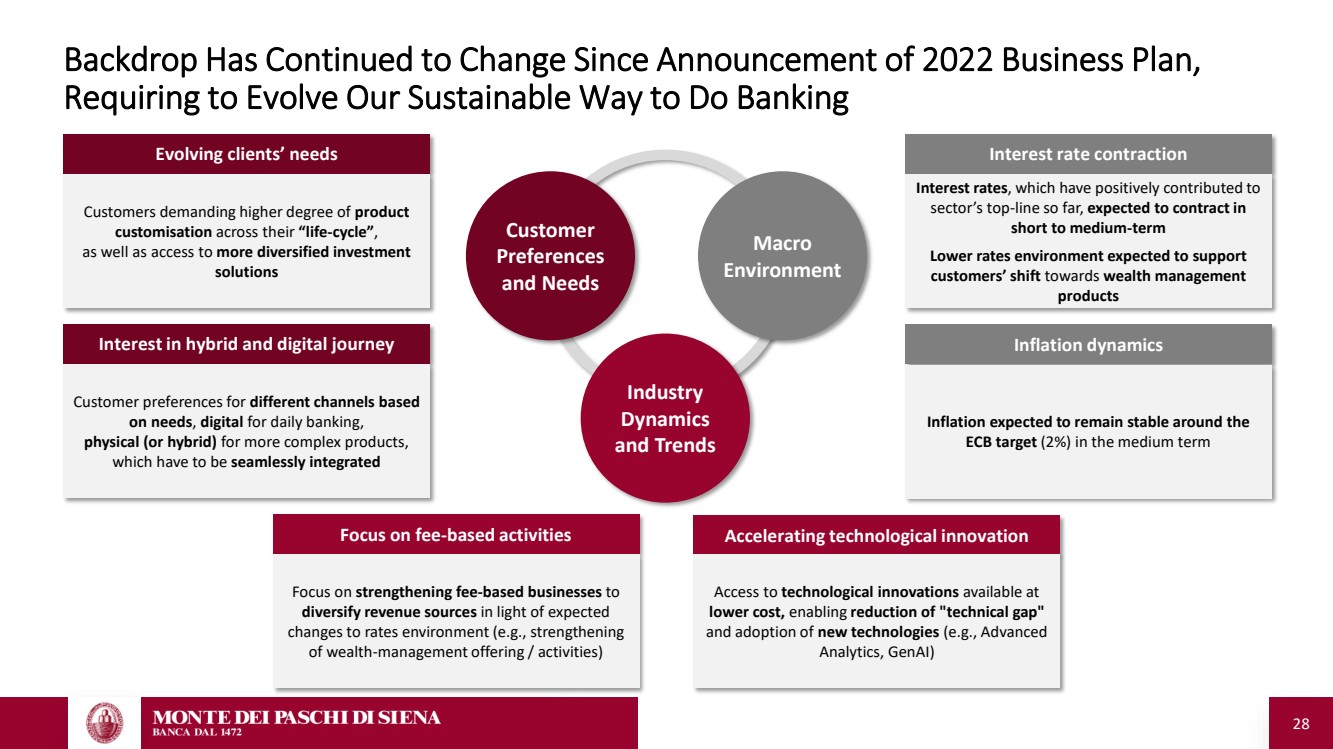
| 28 Backdrop Has Continued to Change Since Announcement of 2022 Business Plan, Requiring to Evolve Our Sustainable Way to Do Banking Macro Environment Customer Preferences and Needs Industry Dynamics and Trends Inflation dynamics Inflation expected to remain stable around the ECB target (2%) in the medium term Interest rate contraction Interest rates, which have positively contributed to sector’s top-line so far, expected to contract in short to medium-term Lower rates environment expected to support customers’ shift towards wealth management products Focus on fee-based activities Focus on strengthening fee-based businesses to diversify revenue sources in light of expected changes to rates environment (e.g., strengthening of wealth-management offering / activities) Accelerating technological innovation Access to technological innovations available at lower cost, enabling reduction of "technical gap" and adoption of new technologies (e.g., Advanced Analytics, GenAI) Interest in hybrid and digital journey Customer preferences for different channels based on needs, digital for daily banking, physical (or hybrid) for more complex products, which have to be seamlessly integrated Evolving clients’ needs Customers demanding higher degree of product customisation across their “life-cycle”, as well as access to more diversified investment solutions |
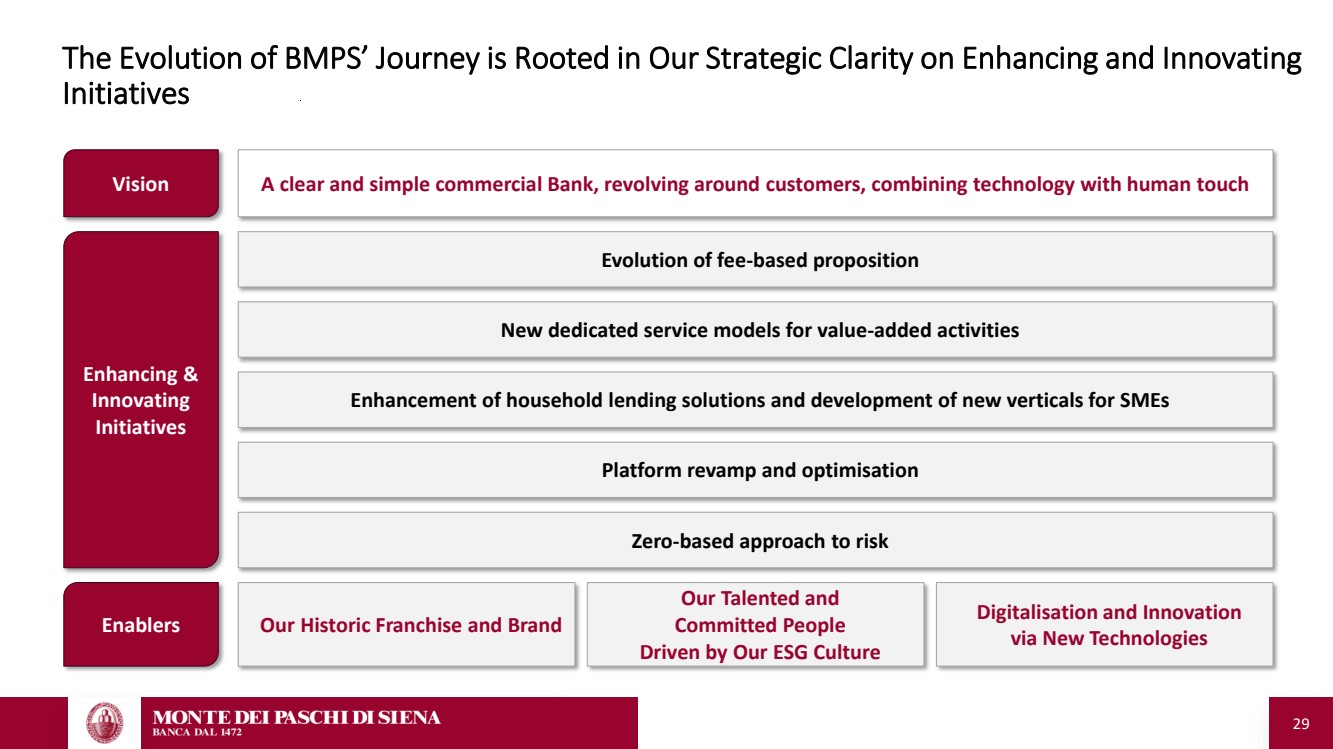
| 29 Vision A clear and simple commercial Bank, revolving around customers, combining technology with human touch The Evolution of BMPS’ Journey is Rooted in Our Strategic Clarity on Enhancing and Innovating Initiatives Enablers Enhancing & Innovating Initiatives Evolution of fee-based proposition New dedicated service models for value-added activities Enhancement of household lending solutions and development of new verticals for SMEs Platform revamp and optimisation Zero-based approach to risk Our Historic Franchise and Brand Our Talented and Committed People Driven by Our ESG Culture Digitalisation and Innovation via New Technologies |
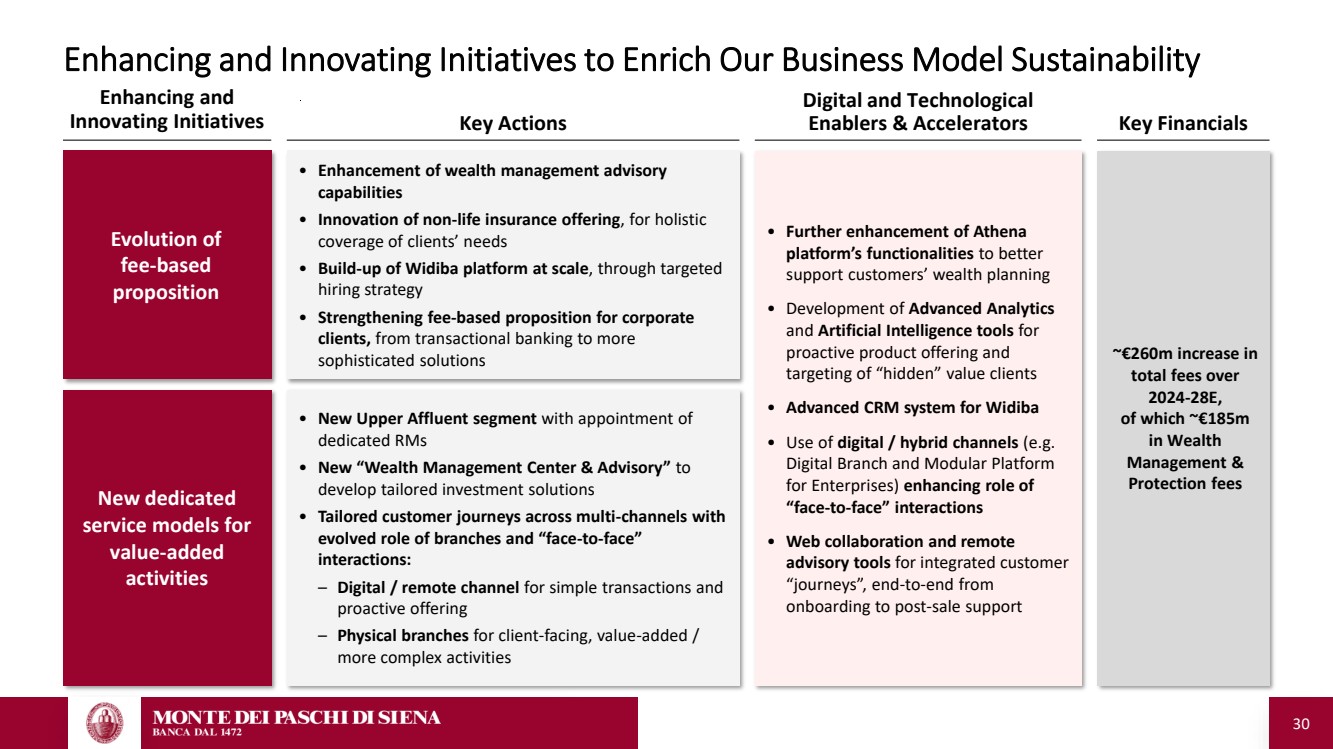
| 30 Enhancing and Innovating Initiatives to Enrich Our Business Model Sustainability Evolution of fee-based proposition • Enhancement of wealth management advisory capabilities • Innovation of non-life insurance offering, for holistic coverage of clients’ needs • Build-up of Widiba platform at scale, through targeted hiring strategy • Strengthening fee-based proposition for corporate clients, from transactional banking to more sophisticated solutions • Further enhancement of Athena platform’s functionalities to better support customers’ wealth planning • Development of Advanced Analytics and Artificial Intelligence tools for proactive product offering and targeting of “hidden” value clients • Advanced CRM system for Widiba • Use of digital / hybrid channels (e.g. Digital Branch and Modular Platform for Enterprises) enhancing role of “face-to-face” interactions • Web collaboration and remote advisory tools for integrated customer “journeys”, end-to-end from onboarding to post-sale support • New Upper Affluent segment with appointment of dedicated RMs • New “Wealth Management Center & Advisory” to develop tailored investment solutions • Tailored customer journeys across multi-channels with evolved role of branches and “face-to-face” interactions: – Digital / remote channel for simple transactions and proactive offering – Physical branches for client-facing, value-added / more complex activities New dedicated service models for value-added activities ~€260m increase in total fees over 2024-28E, of which ~€185m in Wealth Management & Protection fees Enhancing and Innovating Initiatives Key Financials Digital and Technological Key Actions Enablers & Accelerators |
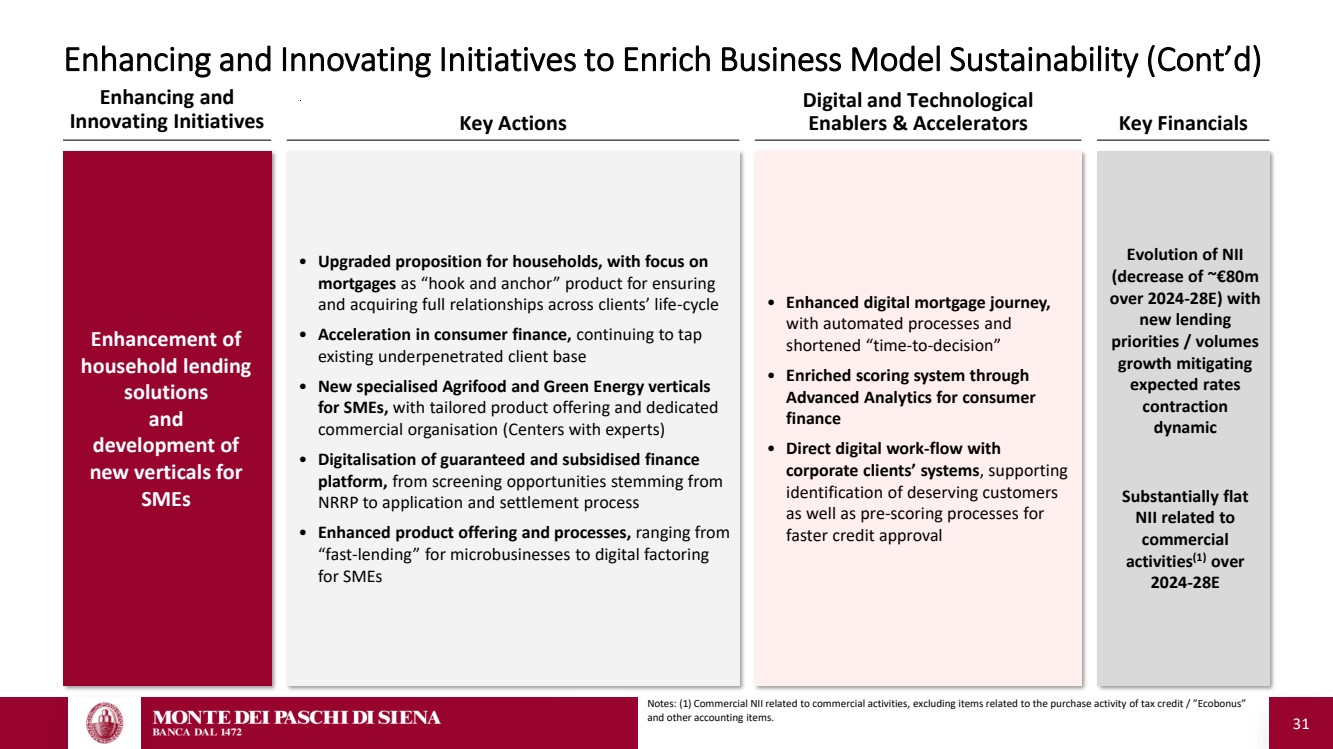
| 31 • Upgraded proposition for households, with focus on mortgages as “hook and anchor” product for ensuring and acquiring full relationships across clients’ life-cycle • Acceleration in consumer finance, continuing to tap existing underpenetrated client base • New specialised Agrifood and Green Energy verticals for SMEs, with tailored product offering and dedicated commercial organisation (Centers with experts) • Digitalisation of guaranteed and subsidised finance platform, from screening opportunities stemming from NRRP to application and settlement process • Enhanced product offering and processes, ranging from “fast-lending” for microbusinesses to digital factoring for SMEs • Enhanced digital mortgage journey, with automated processes and shortened “time-to-decision” • Enriched scoring system through Advanced Analytics for consumer finance • Direct digital work-flow with corporate clients’ systems, supporting identification of deserving customers as well as pre-scoring processes for faster credit approval Evolution of NII (decrease of ~€80m over 2024-28E) with new lending priorities / volumes growth mitigating expected rates contraction dynamic Substantially flat NII related to commercial activities(1) over 2024-28E Enhancement of household lending solutions and development of new verticals for SMEs Enhancing and Innovating Initiatives to Enrich Business Model Sustainability (Cont’d) Notes: (1) Commercial NII related to commercial activities, excluding items related to the purchase activity of tax credit / ”Ecobonus” and other accounting items. Enhancing and Innovating Initiatives Key Financials Digital and Technological Key Actions Enablers & Accelerators |
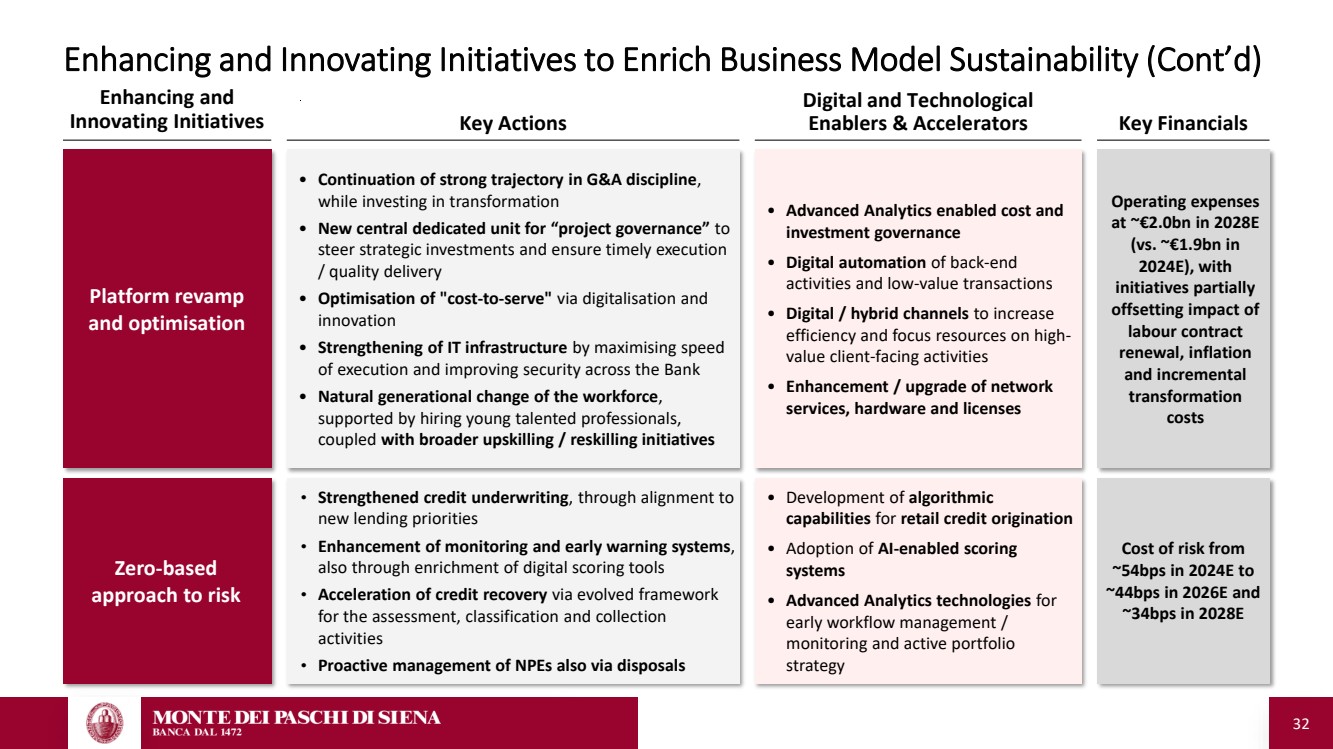
| 32 • Strengthened credit underwriting, through alignment to new lending priorities • Enhancement of monitoring and early warning systems, also through enrichment of digital scoring tools • Acceleration of credit recovery via evolved framework for the assessment, classification and collection activities • Proactive management of NPEs also via disposals • Development of algorithmic capabilities for retail credit origination • Adoption of AI-enabled scoring systems • Advanced Analytics technologies for early workflow management / monitoring and active portfolio strategy Cost of risk from ~54bps in 2024E to ~44bps in 2026E and ~34bps in 2028E Zero-based approach to risk • Continuation of strong trajectory in G&A discipline, while investing in transformation • New central dedicated unit for “project governance” to steer strategic investments and ensure timely execution / quality delivery • Optimisation of "cost-to-serve" via digitalisation and innovation • Strengthening of IT infrastructure by maximising speed of execution and improving security across the Bank • Natural generational change of the workforce, supported by hiring young talented professionals, coupled with broader upskilling / reskilling initiatives Platform revamp and optimisation • Advanced Analytics enabled cost and investment governance • Digital automation of back-end activities and low-value transactions • Digital / hybrid channels to increase efficiency and focus resources on high-value client-facing activities • Enhancement / upgrade of network services, hardware and licenses Operating expenses at ~€2.0bn in 2028E (vs. ~€1.9bn in 2024E), with initiatives partially offsetting impact of labour contract renewal, inflation and incremental transformation costs Enhancing and Innovating Initiatives to Enrich Business Model Sustainability (Cont’d) Enhancing and Innovating Initiatives Key Financials Digital and Technological Key Actions Enablers & Accelerators |
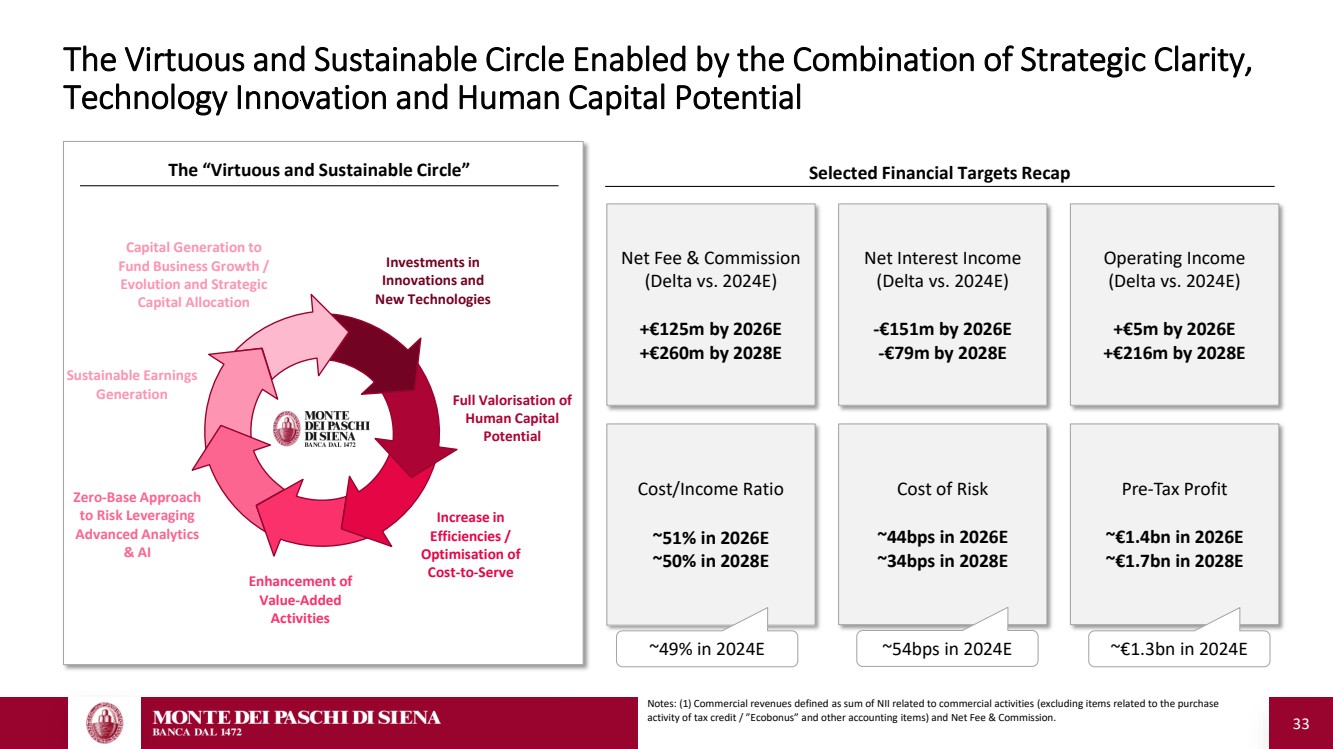
| 33 The Virtuous and Sustainable Circle Enabled by the Combination of Strategic Clarity, Technology Innovation and Human Capital Potential Cost of Risk ~44bps in 2026E ~34bps in 2028E ~54bps in 2024E Cost/Income Ratio ~51% in 2026E ~50% in 2028E Net Fee & Commission (Delta vs. 2024E) +€125m by 2026E +€260m by 2028E Pre-Tax Profit ~€1.4bn in 2026E ~€1.7bn in 2028E ~€1.3bn in 2024E Notes: (1) Commercial revenues defined as sum of NII related to commercial activities (excluding items related to the purchase activity of tax credit / ”Ecobonus” and other accounting items) and Net Fee & Commission. Net Interest Income (Delta vs. 2024E) -€151m by 2026E -€79m by 2028E Selected Financial Targets Recap ~49% in 2024E The “Virtuous and Sustainable Circle” Sustainable Earnings Generation Zero-Base Approach to Risk Leveraging Advanced Analytics & AI Enhancement of Value-Added Activities Increase in Efficiencies / Optimisation of Cost-to-Serve Full Valorisation of Human Capital Potential Investments in Innovations and New Technologies Capital Generation to Fund Business Growth / Evolution and Strategic Capital Allocation Operating Income (Delta vs. 2024E) +€5m by 2026E +€216m by 2028E |
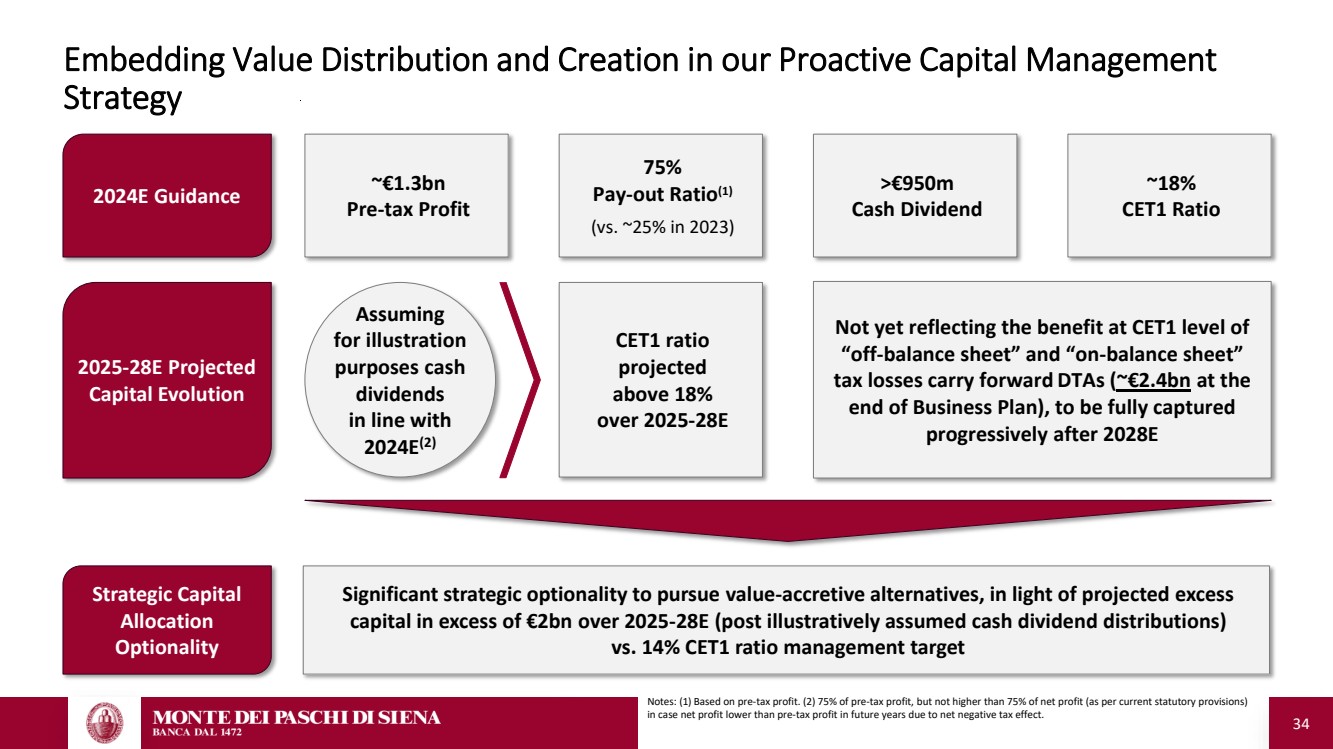
| 34 Embedding Value Distribution and Creation in our Proactive Capital Management Strategy Significant strategic optionality to pursue value-accretive alternatives, in light of projected excess capital in excess of €2bn over 2025-28E (post illustratively assumed cash dividend distributions) vs. 14% CET1 ratio management target ~€1.3bn Pre-tax Profit 2024E Guidance 75% Pay-out Ratio(1) (vs. ~25% in 2023) CET1 ratio projected above 18% over 2025-28E ~18% CET1 Ratio 2025-28E Projected Capital Evolution Strategic Capital Allocation Optionality Notes: (1) Based on pre-tax profit. (2) 75% of pre-tax profit, but not higher than 75% of net profit (as per current statutory provisions) in case net profit lower than pre-tax profit in future years due to net negative tax effect. Assuming for illustration purposes cash dividends in line with 2024E(2) Not yet reflecting the benefit at CET1 level of “off-balance sheet” and “on-balance sheet” tax losses carry forward DTAs (~€2.4bn at the end of Business Plan), to be fully captured progressively after 2028E >€950m Cash Dividend |
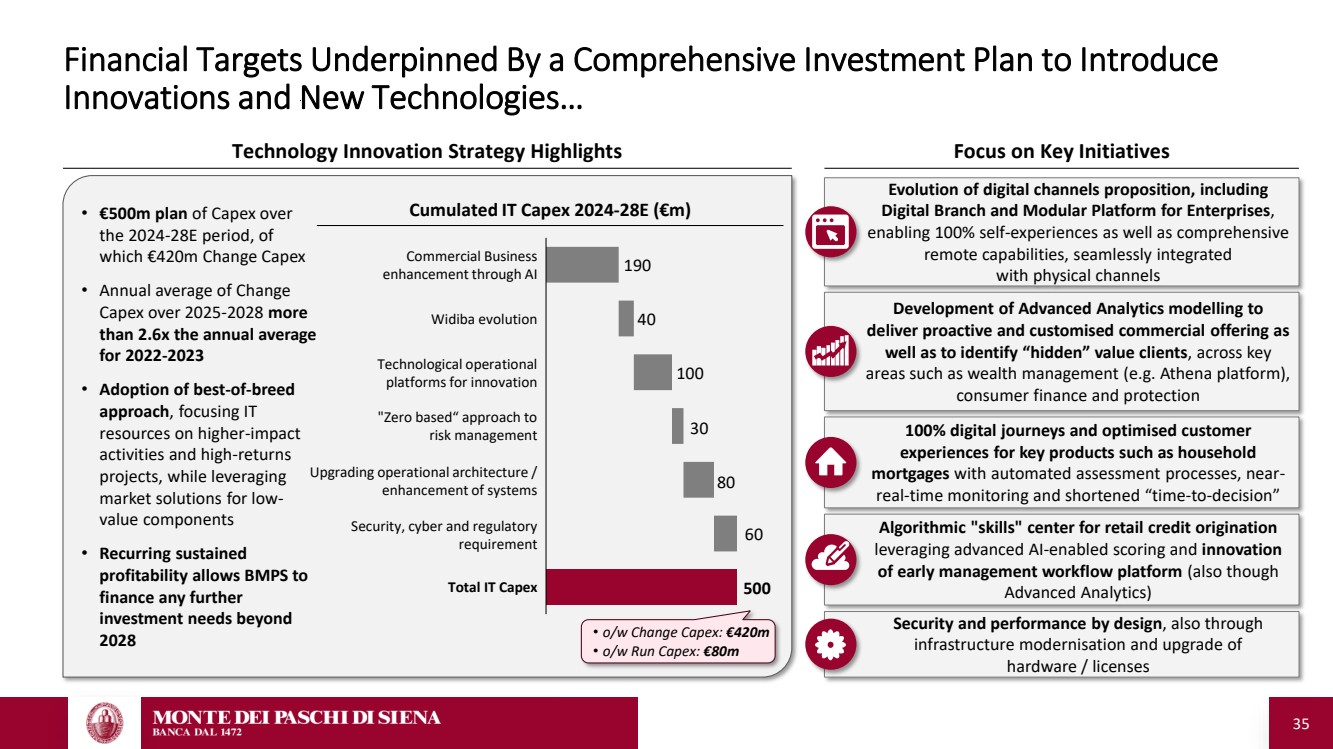
| 35 Financial Targets Underpinned By a Comprehensive Investment Plan to Introduce Innovations and New Technologies… Technology Innovation Strategy Highlights Focus on Key Initiatives • €500m plan of Capex over the 2024-28E period, of which €420m Change Capex • Annual average of Change Capex over 2025-2028 more than 2.6x the annual average for 2022-2023 • Adoption of best-of-breed approach, focusing IT resources on higher-impact activities and high-returns projects, while leveraging market solutions for low-value components • Recurring sustained profitability allows BMPS to finance any further investment needs beyond 2028 40 100 30 80 60 190 500 Evolution of digital channels proposition, including Digital Branch and Modular Platform for Enterprises, enabling 100% self-experiences as well as comprehensive remote capabilities, seamlessly integrated with physical channels Development of Advanced Analytics modelling to deliver proactive and customised commercial offering as well as to identify “hidden” value clients, across key areas such as wealth management (e.g. Athena platform), consumer finance and protection 100% digital journeys and optimised customer experiences for key products such as household mortgages with automated assessment processes, near-real-time monitoring and shortened “time-to-decision” Algorithmic "skills" center for retail credit origination leveraging advanced AI-enabled scoring and innovation of early management workflow platform (also though Advanced Analytics) Cumulated IT Capex 2024-28E (€m) • o/w Change Capex: €420m • o/w Run Capex: €80m Commercial Business enhancement through AI Widiba evolution Technological operational platforms for innovation "Zero based“ approach to risk management Upgrading operational architecture / enhancement of systems Security, cyber and regulatory requirement Total IT Capex Security and performance by design, also through infrastructure modernisation and upgrade of hardware / licenses |
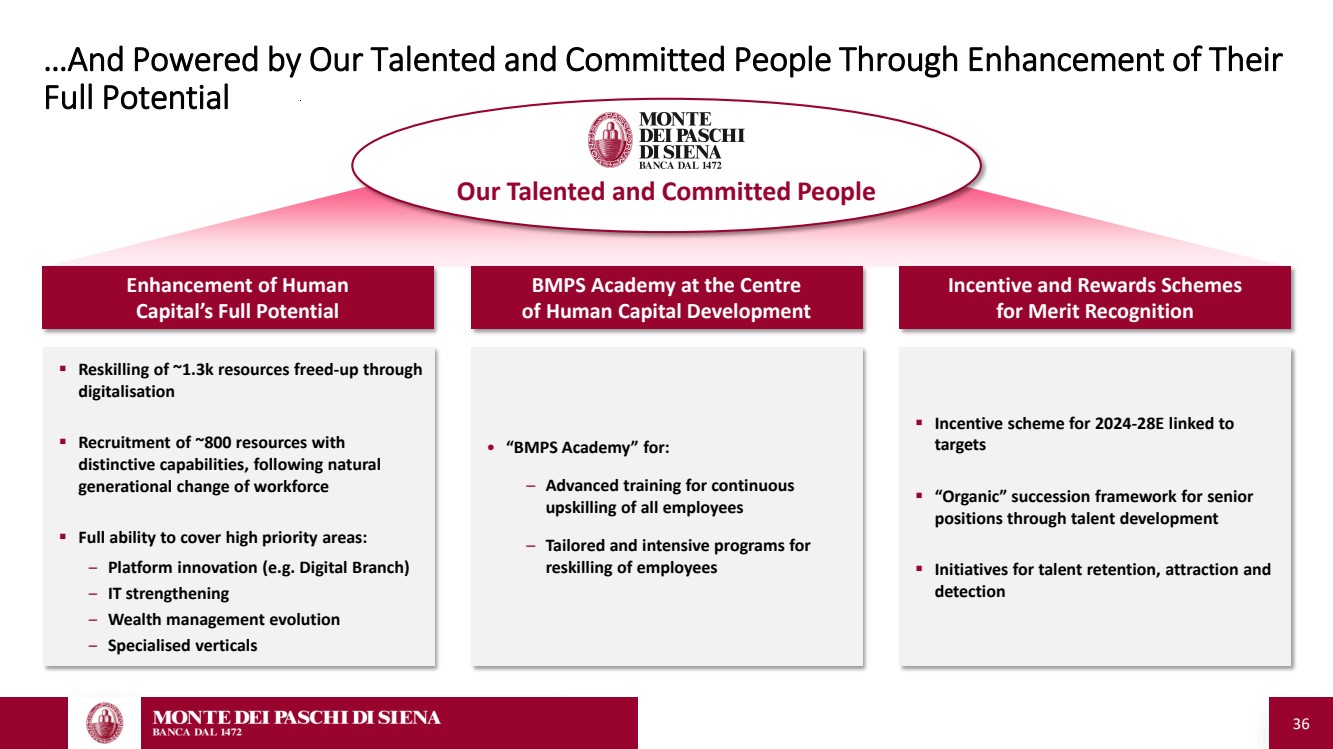
| 36 ▪ Reskilling of ~1.3k resources freed-up through digitalisation ▪ Recruitment of ~800 resources with distinctive capabilities, following natural generational change of workforce ▪ Full ability to cover high priority areas: ‒ Platform innovation (e.g. Digital Branch) ‒ IT strengthening ‒ Wealth management evolution ‒ Specialised verticals …And Powered by Our Talented and Committed People Through Enhancement of Their Full Potential BMPS Academy at the Centre of Human Capital Development Incentive and Rewards Schemes for Merit Recognition Enhancement of Human Capital’s Full Potential Our Talented and Committed People • “BMPS Academy” for: – Advanced training for continuous upskilling of all employees – Tailored and intensive programs for reskilling of employees ▪ Incentive scheme for 2024-28E linked to targets ▪ “Organic” succession framework for senior positions through talent development ▪ Initiatives for talent retention, attraction and detection |
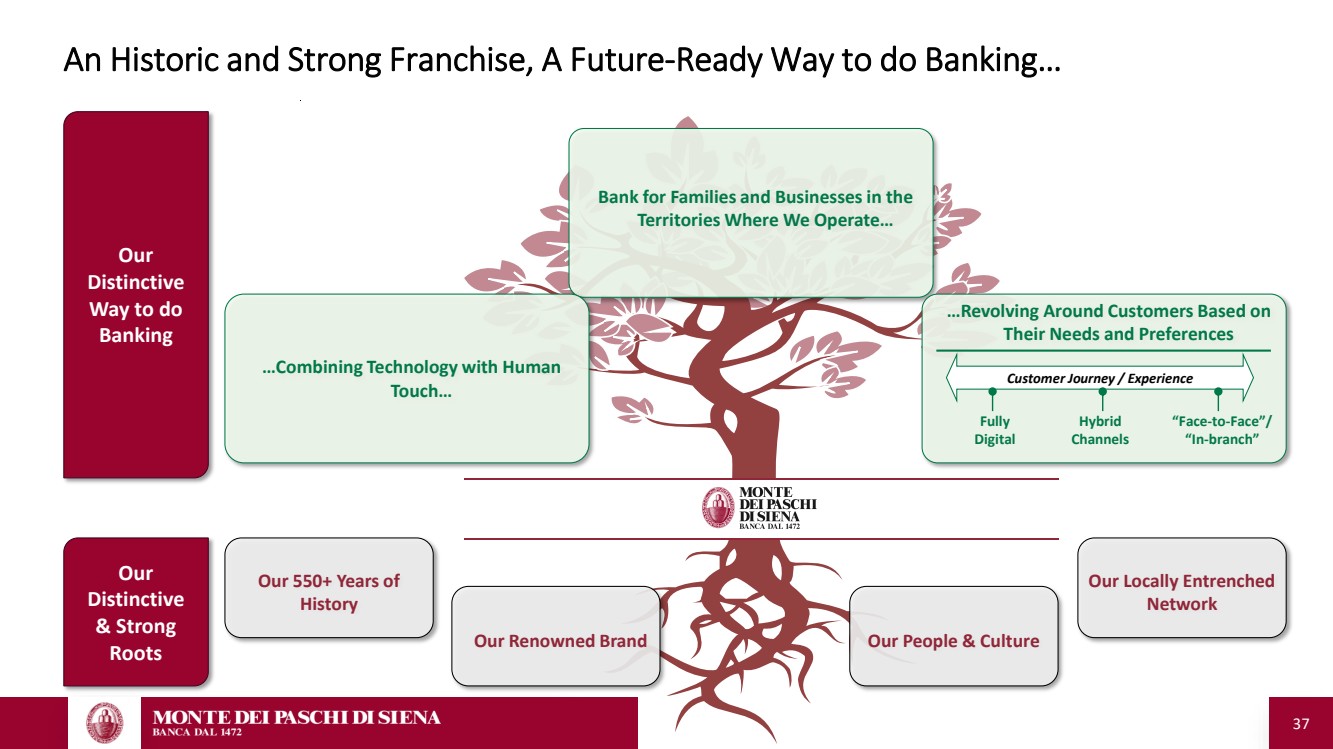
| 37 An Historic and Strong Franchise, A Future-Ready Way to do Banking… Our Distinctive & Strong Roots Our Distinctive Way to do Banking Our 550+ Years of History Our Renowned Brand Our People & Culture Our Locally Entrenched Network Bank for Families and Businesses in the Territories Where We Operate… …Combining Technology with Human Touch… …Revolving Around Customers Based on Their Needs and Preferences Customer Journey / Experience Fully Digital Hybrid Channels “Face-to-Face”/ “In-branch” |
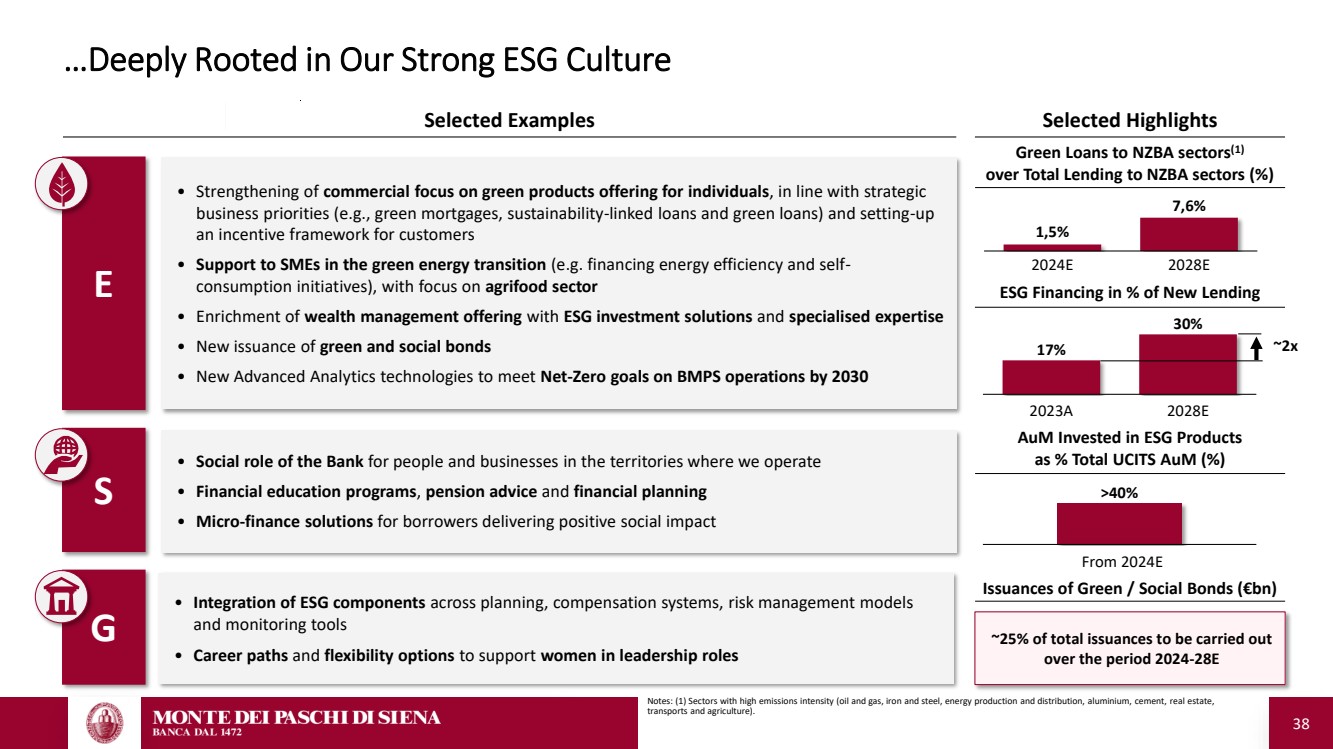
| 38 E • Strengthening of commercial focus on green products offering for individuals, in line with strategic business priorities (e.g., green mortgages, sustainability-linked loans and green loans) and setting-up an incentive framework for customers • Support to SMEs in the green energy transition (e.g. financing energy efficiency and self-consumption initiatives), with focus on agrifood sector • Enrichment of wealth management offering with ESG investment solutions and specialised expertise • New issuance of green and social bonds • New Advanced Analytics technologies to meet Net-Zero goals on BMPS operations by 2030 G • Integration of ESG components across planning, compensation systems, risk management models and monitoring tools • Career paths and flexibility options to support women in leadership roles S • Social role of the Bank for people and businesses in the territories where we operate • Financial education programs, pension advice and financial planning • Micro-finance solutions for borrowers delivering positive social impact …Deeply Rooted in Our Strong ESG Culture Selected Examples From 2024E >40% Selected Highlights Notes: (1) Sectors with high emissions intensity (oil and gas, iron and steel, energy production and distribution, aluminium, cement, real estate, transports and agriculture). Issuances of Green / Social Bonds (€bn) AuM Invested in ESG Products as % Total UCITS AuM (%) ESG Financing in % of New Lending 17% 30% 2023A 2028E ~2x Green Loans to NZBA sectors(1) over Total Lending to NZBA sectors (%) 1,5% 7,6% 2024E 2028E ~25% of total issuances to be carried out over the period 2024-28E |
| 39 2. Business Plan 2024-2028 B. Updated Financial Targets Notes: in the following slides, where applicable, 2024E P&L takes into account the classification of MP Banque as a “discontinued operation” in accordance with IFRS5 below the line. No contribution of MP Banque envisaged from 2025E onwards as the business is expected to be sold by year-end. |
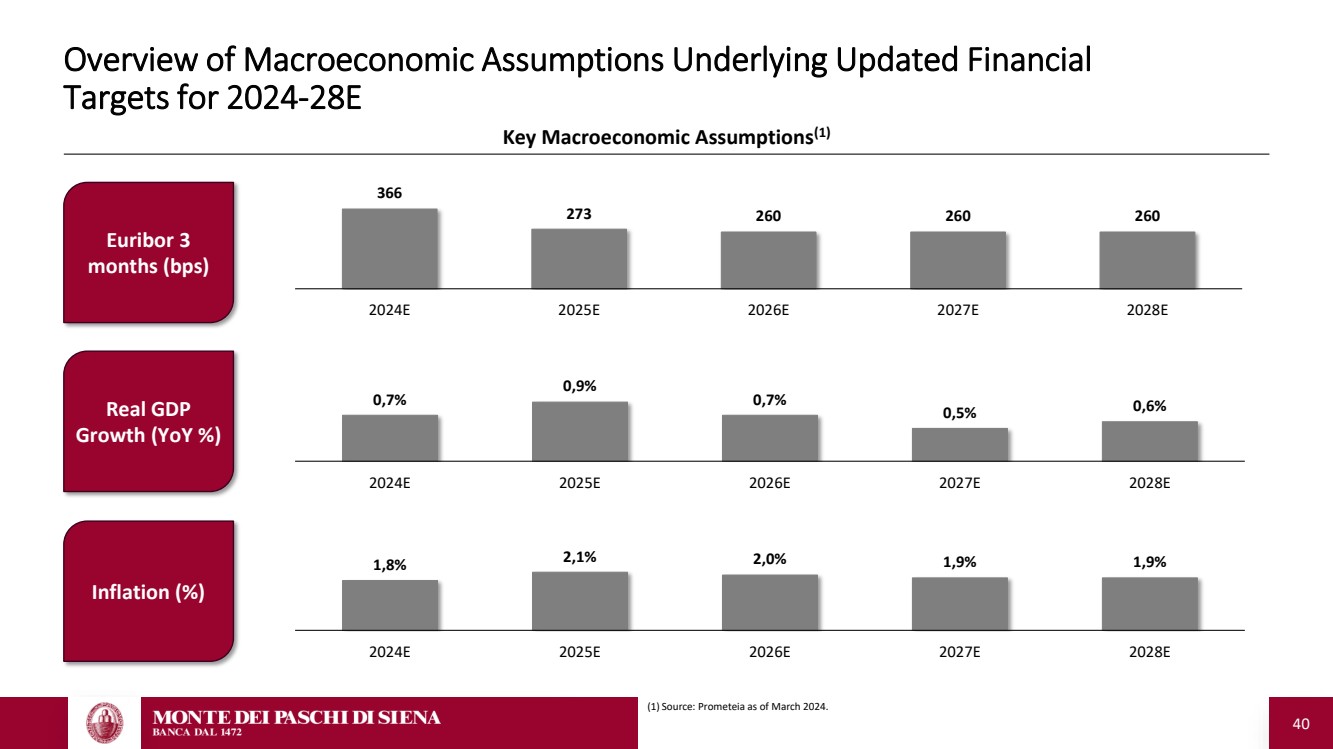
| 40 Overview of Macroeconomic Assumptions Underlying Updated Financial Targets for 2024-28E Key Macroeconomic Assumptions(1) 366 273 260 260 260 2024E 2025E 2026E 2027E 2028E 0,7% 0,9% 0,7% 0,5% 0,6% 2024E 2025E 2026E 2027E 2028E 1,8% 2,1% 2,0% 1,9% 1,9% 2024E 2025E 2026E 2027E 2028E Euribor 3 months (bps) Real GDP Growth (YoY %) Inflation (%) (1) Source: Prometeia as of March 2024. |
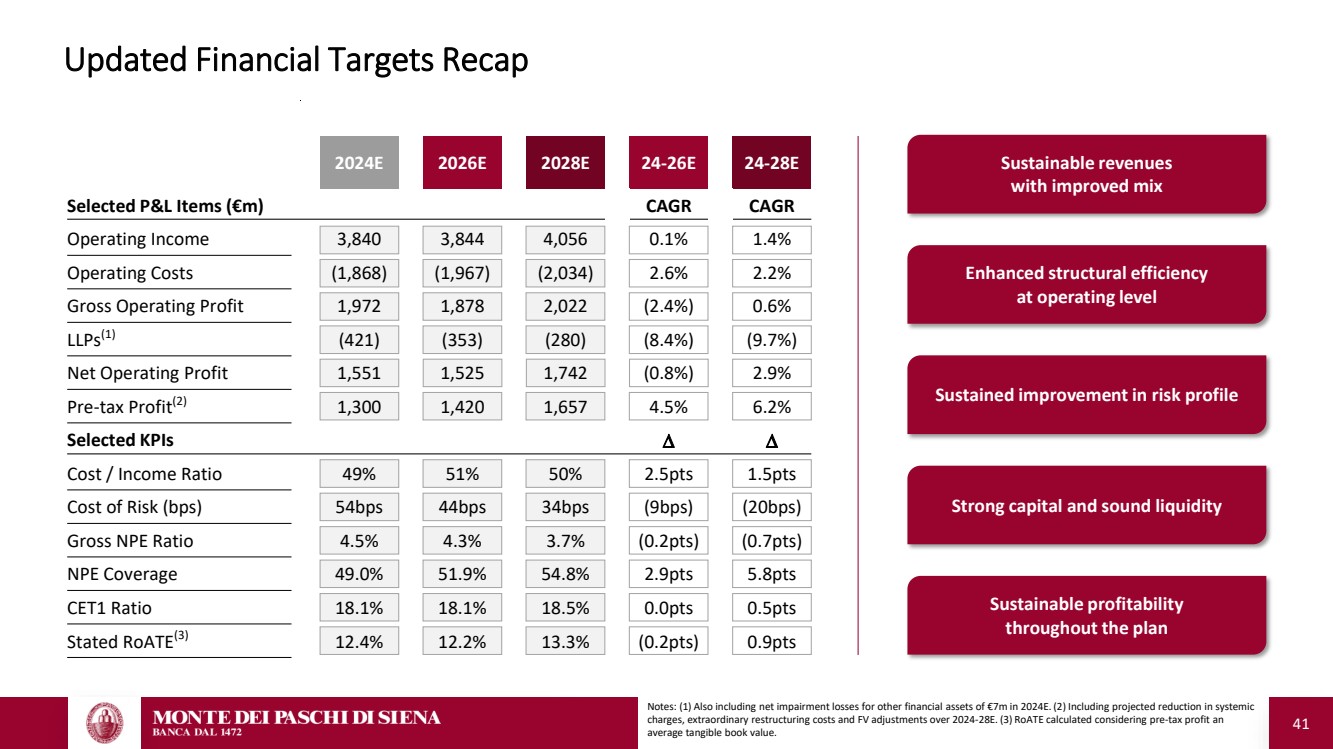
| 41 Updated Financial Targets Recap Sustainable revenues with improved mix Enhanced structural efficiency at operating level Sustained improvement in risk profile Strong capital and sound liquidity Sustainable profitability throughout the plan 2024E 2026E 2028E 24-26E 24-28E Selected P&L Items (€m) CAGR CAGR Operating Income 3,840 3,844 4,056 0.1% 1.4% Operating Costs (1,868) (1,967) (2,034) 2.6% 2.2% Gross Operating Profit 1,972 1,878 2,022 (2.4%) 0.6% LLPs(1) (421) (353) (280) (8.4%) (9.7%) Net Operating Profit 1,551 1,525 1,742 (0.8%) 2.9% Pre-tax Profit(2) 1,300 1,420 1,657 4.5% 6.2% Selected KPIs D D Cost / Income Ratio 49% 51% 50% 2.5pts 1.5pts Cost of Risk (bps) 54bps 44bps 34bps (9bps) (20bps) Gross NPE Ratio 4.5% 4.3% 3.7% (0.2pts) (0.7pts) NPE Coverage 49.0% 51.9% 54.8% 2.9pts 5.8pts CET1 Ratio 18.1% 18.1% 18.5% 0.0pts 0.5pts Stated RoATE(3) 12.4% 12.2% 13.3% (0.2pts) 0.9pts Notes: (1) Also including net impairment losses for other financial assets of €7m in 2024E. (2) Including projected reduction in systemic charges, extraordinary restructuring costs and FV adjustments over 2024-28E. (3) RoATE calculated considering pre-tax profit an average tangible book value. |
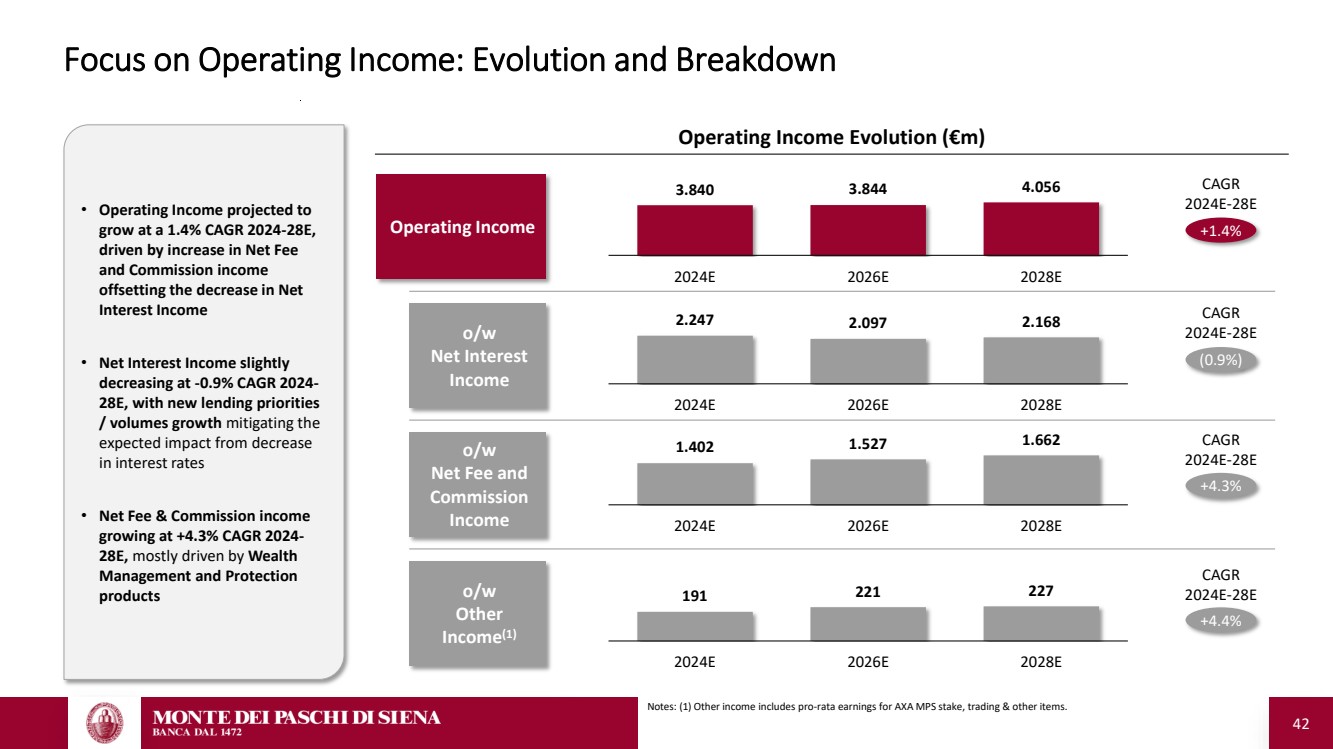
| 42 Focus on Operating Income: Evolution and Breakdown o/w Net Interest Income o/w Net Fee and Commission Income o/w Other Income(1) 3.840 3.844 4.056 2024E 2026E 2028E 2.247 2.097 2.168 2024E 2026E 2028E 1.402 1.527 1.662 2024E 2026E 2028E 191 221 227 2024E 2026E 2028E +1.4% (0.9%) +4.3% +4.4% Operating Income Evolution (€m) Operating Income CAGR 2024E-28E CAGR 2024E-28E CAGR 2024E-28E CAGR 2024E-28E • Operating Income projected to grow at a 1.4% CAGR 2024-28E, driven by increase in Net Fee and Commission income offsetting the decrease in Net Interest Income • Net Interest Income slightly decreasing at -0.9% CAGR 2024- 28E, with new lending priorities / volumes growth mitigating the expected impact from decrease in interest rates • Net Fee & Commission income growing at +4.3% CAGR 2024- 28E, mostly driven by Wealth Management and Protection products Notes: (1) Other income includes pro-rata earnings for AXA MPS stake, trading & other items. |
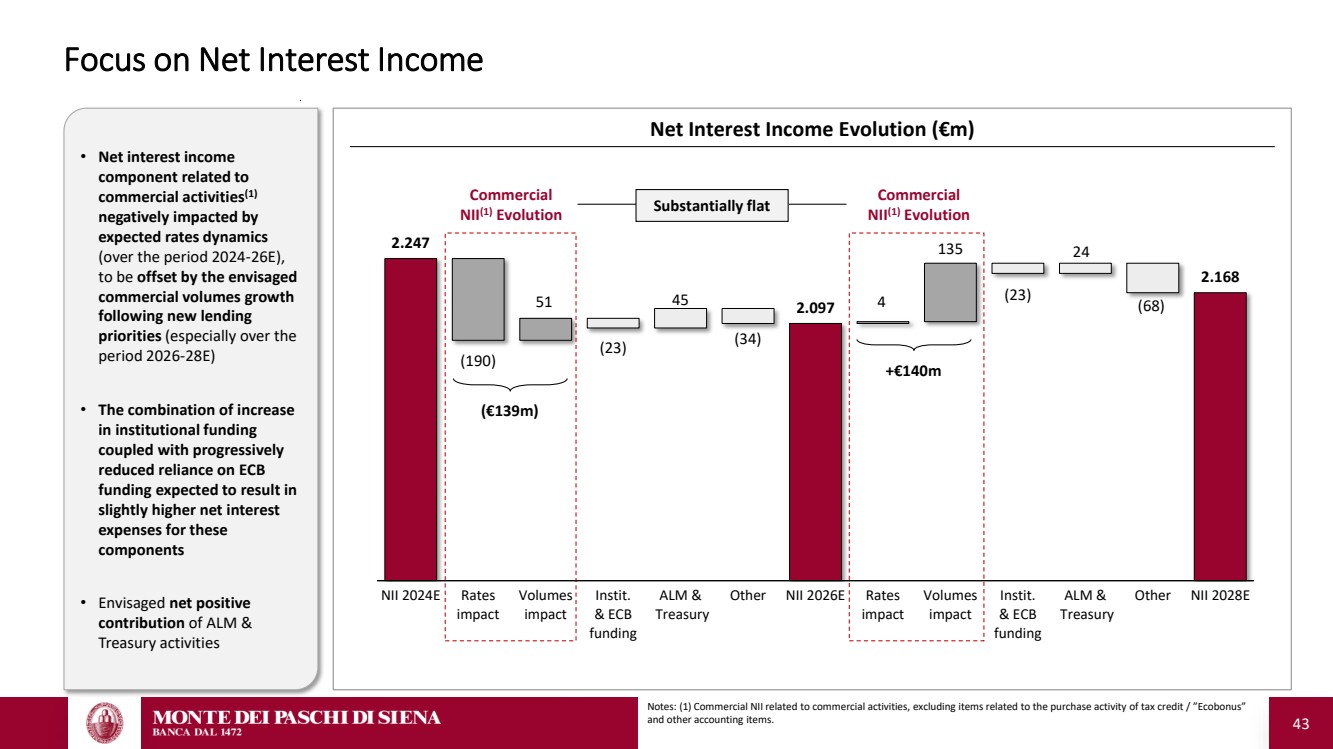
| 43 Focus on Net Interest Income • Net interest income component related to commercial activities(1) negatively impacted by expected rates dynamics (over the period 2024-26E), to be offset by the envisaged commercial volumes growth following new lending priorities (especially over the period 2026-28E) • The combination of increase in institutional funding coupled with progressively reduced reliance on ECB funding expected to result in slightly higher net interest expenses for these components • Envisaged net positive contribution of ALM & Treasury activities Net Interest Income Evolution (€m) (190) 51 (23) 45 (34) 4 135 (23) 24 (68) 2.247 2.097 2.168 NII 2024E Rates impact Volumes impact Instit. & ECB funding ALM & Treasury Other NII 2026E Rates impact Volumes impact Instit. & ECB funding ALM & Treasury Other NII 2028E (€139m) +€140m Commercial NII(1) Evolution Commercial NII(1) Evolution Substantially flat Notes: (1) Commercial NII related to commercial activities, excluding items related to the purchase activity of tax credit / ”Ecobonus” and other accounting items. |
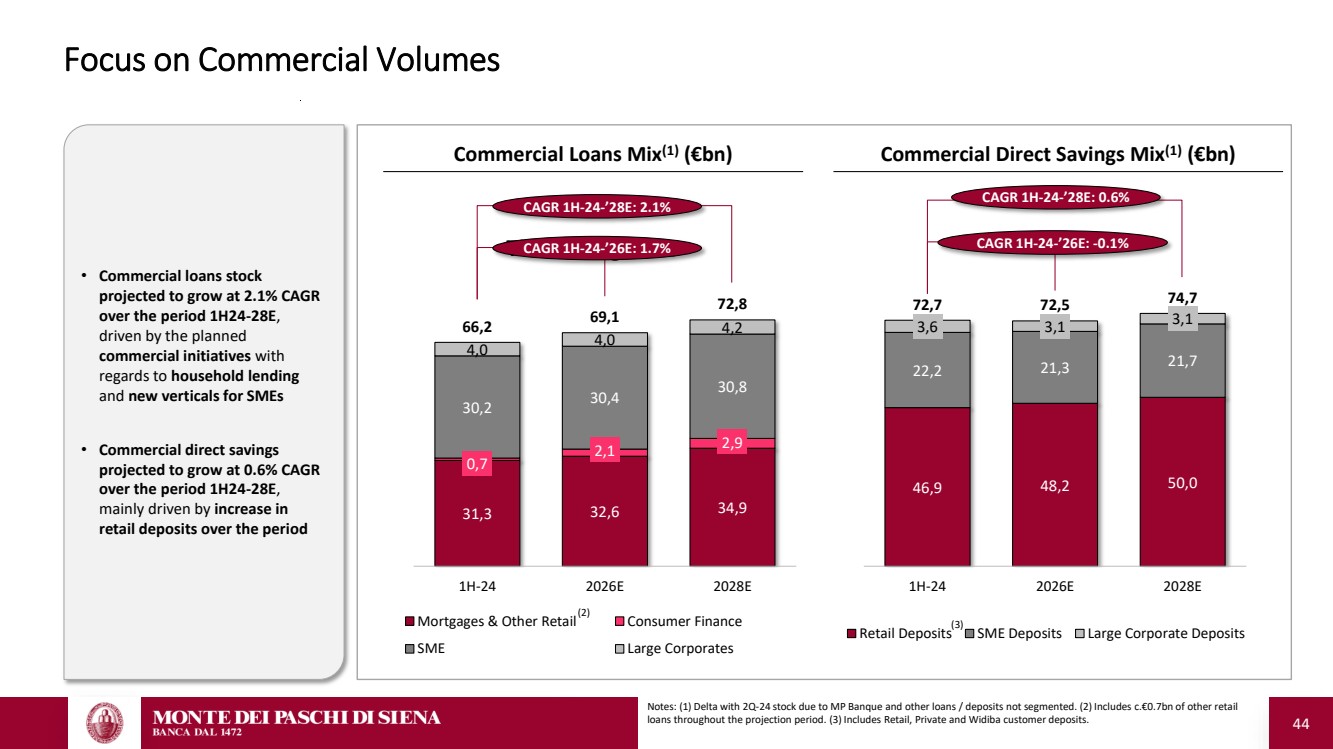
| 44 Focus on Commercial Volumes Commercial Direct Savings Mix(1) (€bn) 46,9 48,2 50,0 22,2 21,3 21,7 3,6 3,1 3,1 72,7 72,5 74,7 1H-24 2026E 2028E Retail Deposits SME Deposits Large Corporate Deposits • Commercial loans stock projected to grow at 2.1% CAGR over the period 1H24-28E, driven by the planned commercial initiatives with regards to household lending and new verticals for SMEs • Commercial direct savings projected to grow at 0.6% CAGR over the period 1H24-28E, mainly driven by increase in retail deposits over the period CAGR 1H-24-’28E: 0.6% CAGR 1H-24-’26E: -0.1% (3) Commercial Loans Mix(1) (€bn) 31,3 32,6 34,9 0,7 2,1 2,9 30,2 30,4 30,8 4,0 4,0 66,2 4,2 69,1 72,8 1H-24 2026E 2028E Titolo del grafico Mortgages & Other Retail Consumer Finance SME Large Corporates CAGR 1H-24-’28E: 2.1% CAGR 1H-24-’26E: 1.7% (2) Notes: (1) Delta with 2Q-24 stock due to MP Banque and other loans / deposits not segmented. (2) Includes c.€0.7bn of other retail loans throughout the projection period. (3) Includes Retail, Private and Widiba customer deposits. |
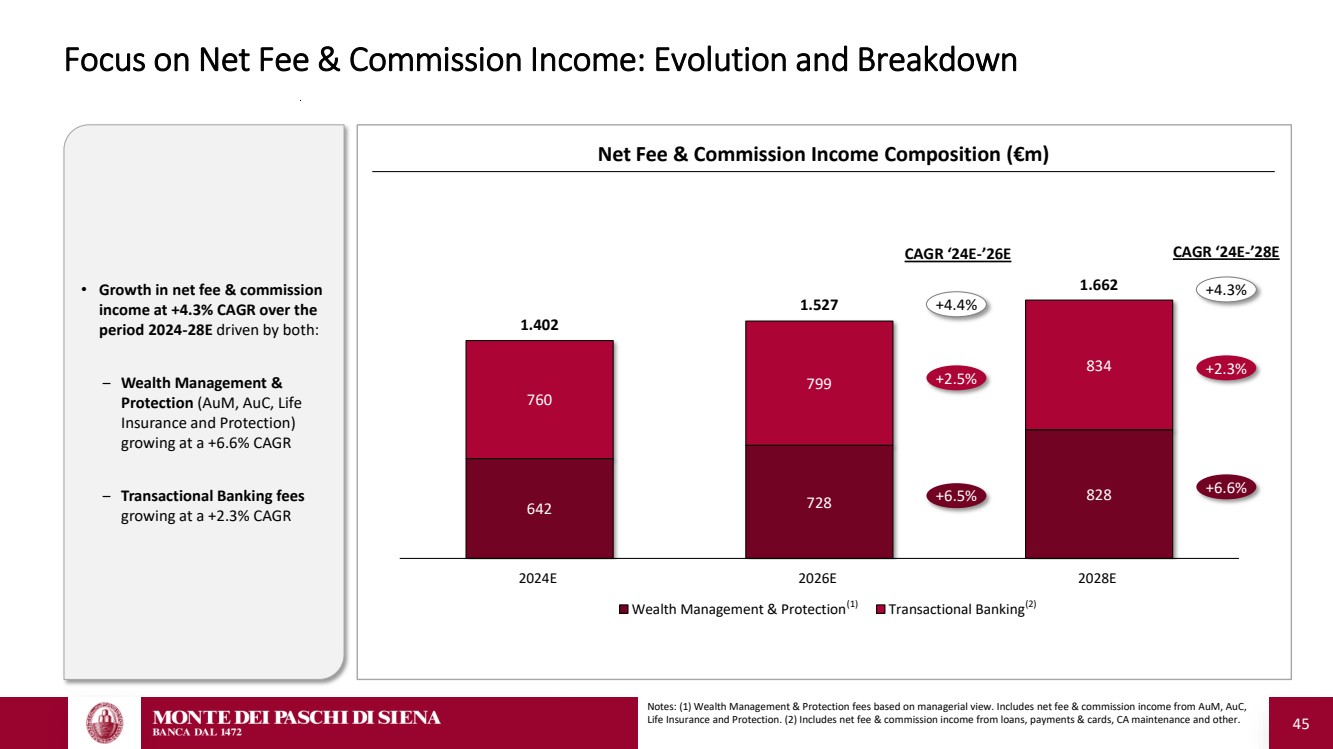
| 45 642 728 828 760 799 834 1.402 1.527 1.662 2024E 2026E 2028E Wealth Management & Protection Transactional Banking Focus on Net Fee & Commission Income: Evolution and Breakdown +6.5% +2.5% +6.6% +2.3% CAGR ‘24E-’26E CAGR ‘24E-’28E +4.4% +4.3% (1) (2) Net Fee & Commission Income Composition (€m) • Growth in net fee & commission income at +4.3% CAGR over the period 2024-28E driven by both: ‒ Wealth Management & Protection (AuM, AuC, Life Insurance and Protection) growing at a +6.6% CAGR ‒ Transactional Banking fees growing at a +2.3% CAGR Notes: (1) Wealth Management & Protection fees based on managerial view. Includes net fee & commission income from AuM, AuC, Life Insurance and Protection. (2) Includes net fee & commission income from loans, payments & cards, CA maintenance and other. |
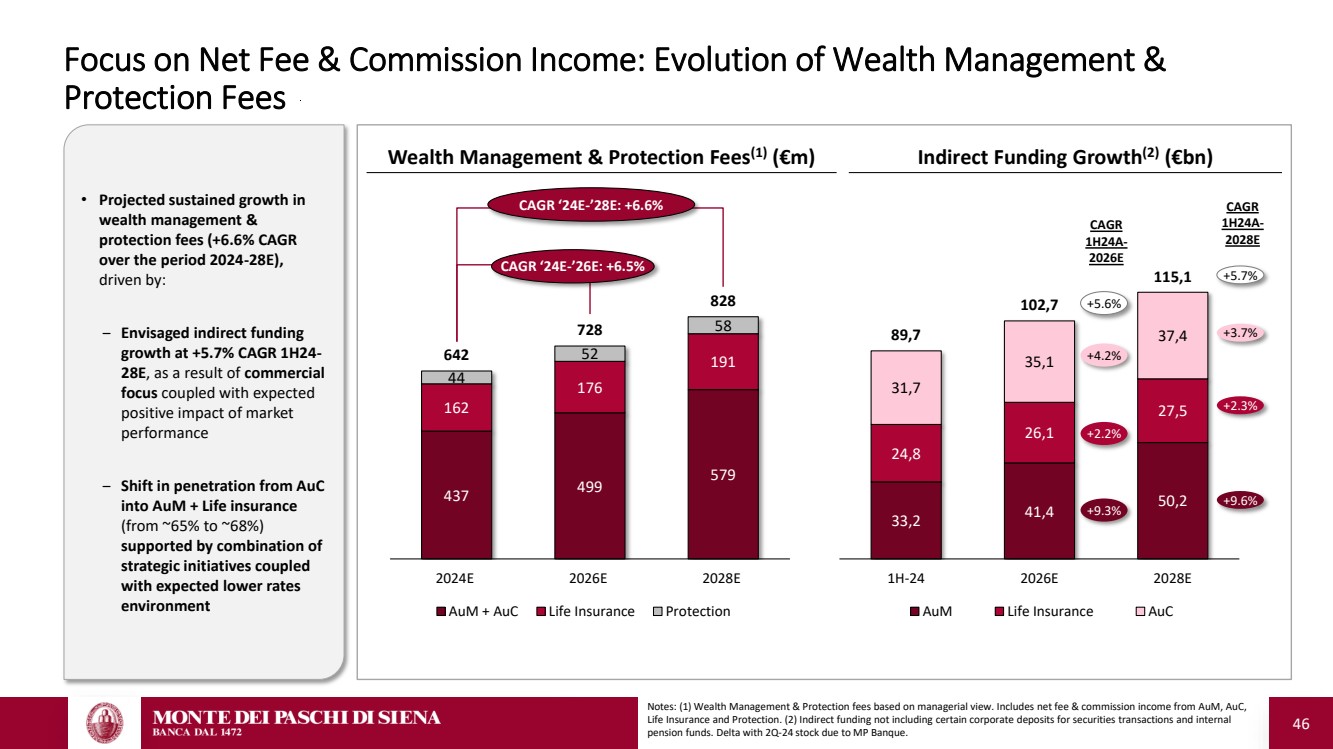
| 46 437 499 579 162 176 191 44 52 58 642 728 828 2024E 2026E 2028E AuM + AuC Life Insurance Protection 33,2 41,4 50,2 24,8 26,1 27,5 31,7 35,1 89,7 37,4 102,7 115,1 1H-24 2026E 2028E AuM Life Insurance AuC Focus on Net Fee & Commission Income: Evolution of Wealth Management & Protection Fees Indirect Funding Growth(2) Wealth Management & Protection Fees (€bn) (1) (€m) +9.6% +2.3% +9.3% +2.2% • Projected sustained growth in wealth management & protection fees (+6.6% CAGR over the period 2024-28E), driven by: ‒ Envisaged indirect funding growth at +5.7% CAGR 1H24- 28E, as a result of commercial focus coupled with expected positive impact of market performance ‒ Shift in penetration from AuC into AuM + Life insurance (from ~65% to ~68%) supported by combination of strategic initiatives coupled with expected lower rates environment CAGR ‘24E-’28E: +6.6% CAGR ‘24E-’26E: +6.5% CAGR 1H24A-2026E +5.7% +5.6% +3.7% +4.2% Notes: (1) Wealth Management & Protection fees based on managerial view. Includes net fee & commission income from AuM, AuC, Life Insurance and Protection. (2) Indirect funding not including certain corporate deposits for securities transactions and internal pension funds. Delta with 2Q-24 stock due to MP Banque. CAGR 1H24A-2028E |
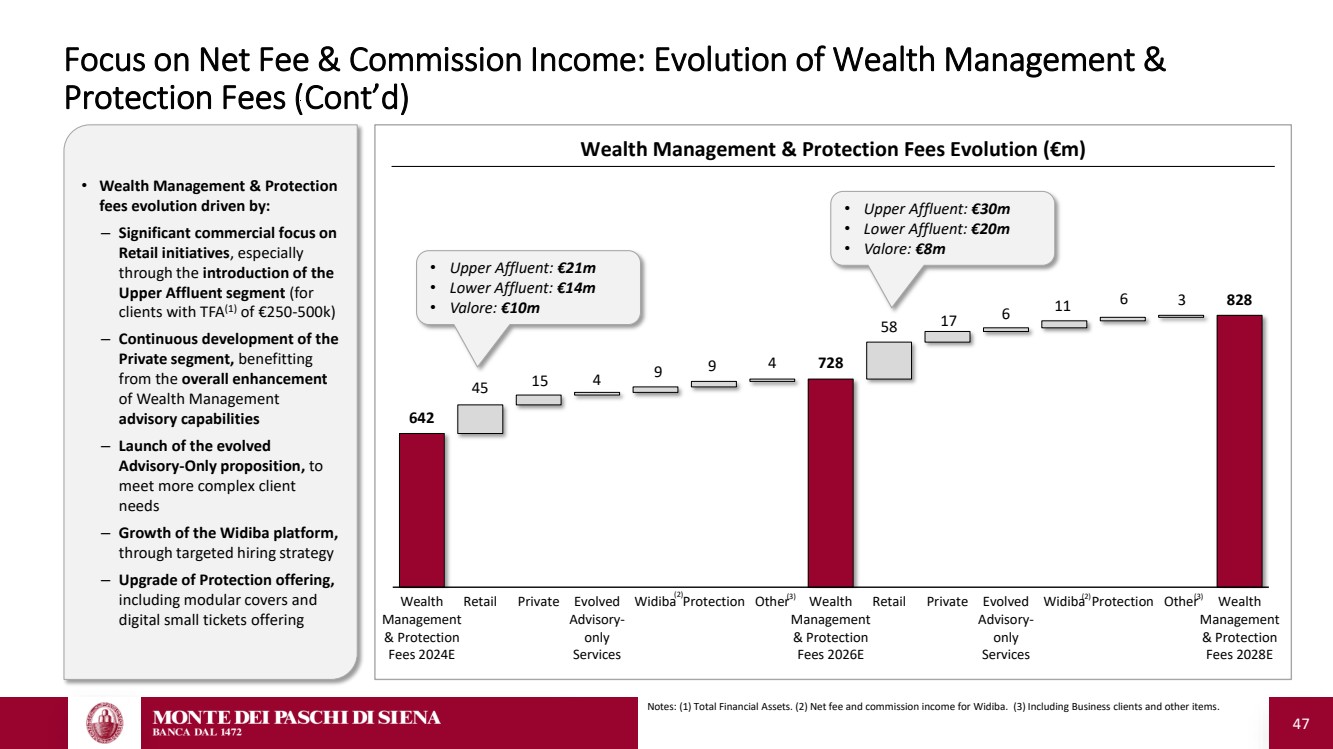
| 47 Focus on Net Fee & Commission Income: Evolution of Wealth Management & Protection Fees (Cont’d) • Wealth Management & Protection fees evolution driven by: – Significant commercial focus on Retail initiatives, especially through the introduction of the Upper Affluent segment (for clients with TFA(1) of €250-500k) – Continuous development of the Private segment, benefitting from the overall enhancement of Wealth Management advisory capabilities – Launch of the evolved Advisory-Only proposition, to meet more complex client needs – Growth of the Widiba platform, through targeted hiring strategy – Upgrade of Protection offering, including modular covers and digital small tickets offering 45 15 4 9 9 4 58 17 6 11 6 3 642 728 828 Wealth Management & Protection Fees 2024E Retail Private Evolved Advisory-only Services Widiba Protection Other Wealth Management & Protection Fees 2026E Retail Private Evolved Advisory-only Services Widiba Protection Other Wealth Management & Protection Fees 2028E Wealth Management & Protection Fees Evolution (€m) • Upper Affluent: €21m • Lower Affluent: €14m • Valore: €10m • Upper Affluent: €30m • Lower Affluent: €20m • Valore: €8m Notes: (1) Total Financial Assets. (2) Net fee and commission income for Widiba. (3) Including Business clients and other items. (2) (2) (3) (3) |
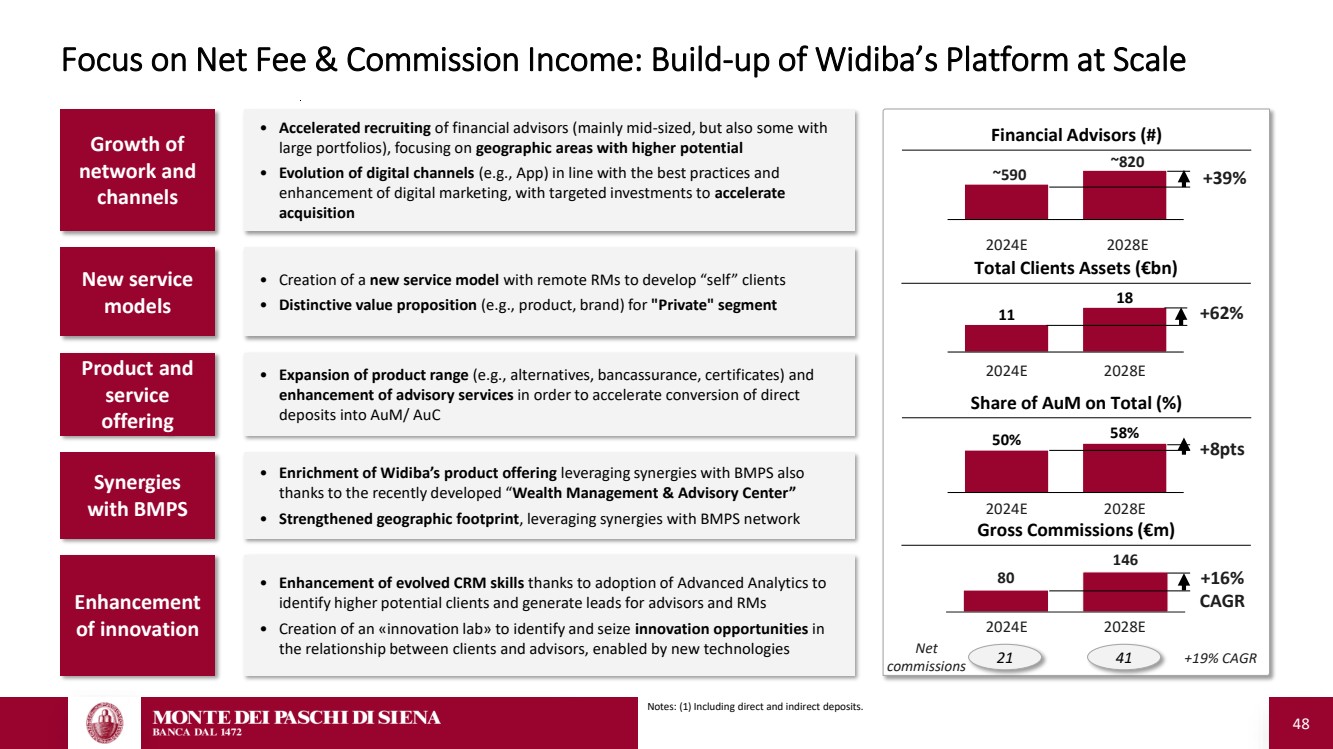
| 48 Focus on Net Fee & Commission Income: Build-up of Widiba’s Platform at Scale Financial Advisors (#) Total Clients Assets (€bn) Growth of network and channels • Accelerated recruiting of financial advisors (mainly mid-sized, but also some with large portfolios), focusing on geographic areas with higher potential • Evolution of digital channels (e.g., App) in line with the best practices and enhancement of digital marketing, with targeted investments to accelerate acquisition New service models • Creation of a new service model with remote RMs to develop “self” clients • Distinctive value proposition (e.g., product, brand) for "Private" segment Product and service offering • Expansion of product range (e.g., alternatives, bancassurance, certificates) and enhancement of advisory services in order to accelerate conversion of direct deposits into AuM/ AuC Synergies with BMPS • Enrichment of Widiba’s product offering leveraging synergies with BMPS also thanks to the recently developed “Wealth Management & Advisory Center” • Strengthened geographic footprint, leveraging synergies with BMPS network Enhancement of innovation • Enhancement of evolved CRM skills thanks to adoption of Advanced Analytics to identify higher potential clients and generate leads for advisors and RMs • Creation of an «innovation lab» to identify and seize innovation opportunities in the relationship between clients and advisors, enabled by new technologies 2024E 2028E ~820 ~590 +39% 50% 58% 2024E 2028E +8pts 11 18 2024E 2028E +62% Share of AuM on Total (%) 80 146 Gross Commissions (€m) 2024E 2028E +16% CAGR Notes: (1) Including direct and indirect deposits. 21 41 +19% CAGR Net commissions |
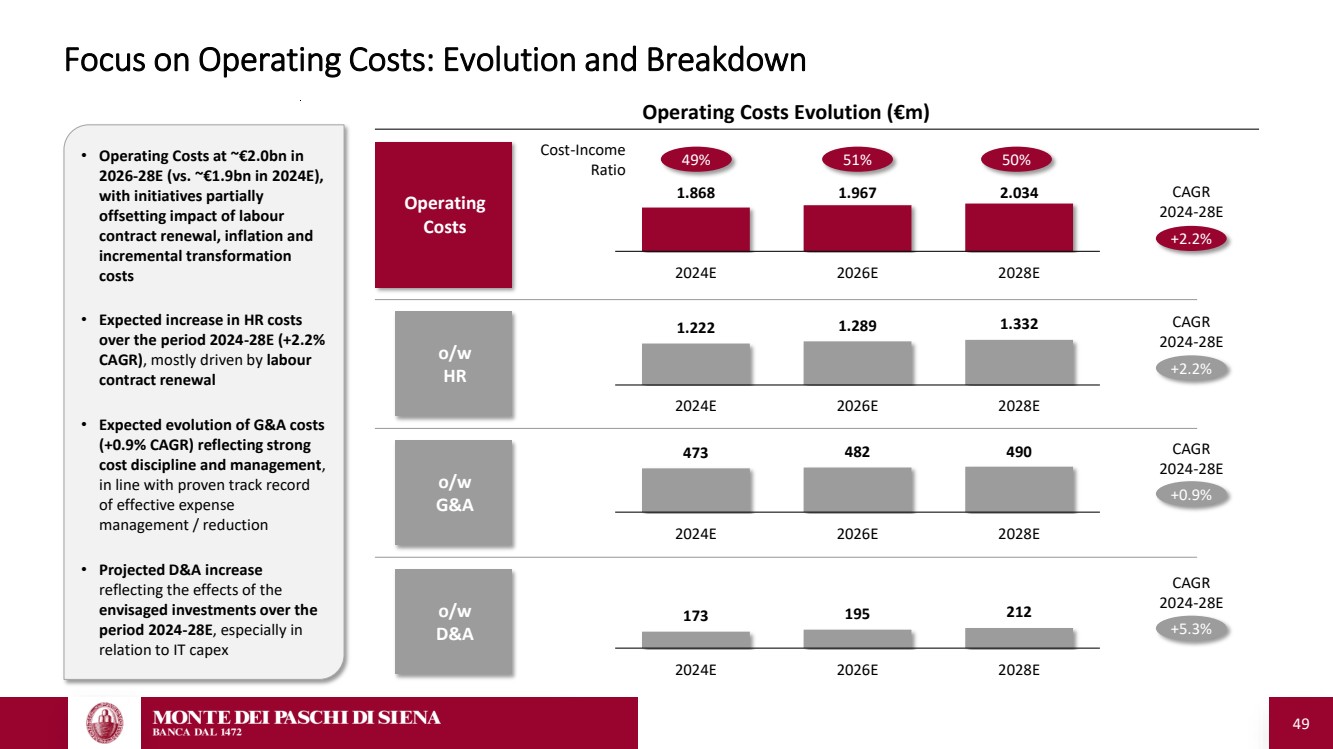
| 49 Focus on Operating Costs: Evolution and Breakdown o/w HR o/w G&A o/w D&A 1.868 1.967 2.034 2024E 2026E 2028E 1.222 1.289 1.332 2024E 2026E 2028E 473 482 490 2024E 2026E 2028E 173 195 212 2024E 2026E 2028E +2.2% +2.2% +0.9% +5.3% Operating Costs Evolution (€m) Operating Costs CAGR 2024-28E CAGR 2024-28E CAGR 2024-28E CAGR 2024-28E 49% 51% 50% Cost-Income Ratio • Operating Costs at ~€2.0bn in 2026-28E (vs. ~€1.9bn in 2024E), with initiatives partially offsetting impact of labour contract renewal, inflation and incremental transformation costs • Expected increase in HR costs over the period 2024-28E (+2.2% CAGR), mostly driven by labour contract renewal • Expected evolution of G&A costs (+0.9% CAGR) reflecting strong cost discipline and management, in line with proven track record of effective expense management / reduction • Projected D&A increase reflecting the effects of the envisaged investments over the period 2024-28E, especially in relation to IT capex |
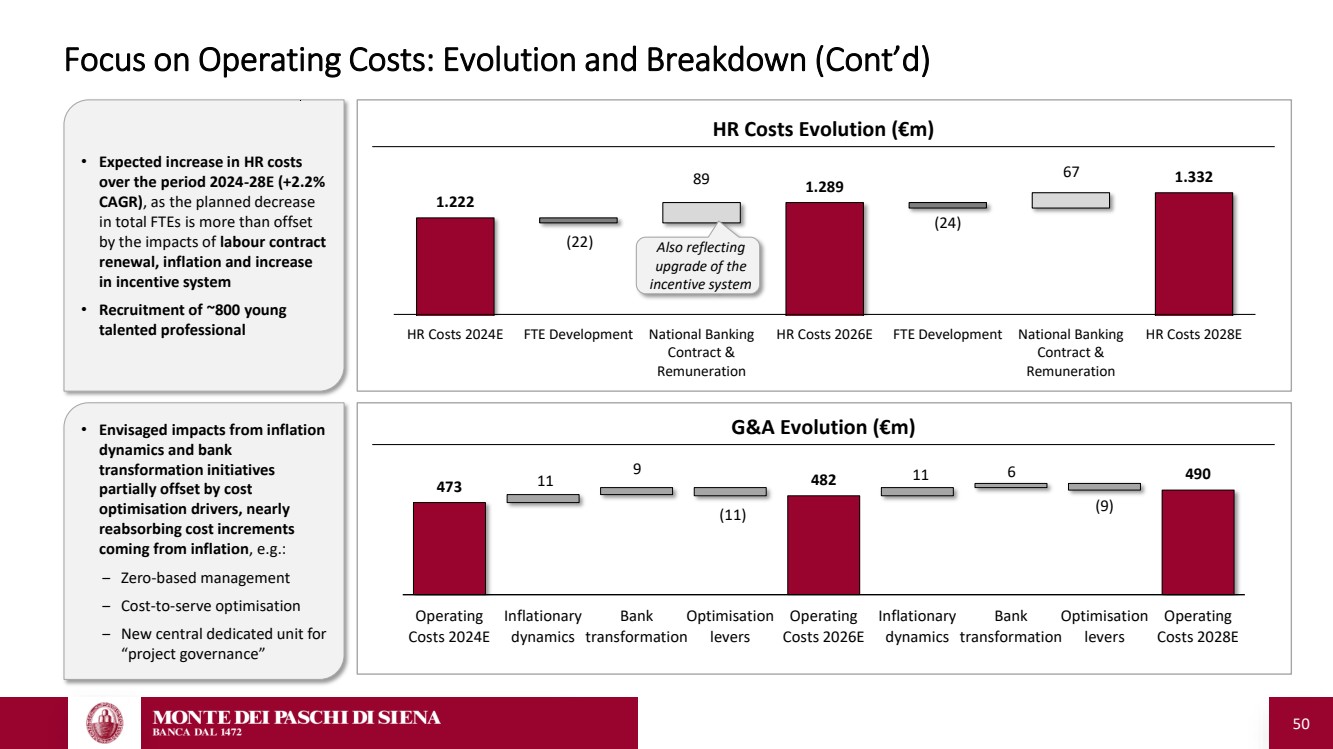
| 50 Focus on Operating Costs: Evolution and Breakdown (Cont’d) • Expected increase in HR costs over the period 2024-28E (+2.2% CAGR), as the planned decrease in total FTEs is more than offset by the impacts of labour contract renewal, inflation and increase in incentive system • Recruitment of ~800 young talented professional (22) 89 (24) 67 1.222 1.289 1.332 HR Costs 2024E FTE Development National Banking Contract & Remuneration HR Costs 2026E FTE Development National Banking Contract & Remuneration HR Costs 2028E Also reflecting upgrade of the incentive system HR Costs Evolution (€m) • Envisaged impacts from inflation G&A Evolution (€m) dynamics and bank transformation initiatives partially offset by cost optimisation drivers, nearly reabsorbing cost increments coming from inflation, e.g.: ‒ Zero-based management ‒ Cost-to-serve optimisation ‒ New central dedicated unit for “project governance” 11 9 (11) 11 6 (9) 473 482 490 Operating Costs 2024E Inflationary dynamics Bank transformation Optimisation levers Operating Costs 2026E Inflationary dynamics Bank transformation Optimisation levers Operating Costs 2028E |
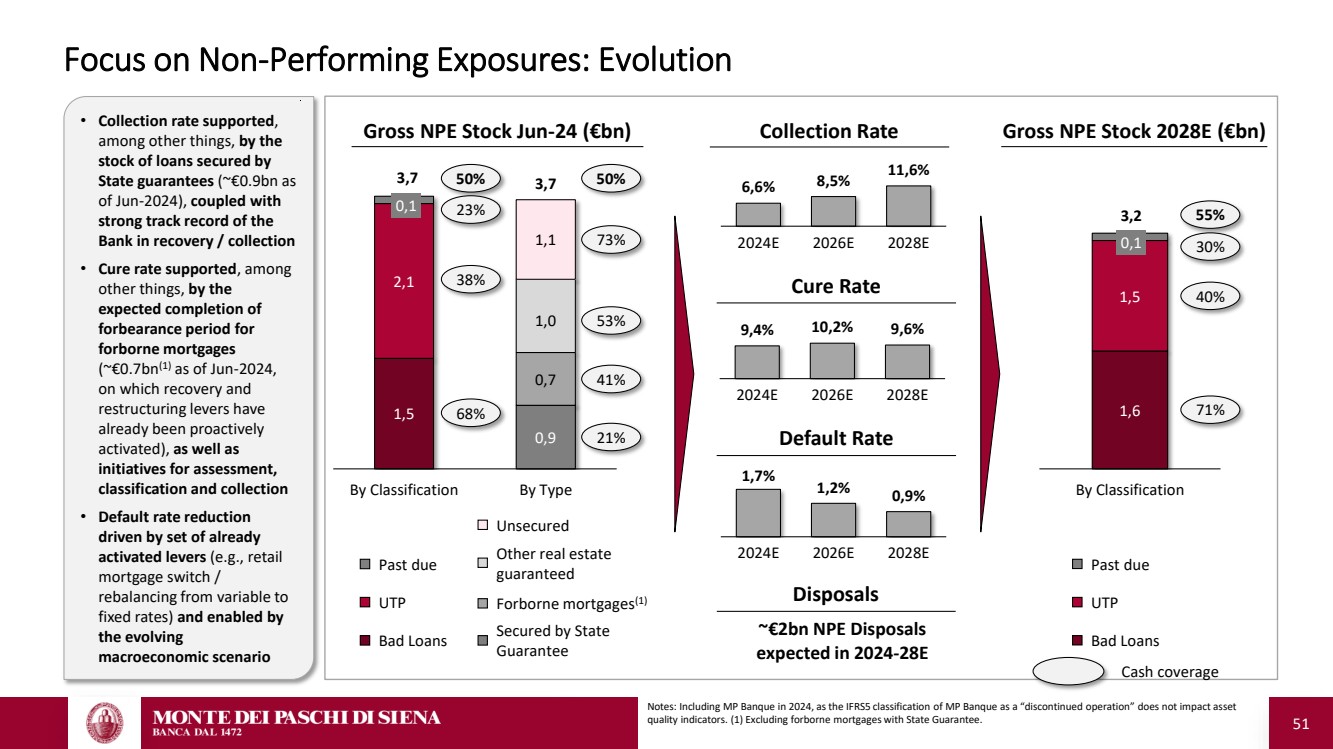
| 51 Focus on Non-Performing Exposures: Evolution Gross NPE Stock 2028E (€bn) Default Rate 1,7% 1,2% 0,9% 2024E 2026E 2028E Collection Rate 6,6% 8,5% 11,6% 2024E 2026E 2028E Cure Rate 9,4% 10,2% 9,6% 2024E 2026E 2028E Disposals ~€2bn NPE Disposals expected in 2024-28E 1,5 2,1 0,1 0,9 0,7 1,0 1,1 3,7 3,7 By Classification By Type Gross NPE Stock Jun-24 (€bn) Bad Loans UTP Past due Secured by State Guarantee Forborne mortgages(1) Other real estate guaranteed Unsecured • Collection rate supported, among other things, by the stock of loans secured by State guarantees (~€0.9bn as of Jun-2024), coupled with strong track record of the Bank in recovery / collection • Cure rate supported, among other things, by the expected completion of forbearance period for forborne mortgages (~€0.7bn(1) as of Jun-2024, on which recovery and restructuring levers have already been proactively activated), as well as initiatives for assessment, classification and collection • Default rate reduction driven by set of already activated levers (e.g., retail mortgage switch / rebalancing from variable to fixed rates) and enabled by the evolving macroeconomic scenario 50% 23% 38% 68% 1,6 1,5 0,1 3,2 By Classification Bad Loans UTP Past due 55% 30% 40% 71% 50% 73% 53% 21% 41% Notes: Including MP Banque in 2024, as the IFRS5 classification of MP Banque as a “discontinued operation” does not impact asset quality indicators. (1) Excluding forborne mortgages with State Guarantee. Cash coverage |
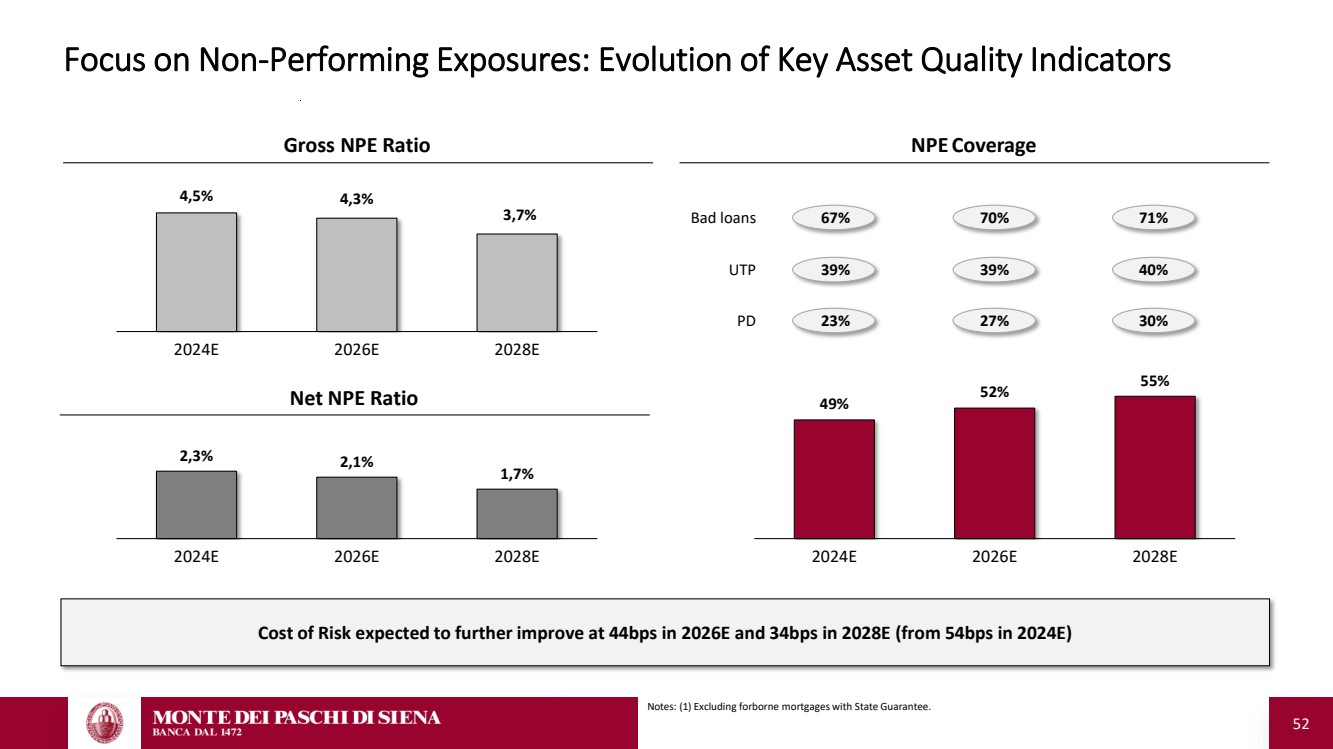
| 52 Focus on Non-Performing Exposures: Evolution of Key Asset Quality Indicators Gross NPE Ratio NPE Coverage 4,5% 4,3% 3,7% 2024E 2026E 2028E Net NPE Ratio 2,3% 2,1% 1,7% 2024E 2026E 2028E Cost of Risk expected to further improve at 44bps in 2026E and 34bps in 2028E (from 54bps in 2024E) 49% 52% 55% 2024E 2026E 2028E Bad loans 67% 70% 71% UTP 39% 39% 40% PD 23% 27% 30% Notes: (1) Excluding forborne mortgages with State Guarantee. |
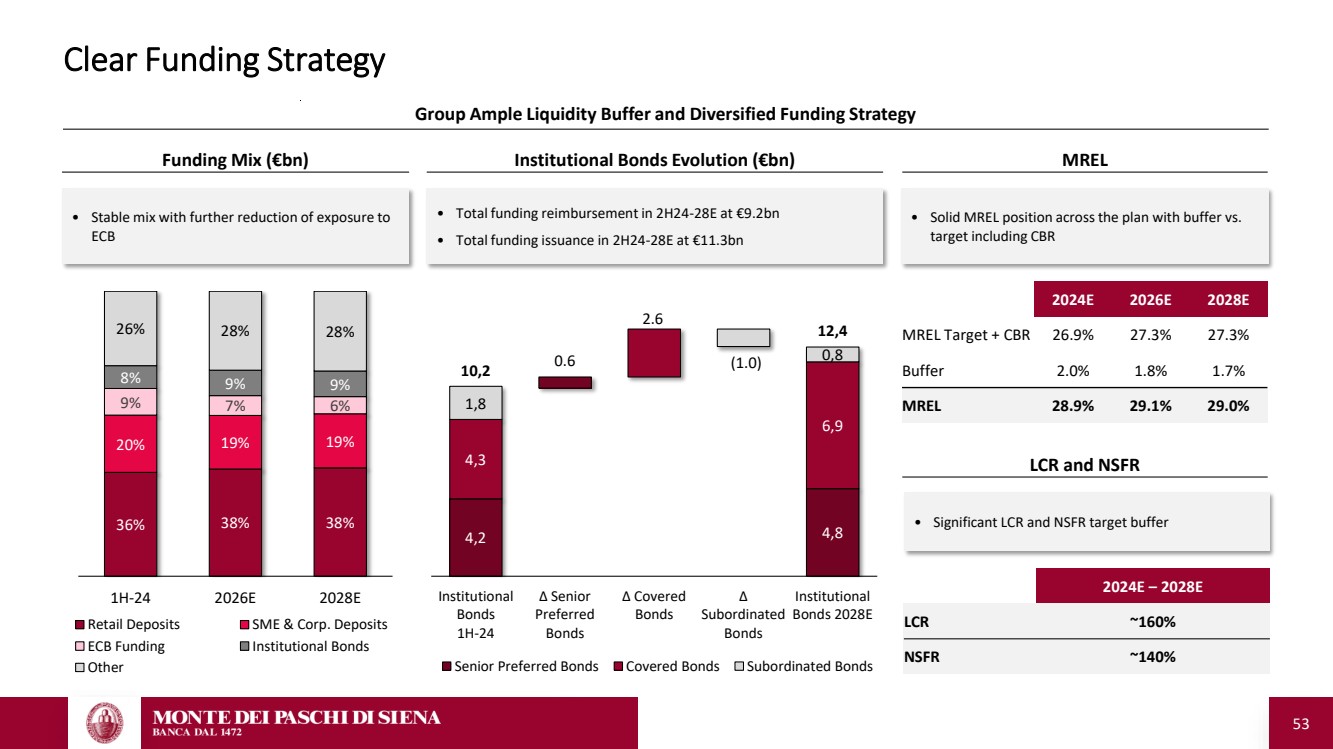
| 53 Clear Funding Strategy Group Ample Liquidity Buffer and Diversified Funding Strategy • Significant LCR and NSFR target buffer MREL • Solid MREL position across the plan with buffer vs. target including CBR Funding Mix (€bn) • Stable mix with further reduction of exposure to ECB 36% 38% 38% 20% 19% 19% 9% 7% 6% 8% 9% 9% 26% 28% 28% 1H-24 2026E 2028E Retail Deposits SME & Corp. Deposits ECB Funding Institutional Bonds Other Institutional Bonds Evolution (€bn) • Total funding reimbursement in 2H24-28E at €9.2bn • Total funding issuance in 2H24-28E at €11.3bn 4,2 4,8 4,3 6,9 1,8 0,8 0.6 2.6 (1.0) 10,2 12,4 Institutional Bonds 1H-24 ∆ Senior Preferred Bonds ∆ Covered Bonds ∆ Subordinated Bonds Institutional Bonds 2028E Senior Preferred Bonds Covered Bonds Subordinated Bonds LCR and NSFR 2024E 2026E 2028E MREL Target + CBR 26.9% 27.3% 27.3% Buffer 2.0% 1.8% 1.7% MREL 28.9% 29.1% 29.0% 2024E – 2028E LCR ~160% NSFR ~140% |
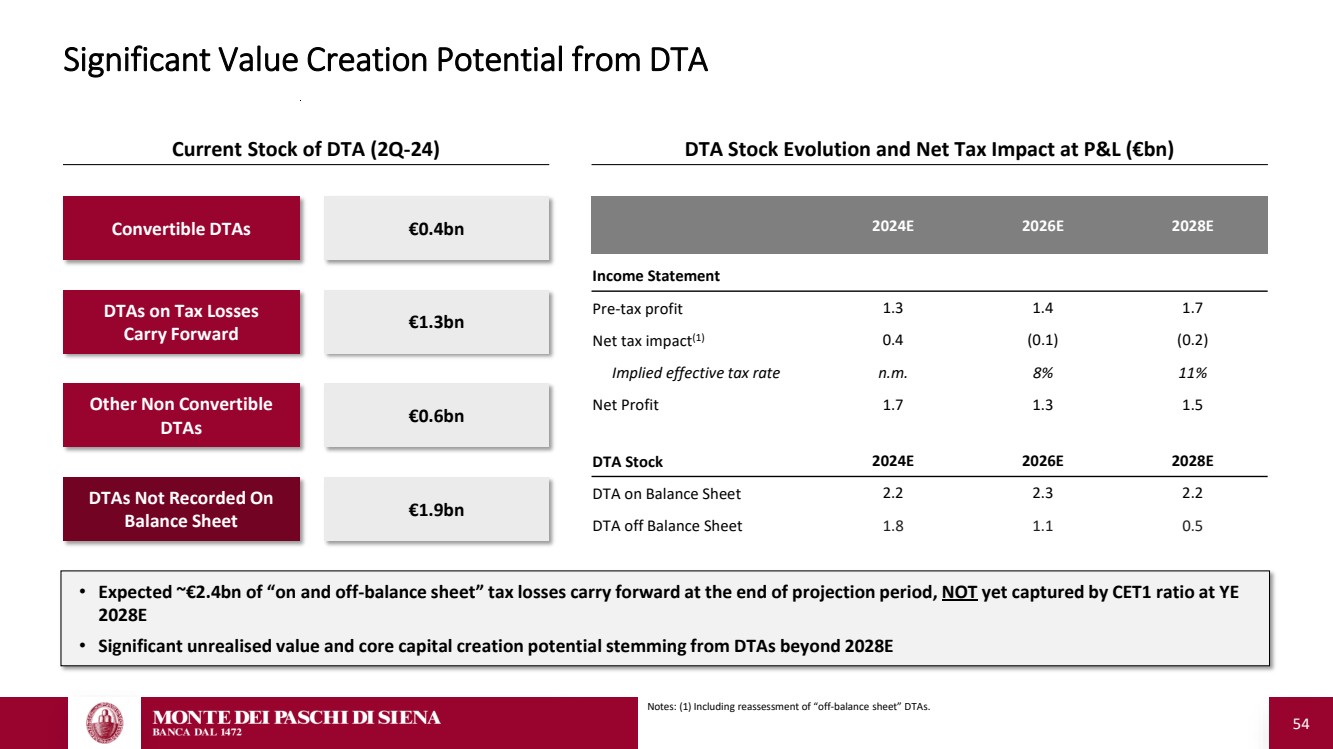
| 54 Significant Value Creation Potential from DTA Other Non Convertible DTAs Convertible DTAs DTAs on Tax Losses Carry Forward DTAs Not Recorded On Balance Sheet Current Stock of DTA (2Q-24) 2024E 2026E 2028E Income Statement Pre-tax profit 1.3 1.4 1.7 Net tax impact(1) 0.4 (0.1) (0.2) Implied effective tax rate n.m. 8% 11% Net Profit 1.7 1.3 1.5 DTA Stock 2024E 2026E 2028E DTA on Balance Sheet 2.2 2.3 2.2 DTA off Balance Sheet 1.8 1.1 0.5 DTA Stock Evolution and Net Tax Impact at P&L (€bn) €0.6bn €0.4bn €1.3bn €1.9bn • Expected ~€2.4bn of “on and off-balance sheet” tax losses carry forward at the end of projection period, NOT yet captured by CET1 ratio at YE 2028E • Significant unrealised value and core capital creation potential stemming from DTAs beyond 2028E Notes: (1) Including reassessment of “off-balance sheet” DTAs. |
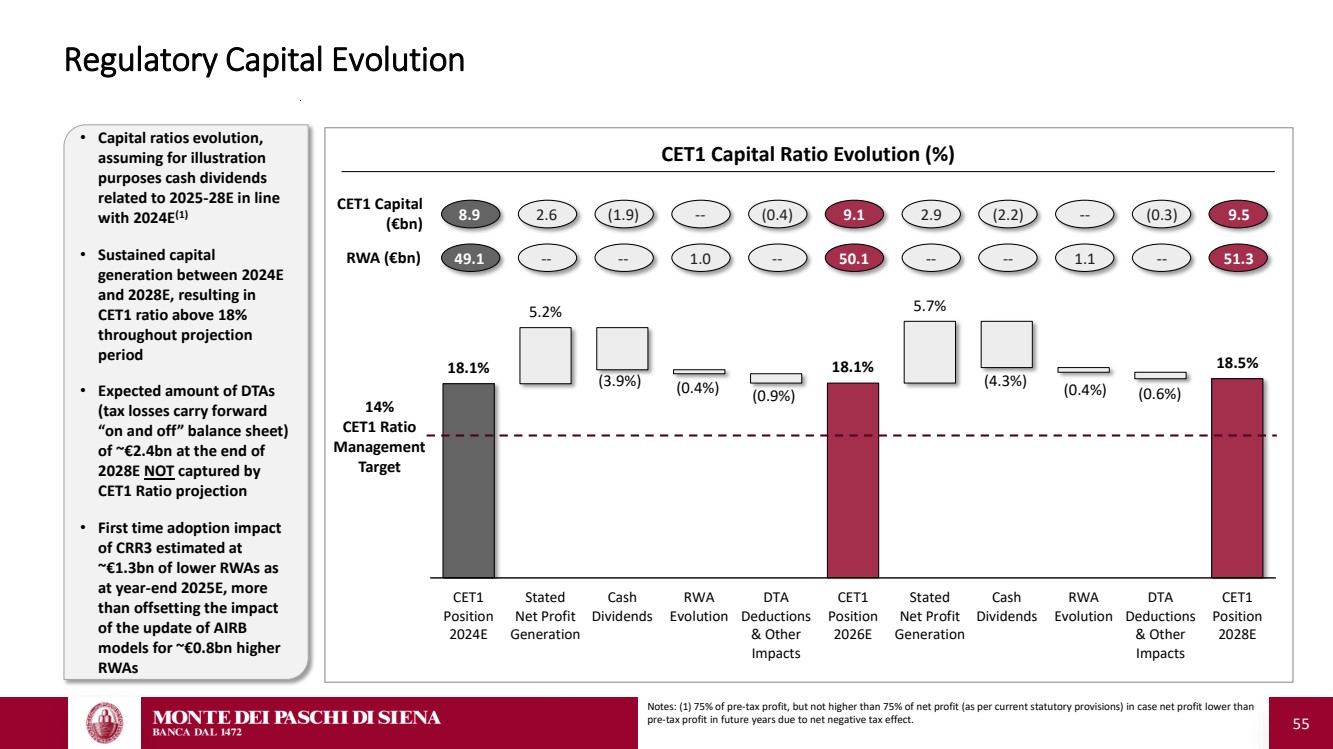
| 55 Regulatory Capital Evolution 18.1% 5.2% (3.9%) (0.4%) (0.9%) 18.1% 5.7% (4.3%) (0.4%) (0.6%) 18.5% CET1 Position 2024E Stated Net Profit Generation Cash Dividends RWA Evolution DTA Deductions & Other Impacts CET1 Position 2026E Stated Net Profit Generation Cash Dividends RWA Evolution DTA Deductions & Other Impacts CET1 Position 2028E 14% CET1 Ratio Management Target 8.9 2.6 (1.9) -- (0.4) 9.1 2.9 (2.2) -- (0.3) 9.5 49.1 -- -- 1.0 -- 50.1 -- -- 1.1 -- 51.3 CET1 Capital (€bn) RWA (€bn) CET1 Capital Ratio Evolution (%) • Capital ratios evolution, assuming for illustration purposes cash dividends related to 2025-28E in line with 2024E(1) • Sustained capital generation between 2024E and 2028E, resulting in CET1 ratio above 18% throughout projection period • Expected amount of DTAs (tax losses carry forward “on and off” balance sheet) of ~€2.4bn at the end of 2028E NOT captured by CET1 Ratio projection • First time adoption impact of CRR3 estimated at ~€1.3bn of lower RWAs as at year-end 2025E, more than offsetting the impact of the update of AIRB models for ~€0.8bn higher RWAs Notes: (1) 75% of pre-tax profit, but not higher than 75% of net profit (as per current statutory provisions) in case net profit lower than pre-tax profit in future years due to net negative tax effect. |
| 56 3. Closing Remarks and Q&A Session |

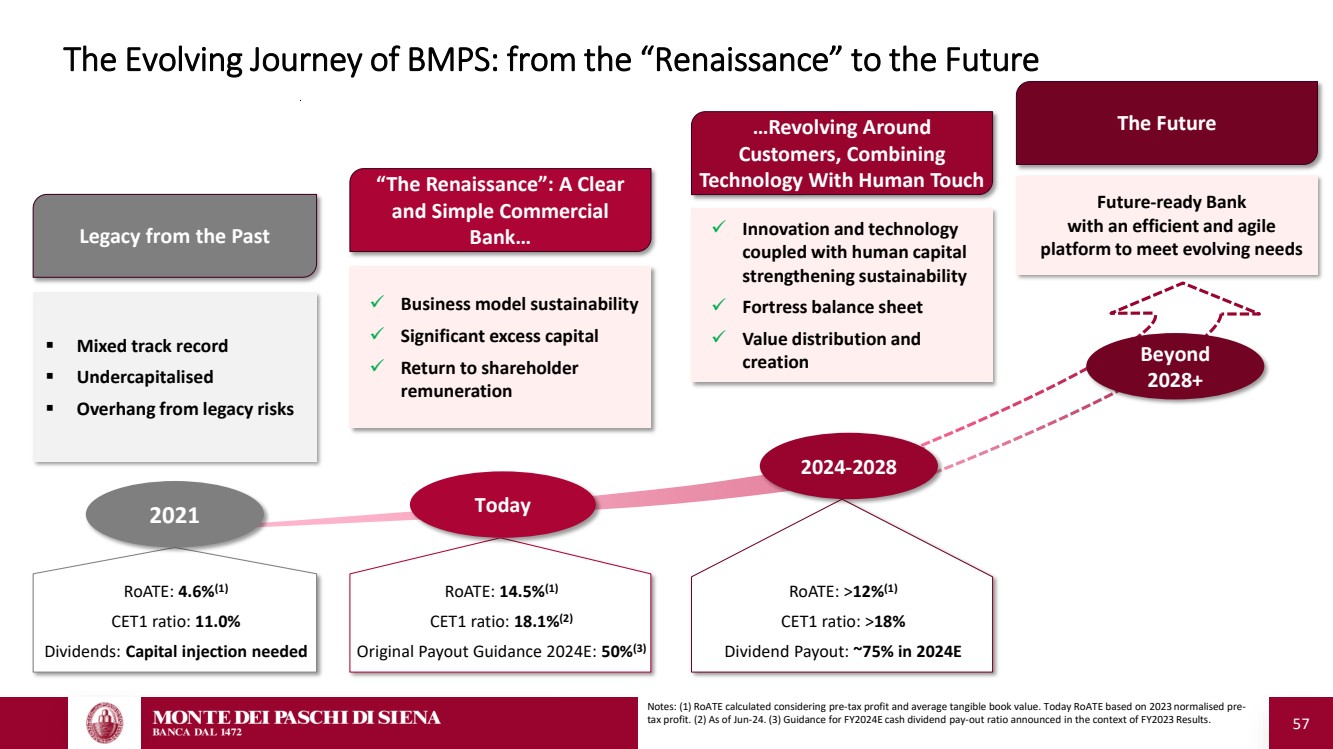
| 57 The Evolving Journey of BMPS: from the “Renaissance” to the Future RoATE: 14.5%(1) CET1 ratio: 18.1%(2) Original Payout Guidance 2024E: 50%(3) Today RoATE: 4.6%(1) CET1 ratio: 11.0% Dividends: Capital injection needed Legacy from the Past ▪ Mixed track record ▪ Undercapitalised ▪ Overhang from legacy risks “The Renaissance”: A Clear and Simple Commercial Bank… ✓ Business model sustainability ✓ Significant excess capital ✓ Return to shareholder remuneration 2021 ✓ Innovation and technology coupled with human capital strengthening sustainability ✓ Fortress balance sheet ✓ Value distribution and creation …Revolving Around Customers, Combining Technology With Human Touch The Future Beyond 2028+ Future-ready Bank with an efficient and agile platform to meet evolving needs RoATE: >12%(1) CET1 ratio: >18% Dividend Payout: ~75% in 2024E 2024-2028 Notes: (1) RoATE calculated considering pre-tax profit and average tangible book value. Today RoATE based on 2023 normalised pre-tax profit. (2) As of Jun-24. (3) Guidance for FY2024E cash dividend pay-out ratio announced in the context of FY2023 Results. |
| 58 Appendix – Supporting Materials of 2Q-24 & 1H-24 Results |
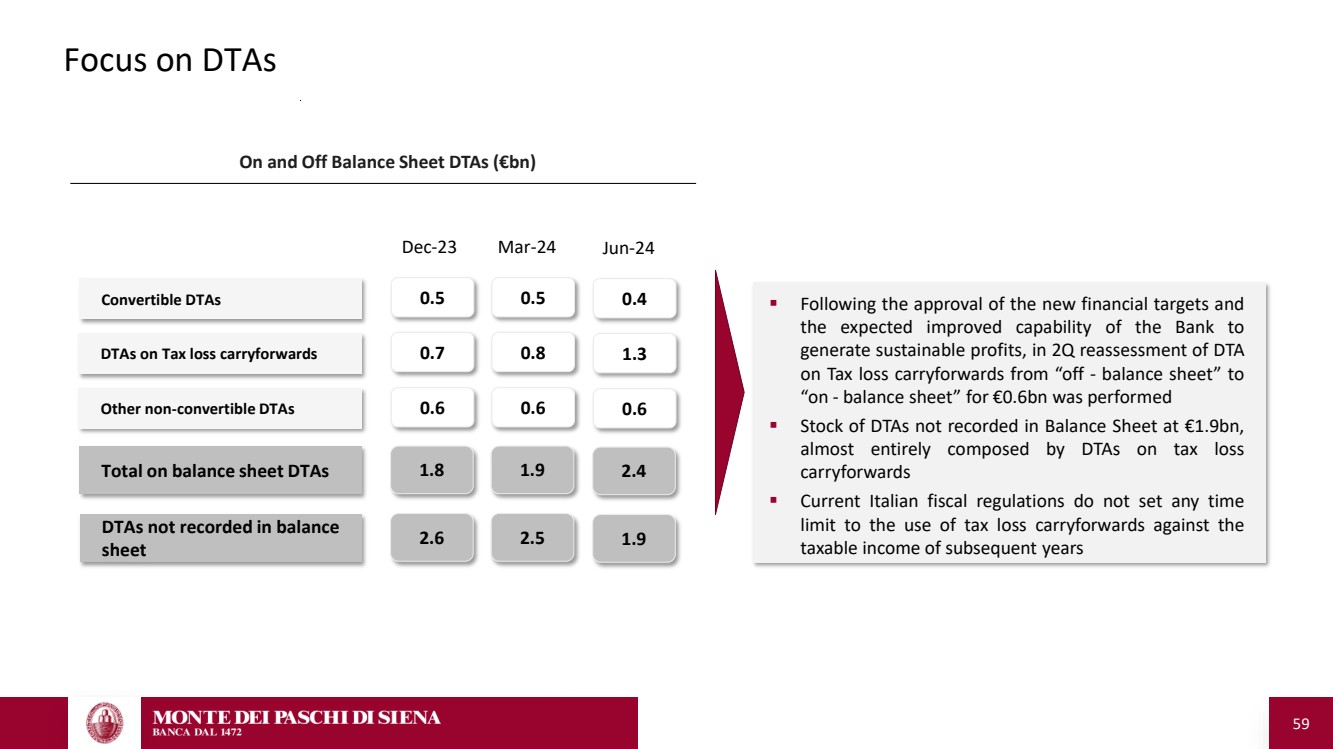
| 59 Focus on DTAs Other non-convertible DTAs DTAs on Tax loss carryforwards Convertible DTAs Dec-23 ▪ Following the approval of the new financial targets and the expected improved capability of the Bank to generate sustainable profits, in 2Q reassessment of DTA on Tax loss carryforwards from “off - balance sheet” to “on - balance sheet” for €0.6bn was performed ▪ Stock of DTAs not recorded in Balance Sheet at €1.9bn, almost entirely composed by DTAs on tax loss carryforwards ▪ Current Italian fiscal regulations do not set any time limit to the use of tax loss carryforwards against the taxable income of subsequent years On and Off Balance Sheet DTAs (€bn) DTAs not recorded in balance sheet Total on balance sheet DTAs 0.5 0.7 0.6 2.6 1.8 Mar-24 0.5 0.8 0.6 2.5 1.9 0.4 1.3 0.6 1.9 2.4 Jun-24 |
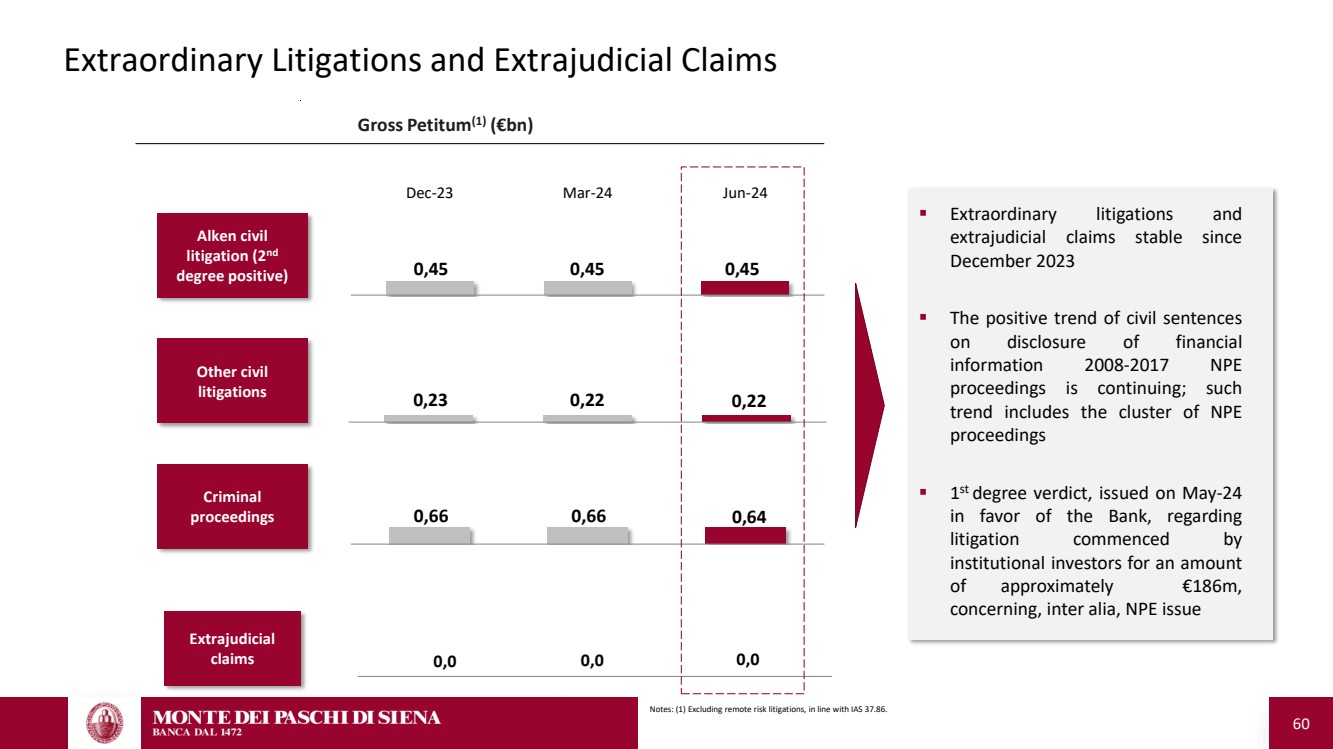
| 60 Extraordinary Litigations and Extrajudicial Claims 0,66 0,66 0,64 0,23 0,22 0,22 Gross Petitum(1) (€bn) Other civil litigations Extrajudicial claims 0,0 0,0 0,0 0,45 0,45 0,45 Dec-23 Mar-24 Jun-24 Alken civil litigation (2nd degree positive) ▪ Extraordinary litigations and extrajudicial claims stable since December 2023 ▪ The positive trend of civil sentences on disclosure of financial information 2008-2017 NPE proceedings is continuing; such trend includes the cluster of NPE proceedings ▪ 1 st degree verdict, issued on May-24 in favor of the Bank, regarding litigation commenced by institutional investors for an amount of approximately €186m, concerning, inter alia, NPE issue Notes: (1) Excluding remote risk litigations, in line with IAS 37.86. Criminal proceedings |
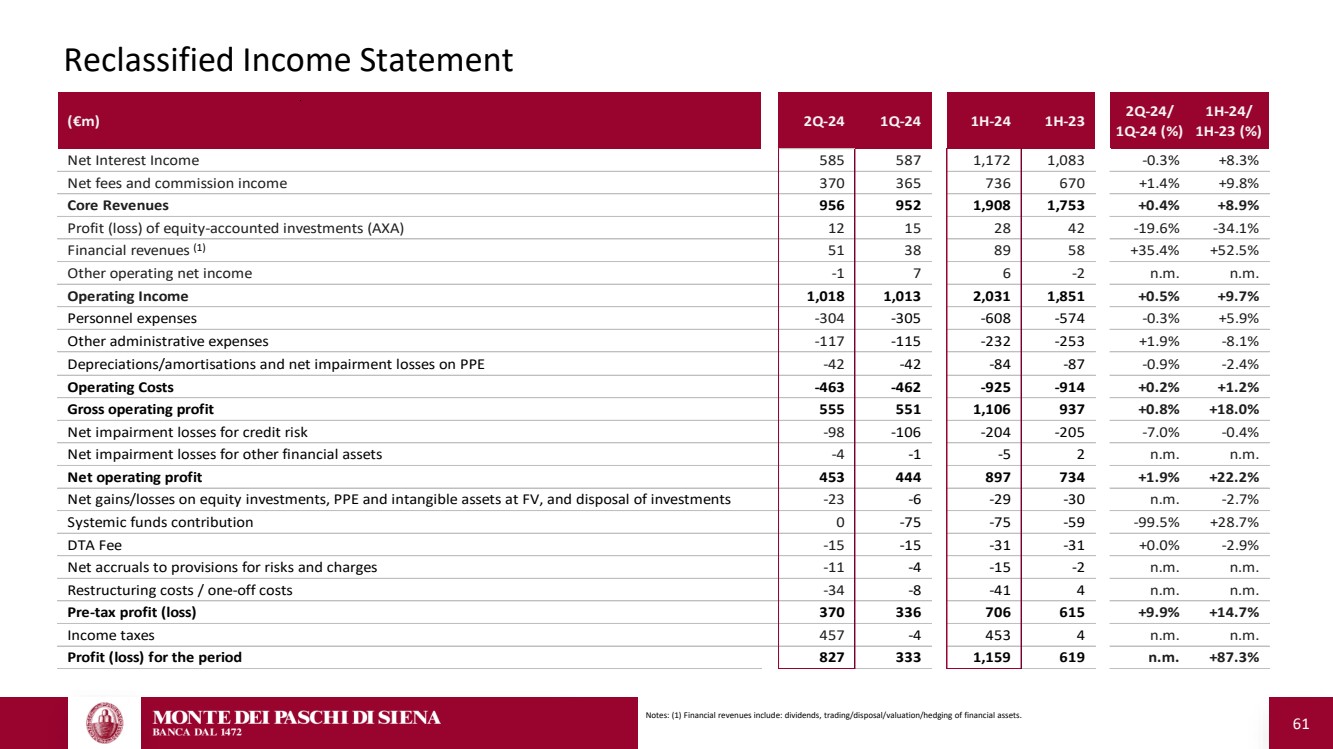
| 61 Reclassified Income Statement (€m) 2Q-24 1Q-24 1H-24 1H-23 2Q-24/ 1Q-24 (%) 1H-24/ 1H-23 (%) Net Interest Income 585 587 1,172 1,083 -0.3% +8.3% Net fees and commission income 370 365 736 670 +1.4% +9.8% Core Revenues 956 952 1,908 1,753 +0.4% +8.9% Profit (loss) of equity-accounted investments (AXA) 1 2 1 5 2 8 4 2 -19.6% -34.1% Financial revenues 5 1 3 8 8 9 5 8 +35.4% +52.5% Other operating net income -1 7 6 -2 n.m. n.m. Operating Income 1,018 1,013 2,031 1,851 +0.5% +9.7% Personnel expenses -304 -305 -608 -574 -0.3% +5.9% Other administrative expenses -117 -115 -232 -253 +1.9% -8.1% Depreciations/amortisations and net impairment losses on PPE -42 -42 -84 -87 -0.9% -2.4% Operating Costs -463 -462 -925 -914 +0.2% +1.2% Gross operating profit 555 551 1,106 937 +0.8% +18.0% Net impairment losses for credit risk -98 -106 -204 -205 -7.0% -0.4% Net impairment losses for other financial assets -4 -1 -5 2 n.m. n.m. Net operating profit 453 444 897 734 +1.9% +22.2% Net gains/losses on equity investments, PPE and intangible assets at FV, and disposal of investments -23 -6 -29 -30 n.m. -2.7% Systemic funds contribution 0 -75 -75 -59 -99.5% +28.7% DTA Fee -15 -15 -31 -31 +0.0% -2.9% Net accruals to provisions for risks and charges -11 -4 -15 -2 n.m. n.m. Restructuring costs / one-off costs -34 -8 -41 4 n.m. n.m. Pre-tax profit (loss) 370 336 706 615 +9.9% +14.7% Income taxes 457 -4 453 4 n.m. n.m. Profit (loss) for the period 827 333 1,159 619 n.m. +87.3% (1) Notes: (1) Financial revenues include: dividends, trading/disposal/valuation/hedging of financial assets. |
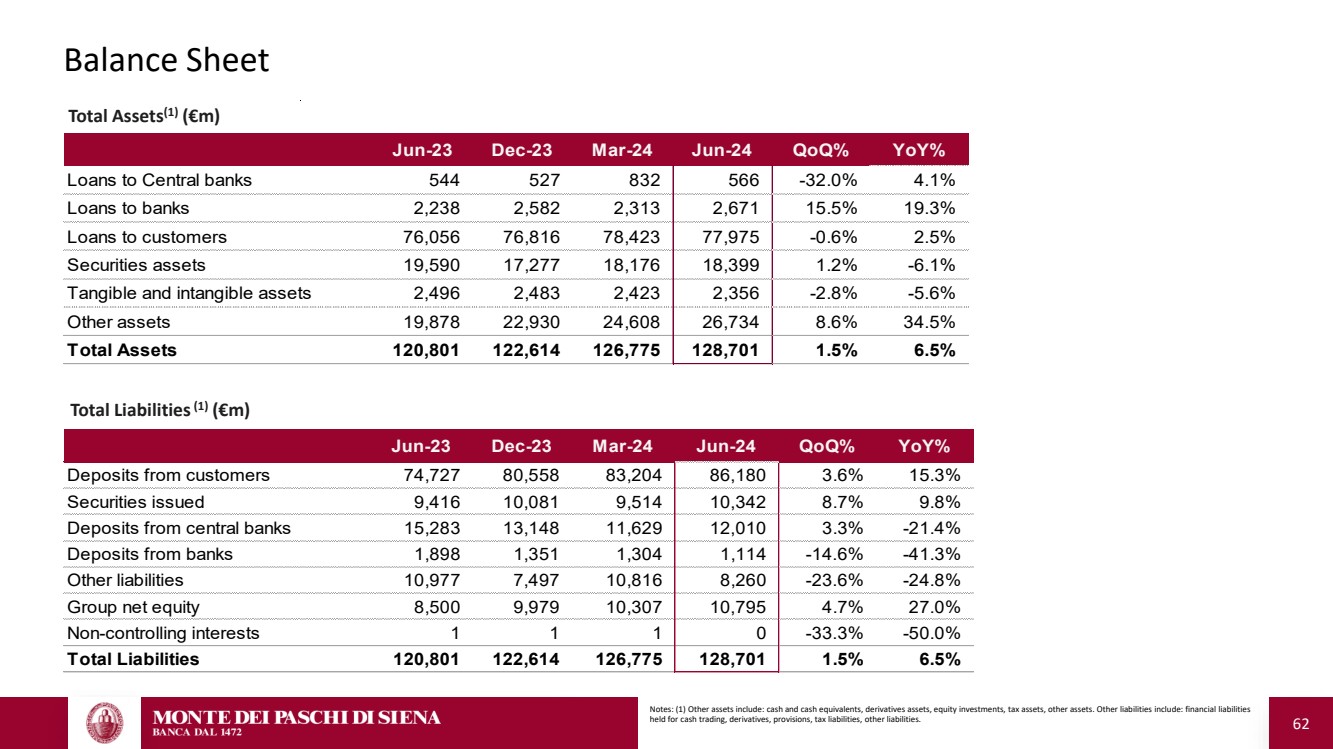
| 62 Balance Sheet Notes: (1) Other assets include: cash and cash equivalents, derivatives assets, equity investments, tax assets, other assets. Other liabilities include: financial liabilities held for cash trading, derivatives, provisions, tax liabilities, other liabilities. Total Assets(1) (€m) Total Liabilities(1) (€m) Jun-23 Dec-23 Mar-24 Jun-24 QoQ% YoY% Loans to Central banks 544 527 832 566 -32.0% 4.1% Loans to banks 2,238 2,582 2,313 2,671 15.5% 19.3% Loans to customers 76,056 76,816 78,423 77,975 -0.6% 2.5% Securities assets 19,590 17,277 18,176 18,399 1.2% -6.1% Tangible and intangible assets 2,496 2,483 2,423 2,356 -2.8% -5.6% Other assets 19,878 22,930 24,608 26,734 8.6% 34.5% Total Assets 120,801 122,614 126,775 128,701 1.5% 6.5% Jun-23 Dec-23 Mar-24 Jun-24 QoQ% YoY% Deposits from customers 74,727 80,558 83,204 86,180 3.6% 15.3% Securities issued 9,416 10,081 9,514 10,342 8.7% 9.8% Deposits from central banks 15,283 13,148 11,629 12,010 3.3% -21.4% Deposits from banks 1,898 1,351 1,304 1,114 -14.6% -41.3% Other liabilities 10,977 7,497 10,816 8,260 -23.6% -24.8% Group net equity 8,500 9,979 10,307 10,795 4.7% 27.0% Non-controlling interests 1 1 1 0 -33.3% -50.0% Total Liabilities 120,801 122,614 126,775 128,701 1.5% 6.5% |
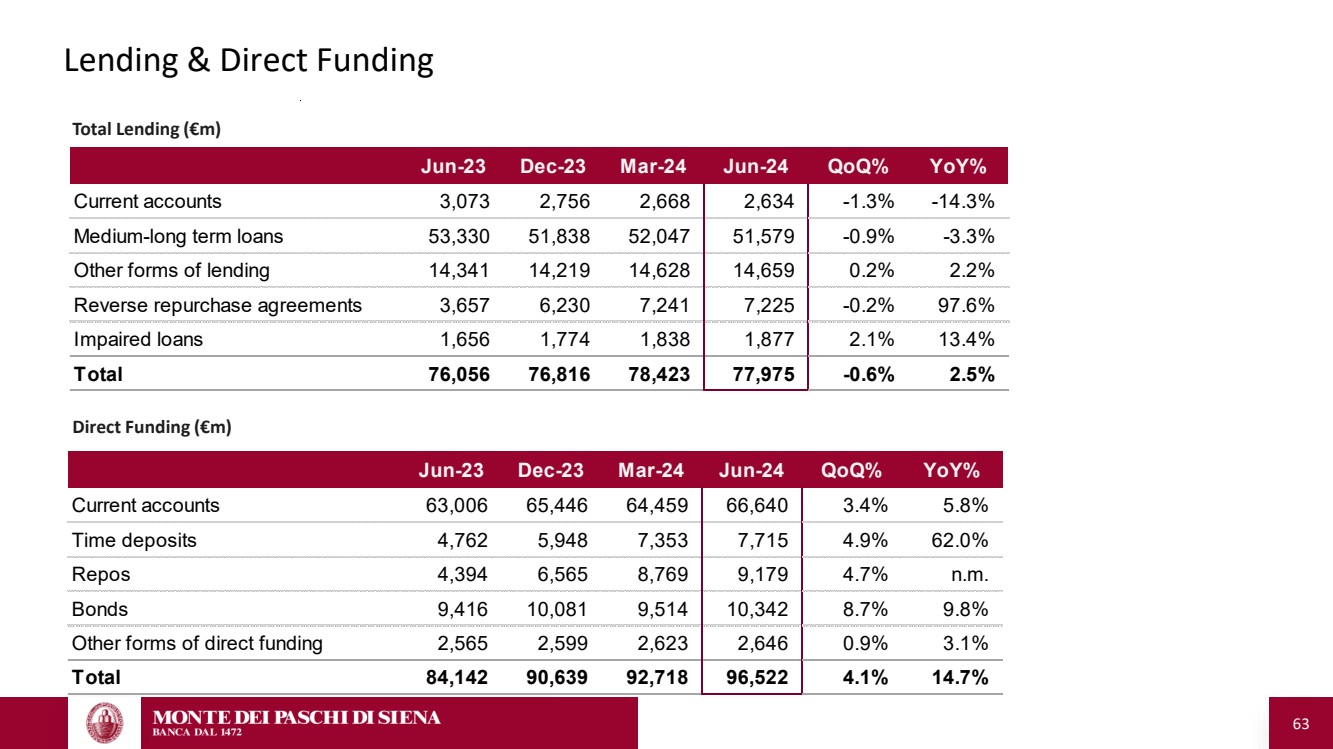
| 63 Lending & Direct Funding Total Lending (€m) Direct Funding (€m) Jun-23 Dec-23 Mar-24 Jun-24 QoQ% YoY% Current accounts 3,073 2,756 2,668 2,634 -1.3% -14.3% Medium-long term loans 53,330 51,838 52,047 51,579 -0.9% -3.3% Other forms of lending 14,341 14,219 14,628 14,659 0.2% 2.2% Reverse repurchase agreements 3,657 6,230 7,241 7,225 -0.2% 97.6% Impaired loans 1,656 1,774 1,838 1,877 2.1% 13.4% Total 76,056 76,816 78,423 77,975 -0.6% 2.5% Jun-23 Dec-23 Mar-24 Jun-24 QoQ% YoY% Current accounts 63,006 65,446 64,459 66,640 3.4% 5.8% Time deposits 4,762 5,948 7,353 7,715 4.9% 62.0% Repos 4,394 6,565 8,769 9,179 4.7% n.m. Bonds 9,416 10,081 9,514 10,342 8.7% 9.8% Other forms of direct funding 2,565 2,599 2,623 2,646 0.9% 3.1% Total 84,142 90,639 92,718 96,522 4.1% 14.7% |