What were the Fund costs for the past year?
(based on a hypothetical $10,000 investment)
Fund Name | Costs of a $10,000 investment | Costs paid as a percentage of a $10,000 investment |
|---|---|---|
GEND | $1¹ | 0.38% |
¹ Based on operations for the period from January 13, 2025 to April 30, 2025. Expenses for the full fiscal year would be higher.
How did the Fund perform last year and what affected its performance?
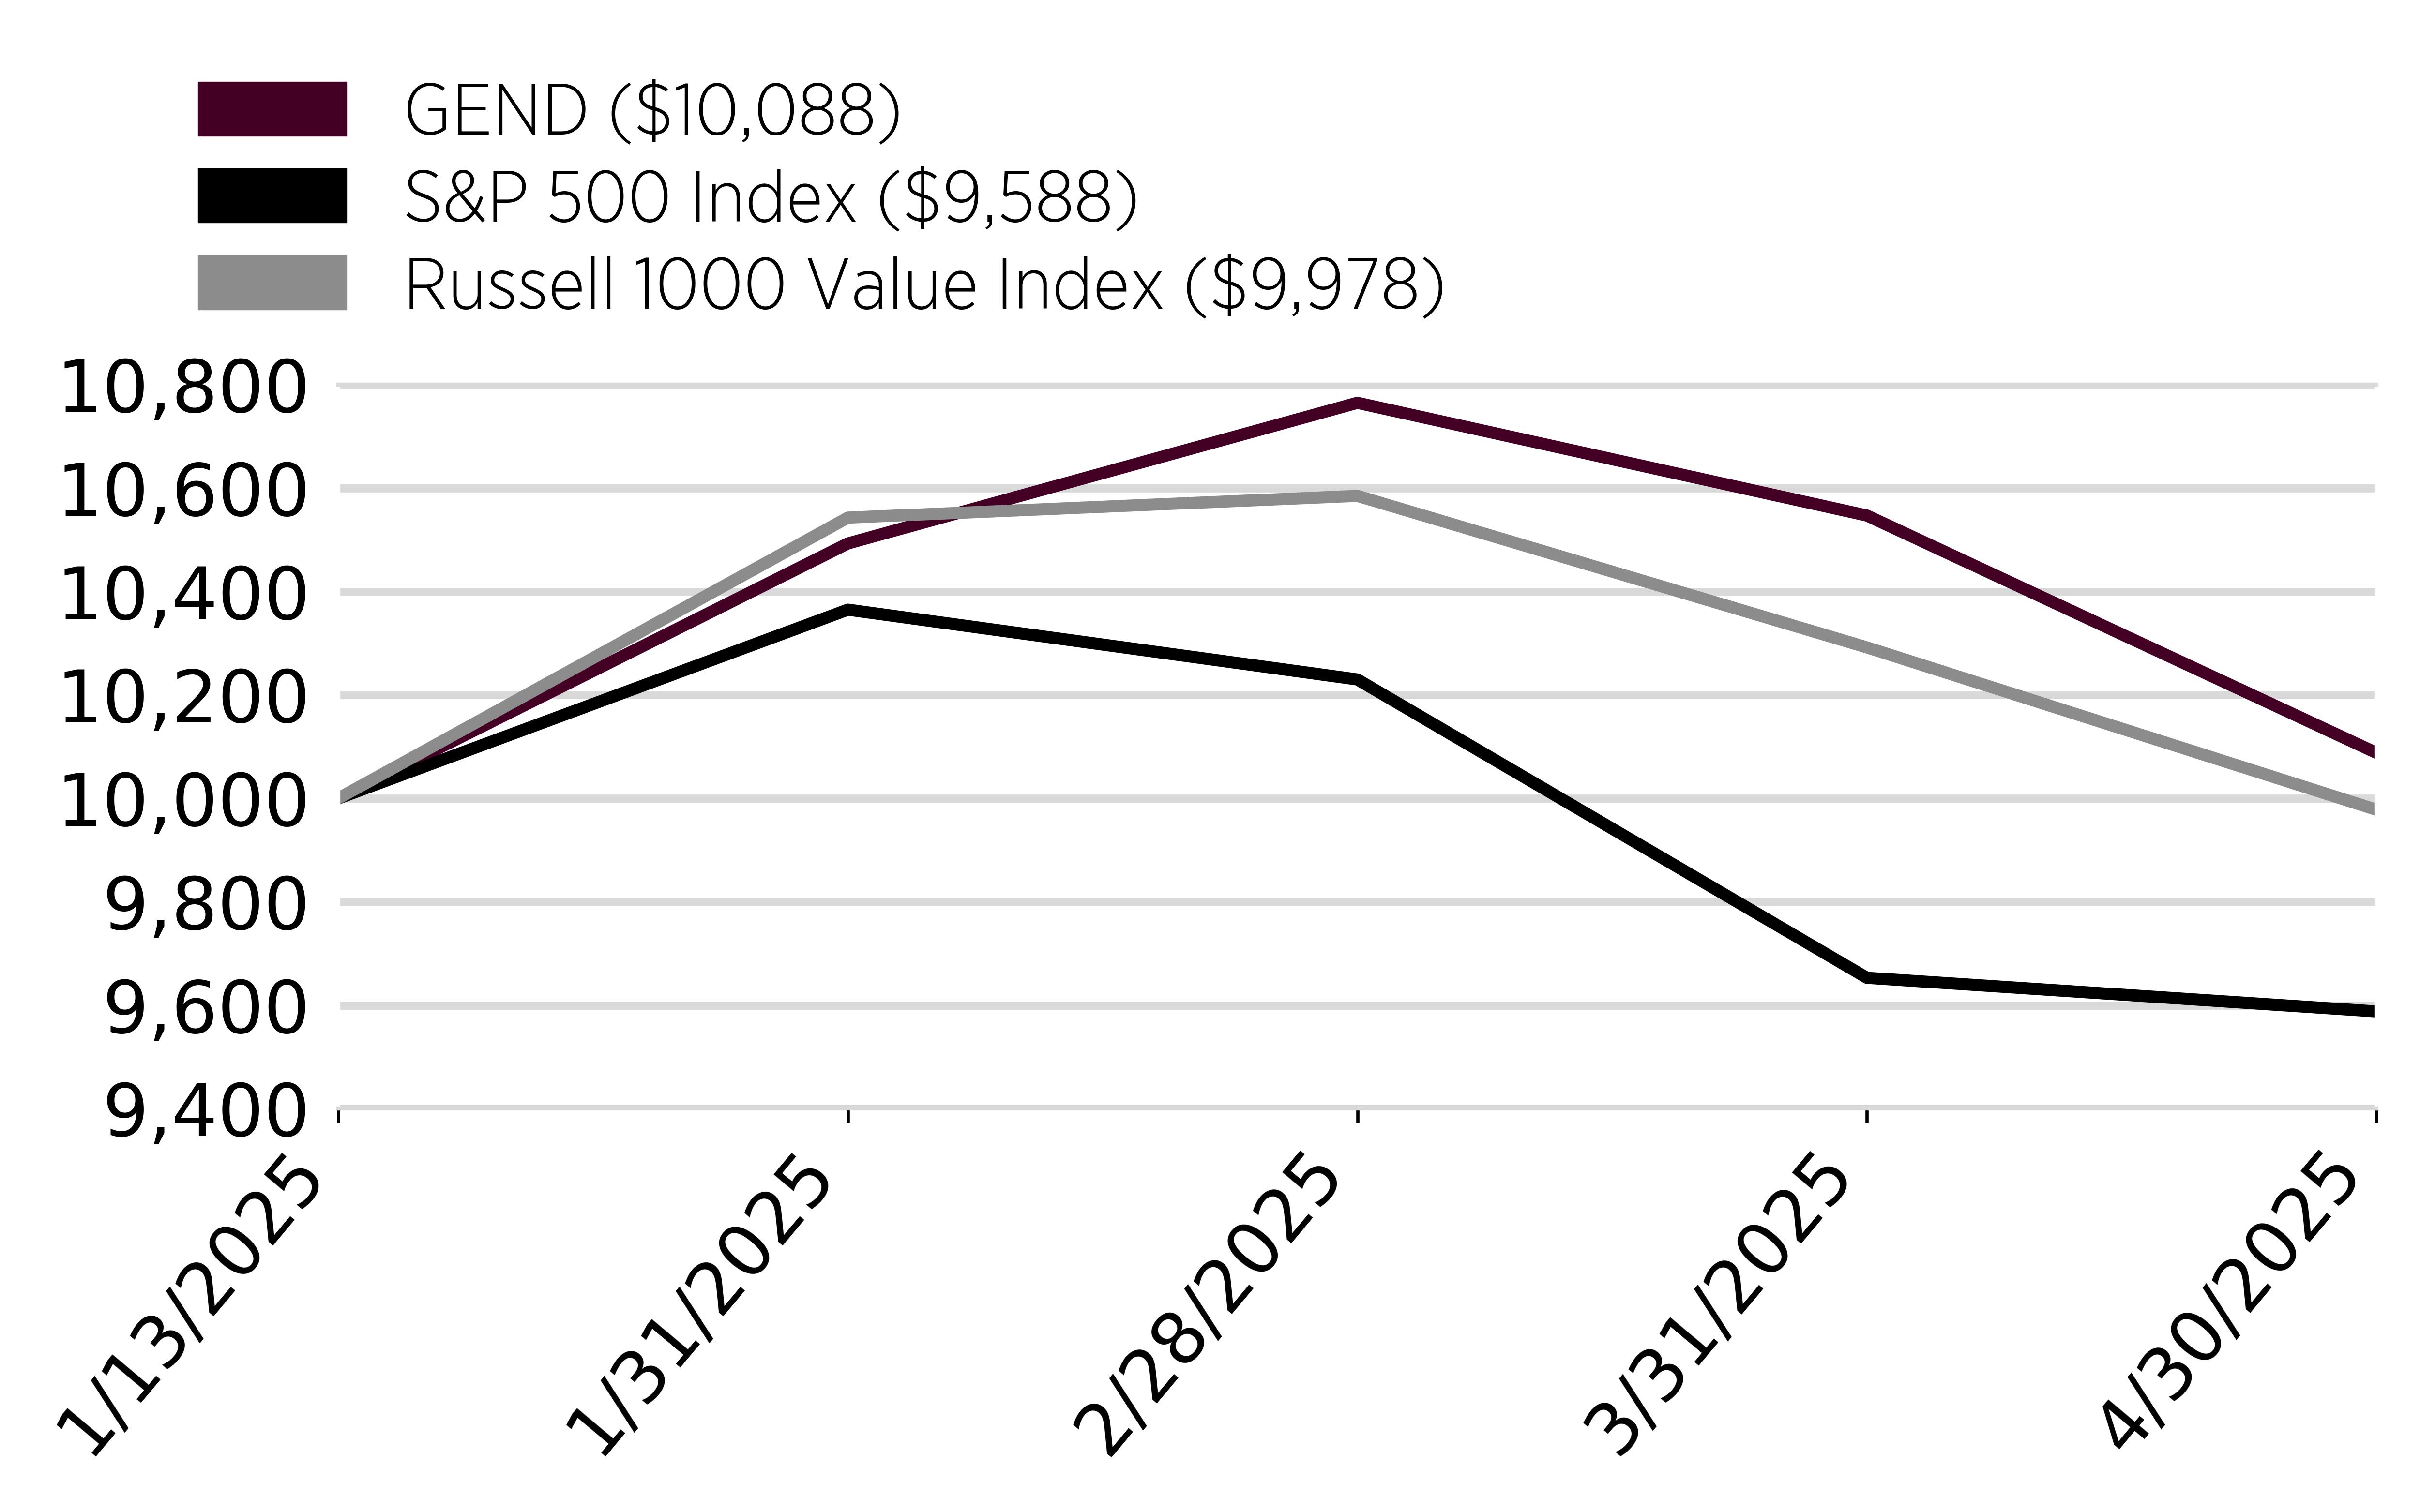
For the period January 13, 2025 to April 30, 2025, the Fund returned 0.88%. The Fund outperformed the S&P 500 Index and the Russell 1000 Value Index, which returned -4.07% and -0.21%, respectively, for the same period.
What factors influenced performance?
During the period, changes in US tariff policy and a fear of increased global tariffs materially increased equity volatility.Cooling domestic inflation along with healthy employment numbers have also been a tailwind to the equity markets.
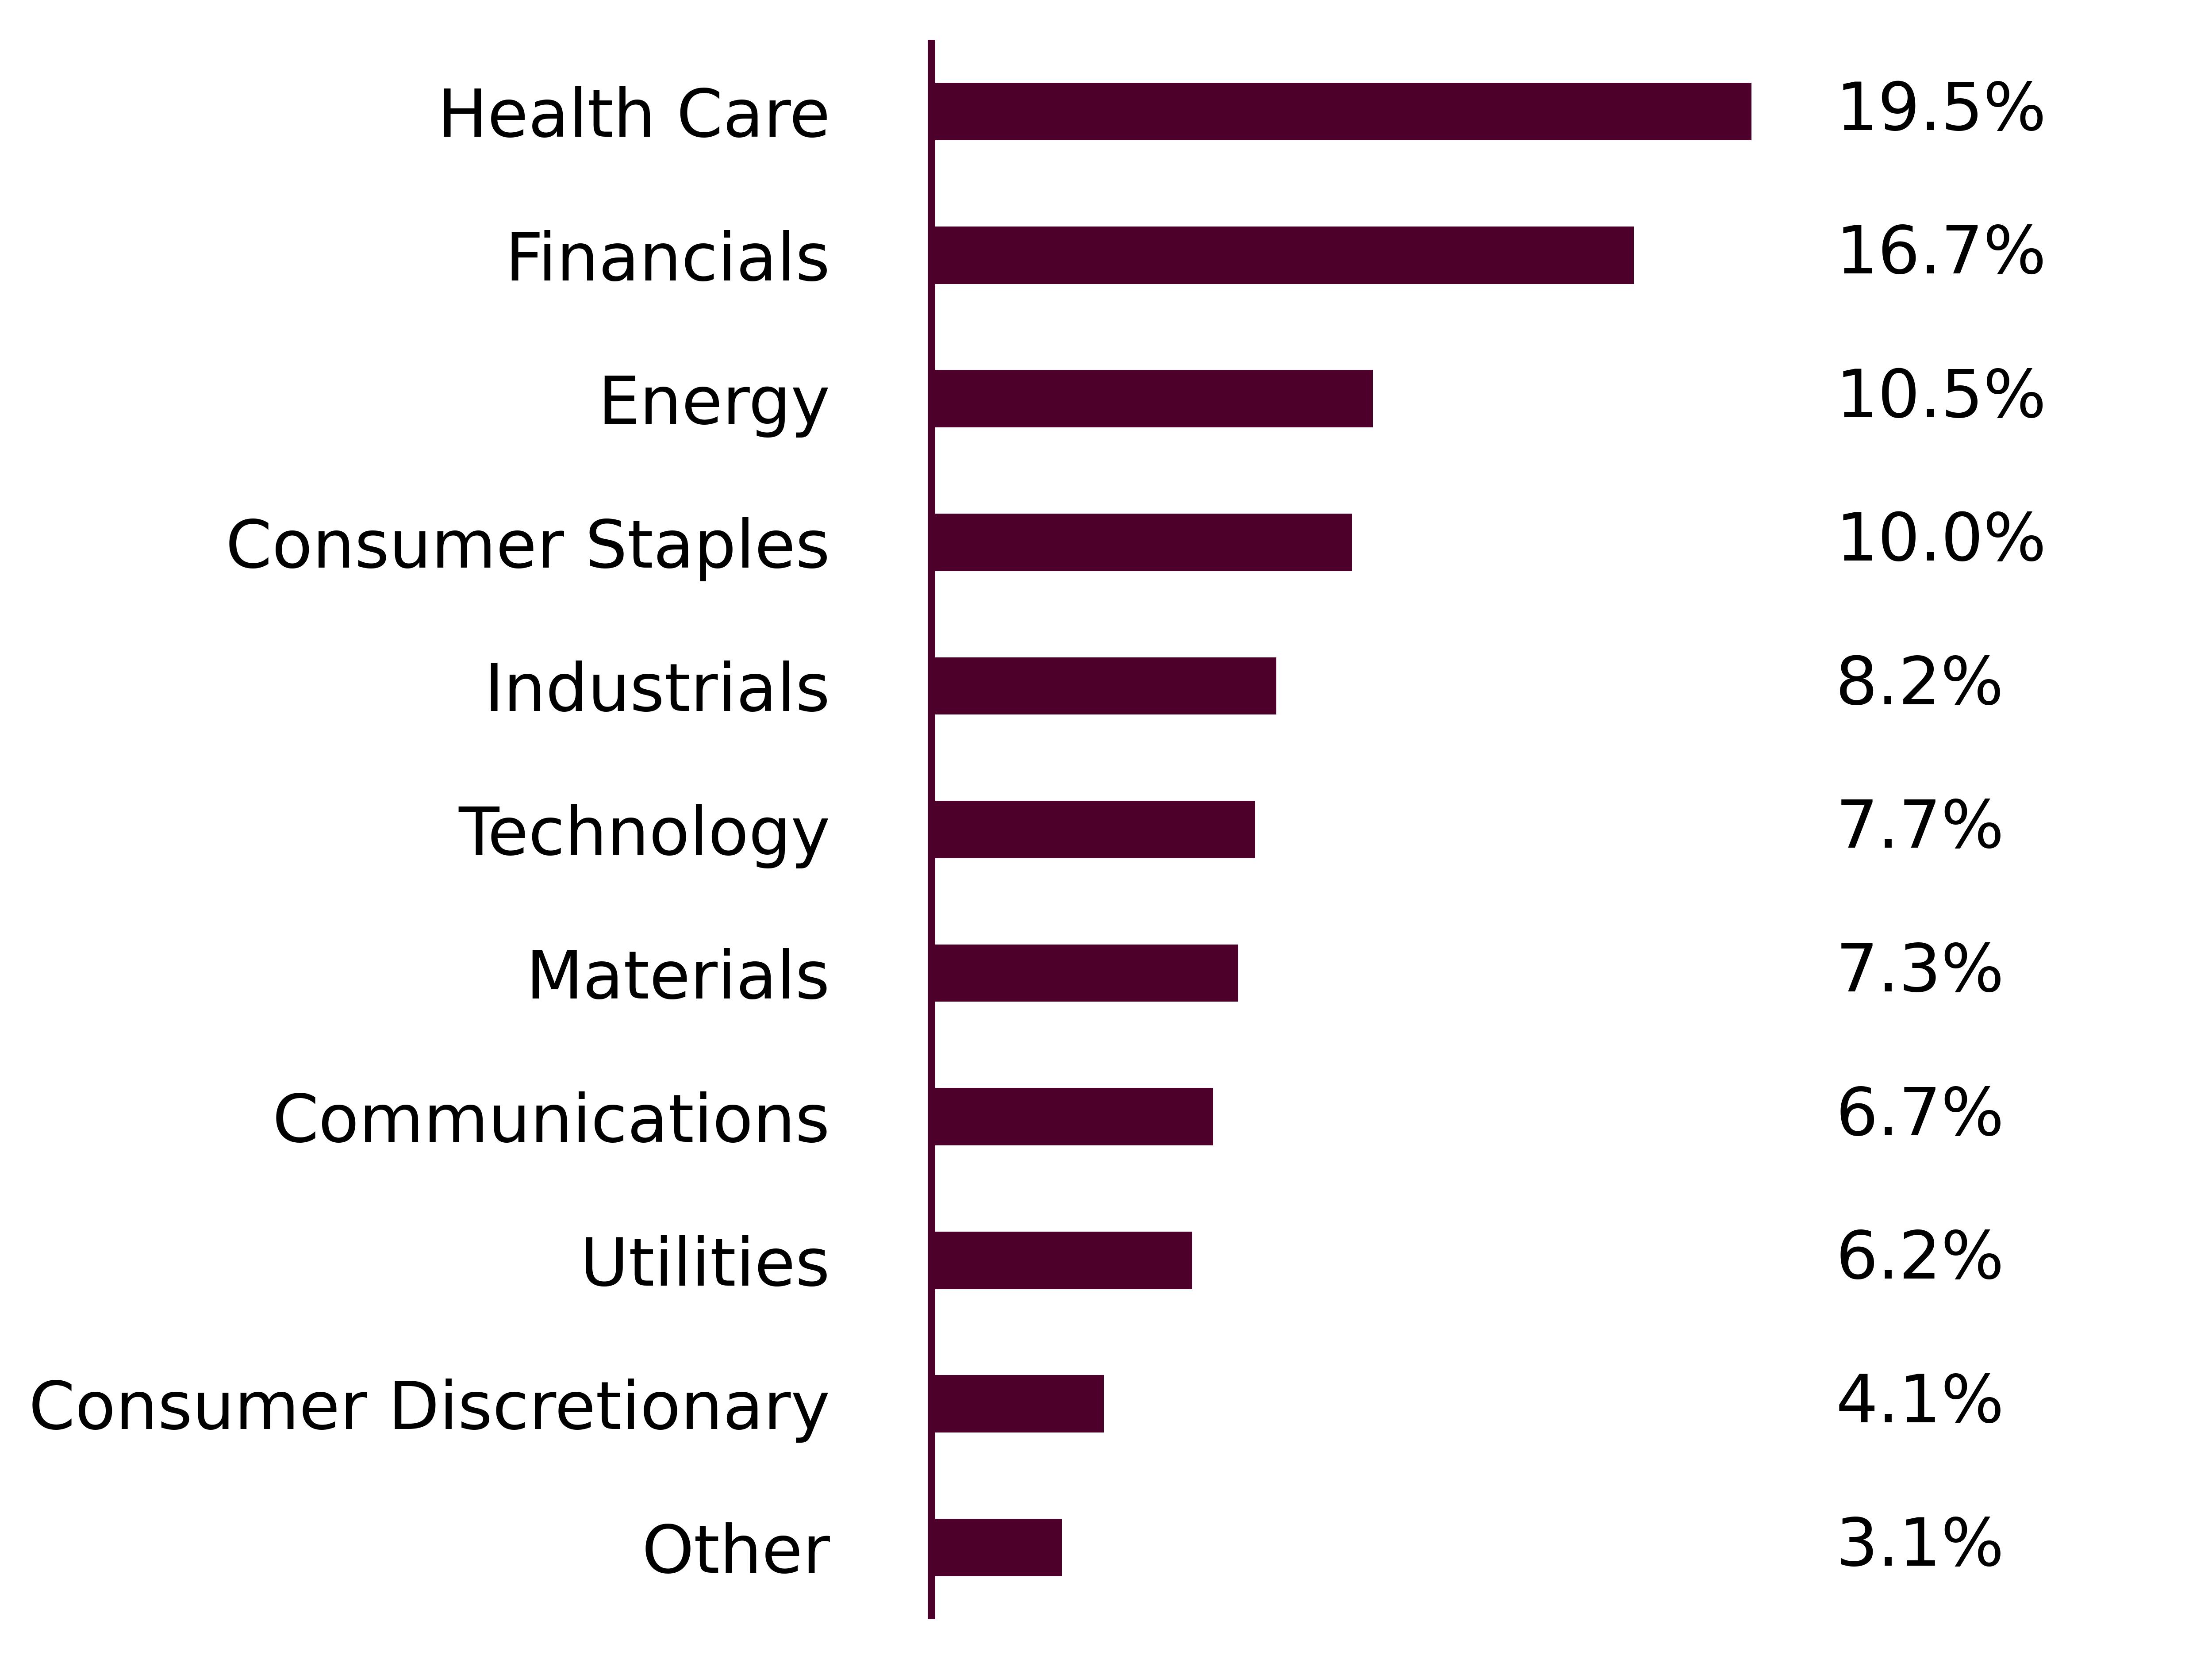
The Fund focuses on companies that pay higher dividend yields and is underweight in large cap growth companies that historically pay little or no dividends.The Fund’s underweight positions in the Technology and Consumer Discretionary sectors along with the strong performance of the security selections in the Communications and Healthcare sectors led to the Fund’s outperformance.
The main contributors to performance include:
• CVS Health Corp: The company provided 2025 guidance that suggests a rebound is starting. Management set achievable guidance with opportunities for upside.
• AT&T: Q4 2024 was another quarter of solid results. The company had strong service revenue and wireless margins showed improvement year-over-year.
• Gilead Sciences: Earnings guidance range was above current consensus with another year of margin expansion. HIV revenue grew 16% while oncology revenue grew 10%.
The main detractors to performance include:
• United Parcel Service: The company effectively pulled full year guidance due to uncertainty around trade.Q2 guidance was below expectations.
• Dow Inc.: While the company has seen volumes grow, pricing has remained challenging.All three segments of the company experienced declining pricing.
• Northern Trust: While Net Interest Margins were strong, fees were below expectations.Operating expenses are elevated as the company is finishing its accelerated investment in modernization.
Cumulative Performance
From January 13, 2025 through April 30, 2025
Initial Investment of $10,000
Average Annual Total Returns
Key Fund Statistics
(as of April 30, 2025)
Fund Net Assets | $601,651 |
Number of Holdings | 34 |
Advisory Fee Paid | $355 |
Portfolio Turnover | 10.12% |
What did the Fund invest in?
(as of April 30, 2025)
Sector Breakdown (% of net assets)
Top Ten Holdings | (% of Total Net Assets) |
|---|---|
Enbridge Inc | |
Altria Group Inc | |
AT&T Inc | |
Cisco Systems Inc | |
M&T Bank Corp | |
CVS Health Corp | |
JPMorgan Chase & Co | |
Blackrock Inc | |
Chevron Corp | |
Evergy Inc |
What were the Fund costs for the past year?
(based on a hypothetical $10,000 investment)
Fund Name | Costs of a $10,000 investment | Costs paid as a percentage of a $10,000 investment |
|---|---|---|
GENW | $1¹ | 0.38% |
¹ Based on operations for the period from January 13, 2025 to April 30, 2025. Expenses for the full fiscal year would be higher.
How did the Fund perform last year and what affected its performance?
For the period January 13, 2025 to April 30, 2025, the Fund returned 13.41%. The Fund outperformed the S&P 500 Index, which returned -4.07%, but underperformed the MSCI EAFE Value Index, which returned 17.84%, for the same period.
What factors influenced performance?
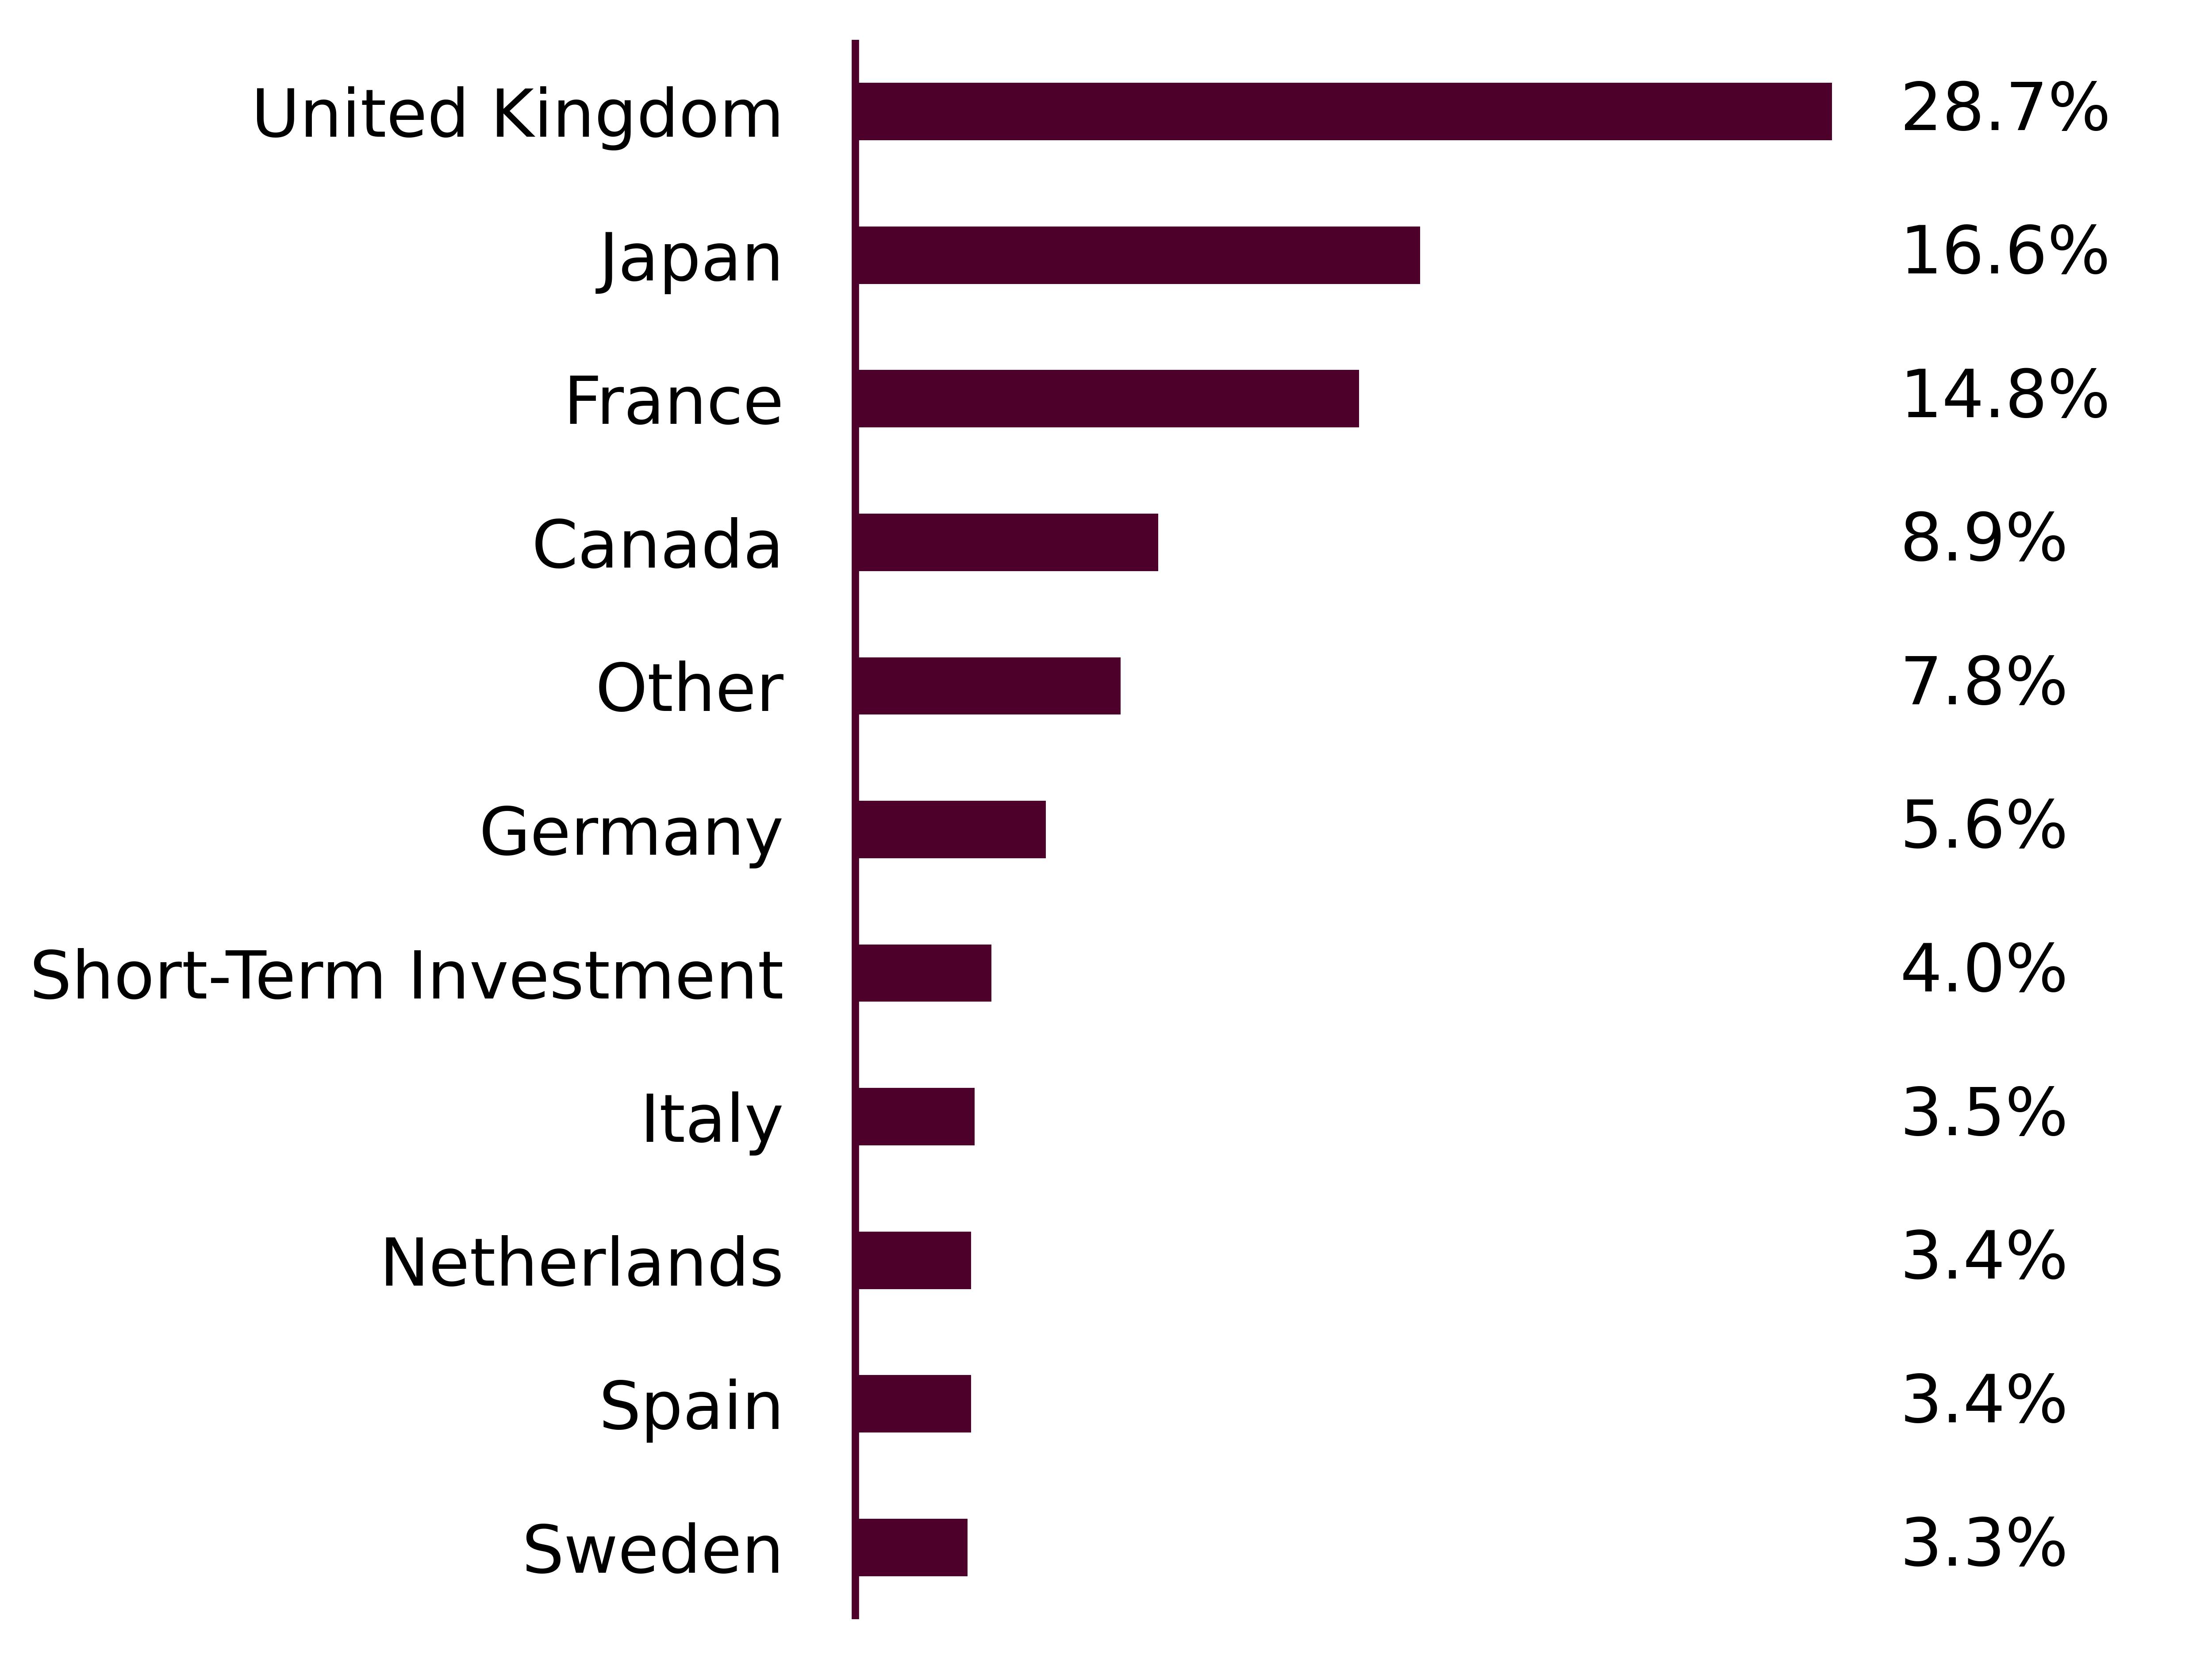
The Fund focuses on stocks that pay higher dividend yields and is underweight in large cap growth companies that historically pay little or no dividends.The Fund’s underweight positions in the Technology sector along with the strong performance of the security selections in the Financials, Industrials and Communication Services sectors led to the Fund’s outperformance.
The main contributors to performance include:
• BAE Systems: Large beneficiary of the positive inflection in European/Asian defense spending because of pressure from the US Administration, new UK govt increasing their defense budget and the prospect for a next generation UK-Italian-Japanese fighter jet.
• Orange: Ended a shaky FY24 on a high note with strong Q4 2024 results and bullish 2025 guide.French consolidation and Spanish optionality provide further catalysts.
• AXA: Restructured XL unit along with a strong capital position sets up the company to deliver strong earnings growth and one of the most attractive capital return profiles among peers.
The main detractors to performance include:
• Nomura Holdings: Destabilization of the Japanese equity market due to US tariffs and recent announced acquisitions in US/Europe asset management have acted as overhangs on the stock.Q4 2024 earnings were viewed as stable, however the announced ¥60 billion share buyback was likely viewed as disappointing.
• BP Plc: Lower crude oil prices driven by higher-than-expected production quotas set by OPEC+ as well as the prospect of a global economic slowdown exacerbated by US tariffs.Q1 2025 results also missed expectations as the company attempts to return to the old playbook of conventional oil and gas.
• Schneider Electric: Lower than expected Q1 2025 organic sales growth driven by Western Europe and ROW regions.Although 2025 guidance was reiterated, updated exchange rate assumptions imply downside to consensus earnings.
Cumulative Performance
From January 13, 2025 through April 30, 2025
Initial Investment of $10,000

Average Annual Total Returns
Key Fund Statistics
(as of April 30, 2025)
Fund Net Assets | $677,735 |
Number of Holdings | 33 |
Advisory Fee Paid | $325 |
Portfolio Turnover | 8.81% |
What did the Fund invest in?
(as of April 30, 2025)
Sector Breakdown (% of net assets)
Top Ten Holdings | (% of Total Net Assets) |
|---|---|
BAE Systems PLC | |
Mitsubishi UFJ Financial Group Inc | |
Sumitomo Mitsui Financial Group Inc | |
Barclays PLC | |
Goldman Sachs Financial Square Government Fund | |
Enbridge Inc | |
Allianz SE | |
Enel SpA | |
AXA SA | |
BNP Paribas SA |
What were the Fund costs for the past year?
(based on a hypothetical $10,000 investment)
Fund Name | Costs of a $10,000 investment | Costs paid as a percentage of a $10,000 investment |
|---|---|---|
GENT | $4¹ | 0.38% |
¹ Based on operations for the period from May 21, 2024 to April 30, 2025. Expenses for the full fiscal year would be higher.
How did the Fund perform last year and what affected its performance?
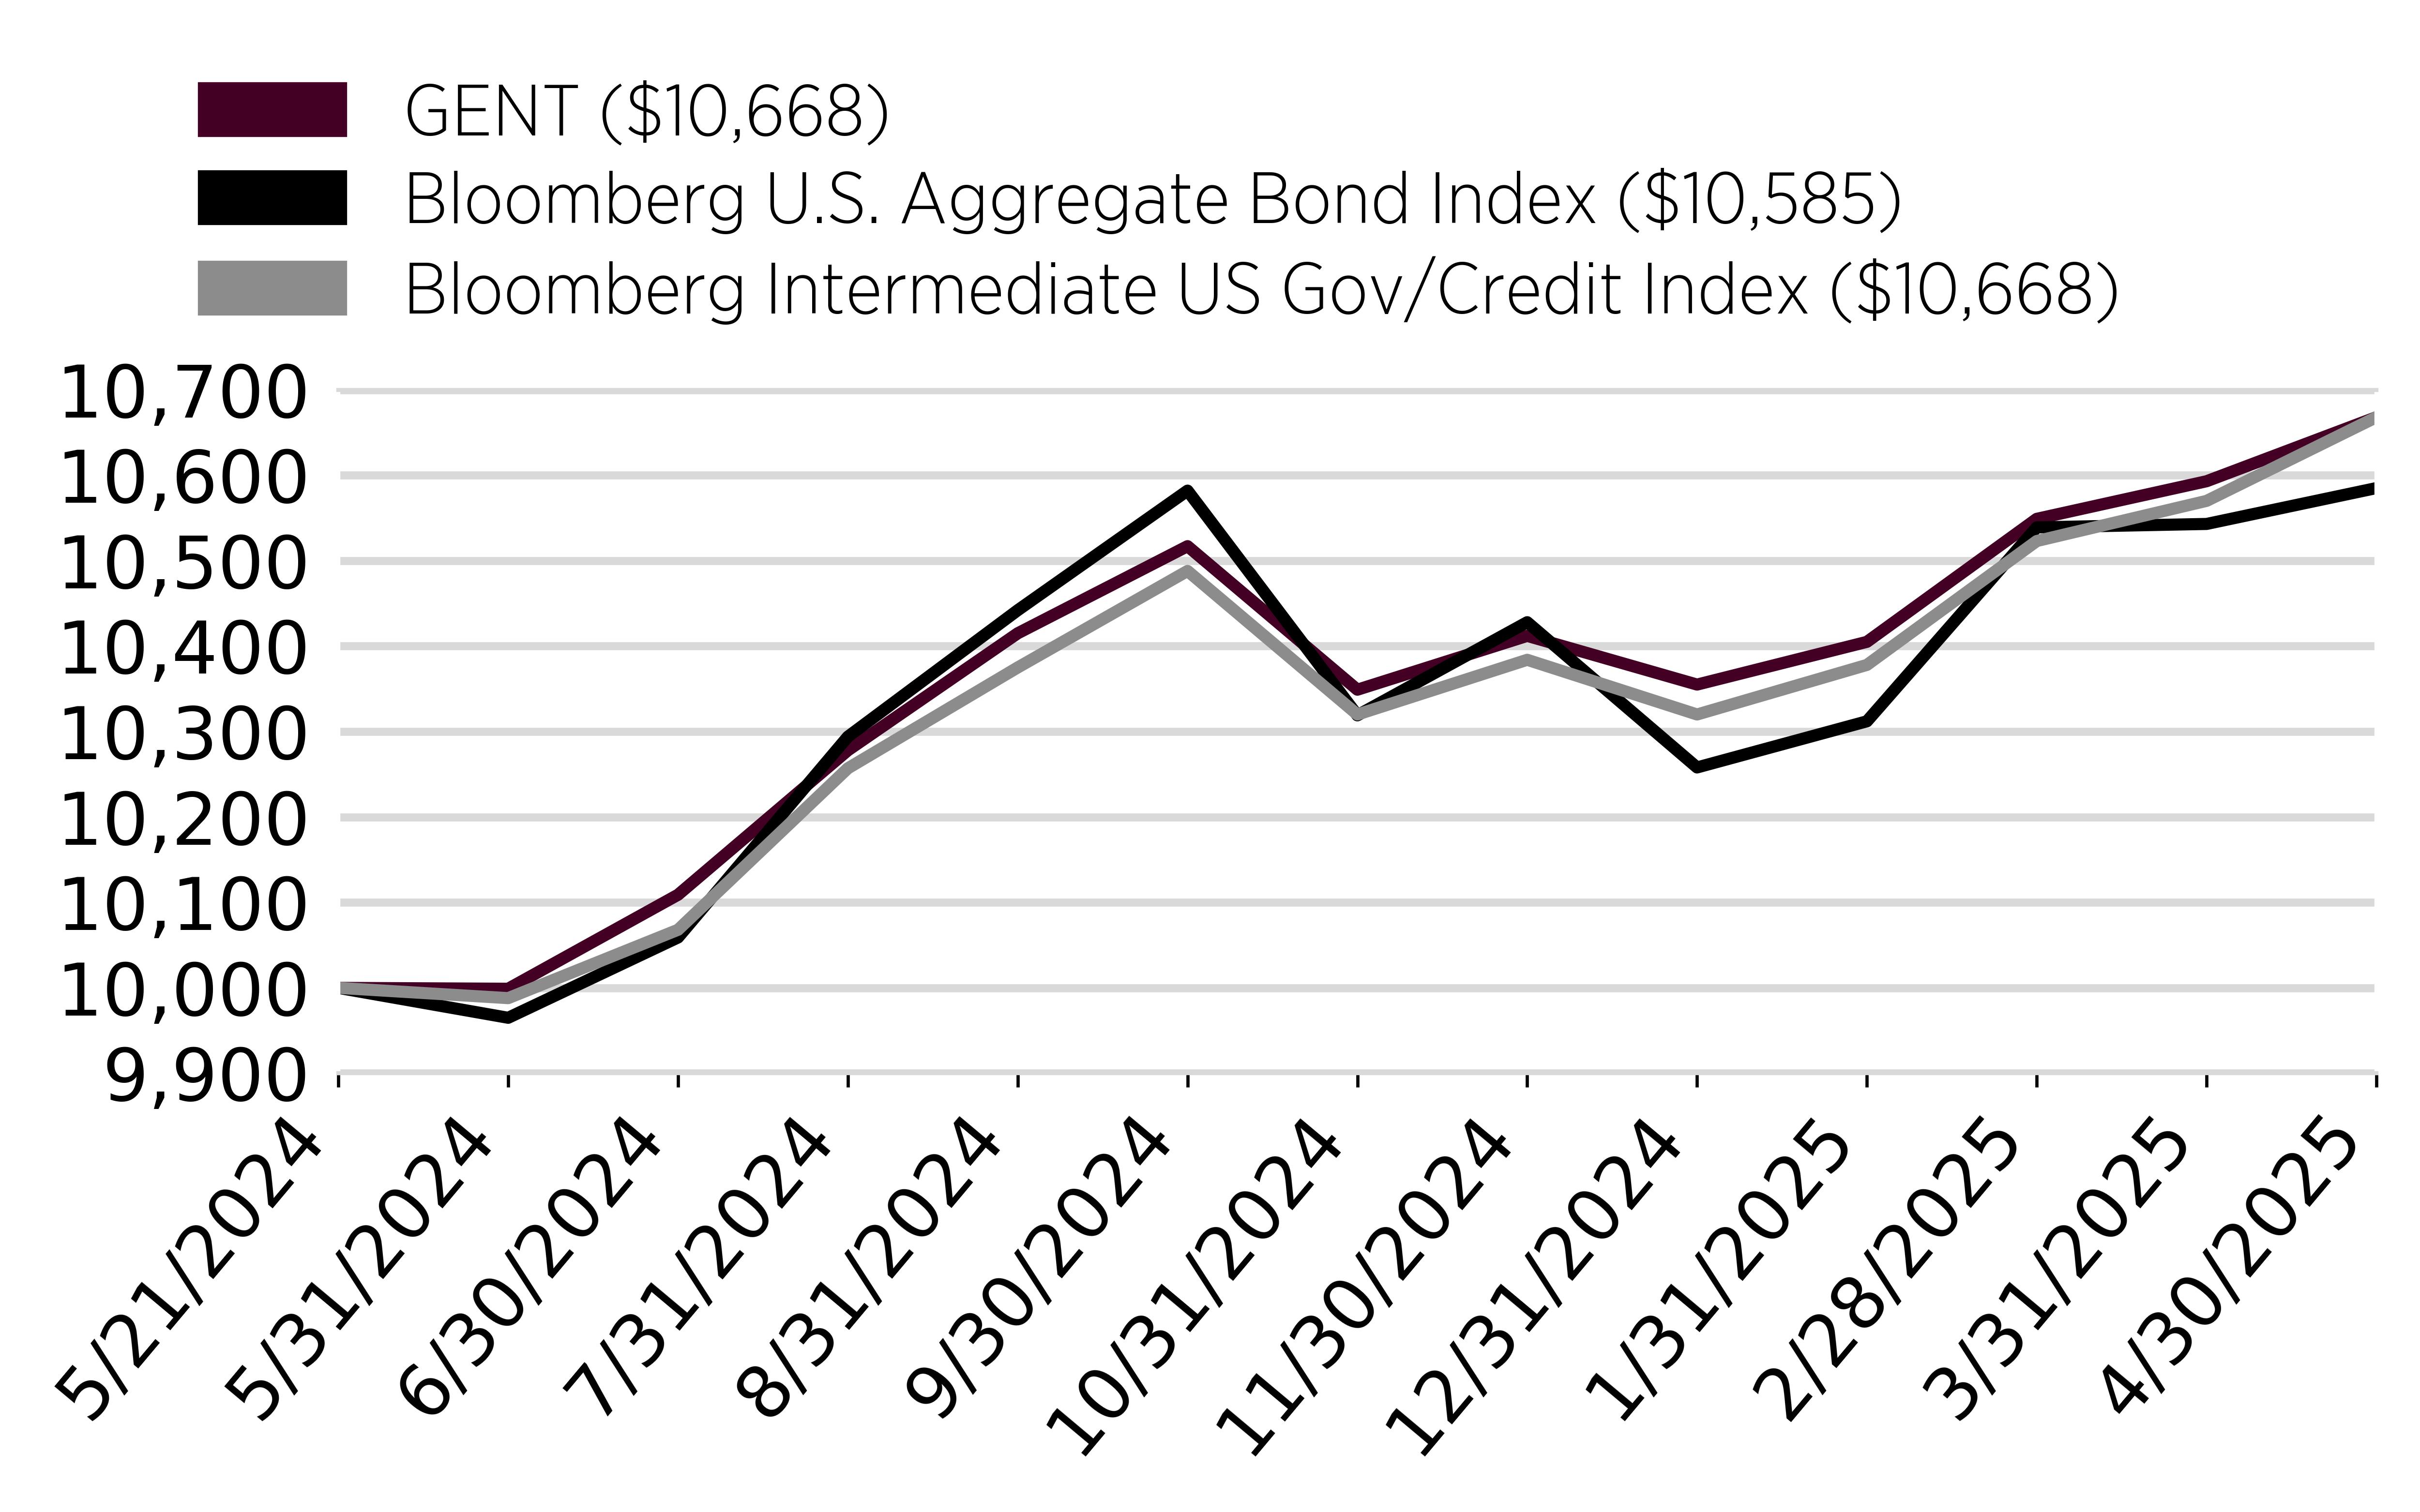
For the period May 21, 2024 to April 30, 2025, the Fund returned 6.68%. The Fund outperformed the Bloomberg U.S. Aggregate Bond Index, which returned 5.86%, and performed the same as the Bloomberg Intermediate US Gov/Credit Index, which returned 6.68%, for the same period.
What factors influenced performance?
The Fund’s outperformance of its benchmark was largely driven by an underweight allocation to the securitized debt sector.Additionally, the fund outperformed due to taking less interest rate risk than the benchmark index as interest rates increased across the curve.
The main contributors to performance include:
• M & T Bank 7.413% 10/30/29
• Cheniere Energy 4.625% 10/15/28
• Tri Point Homes 5.70% 6/15/28
The main detractors to performance include:
• HF Sinclair 5.75% 1/15/31
• Citigroup FRN 10/30/24
• Morgan Stanley 4.679% 7/17/26
Cumulative Performance
From May 21, 2024 through April 30, 2025
Initial Investment of $10,000
Average Annual Total Returns
Key Fund Statistics
(as of April 30, 2025)
Fund Net Assets | $38,393,279 |
Number of Holdings | 44 |
Advisory Fee Paid | $51,599 |
Portfolio Turnover | 56.87% |
What did the Fund invest in?
(as of April 30, 2025)
Sector Breakdown (% of net assets)
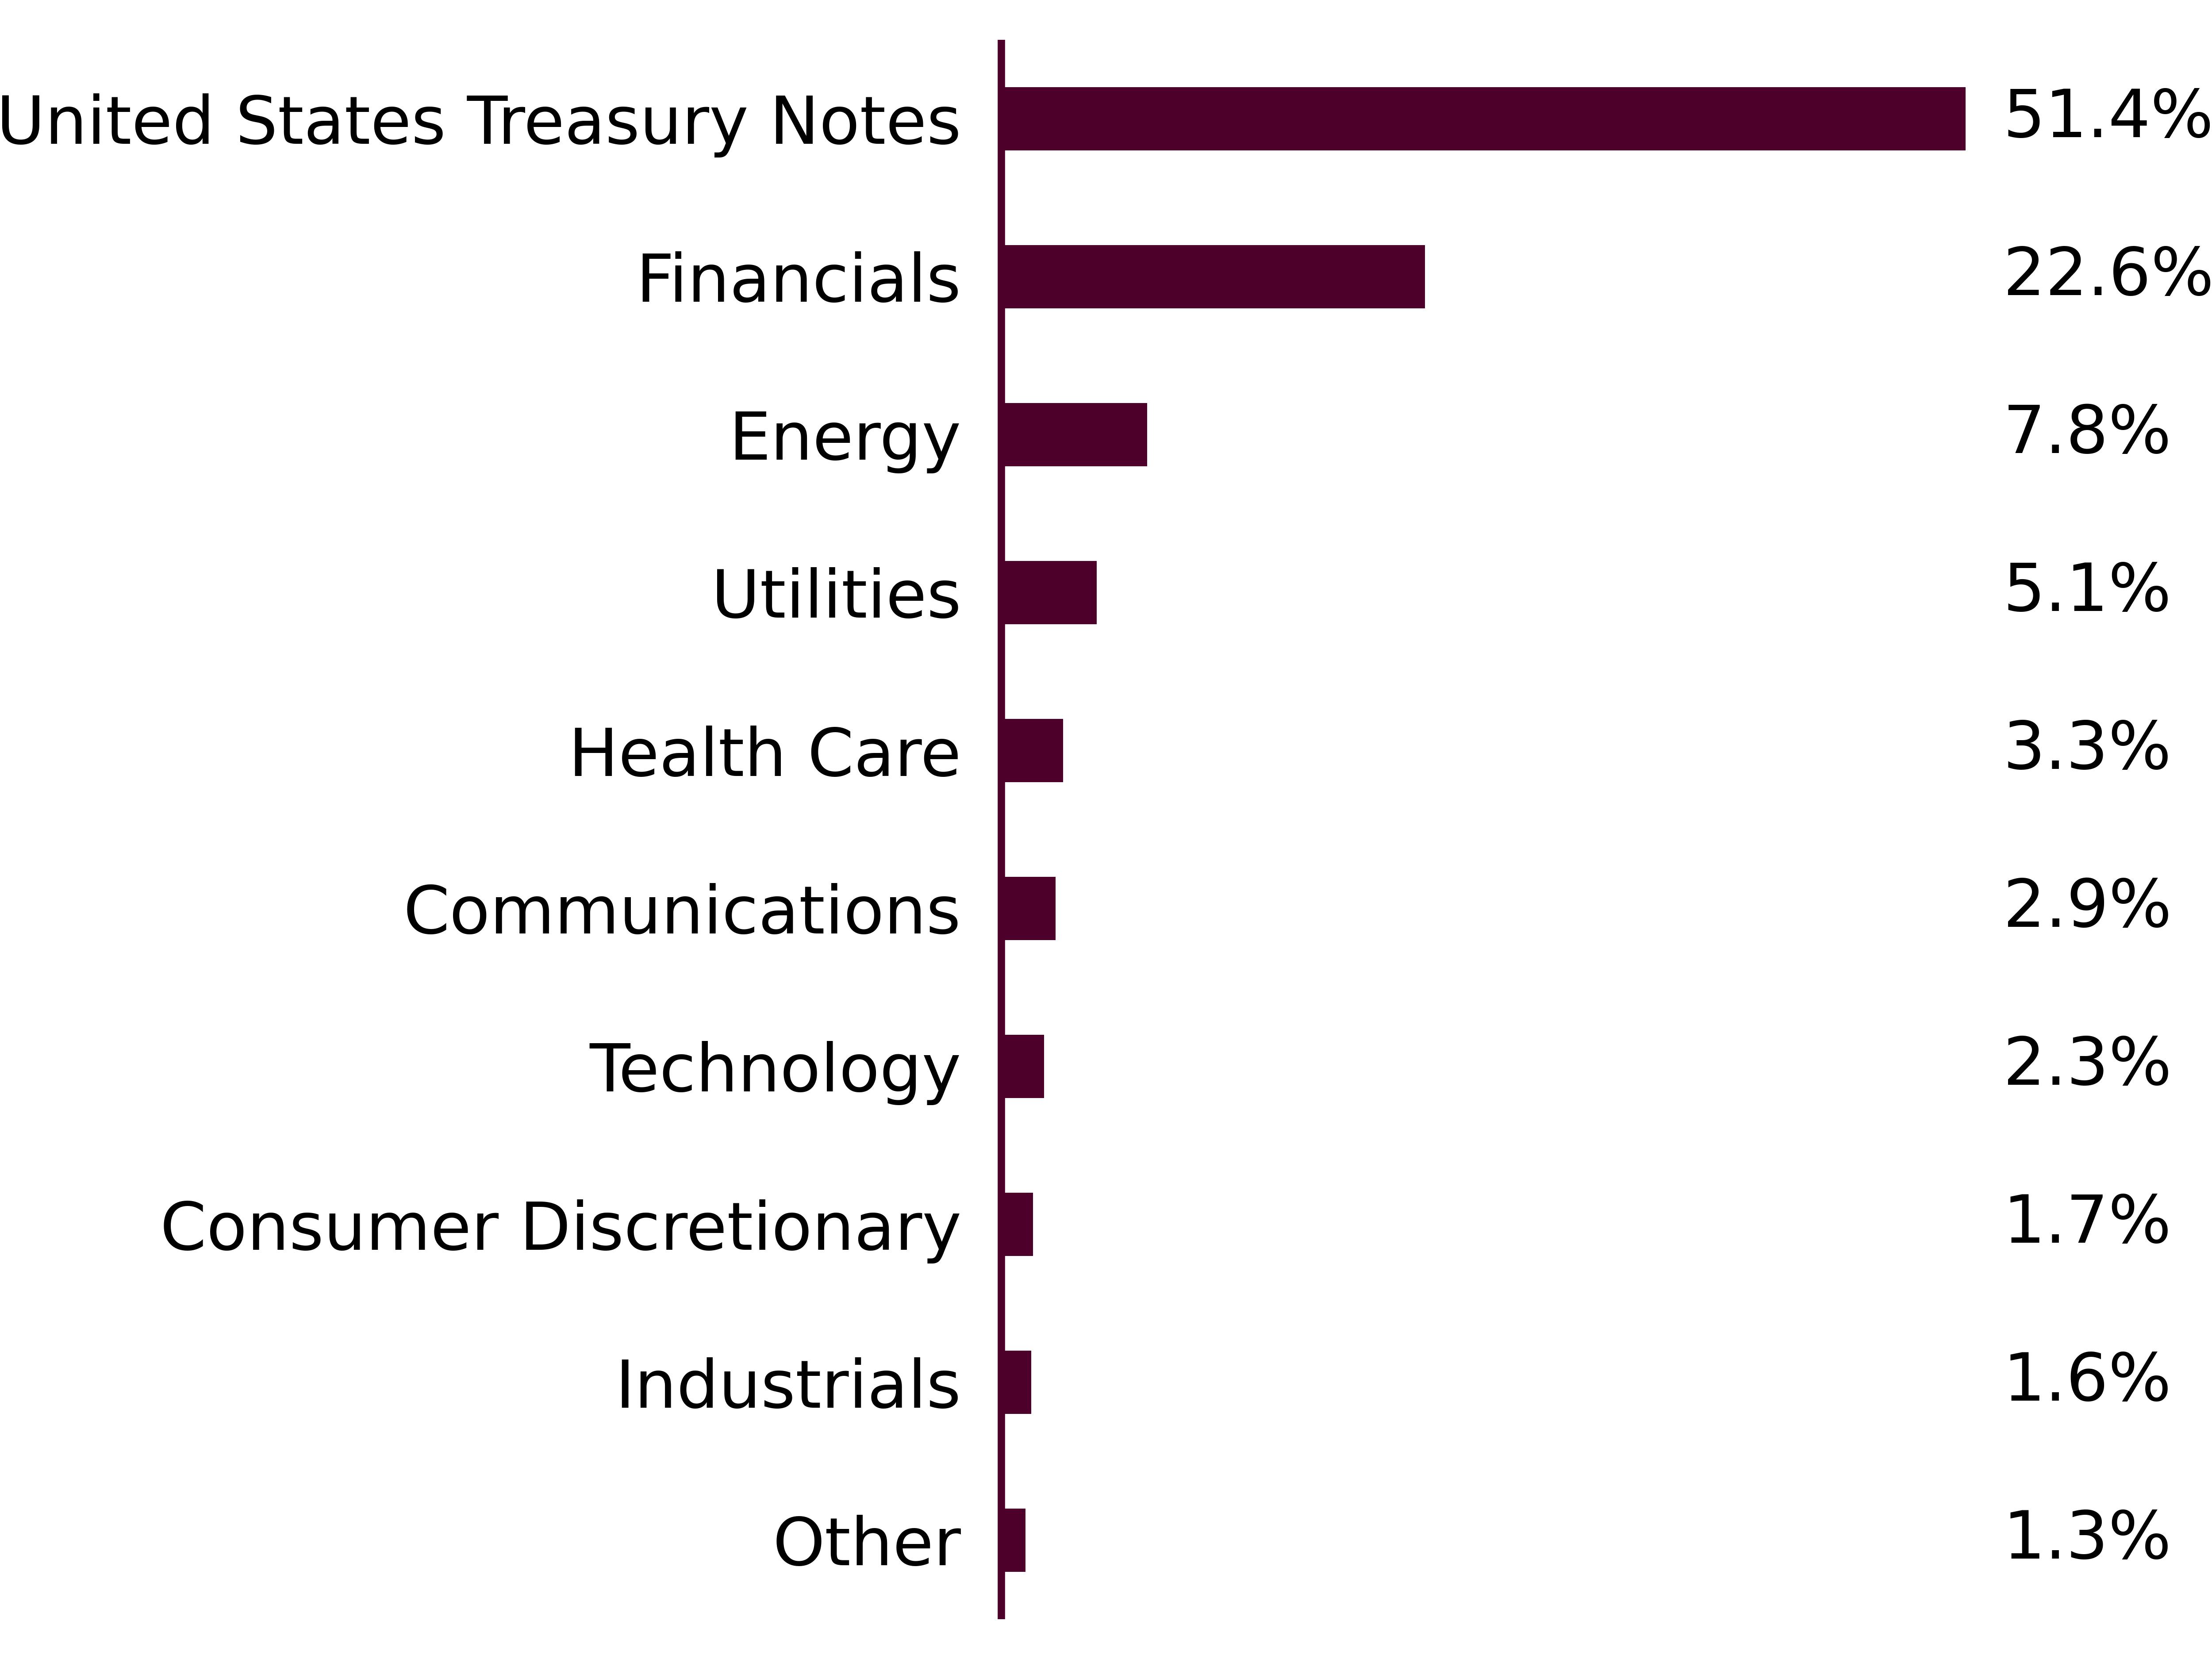
Top Ten Holdings | (% of Total Net Assets) |
|---|---|
United States Treasury Note, 3.875% 9/30/29 | |
United States Treasury Note, 2.875% 5/15/32 | |
United States Treasury Note, 4% 1/31/31 | |
United States Treasury Note, 4.625% 2/15/35 | |
United States Treasury Note, 3.5% 2/15/33 | |
United States Treasury Note, 1.25% 3/31/28 | |
United States Treasury Note, 4.625% 11/15/26 | |
Goldman Sachs Group Inc/The, 5.727% 4/25/30 | |
Utah Acquisition Sub Inc, 3.95% 6/15/26 | |
Transcanada Trust, 5.875% 8/15/76 |
What were the Fund costs for the past year?
(based on a hypothetical $10,000 investment)
Fund Name | Costs of a $10,000 investment | Costs paid as a percentage of a $10,000 investment |
|---|---|---|
GENM | $4¹ | 0.38% |
¹ Based on operations for the period from May 21, 2024 to April 30, 2025. Expenses for the full fiscal year would be higher.
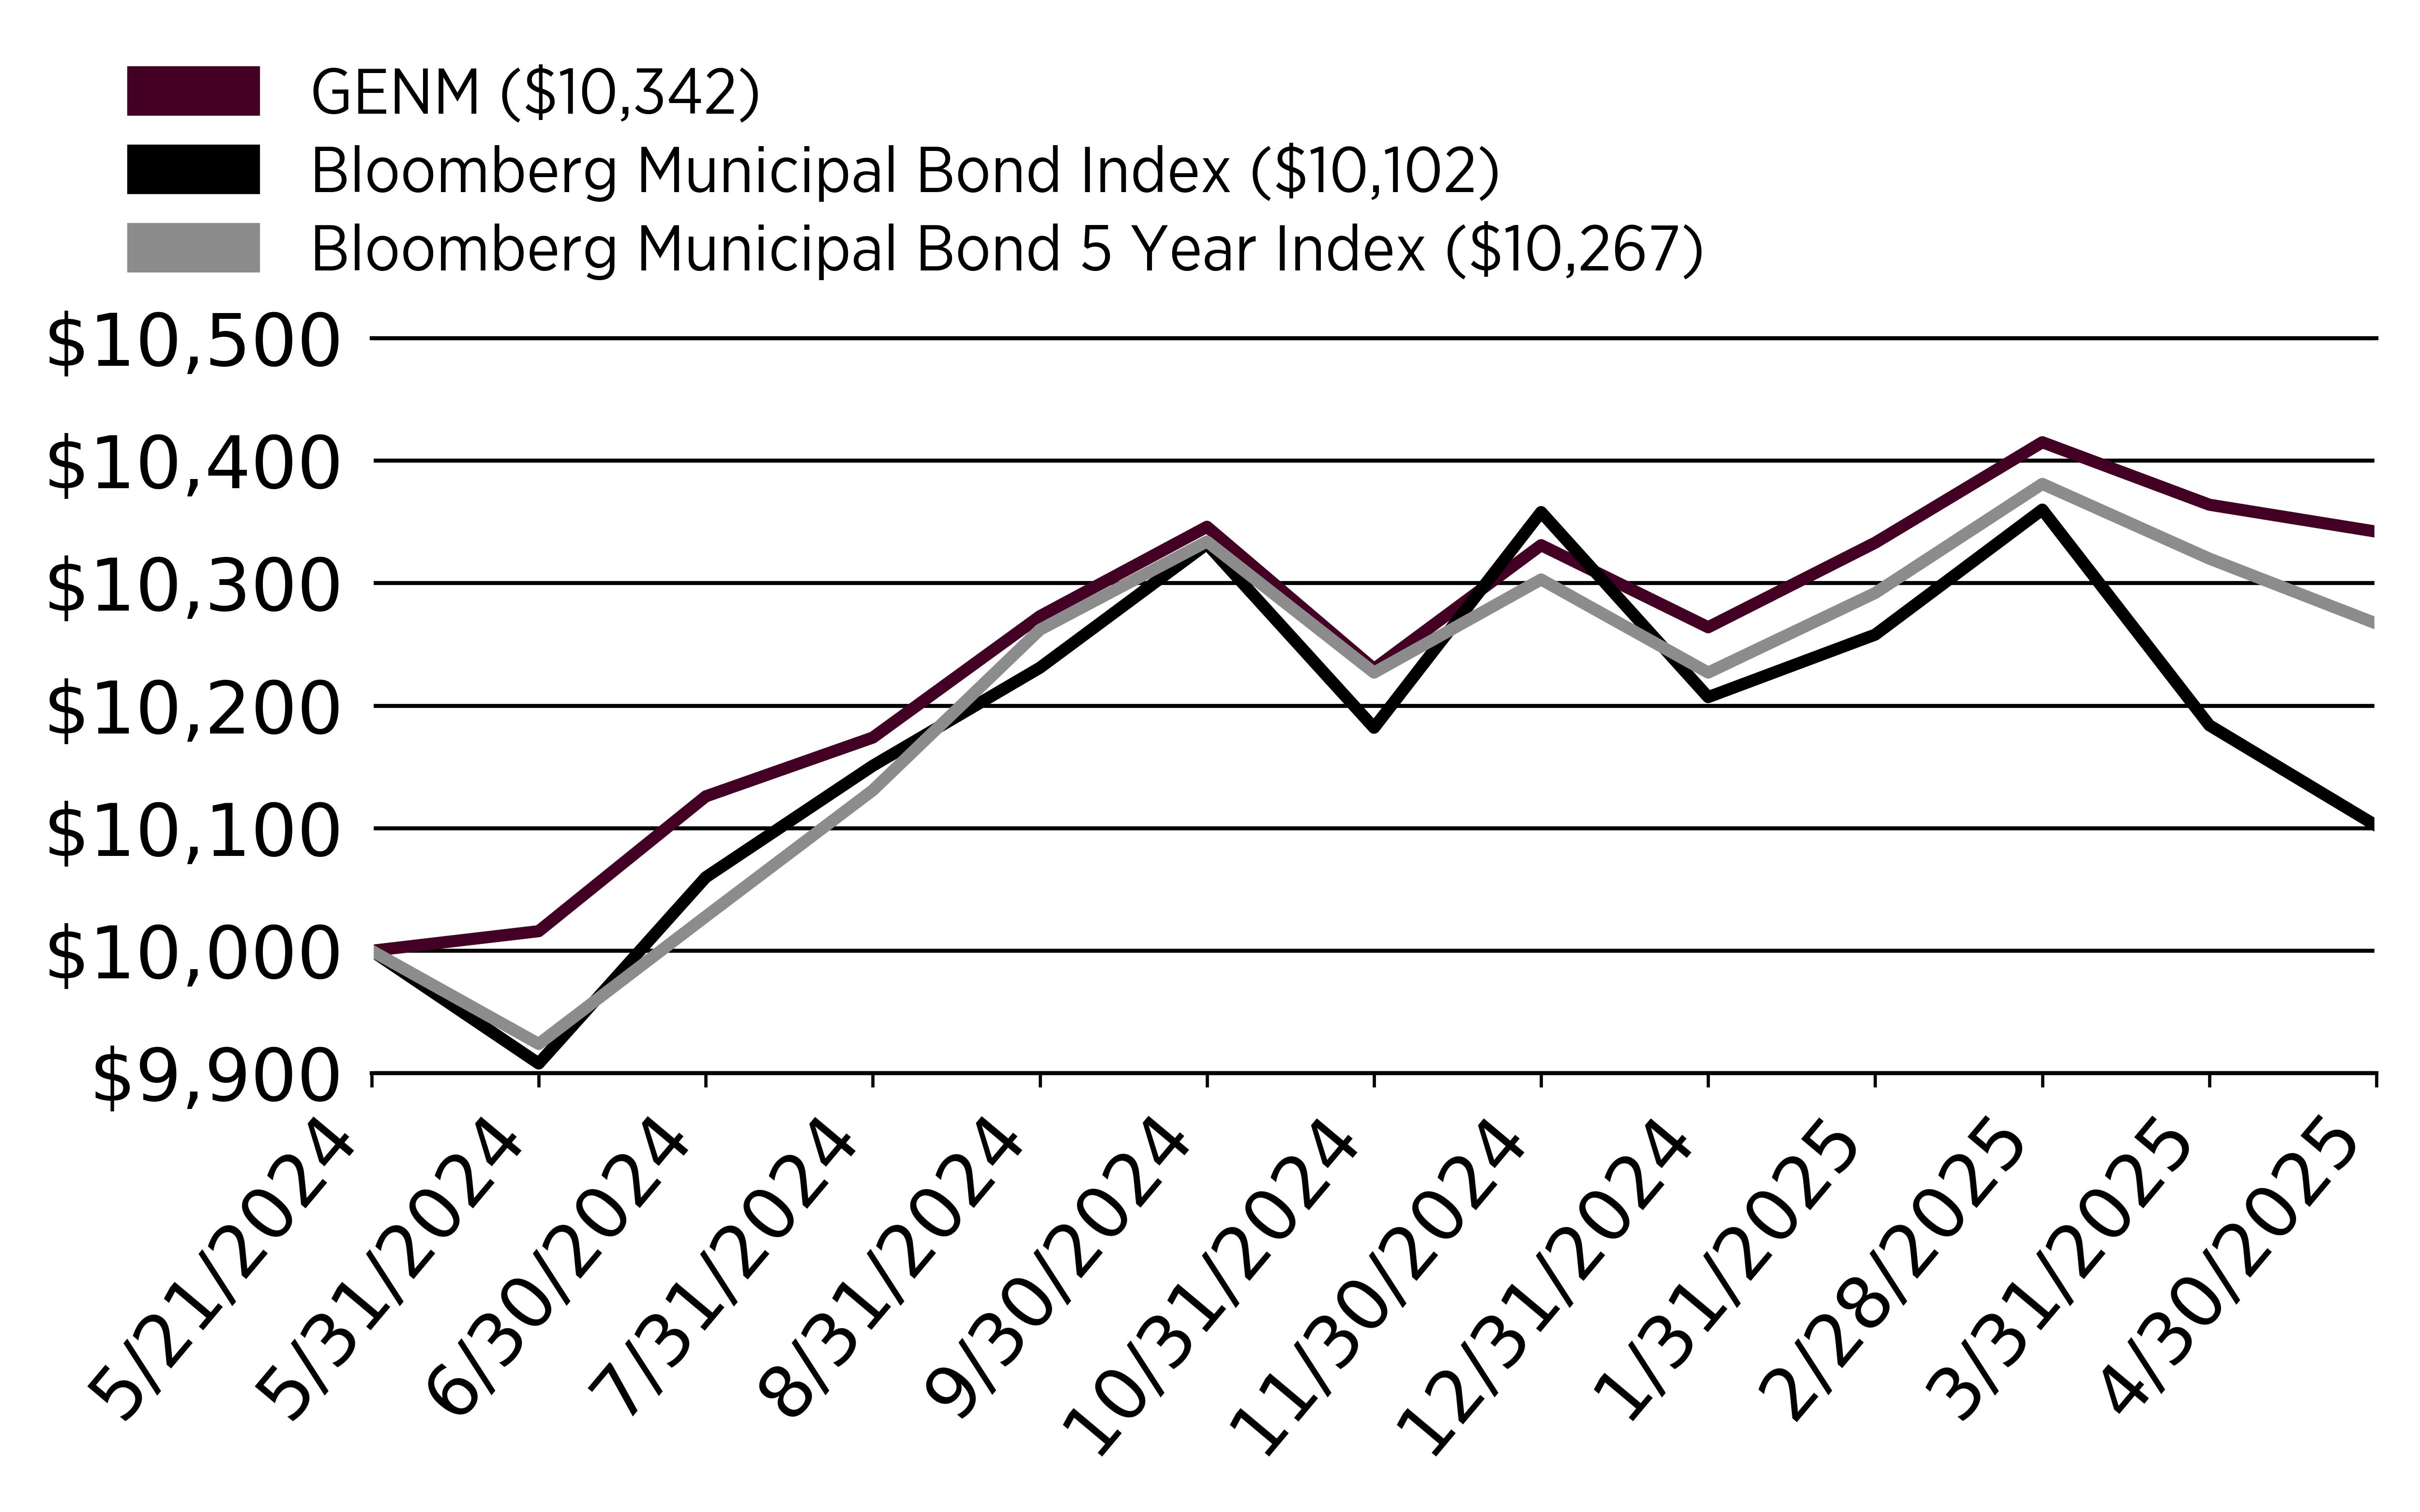
How did the Fund perform last year and what affected its performance?
For the period May 21, 2024 to April 30, 2025, the Fund returned 3.42%. The Fund outperformed the Bloomberg Municipal Bond Index and the Bloomberg Municipal Bond 5 Year Index, which returned 1.02% and 2.67%, respectively, for the same period.
What factors influenced performance?
The Fund’s out performance of its benchmark was largely driven by its participation in the primary market and the capture of spread compression on select new issues.The new issue market remains a key source for performance.Longer-duration holdings created a headwind for overall performance as the tax-exempt yield curve steepened during the period.
The main contributors to performance include:
• Aurora IN Sch Dist GO 5.00% 2038 (AA1)
• Arizona Student Housing RV 5.00% 2030 (AA)
• Richmond VA Housing Auth RV 4.50% 2040 (AAA)
The main detractors to performance include:
• Bradley IL GO 5.00% 2035 (AA)
• Joplin MO IDA 5.00% 2039 (A+)
• Grand County CO 5.00% 2036 (AA-)
Cumulative Performance
From May 21, 2024 through April 30, 2025
Initial Investment of $10,000
Average Annual Total Returns
Key Fund Statistics
(as of April 30, 2025)
Fund Net Assets | $4,513,177 |
Number of Holdings | 61 |
Advisory Fee Paid | $3,109 |
Portfolio Turnover | 51.62% |
What did the Fund invest in?
(as of April 30, 2025)
State Breakdown (% of net assets)
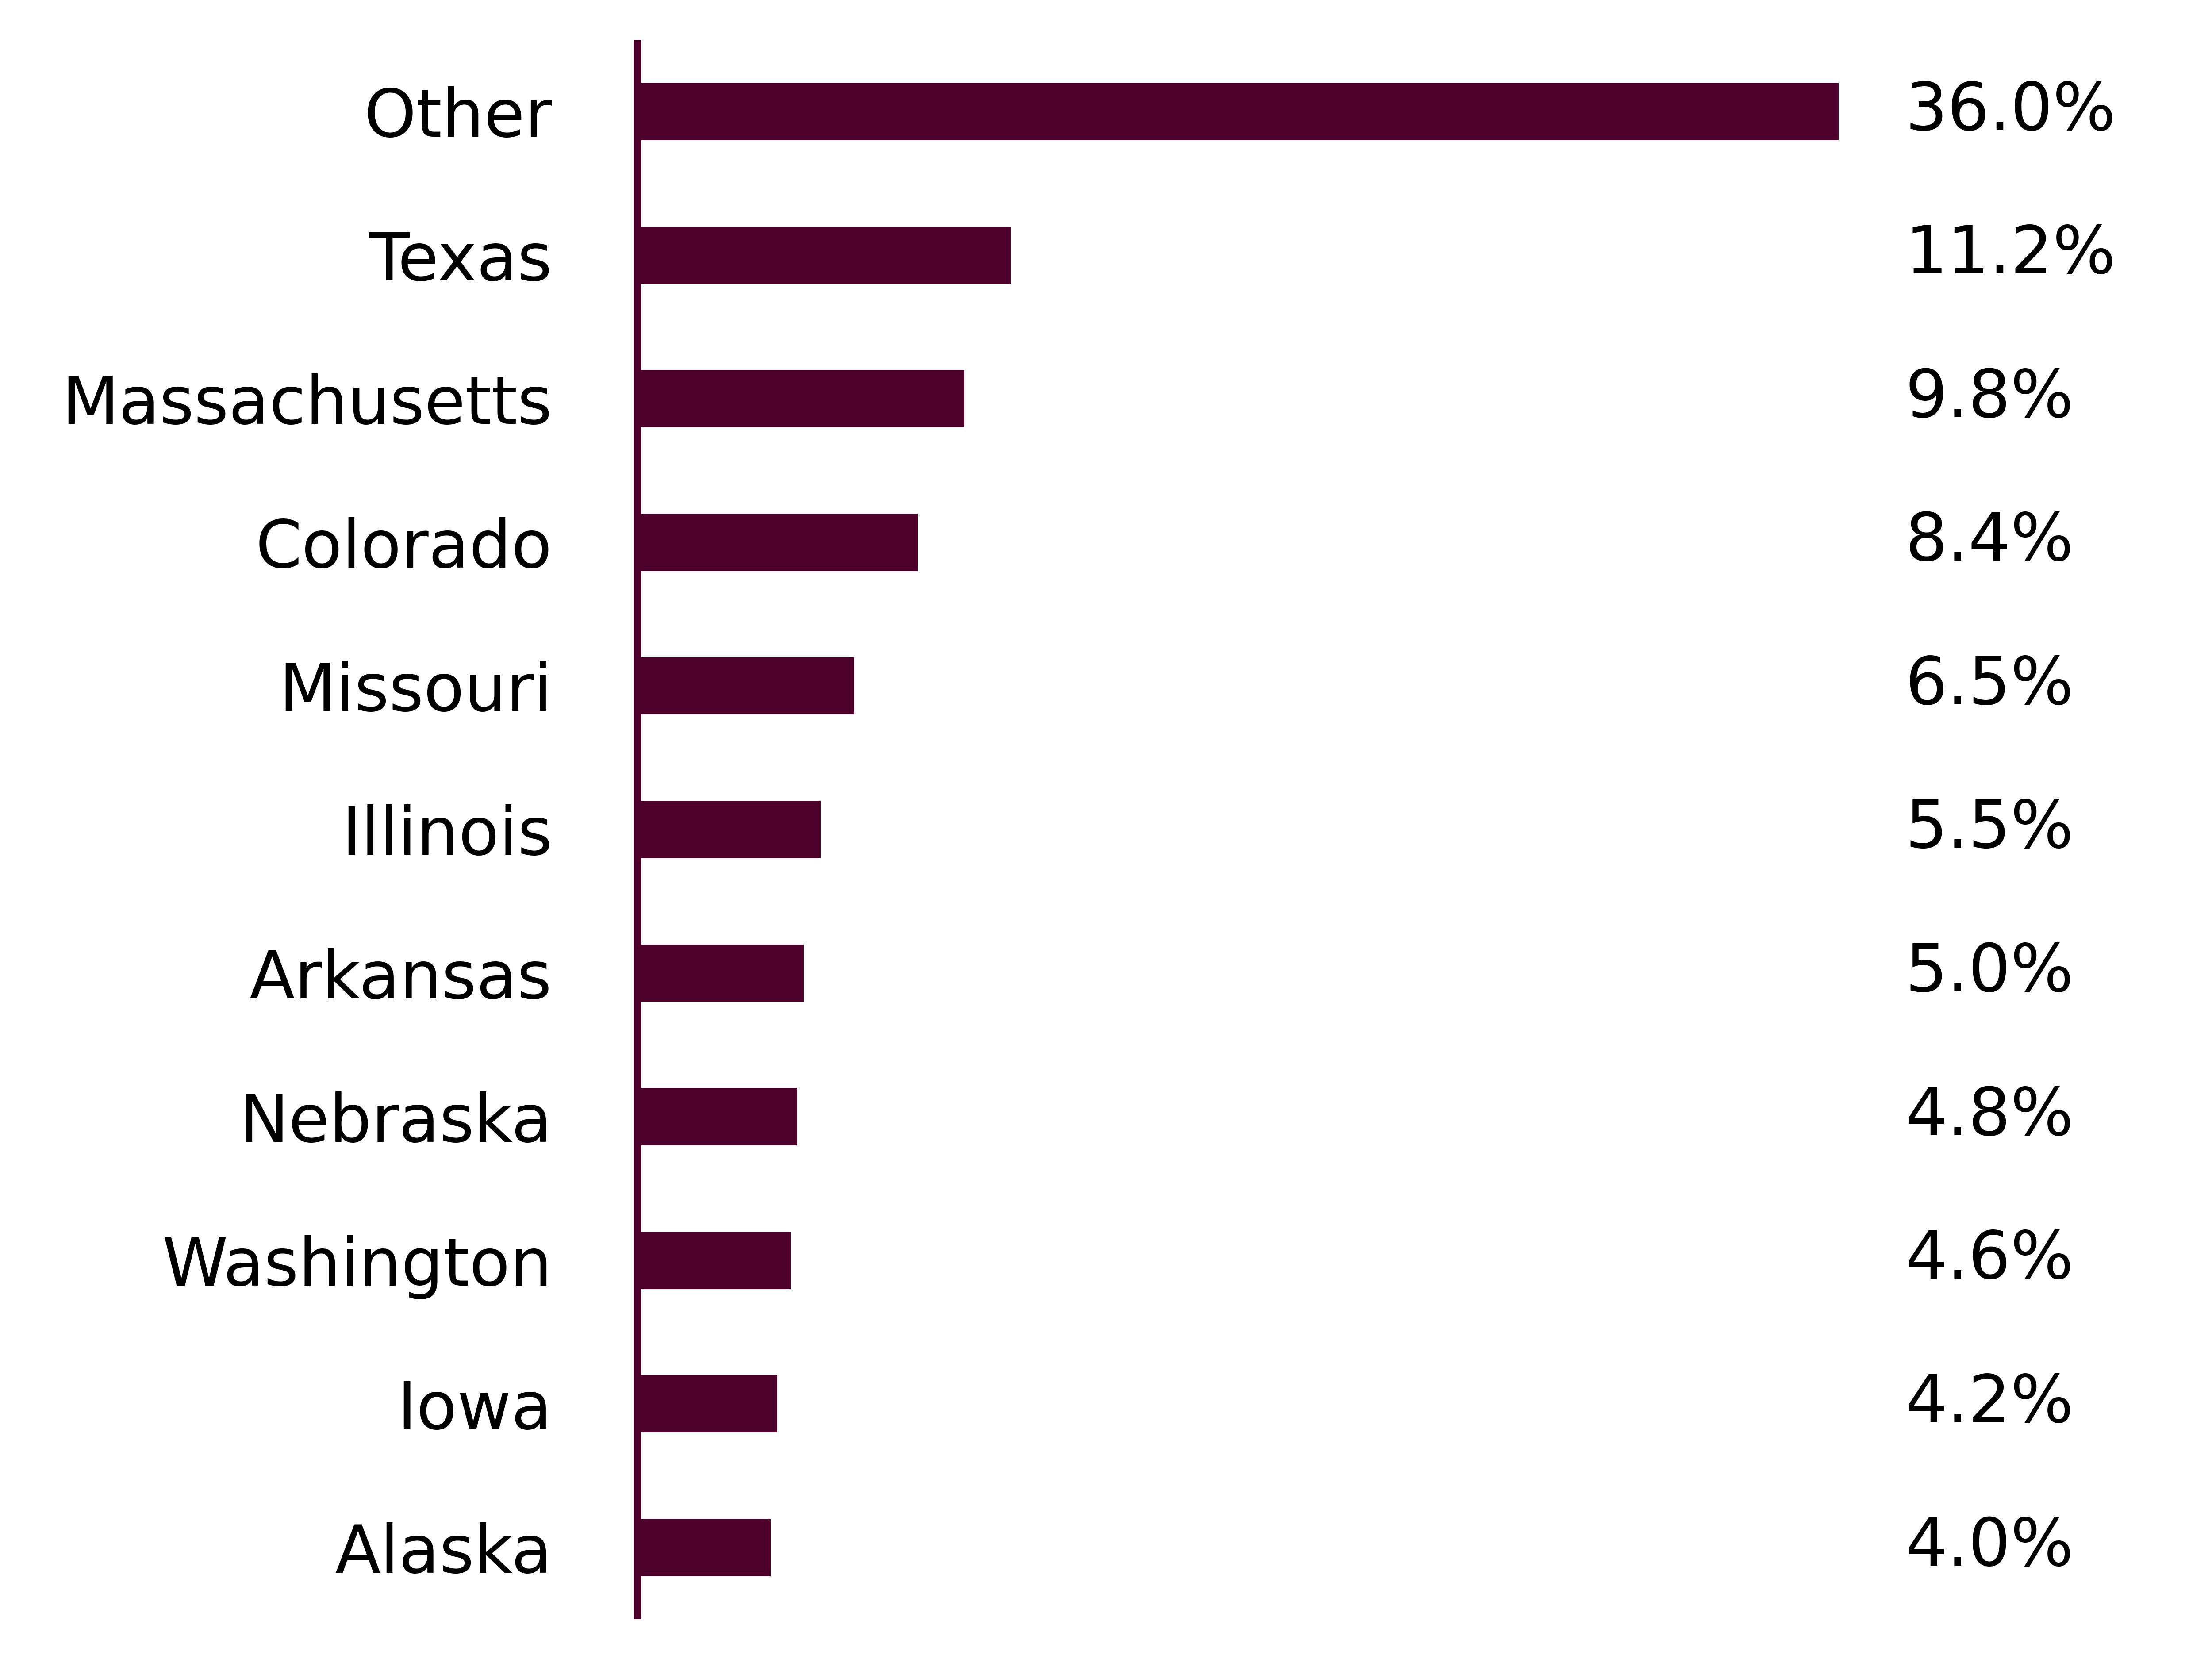
Top Ten Holdings | (% of Total Net Assets) |
|---|---|
Fidelity Government Portfolio | |
PEFA Inc | |
City of Hope AR Sales & Use Tax Revenue | |
Missouri Development Finance Board | |
Alaska Municipal Bond Bank Authority | |
Arlington Higher Education Finance Corp | |
City of Chicago IL | |
Pennsylvania Economic Development Financing Authority | |
Central Plains Energy Project | |
Columbus County Housing Authority |
| [1] | Based on operations for the period from January 13, 2025 to April 30, 2025. Expenses for the full fiscal year would be higher. |
| [2] | Based on operations for the period from January 13, 2025 to April 30, 2025. Expenses for the full fiscal year would be higher. |
| [3] | Based on operations for the period from May 21, 2024 to April 30, 2025. Expenses for the full fiscal year would be higher. |
| [4] | Based on operations for the period from May 21, 2024 to April 30, 2025. Expenses for the full fiscal year would be higher. |