Shareholder Report
Apr. 30, 2025
USD ($)
$ / shares
WHAT WERE THE FUND COSTS FOR THE PAST YEAR? (based on a hypothetical $10,000 investment)
|
Class Name
|
Costs of a $10,000 investment
|
Costs paid as a percentage of a $10,000 investment
|
|
Institutional Class
|
$92
|
0.92%
|
HOW DID THE FUND PERFORM LAST YEAR AND WHAT AFFECTED ITS PERFORMANCE?
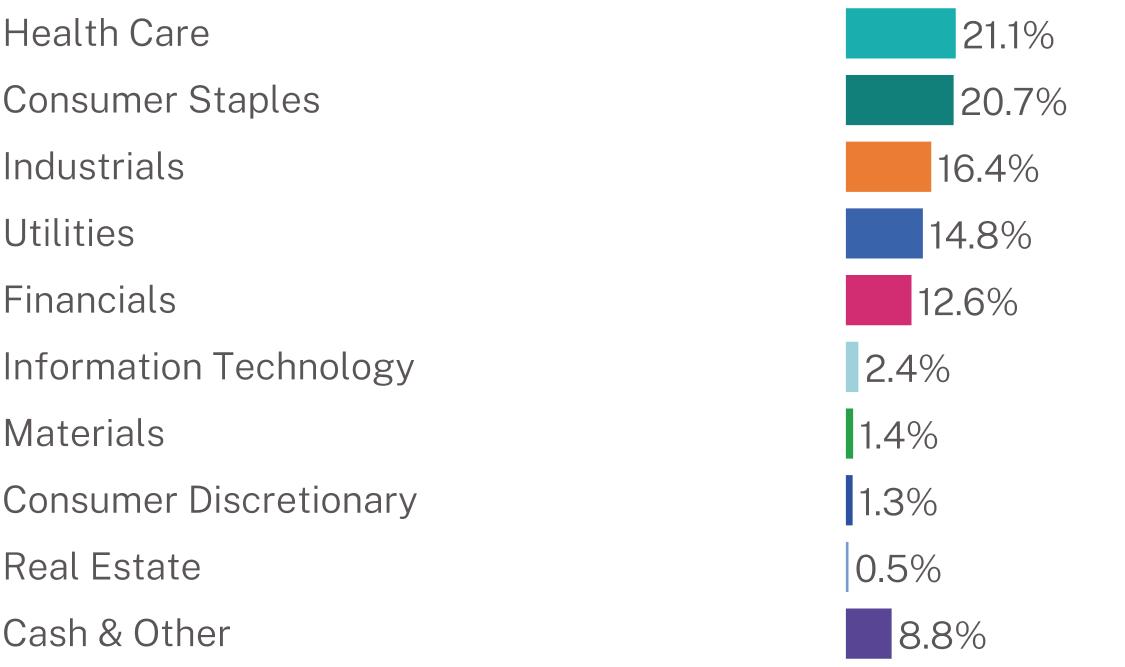
As we head into our 17th year here as a firm at Nuance Investments, it makes me reflect on just how much I enjoy the competition that embodies our work each day. Competing against the market, benchmarks, and peers has been my work world now since the mid 1990’s. While there have been many outstanding and frustrating years, the fiscal year was one of the more disappointing as we believe the market seemingly ignores valuation multiples as a primary reason for downside support. To be clear, this is our opinion of the market and not a fact. The fund trailed its primary benchmark, the Russell Midcap® Value Index, in this annual period primarily due to some of our largest holdings having tough quarters. We do believe this can lead to opportunities and is reflected in the make up of the portfolio. The largest overweight positions, relative to the benchmark, remain the Consumer Staples, Health Care, and Utilities sectors. Within the Health Care sector, we are invested across multiple sub-industries including Life Sciences Tools & Services, Health Care Supplies, and Health Care Distributors. Within the Consumer Staples sector, our primary exposure remains in the Household Products and Personal Care Products industries. We also have exposure within the Foods Products industry. We remain overweight in the Utilities sector, and our positioning there is primarily within the Water Utilities industry. We favor the competitive position of water utilities to natural gas and most electric utilities. While the Industrials and Financials sectors makes up a meaningful part of the portfolio, we are underweight the benchmark. While we have small exposure in the Information Technology, Real Estate, Materials, and Consumer Discretionary sectors, we continue to be underweight those sectors relative to the benchmark. We remain underweight the Energy sector. Lastly, we remain underweight the Communication Services sector primarily due to competitive uncertainty and valuation concerns.
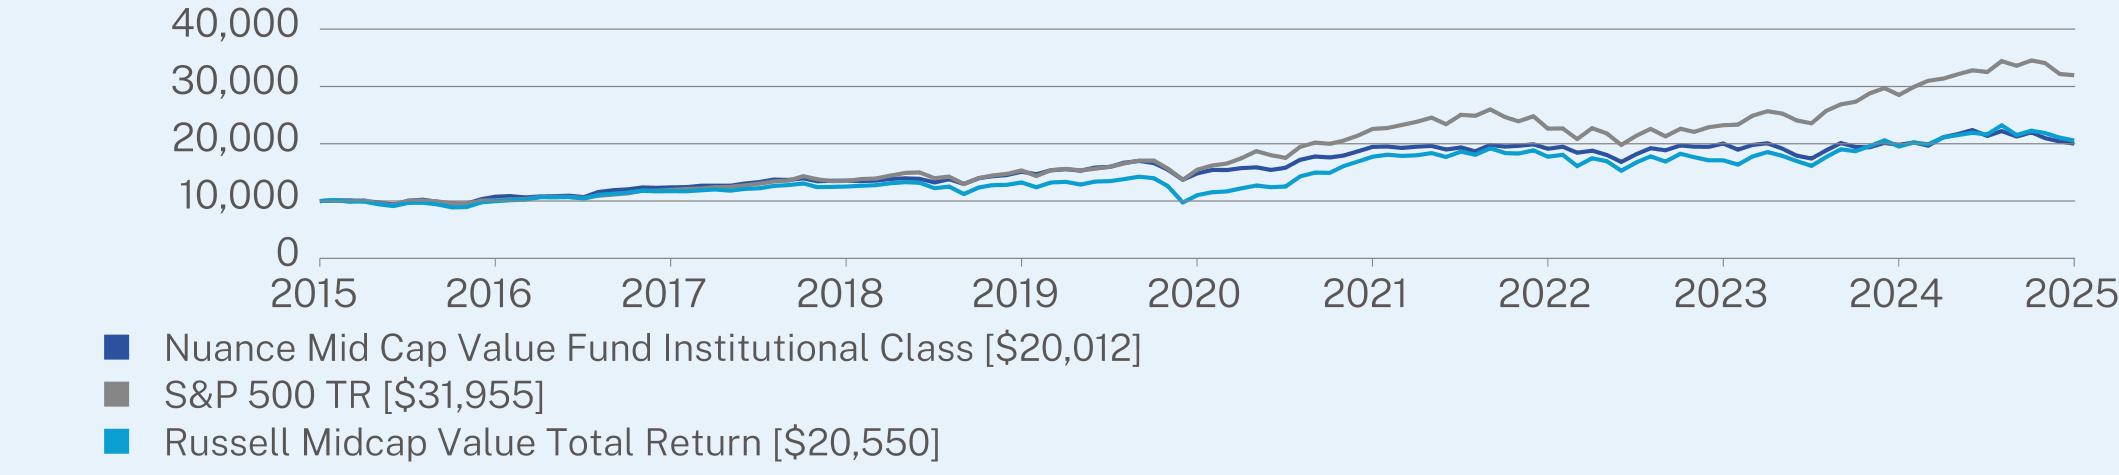
ANNUAL AVERAGE TOTAL RETURN (%)
|
|
1 Year
|
5 Year
|
10 Year
|
|
Institutional Class (without sales charge)
|
1.01
|
6.16
|
7.18
|
|
S&P 500 TR
|
12.10
|
15.61
|
12.32
|
|
Russell Midcap Value Total Return
|
5.24
|
13.24
|
7.47
|
Visit https://nuanceinvestments.com/mid-cap-value-fund/ for more recent performance information.
Visit https://nuanceinvestments.com/mid-cap-value-fund/ for more recent performance information.
KEY FUND STATISTICS (as of April 30, 2025)
|
Net Assets
|
$540,286,596
|
|
Number of Holdings
|
57
|
|
Net Advisory Fee
|
$11,258,109
|
|
Portfolio Turnover
|
74%
|
|
Top Holdings
|
(%)
|
|
Estee Lauder Companies, Inc.
|
7.0%
|
|
Henkel AG & Co. KGaA
|
6.0%
|
|
Qiagen NV
|
5.6%
|
|
California Water Service Group
|
4.5%
|
|
Globe Life, Inc.
|
4.0%
|
|
Hologic, Inc.
|
4.0%
|
|
Marten Transport Ltd.
|
4.0%
|
|
Werner Enterprises, Inc.
|
3.6%
|
|
Northern Trust Corp.
|
3.5%
|
|
Solventum Corp.
|
3.5%
|

WHAT WERE THE FUND COSTS FOR THE PAST YEAR? (based on a hypothetical $10,000 investment)
|
Class Name
|
Costs of a $10,000 investment
|
Costs paid as a percentage of a $10,000 investment
|
|
Investor Class
|
$118
|
1.18%
|
HOW DID THE FUND PERFORM LAST YEAR AND WHAT AFFECTED ITS PERFORMANCE?
As we head into our 17th year here as a firm at Nuance Investments, it makes me reflect on just how much I enjoy the competition that embodies our work each day. Competing against the market, benchmarks, and peers has been my work world now since the mid 1990’s. While there have been many outstanding and frustrating years, the fiscal year was one of the more disappointing as we believe the market seemingly ignores valuation multiples as a primary reason for downside support. To be clear, this is our opinion of the market and not a fact. The fund trailed its primary benchmark, the Russell Midcap® Value Index, in this annual period primarily due to some of our largest holdings having tough quarters. We do believe this can lead to opportunities and is reflected in the make up of the portfolio. The largest overweight positions, relative to the benchmark, remain the Consumer Staples, Health Care, and Utilities sectors. Within the Health Care sector, we are invested across multiple sub-industries including Life Sciences Tools & Services, Health Care Supplies, and Health Care Distributors. Within the Consumer Staples sector, our primary exposure remains in the Household Products and Personal Care Products industries. We also have exposure within the Foods Products industry. We remain overweight in the Utilities sector, and our positioning there is primarily within the Water Utilities industry. We favor the competitive position of water utilities to natural gas and most electric utilities. While the Industrials and Financials sectors makes up a meaningful part of the portfolio, we are underweight the benchmark. While we have small exposure in the Information Technology, Real Estate, Materials, and Consumer Discretionary sectors, we continue to be underweight those sectors relative to the benchmark. We remain underweight the Energy sector. Lastly, we remain underweight the Communication Services sector primarily due to competitive uncertainty and valuation concerns.
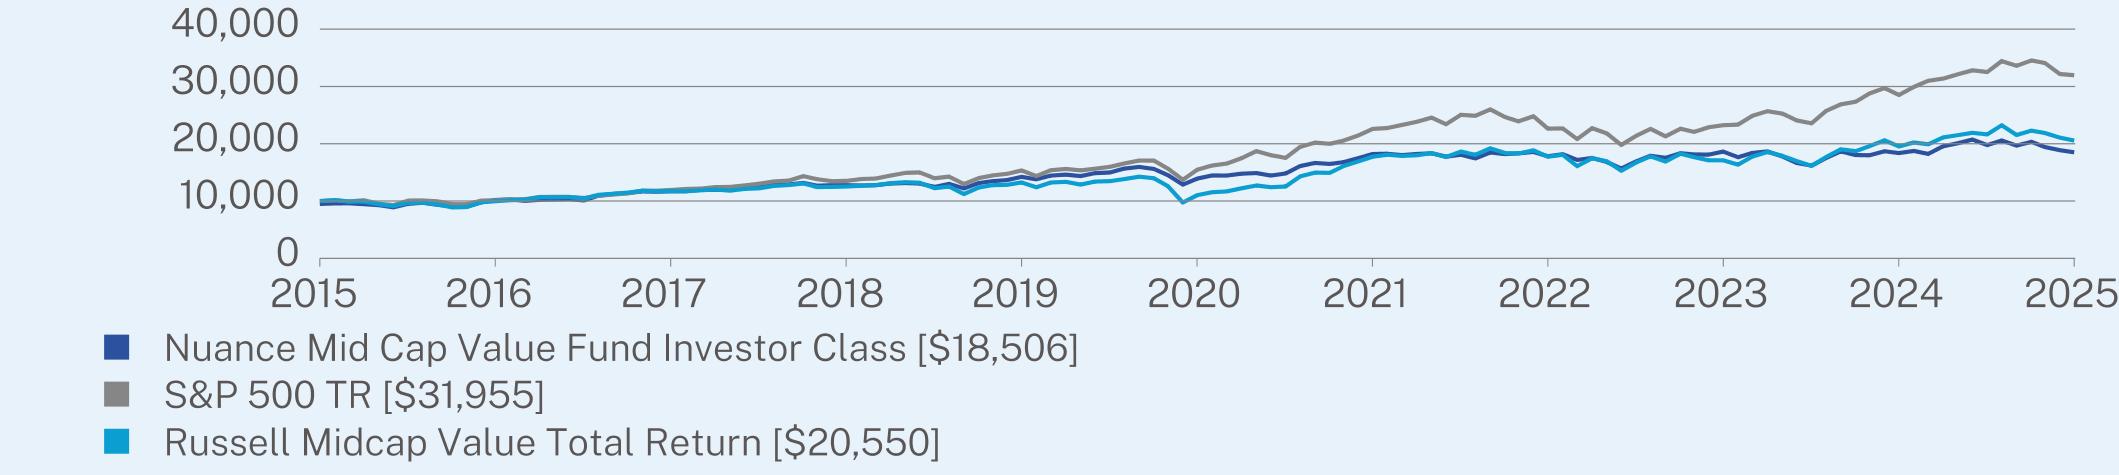
ANNUAL AVERAGE TOTAL RETURN (%)
|
|
1 Year
|
5 Year
|
10 Year
|
|
Investor Class (without sales charge)
|
0.76
|
5.86
|
6.90
|
|
Investor Class (with sales charge)
|
-4.28
|
4.78
|
6.35
|
|
S&P 500 TR
|
12.10
|
15.61
|
12.32
|
|
Russell Midcap Value Total Return
|
5.24
|
13.24
|
7.47
|
Visit https://nuanceinvestments.com/mid-cap-value-fund/ for more recent performance information.
Visit https://nuanceinvestments.com/mid-cap-value-fund/ for more recent performance information.
KEY FUND STATISTICS (as of April 30, 2025)
|
Net Assets
|
$540,286,596
|
|
Number of Holdings
|
57
|
|
Net Advisory Fee
|
$11,258,109
|
|
Portfolio Turnover
|
74%
|
|
Top Holdings
|
(%)
|
|
Estee Lauder Companies, Inc.
|
7.0%
|
|
Henkel AG & Co. KGaA
|
6.0%
|
|
Qiagen NV
|
5.6%
|
|
California Water Service Group
|
4.5%
|
|
Globe Life, Inc.
|
4.0%
|
|
Hologic, Inc.
|
4.0%
|
|
Marten Transport Ltd.
|
4.0%
|
|
Werner Enterprises, Inc.
|
3.6%
|
|
Northern Trust Corp.
|
3.5%
|
|
Solventum Corp.
|
3.5%
|
WHAT WERE THE FUND COSTS FOR THE PAST YEAR? (based on a hypothetical $10,000 investment)
|
Class Name
|
Costs of a $10,000 investment
|
Costs paid as a percentage of a $10,000 investment
|
|
Z Class
|
$78
|
0.78%
|
HOW DID THE FUND PERFORM LAST YEAR AND WHAT AFFECTED ITS PERFORMANCE?
As we head into our 17th year here as a firm at Nuance Investments, it makes me reflect on just how much I enjoy the competition that embodies our work each day. Competing against the market, benchmarks, and peers has been my work world now since the mid 1990’s. While there have been many outstanding and frustrating years, the fiscal year was one of the more disappointing as we believe the market seemingly ignores valuation multiples as a primary reason for downside support. To be clear, this is our opinion of the market and not a fact. The fund trailed its primary benchmark, the Russell Midcap® Value Index, in this annual period primarily due to some of our largest holdings having tough quarters. We do believe this can lead to opportunities and is reflected in the make up of the portfolio. The largest overweight positions, relative to the benchmark, remain the Consumer Staples, Health Care, and Utilities sectors. Within the Health Care sector, we are invested across multiple sub-industries including Life Sciences Tools & Services, Health Care Supplies, and Health Care Distributors. Within the Consumer Staples sector, our primary exposure remains in the Household Products and Personal Care Products industries. We also have exposure within the Foods Products industry. We remain overweight in the Utilities sector, and our positioning there is primarily within the Water Utilities industry. We favor the competitive position of water utilities to natural gas and most electric utilities. While the Industrials and Financials sectors makes up a meaningful part of the portfolio, we are underweight the benchmark. While we have small exposure in the Information Technology, Real Estate, Materials, and Consumer Discretionary sectors, we continue to be underweight those sectors relative to the benchmark. We remain underweight the Energy sector. Lastly, we remain underweight the Communication Services sector primarily due to competitive uncertainty and valuation concerns.
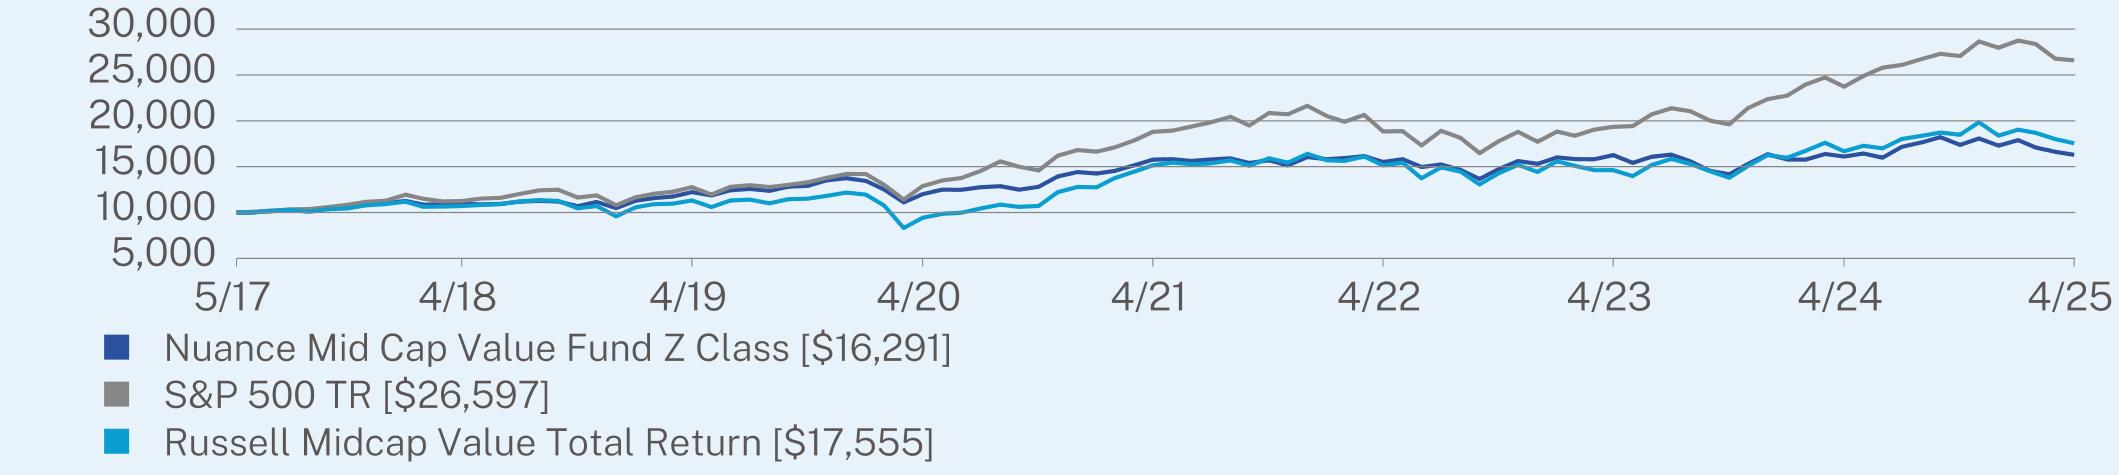
ANNUAL AVERAGE TOTAL RETURN (%)
|
|
1 Year
|
5 Year
|
Since Inception
(05/08/2017) |
|
Z Class (without sales charge)
|
1.17
|
6.30
|
6.31
|
|
S&P 500 TR
|
12.10
|
15.61
|
13.04
|
|
Russell Midcap Value Total Return
|
5.24
|
13.24
|
7.31
|
Visit https://nuanceinvestments.com/mid-cap-value-fund/ for more recent performance information.
Visit https://nuanceinvestments.com/mid-cap-value-fund/ for more recent performance information.
KEY FUND STATISTICS (as of April 30, 2025)
|
Net Assets
|
$540,286,596
|
|
Number of Holdings
|
57
|
|
Net Advisory Fee
|
$11,258,109
|
|
Portfolio Turnover
|
74%
|
|
Top Holdings
|
(%)
|
|
Estee Lauder Companies, Inc.
|
7.0%
|
|
Henkel AG & Co. KGaA
|
6.0%
|
|
Qiagen NV
|
5.6%
|
|
California Water Service Group
|
4.5%
|
|
Globe Life, Inc.
|
4.0%
|
|
Hologic, Inc.
|
4.0%
|
|
Marten Transport Ltd.
|
4.0%
|
|
Werner Enterprises, Inc.
|
3.6%
|
|
Northern Trust Corp.
|
3.5%
|
|
Solventum Corp.
|
3.5%
|
