Shareholder Report
Apr. 30, 2025
USD ($)
Holding
This report describes changes to the Fund that occurred during the reporting period.
What Were The Fund Costs For The Last Year ?
(Based on a hypothetical $10,000 investment)
| Fund | Costs of a $10,000 investment | Costs paid as a percentage of a $10,000 investment |
| Invesco Bloomberg MVP Multi-factor ETF | $31 | 0.29% |
How Did The Fund Perform During The Period?
• During the fiscal year ended April 30, 2025, U.S. equities began the period with strong performance but experienced a more challenging environment near the end of the period due to uncertainty regarding global trade and tariff policy. The Fund's multi-factor security selection and equal weighting methodology led it to be underweight mega-capitalization information technology and communication services securities, creating a performance headwind relative to the S&P 500® Index.
• The Fund is passively managed and seeks to track the investment results (before fees and expenses) of the Bloomberg MVP Index (the “Index”). The Fund generally will invest at least 90% of its total assets in securities that comprise the Index.
• For the fiscal year ended April 30, 2025, the Fund's performance, on a net asset value ("NAV") basis, 10.44%, differed from the return of the Index, 10.79%, primarily due to fees and expenses incurred by the Fund during the period.
What contributed to performance?
Sector Allocations | Financials sector, followed by the utilities and real estate sectors, respectively.
Positions | Targa Resources Corp., an energy company (no longer held at fiscal year-end), and Entergy Corp., a utilities company (no longer held at fiscal year-end).
What detracted from performance?
Sector Allocations | Materials sector.
Positions | Elevance Health, Inc., a health care company (no longer held at fiscal year-end), and Raymond James Financial, Inc., a financials company (no longer held at fiscal year-end).
How Has The Fund Historically Performed?
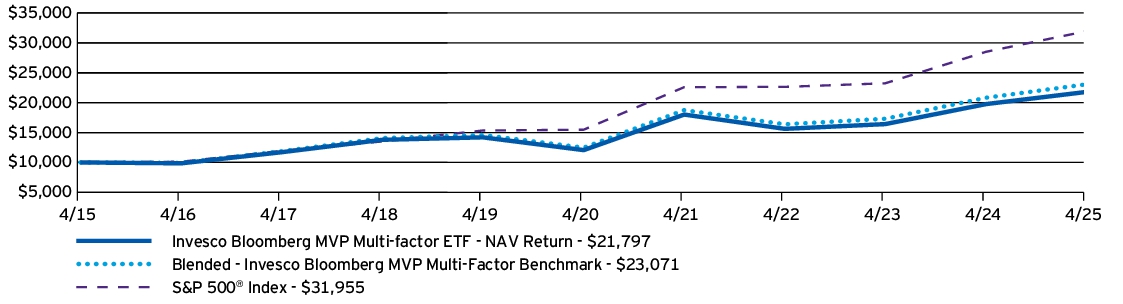
Growth of $10,000 Investment
AVERAGE ANNUAL TOTAL RETURNS |
1 Year |
5 Years |
10 Years |
| Invesco Bloomberg MVP Multi-factor ETF — NAV Return | 10.44% | 12.60% | 8.10% |
| Blended - Invesco Bloomberg MVP Multi-Factor Benchmark | 10.79% | 13.09% | 8.72% |
| S&P 500® Index | 12.10% | 15.61% | 12.32% |
Performance figures do not reflect deduction of taxes a shareholder would pay on Fund distributions or sale of Fund shares.
- Effective August 28, 2024, the Fund changed its broad-based securities market benchmark from the Bloomberg MVP Index to the S&P 500® Index to reflect that the S&P 500® Index can be considered more broadly representative of the overall applicable securities market.
What Are Key Statistics About The Fund?
(as of April 30, 2025)
| Fund net assets | $109,074,816 |
| Total number of portfolio holdings | 58 |
| Total advisory fees paid | $301,388 |
| Portfolio turnover rate | 154% |
What Comprised The Fund's Holdings?
(as of April 30, 2025)
Top ten holdings*
(% of net assets)
(% of net assets)
| Vistra Corp. | 2.08% |
| Kroger Co. (The) | 2.01% |
| TJX Cos., Inc. (The) | 1.99% |
| Quest Diagnostics, Inc. | 1.98% |
| Cencora, Inc. | 1.98% |
| Republic Services, Inc. | 1.95% |
| Cardinal Health, Inc. | 1.93% |
| Waste Management, Inc. | 1.90% |
| Motorola Solutions, Inc. | 1.89% |
| Kellanova | 1.89% |
| * Excluding money market fund holdings, if any. |
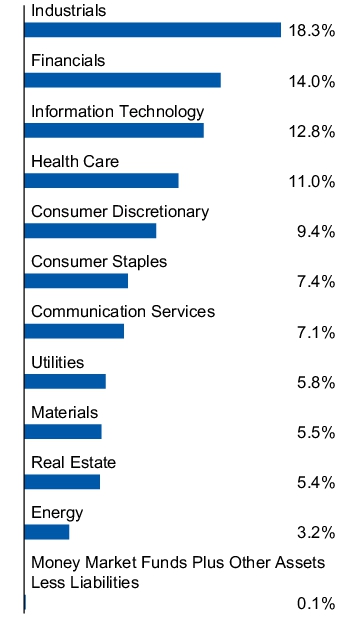
Sector allocation
(% of net assets)
(% of net assets)
Top ten holdings*
(% of net assets)
(% of net assets)
| Vistra Corp. | 2.08% |
| Kroger Co. (The) | 2.01% |
| TJX Cos., Inc. (The) | 1.99% |
| Quest Diagnostics, Inc. | 1.98% |
| Cencora, Inc. | 1.98% |
| Republic Services, Inc. | 1.95% |
| Cardinal Health, Inc. | 1.93% |
| Waste Management, Inc. | 1.90% |
| Motorola Solutions, Inc. | 1.89% |
| Kellanova | 1.89% |
| * Excluding money market fund holdings, if any. |
How Has The Fund Changed Over The Past Year?
This is a summary of certain changes to the Fund since April 30, 2024. For more complete information, you may review the Fund's prospectus, which is available at invesco.com/reports or upon request at (800) 983-0903.
The Fund's net expense ratio decreased from the prior fiscal year end as a result of a change in the Fund's investment advisory agreement which became effective on August 28, 2023.
The Fund's net expense ratio decreased from the prior fiscal year end as a result of a change in the Fund's investment advisory agreement which became effective on August 28, 2023.
This is a summary of certain changes to the Fund since April 30, 2024. For more complete information, you may review the Fund's prospectus, which is available at invesco.com/reports or upon request at (800) 983-0903.
What Were The Fund Costs For The Last Year ?
(Based on a hypothetical $10,000 investment)
| Fund | Costs of a $10,000 investment | Costs paid as a percentage of a $10,000 investment |
| Invesco S&P SmallCap Momentum ETF | $36 | 0.35% |
How Did The Fund Perform During The Period?
• During the fiscal year ended April 30, 2025, U.S. small cap equities showed strong performance subsequent to the conclusion of the U.S. election but struggled near the end of the period due to uncertainty regarding global trade and tariff policy. The Fund's focus on momentum securities, or those with relatively stronger price returns over a trailing twelve-month period, was a notable driver of its relative outperformance versus the S&P SmallCap 600® Index during the period as investors continued to favor the momentum factor.
• The Fund is passively managed and seeks to track the investment results (before fees and expenses) of the S&P SmallCap 600® Momentum Index (the “Index”). The Fund generally will invest at least 90% of its total assets in securities that comprise the Index.
• For the fiscal year ended April 30, 2025, the Fund's performance, on a net asset value ("NAV") basis, 8.11%, differed from the return of the Index, 8.51%, primarily due to fees and expenses incurred by the Fund during the period.
What contributed to performance?
Sector Allocations | Consumer discretionary sector, followed by the health care and financials sectors, respectively.
Positions | Mueller Industries, Inc., an industrials company (no longer held at fiscal year-end), and Stride, Inc., a consumer discretionary company.
What detracted from performance?
Sector Allocations | Real estate sector, followed by the materials and energy sectors, respectively.
Positions | Alpha Metallurgical Resources, Inc., a materials company (no longer held at fiscal year-end), and Innovative Industrial Properties Inc., a real estate company (no longer held at fiscal year-end).
How Has The Fund Historically Performed?
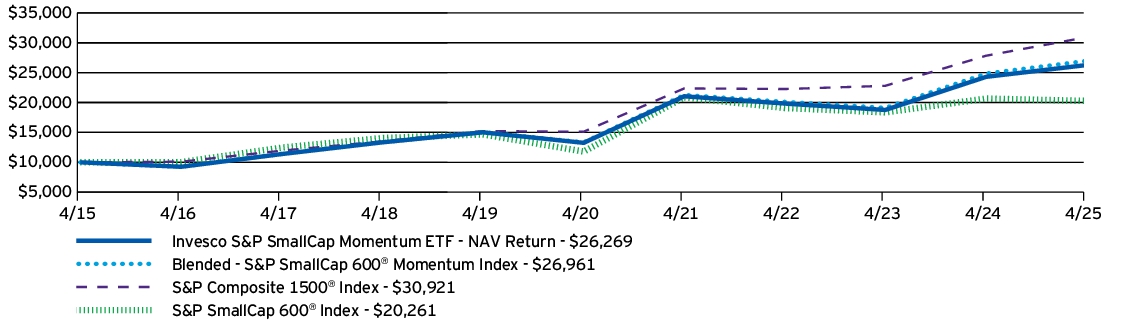
Growth of $10,000 Investment
AVERAGE ANNUAL TOTAL RETURNS |
1 Year |
5 Years |
10 Years |
| Invesco S&P SmallCap Momentum ETF — NAV Return | 8.11% | 14.66% | 10.14% |
| Blended - S&P SmallCap 600® Momentum Index | 8.51% | 15.12% | 10.43% |
| S&P Composite 1500® Index | 11.12% | 15.39% | 11.95% |
| S&P SmallCap 600® Index | -1.93% | 11.42% | 7.32% |
Performance figures do not reflect deduction of taxes a shareholder would pay on Fund distributions or sale of Fund shares.
- Effective August 28, 2024, the Fund changed its broad-based securities market benchmark from the S&P SmallCap 600® Momentum Index to the S&P Composite 1500® Index to reflect that the S&P Composite 1500® Index can be considered more broadly representative of the overall applicable securities market.
What Are Key Statistics About The Fund?
(as of April 30, 2025)
| Fund net assets | $1,385,545,122 |
| Total number of portfolio holdings | 120 |
| Total advisory fees paid | $3,248,566 |
| Portfolio turnover rate | 115% |
What Comprised The Fund's Holdings?
(as of April 30, 2025)
Top ten holdings*
(% of net assets)
(% of net assets)
| Corcept Therapeutics, Inc. | 3.06% |
| Brinker International, Inc. | 2.72% |
| ADMA Biologics, Inc. | 2.33% |
| Mr. Cooper Group, Inc. | 2.10% |
| Stride, Inc. | 2.07% |
| ACI Worldwide, Inc. | 1.96% |
| Armstrong World Industries, Inc. | 1.91% |
| Jackson Financial, Inc., Class A | 1.86% |
| Group 1 Automotive, Inc. | 1.77% |
| InterDigital, Inc. | 1.75% |
| * Excluding money market fund holdings, if any. |
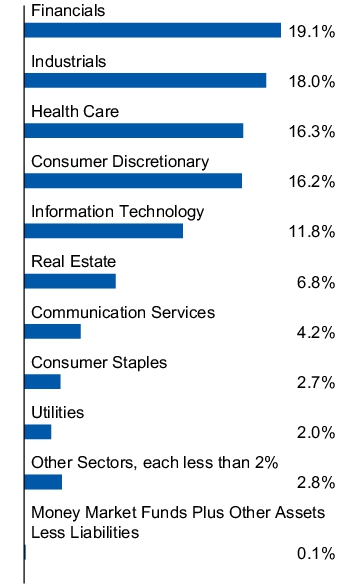
Sector allocation
(% of net assets)
(% of net assets)
Top ten holdings*
(% of net assets)
(% of net assets)
| Corcept Therapeutics, Inc. | 3.06% |
| Brinker International, Inc. | 2.72% |
| ADMA Biologics, Inc. | 2.33% |
| Mr. Cooper Group, Inc. | 2.10% |
| Stride, Inc. | 2.07% |
| ACI Worldwide, Inc. | 1.96% |
| Armstrong World Industries, Inc. | 1.91% |
| Jackson Financial, Inc., Class A | 1.86% |
| Group 1 Automotive, Inc. | 1.77% |
| InterDigital, Inc. | 1.75% |
| * Excluding money market fund holdings, if any. |
What Were The Fund Costs For The Last Year ?
(Based on a hypothetical $10,000 investment)
| Fund | Costs of a $10,000 investment | Costs paid as a percentage of a $10,000 investment |
| Invesco S&P SmallCap Value with Momentum ETF | $35 | 0.36% |
How Did The Fund Perform During The Period?
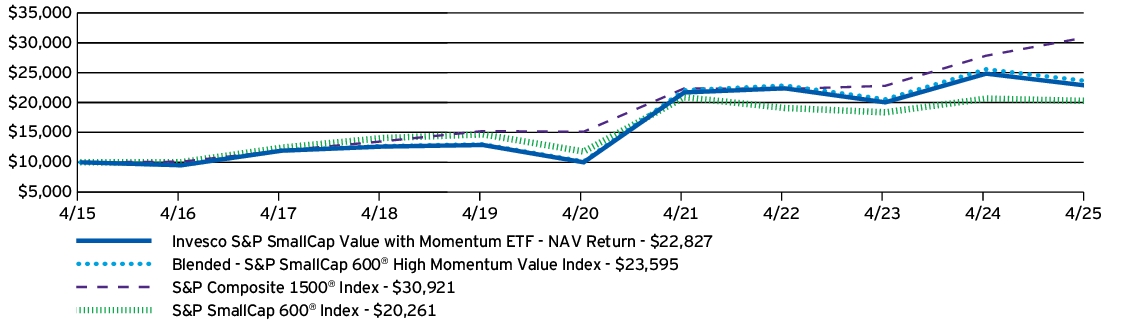
• During the fiscal year ended April 30, 2025, U.S. small cap equities showed strong performance subsequent to the conclusion of the U.S. election but struggled near the end of the period due to uncertainty regarding global trade and tariff policy. The Fund underperformed the S&P SmallCap 600® Index due to its focus on value securities, which underperformed U.S. small cap equities during the period. Poor security selection results in the consumer discretionary, materials, and industrials sectors were also notable drivers of relative underperformance.
• The Fund is passively managed and seeks to track the investment results (before fees and expenses) of the S&P SmallCap 600® High Momentum Value Index (the “Index”). The Fund generally will invest at least 90% of its total assets in securities that comprise the Index.
• For the fiscal year ended April 30, 2025, the Fund's performance, on a net asset value ("NAV") basis, -8.07%, differed from the return of the Index, -7.70%, primarily due to fees and expenses incurred by the Fund during the period.
What contributed to performance?
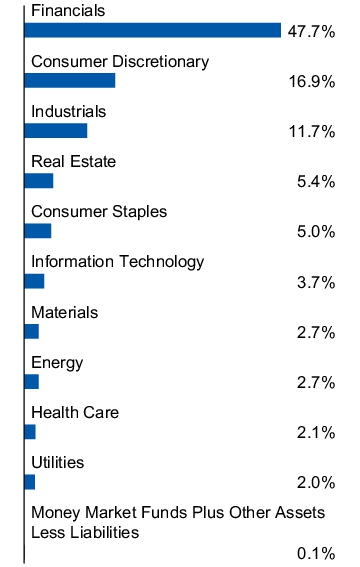
Sector Allocations | Financials sector, followed by the communication services and consumer staples sectors, respectively.
Positions | StoneX Group Inc., a financials company, and Telephone and Data Systems, Inc., a communication services company (no longer held at fiscal year-end).
What detracted from performance?
Sector Allocations | Consumer discretionary sector, followed by the energy and materials sectors, respectively.
Positions | Par Pacific Holdings, Inc., an energy company (no longer held at fiscal year-end), and Caleres, Inc., a consumer discretionary company.
How Has The Fund Historically Performed?
Growth of $10,000 Investment
AVERAGE ANNUAL TOTAL RETURNS |
1 Year |
5 Years |
10 Years |
| Invesco S&P SmallCap Value with Momentum ETF — NAV Return | -8.07% | 17.94% | 8.60% |
| Blended - S&P SmallCap 600® High Momentum Value Index | -7.70% | 18.40% | 8.96% |
| S&P Composite 1500® Index | 11.12% | 15.39% | 11.95% |
| S&P SmallCap 600® Index | -1.93% | 11.42% | 7.32% |
Performance figures do not reflect deduction of taxes a shareholder would pay on Fund distributions or sale of Fund shares.
- Effective August 28, 2024, the Fund changed its broad-based securities market benchmark from the S&P SmallCap 600® High Momentum Value Index to the S&P Composite 1500® Index to reflect that the S&P Composite 1500® Index can be considered more broadly representative of the overall applicable securities market.
What Are Key Statistics About The Fund?
(as of April 30, 2025)
| Fund net assets | $573,223,772 |
| Total number of portfolio holdings | 121 |
| Total advisory fees paid | $2,225,771 |
| Portfolio turnover rate | 87% |
What Comprised The Fund's Holdings?
(as of April 30, 2025)
Top ten holdings*
(% of net assets)
(% of net assets)
| StoneX Group, Inc. | 2.17% |
| EZCORP, Inc., Class A | 1.92% |
| World Kinect Corp. | 1.88% |
| Fresh Del Monte Produce, Inc. | 1.53% |
| Lincoln National Corp. | 1.53% |
| Sonic Automotive, Inc., Class A | 1.51% |
| Universal Corp. | 1.48% |
| Group 1 Automotive, Inc. | 1.40% |
| Select Medical Holdings Corp. | 1.34% |
| SiriusPoint Ltd. | 1.32% |
| * Excluding money market fund holdings, if any. |
Sector allocation
(% of net assets)
(% of net assets)
Top ten holdings*
(% of net assets)
(% of net assets)
| StoneX Group, Inc. | 2.17% |
| EZCORP, Inc., Class A | 1.92% |
| World Kinect Corp. | 1.88% |
| Fresh Del Monte Produce, Inc. | 1.53% |
| Lincoln National Corp. | 1.53% |
| Sonic Automotive, Inc., Class A | 1.51% |
| Universal Corp. | 1.48% |
| Group 1 Automotive, Inc. | 1.40% |
| Select Medical Holdings Corp. | 1.34% |
| SiriusPoint Ltd. | 1.32% |
| * Excluding money market fund holdings, if any. |
What Were The Fund Costs For The Last Year ?
(Based on a hypothetical $10,000 investment)
| Fund | Costs of a $10,000 investment | Costs paid as a percentage of a $10,000 investment |
| Invesco Biotechnology & Genome ETF | $59 | 0.58% |
How Did The Fund Perform During The Period?
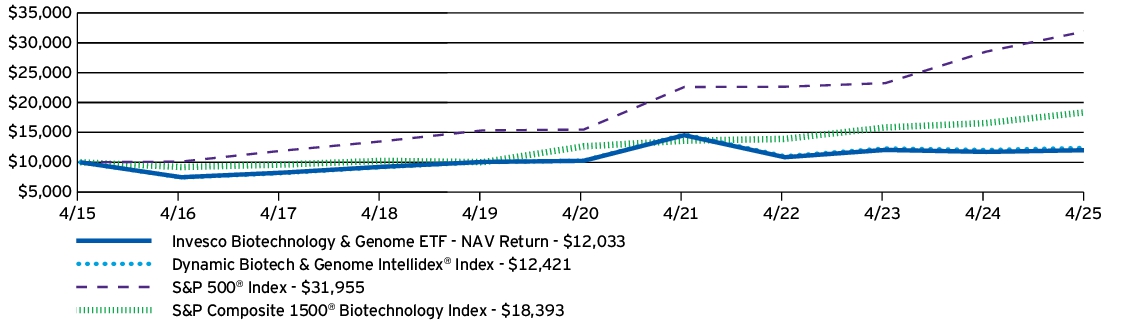
• During the fiscal year ended April 30, 2025, U.S. equities had strong performance in the beginning with a more challenging environment at the end due to uncertainty regarding global trade and tariff policy. During the period, the health care sector underperformed the broader stock market. In addition to the Fund's focus on health care stocks, its multi-factor methodology created a performance headwind compared to the S&P Composite 1500® Biotechnolgy Index.
• The Fund is passively managed and seeks to track the investment results (before fees and expenses) of the Dynamic Biotech & Genome Intellidex® Index (the “Index”). The Fund generally will invest at least 90% of its total assets in securities that comprise the Index.
• For the fiscal year ended April 30, 2025, the Fund's performance, on a net asset value ("NAV") basis, 2.51%, differed from the return of the Index, 3.02%, primarily due to fees and expenses incurred by the Fund during the period.
What contributed to performance?
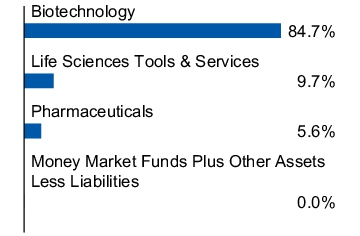
Sub-Industry Allocations | Biotechnology sub-industry, followed by the health care services sub-industry.
Positions | TG Therapeutics, Inc., a biotechnology company, and Gilead Sciences, Inc., a biotechnology company.
What detracted from performance?
Sub-Industry Allocations | Life sciences tools & services sub-industry, followed by the pharmaceuticals sub-industry.
Positions | Biogen Inc., a biotechnology company, and Myriad Genetics, Inc., a biotechnology company.
How Has The Fund Historically Performed?
Growth of $10,000 Investment
AVERAGE ANNUAL TOTAL RETURNS |
1 Year |
5 Years |
10 Years |
| Invesco Biotechnology & Genome ETF — NAV Return | 2.51% | 3.26% | 1.87% |
| Dynamic Biotech & Genome Intellidex® Index | 3.02% | 3.85% | 2.19% |
| S&P 500® Index | 12.10% | 15.61% | 12.32% |
| S&P Composite 1500® Biotechnology Index | 11.03% | 7.73% | 6.28% |
Performance figures do not reflect deduction of taxes a shareholder would pay on Fund distributions or sale of Fund shares.
- Effective August 28, 2024, the Fund changed its broad-based securities market benchmark from the S&P Composite 1500® Biotechnology Index to the S&P 500® Index to reflect that the S&P 500® Index can be considered more broadly representative of the overall applicable securities market.
What Are Key Statistics About The Fund?
(as of April 30, 2025)
| Fund net assets | $221,283,667 |
| Total number of portfolio holdings | 33 |
| Total advisory fees paid | $1,272,494 |
| Portfolio turnover rate | 94% |
What Comprised The Fund's Holdings?
(as of April 30, 2025)
Top ten holdings*
(% of net assets)
(% of net assets)
| Natera, Inc. | 5.18% |
| Gilead Sciences, Inc. | 5.11% |
| Neurocrine Biosciences, Inc. | 4.97% |
| Amgen, Inc. | 4.93% |
| TG Therapeutics, Inc. | 4.55% |
| United Therapeutics Corp. | 4.54% |
| Biogen, Inc. | 4.52% |
| Regeneron Pharmaceuticals, Inc. | 4.43% |
| Illumina, Inc. | 4.34% |
| Protagonist Therapeutics, Inc. | 3.81% |
| * Excluding money market fund holdings, if any. |
Sub-industry allocation
(% of net assets)
(% of net assets)
Top ten holdings*
(% of net assets)
(% of net assets)
| Natera, Inc. | 5.18% |
| Gilead Sciences, Inc. | 5.11% |
| Neurocrine Biosciences, Inc. | 4.97% |
| Amgen, Inc. | 4.93% |
| TG Therapeutics, Inc. | 4.55% |
| United Therapeutics Corp. | 4.54% |
| Biogen, Inc. | 4.52% |
| Regeneron Pharmaceuticals, Inc. | 4.43% |
| Illumina, Inc. | 4.34% |
| Protagonist Therapeutics, Inc. | 3.81% |
| * Excluding money market fund holdings, if any. |
What Were The Fund Costs For The Last Year ?
(Based on a hypothetical $10,000 investment)
| Fund | Costs of a $10,000 investment | Costs paid as a percentage of a $10,000 investment |
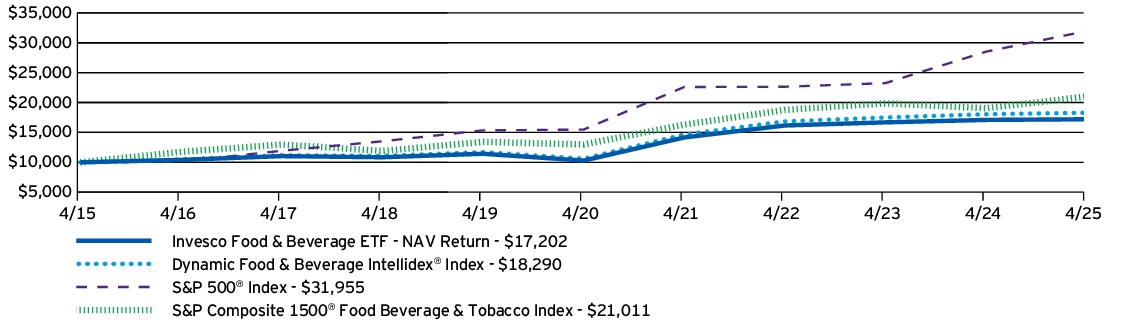
| Invesco Food & Beverage ETF | $61 | 0.61% |
How Did The Fund Perform During The Period?
• During the fiscal year ended April 30, 2025, U.S. equities had strong performance in the beginning with a more challenging environment at the end due to uncertainty regarding global trade and tariff policy. During the period, the consumer staples sector underperformed the broader stock market. In addition to the Fund's focus on consumer staples stocks, its multi-factor methodology led to an overweight in restaurants, which created a performance headwind compared to the S&P Composite 1500® Food Beverage & Tobacco Index.
• The Fund is passively managed and seeks to track the investment results (before fees and expenses) of the Dynamic Food & Beverage Intellidex® Index (the “Index”). The Fund generally will invest at least 90% of its total assets in securities that comprise the Index.
• For the fiscal year ended April 30, 2025, the Fund's performance, on a net asset value ("NAV") basis, 0.66%, differed from the return of the Index, 1.32%, primarily due to fees and expenses incurred by the Fund during the period.
What contributed to performance?
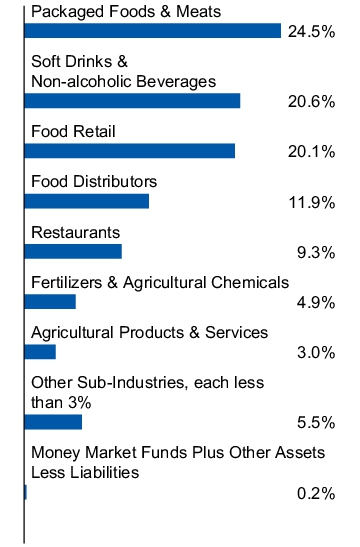
Sub-Industry Allocations | Food retail sub-industry, followed by the soft drinks & non-alcoholic beverages and packaged foods & meats sub-industries, respectively.
Positions | Sprouts Farmers Market, Inc., a food retail company, and Pilgrim's Pride Corp., a packaged food & meats company.
What detracted from performance?
Sub-Industry Allocations | Restaurants sub-industry, followed by the distillers & vintners and agricultural products & services sub-industries, respectively.
Positions | Constellation Brands, Inc., Class A, a distillers & vintners company (no longer held at fiscal year-end), and Shake Shack, Inc., Class A, a restaurants company.
How Has The Fund Historically Performed?
Growth of $10,000 Investment
AVERAGE ANNUAL TOTAL RETURNS |
1 Year |
5 Years |
10 Years |
| Invesco Food & Beverage ETF — NAV Return | 0.66% | 10.84% | 5.57% |
| Dynamic Food & Beverage Intellidex® Index | 1.32% | 11.51% | 6.22% |
| S&P 500® Index | 12.10% | 15.61% | 12.32% |
| S&P Composite 1500® Food Beverage & Tobacco Index | 10.39% | 10.10% | 7.71% |
Performance figures do not reflect deduction of taxes a shareholder would pay on Fund distributions or sale of Fund shares.
- Effective August 28, 2024, the Fund changed its broad-based securities market benchmark from the S&P Composite 1500® Food Beverage & Tobacco Index to the S&P 500® Index to reflect that the S&P 500® Index can be considered more broadly representative of the overall applicable securities market.
What Are Key Statistics About The Fund?
(as of April 30, 2025)
| Fund net assets | $101,566,340 |
| Total number of portfolio holdings | 33 |
| Total advisory fees paid | $546,797 |
| Portfolio turnover rate | 139% |
What Comprised The Fund's Holdings?
(as of April 30, 2025)
Top ten holdings*
(% of net assets)
(% of net assets)
| Monster Beverage Corp. | 5.71% |
| Kroger Co. (The) | 5.46% |
| Coca-Cola Co. (The) | 5.03% |
| DoorDash, Inc., Class A | 5.00% |
| Keurig Dr Pepper, Inc. | 4.91% |
| Corteva, Inc. | 4.88% |
| Sysco Corp. | 4.75% |
| General Mills, Inc. | 4.56% |
| Natural Grocers by Vitamin Cottage, Inc. | 3.22% |
| Sprouts Farmers Market, Inc. | 3.19% |
| * Excluding money market fund holdings, if any. |
Sub-industry allocation
(% of net assets)
(% of net assets)
Top ten holdings*
(% of net assets)
(% of net assets)
| Monster Beverage Corp. | 5.71% |
| Kroger Co. (The) | 5.46% |
| Coca-Cola Co. (The) | 5.03% |
| DoorDash, Inc., Class A | 5.00% |
| Keurig Dr Pepper, Inc. | 4.91% |
| Corteva, Inc. | 4.88% |
| Sysco Corp. | 4.75% |
| General Mills, Inc. | 4.56% |
| Natural Grocers by Vitamin Cottage, Inc. | 3.22% |
| Sprouts Farmers Market, Inc. | 3.19% |
| * Excluding money market fund holdings, if any. |
What Were The Fund Costs For The Last Year ?
(Based on a hypothetical $10,000 investment)
| Fund | Costs of a $10,000 investment | Costs paid as a percentage of a $10,000 investment |
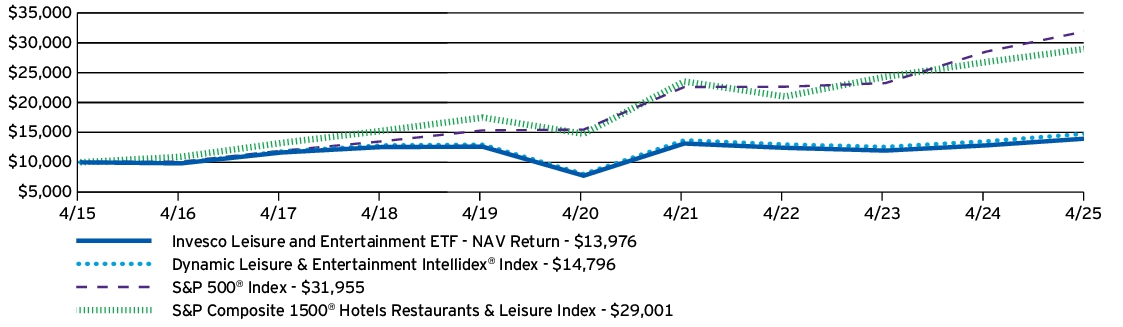
| Invesco Leisure and Entertainment ETF | $60 | 0.57% |
How Did The Fund Perform During The Period?
• During the fiscal year ended April 30, 2025, U.S. equities had strong performance in the beginning with a more challenging environment at the end due to uncertainty regarding global trade and tariff policy. During the period, the consumer discretionary sector underperformed the broader stock market. Despite the Fund's focus on consumer discretionary stocks, its multi-factor methodology led to an overweight in movies & entertainment, which performed well relative to other leisure sub-industries in the S&P Composite 1500® Hotels Restaurants & Leisure Index.
• The Fund is passively managed and seeks to track the investment results (before fees and expenses) of the Dynamic Leisure & Entertainment Intellidex® Index (the “Index”). The Fund generally will invest at least 90% of its total assets in securities that comprise the Index.
• For the fiscal year ended April 30, 2025, the Fund's performance, on a net asset value ("NAV") basis, 8.91%, differed from the return of the Index, 9.51%, primarily due to fees and expenses incurred by the Fund during the period.
What contributed to performance?
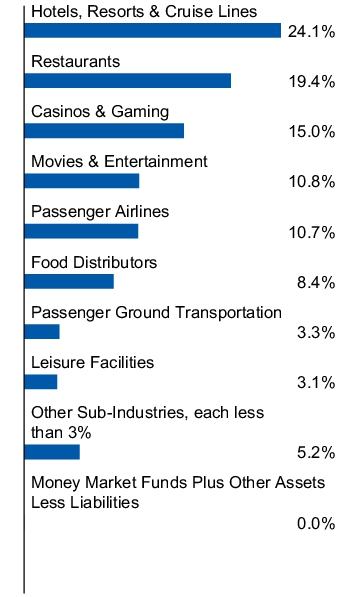
Sub-Industry Allocations | Movies & entertainment sub-industry, followed by the hotels, resorts & cruise lines and broadcasting sub-industries, respectively.
Positions | Brinker International, Inc., a restaurants company, and Royal Caribbean Group Ltd., a hotels, resorts & cruise lines company.
What detracted from performance?
Sub-Industry Allocations | Interactive media & services sub-industry, followed by the passenger airlines sub-industry.
Positions | TripAdvisor, Inc., an interactive media & services company (no longer held at fiscal year-end), and Norwegian Cruise Line Holdings Ltd., a hotels, resorts & cruise lines company.
How Has The Fund Historically Performed?
Growth of $10,000 Investment
AVERAGE ANNUAL TOTAL RETURNS |
1 Year |
5 Years |
10 Years |
| Invesco Leisure and Entertainment ETF — NAV Return | 8.91% | 12.49% | 3.40% |
| Dynamic Leisure & Entertainment Intellidex® Index | 9.51% | 12.97% | 4.00% |
| S&P 500® Index | 12.10% | 15.61% | 12.32% |
| S&P Composite 1500® Hotels Restaurants & Leisure Index | 8.32% | 14.46% | 11.23% |
Performance figures do not reflect deduction of taxes a shareholder would pay on Fund distributions or sale of Fund shares.
- Effective August 28, 2024, the Fund changed its broad-based securities market benchmark from the S&P Composite 1500® Hotels Restaurants & Leisure Index to the S&P 500® Index to reflect that the S&P 500® Index can be considered more broadly representative of the overall applicable securities market.
What Are Key Statistics About The Fund?
(as of April 30, 2025)
| Fund net assets | $313,594,104 |
| Total number of portfolio holdings | 33 |
| Total advisory fees paid | $1,341,006 |
| Portfolio turnover rate | 157% |
What Comprised The Fund's Holdings?
(as of April 30, 2025)
Top ten holdings*
(% of net assets)
(% of net assets)
| DoorDash, Inc., Class A | 5.73% |
| Sysco Corp. | 5.45% |
| Royal Caribbean Cruises Ltd. | 5.14% |
| Hilton Worldwide Holdings, Inc. | 4.97% |
| Warner Bros. Discovery, Inc. | 4.61% |
| Carnival Corp. | 4.39% |
| United Airlines Holdings, Inc. | 4.05% |
| Delta Air Lines, Inc. | 3.83% |
| Sportradar Group AG | 3.49% |
| Super Group (SGHC) Ltd. | 3.34% |
| * Excluding money market fund holdings, if any. |
Sub-industry allocation
(% of net assets)
(% of net assets)
Top ten holdings*
(% of net assets)
(% of net assets)
| DoorDash, Inc., Class A | 5.73% |
| Sysco Corp. | 5.45% |
| Royal Caribbean Cruises Ltd. | 5.14% |
| Hilton Worldwide Holdings, Inc. | 4.97% |
| Warner Bros. Discovery, Inc. | 4.61% |
| Carnival Corp. | 4.39% |
| United Airlines Holdings, Inc. | 4.05% |
| Delta Air Lines, Inc. | 3.83% |
| Sportradar Group AG | 3.49% |
| Super Group (SGHC) Ltd. | 3.34% |
| * Excluding money market fund holdings, if any. |
What Were The Fund Costs For The Last Year ?
(Based on a hypothetical $10,000 investment)
| Fund | Costs of a $10,000 investment | Costs paid as a percentage of a $10,000 investment |
| Invesco Next Gen Media and Gaming ETF | $70 | 0.62%† |
|
† |
Reflects fee waivers and/or expense reimbursements, without which expenses would have been higher. |
How Did The Fund Perform During The Period?
• During the fiscal year ended April 30, 2025, U.S. equities had strong performance in the beginning with a more challenging environment at the end due to uncertainty regarding global trade and tariff policy, whereas global equities performed better toward the end of the fiscal year. During the period, movies & entertainment outperformed the broader stock market. In addition to the Fund's focus on media- and gaming-related industries, its thematic media methodology created a performance tailwind compared to the S&P Composite 1500® Media Index.
• The Fund is passively managed and seeks to track the investment results (before fees and expenses) of the STOXX World AC NexGen Media Index (the “Index”). The Fund generally will invest at least 90% of its total assets in securities that comprise the Index.
• For the fiscal year ended April 30, 2025, the Fund's performance, on a net asset value ("NAV") basis, 24.72%, differed from the return of the Index, 25.43%, primarily due to fees and expenses incurred by the Fund during the period.
What contributed to performance?
Sub-Industry Allocations | Movies & entertainment sub-industry, followed by the interactive home entertainment and technology hardware storage & peripherals sub-industries, respectively.
Positions | Netflix, Inc., a movies & entertainment company, and Spotify Technology S.A., a movies & entertainment company.
What detracted from performance?
Sub-Industry Allocations | Advertising sub-industry, followed by the consumer electronics sub-industry.
Positions | Advanced Micro Devices, Inc., a semiconductors company, and Adobe Inc., an application software company.
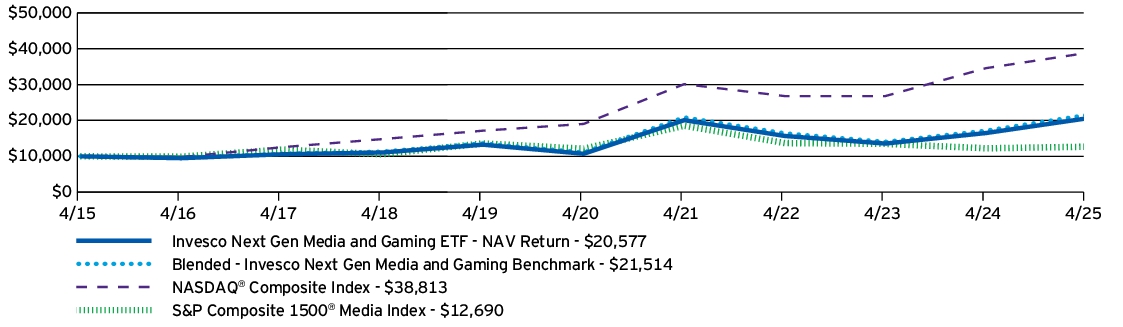
How Has The Fund Historically Performed?
Growth of $10,000 Investment
AVERAGE ANNUAL TOTAL RETURNS |
1 Year |
5 Years |
10 Years |
| Invesco Next Gen Media and Gaming ETF — NAV Return | 24.72% | 13.95% | 7.48% |
| Blended - Invesco Next Gen Media and Gaming Benchmark | 25.43% | 14.22% | 7.96% |
| NASDAQ® Composite Index | 12.22% | 15.32% | 14.52% |
| S&P Composite 1500® Media Index | 3.70% | 0.93% | 2.41% |
Performance figures do not reflect deduction of taxes a shareholder would pay on Fund distributions or sale of Fund shares.
- Effective August 28, 2024, the Fund changed its broad-based securities market benchmark from the S&P Composite 1500® Media Index to the NASDAQ® Composite Index to reflect that the NASDAQ® Composite Index can be considered more broadly representative of the overall applicable securities market.
What Are Key Statistics About The Fund?
(as of April 30, 2025)
| Fund net assets | $124,350,349 |
| Total number of portfolio holdings | 87 |
| Total advisory fees paid | $230,167 |
| Portfolio turnover rate | 33% |
What Comprised The Fund's Holdings?
(as of April 30, 2025)
Top ten holdings*
(% of net assets)
(% of net assets)
| Netflix, Inc. | 9.86% |
| Apple, Inc. | 7.87% |
| QUALCOMM, Inc. | 7.41% |
| NVIDIA Corp. | 7.31% |
| Meta Platforms, Inc., Class A | 7.21% |
| Nintendo Co. Ltd. | 5.27% |
| Spotify Technology S.A. | 4.84% |
| Adobe, Inc. | 4.33% |
| Advanced Micro Devices, Inc. | 4.33% |
| MediaTek, Inc. | 3.98% |
| * Excluding money market fund holdings, if any. |
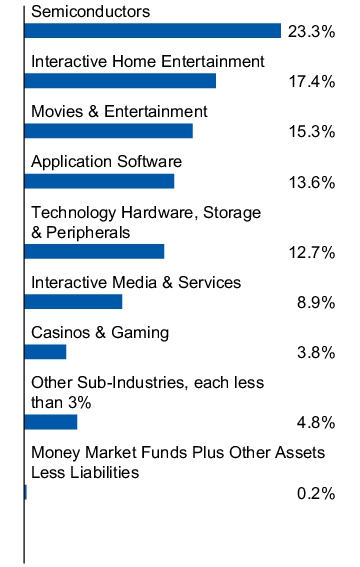
Sub-industry allocation
(% of net assets)
(% of net assets)
Top ten holdings*
(% of net assets)
(% of net assets)
| Netflix, Inc. | 9.86% |
| Apple, Inc. | 7.87% |
| QUALCOMM, Inc. | 7.41% |
| NVIDIA Corp. | 7.31% |
| Meta Platforms, Inc., Class A | 7.21% |
| Nintendo Co. Ltd. | 5.27% |
| Spotify Technology S.A. | 4.84% |
| Adobe, Inc. | 4.33% |
| Advanced Micro Devices, Inc. | 4.33% |
| MediaTek, Inc. | 3.98% |
| * Excluding money market fund holdings, if any. |
This report describes changes to the Fund that occurred during the reporting period.
What Were The Fund Costs For The Last Year ?
(Based on a hypothetical $10,000 investment)
| Fund | Costs of a $10,000 investment | Costs paid as a percentage of a $10,000 investment |
| Invesco Next Gen Connectivity ETF | $43 | 0.40% |
How Did The Fund Perform During The Period?
• During the fiscal year ended April 30, 2025, U.S. equities had strong performance in the beginning with a more challenging environment at the end due to uncertainty regarding global trade and tariff policy, whereas global equities performed better toward the end of the fiscal year. During the period, connectivity-related industries outperformed the broader stock market. In addition to the Fund's focus on connectivity-related industries, its thematic emerging connectivity methodology created a performance headwind compared to the S&P Composite 1500® Communications Equipment Index.
• The Fund is passively managed and seeks to track the investment results (before fees and expenses) of the STOXX World AC NexGen Connectivity Index (the “Index”). The Fund generally will invest at least 90% of its total assets in securities that comprise the Index.
• For the fiscal year ended April 30, 2025, the Fund's performance, on a net asset value ("NAV") basis, 17.19%, differed from the return of the Index, 17.26%, primarily due to fees and expenses incurred by the Fund during the period, partially offset by income received from the securities lending program in which the Fund participates.
What contributed to performance?
Sub-Industry Allocations | Integrated telecommunication services sub-industry, followed by the semiconductors and communications equipment sub-industries, respectively.
Positions | Broadcom, Inc., a semiconductors company, and Apple, Inc., a technology hardware storage & peripherals company.
What detracted from performance?
Sub-Industry Allocations | Internet services & infrastructure sub-industry, followed by the application software sub-industry.
Positions | Samsung Electronics Co., Ltd., a technology hardware storage & peripherals company, and Intel Corp., a semiconductors company.
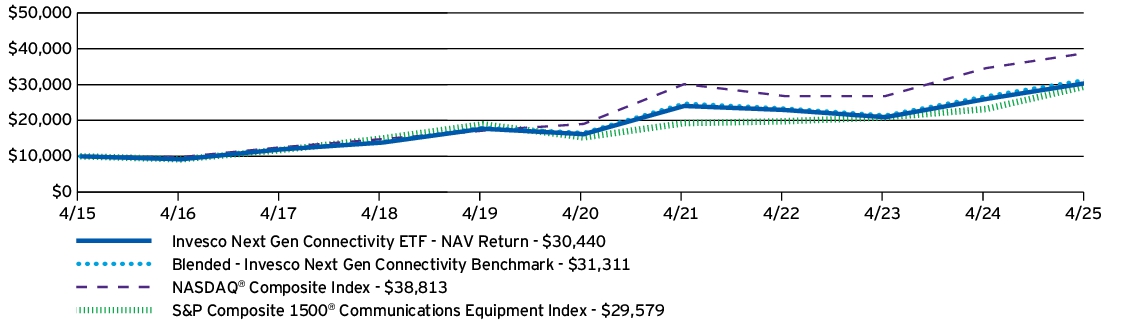
How Has The Fund Historically Performed?
Growth of $10,000 Investment
AVERAGE ANNUAL TOTAL RETURNS |
1 Year |
5 Years |
10 Years |
| Invesco Next Gen Connectivity ETF — NAV Return | 17.19% | 13.48% | 11.78% |
| Blended - Invesco Next Gen Connectivity Benchmark | 17.26% | 13.64% | 12.09% |
| NASDAQ® Composite Index | 12.22% | 15.32% | 14.52% |
| S&P Composite 1500® Communications Equipment Index | 27.52% | 14.14% | 11.45% |
Performance figures do not reflect deduction of taxes a shareholder would pay on Fund distributions or sale of Fund shares.
- Effective August 28, 2024, the Fund changed its broad-based securities market benchmark from the S&P Composite 1500® Communications Equipment Index to the NASDAQ® Composite Index to reflect that the NASDAQ® Composite Index can be considered more broadly representative of the overall applicable securities market.
What Are Key Statistics About The Fund?
(as of April 30, 2025)
| Fund net assets | $30,883,953 |
| Total number of portfolio holdings | 103 |
| Total advisory fees paid | $155,905 |
| Portfolio turnover rate | 14% |
What Comprised The Fund's Holdings?
(as of April 30, 2025)
Top ten holdings*
(% of net assets)
(% of net assets)
| Apple, Inc. | 7.95% |
| Broadcom, Inc. | 7.89% |
| Taiwan Semiconductor Manufacturing Co. Ltd. | 7.59% |
| AT&T, Inc. | 4.23% |
| Cisco Systems, Inc. | 4.14% |
| Verizon Communications, Inc. | 3.99% |
| QUALCOMM, Inc. | 3.56% |
| Samsung Electronics Co. Ltd. | 2.69% |
| Palo Alto Networks, Inc. | 2.67% |
| T-Mobile US, Inc. | 2.49% |
| * Excluding money market fund holdings, if any. |
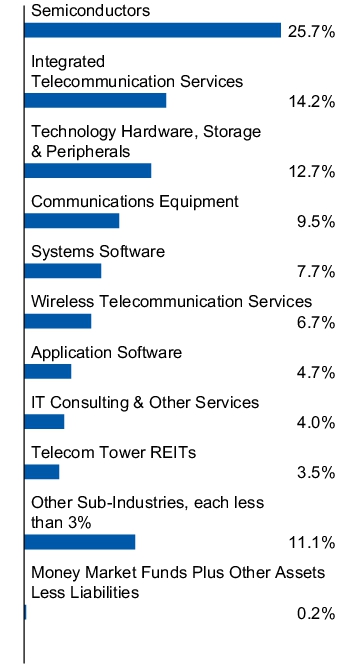
Sub-industry allocation
(% of net assets)
(% of net assets)
Top ten holdings*
(% of net assets)
(% of net assets)
| Apple, Inc. | 7.95% |
| Broadcom, Inc. | 7.89% |
| Taiwan Semiconductor Manufacturing Co. Ltd. | 7.59% |
| AT&T, Inc. | 4.23% |
| Cisco Systems, Inc. | 4.14% |
| Verizon Communications, Inc. | 3.99% |
| QUALCOMM, Inc. | 3.56% |
| Samsung Electronics Co. Ltd. | 2.69% |
| Palo Alto Networks, Inc. | 2.67% |
| T-Mobile US, Inc. | 2.49% |
| * Excluding money market fund holdings, if any. |
How Has The Fund Changed Over The Past Year?
This is a summary of certain changes to the Fund since April 30, 2024. For more complete information, you may review the Fund's prospectus, which is available at invesco.com/reports or upon request at (800) 983-0903.
The Fund's net expense ratio decreased from the prior fiscal year end as a result of a change in the Fund's investment advisory agreement which became effective on August 28, 2023.
The Fund's net expense ratio decreased from the prior fiscal year end as a result of a change in the Fund's investment advisory agreement which became effective on August 28, 2023.
This is a summary of certain changes to the Fund since April 30, 2024. For more complete information, you may review the Fund's prospectus, which is available at invesco.com/reports or upon request at (800) 983-0903.
What Were The Fund Costs For The Last Year ?
(Based on a hypothetical $10,000 investment)
| Fund | Costs of a $10,000 investment | Costs paid as a percentage of a $10,000 investment |
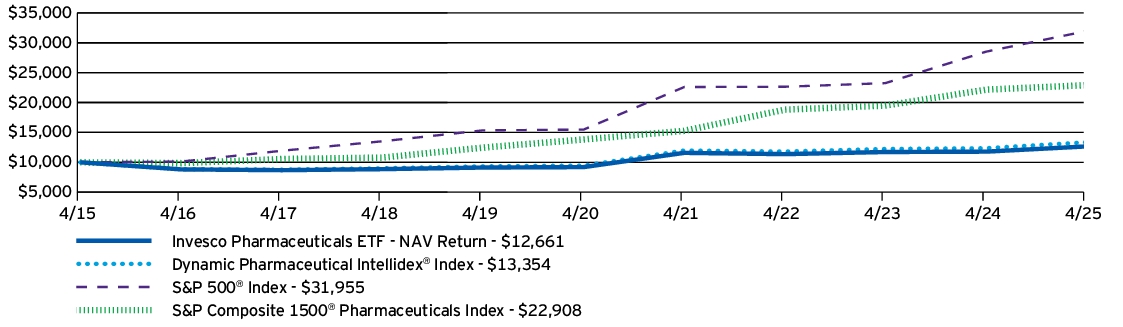
| Invesco Pharmaceuticals ETF | $59 | 0.57% |
How Did The Fund Perform During The Period?
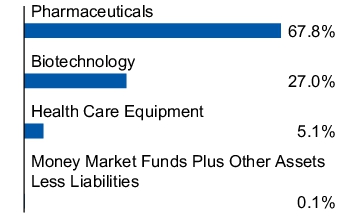
• During the fiscal year ended April 30, 2025, U.S. equities had strong performance in the beginning with a more challenging environment at the end due to uncertainty regarding global trade and tariff policy. During the period, the health care sector underperformed the broader stock market. Despite the Fund's focus on health care stocks, its multi-factor methodology led to an overweight in health care equipment, which created a performance tailwind compared to the S&P Composite 1500® Pharmaceuticals Index.
• The Fund is passively managed and seeks to track the investment results (before fees and expenses) of the Dynamic Pharmaceutical Intellidex® Index (the “Index”). The Fund generally will invest at least 90% of its total assets in securities that comprise the Index.
• For the fiscal year ended April 30, 2025, the Fund's performance, on a net asset value ("NAV") basis, 7.45%, differed from the return of the Index, 8.06%, primarily due to fees and expenses incurred by the Fund during the period.
What contributed to performance?
Sub-Industry Allocations | Pharmaceuticals sub-industry followed by the biotechnology sub-industry.
Positions | Corcept Therapeutics, Inc., a pharmaceuticals company, and Ligand Pharmaceuticals, Inc., a pharmaceuticals company.
What detracted from performance?
Sub-Industry Allocations | No sub-industries detracted from the Fund's performance during the period.
Positions | Merck & Co., Inc., a pharmaceuticals company, and Biogen, Inc., a biotechnology company.
How Has The Fund Historically Performed?
Growth of $10,000 Investment
AVERAGE ANNUAL TOTAL RETURNS |
1 Year |
5 Years |
10 Years |
| Invesco Pharmaceuticals ETF — NAV Return | 7.45% | 6.59% | 2.39% |
| Dynamic Pharmaceutical Intellidex® Index | 8.06% | 7.15% | 2.93% |
| S&P 500® Index | 12.10% | 15.61% | 12.32% |
| S&P Composite 1500® Pharmaceuticals Index | 3.40% | 10.64% | 8.64% |
Performance figures do not reflect deduction of taxes a shareholder would pay on Fund distributions or sale of Fund shares.
- Effective August 28, 2024, the Fund changed its broad-based securities market benchmark from the S&P Composite 1500® Pharmaceuticals Index to the S&P 500® Index to reflect that the S&P 500® Index can be considered more broadly representative of the overall applicable securities market.
What Are Key Statistics About The Fund?
(as of April 30, 2025)
| Fund net assets | $243,737,940 |
| Total number of portfolio holdings | 35 |
| Total advisory fees paid | $1,358,978 |
| Portfolio turnover rate | 48% |
What Comprised The Fund's Holdings?
(as of April 30, 2025)
Top ten holdings*
(% of net assets)
(% of net assets)
| Eli Lilly and Co. | 5.30% |
| Abbott Laboratories | 5.12% |
| AbbVie, Inc. | 5.08% |
| Gilead Sciences, Inc. | 5.08% |
| Johnson & Johnson | 5.00% |
| Merck & Co., Inc. | 4.96% |
| Amgen, Inc. | 4.90% |
| Pfizer, Inc. | 4.85% |
| ANI Pharmaceuticals, Inc. | 3.77% |
| Tarsus Pharmaceuticals, Inc. | 3.65% |
| * Excluding money market fund holdings, if any. |
Sub-industry allocation
(% of net assets)
(% of net assets)
Top ten holdings*
(% of net assets)
(% of net assets)
| Eli Lilly and Co. | 5.30% |
| Abbott Laboratories | 5.12% |
| AbbVie, Inc. | 5.08% |
| Gilead Sciences, Inc. | 5.08% |
| Johnson & Johnson | 5.00% |
| Merck & Co., Inc. | 4.96% |
| Amgen, Inc. | 4.90% |
| Pfizer, Inc. | 4.85% |
| ANI Pharmaceuticals, Inc. | 3.77% |
| Tarsus Pharmaceuticals, Inc. | 3.65% |
| * Excluding money market fund holdings, if any. |
What Were The Fund Costs For The Last Year ?
(Based on a hypothetical $10,000 investment)
| Fund | Costs of a $10,000 investment | Costs paid as a percentage of a $10,000 investment |
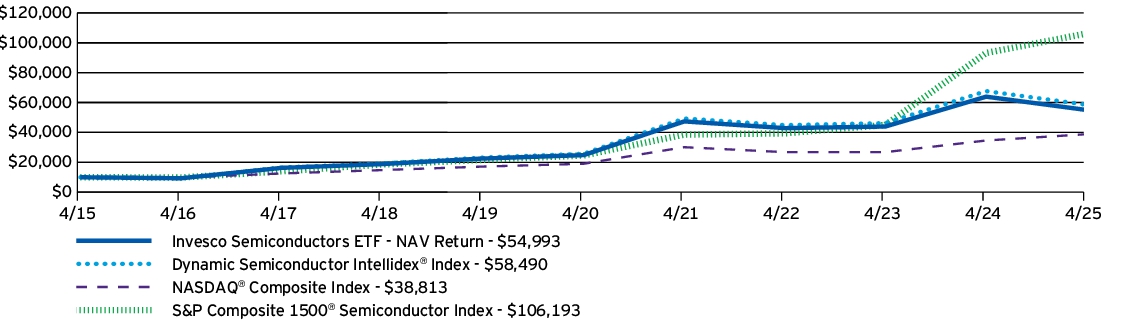
| Invesco Semiconductors ETF | $52 | 0.56% |
How Did The Fund Perform During The Period?
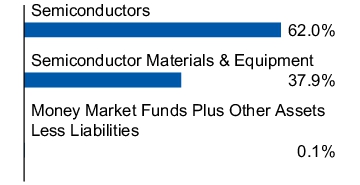
• During the fiscal year ended April 30, 2025, U.S. equities had strong performance in the beginning with a more challenging environment at the end due to uncertainty regarding global trade and tariff policy. During the period, semiconductors underperformed the broader stock market. In addition to the Fund's focus on semiconductor stocks, its multi-factor methodology created a performance headwind compared to the S&P Composite 1500® Semiconductor Index.
• The Fund is passively managed and seeks to track the investment results (before fees and expenses) of the Dynamic Semiconductor Intellidex® Index (the “Index”). The Fund generally will invest at least 90% of its total assets in securities that comprise the Index.
• For the fiscal year ended April 30, 2025, the Fund's performance, on a net asset value ("NAV") basis, -13.95%, differed from the return of the Index, -13.50%, primarily due to fees and expenses incurred by the Fund during the period.
What contributed to performance?
Sub-Industry Allocations | Electronic manufacturing services sub-industry.
Positions | Astera Labs, Inc. (no longer held at fiscal year-end), a semiconductors company, and Broadcom, Inc., a semiconductors company.
What detracted from performance?
Sub-Industry Allocations | Semiconductor materials & equipment sub-industry followed by the semiconductors sub-industry.
Positions | Ichor Holdings Ltd., a semiconductor materials & equipment company, and Texas Instruments, Inc., a semiconductors company.
How Has The Fund Historically Performed?
Growth of $10,000 Investment
AVERAGE ANNUAL TOTAL RETURNS |
1 Year |
5 Years |
10 Years |
| Invesco Semiconductors ETF — NAV Return | -13.95% | 17.25% | 18.59% |
| Dynamic Semiconductor Intellidex® Index | -13.50% | 17.90% | 19.32% |
| NASDAQ® Composite Index | 12.22% | 15.32% | 14.52% |
| S&P Composite 1500® Semiconductor Index | 14.00% | 33.96% | 26.65% |
Performance figures do not reflect deduction of taxes a shareholder would pay on Fund distributions or sale of Fund shares.
- Effective August 28, 2024, the Fund changed its broad-based securities market benchmark from the S&P Composite 1500® Semiconductor Index to the NASDAQ® Composite Index to reflect that the NASDAQ® Composite Index can be considered more broadly representative of the overall applicable securities market.
What Are Key Statistics About The Fund?
(as of April 30, 2025)
| Fund net assets | $574,820,457 |
| Total number of portfolio holdings | 33 |
| Total advisory fees paid | $3,800,130 |
| Portfolio turnover rate | 78% |
What Comprised The Fund's Holdings?
(as of April 30, 2025)
Top ten holdings*
(% of net assets)
(% of net assets)
| KLA Corp. | 5.84% |
| Broadcom, Inc. | 5.73% |
| QUALCOMM, Inc. | 5.55% |
| Applied Materials, Inc. | 5.49% |
| Lam Research Corp. | 5.38% |
| NVIDIA Corp. | 5.19% |
| Analog Devices, Inc. | 4.99% |
| Texas Instruments, Inc. | 4.82% |
| SiTime Corp. | 3.01% |
| Monolithic Power Systems, Inc. | 3.00% |
| * Excluding money market fund holdings, if any. |
Sub-industry allocation
(% of net assets)
(% of net assets)
Top ten holdings*
(% of net assets)
(% of net assets)
| KLA Corp. | 5.84% |
| Broadcom, Inc. | 5.73% |
| QUALCOMM, Inc. | 5.55% |
| Applied Materials, Inc. | 5.49% |
| Lam Research Corp. | 5.38% |
| NVIDIA Corp. | 5.19% |
| Analog Devices, Inc. | 4.99% |
| Texas Instruments, Inc. | 4.82% |
| SiTime Corp. | 3.01% |
| Monolithic Power Systems, Inc. | 3.00% |
| * Excluding money market fund holdings, if any. |
What Were The Fund Costs For The Last Year ?
(Based on a hypothetical $10,000 investment)
| Fund | Costs of a $10,000 investment | Costs paid as a percentage of a $10,000 investment |
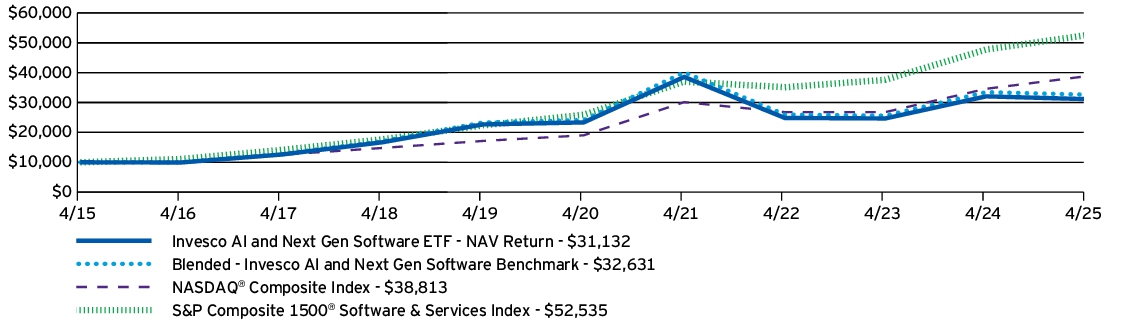
| Invesco AI and Next Gen Software ETF | $55 | 0.56% |
How Did The Fund Perform During The Period?
• During the fiscal year ended April 30, 2025, U.S. equities had strong performance in the beginning with a more challenging environment at the end due to uncertainty regarding global trade and tariff policy, whereas global equities performed better toward the end of the fiscal year. During the period, AI- and software-related industries underperformed the broader stock market. In addition to the Fund's focus on AI- and software-related industries, its thematic AI methodology created a performance headwind compared to the S&P Composite 1500® Software & Services Index.
• The Fund is passively managed and seeks to track the investment results (before fees and expenses) of the STOXX World AC NexGen Software Development Index (the “Index”). The Fund generally will invest at least 90% of its total assets in securities that comprise the Index.
• For the fiscal year ended April 30, 2025, the Fund's performance, on a net asset value ("NAV") basis, -2.88%, differed from the return of the Index, -2.51%, primarily due to fees and expenses incurred by the Fund during the period.
What contributed to performance?
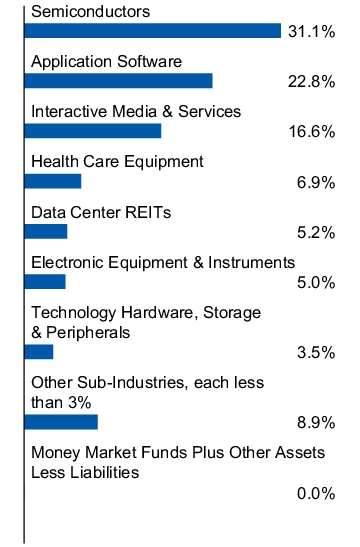
Sub-Industry Allocations | Interactive media & services sub-industry, followed by the health care equipment and application software sub-industries, respectively.
Positions | NVIDIA Corp., a semiconductors company, and Meta Platforms Inc., Class A, an interactive media & services company.
What detracted from performance?
Sub-Industry Allocations | Semiconductors sub-industry, followed by the technology hardware storage & peripherals and electronic equipment & instruments sub-industries, respectively.
Positions | Advanced Micro Devices, Inc., a semiconductors company, and Intel Corp., a semiconductors company.
How Has The Fund Historically Performed?
Growth of $10,000 Investment
AVERAGE ANNUAL TOTAL RETURNS |
1 Year |
5 Years |
10 Years |
| Invesco AI and Next Gen Software ETF — NAV Return | -2.88% | 5.93% | 12.03% |
| Blended - Invesco AI and Next Gen Software Benchmark | -2.51% | 6.22% | 12.55% |
| NASDAQ® Composite Index | 12.22% | 15.32% | 14.52% |
| S&P Composite 1500® Software & Services Index | 10.06% | 15.18% | 18.04% |
Performance figures do not reflect deduction of taxes a shareholder would pay on Fund distributions or sale of Fund shares.
- Effective August 28, 2024, the Fund changed its broad-based securities market benchmark from the S&P Composite 1500® Software & Services Index to the NASDAQ® Composite Index to reflect that the NASDAQ® Composite Index can be considered more broadly representative of the overall applicable securities market.
What Are Key Statistics About The Fund?
(as of April 30, 2025)
| Fund net assets | $382,043,613 |
| Total number of portfolio holdings | 101 |
| Total advisory fees paid | $1,948,987 |
| Portfolio turnover rate | 18% |
What Comprised The Fund's Holdings?
(as of April 30, 2025)
Top ten holdings*
(% of net assets)
(% of net assets)
| Alphabet, Inc., Class A | 7.92% |
| NVIDIA Corp. | 7.65% |
| Meta Platforms, Inc., Class A | 7.54% |
| Intuitive Surgical, Inc. | 6.93% |
| Adobe, Inc. | 6.25% |
| Advanced Micro Devices, Inc. | 5.97% |
| QUALCOMM, Inc. | 4.46% |
| MicroStrategy, Inc., Class A | 3.48% |
| Keyence Corp. | 3.33% |
| Micron Technology, Inc. | 3.28% |
| * Excluding money market fund holdings, if any. |
Sub-industry allocation
(% of net assets)
(% of net assets)
Top ten holdings*
(% of net assets)
(% of net assets)
| Alphabet, Inc., Class A | 7.92% |
| NVIDIA Corp. | 7.65% |
| Meta Platforms, Inc., Class A | 7.54% |
| Intuitive Surgical, Inc. | 6.93% |
| Adobe, Inc. | 6.25% |
| Advanced Micro Devices, Inc. | 5.97% |
| QUALCOMM, Inc. | 4.46% |
| MicroStrategy, Inc., Class A | 3.48% |
| Keyence Corp. | 3.33% |
| Micron Technology, Inc. | 3.28% |
| * Excluding money market fund holdings, if any. |
What Were The Fund Costs For The Last Year ?
(Based on a hypothetical $10,000 investment)
| Fund | Costs of a $10,000 investment | Costs paid as a percentage of a $10,000 investment |
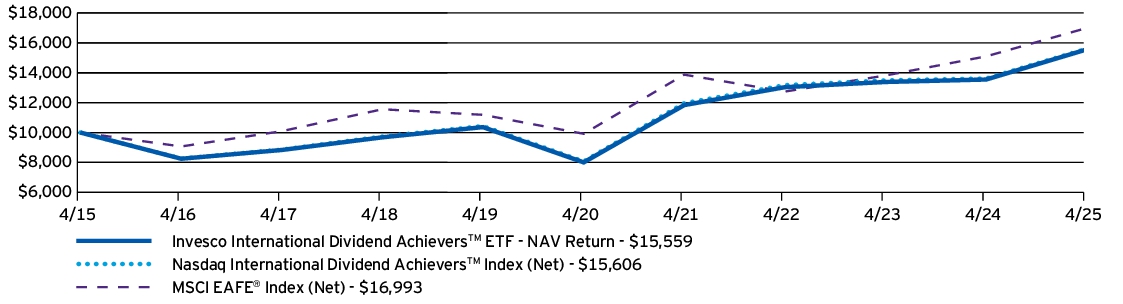
| Invesco International Dividend AchieversTM ETF | $57 | 0.53% |
How Did The Fund Perform During The Period?
• During the fiscal year ended April 30, 2025, international equities showed relatively weak performance until mounting concerns over U.S. global trade and tariff policy led to relative outperformance near the end of the period. Strong security selection results in the energy and materials sectors were supportive to the Fund's relative outperformance versus the MSCI EAFE® Index during the period.
• The Fund is passively managed and seeks to track the investment results (before fees and expenses) of the Nasdaq International Dividend AchieversTM Index (the “Index”). The Fund generally will invest at least 90% of its total assets in securities that comprise the Index.
• For the fiscal year ended April 30, 2025, the Fund's performance, on a net asset value ("NAV") basis, 14.85%, differed from the return of the Index, 14.60%, primarily due to positive differences in the tax withholding treatment of dividends between the Fund and the Index and the effect of a corporate action, which were partially offset by fees and expenses incurred by the Fund during the period.
What contributed to performance?
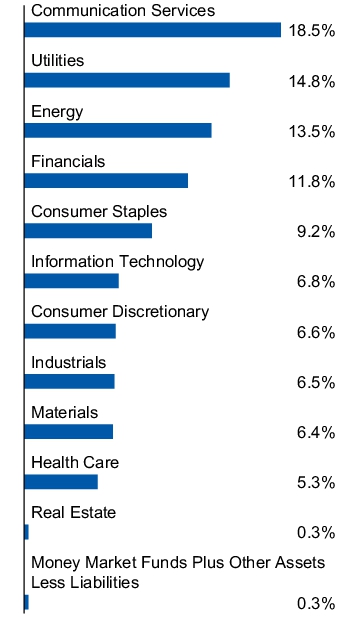
Sector Allocations | Financials sector, followed by the utilities and energy sectors, respectively.
Positions | British American Tobacco PLC, ADR, a consumer staples company, and TC Energy Corp., an energy company.
What detracted from performance?
Sector Allocations | Consumer discretionary sector, followed by the communication services sector.
Positions | BCE, Inc., a communication services company, and Magna International, Inc., a consumer discretionary company.
How Has The Fund Historically Performed?
Growth of $10,000 Investment
AVERAGE ANNUAL TOTAL RETURNS |
1 Year |
5 Years |
10 Years |
| Invesco International Dividend AchieversTM ETF — NAV Return | 14.85% | 14.22% | 4.52% |
| Nasdaq International Dividend Achievers™ Index (Net) | 14.60% | 14.10% | 4.55% |
| MSCI EAFE® Index (Net) | 12.57% | 11.37% | 5.45% |
Performance figures do not reflect deduction of taxes a shareholder would pay on Fund distributions or sale of Fund shares.
- Effective August 28, 2024, the Fund changed its broad-based securities market benchmark from the Nasdaq International Dividend Achievers™ Index (Net) to the MSCI EAFE® Index (Net) to reflect that the MSCI EAFE® Index (Net) can be considered more broadly representative of the overall applicable securities market.
What Are Key Statistics About The Fund?
(as of April 30, 2025)
| Fund net assets | $826,703,193 |
| Total number of portfolio holdings | 51 |
| Total advisory fees paid | $3,398,962 |
| Portfolio turnover rate | 42% |
What Comprised The Fund's Holdings?
(as of April 30, 2025)
Top ten holdings*
(% of net assets)
(% of net assets)
| British American Tobacco PLC, ADR | 4.35% |
| Enbridge, Inc. | 4.21% |
| PT Telkom Indonesia (Persero) Tbk, ADR | 4.18% |
| National Grid PLC, ADR | 4.12% |
| PLDT, Inc., ADR | 4.00% |
| Brookfield Renewable Partners L.P. | 3.98% |
| TC Energy Corp. | 3.91% |
| TELUS Corp. | 3.86% |
| BCE, Inc. | 3.74% |
| Canadian Natural Resources Ltd. | 3.46% |
| * Excluding money market fund holdings, if any. |
Sector allocation
(% of net assets)
(% of net assets)
Top ten holdings*
(% of net assets)
(% of net assets)
| British American Tobacco PLC, ADR | 4.35% |
| Enbridge, Inc. | 4.21% |
| PT Telkom Indonesia (Persero) Tbk, ADR | 4.18% |
| National Grid PLC, ADR | 4.12% |
| PLDT, Inc., ADR | 4.00% |
| Brookfield Renewable Partners L.P. | 3.98% |
| TC Energy Corp. | 3.91% |
| TELUS Corp. | 3.86% |
| BCE, Inc. | 3.74% |
| Canadian Natural Resources Ltd. | 3.46% |
| * Excluding money market fund holdings, if any. |
What Were The Fund Costs For The Last Year ?
(Based on a hypothetical $10,000 investment)
| Fund | Costs of a $10,000 investment | Costs paid as a percentage of a $10,000 investment |
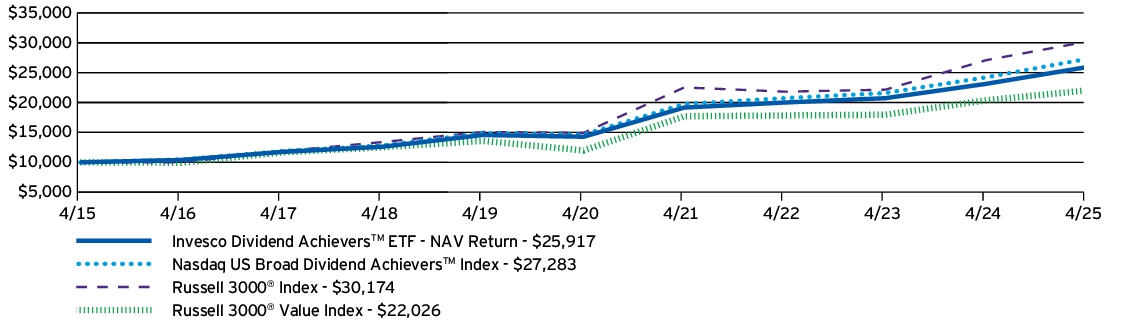
| Invesco Dividend AchieversTM ETF | $55 | 0.52% |
How Did The Fund Perform During The Period?
• During the fiscal year ended April 30, 2025, U.S. equities began the period with strong performance but experienced a more challenging environment near the end of the period due to uncertainty regarding global trade and tariff policy. The Fund outperformed the Russell 3000® Value Index primarily due to strong security selection results in the information technology sector.
• The Fund is passively managed and seeks to track the investment results (before fees and expenses) of the Nasdaq US Broad Dividend AchieversTM Index (the “Index”). The Fund generally will invest at least 90% of its total assets in securities that comprise the Index.
• For the fiscal year ended April 30, 2025, the Fund's performance, on a net asset value ("NAV") basis, 12.08%, differed from the return of the Index, 12.66%, primarily due to fees and expenses incurred by the Fund during the period.
What contributed to performance?
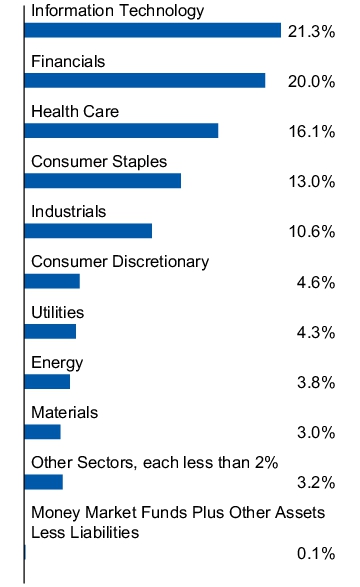
Sector Allocations | Financials sector, followed by the information technology and consumer staples sectors, respectively.
Positions | Broadcom, Inc., an information technology company, and Walmart, Inc., a consumer staples company.
What detracted from performance?
Sector Allocations | Energy sector, followed by the materials sector.
Positions | Merck & Co., Inc., a health care company, and PepsiCo, Inc., a consumer staples company.
How Has The Fund Historically Performed?
Growth of $10,000 Investment
AVERAGE ANNUAL TOTAL RETURNS |
1 Year |
5 Years |
10 Years |
| Invesco Dividend AchieversTM ETF — NAV Return | 12.08% | 12.67% | 9.99% |
| Nasdaq US Broad Dividend Achievers™ Index | 12.66% | 13.26% | 10.56% |
| Russell 3000® Index | 11.40% | 15.12% | 11.68% |
| Russell 3000® Value Index | 8.11% | 12.96% | 8.22% |
Performance figures do not reflect deduction of taxes a shareholder would pay on Fund distributions or sale of Fund shares.
- Effective August 28, 2024, the Fund changed its broad-based securities market benchmark from the Nasdaq US Broad Dividend Achievers™ Index to the Russell 3000® Index to reflect that the Russell 3000® Index can be considered more broadly representative of the overall applicable securities market.
What Are Key Statistics About The Fund?
(as of April 30, 2025)
| Fund net assets | $673,575,388 |
| Total number of portfolio holdings | 434 |
| Total advisory fees paid | $2,757,665 |
| Portfolio turnover rate | 7% |
What Comprised The Fund's Holdings?
(as of April 30, 2025)
Top ten holdings*
(% of net assets)
(% of net assets)
| Microsoft Corp. | 4.22% |
| Broadcom, Inc. | 3.90% |
| Apple, Inc. | 3.73% |
| Eli Lilly and Co. | 3.69% |
| Walmart, Inc. | 3.38% |
| JPMorgan Chase & Co. | 2.96% |
| Visa, Inc., Class A | 2.58% |
| Mastercard, Inc., Class A | 2.15% |
| Exxon Mobil Corp. | 1.98% |
| Costco Wholesale Corp. | 1.91% |
| * Excluding money market fund holdings, if any. |
Sector allocation
(% of net assets)
(% of net assets)
Top ten holdings*
(% of net assets)
(% of net assets)
| Microsoft Corp. | 4.22% |
| Broadcom, Inc. | 3.90% |
| Apple, Inc. | 3.73% |
| Eli Lilly and Co. | 3.69% |
| Walmart, Inc. | 3.38% |
| JPMorgan Chase & Co. | 2.96% |
| Visa, Inc., Class A | 2.58% |
| Mastercard, Inc., Class A | 2.15% |
| Exxon Mobil Corp. | 1.98% |
| Costco Wholesale Corp. | 1.91% |
| * Excluding money market fund holdings, if any. |
What Were The Fund Costs For The Last Year ?
(Based on a hypothetical $10,000 investment)
| Fund | Costs of a $10,000 investment | Costs paid as a percentage of a $10,000 investment |
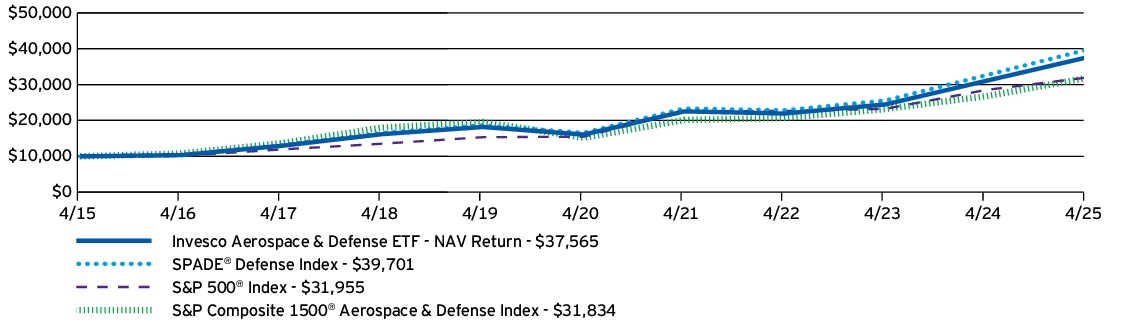
| Invesco Aerospace & Defense ETF | $64 | 0.58% |
How Did The Fund Perform During The Period?
• During the fiscal year ended April 30, 2025, U.S. equities had strong performance in the beginning with a more challenging environment at the end due to uncertainty regarding global trade and tariff policy. During the period, aerospace- and defense-related businesses outperformed the broader stock market. In addition to the Fund's focus on aerospace- and defense-related stocks, its higher allocation to the information technology sector created a performance tailwind compared to the S&P Composite 1500® Aerospace & Defense Index.
• The Fund is passively managed and seeks to track the investment results (before fees and expenses) of the SPADE® Defense Index (the “Index”). The Fund generally will invest at least 90% of its total assets in securities that comprise the Index.
• For the fiscal year ended April 30, 2025, the Fund's performance, on a net asset value ("NAV") basis, 21.03%, differed from the return of the Index, 21.75%, primarily due to fees and expenses incurred by the Fund during the period.
What contributed to performance?
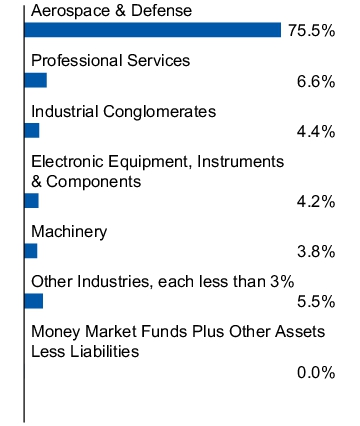
Industry Allocations | Aerospace & defense industry, followed by the software and electronic equipment instruments & components industries, respectively.
Positions | Howmet Aerospace, Inc., an aerospace & defense company, and Palantir Technologies, Inc., Class A, a software company.
What detracted from performance?
Industry Allocations | Electrical equipment industry, followed by the metals & mining and communications equipment industries, respectively.
Positions | Huntington Ingalls Industries, Inc., an aerospace & defense company, and Textron, Inc., an aerospace & defense company.
How Has The Fund Historically Performed?
Growth of $10,000 Investment
AVERAGE ANNUAL TOTAL RETURNS |
1 Year |
5 Years |
10 Years |
| Invesco Aerospace & Defense ETF — NAV Return | 21.03% | 18.52% | 14.15% |
| SPADE® Defense Index | 21.75% | 19.14% | 14.78% |
| S&P 500® Index | 12.10% | 15.61% | 12.32% |
| S&P Composite 1500® Aerospace & Defense Index | 18.93% | 15.93% | 12.28% |
Performance figures do not reflect deduction of taxes a shareholder would pay on Fund distributions or sale of Fund shares.
- Effective August 28, 2024, the Fund changed its broad-based securities market benchmark from the S&P Composite 1500® Aerospace & Defense Index to the S&P 500® Index to reflect that the S&P 500® Index can be considered more broadly representative of the overall applicable securities market.
What Are Key Statistics About The Fund?
(as of April 30, 2025)
| Fund net assets | $4,714,898,094 |
| Total number of portfolio holdings | 59 |
| Total advisory fees paid | $20,768,209 |
| Portfolio turnover rate | 15% |
What Comprised The Fund's Holdings?
(as of April 30, 2025)
Top ten holdings*
(% of net assets)
(% of net assets)
| Lockheed Martin Corp. | 7.97% |
| Boeing Co. (The) | 7.55% |
| General Electric Co. | 7.24% |
| RTX Corp. | 6.99% |
| Northrop Grumman Corp. | 5.27% |
| General Dynamics Corp. | 4.61% |
| Honeywell International, Inc. | 4.36% |
| Howmet Aerospace, Inc. | 4.09% |
| L3Harris Technologies, Inc. | 4.09% |
| TransDigm Group, Inc. | 4.06% |
| * Excluding money market fund holdings, if any. |
Industry allocation
(% of net assets)
(% of net assets)
Top ten holdings*
(% of net assets)
(% of net assets)
| Lockheed Martin Corp. | 7.97% |
| Boeing Co. (The) | 7.55% |
| General Electric Co. | 7.24% |
| RTX Corp. | 6.99% |
| Northrop Grumman Corp. | 5.27% |
| General Dynamics Corp. | 4.61% |
| Honeywell International, Inc. | 4.36% |
| Howmet Aerospace, Inc. | 4.09% |
| L3Harris Technologies, Inc. | 4.09% |
| TransDigm Group, Inc. | 4.06% |
| * Excluding money market fund holdings, if any. |
What Were The Fund Costs For The Last Year ?
(Based on a hypothetical $10,000 investment)
| Fund | Costs of a $10,000 investment | Costs paid as a percentage of a $10,000 investment |
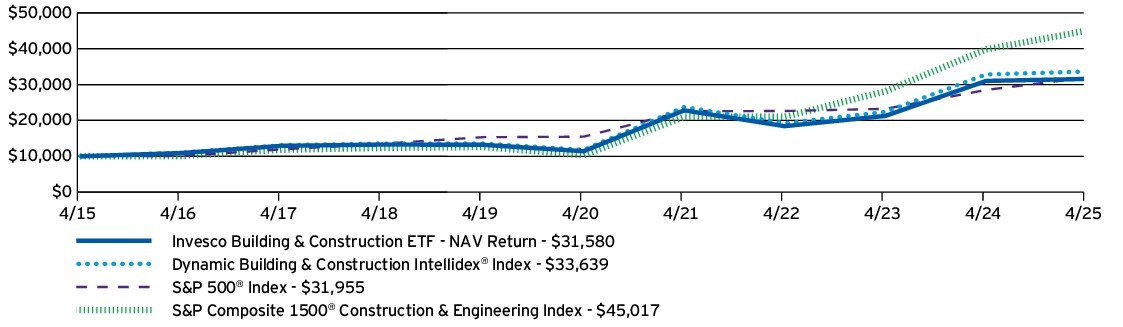
| Invesco Building & Construction ETF | $58 | 0.57% |
How Did The Fund Perform During The Period?
• During the fiscal year ended April 30, 2025, U.S. equities had strong performance in the beginning with a more challenging environment at the end due to uncertainty regarding global trade and tariff policy. During the period, the materials sector underperformed the broader stock market. In addition to the Fund's focus on materials, its multi-factor methodology led to an overweight in homebuilding stocks, which created a performance headwind compared to the S&P Composite 1500® Construction & Engineering Index.
• The Fund is passively managed and seeks to track the investment results (before fees and expenses) of the Dynamic Building & Construction Intellidex® Index (the “Index”). The Fund generally will invest at least 90% of its total assets in securities that comprise the Index.
• For the fiscal year ended April 30, 2025, the Fund's performance, on a net asset value ("NAV") basis, 1.85%, differed from the return of the Index, 2.50%, primarily due to fees and expenses incurred by the Fund during the period.
What contributed to performance?
Sub-Industry Allocations | Construction & engineering sub-industry, followed by the construction materials and office services & supplies sub-industries, respectively.
Positions | Argan, Inc., a construction & engineering company, and United States Lime & Minerals, Inc., a construction materials company.
What detracted from performance?
Sub-Industry Allocations | Building products sub-industry, followed by the homebuilding and home improvement retail sub-industries, respectively.
Positions | IES Holdings, Inc., a construction & engineering company (no longer held at fiscal year-end), and EMCOR Group, Inc., a construction & engineering company.
How Has The Fund Historically Performed?
Growth of $10,000 Investment
AVERAGE ANNUAL TOTAL RETURNS |
1 Year |
5 Years |
10 Years |
| Invesco Building & Construction ETF — NAV Return | 1.85% | 22.57% | 12.19% |
| Dynamic Building & Construction Intellidex® Index | 2.50% | 23.30% | 12.90% |
| S&P 500® Index | 12.10% | 15.61% | 12.32% |
| S&P Composite 1500® Construction & Engineering Index | 13.11% | 34.30% | 16.24% |
Performance figures do not reflect deduction of taxes a shareholder would pay on Fund distributions or sale of Fund shares.
- Effective August 28, 2024, the Fund changed its broad-based securities market benchmark from the S&P Composite 1500® Construction & Engineering Index to the S&P 500® Index to reflect that the S&P 500® Index can be considered more broadly representative of the overall applicable securities market.
What Are Key Statistics About The Fund?
(as of April 30, 2025)
| Fund net assets | $205,158,638 |
| Total number of portfolio holdings | 33 |
| Total advisory fees paid | $1,714,800 |
| Portfolio turnover rate | 151% |
What Comprised The Fund's Holdings?
(as of April 30, 2025)
Top ten holdings*
(% of net assets)
(% of net assets)
| Trane Technologies PLC | 5.58% |
| Martin Marietta Materials, Inc. | 5.42% |
| Vulcan Materials Co. | 5.33% |
| EMCOR Group, Inc. | 5.11% |
| Johnson Controls International PLC | 5.08% |
| CRH PLC | 4.83% |
| Lowe's Cos., Inc. | 4.68% |
| Home Depot, Inc. (The) | 4.65% |
| Sterling Infrastructure, Inc. | 3.57% |
| Argan, Inc. | 3.38% |
| * Excluding money market fund holdings, if any. |
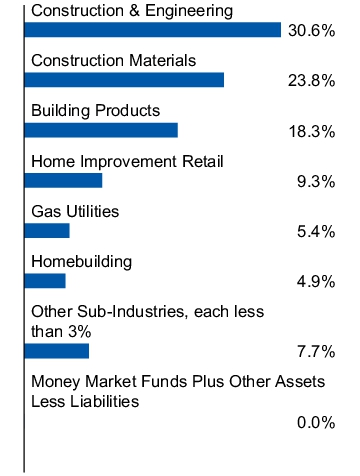
Sub-industry allocation
(% of net assets)
(% of net assets)
Top ten holdings*
(% of net assets)
(% of net assets)
| Trane Technologies PLC | 5.58% |
| Martin Marietta Materials, Inc. | 5.42% |
| Vulcan Materials Co. | 5.33% |
| EMCOR Group, Inc. | 5.11% |
| Johnson Controls International PLC | 5.08% |
| CRH PLC | 4.83% |
| Lowe's Cos., Inc. | 4.68% |
| Home Depot, Inc. (The) | 4.65% |
| Sterling Infrastructure, Inc. | 3.57% |
| Argan, Inc. | 3.38% |
| * Excluding money market fund holdings, if any. |
What Were The Fund Costs For The Last Year ?
(Based on a hypothetical $10,000 investment)
| Fund | Costs of a $10,000 investment | Costs paid as a percentage of a $10,000 investment |
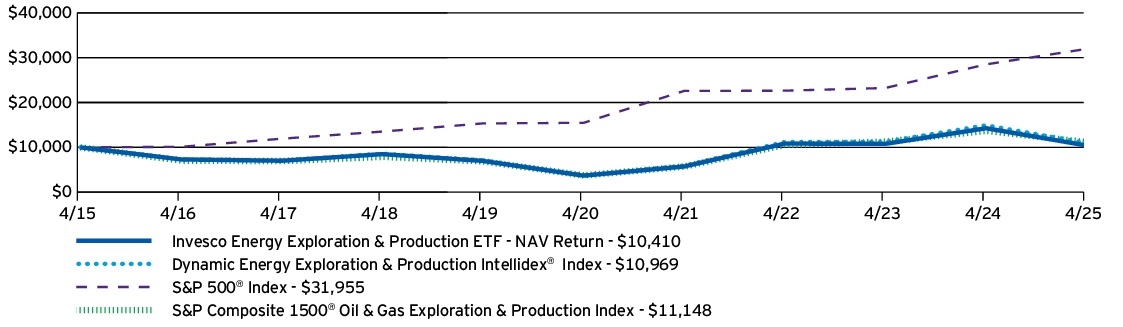
| Invesco Energy Exploration & Production ETF | $53 | 0.61% |
How Did The Fund Perform During The Period?
• During the fiscal year ended April 30, 2025, U.S. equities had strong performance in the beginning with a more challenging environment at the end due to uncertainty regarding global trade and tariff policy. During the period, the energy sector underperformed the broader stock market. In addition to the Fund's focus on energy stocks, its multi-factor methodology led to an overweight in oil & gas refining, which created a performance headwind compared to the S&P Composite 1500® Oil & Gas Exploration & Production Index.
• The Fund is passively managed and seeks to track the investment results (before fees and expenses) of the Dynamic Energy Exploration & Production Intellidex® Index (the “Index”). The Fund generally will invest at least 90% of its total assets in securities that comprise the Index.
• For the fiscal year ended April 30, 2025, the Fund's performance, on a net asset value ("NAV") basis, -27.01%, differed from the return of the Index, -26.58%, primarily due to fees and expenses incurred by the Fund during the period.
What contributed to performance?
Sub-Industry Allocations | Gas utilities sub-industry.
Positions | National Fuel Gas Co., a gas utilities company, and CNX Resources Corp., an oil & gas exploration & production company.
What detracted from performance?
Sub-Industry Allocations | Oil & gas exploration & production sub-industry, followed by the oil & gas refining & marketing and integrated oil & gas sub-industries, respectively.
Positions | Devon Energy Corp., an oil & gas exploration & production company, and Vital Energy, Inc., an oil & gas exploration & production company (no longer held at fiscal year-end).
How Has The Fund Historically Performed?
Growth of $10,000 Investment
AVERAGE ANNUAL TOTAL RETURNS |
1 Year |
5 Years |
10 Years |
| Invesco Energy Exploration & Production ETF — NAV Return | -27.01% | 23.03% | 0.40% |
| Dynamic Energy Exploration & Production Intellidex® Index | -26.58% | 23.77% | 0.93% |
| S&P 500® Index | 12.10% | 15.61% | 12.32% |
| S&P Composite 1500® Oil & Gas Exploration & Production Index | -18.62% | 24.37% | 1.09% |
Performance figures do not reflect deduction of taxes a shareholder would pay on Fund distributions or sale of Fund shares.
- Effective August 28, 2024, the Fund changed its broad-based securities market benchmark from the S&P Composite 1500® Oil & Gas Exploration & Production Index to the S&P 500® Index to reflect that the S&P 500® Index can be considered more broadly representative of the overall applicable securities market.
What Are Key Statistics About The Fund?
(as of April 30, 2025)
| Fund net assets | $71,299,950 |
| Total number of portfolio holdings | 33 |
| Total advisory fees paid | $569,920 |
| Portfolio turnover rate | 75% |
What Comprised The Fund's Holdings?
(as of April 30, 2025)
Top ten holdings*
(% of net assets)
(% of net assets)
| EQT Corp. | 6.07% |
| Expand Energy Corp. | 6.06% |
| Marathon Petroleum Corp. | 5.47% |
| Coterra Energy, Inc. | 5.38% |
| Valero Energy Corp. | 5.21% |
| Devon Energy Corp. | 5.08% |
| EOG Resources, Inc. | 5.04% |
| Phillips 66 | 4.95% |
| National Fuel Gas Co. | 3.39% |
| CNX Resources Corp. | 3.18% |
| * Excluding money market fund holdings, if any. |
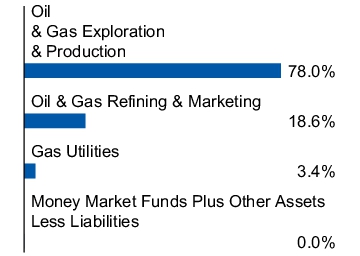
Sub-industry allocation
(% of net assets)
(% of net assets)
Top ten holdings*
(% of net assets)
(% of net assets)
| EQT Corp. | 6.07% |
| Expand Energy Corp. | 6.06% |
| Marathon Petroleum Corp. | 5.47% |
| Coterra Energy, Inc. | 5.38% |
| Valero Energy Corp. | 5.21% |
| Devon Energy Corp. | 5.08% |
| EOG Resources, Inc. | 5.04% |
| Phillips 66 | 4.95% |
| National Fuel Gas Co. | 3.39% |
| CNX Resources Corp. | 3.18% |
| * Excluding money market fund holdings, if any. |
What Were The Fund Costs For The Last Year ?
(Based on a hypothetical $10,000 investment)
| Fund | Costs of a $10,000 investment | Costs paid as a percentage of a $10,000 investment |
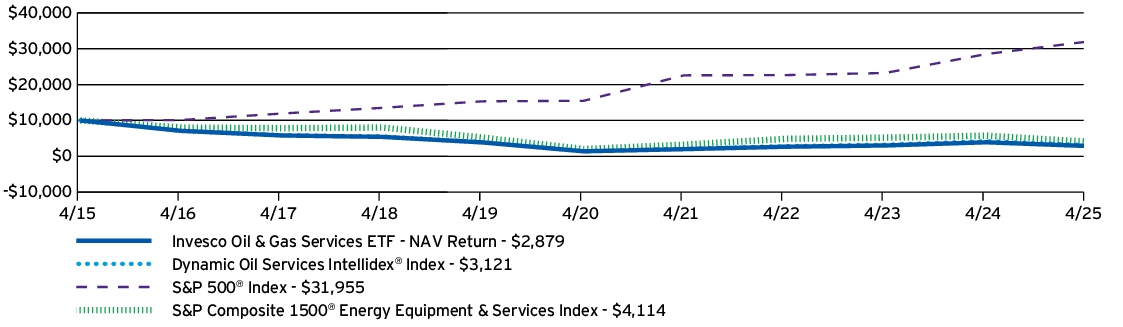
| Invesco Oil & Gas Services ETF | $55 | 0.63%† |
|
† |
Reflects fee waivers and/or expense reimbursements, without which expenses would have been higher. |
How Did The Fund Perform During The Period?
• During the fiscal year ended April 30, 2025, U.S. equities had strong performance in the beginning with a more challenging environment at the end due to uncertainty regarding global trade and tariff policy. During the period, the energy sector underperformed the broader stock market. Despite the Fund's focus on energy stocks, its multi-factor methodology led to an overweight in consumable fuels, which created a performance tailwind compared to the S&P Composite 1500® Energy Equipment & Services Index.
• The Fund is passively managed and seeks to track the investment results (before fees and expenses) of the Dynamic Oil Services Intellidex® Index (the “Index”). The Fund generally will invest at least 90% of its total assets in securities that comprise the Index.
• For the fiscal year ended April 30, 2025, the Fund's performance, on a net asset value ("NAV") basis, -26.48%, differed from the return of the Index, -26.02%, primarily due to fees and expenses incurred by the Fund during the period, which were partially offset by the effect of daily compounding during a period of weak performance.
What contributed to performance?
Sub-Industry Allocations | No sub-industries contributed to the Fund's performance during the period.
Positions | Golar LNG Ltd., an oil & gas storage & transportation company, and Kodiak Gas Services, Inc., an oil & gas equipment & services company.
What detracted from performance?
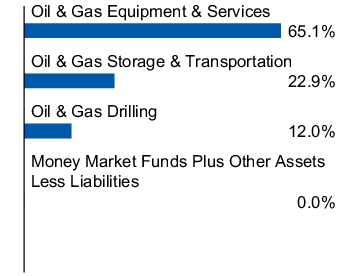
Sub-Industry Allocations | Oil & gas equipment & services sub-industry, followed by the oil & gas drilling and oil & gas storage & transportation sub-industries, respectively.
Positions | Weatherford International PLC, an oil & gas equipment & services company, and Tidewater, Inc., an oil & gas equipment & services company.
How Has The Fund Historically Performed?
Growth of $10,000 Investment
AVERAGE ANNUAL TOTAL RETURNS |
1 Year |
5 Years |
10 Years |
| Invesco Oil & Gas Services ETF — NAV Return | -26.48% | 15.54% | -11.71% |
| Dynamic Oil Services Intellidex® Index | -26.02% | 16.71% | -10.99% |
| S&P 500® Index | 12.10% | 15.61% | 12.32% |
| S&P Composite 1500® Energy Equipment & Services Index | -28.41% | 15.21% | -8.50% |
Performance figures do not reflect deduction of taxes a shareholder would pay on Fund distributions or sale of Fund shares.
- Effective August 28, 2024, the Fund changed its broad-based securities market benchmark from the S&P Composite 1500® Energy Equipment & Services Index to the S&P 500® Index to reflect that the S&P 500® Index can be considered more broadly representative of the overall applicable securities market.
What Are Key Statistics About The Fund?
(as of April 30, 2025)
| Fund net assets | $25,296,230 |
| Total number of portfolio holdings | 33 |
| Total advisory fees paid | $278,493 |
| Portfolio turnover rate | 71% |
What Comprised The Fund's Holdings?
(as of April 30, 2025)
Top ten holdings*
(% of net assets)
(% of net assets)
| TechnipFMC PLC | 6.16% |
| Archrock, Inc. | 5.42% |
| Schlumberger N.V. | 4.93% |
| Noble Corp. PLC | 4.93% |
| Baker Hughes Co., Class A | 4.89% |
| NOV, Inc. | 4.72% |
| Halliburton Co. | 4.60% |
| Weatherford International PLC | 3.94% |
| Golar LNG Ltd. | 3.69% |
| Teekay Tankers Ltd., Class A | 3.52% |
| * Excluding money market fund holdings, if any. |
Sub-industry allocation
(% of net assets)
(% of net assets)
Top ten holdings*
(% of net assets)
(% of net assets)
| TechnipFMC PLC | 6.16% |
| Archrock, Inc. | 5.42% |
| Schlumberger N.V. | 4.93% |
| Noble Corp. PLC | 4.93% |
| Baker Hughes Co., Class A | 4.89% |
| NOV, Inc. | 4.72% |
| Halliburton Co. | 4.60% |
| Weatherford International PLC | 3.94% |
| Golar LNG Ltd. | 3.69% |
| Teekay Tankers Ltd., Class A | 3.52% |
| * Excluding money market fund holdings, if any. |
What Were The Fund Costs For The Last Year ?
(Based on a hypothetical $10,000 investment)
| Fund | Costs of a $10,000 investment | Costs paid as a percentage of a $10,000 investment |
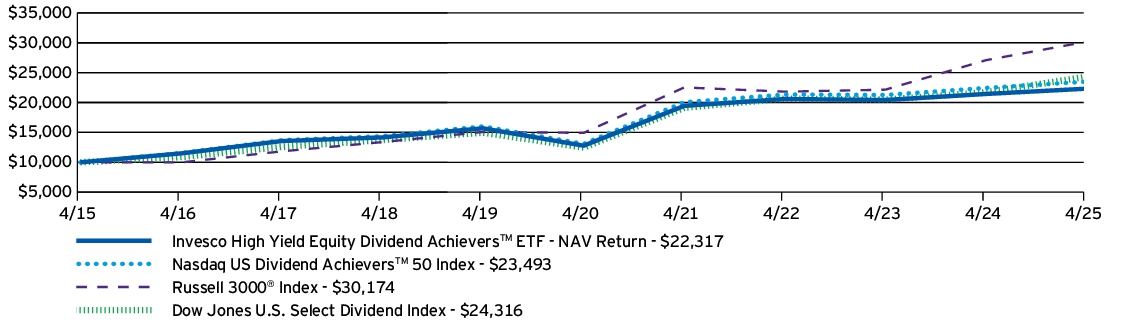
| Invesco High Yield Equity Dividend AchieversTM ETF | $53 | 0.52% |
How Did The Fund Perform During The Period?
• During the fiscal year ended April 30, 2025, U.S. equities began the period with strong performance but experienced a more challenging environment near the end of the period due to uncertainty regarding global trade and tariff policy. Negative security selection results in all sectors except for information technology caused a significant relative performance headwind for the Fund against the Dow Jones U.S. Select Dividend Index for the period.
• The Fund is passively managed and seeks to track the investment results (before fees and expenses) of the Nasdaq US Dividend Achievers 50TM Index (the “Index”). The Fund generally will invest at least 90% of its total assets in securities that comprise the Index.
• For the fiscal year ended April 30, 2025, the Fund's performance, on a net asset value ("NAV") basis, 4.12%, differed from the return of the Index, 4.67%, primarily due to fees and expenses incurred by the Fund during the period.
What contributed to performance?
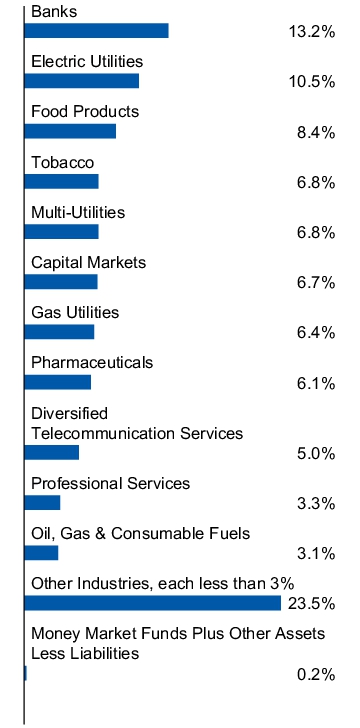
Industry Allocations | Banks industry, followed by the tobacco and electric utilities industries, respectively.
Positions | Altria Group, Inc., a tobacco company, and Philip Morris International, Inc., a tobacco company (no longer held at fiscal year-end).
What detracted from performance?
Industry Allocations | Professional services industry, followed by the consumer staples distribution & retail and chemicals industries, respectively.
Positions | Walgreens Boots Alliance, Inc., a consumer staples distribution & retail company (no longer held at fiscal year-end), and Leggett & Platt, Inc., a household durables company (no longer held at fiscal year-end).
How Has The Fund Historically Performed?
Growth of $10,000 Investment
AVERAGE ANNUAL TOTAL RETURNS |
1 Year |
5 Years |
10 Years |
| Invesco High Yield Equity Dividend AchieversTM ETF — NAV Return | 4.12% | 11.80% | 8.36% |
| Nasdaq US Dividend Achievers™ 50 Index | 4.67% | 12.39% | 8.92% |
| Russell 3000® Index | 11.40% | 15.12% | 11.68% |
| Dow Jones U.S. Select Dividend Index | 12.00% | 14.29% | 9.29% |
Performance figures do not reflect deduction of taxes a shareholder would pay on Fund distributions or sale of Fund shares.
- Effective August 28, 2024, the Fund changed its broad-based securities market benchmark from the Nasdaq US Dividend Achievers™ 50 Index to the Russell 3000® Index to reflect that the Russell 3000® Index can be considered more broadly representative of the overall applicable securities market.
What Are Key Statistics About The Fund?
(as of April 30, 2025)
| Fund net assets | $1,089,361,259 |
| Total number of portfolio holdings | 53 |
| Total advisory fees paid | $4,811,035 |
| Portfolio turnover rate | 58% |
What Comprised The Fund's Holdings?
(as of April 30, 2025)
Top ten holdings*
(% of net assets)
(% of net assets)
| Altria Group, Inc. | 3.65% |
| Universal Corp. | 3.16% |
| Verizon Communications, Inc. | 3.07% |
| Pfizer, Inc. | 2.84% |
| Edison International | 2.76% |
| Franklin Resources, Inc. | 2.75% |
| LyondellBasell Industries N.V., Class A | 2.50% |
| AES Corp. (The) | 2.49% |
| Northwest Natural Holding Co. | 2.43% |
| Avista Corp. | 2.39% |
| * Excluding money market fund holdings, if any. |
Industry allocation
(% of net assets)
(% of net assets)
Top ten holdings*
(% of net assets)
(% of net assets)
| Altria Group, Inc. | 3.65% |
| Universal Corp. | 3.16% |
| Verizon Communications, Inc. | 3.07% |
| Pfizer, Inc. | 2.84% |
| Edison International | 2.76% |
| Franklin Resources, Inc. | 2.75% |
| LyondellBasell Industries N.V., Class A | 2.50% |
| AES Corp. (The) | 2.49% |
| Northwest Natural Holding Co. | 2.43% |
| Avista Corp. | 2.39% |
| * Excluding money market fund holdings, if any. |
What Were The Fund Costs For The Last Year ?
(Based on a hypothetical $10,000 investment)
| Fund | Costs of a $10,000 investment | Costs paid as a percentage of a $10,000 investment |
| Invesco Dorsey Wright Utilities Momentum ETF | $67 | 0.60%† |
|
† |
Reflects fee waivers and/or expense reimbursements, without which expenses would have been higher. |
How Did The Fund Perform During The Period?
• During the fiscal year ended April 30, 2025, U.S. equities had strong performance in the beginning with a more challenging environment at the end due to uncertainty regarding global trade and tariff policy. During the period, utilities outperformed the broader stock market. In addition to the Fund's focus on utilities stocks, its momentum methodology created a performance tailwind compared to the S&P 500® Utilities Index.
• The Fund is passively managed and seeks to track the investment results (before fees and expenses) of the Dorsey Wright Utilities Technical LeadersTM Index (the “Index”). The Fund generally will invest at least 90% of its total assets in securities that comprise the Index.
• For the fiscal year ended April 30, 2025, the Fund's performance, on a net asset value ("NAV") basis, 23.05%, differed from the return of the Index, 23.85%, primarily due to fees and expenses incurred by the Fund during the period.
What contributed to performance?
Sub-Industry Allocations | Electric utilities sub-industry, followed by the multi-utilities and integrated telecommunication services sub-industries, respectively.
Positions | Vistra Corp., an independent power producers & energy traders company (no longer held at fiscal year-end), and AT&T, Inc., an integrated telecommunication services company.
What detracted from performance?
Sub-Industry Allocations | Renewable electricity sub-industry followed by the alternative carriers sub-industry.
Positions | Sunnova Energy International, Inc., a renewable electricity company (no longer held at fiscal year-end), and Lumen Technologies, Inc., an alternative carriers company (no longer held at fiscal year-end).
How Has The Fund Historically Performed?
Growth of $10,000 Investment
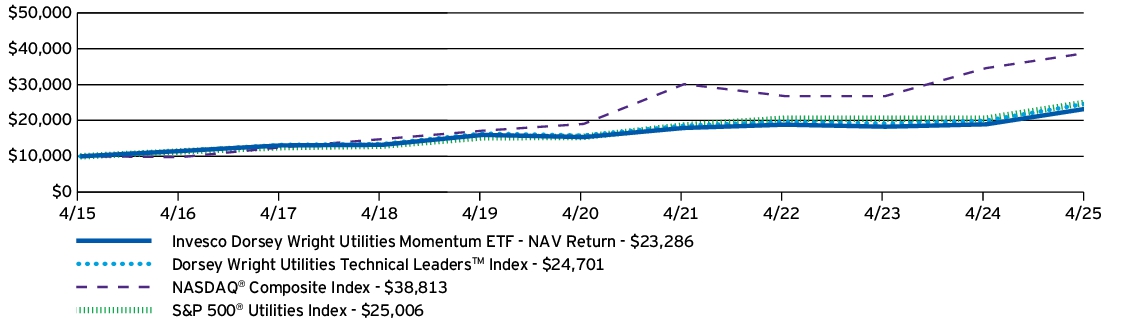
AVERAGE ANNUAL TOTAL RETURNS |
1 Year |
5 Years |
10 Years |
| Invesco Dorsey Wright Utilities Momentum ETF — NAV Return | 23.05% | 8.68% | 8.82% |
| Dorsey Wright Utilities Technical Leaders™ Index | 23.85% | 9.33% | 9.46% |
| NASDAQ® Composite Index | 12.22% | 15.32% | 14.52% |
| S&P 500® Utilities Index | 21.98% | 10.14% | 9.60% |
Performance figures do not reflect deduction of taxes a shareholder would pay on Fund distributions or sale of Fund shares.
- Effective August 28, 2024, the Fund changed its broad-based securities market benchmark from the S&P 500® Utilities Index to the NASDAQ® Composite Index to reflect that the NASDAQ® Composite Index can be considered more broadly representative of the overall applicable securities market.
What Are Key Statistics About The Fund?
(as of April 30, 2025)
| Fund net assets | $70,184,216 |
| Total number of portfolio holdings | 36 |
| Total advisory fees paid | $148,960 |
| Portfolio turnover rate | 53% |
What Comprised The Fund's Holdings?
(as of April 30, 2025)
Top ten holdings*
(% of net assets)
(% of net assets)
| GE Vernova, Inc. | 4.37% |
| Atmos Energy Corp. | 4.25% |
| Southern Co. (The) | 4.10% |
| NiSource, Inc. | 3.84% |
| Duke Energy Corp. | 3.83% |
| WEC Energy Group, Inc. | 3.81% |
| NextEra Energy, Inc. | 3.64% |
| DTE Energy Co. | 3.53% |
| AT&T, Inc. | 3.52% |
| American Water Works Co., Inc. | 3.49% |
| * Excluding money market fund holdings, if any. |
Sub-industry allocation
(% of net assets)
(% of net assets)
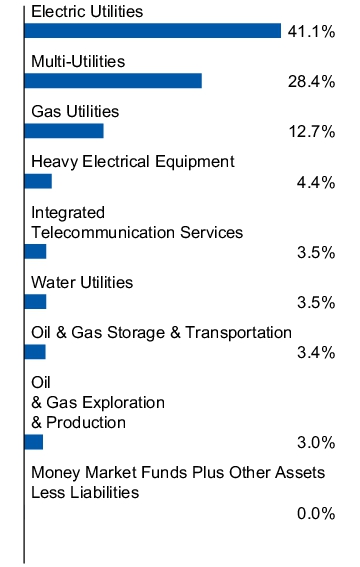
Top ten holdings*
(% of net assets)
(% of net assets)
| GE Vernova, Inc. | 4.37% |
| Atmos Energy Corp. | 4.25% |
| Southern Co. (The) | 4.10% |
| NiSource, Inc. | 3.84% |
| Duke Energy Corp. | 3.83% |
| WEC Energy Group, Inc. | 3.81% |
| NextEra Energy, Inc. | 3.64% |
| DTE Energy Co. | 3.53% |
| AT&T, Inc. | 3.52% |
| American Water Works Co., Inc. | 3.49% |
| * Excluding money market fund holdings, if any. |
What Were The Fund Costs For The Last Year ?
(Based on a hypothetical $10,000 investment)
| Fund | Costs of a $10,000 investment | Costs paid as a percentage of a $10,000 investment |
| Invesco Water Resources ETF | $60 | 0.59% |
How Did The Fund Perform During The Period?
• During the fiscal year ended April 30, 2025, water has lagged broader U.S. equity markets during the period, however, it has begun to show its defensive nature as volatility began to pick up in 2025. Utilities have outpaced industrials during the period, particularly showing resilience towards the tariff environment. The Fund's overweight to the utilities sector helped to offset negative effects from security selection and allocation to the industrials sector. While the Fund underperformed the S&P 500® Index during the fiscal year, the water theme's generally inelastic demand profile has led to strong returns versus the S&P 500® Index year-to-date.
• The Fund is passively managed and seeks to track the investment results (before fees and expenses) of the Nasdaq OMX US WaterTM Index (the “Index”). The Fund generally will invest at least 90% of its total assets in securities that comprise the Index.
• For the fiscal year ended April 30, 2025, the Fund's performance, on a net asset value ("NAV") basis, 2.36%, differed from the return of the Index, 2.99%, primarily due to fees and expenses incurred by the Fund during the period.
What contributed to performance?
Industry Allocations | Water utilities industry, followed by the construction & engineering industry.
Positions | American Water Works Co., Inc., a water utilities company, and Valmont Industries, Inc., a construction & engineering company.
What detracted from performance?
Industry Allocations | Building products industry, followed by the trading companies & distributors industry.
Positions | Ferguson Enterprises, Inc., a trading companies & distributors company, and Advanced Drainage Systems, Inc., a building products company.
How Has The Fund Historically Performed?
Growth of $10,000 Investment
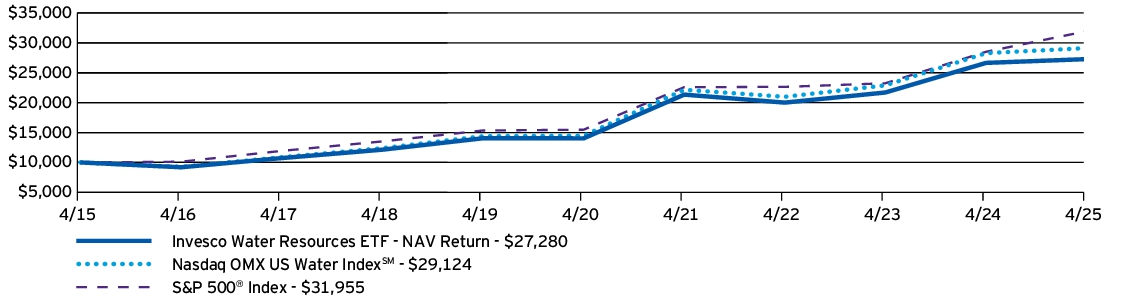
AVERAGE ANNUAL TOTAL RETURNS |
1 Year |
5 Years |
10 Years |
| Invesco Water Resources ETF — NAV Return | 2.36% | 14.22% | 10.56% |
| Nasdaq OMX US Water Index℠ | 2.99% | 15.01% | 11.28% |
| S&P 500® Index | 12.10% | 15.61% | 12.32% |
Performance figures do not reflect deduction of taxes a shareholder would pay on Fund distributions or sale of Fund shares.
What Are Key Statistics About The Fund?
(as of April 30, 2025)
| Fund net assets | $2,057,899,753 |
| Total number of portfolio holdings | 41 |
| Total advisory fees paid | $10,909,903 |
| Portfolio turnover rate | 25% |
What Comprised The Fund's Holdings?
(as of April 30, 2025)
Top ten holdings*
(% of net assets)
(% of net assets)
| Roper Technologies, Inc. | 7.88% |
| Ferguson Enterprises, Inc. | 7.86% |
| Ecolab, Inc. | 7.69% |
| Waters Corp. | 6.57% |
| Xylem, Inc. | 6.31% |
| American Water Works Co., Inc. | 4.45% |
| Tetra Tech, Inc. | 4.40% |
| Core & Main, Inc., Class A | 4.25% |
| A.O. Smith Corp. | 4.20% |
| AECOM | 4.06% |
| * Excluding money market fund holdings, if any. |
Industry allocation
(% of net assets)
(% of net assets)
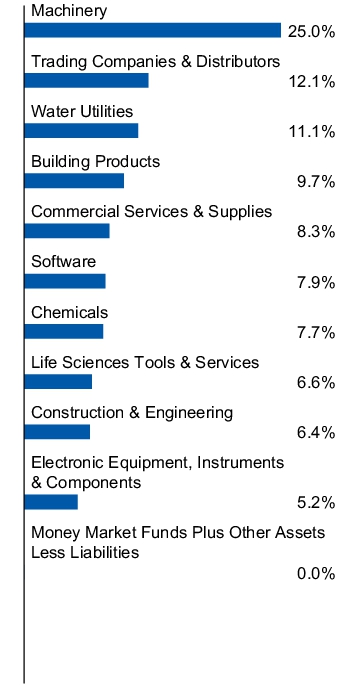
Top ten holdings*
(% of net assets)
(% of net assets)
| Roper Technologies, Inc. | 7.88% |
| Ferguson Enterprises, Inc. | 7.86% |
| Ecolab, Inc. | 7.69% |
| Waters Corp. | 6.57% |
| Xylem, Inc. | 6.31% |
| American Water Works Co., Inc. | 4.45% |
| Tetra Tech, Inc. | 4.40% |
| Core & Main, Inc., Class A | 4.25% |
| A.O. Smith Corp. | 4.20% |
| AECOM | 4.06% |
| * Excluding money market fund holdings, if any. |
What Were The Fund Costs For The Last Year ?
(Based on a hypothetical $10,000 investment)
| Fund | Costs of a $10,000 investment | Costs paid as a percentage of a $10,000 investment |
| Invesco S&P 500® Quality ETF | $16 | 0.15%† |
|
† |
Reflects fee waivers and/or expense reimbursements, without which expenses would have been higher. |
How Did The Fund Perform During The Period?
• During the fiscal year ended April 30, 2025, U.S. equities began the period with strong performance but experienced a more challenging environment near the end of the period due to uncertainty regarding global trade and tariff policy. During the period, securities with greater exposure to the quality factor, a composite measure of return-on-equity, leverage, and balance sheet accruals, outperformed the S&P 500® Index. The Fund's methodology focuses on securities with these features, creating a tailwind to Fund performance relative to the S&P 500® Index.
• The Fund is passively managed and seeks to track the investment results (before fees and expenses) of the S&P 500® Quality Index (the “Index”). The Fund generally will invest at least 90% of its total assets in securities that comprise the Index.
• For the fiscal year ended April 30, 2025, the Fund's performance, on a net asset value ("NAV") basis, 14.84%, differed from the return of the Index, 15.05%, primarily due to fees and expenses incurred by the Fund during the period.
What contributed to performance?
Sector Allocations | Information technology sector, followed by the financials and communication services sectors, respectively.
Positions | Broadcom, Inc., an information technology company (no longer held at fiscal year-end), and NVIDIA Corp., an information technology company.
What detracted from performance?
Sector Allocations | Energy sector, followed by the consumer discretionary sector.
Positions | Applied Materials, Inc., an information technology company, and Salesforce, Inc., an information technology company.
How Has The Fund Historically Performed?
Growth of $10,000 Investment
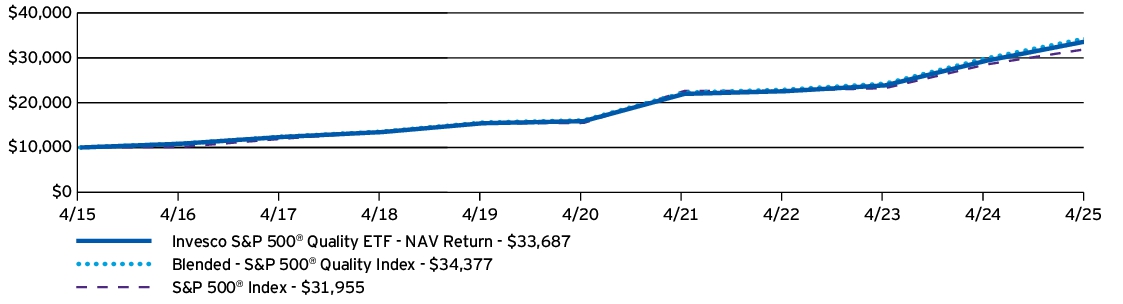
AVERAGE ANNUAL TOTAL RETURNS |
1 Year |
5 Years |
10 Years |
| Invesco S&P 500® Quality ETF — NAV Return | 14.84% | 16.24% | 12.91% |
| Blended - S&P 500® Quality Index | 15.05% | 16.43% | 13.14% |
| S&P 500® Index | 12.10% | 15.61% | 12.32% |
Performance figures do not reflect deduction of taxes a shareholder would pay on Fund distributions or sale of Fund shares.
- Effective August 28, 2024, the Fund changed its broad-based securities market benchmark from the S&P 500® Quality Index to the S&P 500® Index to reflect that the S&P 500® Index can be considered more broadly representative of the overall applicable securities market.
What Are Key Statistics About The Fund?
(as of April 30, 2025)
| Fund net assets | $12,403,993,608 |
| Total number of portfolio holdings | 102 |
| Total advisory fees paid | $10,351,502 |
| Portfolio turnover rate | 57% |
What Comprised The Fund's Holdings?
(as of April 30, 2025)
Top ten holdings*
(% of net assets)
(% of net assets)
| Visa, Inc., Class A | 5.82% |
| Netflix, Inc. | 5.68% |
| Johnson & Johnson | 5.63% |
| Mastercard, Inc., Class A | 5.42% |
| Meta Platforms, Inc., Class A | 4.58% |
| Apple, Inc. | 4.56% |
| Costco Wholesale Corp. | 4.39% |
| Procter & Gamble Co. (The) | 4.18% |
| NVIDIA Corp. | 4.13% |
| General Electric Co. | 2.85% |
| * Excluding money market fund holdings, if any. |
Sector allocation
(% of net assets)
(% of net assets)
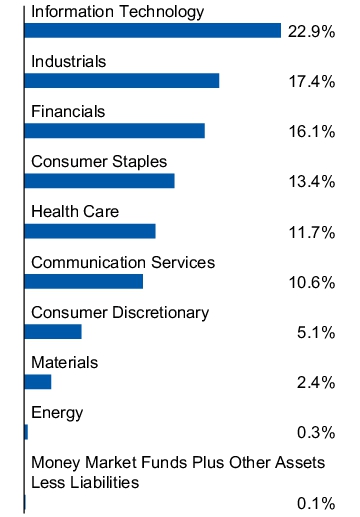
Top ten holdings*
(% of net assets)
(% of net assets)
| Visa, Inc., Class A | 5.82% |
| Netflix, Inc. | 5.68% |
| Johnson & Johnson | 5.63% |
| Mastercard, Inc., Class A | 5.42% |
| Meta Platforms, Inc., Class A | 4.58% |
| Apple, Inc. | 4.56% |
| Costco Wholesale Corp. | 4.39% |
| Procter & Gamble Co. (The) | 4.18% |
| NVIDIA Corp. | 4.13% |
| General Electric Co. | 2.85% |
| * Excluding money market fund holdings, if any. |
What Were The Fund Costs For The Last Year ?
(Based on a hypothetical $10,000 investment)
| Fund | Costs of a $10,000 investment | Costs paid as a percentage of a $10,000 investment |
| Invesco Golden Dragon China ETF | $75 | 0.70% |
How Did The Fund Perform During The Period?
• During the fiscal year ended April 30, 2025, China experienced a difficult economic environment, hampered by the real estate and consumer sectors. Despite this, China finished 2024 with GDP growth of 5%, meeting government targets. Weakening demographics due to a shrinking population, high local government debt and lower revenues, and increased tariff pressure from the country's largest trade partners, have also been major headwinds for China. Overweight allocations to consumer discretionary and communication services were the leading detractors from Fund performance compared to the FTSE China 50 Index.
• The Fund is passively managed and seeks to track the investment results (before fees and expenses) of the Nasdaq Golden Dragon China IndexTM (the “Index”). The Fund generally will invest at least 90% of its total assets in securities that comprise the Index.
• For the fiscal year ended April 30, 2025, the Fund's performance, on a net asset value ("NAV") basis, 14.17%, differed from the return of the Index, 14.16%, primarily due to income received from the securities lending program in which the Fund participates, partially offset by fees and expenses incurred by the Fund during the period.
What contributed to performance?
Sector Allocations | Consumer discretionary sector, followed by the financials sector.
Positions | Alibaba Group Holding Ltd., ADR, a consumer discretionary company, and Trip.com Group Ltd., ADR, a consumer discretionary company (no longer held at fiscal year-end).
What detracted from performance?
Sector Allocations | Communication services sector, followed by the consumer staples sector.
Positions | New Oriental Education & Technology Group, Inc., ADR, a consumer discretionary company, and Kanzhun Ltd., ADR, a communication services company.
How Has The Fund Historically Performed?
Growth of $10,000 Investment
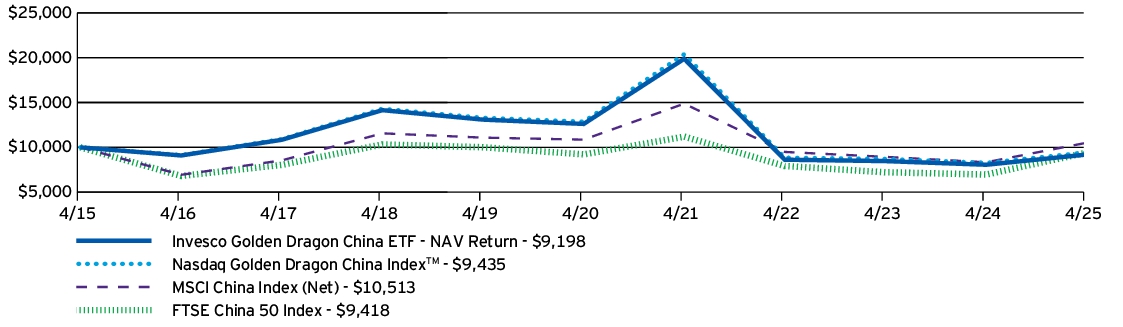
AVERAGE ANNUAL TOTAL RETURNS |
1 Year |
5 Years |
10 Years |
| Invesco Golden Dragon China ETF — NAV Return | 14.17% | -6.12% | -0.83% |
| Nasdaq Golden Dragon China Index™ | 14.16% | -6.01% | -0.58% |
| MSCI China Index (Net) | 26.13% | -0.65% | 0.50% |
| FTSE China 50 Index | 35.22% | 0.43% | -0.60% |
Performance figures do not reflect deduction of taxes a shareholder would pay on Fund distributions or sale of Fund shares.
- Effective August 28, 2024, the Fund changed its broad-based securities market benchmark from the FTSE China 50 Index to the MSCI China Index (Net) to reflect that the MSCI China Index (Net) can be considered more broadly representative of the overall applicable securities market.
What Are Key Statistics About The Fund?
(as of April 30, 2025)
| Fund net assets | $141,907,317 |
| Total number of portfolio holdings | 71 |
| Total advisory fees paid | $726,482 |
| Portfolio turnover rate | 25% |
What Comprised The Fund's Holdings?
(as of April 30, 2025)
Top ten holdings*
(% of net assets)
(% of net assets)
| Alibaba Group Holding Ltd., ADR | 8.05% |
| Yum China Holdings, Inc. | 7.83% |
| KE Holdings, Inc., ADR | 7.49% |
| Baidu, Inc., ADR | 7.15% |
| JD.com, Inc., ADR | 6.96% |
| NetEase, Inc., ADR | 4.79% |
| Tencent Music Entertainment Group, ADR | 4.42% |
| Full Truck Alliance Co. Ltd., ADR | 4.32% |
| Vipshop Holdings Ltd., ADR | 3.28% |
| H World Group Ltd., ADR | 3.11% |
| * Excluding money market fund holdings, if any. |
Sector allocation
(% of net assets)
(% of net assets)
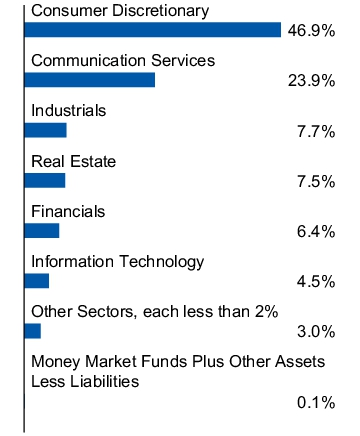
Top ten holdings*
(% of net assets)
(% of net assets)
| Alibaba Group Holding Ltd., ADR | 8.05% |
| Yum China Holdings, Inc. | 7.83% |
| KE Holdings, Inc., ADR | 7.49% |
| Baidu, Inc., ADR | 7.15% |
| JD.com, Inc., ADR | 6.96% |
| NetEase, Inc., ADR | 4.79% |
| Tencent Music Entertainment Group, ADR | 4.42% |
| Full Truck Alliance Co. Ltd., ADR | 4.32% |
| Vipshop Holdings Ltd., ADR | 3.28% |
| H World Group Ltd., ADR | 3.11% |
| * Excluding money market fund holdings, if any. |
What Were The Fund Costs For The Last Year ?
(Based on a hypothetical $10,000 investment)
| Fund | Costs of a $10,000 investment | Costs paid as a percentage of a $10,000 investment |
| Invesco WilderHill Clean Energy ETF | $57 | 0.64% |
How Did The Fund Perform During The Period?
• During the fiscal year ended April 30, 2025, clean energy stocks significantly underperformed the Russell 2000® Growth Index due primarily to tariffs imposed on Chinese solar and rampant oversupply issues. The electric vehicles market dealt with its own challenges as consumers seem to be tapped out. Though we believe the U.S. ultimately looks to reshore some components of solar and battery manufacturing, a trade deal with China could potentially lift Chinese solar manufacturers, a trend the market also seems to be anticipating given recent positive returns. The Fund's overweight allocation to and security selection in the industrials sector also contributed to its underperformance relative to the Russell 2000® Growth Index during the period.
• The Fund is passively managed and seeks to track the investment results (before fees and expenses) of the WilderHill Clean Energy Index (the “Index”). The Fund generally will invest at least 90% of its total assets in securities that comprise the Index.
• For the fiscal year ended April 30, 2025, the Fund's performance, on a net asset value ("NAV") basis, -21.73%, differed from the return of the Index, -22.67%, primarily due to income received from the securities lending program in which the Fund participates, partially offset by fees and expenses that the Fund incurred during the period.
What contributed to performance?
Industry Allocations | Aerospace & defense industry, followed by the automobiles and independent power and renewable electricity producers industries, respectively.
Positions | Archer Aviation, Inc., Class A, an aerospace and defense company, and Eos Energy Enterprises, Inc., an electrical equipment company.
What detracted from performance?
Industry Allocations | Electrical equipment industry, followed by the semiconductors & semiconductor equipment industry.
Positions | Wolfspeed, Inc., a semiconductors & semiconductor equipment company, and LanzaTech Global, Inc., a commercial services & supplies company.
How Has The Fund Historically Performed?
Growth of $10,000 Investment
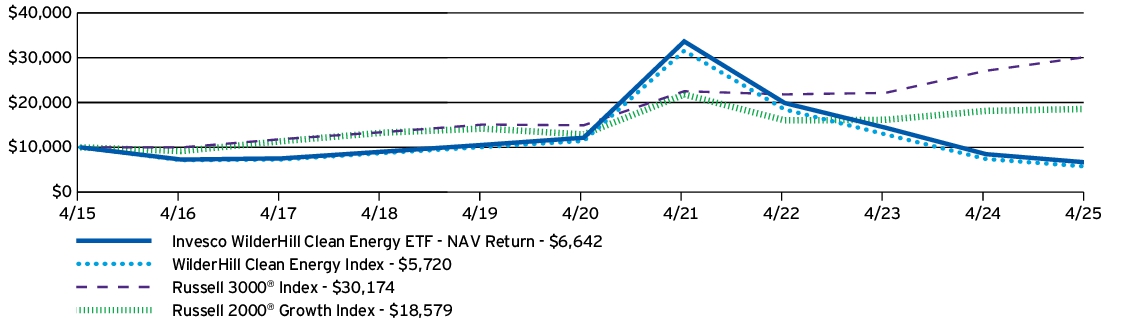
AVERAGE ANNUAL TOTAL RETURNS |
1 Year |
5 Years |
10 Years |
| Invesco WilderHill Clean Energy ETF — NAV Return | -21.73% | -11.37% | -4.01% |
| WilderHill Clean Energy Index | -22.67% | -12.94% | -5.43% |
| Russell 3000® Index | 11.40% | 15.12% | 11.68% |
| Russell 2000® Growth Index | 2.42% | 7.60% | 6.39% |
Performance figures do not reflect deduction of taxes a shareholder would pay on Fund distributions or sale of Fund shares.
- Effective August 28, 2024, the Fund changed its broad-based securities market benchmark from the Russell 2000® Growth Index to the Russell 3000® Index to reflect that the Russell 3000® Index can be considered more broadly representative of the overall applicable securities market.
What Are Key Statistics About The Fund?
(as of April 30, 2025)
| Fund net assets | $220,825,283 |
| Total number of portfolio holdings | 66 |
| Total advisory fees paid | $1,467,434 |
| Portfolio turnover rate | 62% |
What Comprised The Fund's Holdings?
(as of April 30, 2025)
Top ten holdings*
(% of net assets)
(% of net assets)
| Eos Energy Enterprises, Inc. | 2.52% |
| Quanta Services, Inc. | 2.31% |
| Sunrun, Inc. | 2.22% |
| ReNew Energy Global PLC, Class A | 2.19% |
| American Superconductor Corp. | 2.12% |
| Shoals Technologies Group, Inc., Class A | 2.10% |
| Brookfield Renewable Corp. | 2.06% |
| Rivian Automotive, Inc., Class A | 2.03% |
| Itron, Inc. | 2.03% |
| REX American Resources Corp. | 1.98% |
| * Excluding money market fund holdings, if any. |
Industry allocation
(% of net assets)
(% of net assets)
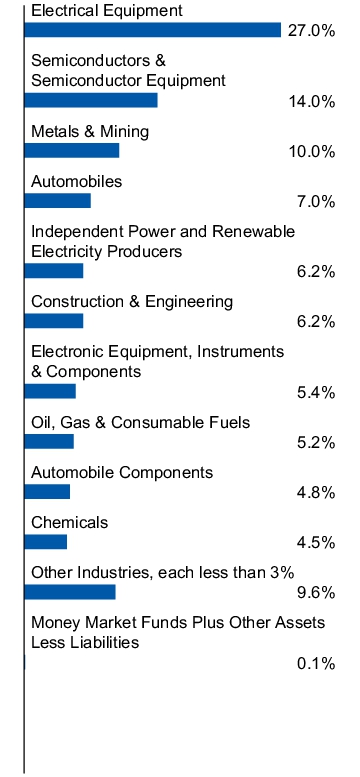
Top ten holdings*
(% of net assets)
(% of net assets)
| Eos Energy Enterprises, Inc. | 2.52% |
| Quanta Services, Inc. | 2.31% |
| Sunrun, Inc. | 2.22% |
| ReNew Energy Global PLC, Class A | 2.19% |
| American Superconductor Corp. | 2.12% |
| Shoals Technologies Group, Inc., Class A | 2.10% |
| Brookfield Renewable Corp. | 2.06% |
| Rivian Automotive, Inc., Class A | 2.03% |
| Itron, Inc. | 2.03% |
| REX American Resources Corp. | 1.98% |
| * Excluding money market fund holdings, if any. |
What Were The Fund Costs For The Last Year ?
(Based on a hypothetical $10,000 investment)
| Fund | Costs of a $10,000 investment | Costs paid as a percentage of a $10,000 investment |
| Invesco Large Cap Growth ETF | $60 | 0.55% |
How Did The Fund Perform During The Period?
• During the fiscal year ended April 30, 2025, U.S. equities began the period with strong performance but experienced a more challenging environment near the end of the period due to uncertainty regarding global trade and tariff policy. Security selection results in the communication services and consumer staples sectors as well as an average overweight to financials were relative performance tailwinds for the Fund versus the Russell 1000® Growth Index during the period.
• The Fund is passively managed and seeks to track the investment results (before fees and expenses) of the Dynamic Large Cap Growth Intellidex® Index (the “Index”). The Fund generally will invest at least 90% of its total assets in securities that comprise the Index.
• For the fiscal year ended April 30, 2025, the Fund's performance, on a net asset value ("NAV") basis, 17.53%, differed from the return of the Index, 18.19%, primarily due to fees and expenses incurred by the Fund during the period.
What contributed to performance?
Sector Allocations | Information technology sector, followed by the communication services and industrials sectors, respectively.
Positions | Netflix, Inc., a communication services company, and NVIDIA Corp., an information technology company.
What detracted from performance?
Sector Allocations | Energy sector.
Positions | Tesla, Inc., a consumer discretionary company (no longer held at fiscal year-end), and Trade Desk, Inc., Class A, a communication services company (no longer held at fiscal year-end).
How Has The Fund Historically Performed?
Growth of $10,000 Investment
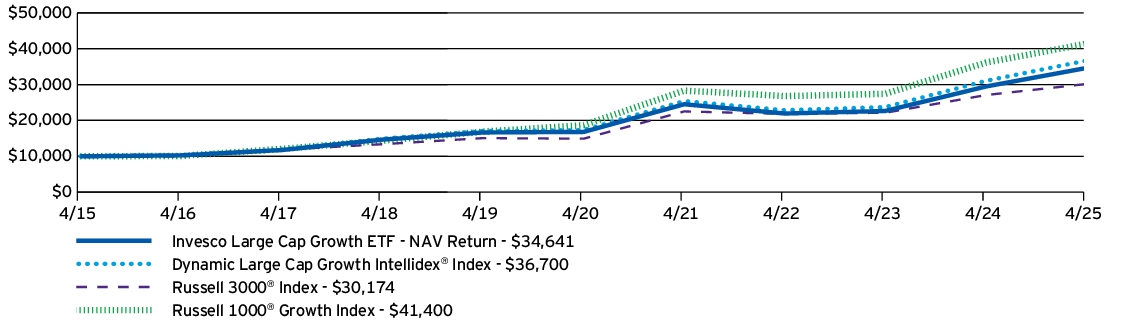
AVERAGE ANNUAL TOTAL RETURNS |
1 Year |
5 Years |
10 Years |
| Invesco Large Cap Growth ETF — NAV Return | 17.53% | 15.57% | 13.23% |
| Dynamic Large Cap Growth Intellidex® Index | 18.19% | 16.22% | 13.88% |
| Russell 3000® Index | 11.40% | 15.12% | 11.68% |
| Russell 1000® Growth Index | 14.53% | 17.23% | 15.27% |
Performance figures do not reflect deduction of taxes a shareholder would pay on Fund distributions or sale of Fund shares.
What Are Key Statistics About The Fund?
(as of April 30, 2025)
| Fund net assets | $976,252,834 |
| Total number of portfolio holdings | 53 |
| Total advisory fees paid | $4,686,708 |
| Portfolio turnover rate | 92% |
What Comprised The Fund's Holdings?
(as of April 30, 2025)
Top ten holdings*
(% of net assets)
(% of net assets)
| Netflix, Inc. | 4.03% |
| General Electric Co. | 3.52% |
| Walmart, Inc. | 3.47% |
| Microsoft Corp. | 3.46% |
| Visa, Inc., Class A | 3.42% |
| Mastercard, Inc., Class A | 3.38% |
| Broadcom, Inc. | 3.31% |
| Costco Wholesale Corp. | 3.28% |
| American Express Co. | 3.16% |
| Alphabet, Inc., Class A | 3.15% |
| * Excluding money market fund holdings, if any. |
Sector allocation
(% of net assets)
(% of net assets)
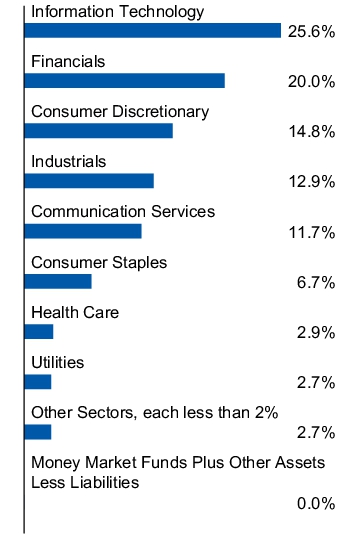
Top ten holdings*
(% of net assets)
(% of net assets)
| Netflix, Inc. | 4.03% |
| General Electric Co. | 3.52% |
| Walmart, Inc. | 3.47% |
| Microsoft Corp. | 3.46% |
| Visa, Inc., Class A | 3.42% |
| Mastercard, Inc., Class A | 3.38% |
| Broadcom, Inc. | 3.31% |
| Costco Wholesale Corp. | 3.28% |
| American Express Co. | 3.16% |
| Alphabet, Inc., Class A | 3.15% |
| * Excluding money market fund holdings, if any. |
What Were The Fund Costs For The Last Year ?
(Based on a hypothetical $10,000 investment)
| Fund | Costs of a $10,000 investment | Costs paid as a percentage of a $10,000 investment |
| Invesco Large Cap Value ETF | $57 | 0.55% |
How Did The Fund Perform During The Period?
• During the fiscal year ended April 30, 2025, U.S. equities began the period with strong performance but experienced a more challenging environment near the end of the period due to uncertainty regarding global trade and tariff policy. The Fund slightly underperformed the Russell 1000® Value Index due to poor security selection results in the financials and industrials sectors, and a large average overweight to the energy sector, partially offset by relatively strong security selection results in the health care and information technology sectors.
• The Fund is passively managed and seeks to track the investment results (before fees and expenses) of the Dynamic Large Cap Value Intellidex® Index (the “Index”). The Fund generally will invest at least 90% of its total assets in securities that comprise the Index.
• For the fiscal year ended April 30, 2025, the Fund's performance, on a net asset value ("NAV") basis, 8.00%, differed from the return of the Index, 8.49%, primarily due to fees and expenses incurred by the Fund during the period.
What contributed to performance?
Sector Allocations | Financials sector, followed by the health care and information technology sectors, respectively.
Positions | International Business Machines Corp., an information technology company, and JPMorgan Chase & Co., a financials company.
What detracted from performance?
Sector Allocations | Energy sector, followed by the consumer discretionary and industrials sectors, respectively.
Positions | Home Depot, Inc., a consumer discretionary company, and Chevron Corp., an energy company.
How Has The Fund Historically Performed?
Growth of $10,000 Investment
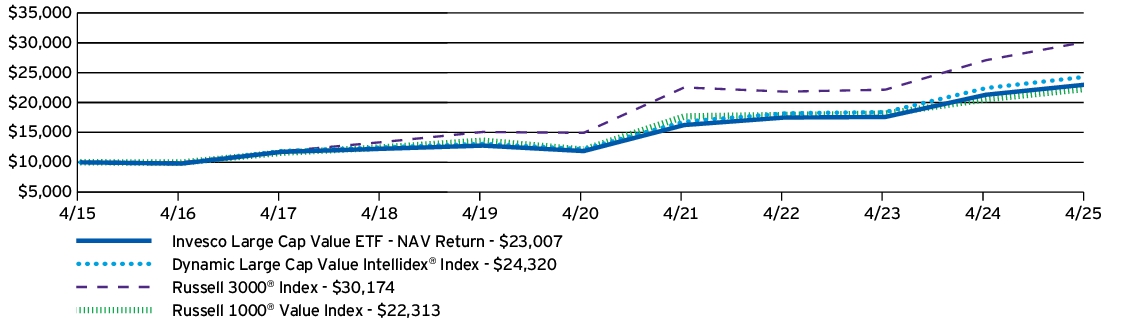
AVERAGE ANNUAL TOTAL RETURNS |
1 Year |
5 Years |
10 Years |
| Invesco Large Cap Value ETF — NAV Return | 8.00% | 14.13% | 8.69% |
| Dynamic Large Cap Value Intellidex® Index | 8.49% | 14.78% | 9.29% |
| Russell 3000® Index | 11.40% | 15.12% | 11.68% |
| Russell 1000® Value Index | 8.55% | 13.00% | 8.36% |
Performance figures do not reflect deduction of taxes a shareholder would pay on Fund distributions or sale of Fund shares.
- Effective August 28, 2024, the Fund changed its broad-based securities market benchmark from the Dynamic Large Cap Value Intellidex® Index to the Russell 3000® Index to reflect that the Russell 3000® Index can be considered more broadly representative of the overall applicable securities market.
What Are Key Statistics About The Fund?
(as of April 30, 2025)
| Fund net assets | $1,000,734,843 |
| Total number of portfolio holdings | 53 |
| Total advisory fees paid | $4,897,413 |
| Portfolio turnover rate | 103% |
What Comprised The Fund's Holdings?
(as of April 30, 2025)
Top ten holdings*
(% of net assets)
(% of net assets)
| Philip Morris International, Inc. | 3.84% |
| Exxon Mobil Corp. | 3.40% |
| AbbVie, Inc. | 3.38% |
| JPMorgan Chase & Co. | 3.36% |
| Procter & Gamble Co. (The) | 3.33% |
| Johnson & Johnson | 3.33% |
| International Business Machines Corp. | 3.32% |
| Wells Fargo & Co. | 3.30% |
| QUALCOMM, Inc. | 3.25% |
| Home Depot, Inc. (The) | 3.24% |
| * Excluding money market fund holdings, if any. |
Sector allocation
(% of net assets)
(% of net assets)
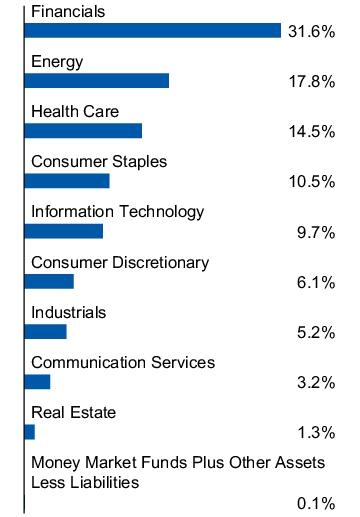
Top ten holdings*
(% of net assets)
(% of net assets)
| Philip Morris International, Inc. | 3.84% |
| Exxon Mobil Corp. | 3.40% |
| AbbVie, Inc. | 3.38% |
| JPMorgan Chase & Co. | 3.36% |
| Procter & Gamble Co. (The) | 3.33% |
| Johnson & Johnson | 3.33% |
| International Business Machines Corp. | 3.32% |
| Wells Fargo & Co. | 3.30% |
| QUALCOMM, Inc. | 3.25% |
| Home Depot, Inc. (The) | 3.24% |
| * Excluding money market fund holdings, if any. |
This report describes changes to the Fund that occurred during the reporting period.
What Were The Fund Costs For The Last Year ?
(Based on a hypothetical $10,000 investment)
| Fund | Costs of a $10,000 investment | Costs paid as a percentage of a $10,000 investment |
| Invesco S&P MidCap Momentum ETF | $34 | 0.33% |
How Did The Fund Perform During The Period?
• During the fiscal year ended April 30, 2025, U.S. mid cap equities showed strong performance subsequent to the conclusion of the U.S. election but struggled near the end of the period due to uncertainty regarding global trade and tariff policy. The Fund's focus on momentum securities, or those with relatively stronger price returns over a trailing twelve-month period, was a notable driver of its relative outperformance versus the S&P MidCap 400® Index during the period as investors continued to favor the momentum factor.
• The Fund is passively managed and seeks to track the investment results (before fees and expenses) of the S&P MidCap 400® Momentum Index (the “Index”). The Fund generally will invest at least 90% of its total assets in securities that comprise the Index.
• For the fiscal year ended April 30, 2025, the Fund's performance, on a net asset value ("NAV") basis, 6.78%, differed from the return of the Index, 7.17%, primarily due to fees and expenses incurred by the Fund during the period.
What contributed to performance?
Sector Allocations | Consumer staples sector, followed by the industrials and information technology sectors, respectively.
Positions | Sprouts Farmers Market, Inc., a consumer staples company, and Texas Pacific Land Corp., an energy company (no longer held at fiscal year-end).
What detracted from performance?
Sector Allocations | Consumer discretionary sector, followed by the real estate and materials sectors, respectively.
Positions | Wingstop, Inc., a consumer discretionary company (no longer held at fiscal year-end), and Abercrombie & Fitch Co., Class A, a consumer discretionary company (no longer held at fiscal year-end).
How Has The Fund Historically Performed?
Growth of $10,000 Investment
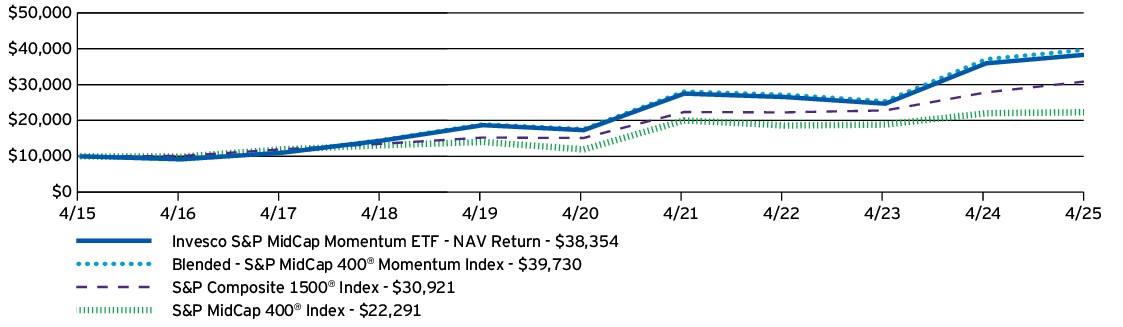
AVERAGE ANNUAL TOTAL RETURNS |
1 Year |
5 Years |
10 Years |
| Invesco S&P MidCap Momentum ETF — NAV Return | 6.78% | 17.28% | 14.39% |
| Blended - S&P MidCap 400® Momentum Index | 7.17% | 17.70% | 14.79% |
| S&P Composite 1500® Index | 11.12% | 15.39% | 11.95% |
| S&P MidCap 400® Index | 1.19% | 13.34% | 8.35% |
Performance figures do not reflect deduction of taxes a shareholder would pay on Fund distributions or sale of Fund shares.
- Effective August 28, 2024, the Fund changed its broad-based securities market benchmark from the S&P MidCap 400® Momentum Index to the S&P Composite 1500® Index to reflect that the S&P Composite 1500® Index can be considered more broadly representative of the overall applicable securities market.
What Are Key Statistics About The Fund?
(as of April 30, 2025)
| Fund net assets | $3,419,343,960 |
| Total number of portfolio holdings | 80 |
| Total advisory fees paid | $9,202,624 |
| Portfolio turnover rate | 104% |
What Comprised The Fund's Holdings?
(as of April 30, 2025)
Top ten holdings*
(% of net assets)
(% of net assets)
| Interactive Brokers Group, Inc., Class A | 4.34% |
| Sprouts Farmers Market, Inc. | 3.97% |
| EMCOR Group, Inc. | 3.05% |
| Guidewire Software, Inc. | 2.79% |
| Equitable Holdings, Inc. | 2.57% |
| Unum Group | 2.46% |
| US Foods Holding Corp. | 2.33% |
| DT Midstream, Inc. | 2.29% |
| Carpenter Technology Corp. | 2.27% |
| Casey's General Stores, Inc. | 2.23% |
| * Excluding money market fund holdings, if any. |
Sector allocation
(% of net assets)
(% of net assets)
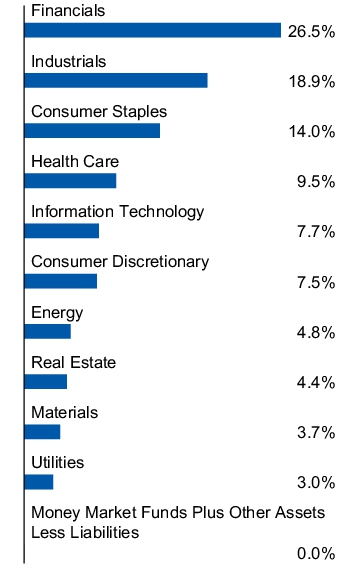
Top ten holdings*
(% of net assets)
(% of net assets)
| Interactive Brokers Group, Inc., Class A | 4.34% |
| Sprouts Farmers Market, Inc. | 3.97% |
| EMCOR Group, Inc. | 3.05% |
| Guidewire Software, Inc. | 2.79% |
| Equitable Holdings, Inc. | 2.57% |
| Unum Group | 2.46% |
| US Foods Holding Corp. | 2.33% |
| DT Midstream, Inc. | 2.29% |
| Carpenter Technology Corp. | 2.27% |
| Casey's General Stores, Inc. | 2.23% |
| * Excluding money market fund holdings, if any. |
How Has The Fund Changed Over The Past Year?
This is a summary of certain changes to the Fund since April 30, 2024. For more complete information, you may review the Fund's prospectus, which is available at invesco.com/reports or upon request at (800) 983-0903.
The Fund's net expense ratio decreased from the prior fiscal year end as a result of a change in operating expenses.
The Fund's net expense ratio decreased from the prior fiscal year end as a result of a change in operating expenses.
This is a summary of certain changes to the Fund since April 30, 2024. For more complete information, you may review the Fund's prospectus, which is available at invesco.com/reports or upon request at (800) 983-0903.
What Were The Fund Costs For The Last Year ?
(Based on a hypothetical $10,000 investment)
| Fund | Costs of a $10,000 investment | Costs paid as a percentage of a $10,000 investment |
| Invesco S&P MidCap Value with Momentum ETF | $40 | 0.39% |
How Did The Fund Perform During The Period?
• During the fiscal year ended April 30, 2025, U.S. mid cap equities showed strong performance subsequent to the conclusion of the U.S. election but struggled near the end of the period due to uncertainty regarding global trade and tariff policy. The Fund's outperformance relative to the S&P MidCap 400® Index was primarily due to its focus on value securities, which outperformed mid-cap U.S. equities during the period. A large relative overweight to financials as well as strong security selection results within that sector were notably supportive of relative outperformance.
• The Fund is passively managed and seeks to track the investment results (before fees and expenses) of the S&P MidCap 400® High Momentum Value Index (the “Index”). The Fund generally will invest at least 90% of its total assets in securities that comprise the Index.
• For the fiscal year ended April 30, 2025, the Fund's performance, on a net asset value ("NAV") basis, 2.84%, differed from the return of the Index, 3.23%, primarily due to fees and expenses incurred by the Fund during the period.
What contributed to performance?
Sector Allocations | Financials sector, followed by the consumer staples and utilities sectors, respectively.
Positions | Unum Group, a financials company, and Pilgrim's Pride Corp., a consumer staples company.
What detracted from performance?
Sector Allocations | Energy sector, followed by the materials and industrials sectors, respectively.
Positions | PBF Energy, Inc., Class A, an energy company (no longer held at fiscal year-end), and HF Sinclar Corp., an energy company (no longer held at fiscal year-end).
How Has The Fund Historically Performed?
Growth of $10,000 Investment
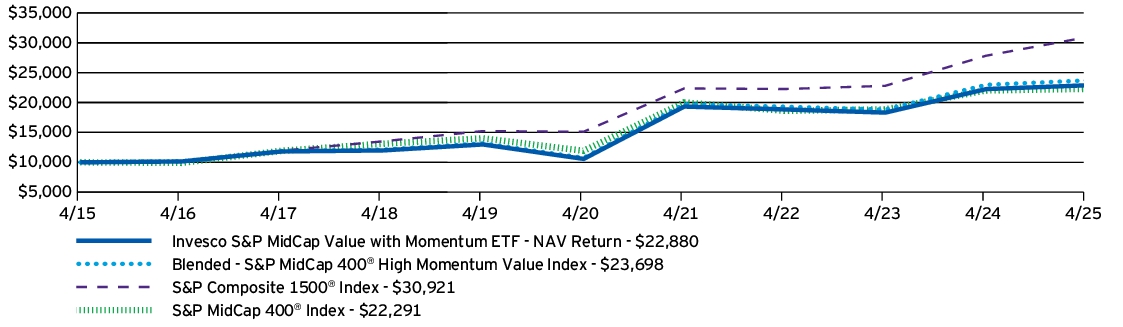
AVERAGE ANNUAL TOTAL RETURNS |
1 Year |
5 Years |
10 Years |
| Invesco S&P MidCap Value with Momentum ETF — NAV Return | 2.84% | 16.70% | 8.63% |
| Blended - S&P MidCap 400® High Momentum Value Index | 3.23% | 17.15% | 9.01% |
| S&P Composite 1500® Index | 11.12% | 15.39% | 11.95% |
| S&P MidCap 400® Index | 1.19% | 13.34% | 8.35% |
Performance figures do not reflect deduction of taxes a shareholder would pay on Fund distributions or sale of Fund shares.
- Effective August 28, 2024, the Fund changed its broad-based securities market benchmark from the S&P MidCap 400® High Momentum Value Index to the S&P Composite 1500® Index to reflect that the S&P Composite 1500® Index can be considered more broadly representative of the overall applicable securities market.
What Are Key Statistics About The Fund?
(as of April 30, 2025)
| Fund net assets | $238,905,880 |
| Total number of portfolio holdings | 83 |
| Total advisory fees paid | $722,559 |
| Portfolio turnover rate | 73% |
What Comprised The Fund's Holdings?
(as of April 30, 2025)
Top ten holdings*
(% of net assets)
(% of net assets)
| Avnet, Inc. | 2.61% |
| TD SYNNEX Corp. | 2.47% |
| Nordstrom, Inc. | 2.37% |
| AutoNation, Inc. | 2.30% |
| Unum Group | 2.06% |
| Essent Group Ltd. | 1.88% |
| Lithia Motors, Inc., Class A | 1.82% |
| Tenet Healthcare Corp. | 1.80% |
| Performance Food Group Co. | 1.79% |
| Graham Holdings Co., Class B | 1.71% |
| * Excluding money market fund holdings, if any. |
Sector allocation
(% of net assets)
(% of net assets)
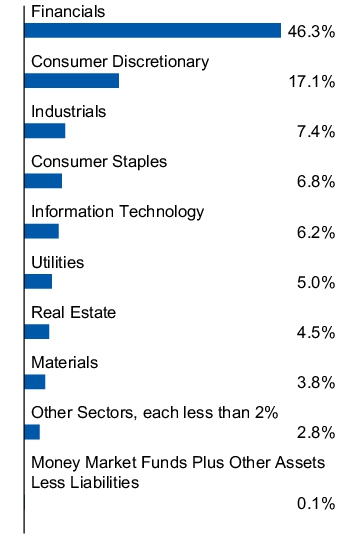
Top ten holdings*
(% of net assets)
(% of net assets)
| Avnet, Inc. | 2.61% |
| TD SYNNEX Corp. | 2.47% |
| Nordstrom, Inc. | 2.37% |
| AutoNation, Inc. | 2.30% |
| Unum Group | 2.06% |
| Essent Group Ltd. | 1.88% |
| Lithia Motors, Inc., Class A | 1.82% |
| Tenet Healthcare Corp. | 1.80% |
| Performance Food Group Co. | 1.79% |
| Graham Holdings Co., Class B | 1.71% |
| * Excluding money market fund holdings, if any. |
This report describes changes to the Fund that occurred during the reporting period.
What Were The Fund Costs For The Last Year ?
(Based on a hypothetical $10,000 investment)
| Fund | Costs of a $10,000 investment | Costs paid as a percentage of a $10,000 investment |
| Invesco RAFI US 1000 ETF | $41 | 0.39% |
How Did The Fund Perform During The Period?
• During the fiscal year ended April 30, 2025, U.S. equities began the period with strong performance but experienced a more challenging environment near the end of the period due to uncertainty regarding global trade and tariff policy. The Fund's fundamental weighting methodology led to a value-tilted portfolio, creating a performance headwind compared to the Russell 1000® Index.
• Effective March 24, 2025, the Fund changed its name from Invesco FTSE RAFI US 1000 ETF to Invesco RAFI US 1000 ETF and the underlying index from FTSE RAFITM US 1000 Index (the "Previous Index") to RAFITM Fundamental Select US 1000 Index (the "Index"). At that time, the Fund changed its investment objective and investment policies.
• The Fund is passively managed and seeks to track the investment results (before fees and expenses) of the Index, and prior to March 24, 2025, the Previous Index. The Fund generally will invest at least 90% of its total assets in securities that comprise the Index.
• For the fiscal year ended April 30, 2025, the Fund's performance, on a net asset value ("NAV") basis, 8.46%, differed from the return of the Custom Invesco RAFI U.S. 1000 ETF Benchmark (a composite of the returns of the Previous Index through March 21, 2025, and of the Index for the remainder of the fiscal year ended April 30, 2025), 8.86%, primarily due to fees and expenses incurred by the Fund during the period.
What contributed to performance?
Sector Allocations | Financials sector, followed by the communication services and consumer staples sectors, respectively.
Positions | Berkshire Hathaway, Inc., Class B, a financials company, and AT&T, Inc., a communication services company.
What detracted from performance?
Sector Allocations | Energy sector, followed by the materials sector.
Positions | Intel Corp., an information technology company, and Merck & Co., Inc., a health care company.
How Has The Fund Historically Performed?
Growth of $10,000 Investment
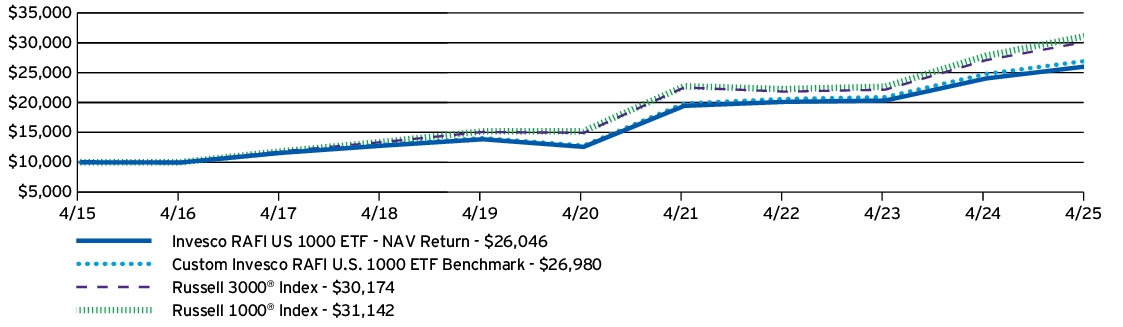
AVERAGE ANNUAL TOTAL RETURNS |
1 Year |
5 Years |
10 Years |
| Invesco RAFI US 1000 ETF — NAV Return | 8.46% | 15.67% | 10.05% |
| Custom Invesco RAFI U.S. 1000 ETF Benchmark | 8.86% | 16.10% | 10.43% |
| RAFI™ Fundamental Select US 1000 Index | |||
| FTSE RAFI™ US 1000 Index | 8.47% | 16.02% | 10.39% |
| Russell 3000® Index | 11.40% | 15.12% | 11.68% |
| Russell 1000® Index | 11.94% | 15.42% | 12.03% |
Performance figures do not reflect deduction of taxes a shareholder would pay on Fund distributions or sale of Fund shares.
- Effective August 28, 2024, the Fund changed its broad-based securities market benchmark from the FTSE RAFI™ US 1000 Index to the Russell 3000® Index to reflect that the Russell 3000® Index can be considered more broadly representative of the overall applicable securities market.
What Are Key Statistics About The Fund?
(as of April 30, 2025)
| Fund net assets | $7,402,653,954 |
| Total number of portfolio holdings | 1,095 |
| Total advisory fees paid | $21,163,647 |
| Portfolio turnover rate | 6% |
What Comprised The Fund's Holdings?
(as of April 30, 2025)
Top ten holdings*
(% of net assets)
(% of net assets)
| Berkshire Hathaway, Inc., Class B | 2.75% |
| Apple, Inc. | 2.68% |
| JPMorgan Chase & Co. | 2.18% |
| Alphabet, Inc., Class A | 2.11% |
| Microsoft Corp. | 2.11% |
| Exxon Mobil Corp. | 2.02% |
| Amazon.com, Inc. | 1.65% |
| AT&T, Inc. | 1.46% |
| Walmart, Inc. | 1.29% |
| Verizon Communications, Inc. | 1.28% |
| * Excluding money market fund holdings, if any. |
Sector allocation
(% of net assets)
(% of net assets)
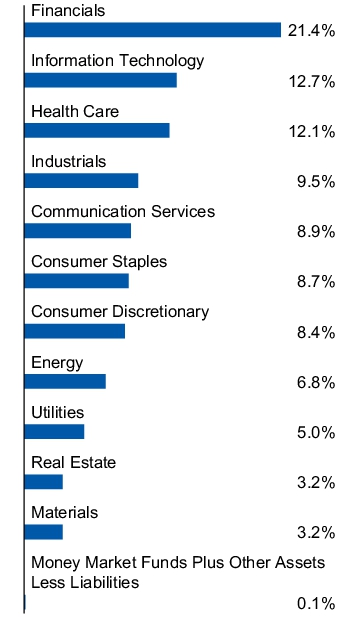
Top ten holdings*
(% of net assets)
(% of net assets)
| Berkshire Hathaway, Inc., Class B | 2.75% |
| Apple, Inc. | 2.68% |
| JPMorgan Chase & Co. | 2.18% |
| Alphabet, Inc., Class A | 2.11% |
| Microsoft Corp. | 2.11% |
| Exxon Mobil Corp. | 2.02% |
| Amazon.com, Inc. | 1.65% |
| AT&T, Inc. | 1.46% |
| Walmart, Inc. | 1.29% |
| Verizon Communications, Inc. | 1.28% |
| * Excluding money market fund holdings, if any. |
How Has The Fund Changed Over The Past Year?
This is a summary of certain changes to the Fund since April 30, 2024. For more complete information, you may review the Fund's prospectus, which is available at invesco.com/reports or upon request at (800) 983-0903.
At a meeting held on December 13, 2024, the Board of Trustees of the Fund approved changes to the name, underlying index, index provider, investment objective and principal investment strategy of the Fund. These changes took effect on March 24, 2025.
At a meeting held on December 13, 2024, the Board of Trustees of the Fund approved changes to the name, underlying index, index provider, investment objective and principal investment strategy of the Fund. These changes took effect on March 24, 2025.
At a meeting held on December 13, 2024, the Board of Trustees of the Fund approved changes to the name, underlying index, index provider, investment objective and principal investment strategy of the Fund. These changes took effect on March 24, 2025.
At a meeting held on December 13, 2024, the Board of Trustees of the Fund approved changes to the name, underlying index, index provider, investment objective and principal investment strategy of the Fund. These changes took effect on March 24, 2025.
This is a summary of certain changes to the Fund since April 30, 2024. For more complete information, you may review the Fund's prospectus, which is available at invesco.com/reports or upon request at (800) 983-0903.
What Were The Fund Costs For The Last Year ?
(Based on a hypothetical $10,000 investment)
| Fund | Costs of a $10,000 investment | Costs paid as a percentage of a $10,000 investment |
| Invesco NASDAQ Internet ETF | $65 | 0.60% |
How Did The Fund Perform During The Period?
• During the fiscal year ended April 30, 2025, U.S. equities had strong performance in the beginning with a more challenging environment at the end due to uncertainty regarding global trade and tariff policy. During the period, internet-related businesses outperformed the broader stock market. In addition to the Fund's focus on internet-related stocks, its higher allocation to movies & entertainment and broadline retail created a performance tailwind compared to the Nasdaq-100® Index.
• The Fund is passively managed and seeks to track the investment results (before fees and expenses) of the Nasdaq CTA Internet IndexSM (the “Index”). The Fund generally will invest at least 90% of its total assets in securities that comprise the Index.
• For the fiscal year ended April 30, 2025, the Fund's performance, on a net asset value ("NAV") basis, 18.29%, differed from the return of the Index, 18.81%, primarily due to fees and expenses incurred by the Fund during the period.
What contributed to performance?
Sub-Industry Allocations | Movies & entertainment sub-industry, followed by the broadline retail and technology hardware storage & peripherals sub-industries, respectively.
Positions | Netflix, Inc., a movies & entertainment company and Meta Platforms, Inc., Class A, an interactive media & services.
What detracted from performance?
Sub-Industry Allocations | Casinos & gaming sub-industry, followed by the real estate services and application software sub-industries, respectively.
Positions | Walt Disney Co. (The), a movies & entertainment company and Adobe, Inc., an application software company.
How Has The Fund Historically Performed?
Growth of $10,000 Investment
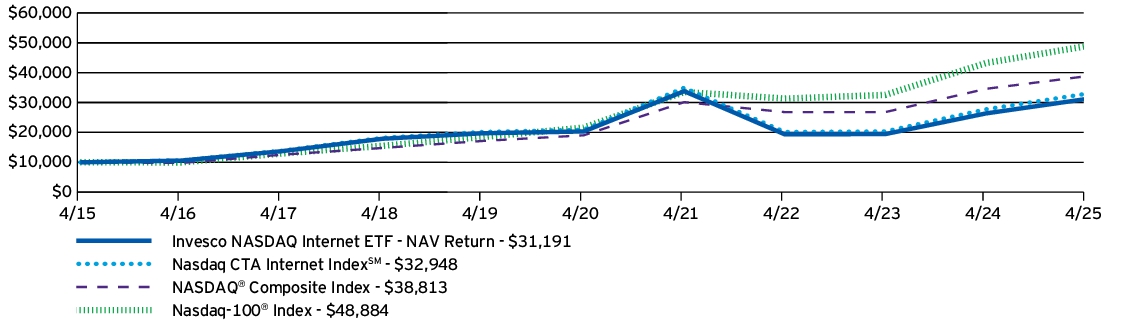
AVERAGE ANNUAL TOTAL RETURNS |
1 Year |
5 Years |
10 Years |
| Invesco NASDAQ Internet ETF — NAV Return | 18.29% | 8.95% | 12.05% |
| Nasdaq CTA Internet Index℠ | 18.81% | 9.55% | 12.66% |
| NASDAQ® Composite Index | 12.22% | 15.32% | 14.52% |
| Nasdaq-100® Index | 13.10% | 17.75% | 17.20% |
Performance figures do not reflect deduction of taxes a shareholder would pay on Fund distributions or sale of Fund shares.
- Effective August 28, 2024, the Fund changed its broad-based securities market benchmark from the Nasdaq-100® Index to the NASDAQ® Composite Index to reflect that the NASDAQ® Composite Index can be considered more broadly representative of the overall applicable securities market.
What Are Key Statistics About The Fund?
(as of April 30, 2025)
| Fund net assets | $791,640,918 |
| Total number of portfolio holdings | 82 |
| Total advisory fees paid | $4,804,784 |
| Portfolio turnover rate | 15% |
What Comprised The Fund's Holdings?
(as of April 30, 2025)
Top ten holdings*
(% of net assets)
(% of net assets)
| Microsoft Corp. | 8.51% |
| Alphabet, Inc., Class C | 7.99% |
| Apple, Inc. | 7.51% |
| Amazon.com, Inc. | 7.42% |
| Meta Platforms, Inc., Class A | 7.02% |
| Netflix, Inc. | 4.93% |
| Uber Technologies, Inc. | 4.55% |
| Booking Holdings, Inc. | 4.35% |
| Salesforce, Inc. | 3.86% |
| Adobe, Inc. | 3.65% |
| * Excluding money market fund holdings, if any. |
Sub-industry allocation
(% of net assets)
(% of net assets)
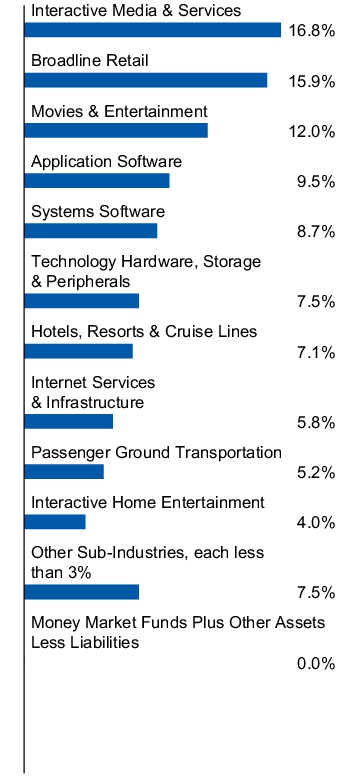
Top ten holdings*
(% of net assets)
(% of net assets)
| Microsoft Corp. | 8.51% |
| Alphabet, Inc., Class C | 7.99% |
| Apple, Inc. | 7.51% |
| Amazon.com, Inc. | 7.42% |
| Meta Platforms, Inc., Class A | 7.02% |
| Netflix, Inc. | 4.93% |
| Uber Technologies, Inc. | 4.55% |
| Booking Holdings, Inc. | 4.35% |
| Salesforce, Inc. | 3.86% |
| Adobe, Inc. | 3.65% |
| * Excluding money market fund holdings, if any. |
What Were The Fund Costs For The Last Year ?
(Based on a hypothetical $10,000 investment)
| Fund | Costs of a $10,000 investment | Costs paid as a percentage of a $10,000 investment |
| Invesco Dorsey Wright Energy Momentum ETF | $55 | 0.60%† |
|
† |
Reflects fee waivers and/or expense reimbursements, without which expenses would have been higher. |
How Did The Fund Perform During The Period?
• During the fiscal year ended April 30, 2025, U.S. equities had strong performance in the beginning with a more challenging environment at the end due to uncertainty regarding global trade and tariff policy. During the period, energy underperformed the broader stock market. In addition to the Fund's focus on energy stocks, its momentum methodology led to lower exposure to mega-cap stocks, which created a performance headwind compared to the S&P 500® Energy Index.
• The Fund is passively managed and seeks to track the investment results (before fees and expenses) of the Dorsey Wright Energy Technical LeadersTM Index (the “Index”). The Fund generally will invest at least 90% of its total assets in securities that comprise the Index.
• For the fiscal year ended April 30, 2025, the Fund's performance, on a net asset value ("NAV") basis, -17.60%, differed from the return of the Index, -17.12%, primarily due to fees and expenses incurred by the Fund during the period.
What contributed to performance?
Sub-Industry Allocations | Oil & gas storage & transportation sub-industry, followed by the coal & consumable fuels sub-industry.
Positions | Texas Pacific Land Corp., an oil & gas exploration & production company, and Targa Resources Corp., an oil & gas storage & transportation company.
What detracted from performance?
Sub-Industry Allocations | Oil & gas equipment & services sub-industry, followed by the oil & gas refining & marketing and oil & gas exploration & production sub-industries, respectively.
Positions | Weatherford International PLC, an oil & gas equipment & services company, and Alpha Metallurgical Resources, Inc., a steel company (no longer held at fiscal year-end).
How Has The Fund Historically Performed?
Growth of $10,000 Investment
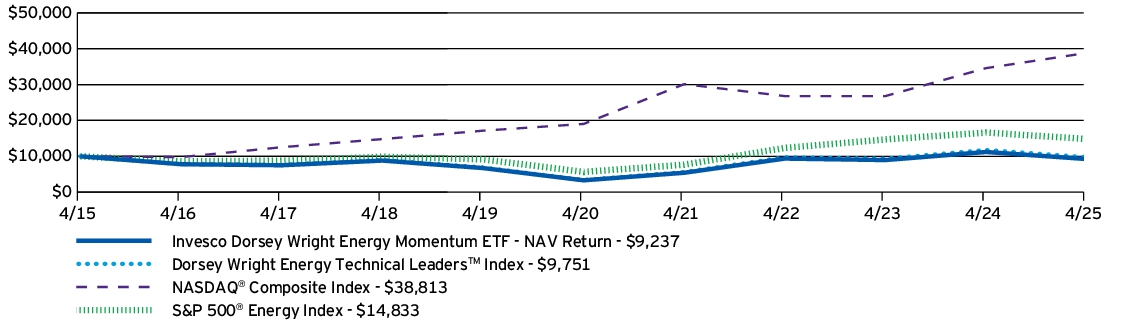
AVERAGE ANNUAL TOTAL RETURNS |
1 Year |
5 Years |
10 Years |
| Invesco Dorsey Wright Energy Momentum ETF — NAV Return | -17.60% | 22.74% | -0.79% |
| Dorsey Wright Energy Technical Leaders™ Index | -17.12% | 23.44% | -0.25% |
| NASDAQ® Composite Index | 12.22% | 15.32% | 14.52% |
| S&P 500® Energy Index | -10.81% | 21.28% | 4.02% |
Performance figures do not reflect deduction of taxes a shareholder would pay on Fund distributions or sale of Fund shares.
- Effective August 28, 2024, the Fund changed its broad-based securities market benchmark from the S&P 500® Energy Index to the NASDAQ® Composite Index to reflect that the NASDAQ® Composite Index can be considered more broadly representative of the overall applicable securities market.
What Are Key Statistics About The Fund?
(as of April 30, 2025)
| Fund net assets | $46,039,593 |
| Total number of portfolio holdings | 42 |
| Total advisory fees paid | $210,846 |
| Portfolio turnover rate | 96% |
What Comprised The Fund's Holdings?
(as of April 30, 2025)
Top ten holdings*
(% of net assets)
(% of net assets)
| Texas Pacific Land Corp. | 8.40% |
| Targa Resources Corp. | 7.44% |
| Williams Cos., Inc. (The) | 3.50% |
| Cheniere Energy, Inc. | 3.13% |
| Weatherford International PLC | 3.10% |
| Kinder Morgan, Inc. | 3.05% |
| Exxon Mobil Corp. | 2.76% |
| Antero Resources Corp. | 2.75% |
| Gulfport Energy Corp. | 2.68% |
| Marathon Petroleum Corp. | 2.63% |
| * Excluding money market fund holdings, if any. |
Sub-industry allocation
(% of net assets)
(% of net assets)
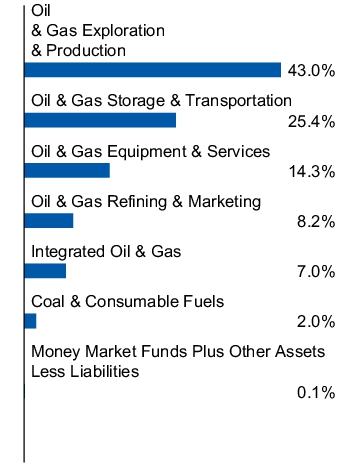
Top ten holdings*
(% of net assets)
(% of net assets)
| Texas Pacific Land Corp. | 8.40% |
| Targa Resources Corp. | 7.44% |
| Williams Cos., Inc. (The) | 3.50% |
| Cheniere Energy, Inc. | 3.13% |
| Weatherford International PLC | 3.10% |
| Kinder Morgan, Inc. | 3.05% |
| Exxon Mobil Corp. | 2.76% |
| Antero Resources Corp. | 2.75% |
| Gulfport Energy Corp. | 2.68% |
| Marathon Petroleum Corp. | 2.63% |
| * Excluding money market fund holdings, if any. |
What Were The Fund Costs For The Last Year ?
(Based on a hypothetical $10,000 investment)
| Fund | Costs of a $10,000 investment | Costs paid as a percentage of a $10,000 investment |
| Invesco Dorsey Wright Financial Momentum ETF | $65 | 0.60%† |
|
† |
Reflects fee waivers and/or expense reimbursements, without which expenses would have been higher. |
How Did The Fund Perform During The Period?
• During the fiscal year ended April 30, 2025, U.S. equities had strong performance in the beginning with a more challenging environment at the end due to uncertainty regarding global trade and tariff policy. During the period, financial stocks outperformed the broader stock market. However, despite the Fund's focus on financial stocks, its momentum methodology created a performance headwind compared to the S&P 500® Financials Index.
• The Fund is passively managed and seeks to track the investment results (before fees and expenses) of the Dorsey Wright Financials Technical LeadersTM Index (the “Index”). The Fund generally will invest at least 90% of its total assets in securities that comprise the Index.
• For the fiscal year ended April 30, 2025, the Fund's performance, on a net asset value ("NAV") basis, 15.37%, differed from the return of the Index, 16.10%, primarily due to fees and expenses incurred by the Fund during the period.
What contributed to performance?
Sub-Industry Allocations | Investment banking & brokerage sub-industry, followed by the trading companies & distributors and transaction & payment processing services sub-industries, respectively.
Positions | FTAI Aviation Ltd., a trading companies & distributors company (no longer held at fiscal year-end), and Robinhood Markets, Inc., Class A, an investment banking & brokerage company (no longer held at fiscal year-end).
What detracted from performance?
Sub-Industry Allocations | Real estate services sub-industry, followed by the consumer finance and regional banks sub-industries, respectively.
Positions | Redfin Corp., a real estate services company (no longer held at fiscal year-end), and LendingTree, Inc., a consumer finance company (no longer held at fiscal year-end).
How Has The Fund Historically Performed?
Growth of $10,000 Investment
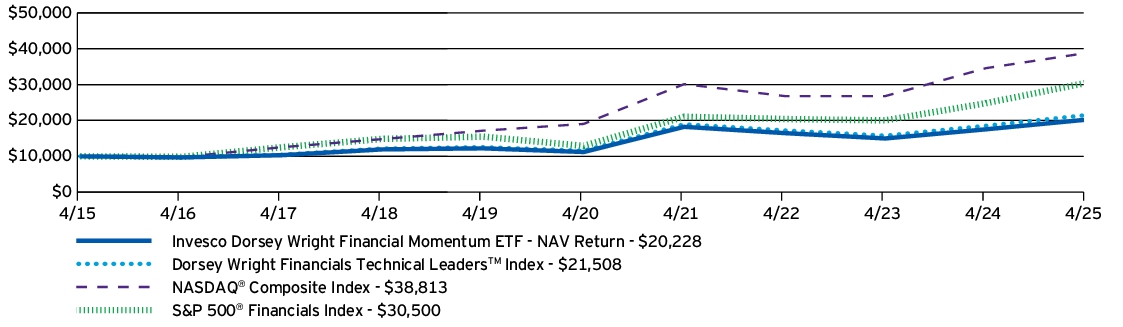
AVERAGE ANNUAL TOTAL RETURNS |
1 Year |
5 Years |
10 Years |
| Invesco Dorsey Wright Financial Momentum ETF — NAV Return | 15.37% | 12.54% | 7.30% |
| Dorsey Wright Financials Technical Leaders™ Index | 16.10% | 13.21% | 7.96% |
| NASDAQ® Composite Index | 12.22% | 15.32% | 14.52% |
| S&P 500® Financials Index | 22.82% | 18.77% | 11.80% |
Performance figures do not reflect deduction of taxes a shareholder would pay on Fund distributions or sale of Fund shares.
- Effective August 28, 2024, the Fund changed its broad-based securities market benchmark from the S&P 500® Financials Index to the NASDAQ® Composite Index to reflect that the NASDAQ® Composite Index can be considered more broadly representative of the overall applicable securities market.
What Are Key Statistics About The Fund?
(as of April 30, 2025)
| Fund net assets | $61,296,310 |
| Total number of portfolio holdings | 48 |
| Total advisory fees paid | $246,040 |
| Portfolio turnover rate | 127% |
What Comprised The Fund's Holdings?
(as of April 30, 2025)
Top ten holdings*
(% of net assets)
(% of net assets)
| Mastercard, Inc., Class A | 6.66% |
| Progressive Corp. (The) | 6.43% |
| Ameriprise Financial, Inc. | 5.13% |
| JPMorgan Chase & Co. | 4.84% |
| Visa, Inc., Class A | 4.06% |
| Mr. Cooper Group, Inc. | 3.47% |
| Unum Group | 3.05% |
| Brown & Brown, Inc. | 2.84% |
| American Express Co. | 2.77% |
| Raymond James Financial, Inc. | 2.55% |
| * Excluding money market fund holdings, if any. |
Sub-industry allocation
(% of net assets)
(% of net assets)
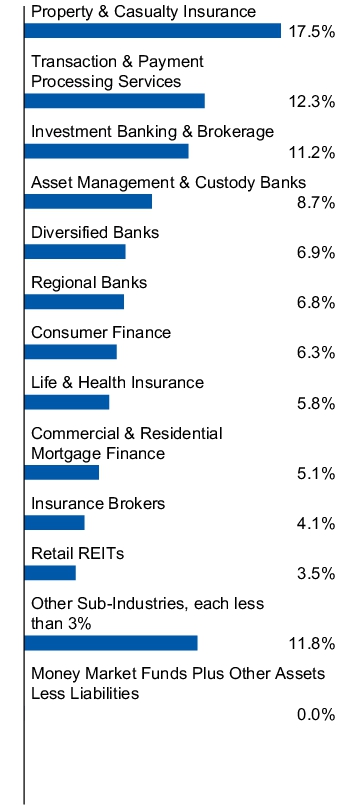
Top ten holdings*
(% of net assets)
(% of net assets)
| Mastercard, Inc., Class A | 6.66% |
| Progressive Corp. (The) | 6.43% |
| Ameriprise Financial, Inc. | 5.13% |
| JPMorgan Chase & Co. | 4.84% |
| Visa, Inc., Class A | 4.06% |
| Mr. Cooper Group, Inc. | 3.47% |
| Unum Group | 3.05% |
| Brown & Brown, Inc. | 2.84% |
| American Express Co. | 2.77% |
| Raymond James Financial, Inc. | 2.55% |
| * Excluding money market fund holdings, if any. |
What Were The Fund Costs For The Last Year ?
(Based on a hypothetical $10,000 investment)
| Fund | Costs of a $10,000 investment | Costs paid as a percentage of a $10,000 investment |
| Invesco Dorsey Wright Healthcare Momentum ETF | $60 | 0.60%† |
|
† |
Reflects fee waivers and/or expense reimbursements, without which expenses would have been higher. |
How Did The Fund Perform During The Period?
• During the fiscal year ended April 30, 2025, U.S. equities had strong performance in the beginning with a more challenging environment at the end due to uncertainty regarding global trade and tariff policy. During the period, health care underperformed the broader stock market. In addition to the Fund's focus on health care stocks, its momentum methodology led to lower exposure to megacap stocks, which created a performance headwind compared to the S&P 500® Health Care Index.
• The Fund is passively managed and seeks to track the investment results (before fees and expenses) of the Dorsey Wright Healthcare Technical LeadersTM Index (the “Index”). The Fund generally will invest at least 90% of its total assets in securities that comprise the Index.
• For the fiscal year ended April 30, 2025, the Fund's performance, on a net asset value ("NAV") basis, -0.86%, differed from the return of the Index, -0.70%, primarily due to fees and expenses incurred by the Fund during the period, partially offset by income received from the securities lending program in which the Fund participates.
What contributed to performance?
Sub-Industry Allocations | Health care services sub-industry, followed by the health care distributors and electronic equipment & instruments sub-industries, respectively.
Positions | Corcept Therapeutics Inc., a pharmaceuticals company (no longer held at fiscal year-end), and TG Therapeutics, Inc., a biotechnology company.
What detracted from performance?
Sub-Industry Allocations | Health care equipment sub-industry, followed by the health care facilities and health care technology sub-industries, respectively.
Positions | Cassava Sciences, Inc., a pharmaceuticals company (no longer held at fiscal year-end), and Scholar Rock Holding Corp., a biotechnology company (no longer held at fiscal year-end).
How Has The Fund Historically Performed?
Growth of $10,000 Investment
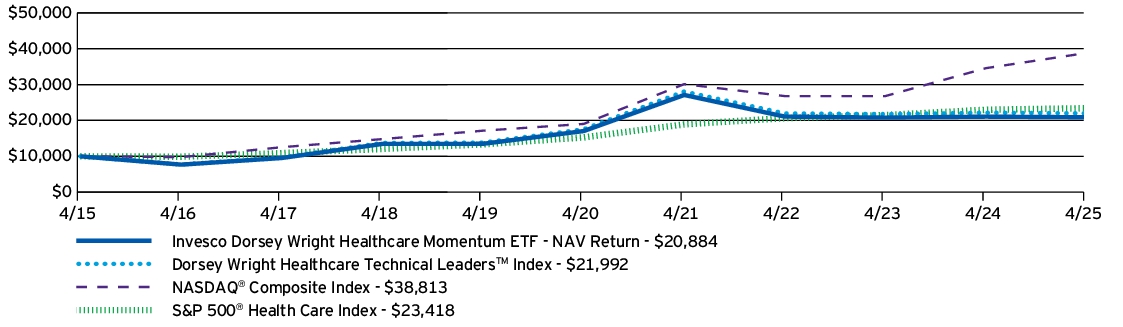
AVERAGE ANNUAL TOTAL RETURNS |
1 Year |
5 Years |
10 Years |
| Invesco Dorsey Wright Healthcare Momentum ETF — NAV Return | -0.86% | 4.15% | 7.64% |
| Dorsey Wright Healthcare Technical Leaders™ Index | -0.70% | 4.61% | 8.20% |
| NASDAQ® Composite Index | 12.22% | 15.32% | 14.52% |
| S&P 500® Health Care Index | 1.86% | 8.90% | 8.88% |
Performance figures do not reflect deduction of taxes a shareholder would pay on Fund distributions or sale of Fund shares.
- Effective August 28, 2024, the Fund changed its broad-based securities market benchmark from the S&P 500® Health Care Index to the NASDAQ® Composite Index to reflect that the NASDAQ® Composite Index can be considered more broadly representative of the overall applicable securities market.
What Are Key Statistics About The Fund?
(as of April 30, 2025)
| Fund net assets | $108,750,891 |
| Total number of portfolio holdings | 38 |
| Total advisory fees paid | $500,446 |
| Portfolio turnover rate | 221% |
What Comprised The Fund's Holdings?
(as of April 30, 2025)
Top ten holdings*
(% of net assets)
(% of net assets)
| Cencora, Inc. | 4.28% |
| Eli Lilly and Co. | 4.27% |
| TG Therapeutics, Inc. | 4.11% |
| Exelixis, Inc. | 4.06% |
| Boston Scientific Corp. | 3.66% |
| Alignment Healthcare, Inc. | 3.52% |
| BridgeBio Pharma, Inc. | 3.48% |
| Guardant Health, Inc. | 3.45% |
| Axsome Therapeutics, Inc. | 3.31% |
| Krystal Biotech, Inc. | 3.31% |
| * Excluding money market fund holdings, if any. |
Sub-industry allocation
(% of net assets)
(% of net assets)
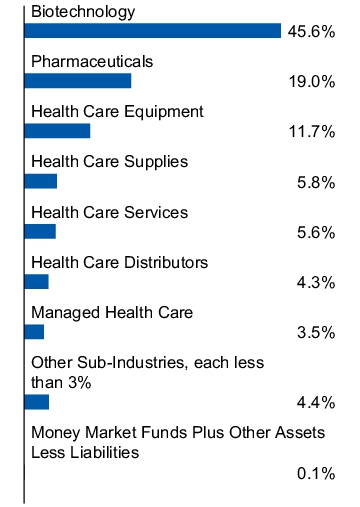
Top ten holdings*
(% of net assets)
(% of net assets)
| Cencora, Inc. | 4.28% |
| Eli Lilly and Co. | 4.27% |
| TG Therapeutics, Inc. | 4.11% |
| Exelixis, Inc. | 4.06% |
| Boston Scientific Corp. | 3.66% |
| Alignment Healthcare, Inc. | 3.52% |
| BridgeBio Pharma, Inc. | 3.48% |
| Guardant Health, Inc. | 3.45% |
| Axsome Therapeutics, Inc. | 3.31% |
| Krystal Biotech, Inc. | 3.31% |
| * Excluding money market fund holdings, if any. |
What Were The Fund Costs For The Last Year ?
(Based on a hypothetical $10,000 investment)
| Fund | Costs of a $10,000 investment | Costs paid as a percentage of a $10,000 investment |
| Invesco Dorsey Wright Industrials Momentum ETF | $61 | 0.60%† |
|
†
|
Reflects fee waivers and/or expense reimbursements, without which expenses would have been higher.
|
How Did The Fund Perform During The Period?
• During the fiscal year ended April 30, 2025, U.S. equities had strong performance in the beginning with a more challenging environment at the end due to uncertainty regarding global trade and tariff policy. During the period, industrials underperformed the broader stock market. In addition to the Fund's focus on industrials stocks, its momentum methodology led to lower exposure to megacap stocks, which created a performance headwind compared to the S&P 500® Industrials Index.
• The Fund is passively managed and seeks to track the investment results (before fees and expenses) of the Dorsey Wright Industrials Technical LeadersTM Index (the “Index”). The Fund generally will invest at least 90% of its total assets in securities that comprise the Index.
• For the fiscal year ended April 30, 2025, the Fund's performance, on a net asset value ("NAV") basis, 4.49%, differed from the return of the Index, 4.98%, primarily due to fees and expenses incurred by the Fund during the period.
What contributed to performance?
Sub-Industry Allocations | Aerospace & defense sub-industry, followed by the diversified support services and heavy electrical equipment sub-industries, respectively.
Positions | Howmet Aerospace, Inc., an aerospace & defense company, and American Superconductor Corp., an electrical components & equipment company (no longer held at fiscal year-end).
What detracted from performance?
Sub-Industry Allocations | Oil & gas equipment & services sub-industry, followed by the research & consulting services and construction materials sub-industries, respectively.
Positions | Vertiv Holdings Co., Class A, an electrical components & equipment company (no longer held at fiscal year-end), and Rocket Lab USA, Inc., an aerospace & defense company (no longer held at fiscal year-end).
How Has The Fund Historically Performed?
Growth of $10,000 Investment
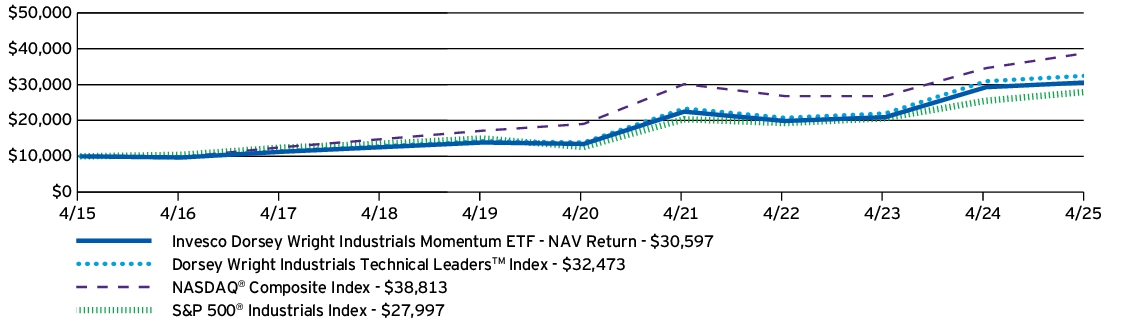
AVERAGE ANNUAL TOTAL RETURNS |
1 Year |
5 Years |
10 Years |
| Invesco Dorsey Wright Industrials Momentum ETF — NAV Return | 4.49% | 17.87% | 11.83% |
| Dorsey Wright Industrials Technical Leaders™ Index | 4.98% | 18.54% | 12.50% |
| NASDAQ® Composite Index | 12.22% | 15.32% | 14.52% |
| S&P 500® Industrials Index | 9.78% | 17.34% | 10.84% |
Performance figures do not reflect deduction of taxes a shareholder would pay on Fund distributions or sale of Fund shares.
- Effective August 28, 2024, the Fund changed its broad-based securities market benchmark from the S&P 500® Industrials Index to the NASDAQ® Composite Index to reflect that the NASDAQ® Composite Index can be considered more broadly representative of the overall applicable securities market.
What Are Key Statistics About The Fund?
(as of April 30, 2025)
| Fund net assets | $319,376,161 |
| Total number of portfolio holdings | 51 |
| Total advisory fees paid | $1,306,410 |
| Portfolio turnover rate | 152% |
What Comprised The Fund's Holdings?
(as of April 30, 2025)
Top ten holdings*
(% of net assets)
(% of net assets)
| Trane Technologies PLC | 4.30% |
| W.W. Grainger, Inc. | 4.27% |
| HEICO Corp. | 4.06% |
| TransDigm Group, Inc. | 3.78% |
| Howmet Aerospace, Inc. | 3.64% |
| Parker-Hannifin Corp. | 3.62% |
| Jabil, Inc. | 3.29% |
| Watsco, Inc. | 3.27% |
| Fiserv, Inc. | 3.23% |
| Packaging Corp. of America | 3.16% |
| * Excluding money market fund holdings, if any. |
Sub-industry allocation
(% of net assets)
(% of net assets)
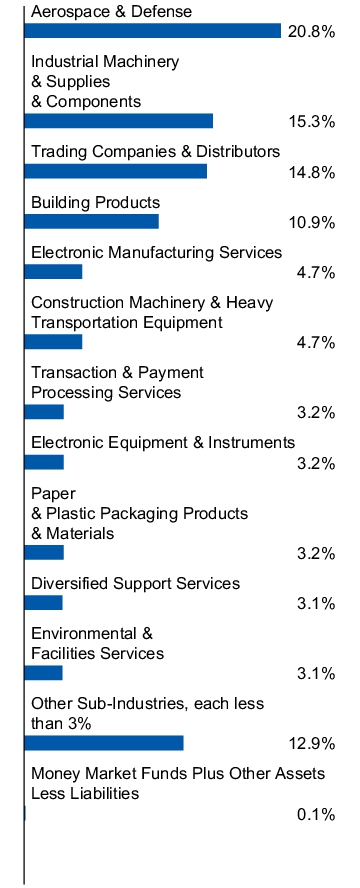
Top ten holdings*
(% of net assets)
(% of net assets)
| Trane Technologies PLC | 4.30% |
| W.W. Grainger, Inc. | 4.27% |
| HEICO Corp. | 4.06% |
| TransDigm Group, Inc. | 3.78% |
| Howmet Aerospace, Inc. | 3.64% |
| Parker-Hannifin Corp. | 3.62% |
| Jabil, Inc. | 3.29% |
| Watsco, Inc. | 3.27% |
| Fiserv, Inc. | 3.23% |
| Packaging Corp. of America | 3.16% |
| * Excluding money market fund holdings, if any. |
What Were The Fund Costs For The Last Year ?
(Based on a hypothetical $10,000 investment)
| Fund | Costs of a $10,000 investment | Costs paid as a percentage of a $10,000 investment |
| Invesco S&P 100 Equal Weight ETF | $27 | 0.25%† |
|
† |
Reflects fee waivers and/or expense reimbursements, without which expenses would have been higher. |
How Did The Fund Perform During The Period?
• During the fiscal year ended April 30, 2025, U.S. equities began the period with strong performance but experienced a more challenging environment near the end of the period due to uncertainty regarding global trade and tariff policy. The Fund's equal weighting methodology led to lower exposure to mega cap stocks within the S&P 100® Index, which was a performance headwind compared to the S&P 100® Index.
• The Fund is passively managed and seeks to track the investment results (before fees and expenses) of the S&P 100® Equal Weight Index (the “Index”). The Fund generally will invest at least 90% of its total assets in securities that comprise the Index.
• For the fiscal year ended April 30, 2025, the Fund's performance, on a net asset value ("NAV") basis, 12.89%, differed from the return of the Index, 13.19%, primarily due to fees and expenses incurred by the Fund during the period.
What contributed to performance?
Sector Allocations | Financials sector, followed by the communication services and information technology sectors, respectively.
Positions | Netflix, Inc., a communication services company, and Tesla, Inc., a consumer discretionary company.
What detracted from performance?
Sector Allocations | Energy sector, followed by the materials sector.
Positions | NIKE, Inc., Class B, a consumer discretionary company, and Target Corp., a consumer staples company.
How Has The Fund Historically Performed?
Growth of $10,000 Investment
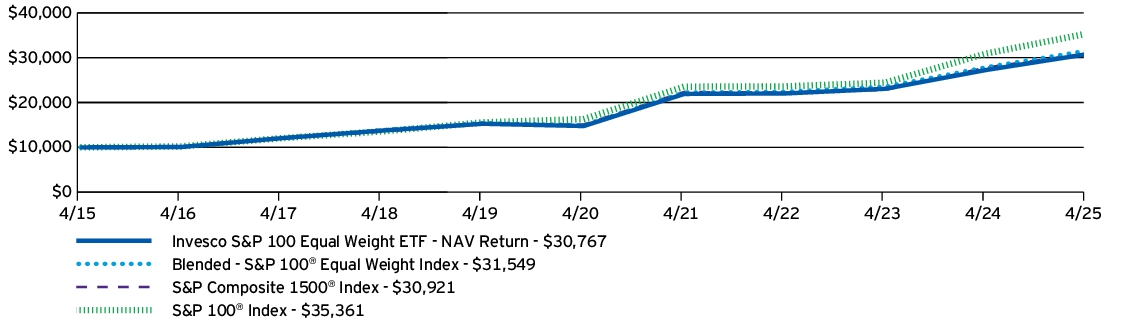
AVERAGE ANNUAL TOTAL RETURNS |
1 Year |
5 Years |
10 Years |
| Invesco S&P 100 Equal Weight ETF — NAV Return | 12.89% | 15.83% | 11.89% |
| Blended - S&P 100® Equal Weight Index | 13.19% | 16.13% | 12.18% |
| S&P Composite 1500® Index | 11.12% | 15.39% | 11.95% |
| S&P 100® Index | 14.38% | 16.77% | 13.46% |
Performance figures do not reflect deduction of taxes a shareholder would pay on Fund distributions or sale of Fund shares.
What Are Key Statistics About The Fund?
(as of April 30, 2025)
| Fund net assets | $1,184,351,957 |
| Total number of portfolio holdings | 104 |
| Total advisory fees paid | $1,735,155 |
| Portfolio turnover rate | 20% |
What Comprised The Fund's Holdings?
(as of April 30, 2025)
Top ten holdings*
(% of net assets)
(% of net assets)
| Palantir Technologies, Inc., Class A | 1.42% |
| Netflix, Inc. | 1.24% |
| Boeing Co. (The) | 1.16% |
| Booking Holdings, Inc. | 1.16% |
| Walmart, Inc. | 1.15% |
| Tesla, Inc. | 1.15% |
| ServiceNow, Inc. | 1.14% |
| Philip Morris International, Inc. | 1.14% |
| Charter Communications, Inc., Class A | 1.13% |
| Charles Schwab Corp. (The) | 1.10% |
| * Excluding money market fund holdings, if any. |
Sector allocation
(% of net assets)
(% of net assets)
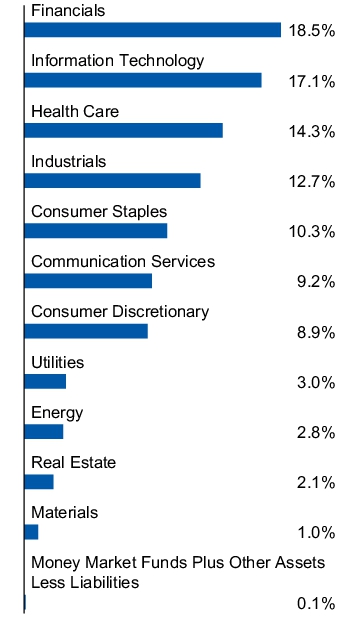
Top ten holdings*
(% of net assets)
(% of net assets)
| Palantir Technologies, Inc., Class A | 1.42% |
| Netflix, Inc. | 1.24% |
| Boeing Co. (The) | 1.16% |
| Booking Holdings, Inc. | 1.16% |
| Walmart, Inc. | 1.15% |
| Tesla, Inc. | 1.15% |
| ServiceNow, Inc. | 1.14% |
| Philip Morris International, Inc. | 1.14% |
| Charter Communications, Inc., Class A | 1.13% |
| Charles Schwab Corp. (The) | 1.10% |
| * Excluding money market fund holdings, if any. |
What Were The Fund Costs For The Last Year ?
(Based on a hypothetical $10,000 investment)
| Fund | Costs of a $10,000 investment | Costs paid as a percentage of a $10,000 investment |
| Invesco S&P MidCap Quality ETF | $24 | 0.25%† |
|
† |
Reflects fee waivers and/or expense reimbursements, without which expenses would have been higher. |
How Did The Fund Perform During The Period?
• During the fiscal year ended April 30, 2025, U.S. mid cap equities showed strong performance subsequent to the conclusion of the U.S. election but struggled near the end of the period due to uncertainty regarding global trade and tariff policy. The Fund's relative underperformance to the S&P MidCap 400® Index was primarily due to poor security selection results in the consumer staples and energy sectors. Underweights to the real estate, financials, and utilities sectors also detracted from relative performance.
• The Fund is passively managed and seeks to track the investment results (before fees and expenses) of the S&P MidCap 400® Quality Index (the “Index”). The Fund generally will invest at least 90% of its total assets in securities that comprise the Index.
• For the fiscal year ended April 30, 2025, the Fund's performance, on a net asset value ("NAV") basis, -5.32%, differed from the return of the Index, -5.07%, primarily due to fees and expenses incurred by the Fund during the period.
What contributed to performance?
Sector Allocations | Financials sector, followed by the health care and utilities sectors, respectively.
Positions | Erie Indemnity Co., Class A, a financials company (no longer held at fiscal year-end), and Comfort Systems USA, Inc., an industrials company.
What detracted from performance?
Sector Allocations | Consumer discretionary sector, followed by the energy and consumer staples sectors, respectively.
Positions | Celsius Holdings, Inc., a consumer staples company, and Weatherford International PLC, an energy company.
How Has The Fund Historically Performed?
Growth of $10,000 Investment
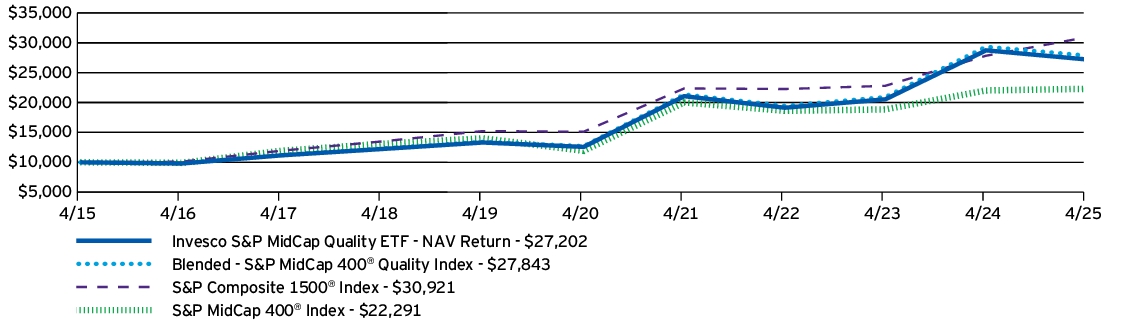
AVERAGE ANNUAL TOTAL RETURNS |
1 Year |
5 Years |
10 Years |
| Invesco S&P MidCap Quality ETF — NAV Return | -5.32% | 16.68% | 10.52% |
| Blended - S&P MidCap 400® Quality Index | -5.07% | 16.99% | 10.78% |
| S&P Composite 1500® Index | 11.12% | 15.39% | 11.95% |
| S&P MidCap 400® Index | 1.19% | 13.34% | 8.35% |
Performance figures do not reflect deduction of taxes a shareholder would pay on Fund distributions or sale of Fund shares.
- Effective August 28, 2024, the Fund changed its broad-based securities market benchmark from the S&P MidCap 400® Quality Index to the S&P Composite 1500® Index to reflect that the S&P Composite 1500® Index can be considered more broadly representative of the overall applicable securities market.
What Are Key Statistics About The Fund?
(as of April 30, 2025)
| Fund net assets | $4,754,899,329 |
| Total number of portfolio holdings | 81 |
| Total advisory fees paid | $10,729,353 |
| Portfolio turnover rate | 58% |
What Comprised The Fund's Holdings?
(as of April 30, 2025)
Top ten holdings*
(% of net assets)
(% of net assets)
| Carlisle Cos., Inc. | 4.28% |
| EMCOR Group, Inc. | 3.67% |
| DocuSign, Inc. | 3.63% |
| Manhattan Associates, Inc. | 2.74% |
| RenaissanceRe Holdings Ltd. | 2.69% |
| Comfort Systems USA, Inc. | 2.56% |
| Tenet Healthcare Corp. | 2.40% |
| Duolingo, Inc. | 2.13% |
| RPM International, Inc. | 2.12% |
| Graco, Inc. | 1.99% |
| * Excluding money market fund holdings, if any. |
Sector allocation
(% of net assets)
(% of net assets)
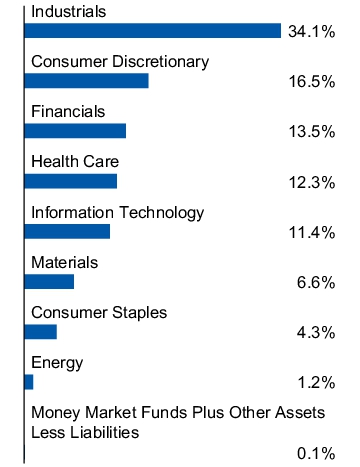
Top ten holdings*
(% of net assets)
(% of net assets)
| Carlisle Cos., Inc. | 4.28% |
| EMCOR Group, Inc. | 3.67% |
| DocuSign, Inc. | 3.63% |
| Manhattan Associates, Inc. | 2.74% |
| RenaissanceRe Holdings Ltd. | 2.69% |
| Comfort Systems USA, Inc. | 2.56% |
| Tenet Healthcare Corp. | 2.40% |
| Duolingo, Inc. | 2.13% |
| RPM International, Inc. | 2.12% |
| Graco, Inc. | 1.99% |
| * Excluding money market fund holdings, if any. |
What Were The Fund Costs For The Last Year ?
(Based on a hypothetical $10,000 investment)
| Fund | Costs of a $10,000 investment | Costs paid as a percentage of a $10,000 investment |
| Invesco Dorsey Wright Technology Momentum ETF | $63 | 0.60%† |
|
† |
Reflects fee waivers and/or expense reimbursements, without which expenses would have been higher. |
How Did The Fund Perform During The Period?
• During the fiscal year ended April 30, 2025, U.S. equities had strong performance in the beginning with a more challenging environment at the end due to uncertainty regarding global trade and tariff policy. During the period, information technology outperformed the broader stock market. However, despite the Fund's focus on information technology stocks, its momentum methodology created a performance headwind compared to the S&P 500® Information Technology Index.
• The Fund is passively managed and seeks to track the investment results (before fees and expenses) of the Dorsey Wright Technology Technical LeadersTM Index (the “Index”). The Fund generally will invest at least 90% of its total assets in securities that comprise the Index.
• For the fiscal year ended April 30, 2025, the Fund's performance, on a net asset value ("NAV") basis, 9.36%, differed from the return of the Index, 9.98%, primarily due to fees and expenses incurred by the Fund during the period.
What contributed to performance?
Sub-Industry Allocations | Application software sub-industry, followed by the alternative carriers and communications equipment sub-industries, respectively.
Positions | AppLovin Corp., Class A, an application software company (no longer held at fiscal year-end), and AST SpaceMobile, Inc., Class A, an alternative carriers company (no longer held at fiscal year-end).
What detracted from performance?
Sub-Industry Allocations | Semiconductors sub-industry, followed by the technology hardware storage & peripherals and semiconductor materials & equipment sub-industries, respectively.
Positions | Rigetti Computing, Inc., a semiconductors company (no longer held at fiscal year-end), and SoundHound AI, Inc., Class A, an application software company (no longer held at fiscal year-end).
How Has The Fund Historically Performed?
Growth of $10,000 Investment
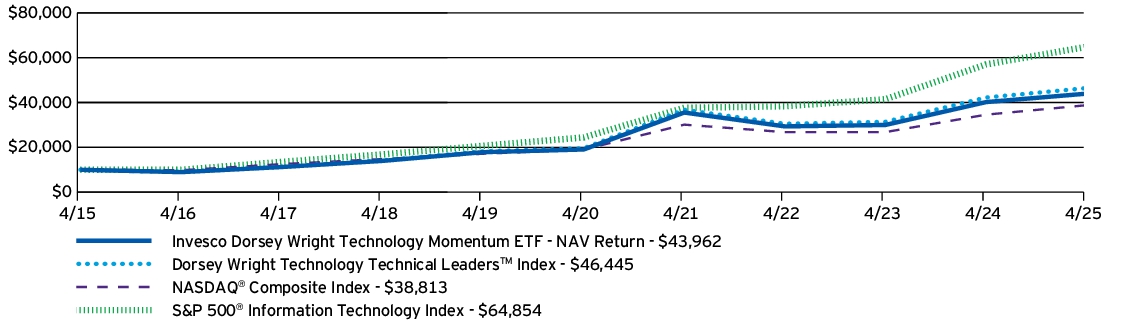
AVERAGE ANNUAL TOTAL RETURNS |
1 Year |
5 Years |
10 Years |
| Invesco Dorsey Wright Technology Momentum ETF — NAV Return | 9.36% | 18.20% | 15.96% |
| Dorsey Wright Technology Technical Leaders™ Index | 9.98% | 18.85% | 16.60% |
| NASDAQ® Composite Index | 12.22% | 15.32% | 14.52% |
| S&P 500® Information Technology Index | 13.79% | 21.56% | 20.56% |
Performance figures do not reflect deduction of taxes a shareholder would pay on Fund distributions or sale of Fund shares.
- Effective August 28, 2024, the Fund changed its broad-based securities market benchmark from the S&P 500® Information Technology Index to the NASDAQ® Composite Index to reflect that the NASDAQ® Composite Index can be considered more broadly representative of the overall applicable securities market.
What Are Key Statistics About The Fund?
(as of April 30, 2025)
| Fund net assets | $354,343,584 |
| Total number of portfolio holdings | 37 |
| Total advisory fees paid | $1,988,429 |
| Portfolio turnover rate | 222% |
What Comprised The Fund's Holdings?
(as of April 30, 2025)
Top ten holdings*
(% of net assets)
(% of net assets)
| Apple, Inc. | 8.91% |
| Meta Platforms, Inc., Class A | 4.52% |
| Nutanix, Inc., Class A | 4.14% |
| Palo Alto Networks, Inc. | 4.02% |
| Rubrik, Inc., Class A | 3.79% |
| Guidewire Software, Inc. | 3.70% |
| Telephone and Data Systems, Inc. | 3.58% |
| Microsoft Corp. | 3.46% |
| Toast, Inc., Class A | 3.41% |
| Zscaler, Inc. | 3.24% |
| * Excluding money market fund holdings, if any. |
Sub-industry allocation
(% of net assets)
(% of net assets)
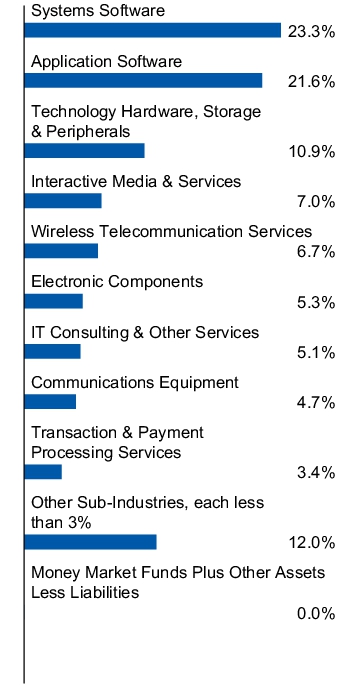
Top ten holdings*
(% of net assets)
(% of net assets)
| Apple, Inc. | 8.91% |
| Meta Platforms, Inc., Class A | 4.52% |
| Nutanix, Inc., Class A | 4.14% |
| Palo Alto Networks, Inc. | 4.02% |
| Rubrik, Inc., Class A | 3.79% |
| Guidewire Software, Inc. | 3.70% |
| Telephone and Data Systems, Inc. | 3.58% |
| Microsoft Corp. | 3.46% |
| Toast, Inc., Class A | 3.41% |
| Zscaler, Inc. | 3.24% |
| * Excluding money market fund holdings, if any. |
What Were The Fund Costs For The Last Year ?
(Based on a hypothetical $10,000 investment)
| Fund | Costs of a $10,000 investment | Costs paid as a percentage of a $10,000 investment |
| Invesco BuyBack AchieversTM ETF | $65 | 0.62% |
How Did The Fund Perform During The Period?
• During the fiscal year ended April 30, 2025, U.S. equities began the period with strong performance but experienced a more challenging environment near the end of the period due to uncertainty regarding global trade and tariff policy. Growth outperformed value. The slight value tilt caused by the Fund's security selection methodology, combined with relatively poor security selection results in the industrials, energy, and communication services sectors, proved to be relative headwinds to performance compared to the S&P 500® Index.
• The Fund is passively managed and seeks to track the investment results (before fees and expenses) of the Nasdaq US BuyBack AchieversTM Index (the “Index”). The Fund generally will invest at least 90% of its total assets in securities that comprise the Index.
• For the fiscal year ended April 30, 2025, the Fund's performance, on a net asset value ("NAV") basis, 9.20%, differed from the return of the Index, 9.82%, primarily due to fees and expenses incurred by the Fund during the period.
What contributed to performance?
Sector Allocations | Financials sector, followed by the information technology and consumer discretionary sectors, respectively.
Positions | AppLovin Corp., Class A, an information technology company (no longer held at fiscal year-end), and Booking Holdings, Inc., a consumer discretionary company.
What detracted from performance?
Sector Allocations | Energy sector, followed by the materials sector.
Positions | Caterpillar, Inc., an industrials company, and Phillips 66, an energy company.
How Has The Fund Historically Performed?
Growth of $10,000 Investment
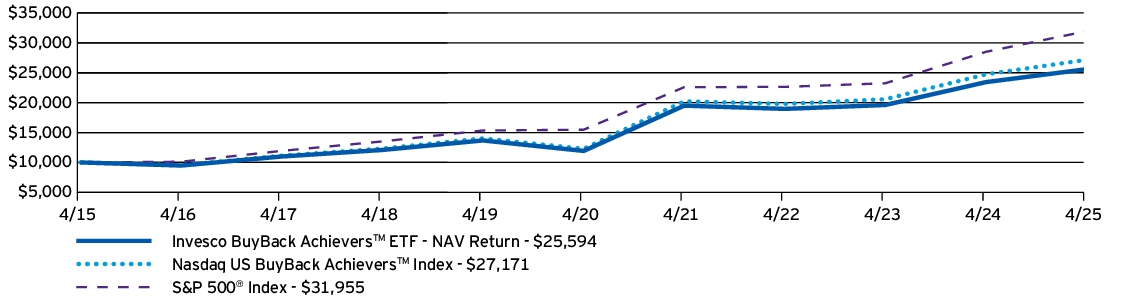
AVERAGE ANNUAL TOTAL RETURNS |
1 Year |
5 Years |
10 Years |
| Invesco BuyBack AchieversTM ETF — NAV Return | 9.20% | 16.50% | 9.85% |
| Nasdaq US BuyBack Achievers™ Index | 9.82% | 17.20% | 10.51% |
| S&P 500® Index | 12.10% | 15.61% | 12.32% |
Performance figures do not reflect deduction of taxes a shareholder would pay on Fund distributions or sale of Fund shares.
- Effective August 28, 2024, the Fund changed its broad-based securities market benchmark from the Nasdaq US BuyBack Achievers™ Index to the S&P 500® Index to reflect that the S&P 500® Index can be considered more broadly representative of the overall applicable securities market.
What Are Key Statistics About The Fund?
(as of April 30, 2025)
| Fund net assets | $1,162,999,859 |
| Total number of portfolio holdings | 204 |
| Total advisory fees paid | $5,922,457 |
| Portfolio turnover rate | 59% |
What Comprised The Fund's Holdings?
(as of April 30, 2025)
Top ten holdings*
(% of net assets)
(% of net assets)
| Booking Holdings, Inc. | 5.66% |
| Wells Fargo & Co. | 5.06% |
| RTX Corp. | 4.87% |
| Caterpillar, Inc. | 4.79% |
| Comcast Corp., Class A | 4.74% |
| PayPal Holdings, Inc. | 3.23% |
| HCA Healthcare, Inc. | 3.03% |
| Marriott International, Inc., Class A | 2.87% |
| Bank of New York Mellon Corp. (The) | 2.69% |
| Cheniere Energy, Inc. | 2.56% |
| * Excluding money market fund holdings, if any. |
Sector allocation
(% of net assets)
(% of net assets)
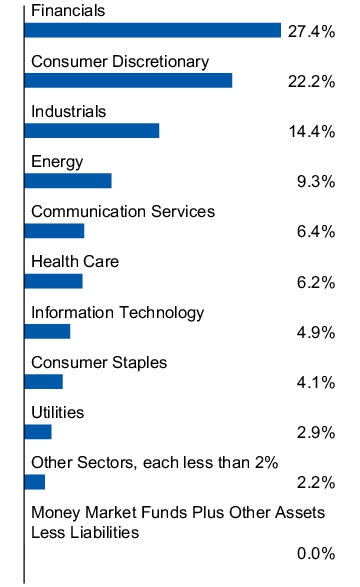
Top ten holdings*
(% of net assets)
(% of net assets)
| Booking Holdings, Inc. | 5.66% |
| Wells Fargo & Co. | 5.06% |
| RTX Corp. | 4.87% |
| Caterpillar, Inc. | 4.79% |
| Comcast Corp., Class A | 4.74% |
| PayPal Holdings, Inc. | 3.23% |
| HCA Healthcare, Inc. | 3.03% |
| Marriott International, Inc., Class A | 2.87% |
| Bank of New York Mellon Corp. (The) | 2.69% |
| Cheniere Energy, Inc. | 2.56% |
| * Excluding money market fund holdings, if any. |
This report describes changes to the Fund that occurred during the reporting period.
What Were The Fund Costs For The Last Year ?
(Based on a hypothetical $10,000 investment)
| Fund | Costs of a $10,000 investment | Costs paid as a percentage of a $10,000 investment |
| Invesco RAFI US 1500 Small-Mid ETF | $39 | 0.39% |
How Did The Fund Perform During The Period?
• During the fiscal year ended April 30, 2025, U.S. small and mid cap equities showed strong performance subsequent to the conclusion of the U.S. election but struggled near the end of the period due to uncertainty regarding global trade and tariff policy. The Fund slightly outperformed the Russell 2000® Index due primarily to individual security selection in the information technology sector.
• Effective March 24, 2025, the Fund changed its name from Invesco FTSE RAFI US 1500 Small-Mid ETF to Invesco RAFI US 1500 Small-Mid ETF and the underlying index from FTSE RAFITM US 1500 Mid Small Index (the "Previous Index") to RAFITM Fundamental Select US 1500 Index (the "Index"). At that time, the Fund changed its investment objective and investment policies.
• The Fund is passively managed and seeks to track the investment results (before fees and expenses) of the Index, and prior to March 24, 2025, the Previous Index. The Fund generally will invest at least 90% of its total assets in securities that comprise the Index.
• For the fiscal year ended April 30, 2025, the Fund's performance, on a net asset value ("NAV") basis, 1.16%, differed from the return of the Custom Invesco RAFI U.S. 1500 Small-Mid ETF Benchmark (a composite of the returns of the Previous Index through March 21, 2025, and of the Index for the remainder of the fiscal year ended April 30, 2025), 1.42%, primarily due to fees and expenses incurred by the Fund during the period.
What contributed to performance?
Sector Allocations | Financials sector, followed by the information technology and industrials sectors, respectively.
Positions | Palantir Technologies, Inc., Class A, an information technology company, and Carvana Co., a consumer discretionary company.
What detracted from performance?
Sector Allocations | Energy sector, followed by the consumer discretionary and health care sectors, respectively.
Positions | B. Riley Financial, Inc., a financials company, and Tilray Brands, Inc., Class 2, a health care company.
How Has The Fund Historically Performed?
Growth of $10,000 Investment
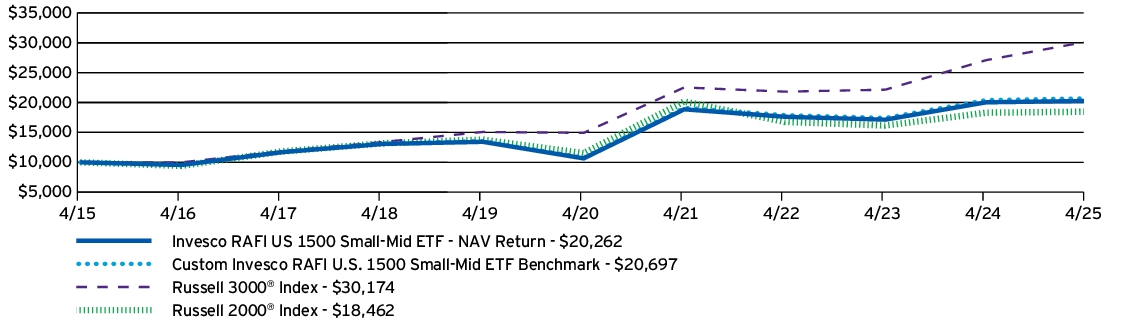
AVERAGE ANNUAL TOTAL RETURNS |
1 Year |
5 Years |
10 Years |
| Invesco RAFI US 1500 Small-Mid ETF — NAV Return | 1.16% | 13.72% | 7.32% |
| Custom Invesco RAFI U.S. 1500 Small-Mid ETF Benchmark | 1.42% | 13.97% | 7.55% |
| RAFI™ Fundamental Select US 1500 Index | |||
| FTSE RAFI™ US 1500 Mid Small Index | 0.85% | 13.84% | 7.48% |
| Russell 3000® Index | 11.40% | 15.12% | 11.68% |
| Russell 2000® Index | 0.87% | 9.88% | 6.32% |
Performance figures do not reflect deduction of taxes a shareholder would pay on Fund distributions or sale of Fund shares.
What Are Key Statistics About The Fund?
(as of April 30, 2025)
| Fund net assets | $2,158,333,726 |
| Total number of portfolio holdings | 1,735 |
| Total advisory fees paid | $7,145,507 |
| Portfolio turnover rate | 17% |
What Comprised The Fund's Holdings?
(as of April 30, 2025)
Top ten holdings*
(% of net assets)
(% of net assets)
| Palantir Technologies, Inc., Class A | 0.56% |
| AppLovin Corp., Class A | 0.55% |
| Carvana Co. | 0.52% |
| Carpenter Technology Corp. | 0.45% |
| Brinker International, Inc. | 0.42% |
| Adtalem Global Education, Inc. | 0.37% |
| Texas Pacific Land Corp. | 0.36% |
| Virtu Financial, Inc., Class A | 0.35% |
| ACI Worldwide, Inc. | 0.29% |
| Primoris Services Corp. | 0.29% |
| * Excluding money market fund holdings, if any. |
Sector allocation
(% of net assets)
(% of net assets)
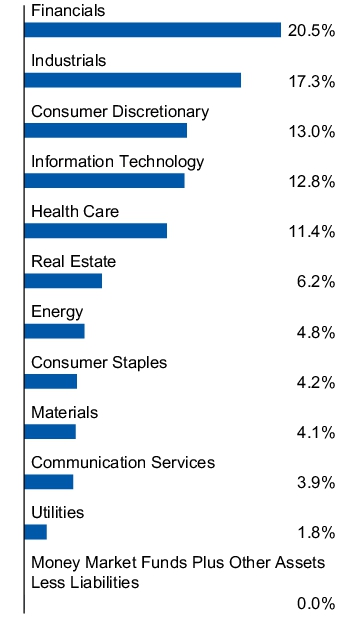
Top ten holdings*
(% of net assets)
(% of net assets)
| Palantir Technologies, Inc., Class A | 0.56% |
| AppLovin Corp., Class A | 0.55% |
| Carvana Co. | 0.52% |
| Carpenter Technology Corp. | 0.45% |
| Brinker International, Inc. | 0.42% |
| Adtalem Global Education, Inc. | 0.37% |
| Texas Pacific Land Corp. | 0.36% |
| Virtu Financial, Inc., Class A | 0.35% |
| ACI Worldwide, Inc. | 0.29% |
| Primoris Services Corp. | 0.29% |
| * Excluding money market fund holdings, if any. |
How Has The Fund Changed Over The Past Year?
This is a summary of certain changes to the Fund since April 30, 2024. For more complete information, you may review the Fund's prospectus, which is available at invesco.com/reports or upon request at (800) 983-0903.
At a meeting held on December 13, 2024, the Board of Trustees of the Fund approved changes to the name, underlying index, index provider, investment objective and principal investment strategy of the Fund. These changes took effect on March 24, 2025.
At a meeting held on December 13, 2024, the Board of Trustees of the Fund approved changes to the name, underlying index, index provider, investment objective and principal investment strategy of the Fund. These changes took effect on March 24, 2025.
At a meeting held on December 13, 2024, the Board of Trustees of the Fund approved changes to the name, underlying index, index provider, investment objective and principal investment strategy of the Fund. These changes took effect on March 24, 2025.
At a meeting held on December 13, 2024, the Board of Trustees of the Fund approved changes to the name, underlying index, index provider, investment objective and principal investment strategy of the Fund. These changes took effect on March 24, 2025.
This is a summary of certain changes to the Fund since April 30, 2024. For more complete information, you may review the Fund's prospectus, which is available at invesco.com/reports or upon request at (800) 983-0903.
What Were The Fund Costs For The Last Year ?
(Based on a hypothetical $10,000 investment)
| Fund | Costs of a $10,000 investment | Costs paid as a percentage of a $10,000 investment |
| Invesco MSCI Sustainable Future ETF | $64 | 0.65%† |
|
† |
Reflects fee waivers and/or expense reimbursements, without which expenses would have been higher. |
How Did The Fund Perform During The Period?
• During the fiscal year ended April 30, 2025, sustainability themes underperformed global equity markets primarily due to stock selection within U.S. Solar manufacturing. U.S. solar manufacturing continued to struggle as the industry continued to grapple with oversupply, simultaneously as electric vehicle consumers appeared to be tapped out dealing two major headwinds to the clean energy space. The Fund’s exposure to positive Chinese equity markets and a steady water theme partially offset these detractors resulting in solid performance versus its clean tech peers.
• The Fund is passively managed and seeks to track the investment results (before fees and expenses) of the MSCI Global Environment Select Index (the “Index”). The Fund generally will invest at least 90% of its total assets in securities that comprise the Index.
• For the fiscal year ended April 30, 2025, the Fund's performance, on a net asset value ("NAV") basis, -2.08%, differed from the return of the Index, -1.72%, primarily due to fees and expenses incurred by the Fund during the period, partially offset by income received from the securities lending program in which the Fund participates.
What contributed to performance?
Industry Allocations | Automobiles industry, followed by retail REITs and specialized REITs industries, respectively.
Positions | Tesla, Inc., an automobiles company, and XPeng, Inc., an automobiles company.
What detracted from performance?
Industry Allocations | Semiconductors & semiconductor equipment industry, followed by the electrical equipment industry.
Positions | Vestas Wind Systems A/S, an electrical equipment company, and Enphase Energy, Inc., a semiconductor & semiconductors equipment company.
How Has The Fund Historically Performed?
Growth of $10,000 Investment
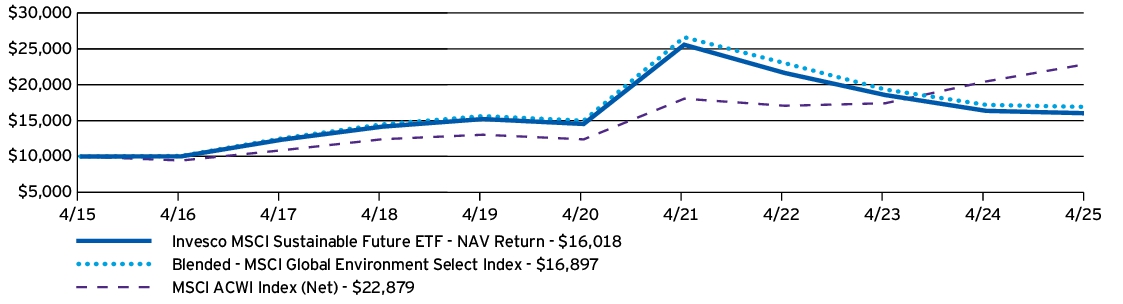
AVERAGE ANNUAL TOTAL RETURNS |
1 Year |
5 Years |
10 Years |
| Invesco MSCI Sustainable Future ETF — NAV Return | -2.08% | 1.97% | 4.82% |
| Blended - MSCI Global Environment Select Index | -1.72% | 2.43% | 5.39% |
| MSCI ACWI Index (Net) | 11.84% | 13.07% | 8.63% |
Performance figures do not reflect deduction of taxes a shareholder would pay on Fund distributions or sale of Fund shares.
What Are Key Statistics About The Fund?
(as of April 30, 2025)
| Fund net assets | $137,953,273 |
| Total number of portfolio holdings | 152 |
| Total advisory fees paid | $788,411 |
| Portfolio turnover rate | 31% |
What Comprised The Fund's Holdings?
(as of April 30, 2025)
Top ten holdings*
(% of net assets)
(% of net assets)
| BYD Co. Ltd., H Shares | 6.25% |
| Digital Realty Trust, Inc. | 5.08% |
| Tesla, Inc. | 4.18% |
| NVIDIA Corp. | 4.10% |
| Li Auto, Inc., A Shares | 3.47% |
| Vestas Wind Systems A/S | 3.11% |
| Kingspan Group PLC | 3.01% |
| First Solar, Inc. | 2.94% |
| XPeng, Inc. | 2.66% |
| LG Energy Solution Ltd. | 2.46% |
| * Excluding money market fund holdings, if any. |
Sector allocation
(% of net assets)
(% of net assets)
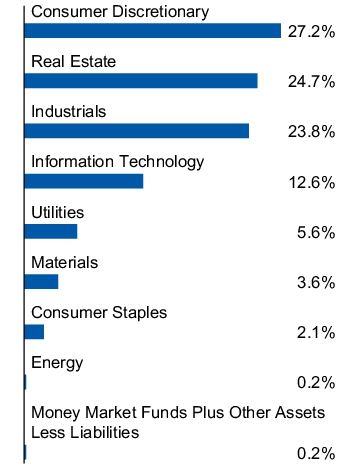
Top ten holdings*
(% of net assets)
(% of net assets)
| BYD Co. Ltd., H Shares | 6.25% |
| Digital Realty Trust, Inc. | 5.08% |
| Tesla, Inc. | 4.18% |
| NVIDIA Corp. | 4.10% |
| Li Auto, Inc., A Shares | 3.47% |
| Vestas Wind Systems A/S | 3.11% |
| Kingspan Group PLC | 3.01% |
| First Solar, Inc. | 2.94% |
| XPeng, Inc. | 2.66% |
| LG Energy Solution Ltd. | 2.46% |
| * Excluding money market fund holdings, if any. |
What Were The Fund Costs For The Last Year ?
(Based on a hypothetical $10,000 investment)
| Fund | Costs of a $10,000 investment | Costs paid as a percentage of a $10,000 investment |
| Invesco Dorsey Wright Basic Materials Momentum ETF | $59 | 0.60%† |
|
† |
Reflects fee waivers and/or expense reimbursements, without which expenses would have been higher. |
How Did The Fund Perform During The Period?
• During the fiscal year ended April 30, 2025, U.S. equities had strong performance in the beginning with a more challenging environment at the end due to uncertainty regarding global trade and tariff policy. During the period, materials underperformed the broader stock market. In addition to the Fund's focus on materials stocks, its momentum methodology led to lower exposure to megacap stocks, which created a performance headwind compared to the S&P 500® Materials Index.
• The Fund is passively managed and seeks to track the investment results (before fees and expenses) of the Dorsey Wright Basic Materials Technical LeadersTM Index (the “Index”). The Fund generally will invest at least 90% of its total assets in securities that comprise the Index.
• For the fiscal year ended April 30, 2025, the Fund's performance, on a net asset value ("NAV") basis, -4.47%, differed from the return of the Index, -3.98%, primarily due to fees and expenses incurred by the Fund during the period.
What contributed to performance?
Sub-Industry Allocations | Gold sub-industry, followed by the steel and forest products sub-industries, respectively.
Positions | Carpenter Technology Corp., a steel company, and Louisiana-Pacific Corp., a forest products company.
What detracted from performance?
Sub-Industry Allocations | Specialty chemicals sub-industry, followed by the aluminum and commodity chemicals sub-industries, respectively.
Positions | Alcoa Corp., an aluminum company, and Avery Dennison Corp., a paper & plastic packaging products & materials company.
How Has The Fund Historically Performed?
Growth of $10,000 Investment
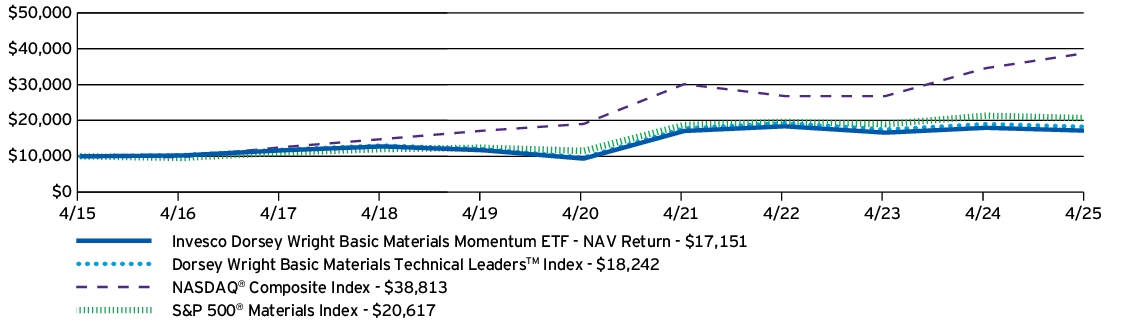
AVERAGE ANNUAL TOTAL RETURNS |
1 Year |
5 Years |
10 Years |
| Invesco Dorsey Wright Basic Materials Momentum ETF — NAV Return | -4.47% | 12.87% | 5.54% |
| Dorsey Wright Basic Materials Technical Leaders™ Index | -3.98% | 13.50% | 6.20% |
| NASDAQ® Composite Index | 12.22% | 15.32% | 14.52% |
| S&P 500® Materials Index | -3.28% | 12.36% | 7.50% |
Performance figures do not reflect deduction of taxes a shareholder would pay on Fund distributions or sale of Fund shares.
- Effective August 28, 2024, the Fund changed its broad-based securities market benchmark from the S&P 500® Materials Index to the NASDAQ® Composite Index to reflect that the NASDAQ® Composite Index can be considered more broadly representative of the overall applicable securities market.
What Are Key Statistics About The Fund?
(as of April 30, 2025)
| Fund net assets | $46,315,775 |
| Total number of portfolio holdings | 46 |
| Total advisory fees paid | $183,752 |
| Portfolio turnover rate | 69% |
What Comprised The Fund's Holdings?
(as of April 30, 2025)
Top ten holdings*
(% of net assets)
(% of net assets)
| Carpenter Technology Corp. | 5.44% |
| Avery Dennison Corp. | 4.85% |
| Linde PLC | 4.79% |
| Corteva, Inc. | 3.90% |
| Reliance, Inc. | 3.62% |
| CF Industries Holdings, Inc. | 3.44% |
| Nucor Corp. | 3.01% |
| Eastman Chemical Co. | 2.95% |
| Newmont Corp. | 2.89% |
| Hecla Mining Co. | 2.64% |
| * Excluding money market fund holdings, if any. |
Sub-industry allocation
(% of net assets)
(% of net assets)
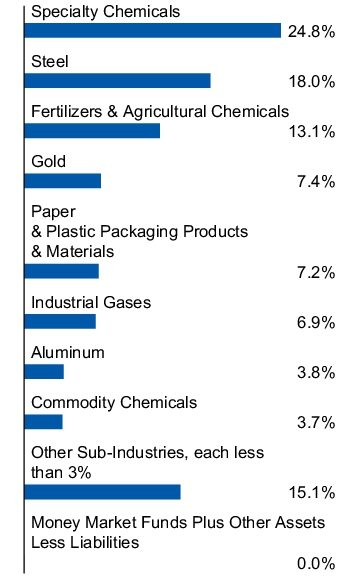
Top ten holdings*
(% of net assets)
(% of net assets)
| Carpenter Technology Corp. | 5.44% |
| Avery Dennison Corp. | 4.85% |
| Linde PLC | 4.79% |
| Corteva, Inc. | 3.90% |
| Reliance, Inc. | 3.62% |
| CF Industries Holdings, Inc. | 3.44% |
| Nucor Corp. | 3.01% |
| Eastman Chemical Co. | 2.95% |
| Newmont Corp. | 2.89% |
| Hecla Mining Co. | 2.64% |
| * Excluding money market fund holdings, if any. |
What Were The Fund Costs For The Last Year ?
(Based on a hypothetical $10,000 investment)
| Fund | Costs of a $10,000 investment | Costs paid as a percentage of a $10,000 investment |
| Invesco Dorsey Wright Consumer Cyclicals Momentum ETF | $59 | 0.60%† |
|
† |
Reflects fee waivers and/or expense reimbursements, without which expenses would have been higher. |
How Did The Fund Perform During The Period?
• During the fiscal year ended April 30, 2025, U.S. equities had strong performance in the beginning with a more challenging environment at the end due to uncertainty regarding global trade and tariff policy. During the period, consumer cyclical stocks outperformed the broader stock market. However, despite the Fund's focus on consumer cyclical stocks, its momentum methodology led to lower exposure to mega-cap stocks as well as a large allocation to the homebuilding sub-industry, which created a performance headwind compared to the S&P 500® Consumer Discretionary Index.
• The Fund is passively managed and seeks to track the investment results (before fees and expenses) of the Dorsey Wright Consumer Cyclicals Technical LeadersTM Index (the “Index”). The Fund generally will invest at least 90% of its total assets in securities that comprise the Index.
• For the fiscal year ended April 30, 2025, the Fund's performance, on a net asset value ("NAV") basis, -4.10%, differed from the return of the Index, -3.56%, primarily due to fees and expenses incurred by the Fund during the period.
What contributed to performance?
Sub-Industry Allocations | Automotive retail sub-industry, followed by the movies & entertainment and hotels, resorts & cruise lines sub-industries, respectively.
Positions | Abercrombie & Fitch Co., Class A, an apparel retail company (no longer held at fiscal year-end), and Acushnet Holdings Corp., a leisure products company (no longer held at fiscal year-end).
What detracted from performance?
Sub-Industry Allocations | Homebuilding sub-industry, followed by the apparel retail sub-industry.
Positions | Victoria's Secret & Co., an apparel retail company (no longer held at fiscal year-end), and RealReal, Inc., an apparel retail company (no longer held at fiscal year-end).
How Has The Fund Historically Performed?
Growth of $10,000 Investment
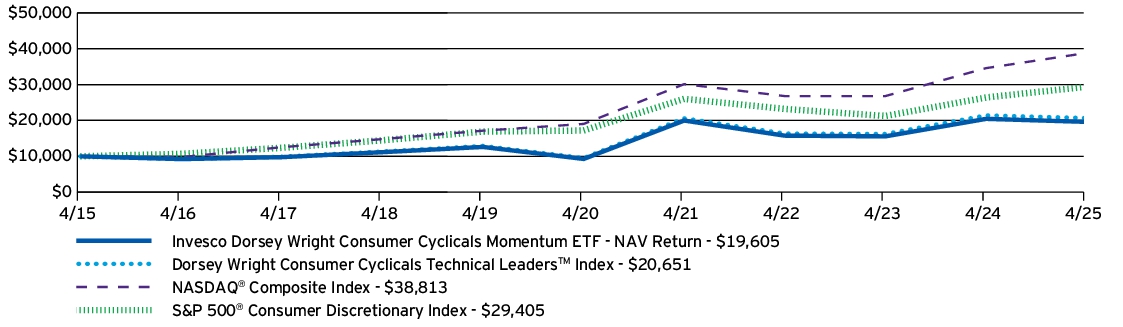
AVERAGE ANNUAL TOTAL RETURNS |
1 Year |
5 Years |
10 Years |
| Invesco Dorsey Wright Consumer Cyclicals Momentum ETF — NAV Return | -4.10% | 16.15% | 6.96% |
| Dorsey Wright Consumer Cyclicals Technical Leaders™ Index | -3.56% | 16.72% | 7.52% |
| NASDAQ® Composite Index | 12.22% | 15.32% | 14.52% |
| S&P 500® Consumer Discretionary Index | 11.34% | 11.32% | 11.39% |
Performance figures do not reflect deduction of taxes a shareholder would pay on Fund distributions or sale of Fund shares.
- Effective August 28, 2024, the Fund changed its broad-based securities market benchmark from the S&P 500® Consumer Discretionary Index to the NASDAQ® Composite Index to reflect that the NASDAQ® Composite Index can be considered more broadly representative of the overall applicable securities market.
What Are Key Statistics About The Fund?
(as of April 30, 2025)
| Fund net assets | $51,016,480 |
| Total number of portfolio holdings | 39 |
| Total advisory fees paid | $216,916 |
| Portfolio turnover rate | 189% |
What Comprised The Fund's Holdings?
(as of April 30, 2025)
Top ten holdings*
(% of net assets)
(% of net assets)
| O'Reilly Automotive, Inc. | 5.41% |
| Netflix, Inc. | 4.16% |
| Cardinal Health, Inc. | 3.94% |
| Royal Caribbean Cruises Ltd. | 3.88% |
| Somnigroup International, Inc. | 3.83% |
| DoorDash, Inc., Class A | 3.71% |
| Amazon.com, Inc. | 3.43% |
| Tapestry, Inc. | 3.43% |
| McKesson Corp. | 3.39% |
| Ralph Lauren Corp. | 3.34% |
| * Excluding money market fund holdings, if any. |
Sub-industry allocation
(% of net assets)
(% of net assets)
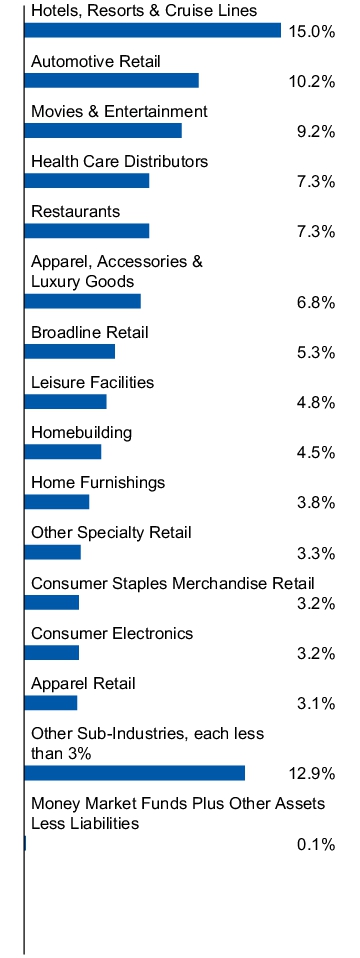
Top ten holdings*
(% of net assets)
(% of net assets)
| O'Reilly Automotive, Inc. | 5.41% |
| Netflix, Inc. | 4.16% |
| Cardinal Health, Inc. | 3.94% |
| Royal Caribbean Cruises Ltd. | 3.88% |
| Somnigroup International, Inc. | 3.83% |
| DoorDash, Inc., Class A | 3.71% |
| Amazon.com, Inc. | 3.43% |
| Tapestry, Inc. | 3.43% |
| McKesson Corp. | 3.39% |
| Ralph Lauren Corp. | 3.34% |
| * Excluding money market fund holdings, if any. |
What Were The Fund Costs For The Last Year ?
(Based on a hypothetical $10,000 investment)
| Fund | Costs of a $10,000 investment | Costs paid as a percentage of a $10,000 investment |
| Invesco Dorsey Wright Consumer Staples Momentum ETF | $65 | 0.60%† |
|
† |
Reflects fee waivers and/or expense reimbursements, without which expenses would have been higher. |
How Did The Fund Perform During The Period?
• During the fiscal year ended April 30, 2025, U.S. equities had strong performance in the beginning with a more challenging environment at the end due to uncertainty regarding global trade and tariff policy. During the period, consumer staples stocks outperformed the broader stock market. In addition to the Fund's focus on consumer staples stocks, its momentum methodology created a performance tailwind compared to the S&P 500® Consumer Staples Index.
• The Fund is passively managed and seeks to track the investment results (before fees and expenses) of the Dorsey Wright Consumer Staples Technical LeadersTM Index (the “Index”). The Fund generally will invest at least 90% of its total assets in securities that comprise the Index.
• For the fiscal year ended April 30, 2025, the Fund's performance, on a net asset value ("NAV") basis, 17.09%, differed from the return of the Index, 17.79%, primarily due to fees and expenses incurred by the Fund during the period.
What contributed to performance?
Sub-Industry Allocations | Education services sub-industry, followed by the food retail and food distributors sub-industries, respectively.
Positions | Sprouts Farmers Market, Inc., a food retail company, and Stride, Inc., an education services company.
What detracted from performance?
Sub-Industry Allocations | Packaged foods & meats sub-industry, followed by the personal care products and household products sub-industries, respectively.
Positions | Vital Farms, Inc., a packaged foods & meats company, and e.l.f. Beauty, Inc., a personal care products company (no longer held at fiscal year-end).
How Has The Fund Historically Performed?
Growth of $10,000 Investment
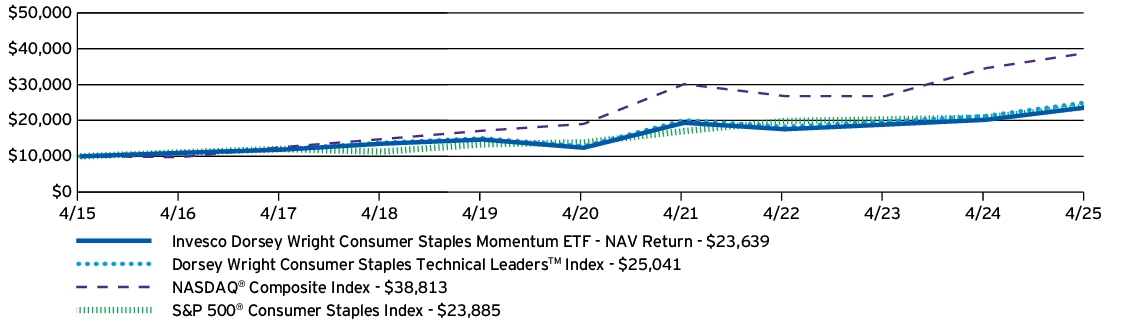
AVERAGE ANNUAL TOTAL RETURNS |
1 Year |
5 Years |
10 Years |
| Invesco Dorsey Wright Consumer Staples Momentum ETF — NAV Return | 17.09% | 13.81% | 8.98% |
| Dorsey Wright Consumer Staples Technical Leaders™ Index | 17.79% | 14.41% | 9.61% |
| NASDAQ® Composite Index | 12.22% | 15.32% | 14.52% |
| S&P 500® Consumer Staples Index | 14.84% | 11.49% | 9.10% |
Performance figures do not reflect deduction of taxes a shareholder would pay on Fund distributions or sale of Fund shares.
- Effective August 28, 2024, the Fund changed its broad-based securities market benchmark from the S&P 500® Consumer Staples Index to the NASDAQ® Composite Index to reflect that the NASDAQ® Composite Index can be considered more broadly representative of the overall applicable securities market.
What Are Key Statistics About The Fund?
(as of April 30, 2025)
| Fund net assets | $91,656,111 |
| Total number of portfolio holdings | 49 |
| Total advisory fees paid | $321,942 |
| Portfolio turnover rate | 104% |
What Comprised The Fund's Holdings?
(as of April 30, 2025)
Top ten holdings*
(% of net assets)
(% of net assets)
| Costco Wholesale Corp. | 3.72% |
| Casey's General Stores, Inc. | 3.63% |
| Sprouts Farmers Market, Inc. | 3.53% |
| Stride, Inc. | 3.52% |
| BJ's Wholesale Club Holdings, Inc. | 3.43% |
| Kroger Co. (The) | 3.34% |
| Service Corp. International | 3.29% |
| Monster Beverage Corp. | 3.29% |
| Church & Dwight Co., Inc. | 3.22% |
| Philip Morris International, Inc. | 3.07% |
| * Excluding money market fund holdings, if any. |
Sub-industry allocation
(% of net assets)
(% of net assets)
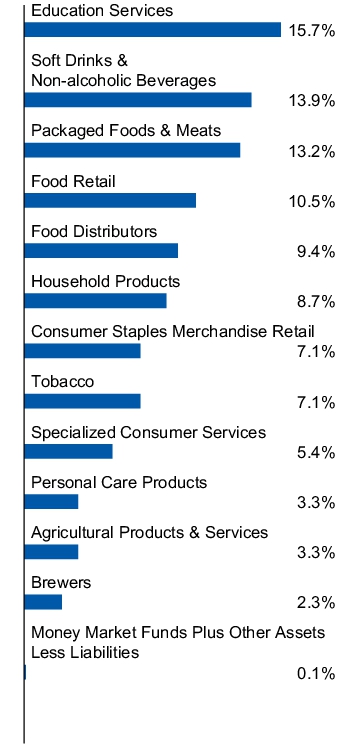
Top ten holdings*
(% of net assets)
(% of net assets)
| Costco Wholesale Corp. | 3.72% |
| Casey's General Stores, Inc. | 3.63% |
| Sprouts Farmers Market, Inc. | 3.53% |
| Stride, Inc. | 3.52% |
| BJ's Wholesale Club Holdings, Inc. | 3.43% |
| Kroger Co. (The) | 3.34% |
| Service Corp. International | 3.29% |
| Monster Beverage Corp. | 3.29% |
| Church & Dwight Co., Inc. | 3.22% |
| Philip Morris International, Inc. | 3.07% |
| * Excluding money market fund holdings, if any. |
What Were The Fund Costs For The Last Year ?
(Based on a hypothetical $10,000 investment)
| Fund | Costs of a $10,000 investment | Costs paid as a percentage of a $10,000 investment |
| Invesco Dorsey Wright Momentum ETF | $65 | 0.62% |
How Did The Fund Perform During The Period?
• During the fiscal year ended April 30, 2025, U.S. equities had strong performance in the beginning with a more challenging environment at the end due to uncertainty regarding global trade and tariff policy. During the period, companies included in the Dorsey Wright® Technical Leaders Index pursuant to the proprietary security selection methodology generally underperformed the broader stock market. The Fund's focus on momentum stocks led to lower exposure to mega-cap stocks, which created a performance headwind compared to the Russell 3000® Growth Index.
• The Fund is passively managed and seeks to track the investment results (before fees and expenses) of the Dorsey Wright Technical LeadersTM Index (the “Index”). The Fund generally will invest at least 90% of its total assets in securities that comprise the Index.
• For the fiscal year ended April 30, 2025, the Fund's performance, on a net asset value ("NAV") basis, 8.29%, differed from the return of the Index, 8.98%, primarily due to fees and expenses incurred by the Fund during the period.
What contributed to performance?
Sector Allocations | Information technology sector, followed by the financials and industrials sectors, respectively.
Positions | AppLovin Corp., Class A, an information technology company, and Targa Resources Corp., an energy company.
What detracted from performance?
Sector Allocations | Consumer discretionary sector.
Positions | Vertiv Holdings Co., Class A, an industrials company (no longer held at fiscal year-end), and e.l.f. Beauty, Inc., a consumer staples company (no longer held at fiscal year-end).
How Has The Fund Historically Performed?
Growth of $10,000 Investment
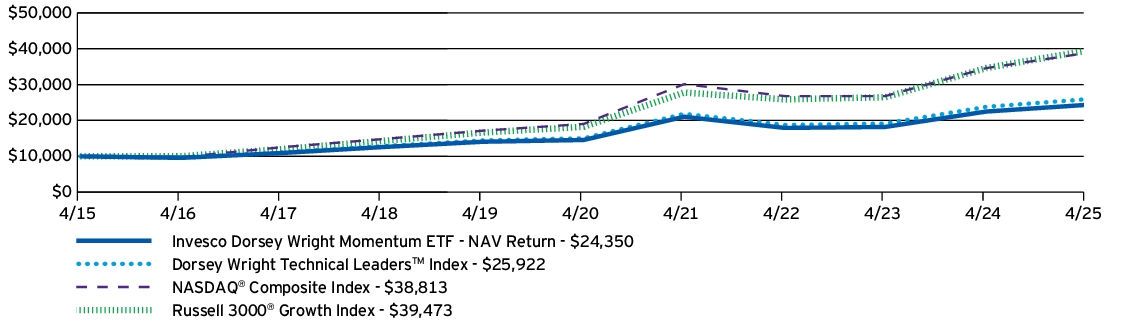
AVERAGE ANNUAL TOTAL RETURNS |
1 Year |
5 Years |
10 Years |
| Invesco Dorsey Wright Momentum ETF — NAV Return | 8.29% | 10.83% | 9.31% |
| Dorsey Wright Technical Leaders™ Index | 8.98% | 11.52% | 9.99% |
| NASDAQ® Composite Index | 12.22% | 15.32% | 14.52% |
| Russell 3000® Growth Index | 14.07% | 16.71% | 14.72% |
Performance figures do not reflect deduction of taxes a shareholder would pay on Fund distributions or sale of Fund shares.
- Effective August 28, 2024, the Fund changed its broad-based securities market benchmark from the Dorsey Wright Technical Leaders™ Index to the NASDAQ® Composite Index to reflect that the NASDAQ® Composite Index can be considered more broadly representative of the overall applicable securities market.
What Are Key Statistics About The Fund?
(as of April 30, 2025)
| Fund net assets | $1,185,168,688 |
| Total number of portfolio holdings | 103 |
| Total advisory fees paid | $6,454,716 |
| Portfolio turnover rate | 109% |
What Comprised The Fund's Holdings?
(as of April 30, 2025)
Top ten holdings*
(% of net assets)
(% of net assets)
| O'Reilly Automotive, Inc. | 3.09% |
| Apple, Inc. | 3.01% |
| Copart, Inc. | 2.93% |
| Mastercard, Inc., Class A | 2.87% |
| Amphenol Corp., Class A | 2.73% |
| AppLovin Corp., Class A | 2.44% |
| Targa Resources Corp. | 2.14% |
| W.W. Grainger, Inc. | 2.09% |
| Fiserv, Inc. | 1.93% |
| Costco Wholesale Corp. | 1.83% |
| * Excluding money market fund holdings, if any. |
Sector allocation
(% of net assets)
(% of net assets)
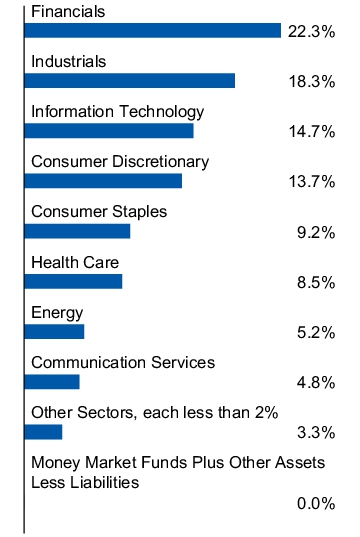
Top ten holdings*
(% of net assets)
(% of net assets)
| O'Reilly Automotive, Inc. | 3.09% |
| Apple, Inc. | 3.01% |
| Copart, Inc. | 2.93% |
| Mastercard, Inc., Class A | 2.87% |
| Amphenol Corp., Class A | 2.73% |
| AppLovin Corp., Class A | 2.44% |
| Targa Resources Corp. | 2.14% |
| W.W. Grainger, Inc. | 2.09% |
| Fiserv, Inc. | 1.93% |
| Costco Wholesale Corp. | 1.83% |
| * Excluding money market fund holdings, if any. |
What Were The Fund Costs For The Last Year ?
(Based on a hypothetical $10,000 investment)
| Fund | Costs of a $10,000 investment | Costs paid as a percentage of a $10,000 investment |
| Invesco Financial Preferred ETF | $56 | 0.55% |
How Did The Fund Perform During The Period?
• During the fiscal year ended April 30, 2025, U.S. credit and equity began the period with strong performance but weakened into the end of the fiscal year. U.S. 10 year treasuries fell during this period, aiding duration instruments. Underweight allocations to mortgage REITs and technology hardware, storage and peripherals relative to the S&P U.S. Preferred Stock Index caused Fund underperformance during the fiscal year.
• The Fund is passively managed and seeks to track the investment results (before fees and expenses) of the ICE Exchange-Listed Fixed Rate Financial Preferred Securities Index (the “Index”). The Fund generally will invest at least 90% of its total assets in securities that comprise the Index.
• For the fiscal year ended April 30, 2025, the Fund's performance, on a net asset value ("NAV") basis, 2.68%, differed from the return of the Index, 3.14%, primarily due to fees and expenses incurred by the Fund during the period.
What contributed to performance?
Industry Allocations | Banks industry, followed by the insurance and consumer finance industries, respectively.
Positions | M&T Bank Corp., Series J, Pfd., a banks company, and KeyCorp, Pfd., a banks company.
What detracted from performance?
Industry Allocations | No industries detracted from the Fund's performance during the period.
Positions | Enstar Group Ltd., Series D, Pfd., an insurance company, and Brighthouse Financial, Inc., Series B, Pfd., an insurance company.
How Has The Fund Historically Performed?
Growth of $10,000 Investment
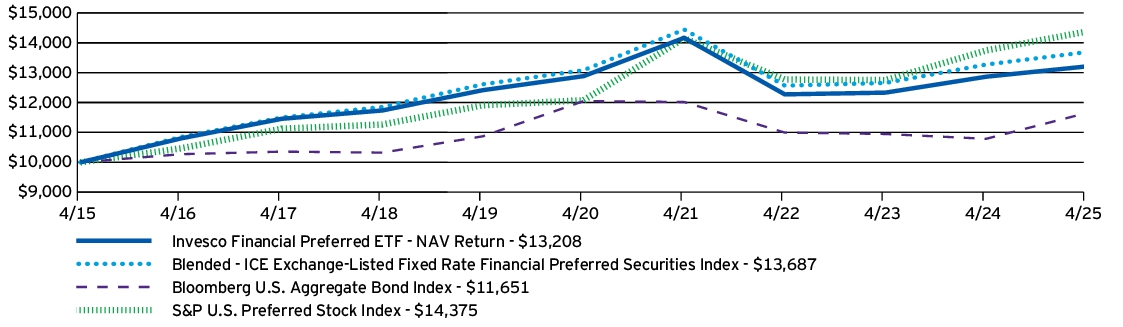
AVERAGE ANNUAL TOTAL RETURNS |
1 Year |
5 Years |
10 Years |
| Invesco Financial Preferred ETF — NAV Return | 2.68% | 0.50% | 2.82% |
| Blended - ICE Exchange-Listed Fixed Rate Financial Preferred Securities Index | 3.14% | 0.91% | 3.19% |
| Bloomberg U.S. Aggregate Bond Index | 8.02% | -0.67% | 1.54% |
| S&P U.S. Preferred Stock Index | 4.60% | 3.55% | 3.70% |
Performance figures do not reflect deduction of taxes a shareholder would pay on Fund distributions or sale of Fund shares.
- Effective August 28, 2024, the Fund changed its broad-based securities market benchmark from the S&P U.S. Preferred Stock Index to the Bloomberg U.S. Aggregate Bond Index to reflect that the Bloomberg U.S. Aggregate Bond Index can be considered more broadly representative of the overall applicable securities market.
What Are Key Statistics About The Fund?
(as of April 30, 2025)
| Fund net assets | $788,530,795 |
| Total number of portfolio holdings | 97 |
| Total advisory fees paid | $4,444,693 |
| Portfolio turnover rate | 21% |
What Comprised The Fund's Holdings?
(as of April 30, 2025)
Top ten holdings*
(% of net assets)
(% of net assets)
| JPMorgan Chase & Co., Series EE, Pfd., 6.00% | 2.45% |
| JPMorgan Chase & Co., Series DD, Pfd., 5.75% | 2.21% |
| Allstate Corp. (The), Series H, Pfd., 5.10% | 2.19% |
| Wells Fargo & Co., Series Z, Pfd., 4.75% | 2.02% |
| JPMorgan Chase & Co., Series LL, Pfd., 4.63% | 1.91% |
| JPMorgan Chase & Co., Series MM, Pfd., 4.20% | 1.89% |
| M&T Bank Corp., Series J, Pfd., 7.50% | 1.84% |
| Capital One Financial Corp., Series I, Pfd., 5.00% | 1.83% |
| MetLife, Inc., Series F, Pfd., 4.75% | 1.80% |
| Bank of America Corp., Series GG, Pfd., 6.00% | 1.78% |
| * Excluding money market fund holdings, if any. |
Industry allocation
(% of net assets)
(% of net assets)
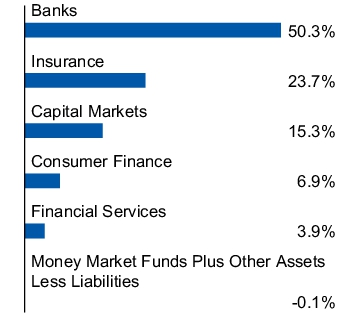
Top ten holdings*
(% of net assets)
(% of net assets)
| JPMorgan Chase & Co., Series EE, Pfd., 6.00% | 2.45% |
| JPMorgan Chase & Co., Series DD, Pfd., 5.75% | 2.21% |
| Allstate Corp. (The), Series H, Pfd., 5.10% | 2.19% |
| Wells Fargo & Co., Series Z, Pfd., 4.75% | 2.02% |
| JPMorgan Chase & Co., Series LL, Pfd., 4.63% | 1.91% |
| JPMorgan Chase & Co., Series MM, Pfd., 4.20% | 1.89% |
| M&T Bank Corp., Series J, Pfd., 7.50% | 1.84% |
| Capital One Financial Corp., Series I, Pfd., 5.00% | 1.83% |
| MetLife, Inc., Series F, Pfd., 4.75% | 1.80% |
| Bank of America Corp., Series GG, Pfd., 6.00% | 1.78% |
| * Excluding money market fund holdings, if any. |
This report describes changes to the Fund that occurred during the reporting period.
What Were The Fund Costs For The Last Year ?
(Based on a hypothetical $10,000 investment)
| Fund | Costs of a $10,000 investment | Costs paid as a percentage of a $10,000 investment |
| Invesco Global Listed Private Equity ETF | $68 | 0.65% |
How Did The Fund Perform During The Period?
• During the fiscal year ended April 30, 2025, international equities showed relatively weak performance until mounting concerns over U.S. global trade and tariff policy led to relative outperformance near the end of the period. During the period, global listed private equity companies underperformed the broader market. The Fund's stock selection methodology within the financial services industry created a performance headwind compared to the MSCI ACWI Index (Net).
• The Fund is passively managed and seeks to track the investment results (before fees and expenses) of the Red Rocks Global Listed Private Equity Index (the “Index”). The Fund generally will invest at least 90% of its total assets in securities (including American depositary receipts and global depositary receipts) that comprise the Index.
• For the fiscal year ended April 30, 2025, the Fund's performance, on a net asset value ("NAV") basis, 9.46%, differed from the return of the Index, 9.90%, primarily due to fees and expenses incurred by the Fund during the period, partially offset by income received from the securities lending program in which the Fund participates.
What contributed to performance?
Industry Allocations | Capital markets industry, followed by the wireless telecommunication services and diversified consumer services industries, respectively.
Positions | 3i Group PLC, a capital markets company, and KKR & Co., Inc., Class A, a capital markets company.
What detracted from performance?
Industry Allocations | Biotechnology industry, followed by the interactive media & services industry.
Positions | CVC Capital Partners PLC, a capital markets company, and Eurazeo SE, a financial services company.
How Has The Fund Historically Performed?
Growth of $10,000 Investment
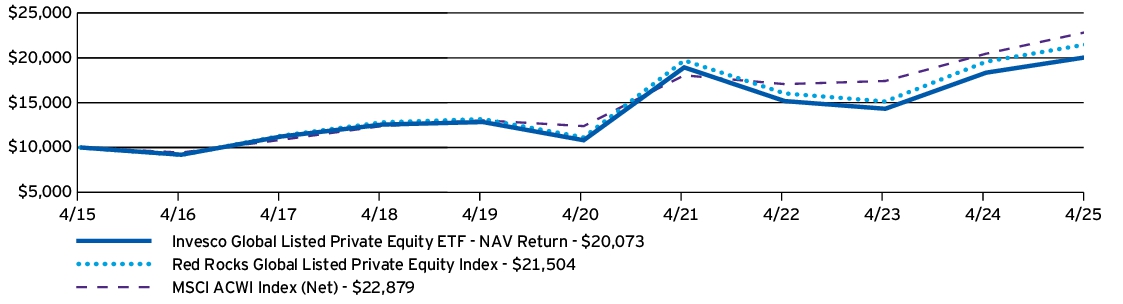
AVERAGE ANNUAL TOTAL RETURNS |
1 Year |
5 Years |
10 Years |
| Invesco Global Listed Private Equity ETF — NAV Return | 9.46% | 13.18% | 7.22% |
| Red Rocks Global Listed Private Equity Index | 9.90% | 14.08% | 7.96% |
| MSCI ACWI Index (Net) | 11.84% | 13.07% | 8.63% |
Performance figures do not reflect deduction of taxes a shareholder would pay on Fund distributions or sale of Fund shares.
What Are Key Statistics About The Fund?
(as of April 30, 2025)
| Fund net assets | $235,236,467 |
| Total number of portfolio holdings | 67 |
| Total advisory fees paid | $1,299,857 |
| Portfolio turnover rate | 39% |
What Comprised The Fund's Holdings?
(as of April 30, 2025)
Top ten holdings*
(% of net assets)
(% of net assets)
| 3i Group PLC | 5.90% |
| Sofina S.A. | 4.88% |
| KKR & Co., Inc., Class A | 4.87% |
| Blue Owl Capital, Inc. | 4.69% |
| EQT AB | 4.60% |
| Blackstone, Inc., Class A | 4.46% |
| TPG, Inc. | 4.41% |
| Partners Group Holding AG | 4.29% |
| Eurazeo SE | 4.05% |
| HAL Trust | 4.04% |
| * Excluding money market fund holdings, if any. |
Industry allocation
(% of net assets)
(% of net assets)
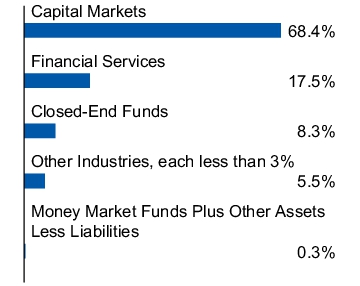
Top ten holdings*
(% of net assets)
(% of net assets)
| 3i Group PLC | 5.90% |
| Sofina S.A. | 4.88% |
| KKR & Co., Inc., Class A | 4.87% |
| Blue Owl Capital, Inc. | 4.69% |
| EQT AB | 4.60% |
| Blackstone, Inc., Class A | 4.46% |
| TPG, Inc. | 4.41% |
| Partners Group Holding AG | 4.29% |
| Eurazeo SE | 4.05% |
| HAL Trust | 4.04% |
| * Excluding money market fund holdings, if any. |
How Has The Fund Changed Over The Past Year?
This is a summary of certain changes to the Fund since April 30, 2024. For more complete information, you may review the Fund's prospectus, which is available at invesco.com/reports or upon request at (800) 983-0903.
The Fund modified its principal investment strategies and principal risks to reflect that master limited partnerships are not eligible for inclusion in the underlying index.
The Fund modified its principal investment strategies and principal risks to reflect that master limited partnerships are not eligible for inclusion in the underlying index.
The Fund modified its principal investment strategies and principal risks to reflect that master limited partnerships are not eligible for inclusion in the underlying index.
This is a summary of certain changes to the Fund since April 30, 2024. For more complete information, you may review the Fund's prospectus, which is available at invesco.com/reports or upon request at (800) 983-0903.
This report describes changes to the Fund that occurred during the reporting period.
What Were The Fund Costs For The Last Year ?
(Based on a hypothetical $10,000 investment)
| Fund | Costs of a $10,000 investment | Costs paid as a percentage of a $10,000 investment |
| Invesco S&P 500 BuyWrite ETF | $30 | 0.29% |
How Did The Fund Perform During The Period?
• During the fiscal year ended April 30, 2025, the Fund's underlying equity exposure to the S&P 500® Index performed well, led by the financials and utilities sectors. However, due to the lower volatility experienced during the period, the call options detracted from performance by capping the Fund's upside participation. This lack of upside was partially offset by the income generated from the call options.
• The Fund is passively managed and seeks to track the investment results (before fees and expenses) of the CBOE S&P 500 BuyWrite IndexSM (the “Index”). The Fund generally will invest at least 90% of its total assets in securities that comprise the Index and will write (sell) call options thereon.
• For the fiscal year ended April 30, 2025, the Fund's performance, on a net asset value ("NAV") basis, 9.09%, differed from the return of the Index, 9.50%, primarily due to fees and expenses incurred by the Fund during the period.
What contributed to performance?
Sector Allocations | Information technology sector, followed by the financials sector.
Positions | SPX 04/17/25 covered call contract, a short S&P 500 Index call contract (no longer held at fiscal year-end), and NVIDIA Corp., an information technology company.
What detracted from performance?
Sector Allocations | Covered call contracts, followed by the energy sector.
Positions | SPX 05/17/24 covered call contract, a short S&P 500 Index call contract (no longer held at fiscal year-end), and SPX 05/16/25 covered call contract, a short S&P 500 Index call contract.
How Has The Fund Historically Performed?
Growth of $10,000 Investment
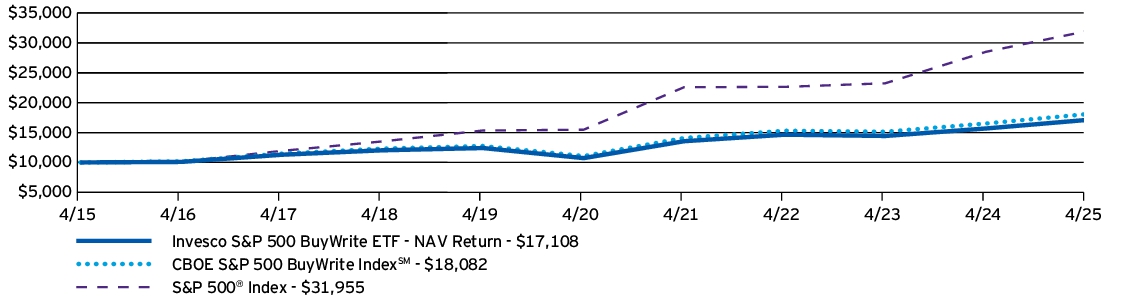
AVERAGE ANNUAL TOTAL RETURNS |
1 Year |
5 Years |
10 Years |
| Invesco S&P 500 BuyWrite ETF — NAV Return | 9.09% | 9.80% | 5.52% |
| CBOE S&P 500 BuyWrite Index℠ | 9.50% | 10.32% | 6.10% |
| S&P 500® Index | 12.10% | 15.61% | 12.32% |
Performance figures do not reflect deduction of taxes a shareholder would pay on Fund distributions or sale of Fund shares.
What Are Key Statistics About The Fund?
(as of April 30, 2025)
| Fund net assets | $134,041,475 |
| Total number of portfolio holdings | 505 |
| Total advisory fees paid | $305,271 |
| Portfolio turnover rate | 41% |
What Comprised The Fund's Holdings?
(as of April 30, 2025)
Top ten holdings*
(% of net assets)
(% of net assets)
| Apple, Inc. | 7.18% |
| Microsoft Corp. | 6.61% |
| NVIDIA Corp. | 6.00% |
| Amazon.com, Inc. | 3.91% |
| Meta Platforms, Inc., Class A | 2.70% |
| Berkshire Hathaway, Inc., Class B | 2.20% |
| Alphabet, Inc., Class A | 2.08% |
| Broadcom, Inc. | 2.03% |
| Tesla, Inc. | 1.78% |
| Alphabet, Inc., Class C | 1.71% |
| * Excluding money market fund holdings, if any. |
Sector allocation
(% of net assets)
(% of net assets)
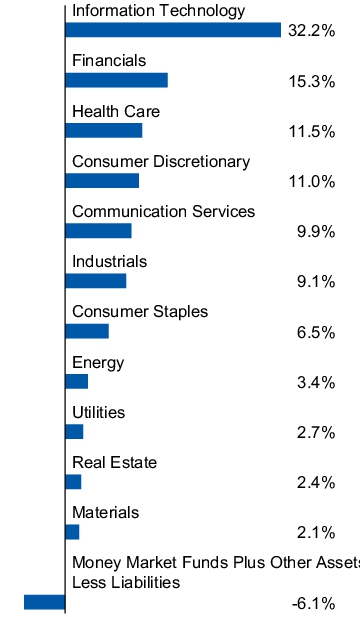
Top ten holdings*
(% of net assets)
(% of net assets)
| Apple, Inc. | 7.18% |
| Microsoft Corp. | 6.61% |
| NVIDIA Corp. | 6.00% |
| Amazon.com, Inc. | 3.91% |
| Meta Platforms, Inc., Class A | 2.70% |
| Berkshire Hathaway, Inc., Class B | 2.20% |
| Alphabet, Inc., Class A | 2.08% |
| Broadcom, Inc. | 2.03% |
| Tesla, Inc. | 1.78% |
| Alphabet, Inc., Class C | 1.71% |
| * Excluding money market fund holdings, if any. |
How Has The Fund Changed Over The Past Year?
This is a summary of certain changes to the Fund since April 30, 2024. For more complete information, you may review the Fund's prospectus, which is available at invesco.com/reports or upon request at (800) 983-0903.
The Fund's net expense ratio decreased from the prior fiscal year end as a result of a change in the Fund's investment advisory agreement which became effective on January 5, 2024.
The Fund's net expense ratio decreased from the prior fiscal year end as a result of a change in the Fund's investment advisory agreement which became effective on January 5, 2024.
This is a summary of certain changes to the Fund since April 30, 2024. For more complete information, you may review the Fund's prospectus, which is available at invesco.com/reports or upon request at (800) 983-0903.
What Were The Fund Costs For The Last Year ?
(Based on a hypothetical $10,000 investment)
| Fund | Costs of a $10,000 investment | Costs paid as a percentage of a $10,000 investment |
| Invesco S&P 500 GARP ETF | $35 | 0.35% |
How Did The Fund Perform During The Period?
• During the fiscal year ended April 30, 2025, U.S. equities began the period with strong performance but experienced a more challenging environment near the end of the period due to uncertainty regarding global trade and tariff policy. The Fund underperformed the S&P 500® Index primarily due to its large overweight to and security selection within the energy sector, which was the worst-performing sector in the S&P 500® Index during the period.
• The Fund is passively managed and seeks to track the investment results (before fees and expenses) of the S&P 500® GARP Index (the “Index”). The Fund generally will invest at least 90% of its total assets in securities that comprise the Index.
• For the fiscal year ended April 30, 2025, the Fund's performance, on a net asset value ("NAV") basis, -2.60%, differed from the return of the Index, -2.23%, primarily due to fees and expenses incurred by the Fund during the period.
What contributed to performance?
Sector Allocations | Financials sector, followed by the information technology and industrials sectors, respectively.
Positions | United Airlines Holdings, Inc., an industrials company, and Paycom Software, Inc., an industrials company.
What detracted from performance?
Sector Allocations | Energy sector, followed by the materials and consumer staples sectors, respectively.
Positions | APA Corp., an energy company, and Celanese Corp., a materials company (no longer held at fiscal year-end).
How Has The Fund Historically Performed?
Growth of $10,000 Investment
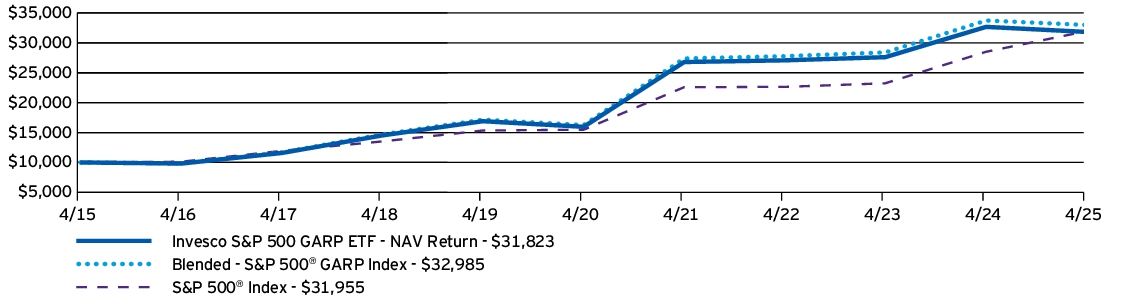
AVERAGE ANNUAL TOTAL RETURNS |
1 Year |
5 Years |
10 Years |
| Invesco S&P 500 GARP ETF — NAV Return | -2.60% | 14.81% | 12.27% |
| Blended - S&P 500® GARP Index | -2.23% | 15.22% | 12.68% |
| S&P 500® Index | 12.10% | 15.61% | 12.32% |
Performance figures do not reflect deduction of taxes a shareholder would pay on Fund distributions or sale of Fund shares.
- Effective August 28, 2024, the Fund changed its broad-based securities market benchmark from the S&P 500® GARP Index to the S&P 500® Index to reflect that the S&P 500® Index can be considered more broadly representative of the overall applicable securities market.
What Are Key Statistics About The Fund?
(as of April 30, 2025)
| Fund net assets | $2,782,076,241 |
| Total number of portfolio holdings | 77 |
| Total advisory fees paid | $12,102,435 |
| Portfolio turnover rate | 69% |
What Comprised The Fund's Holdings?
(as of April 30, 2025)
Top ten holdings*
(% of net assets)
(% of net assets)
| EOG Resources, Inc. | 2.27% |
| Valero Energy Corp. | 2.26% |
| Marathon Petroleum Corp. | 2.26% |
| TJX Cos., Inc. (The) | 2.22% |
| NVIDIA Corp. | 2.18% |
| Steel Dynamics, Inc. | 2.16% |
| ConocoPhillips | 2.07% |
| Ulta Beauty, Inc. | 1.95% |
| Ross Stores, Inc. | 1.93% |
| Host Hotels & Resorts, Inc. | 1.81% |
| * Excluding money market fund holdings, if any. |
Sector allocation
(% of net assets)
(% of net assets)
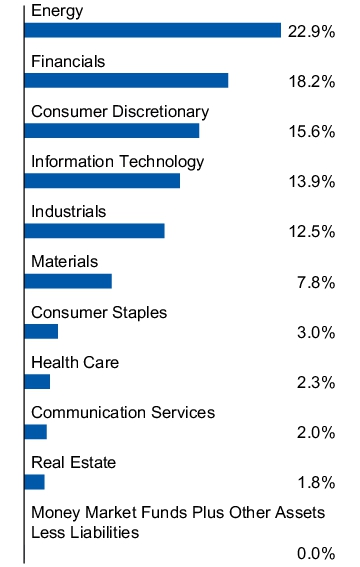
Top ten holdings*
(% of net assets)
(% of net assets)
| EOG Resources, Inc. | 2.27% |
| Valero Energy Corp. | 2.26% |
| Marathon Petroleum Corp. | 2.26% |
| TJX Cos., Inc. (The) | 2.22% |
| NVIDIA Corp. | 2.18% |
| Steel Dynamics, Inc. | 2.16% |
| ConocoPhillips | 2.07% |
| Ulta Beauty, Inc. | 1.95% |
| Ross Stores, Inc. | 1.93% |
| Host Hotels & Resorts, Inc. | 1.81% |
| * Excluding money market fund holdings, if any. |
What Were The Fund Costs For The Last Year ?
(Based on a hypothetical $10,000 investment)
| Fund | Costs of a $10,000 investment | Costs paid as a percentage of a $10,000 investment |
| Invesco S&P 500 Value with Momentum ETF | $40 | 0.39%† |
|
† |
Reflects fee waivers and/or expense reimbursements, without which expenses would have been higher. |
How Did The Fund Perform During The Period?
• During the fiscal year ended April 30, 2025, U.S. equities began the period with strong performance but experienced a more challenging environment near the end of the period due to uncertainty regarding global trade and tariff policy. The Fund underperformed large cap U.S. equities primarily due to its methodology's focus on selecting value securities, which notably lagged the S&P 500® Index during the period.
• The Fund is passively managed and seeks to track the investment results (before fees and expenses) of the S&P 500® High Momentum Value Index (the “Index”). The Fund generally will invest at least 90% of its total assets in securities that comprise the Index.
• For the fiscal year ended April 30, 2025, the Fund's performance, on a net asset value ("NAV") basis, 6.54%, differed from the return of the Index, 6.98%, primarily due to fees and expenses incurred by the Fund during the period.
What contributed to performance?
Sector Allocations | Financials sector, followed by the utilities and health care sectors, respectively.
Positions | Kroger Co., a consumer staples company, and NRG Energy, Inc., a utilities company.
What detracted from performance?
Sector Allocations | Energy sector, followed by the materials and industrials sectors, respectively.
Positions | Celanese Corp., a materials company (no longer held at fiscal year-end) and Valero Energy Corp., an energy company (no longer held at fiscal year-end).
How Has The Fund Historically Performed?
Growth of $10,000 Investment
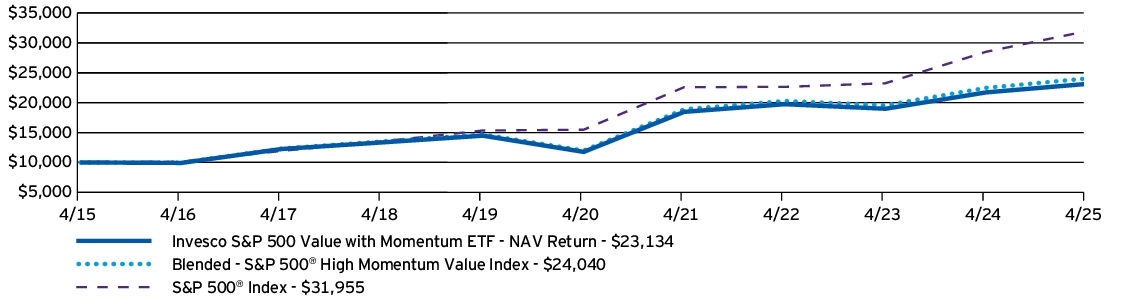
AVERAGE ANNUAL TOTAL RETURNS |
1 Year |
5 Years |
10 Years |
| Invesco S&P 500 Value with Momentum ETF — NAV Return | 6.54% | 14.49% | 8.75% |
| Blended - S&P 500® High Momentum Value Index | 6.98% | 14.94% | 9.17% |
| S&P 500® Index | 12.10% | 15.61% | 12.32% |
Performance figures do not reflect deduction of taxes a shareholder would pay on Fund distributions or sale of Fund shares.
- Effective August 28, 2024, the Fund changed its broad-based securities market benchmark from the S&P 500® High Momentum Value Index to the S&P 500® Index to reflect that the S&P 500® Index can be considered more broadly representative of the overall applicable securities market.
What Are Key Statistics About The Fund?
(as of April 30, 2025)
| Fund net assets | $49,603,492 |
| Total number of portfolio holdings | 103 |
| Total advisory fees paid | $95,539 |
| Portfolio turnover rate | 69% |
What Comprised The Fund's Holdings?
(as of April 30, 2025)
Top ten holdings*
(% of net assets)
(% of net assets)
| General Motors Co. | 2.32% |
| Kroger Co. (The) | 1.99% |
| Tyson Foods, Inc., Class A | 1.82% |
| Loews Corp. | 1.80% |
| Berkshire Hathaway, Inc., Class B | 1.61% |
| Cencora, Inc. | 1.58% |
| Prudential Financial, Inc. | 1.55% |
| Cardinal Health, Inc. | 1.50% |
| Fox Corp., Class A | 1.41% |
| Mohawk Industries, Inc. | 1.38% |
| * Excluding money market fund holdings, if any. |
Sector allocation
(% of net assets)
(% of net assets)
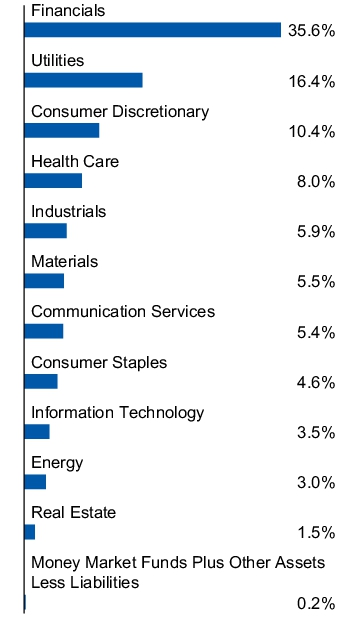
Top ten holdings*
(% of net assets)
(% of net assets)
| General Motors Co. | 2.32% |
| Kroger Co. (The) | 1.99% |
| Tyson Foods, Inc., Class A | 1.82% |
| Loews Corp. | 1.80% |
| Berkshire Hathaway, Inc., Class B | 1.61% |
| Cencora, Inc. | 1.58% |
| Prudential Financial, Inc. | 1.55% |
| Cardinal Health, Inc. | 1.50% |
| Fox Corp., Class A | 1.41% |
| Mohawk Industries, Inc. | 1.38% |
| * Excluding money market fund holdings, if any. |
What Were The Fund Costs For The Last Year ?
(Based on a hypothetical $10,000 investment)
| Fund | Costs of a $10,000 investment | Costs paid as a percentage of a $10,000 investment |
| Invesco S&P 500® Equal Weight Real Estate ETF | $43 | 0.40% |
How Did The Fund Perform During The Period?
• During the fiscal year ended April 30, 2025, U.S. large-cap equities saw significant growth and volatility. Technology stocks were a significant driver of return for the S&P 500® Index in the period due to strong earnings. However, market volatility increased towards the second half of the fiscal year, as a result of aggressive tariffs from the Trump administration. During the period, real estate outperformed the broader market. The Fund's focus on real estate securities created a performance tailwind compared to the S&P 500® Index.
• The Fund is passively managed and seeks to track the investment results (before fees and expenses) of the S&P 500® Equal Weight Real Estate Index (the “Index”). The Fund generally will invest at least 90% of its total assets in securities that comprise the Index.
• For the fiscal year ended April 30, 2025, the Fund's performance, on a net asset value ("NAV") basis, 14.51%, differed from the return of the Index, 14.99%, primarily due to fees and expenses incurred by the Fund during the period.
What contributed to performance?
Industry Allocations | Specialized Real Estate Investment Trusts ("REITs") industry, followed by residential REITs and health care REITs industries, respectively.
Positions | Ventas, Inc., a health care REITs company, and Welltower, Inc., a health care REITs company.
What detracted from performance?
Industry Allocations | Hotel & resort REITs industry.
Positions | Alexandria Real Estate Equities, Inc., a health care REITs company and CoStar Group, Inc. a real estate management & development company.
How Has The Fund Historically Performed?
Growth of $10,000 Investment
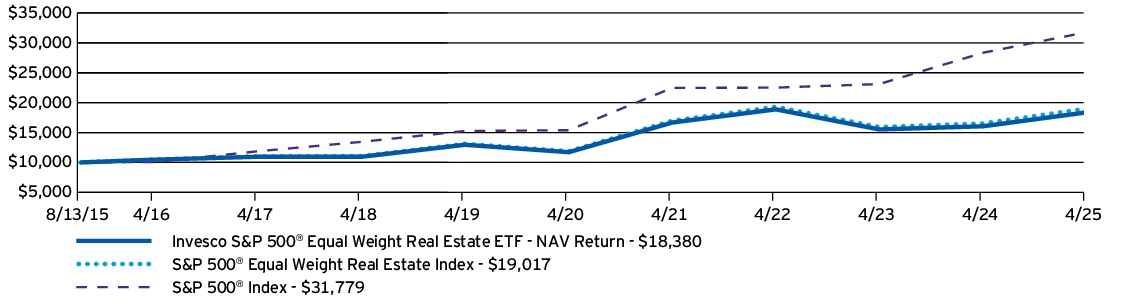
AVERAGE ANNUAL TOTAL RETURNS |
1 Year |
5 Years |
Since Inception (08/13/15) |
| Invesco S&P 500® Equal Weight Real Estate ETF — NAV Return | 14.51% | 9.43% | 6.47% |
| S&P 500® Equal Weight Real Estate Index | 14.99% | 9.85% | 6.84% |
| S&P 500® Index | 12.10% | 15.61% | 12.64% |
| S&P 500® Real Estate Index | 18.35% | 7.65% |
Performance figures do not reflect deduction of taxes a shareholder would pay on Fund distributions or sale of Fund shares.
What Are Key Statistics About The Fund?
(as of April 30, 2025)
| Fund net assets | $110,707,067 |
| Total number of portfolio holdings | 34 |
| Total advisory fees paid | $450,189 |
| Portfolio turnover rate | 14% |
What Comprised The Fund's Holdings?
(as of April 30, 2025)
Top ten holdings*
(% of net assets)
(% of net assets)
| SBA Communications Corp., Class A | 3.68% |
| Crown Castle, Inc. | 3.63% |
| American Tower Corp. | 3.57% |
| Digital Realty Trust, Inc. | 3.46% |
| Ventas, Inc. | 3.46% |
| Iron Mountain, Inc. | 3.40% |
| Welltower, Inc. | 3.39% |
| Invitation Homes, Inc. | 3.38% |
| Realty Income Corp. | 3.36% |
| Equity Residential | 3.33% |
| * Excluding money market fund holdings, if any. |
Industry allocation
(% of net assets)
(% of net assets)
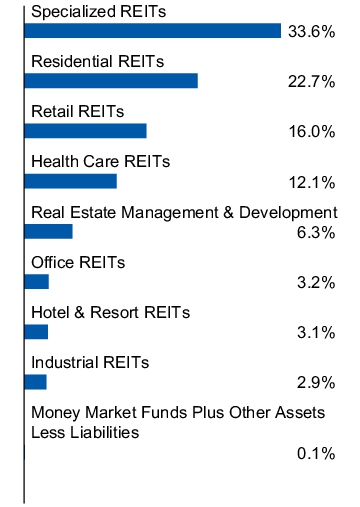
Top ten holdings*
(% of net assets)
(% of net assets)
| SBA Communications Corp., Class A | 3.68% |
| Crown Castle, Inc. | 3.63% |
| American Tower Corp. | 3.57% |
| Digital Realty Trust, Inc. | 3.46% |
| Ventas, Inc. | 3.46% |
| Iron Mountain, Inc. | 3.40% |
| Welltower, Inc. | 3.39% |
| Invitation Homes, Inc. | 3.38% |
| Realty Income Corp. | 3.36% |
| Equity Residential | 3.33% |
| * Excluding money market fund holdings, if any. |
What Were The Fund Costs For The Last Year ?
(Based on a hypothetical $10,000 investment)
| Fund | Costs of a $10,000 investment | Costs paid as a percentage of a $10,000 investment |
| Invesco S&P 500® Equal Weight Technology ETF | $41 | 0.40% |
How Did The Fund Perform During The Period?
• During the fiscal year ended April 30, 2025, U.S. large-cap equities saw significant growth and volatility. Technology stocks were a significant driver of return for the S&P 500® Index in the period due to strong earnings. However, market volatility increased towards the second half of the fiscal year, as a result of aggressive tariffs from the Trump administration. While the Fund's focus on information technology securities created a performance tailwind compared to the S&P 500® Index, its equal weighting methodology led to underweight exposure to mega-cap information technology stocks and created a notable headwind to performance relative to the S&P 500® Index.
• The Fund is passively managed and seeks to track the investment results (before fees and expenses) of the S&P 500® Equal Weight Information Technology Index (the “Index”). The Fund generally will invest at least 90% of its total assets in securities that comprise the Index.
• For the fiscal year ended April 30, 2025, the Fund's performance, on a net asset value ("NAV") basis, 4.69%, differed from the return of the Index, 5.07%, primarily due to fees and expenses incurred by the Fund during the period.
What contributed to performance?
Industry Allocations | Software industry, followed by the communications equipment and IT services industries, respectively.
Positions | Palantir Technologies, Inc., Class A, a software company, and Fair Isaac Corp., a software company.
What detracted from performance?
Industry Allocations | Semiconductors & semiconductor equipment industry, followed by the technology hardware storage & peripherals industry.
Positions | Super Micro Computer, Inc., a technology hardware storage & peripherals company and Enphase Energy, Inc., a semiconductors & semiconductor equipment company.
How Has The Fund Historically Performed?
Growth of $10,000 Investment
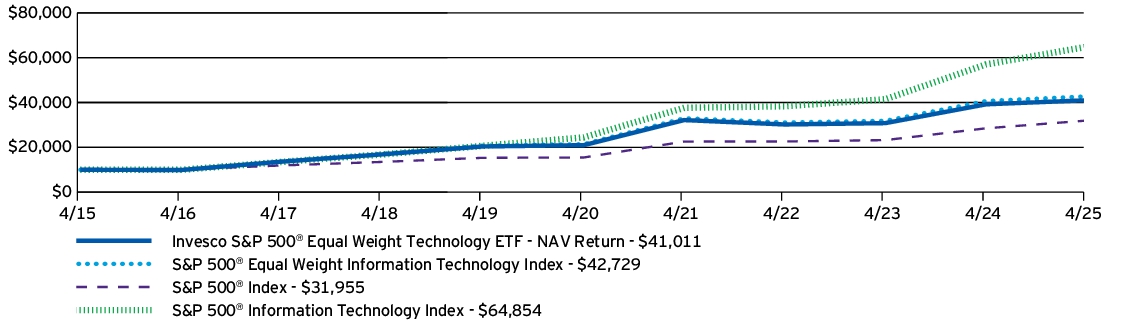
AVERAGE ANNUAL TOTAL RETURNS |
1 Year |
5 Years |
10 Years |
| Invesco S&P 500® Equal Weight Technology ETF — NAV Return | 4.69% | 14.36% | 15.16% |
| S&P 500® Equal Weight Information Technology Index | 5.07% | 14.82% | 15.63% |
| S&P 500® Index | 12.10% | 15.61% | 12.32% |
| S&P 500® Information Technology Index | 13.79% | 21.56% | 20.56% |
Performance figures do not reflect deduction of taxes a shareholder would pay on Fund distributions or sale of Fund shares.
What Are Key Statistics About The Fund?
(as of April 30, 2025)
| Fund net assets | $3,076,557,179 |
| Total number of portfolio holdings | 72 |
| Total advisory fees paid | $14,172,272 |
| Portfolio turnover rate | 26% |
What Comprised The Fund's Holdings?
(as of April 30, 2025)
Top ten holdings*
(% of net assets)
(% of net assets)
| Palantir Technologies, Inc., Class A | 2.06% |
| Cadence Design Systems, Inc. | 1.82% |
| CrowdStrike Holdings, Inc., Class A | 1.80% |
| Amphenol Corp., Class A | 1.79% |
| VeriSign, Inc. | 1.75% |
| ServiceNow, Inc. | 1.65% |
| Fair Isaac Corp. | 1.63% |
| Jabil, Inc. | 1.59% |
| Autodesk, Inc. | 1.59% |
| GoDaddy, Inc., Class A | 1.58% |
| * Excluding money market fund holdings, if any. |
Industry allocation
(% of net assets)
(% of net assets)
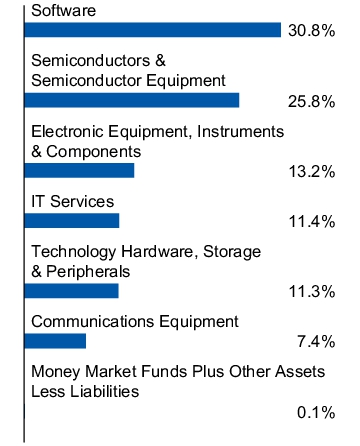
Top ten holdings*
(% of net assets)
(% of net assets)
| Palantir Technologies, Inc., Class A | 2.06% |
| Cadence Design Systems, Inc. | 1.82% |
| CrowdStrike Holdings, Inc., Class A | 1.80% |
| Amphenol Corp., Class A | 1.79% |
| VeriSign, Inc. | 1.75% |
| ServiceNow, Inc. | 1.65% |
| Fair Isaac Corp. | 1.63% |
| Jabil, Inc. | 1.59% |
| Autodesk, Inc. | 1.59% |
| GoDaddy, Inc., Class A | 1.58% |
| * Excluding money market fund holdings, if any. |
What Were The Fund Costs For The Last Year ?
(Based on a hypothetical $10,000 investment)
| Fund | Costs of a $10,000 investment | Costs paid as a percentage of a $10,000 investment |
| Invesco S&P 500® Equal Weight Utilities ETF | $45 | 0.40% |
How Did The Fund Perform During The Period?
• During the fiscal year ended April 30, 2025, U.S. large-cap equities saw significant growth and volatility. Technology stocks were a significant driver of return for the S&P 500® Index in the period due to strong earnings. However, market volatility increased towards the second half of the fiscal year, as a result of aggressive tariffs from the Trump administration. During the period, utilities outperformed the broader market. The Fund's focus on utilities securities created a performance tailwind compared to the S&P 500® Index.
• The Fund is passively managed and seeks to track the investment results (before fees and expenses) of the S&P 500® Equal Weight Utilities Plus Index (the “Index”). The Fund generally will invest at least 90% of its total assets in securities that comprise the Index.
• For the fiscal year ended April 30, 2025, the Fund's performance, on a net asset value ("NAV") basis, 24.85%, differed from the return of the Index, 25.43%, primarily due to fees and expenses incurred by the Fund during the period, as well as the compounding effect of the fee due to high absolute returns during the period.
What contributed to performance?
Industry Allocations | Electric utilities industry, followed by the multi-utilities and gas utilities industries, respectively.
Positions | Vistra Corp., an independent power and renewable electricity producers company, and Entergy Corp., an electric utilities company.
What detracted from performance?
Industry Allocations | No industries detracted from the Fund's performance during the period.
Positions | AES Corp., an independent power and renewable electricity producers company, and Edison International, an electric utilities company.
How Has The Fund Historically Performed?
Growth of $10,000 Investment
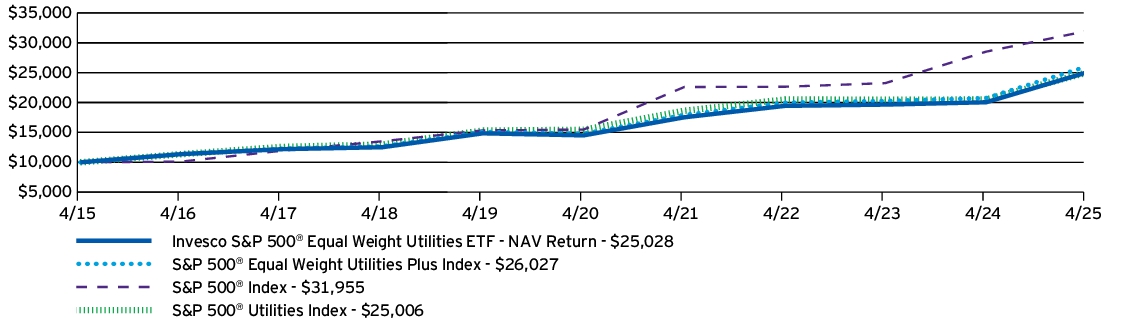
AVERAGE ANNUAL TOTAL RETURNS |
1 Year |
5 Years |
10 Years |
| Invesco S&P 500® Equal Weight Utilities ETF — NAV Return | 24.85% | 11.52% | 9.61% |
| S&P 500® Equal Weight Utilities Plus Index | 25.43% | 11.97% | 10.04% |
| S&P 500® Index | 12.10% | 15.61% | 12.32% |
| S&P 500® Utilities Index | 21.98% | 10.14% | 9.60% |
Performance figures do not reflect deduction of taxes a shareholder would pay on Fund distributions or sale of Fund shares.
What Are Key Statistics About The Fund?
(as of April 30, 2025)
| Fund net assets | $435,711,691 |
| Total number of portfolio holdings | 34 |
| Total advisory fees paid | $1,354,231 |
| Portfolio turnover rate | 19% |
What Comprised The Fund's Holdings?
(as of April 30, 2025)
Top ten holdings*
(% of net assets)
(% of net assets)
| NRG Energy, Inc. | 3.68% |
| CenterPoint Energy, Inc. | 3.49% |
| FirstEnergy Corp. | 3.48% |
| Exelon Corp. | 3.42% |
| Consolidated Edison, Inc. | 3.41% |
| Atmos Energy Corp. | 3.39% |
| Sempra | 3.35% |
| PPL Corp. | 3.34% |
| Vistra Corp. | 3.30% |
| American Electric Power Co., Inc. | 3.27% |
| * Excluding money market fund holdings, if any. |
Industry allocation
(% of net assets)
(% of net assets)
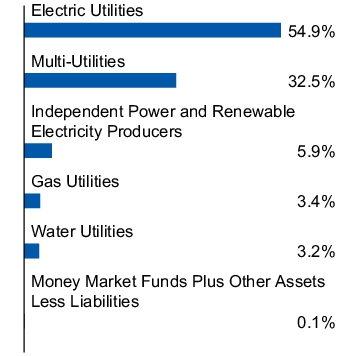
Top ten holdings*
(% of net assets)
(% of net assets)
| NRG Energy, Inc. | 3.68% |
| CenterPoint Energy, Inc. | 3.49% |
| FirstEnergy Corp. | 3.48% |
| Exelon Corp. | 3.42% |
| Consolidated Edison, Inc. | 3.41% |
| Atmos Energy Corp. | 3.39% |
| Sempra | 3.35% |
| PPL Corp. | 3.34% |
| Vistra Corp. | 3.30% |
| American Electric Power Co., Inc. | 3.27% |
| * Excluding money market fund holdings, if any. |
What Were The Fund Costs For The Last Year ?
(Based on a hypothetical $10,000 investment)
| Fund | Costs of a $10,000 investment | Costs paid as a percentage of a $10,000 investment |
| Invesco S&P 500® Pure Growth ETF | $38 | 0.35% |
How Did The Fund Perform During The Period?
• During the fiscal year ended April 30, 2025, U.S. equities began the period with strong performance but experienced a more challenging environment near the end of the period due to uncertainty regarding global trade and tariff policy. Growth outperformed value. The Fund underperformed the S&P 500® Growth Index primarily due to poor security selection results that were widespread across the consumer discretionary, industrials, materials, and financials sectors.
• The Fund is passively managed and seeks to track the investment results (before fees and expenses) of the S&P 500® Pure Growth Index (the “Index”). The Fund generally will invest at least 90% of its total assets in securities that comprise the Index.
• For the fiscal year ended April 30, 2025, the Fund's performance, on a net asset value ("NAV") basis, 14.31%, differed from the return of the Index, 14.72%, primarily due to fees and expenses incurred by the Fund during the period.
What contributed to performance?
Sector Allocations | Information technology sector, followed by the communication services and consumer discretionary sectors, respectively.
Positions | Palantir Technologies, Inc., Class A, an information technology company, and NVIDIA Corp., an information technology company.
What detracted from performance?
Sector Allocations | Materials sector, followed by the real estate and health care sectors, respectively.
Positions | Super Micro Computer, Inc., an information technology company, and Celanese Corp., a materials company (no longer held at fiscal year-end).
How Has The Fund Historically Performed?
Growth of $10,000 Investment
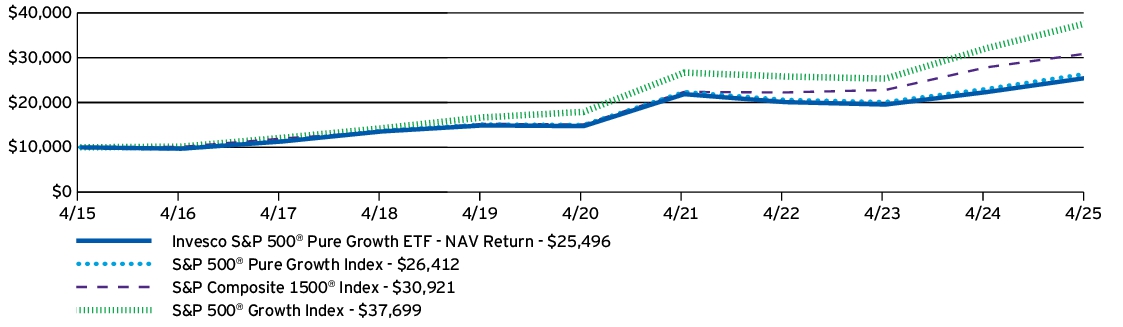
AVERAGE ANNUAL TOTAL RETURNS |
1 Year |
5 Years |
10 Years |
| Invesco S&P 500® Pure Growth ETF — NAV Return | 14.31% | 11.59% | 9.81% |
| S&P 500® Pure Growth Index | 14.72% | 11.98% | 10.20% |
| S&P Composite 1500® Index | 11.12% | 15.39% | 11.95% |
| S&P 500® Growth Index | 17.51% | 16.05% | 14.19% |
Performance figures do not reflect deduction of taxes a shareholder would pay on Fund distributions or sale of Fund shares.
- Effective August 28, 2024, the Fund changed its broad-based securities market benchmark from the S&P 500® Pure Growth Index to the S&P Composite 1500® Index to reflect that the S&P Composite 1500® Index can be considered more broadly representative of the overall applicable securities market.
What Are Key Statistics About The Fund?
(as of April 30, 2025)
| Fund net assets | $1,473,057,709 |
| Total number of portfolio holdings | 94 |
| Total advisory fees paid | $5,457,779 |
| Portfolio turnover rate | 64% |
What Comprised The Fund's Holdings?
(as of April 30, 2025)
Top ten holdings*
(% of net assets)
(% of net assets)
| Palantir Technologies, Inc., Class A | 2.46% |
| Royal Caribbean Cruises Ltd. | 2.09% |
| Texas Pacific Land Corp. | 2.08% |
| Vistra Corp. | 2.01% |
| Fortinet, Inc. | 1.99% |
| Axon Enterprise, Inc. | 1.97% |
| TKO Group Holdings, Inc. | 1.89% |
| Howmet Aerospace, Inc. | 1.83% |
| Live Nation Entertainment, Inc. | 1.76% |
| CrowdStrike Holdings, Inc., Class A | 1.74% |
| * Excluding money market fund holdings, if any. |
Sector allocation
(% of net assets)
(% of net assets)
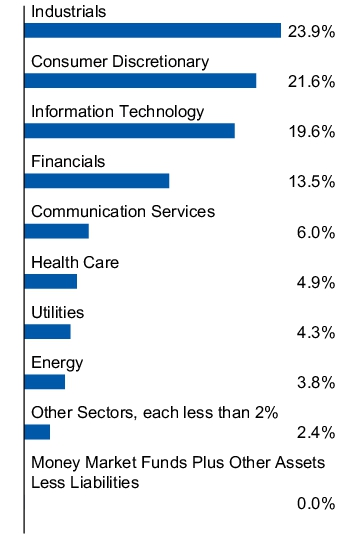
Top ten holdings*
(% of net assets)
(% of net assets)
| Palantir Technologies, Inc., Class A | 2.46% |
| Royal Caribbean Cruises Ltd. | 2.09% |
| Texas Pacific Land Corp. | 2.08% |
| Vistra Corp. | 2.01% |
| Fortinet, Inc. | 1.99% |
| Axon Enterprise, Inc. | 1.97% |
| TKO Group Holdings, Inc. | 1.89% |
| Howmet Aerospace, Inc. | 1.83% |
| Live Nation Entertainment, Inc. | 1.76% |
| CrowdStrike Holdings, Inc., Class A | 1.74% |
| * Excluding money market fund holdings, if any. |
What Were The Fund Costs For The Last Year ?
(Based on a hypothetical $10,000 investment)
| Fund | Costs of a $10,000 investment | Costs paid as a percentage of a $10,000 investment |
| Invesco S&P 500® Pure Value ETF | $36 | 0.35% |
How Did The Fund Perform During The Period?
• During the fiscal year ended April 30, 2025, U.S. equities began the period with strong performance but experienced a more challenging environment near the end of the period due to uncertainty regarding global trade and tariff policy. Growth outperformed value. A large underweight to information technology securities and strong security selection results in health care and industrials were tailwinds to the Fund's performance relative to the S&P 500® Value Index.
• The Fund is passively managed and seeks to track the investment results (before fees and expenses) of the S&P 500® Pure Value Index (the “Index”). The Fund generally will invest at least 90% of its total assets in securities that comprise the Index.
• For the fiscal year ended April 30, 2025, the Fund's performance, on a net asset value ("NAV") basis, 8.48%, differed from the return of the Index, 8.83%, primarily due to fees and expenses incurred by the Fund during the period.
What contributed to performance?
Sector Allocations | Financials sector, followed by the industrials and health care sectors, respectively.
Positions | United Airlines Holdings, Inc., an industrials company (no longer held at fiscal year-end), and Synchrony Financial, a financials company (no longer held at fiscal year-end).
What detracted from performance?
Sector Allocations | Energy sector, followed by the consumer staples and consumer discretionary sectors, respectively.
Positions | Walgreens Boots Alliance, Inc., a consumer staples company, and Valero Energy Corp., an energy company.
How Has The Fund Historically Performed?
Growth of $10,000 Investment
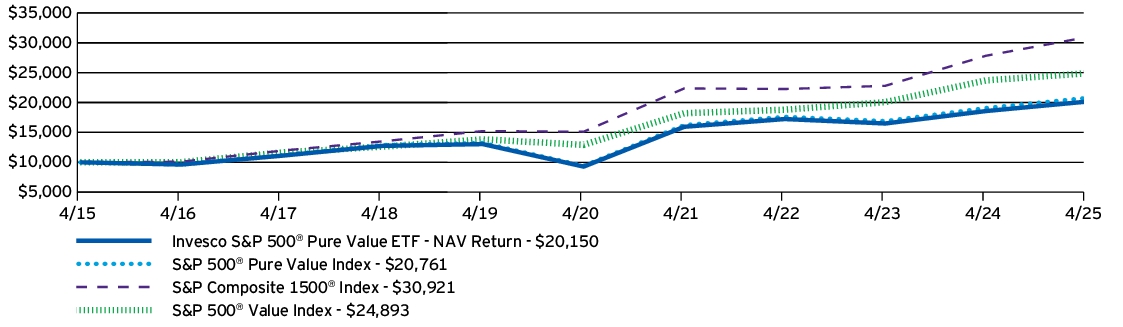
AVERAGE ANNUAL TOTAL RETURNS |
1 Year |
5 Years |
10 Years |
| Invesco S&P 500® Pure Value ETF — NAV Return | 8.48% | 16.76% | 7.26% |
| S&P 500® Pure Value Index | 8.83% | 17.14% | 7.58% |
| S&P Composite 1500® Index | 11.12% | 15.39% | 11.95% |
| S&P 500® Value Index | 5.00% | 14.01% | 9.55% |
Performance figures do not reflect deduction of taxes a shareholder would pay on Fund distributions or sale of Fund shares.
- Effective August 28, 2024, the Fund changed its broad-based securities market benchmark from the S&P 500® Pure Value Index to the S&P Composite 1500® Index to reflect that the S&P Composite 1500® Index can be considered more broadly representative of the overall applicable securities market.
What Are Key Statistics About The Fund?
(as of April 30, 2025)
| Fund net assets | $1,276,120,306 |
| Total number of portfolio holdings | 109 |
| Total advisory fees paid | $6,467,646 |
| Portfolio turnover rate | 42% |
What Comprised The Fund's Holdings?
(as of April 30, 2025)
Top ten holdings*
(% of net assets)
(% of net assets)
| CVS Health Corp. | 3.43% |
| Centene Corp. | 2.67% |
| Ford Motor Co. | 2.59% |
| General Motors Co. | 2.39% |
| Mosaic Co. (The) | 2.38% |
| Bunge Global S.A. | 2.26% |
| Archer-Daniels-Midland Co. | 2.21% |
| Paramount Global, Class B | 2.00% |
| Kroger Co. (The) | 2.00% |
| Tyson Foods, Inc., Class A | 1.89% |
| * Excluding money market fund holdings, if any. |
Sector allocation
(% of net assets)
(% of net assets)
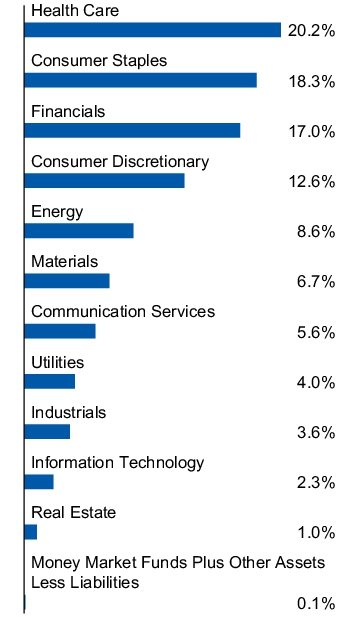
Top ten holdings*
(% of net assets)
(% of net assets)
| CVS Health Corp. | 3.43% |
| Centene Corp. | 2.67% |
| Ford Motor Co. | 2.59% |
| General Motors Co. | 2.39% |
| Mosaic Co. (The) | 2.38% |
| Bunge Global S.A. | 2.26% |
| Archer-Daniels-Midland Co. | 2.21% |
| Paramount Global, Class B | 2.00% |
| Kroger Co. (The) | 2.00% |
| Tyson Foods, Inc., Class A | 1.89% |
| * Excluding money market fund holdings, if any. |
What Were The Fund Costs For The Last Year ?
(Based on a hypothetical $10,000 investment)
| Fund | Costs of a $10,000 investment | Costs paid as a percentage of a $10,000 investment |
| Invesco S&P 500® Top 50 ETF | $21 | 0.20% |
How Did The Fund Perform During The Period?
• During the fiscal year ended April 30, 2025, U.S. equities began the period with strong performance but experienced a more challenging environment near the end of the period due to uncertainty regarding global trade and tariff policy. Growth outperformed value. The Fund slightly underperformed the S&P 100® Index primarily due to poor security selection results within the information technology, health care, and communication services sectors.
• The Fund is passively managed and seeks to track the investment results (before fees and expenses) of the S&P 500® Top 50 Index (the “Index”). The Fund generally will invest at least 90% of its total assets in securities that comprise the Index.
• For the fiscal year ended April 30, 2025, the Fund's performance, on a net asset value ("NAV") basis, 13.89%, differed from the return of the Index, 14.13%, primarily due to fees and expenses incurred by the Fund during the period.
What contributed to performance?
Sector Allocations | Information technology sector, followed by the financials and communication services sectors, respectively.
Positions | NVIDIA Corp., an information technology company, and Apple, Inc., an information technology company.
What detracted from performance?
Sector Allocations | Energy sector.
Positions | Merck & Co., Inc., a health care company, and Advanced Micro Devices, Inc., an information technology company.
How Has The Fund Historically Performed?
Growth of $10,000 Investment
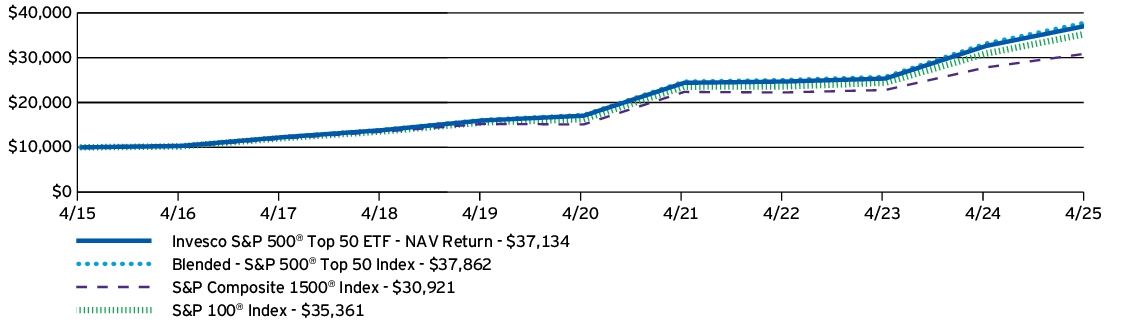
AVERAGE ANNUAL TOTAL RETURNS |
1 Year |
5 Years |
10 Years |
| Invesco S&P 500® Top 50 ETF — NAV Return | 13.89% | 16.82% | 14.02% |
| Blended - S&P 500® Top 50 Index | 14.13% | 17.07% | 14.24% |
| S&P Composite 1500® Index | 11.12% | 15.39% | 11.95% |
| S&P 100® Index | 14.38% | 16.77% | 13.46% |
Performance figures do not reflect deduction of taxes a shareholder would pay on Fund distributions or sale of Fund shares.
- Effective August 28, 2024, the Fund changed its broad-based securities market benchmark from the S&P 100® Index to the S&P Composite 1500® Index to reflect that the S&P Composite 1500® Index can be considered more broadly representative of the overall applicable securities market.
What Are Key Statistics About The Fund?
(as of April 30, 2025)
| Fund net assets | $8,180,847,173 |
| Total number of portfolio holdings | 54 |
| Total advisory fees paid | $13,563,665 |
| Portfolio turnover rate | 3% |
What Comprised The Fund's Holdings?
(as of April 30, 2025)
Top ten holdings*
(% of net assets)
(% of net assets)
| Apple, Inc. | 11.57% |
| Microsoft Corp. | 10.64% |
| NVIDIA Corp. | 9.66% |
| Amazon.com, Inc. | 6.30% |
| Meta Platforms, Inc., Class A | 4.35% |
| Berkshire Hathaway, Inc., Class B | 3.54% |
| Alphabet, Inc., Class A | 3.36% |
| Broadcom, Inc. | 3.27% |
| Tesla, Inc. | 2.86% |
| Alphabet, Inc., Class C | 2.76% |
| * Excluding money market fund holdings, if any. |
Sector allocation
(% of net assets)
(% of net assets)
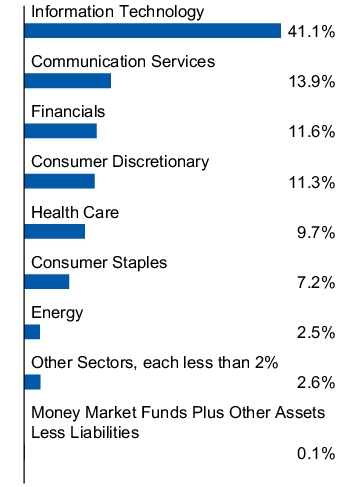
Top ten holdings*
(% of net assets)
(% of net assets)
| Apple, Inc. | 11.57% |
| Microsoft Corp. | 10.64% |
| NVIDIA Corp. | 9.66% |
| Amazon.com, Inc. | 6.30% |
| Meta Platforms, Inc., Class A | 4.35% |
| Berkshire Hathaway, Inc., Class B | 3.54% |
| Alphabet, Inc., Class A | 3.36% |
| Broadcom, Inc. | 3.27% |
| Tesla, Inc. | 2.86% |
| Alphabet, Inc., Class C | 2.76% |
| * Excluding money market fund holdings, if any. |
What Were The Fund Costs For The Last Year ?
(Based on a hypothetical $10,000 investment)
| Fund | Costs of a $10,000 investment | Costs paid as a percentage of a $10,000 investment |
| Invesco S&P MidCap 400® GARP ETF | $33 | 0.35% |
How Did The Fund Perform During The Period?
• During the fiscal year ended April 30, 2025, U.S. mid cap equities showed strong performance subsequent to the conclusion of the U.S. election but struggled near the end of the period due to uncertainty regarding global trade and tariff policy. The Fund's underperformance relative to the S&P MidCap 400® Index was primarily due to its large overweight to and security selection within the energy sector, which resulted from its growth and value multifactor security selection methodology.
• The Fund is passively managed and seeks to track the investment results (before fees and expenses) of the S&P MidCap 400® GARP Index (the “Index”). The Fund generally will invest at least 90% of its total assets in securities that comprise the Index.
• For the fiscal year ended April 30, 2025, the Fund's performance, on a net asset value ("NAV") basis, -10.33%, differed from the return of the Index, -10.03%, primarily due to fees and expenses incurred by the Fund during the period.
What contributed to performance?
Sector Allocations | Biotechnology industry, followed by the health care equipment & supplies and banks industries, respectively.
Positions | Lantheus Holdings, Inc., a health care equipment & supplies company, and Halozyme Therapeutics, Inc., a biotechnology company.
What detracted from performance?
Sector Allocations | Oil, gas & consumable fuels industry, followed by the energy equipment & services and textiles apparel & luxury goods industries, respectively.
Positions | Civitas Resources, Inc., an oil, gas & consumable fuels company, and Valaris Ltd., an energy equipment & services company.
How Has The Fund Historically Performed?
Growth of $10,000 Investment
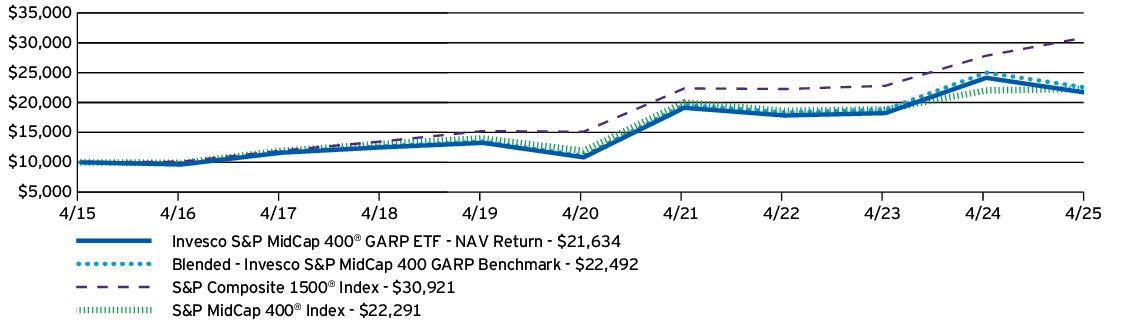
AVERAGE ANNUAL TOTAL RETURNS |
1 Year |
5 Years |
10 Years |
| Invesco S&P MidCap 400® GARP ETF — NAV Return | -10.33% | 14.83% | 8.02% |
| Blended - Invesco S&P MidCap 400 GARP Benchmark | -10.03% | 15.25% | 8.44% |
| S&P Composite 1500® Index | 11.12% | 15.39% | 11.95% |
| S&P MidCap 400® Index | 1.19% | 13.34% | 8.35% |
Performance figures do not reflect deduction of taxes a shareholder would pay on Fund distributions or sale of Fund shares.
- Effective August 28, 2024, the Fund changed its broad-based securities market benchmark from the S&P MidCap 400® Index to the S&P Composite 1500® Index to reflect that the S&P Composite 1500® Index can be considered more broadly representative of the overall applicable securities market.
What Are Key Statistics About The Fund?
(as of April 30, 2025)
| Fund net assets | $447,653,236 |
| Total number of portfolio holdings | 63 |
| Total advisory fees paid | $1,811,864 |
| Portfolio turnover rate | 70% |
What Comprised The Fund's Holdings?
(as of April 30, 2025)
Top ten holdings*
(% of net assets)
(% of net assets)
| Celsius Holdings, Inc. | 4.16% |
| Lantheus Holdings, Inc. | 3.79% |
| Halozyme Therapeutics, Inc. | 3.54% |
| Roivant Sciences Ltd. | 3.12% |
| Crocs, Inc. | 2.35% |
| Chord Energy Corp. | 2.29% |
| Permian Resources Corp. | 2.25% |
| Hancock Whitney Corp. | 2.24% |
| Texas Roadhouse, Inc. | 2.14% |
| Murphy USA, Inc. | 2.14% |
| * Excluding money market fund holdings, if any. |
Sector allocation
(% of net assets)
(% of net assets)
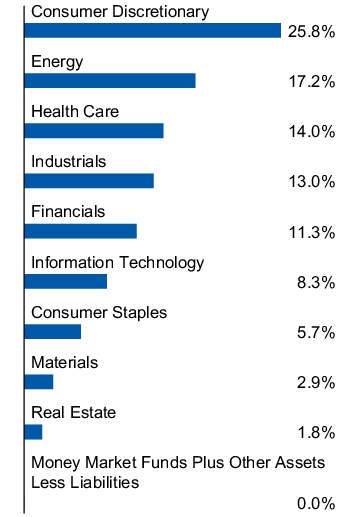
Top ten holdings*
(% of net assets)
(% of net assets)
| Celsius Holdings, Inc. | 4.16% |
| Lantheus Holdings, Inc. | 3.79% |
| Halozyme Therapeutics, Inc. | 3.54% |
| Roivant Sciences Ltd. | 3.12% |
| Crocs, Inc. | 2.35% |
| Chord Energy Corp. | 2.29% |
| Permian Resources Corp. | 2.25% |
| Hancock Whitney Corp. | 2.24% |
| Texas Roadhouse, Inc. | 2.14% |
| Murphy USA, Inc. | 2.14% |
| * Excluding money market fund holdings, if any. |
What Were The Fund Costs For The Last Year ?
(Based on a hypothetical $10,000 investment)
| Fund | Costs of a $10,000 investment | Costs paid as a percentage of a $10,000 investment |
| Invesco S&P MidCap 400® Pure Growth ETF | $34 | 0.35% |
How Did The Fund Perform During The Period?
• During the fiscal year ended April 30, 2025, U.S. mid cap equities showed strong performance subsequent to the conclusion of the U.S. election but struggled near the end of the period due to uncertainty regarding global trade and tariff policy. Growth outperformed value. The Fund's overweight to energy securities, as well as poor security selection results in the consumer staples and energy sectors, weighed on its performance relative to the S&P MidCap 400® Growth Index.
• The Fund is passively managed and seeks to track the investment results (before fees and expenses) of the S&P MidCap 400® Pure Growth Index (the “Index”). The Fund generally will invest at least 90% of its total assets in securities that comprise the Index.
• For the fiscal year ended April 30, 2025, the Fund's performance, on a net asset value ("NAV") basis, -6.46%, differed from the return of the Index, -6.11%, primarily due to fees and expenses incurred by the Fund during the period.
What contributed to performance?
Sector Allocations | Utilities sector, followed by the communication services and information technology sectors, respectively.
Positions | Duolingo, Inc., a consumer discretionary company (no longer held at fiscal year-end), and CNX Resources Corp., an energy company.
What detracted from performance?
Sector Allocations | Energy sector, followed by the health care and consumer discretionary sectors, respectively.
Positions | Celsius Holdings, Inc., a consumer staples company (no longer held at fiscal year-end), and Abercrombie & Fitch Co., Class A, a consumer discretionary company.
How Has The Fund Historically Performed?
Growth of $10,000 Investment
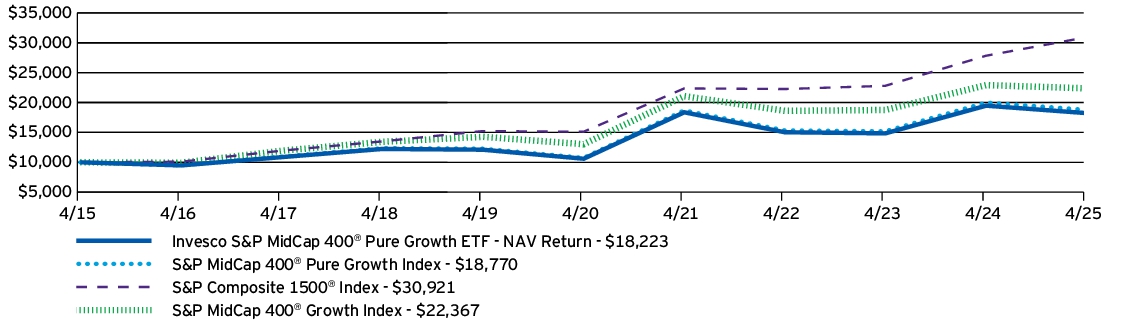
AVERAGE ANNUAL TOTAL RETURNS |
1 Year |
5 Years |
10 Years |
| Invesco S&P MidCap 400® Pure Growth ETF — NAV Return | -6.46% | 11.45% | 6.18% |
| S&P MidCap 400® Pure Growth Index | -6.11% | 11.81% | 6.50% |
| S&P Composite 1500® Index | 11.12% | 15.39% | 11.95% |
| S&P MidCap 400® Growth Index | -2.39% | 11.42% | 8.38% |
Performance figures do not reflect deduction of taxes a shareholder would pay on Fund distributions or sale of Fund shares.
- Effective August 28, 2024, the Fund changed its broad-based securities market benchmark from the S&P MidCap 400® Pure Growth Index to the S&P Composite 1500® Index to reflect that the S&P Composite 1500® Index can be considered more broadly representative of the overall applicable securities market.
What Are Key Statistics About The Fund?
(as of April 30, 2025)
| Fund net assets | $271,433,804 |
| Total number of portfolio holdings | 95 |
| Total advisory fees paid | $1,142,781 |
| Portfolio turnover rate | 77% |
What Comprised The Fund's Holdings?
(as of April 30, 2025)
Top ten holdings*
(% of net assets)
(% of net assets)
| Roivant Sciences Ltd. | 2.47% |
| Carpenter Technology Corp. | 2.30% |
| Hims & Hers Health, Inc. | 2.08% |
| Comfort Systems USA, Inc. | 1.98% |
| Globus Medical, Inc., Class A | 1.87% |
| Exelixis, Inc. | 1.80% |
| RenaissanceRe Holdings Ltd. | 1.67% |
| EMCOR Group, Inc. | 1.62% |
| Valaris Ltd. | 1.62% |
| Shift4 Payments, Inc., Class A | 1.61% |
| * Excluding money market fund holdings, if any. |
Sector allocation
(% of net assets)
(% of net assets)
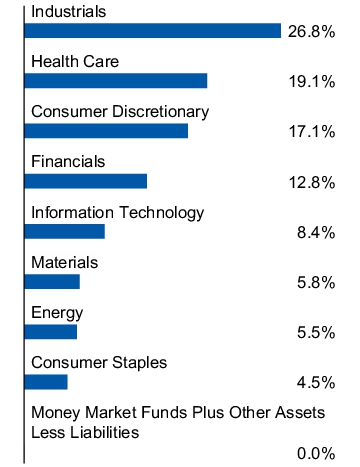
Top ten holdings*
(% of net assets)
(% of net assets)
| Roivant Sciences Ltd. | 2.47% |
| Carpenter Technology Corp. | 2.30% |
| Hims & Hers Health, Inc. | 2.08% |
| Comfort Systems USA, Inc. | 1.98% |
| Globus Medical, Inc., Class A | 1.87% |
| Exelixis, Inc. | 1.80% |
| RenaissanceRe Holdings Ltd. | 1.67% |
| EMCOR Group, Inc. | 1.62% |
| Valaris Ltd. | 1.62% |
| Shift4 Payments, Inc., Class A | 1.61% |
| * Excluding money market fund holdings, if any. |
What Were The Fund Costs For The Last Year ?
(Based on a hypothetical $10,000 investment)
| Fund | Costs of a $10,000 investment | Costs paid as a percentage of a $10,000 investment |
| Invesco S&P MidCap 400® Pure Value ETF | $35 | 0.35% |
How Did The Fund Perform During The Period?
• During the fiscal year ended April 30, 2025, U.S. mid cap equities showed strong performance subsequent to the conclusion of the U.S. election but struggled near the end of the period due to uncertainty regarding global trade and tariff policy. Growth outperformed value. The Fund's security selection results in the energy sector as well as its large overweight to consumer discretionary securities were headwinds to performance relative to the S&P MidCap 400® Value Index.
• The Fund is passively managed and seeks to track the investment results (before fees and expenses) of the S&P MidCap 400® Pure Value Index (the “Index”). The Fund generally will invest at least 90% of its total assets in securities that comprise the Index.
• For the fiscal year ended April 30, 2025, the Fund's performance, on a net asset value ("NAV") basis, 0.26%, differed from the return of the Index, 0.60%, primarily due to fees and expenses incurred by the Fund during the period.
What contributed to performance?
Sector Allocations | Financials sector, followed by the real estate and industrials sectors, respectively.
Positions | MasTec, Inc., an industrials company (no longer held at fiscal year-end), and Jefferies Financial Group, Inc., a financials company (no longer held at fiscal year-end).
What detracted from performance?
Sector Allocations | Energy sector, followed by the consumer discretionary and health care sectors, respectively.
Positions | PBF Energy, Inc., Class A, an energy company, and Macy's, Inc., a consumer discretionary company.
How Has The Fund Historically Performed?
Growth of $10,000 Investment
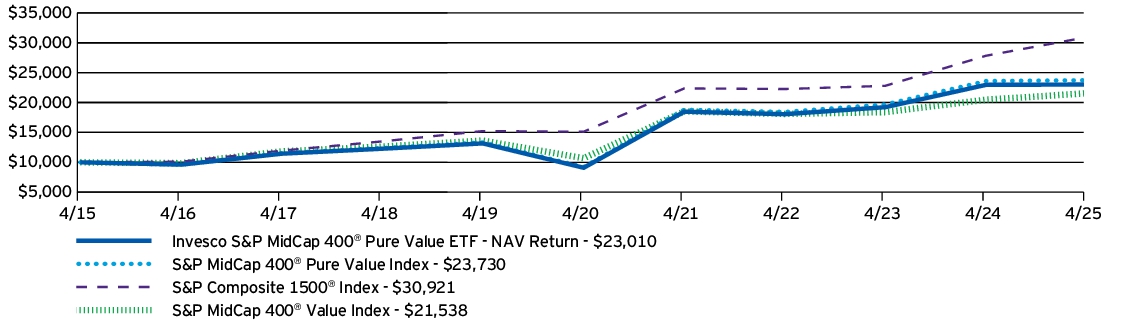
AVERAGE ANNUAL TOTAL RETURNS |
1 Year |
5 Years |
10 Years |
| Invesco S&P MidCap 400® Pure Value ETF — NAV Return | 0.26% | 20.42% | 8.69% |
| S&P MidCap 400® Pure Value Index | 0.60% | 20.82% | 9.03% |
| S&P Composite 1500® Index | 11.12% | 15.39% | 11.95% |
| S&P MidCap 400® Value Index | 5.18% | 15.07% | 7.97% |
Performance figures do not reflect deduction of taxes a shareholder would pay on Fund distributions or sale of Fund shares.
- Effective August 28, 2024, the Fund changed its broad-based securities market benchmark from the S&P MidCap 400® Pure Value Index to the S&P Composite 1500® Index to reflect that the S&P Composite 1500® Index can be considered more broadly representative of the overall applicable securities market.
What Are Key Statistics About The Fund?
(as of April 30, 2025)
| Fund net assets | $227,541,110 |
| Total number of portfolio holdings | 88 |
| Total advisory fees paid | $961,894 |
| Portfolio turnover rate | 50% |
What Comprised The Fund's Holdings?
(as of April 30, 2025)
Top ten holdings*
(% of net assets)
(% of net assets)
| Concentrix Corp. | 4.51% |
| Goodyear Tire & Rubber Co. (The) | 3.86% |
| United States Steel Corp. | 3.22% |
| Avnet, Inc. | 2.86% |
| Arrow Electronics, Inc. | 2.82% |
| HF Sinclair Corp. | 2.77% |
| TD SYNNEX Corp. | 2.58% |
| Lear Corp. | 2.55% |
| Cleveland-Cliffs, Inc. | 2.27% |
| Macy's, Inc. | 2.11% |
| * Excluding money market fund holdings, if any. |
Sector allocation
(% of net assets)
(% of net assets)
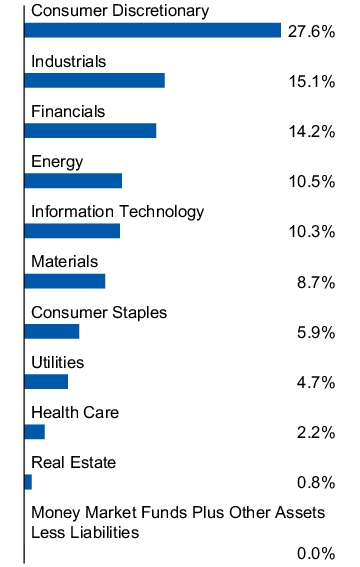
Top ten holdings*
(% of net assets)
(% of net assets)
| Concentrix Corp. | 4.51% |
| Goodyear Tire & Rubber Co. (The) | 3.86% |
| United States Steel Corp. | 3.22% |
| Avnet, Inc. | 2.86% |
| Arrow Electronics, Inc. | 2.82% |
| HF Sinclair Corp. | 2.77% |
| TD SYNNEX Corp. | 2.58% |
| Lear Corp. | 2.55% |
| Cleveland-Cliffs, Inc. | 2.27% |
| Macy's, Inc. | 2.11% |
| * Excluding money market fund holdings, if any. |
What Were The Fund Costs For The Last Year ?
(Based on a hypothetical $10,000 investment)
| Fund | Costs of a $10,000 investment | Costs paid as a percentage of a $10,000 investment |
| Invesco S&P 500® Equal Weight Consumer Discretionary ETF | $41 | 0.40% |
How Did The Fund Perform During The Period?
• During the fiscal year ended April 30, 2025, U.S. large-cap equities saw significant growth and volatility. Technology stocks were a significant driver of return for the S&P 500® Index in the period due to strong earnings. However, market volatility increased towards the second half of the fiscal year, as a result of aggressive tariffs from the Trump administration. During the period, consumer discretionary underperformed the broader market. The Fund's focus on consumer discretionary securities created a performance headwind compared to the S&P 500® Index.
• The Fund is passively managed and seeks to track the investment results (before fees and expenses) of the S&P 500® Equal Weight Consumer Discretionary Index (the “Index”). The Fund generally will invest at least 90% of its total assets in securities that comprise the Index.
• For the fiscal year ended April 30, 2025, the Fund's performance, on a net asset value ("NAV") basis, 4.26%, differed from the return of the Index, 4.70%, primarily due to fees and expenses incurred by the Fund during the period.
What contributed to performance?
Industry Allocations | Hotels, restaurants & leisure industry, followed by the specialty retail and automobiles industries, respectively.
Positions | Tesla, Inc., an automobiles company, and Tapestry, Inc., a textile apparel & luxury goods company.
What detracted from performance?
Industry Allocations | Distributors industry, followed by the automobile components industry.
Positions | NIKE, Inc., Class B, a textile apparel & luxury goods company, and Bath & Body Works, Inc., a specialty retail company (no longer held at fiscal year-end).
How Has The Fund Historically Performed?
Growth of $10,000 Investment
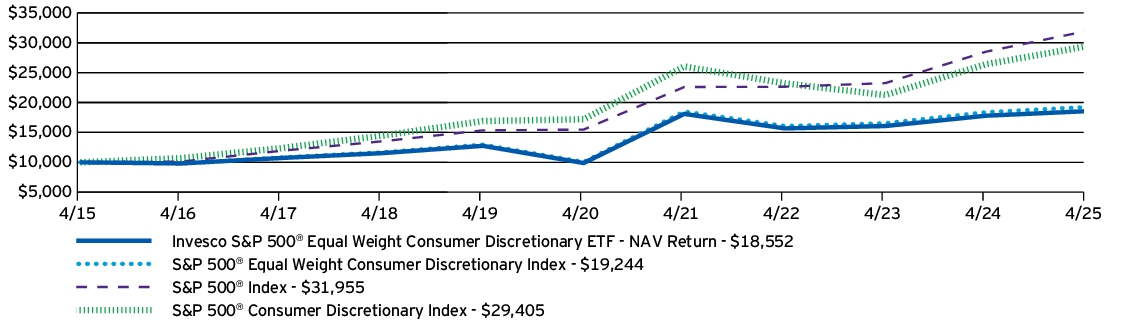
AVERAGE ANNUAL TOTAL RETURNS |
1 Year |
5 Years |
10 Years |
| Invesco S&P 500® Equal Weight Consumer Discretionary ETF — NAV Return | 4.26% | 13.44% | 6.37% |
| S&P 500® Equal Weight Consumer Discretionary Index | 4.70% | 13.87% | 6.77% |
| S&P 500® Index | 12.10% | 15.61% | 12.32% |
| S&P 500® Consumer Discretionary Index | 11.34% | 11.32% | 11.39% |
Performance figures do not reflect deduction of taxes a shareholder would pay on Fund distributions or sale of Fund shares.
What Are Key Statistics About The Fund?
(as of April 30, 2025)
| Fund net assets | $192,274,949 |
| Total number of portfolio holdings | 54 |
| Total advisory fees paid | $1,228,981 |
| Portfolio turnover rate | 27% |
What Comprised The Fund's Holdings?
(as of April 30, 2025)
Top ten holdings*
(% of net assets)
(% of net assets)
| Ulta Beauty, Inc. | 2.41% |
| Booking Holdings, Inc. | 2.33% |
| Tesla, Inc. | 2.28% |
| Domino's Pizza, Inc. | 2.24% |
| TJX Cos., Inc. (The) | 2.24% |
| Ross Stores, Inc. | 2.20% |
| O'Reilly Automotive, Inc. | 2.17% |
| McDonald's Corp. | 2.14% |
| AutoZone, Inc. | 2.12% |
| Darden Restaurants, Inc. | 2.12% |
| * Excluding money market fund holdings, if any. |
Industry allocation
(% of net assets)
(% of net assets)
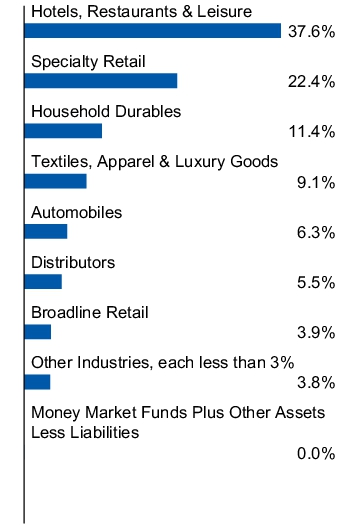
Top ten holdings*
(% of net assets)
(% of net assets)
| Ulta Beauty, Inc. | 2.41% |
| Booking Holdings, Inc. | 2.33% |
| Tesla, Inc. | 2.28% |
| Domino's Pizza, Inc. | 2.24% |
| TJX Cos., Inc. (The) | 2.24% |
| Ross Stores, Inc. | 2.20% |
| O'Reilly Automotive, Inc. | 2.17% |
| McDonald's Corp. | 2.14% |
| AutoZone, Inc. | 2.12% |
| Darden Restaurants, Inc. | 2.12% |
| * Excluding money market fund holdings, if any. |
What Were The Fund Costs For The Last Year ?
(Based on a hypothetical $10,000 investment)
| Fund | Costs of a $10,000 investment | Costs paid as a percentage of a $10,000 investment |
| Invesco S&P SmallCap 600® Pure Growth ETF | $35 | 0.35% |
How Did The Fund Perform During The Period?
• During the fiscal year ended April 30, 2025, U.S. small cap equities showed strong performance subsequent to the conclusion of the U.S. election but struggled near the end of the period due to uncertainty regarding global trade and tariff policy. Growth outperformed value. The Fund's security selection results in the health care, consumer staples, and communication services sectors were tailwinds for relative performance versus the S&P SmallCap 600® Growth Index.
• The Fund is passively managed and seeks to track the investment results (before fees and expenses) of the S&P SmallCap 600® Pure Growth Index (the “Index”). The Fund generally will invest at least 90% of its total assets in securities that comprise the Index.
• For the fiscal year ended April 30, 2025, the Fund's performance, on a net asset value ("NAV") basis, 0.47%, differed from the return of the Index, 0.80%, primarily due to fees and expenses incurred by the Fund during the period.
What contributed to performance?
Sector Allocations | Financials sector, followed by the health care and communication services sectors, respectively.
Positions | TG Therapeutics, Inc., a health care company, and Cinemark Holdings, Inc., a communication services company.
What detracted from performance?
Sector Allocations | Energy sector, followed by the industrials and real estate sectors, respectively.
Positions | Tidewater, Inc., an energy company, and Dave & Buster's Entertainment, Inc., a consumer discretionary company.
How Has The Fund Historically Performed?
Growth of $10,000 Investment
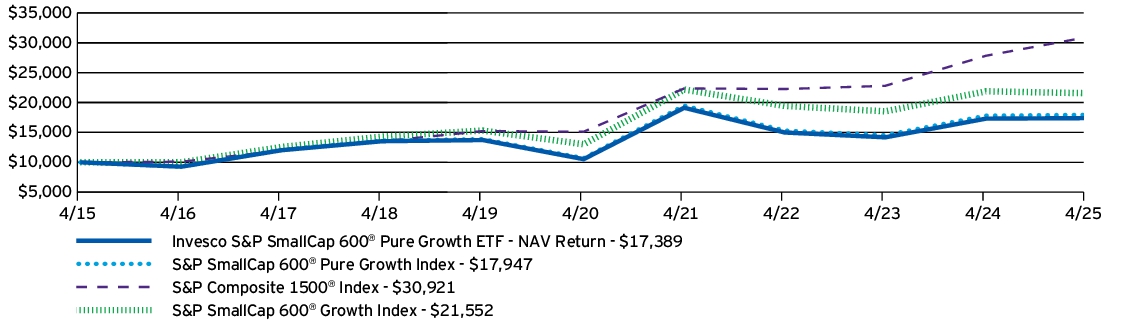
AVERAGE ANNUAL TOTAL RETURNS |
1 Year |
5 Years |
10 Years |
| Invesco S&P SmallCap 600® Pure Growth ETF — NAV Return | 0.47% | 10.57% | 5.69% |
| S&P SmallCap 600® Pure Growth Index | 0.80% | 10.92% | 6.02% |
| S&P Composite 1500® Index | 11.12% | 15.39% | 11.95% |
| S&P SmallCap 600® Growth Index | -1.50% | 10.62% | 7.98% |
Performance figures do not reflect deduction of taxes a shareholder would pay on Fund distributions or sale of Fund shares.
- Effective August 28, 2024, the Fund changed its broad-based securities market benchmark from the S&P SmallCap 600® Pure Growth Index to the S&P Composite 1500® Index to reflect that the S&P Composite 1500® Index can be considered more broadly representative of the overall applicable securities market.
What Are Key Statistics About The Fund?
(as of April 30, 2025)
| Fund net assets | $98,628,960 |
| Total number of portfolio holdings | 136 |
| Total advisory fees paid | $377,890 |
| Portfolio turnover rate | 70% |
What Comprised The Fund's Holdings?
(as of April 30, 2025)
Top ten holdings*
(% of net assets)
(% of net assets)
| TG Therapeutics, Inc. | 2.35% |
| Palomar Holdings, Inc. | 1.99% |
| ADMA Biologics, Inc. | 1.94% |
| Protagonist Therapeutics, Inc. | 1.89% |
| Corcept Therapeutics, Inc. | 1.86% |
| DXP Enterprises, Inc. | 1.71% |
| InterDigital, Inc. | 1.65% |
| Cinemark Holdings, Inc. | 1.64% |
| Chefs' Warehouse, Inc. (The) | 1.55% |
| Adtalem Global Education, Inc. | 1.51% |
| * Excluding money market fund holdings, if any. |
Sector allocation
(% of net assets)
(% of net assets)
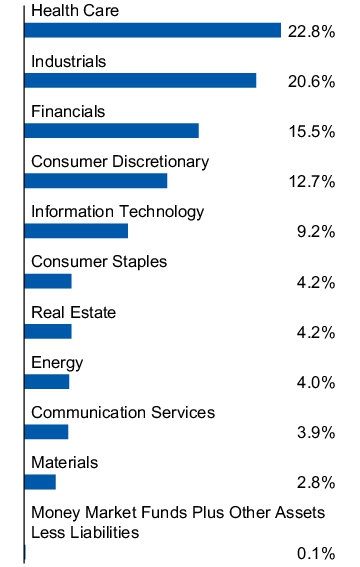
Top ten holdings*
(% of net assets)
(% of net assets)
| TG Therapeutics, Inc. | 2.35% |
| Palomar Holdings, Inc. | 1.99% |
| ADMA Biologics, Inc. | 1.94% |
| Protagonist Therapeutics, Inc. | 1.89% |
| Corcept Therapeutics, Inc. | 1.86% |
| DXP Enterprises, Inc. | 1.71% |
| InterDigital, Inc. | 1.65% |
| Cinemark Holdings, Inc. | 1.64% |
| Chefs' Warehouse, Inc. (The) | 1.55% |
| Adtalem Global Education, Inc. | 1.51% |
| * Excluding money market fund holdings, if any. |
What Were The Fund Costs For The Last Year ?
(Based on a hypothetical $10,000 investment)
| Fund | Costs of a $10,000 investment | Costs paid as a percentage of a $10,000 investment |
| Invesco S&P SmallCap 600® Pure Value ETF | $34 | 0.35% |
How Did The Fund Perform During The Period?
• During the fiscal year ended April 30, 2025, U.S. small cap equities showed strong performance subsequent to the conclusion of the U.S. election but struggled near the end of the period due to uncertainty regarding global trade and tariff policy. Growth outperformed value. The Fund's overweight to consumer discretionary securities, as well as poor security selection results throughout the consumer discretionary, materials, and real estate sectors, were headwinds to relative performance versus the S&P SmallCap 600® Value Index.
• The Fund is passively managed and seeks to track the investment results (before fees and expenses) of the S&P SmallCap 600® Pure Value Index (the “Index”). The Fund generally will invest at least 90% of its total assets in securities that comprise the Index.
• For the fiscal year ended April 30, 2025, the Fund's performance, on a net asset value ("NAV") basis, -5.65%, differed from the return of the Index, -5.30%, primarily due to fees and expenses incurred by the Fund during the period.
What contributed to performance?
Sector Allocations | Financials sector, followed by the communication services and consumer staples sectors, respectively.
Positions | United Natural Foods, Inc., a consumer staples company, and Lumen Technologies, Inc., a communication services company (no longer held at fiscal year-end).
What detracted from performance?
Sector Allocations | Consumer discretionary sector, followed by the materials and energy sectors, respectively.
Positions | Kohl's Corp., a consumer discretionary company, and ODP Corp., a consumer discretionary company (no longer held at fiscal year-end).
How Has The Fund Historically Performed?
Growth of $10,000 Investment
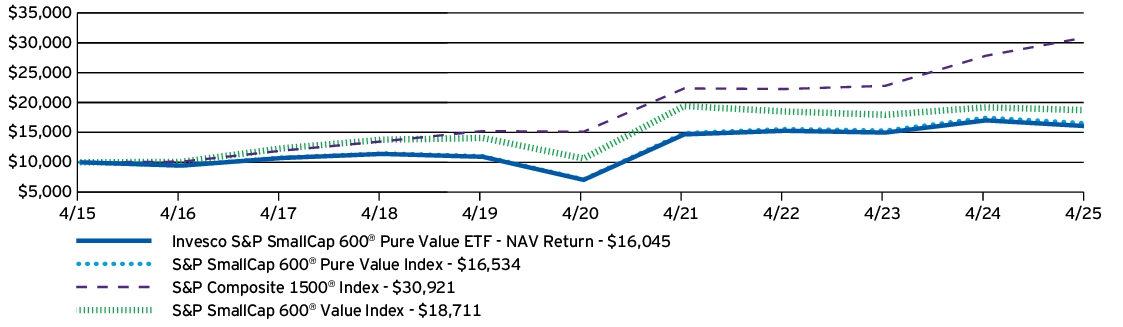
AVERAGE ANNUAL TOTAL RETURNS |
1 Year |
5 Years |
10 Years |
| Invesco S&P SmallCap 600® Pure Value ETF — NAV Return | -5.65% | 17.84% | 4.84% |
| S&P SmallCap 600® Pure Value Index | -5.30% | 18.26% | 5.16% |
| S&P Composite 1500® Index | 11.12% | 15.39% | 11.95% |
| S&P SmallCap 600® Value Index | -2.54% | 11.96% | 6.47% |
Performance figures do not reflect deduction of taxes a shareholder would pay on Fund distributions or sale of Fund shares.
- Effective August 28, 2024, the Fund changed its broad-based securities market benchmark from the S&P SmallCap 600® Pure Value Index to the S&P Composite 1500® Index to reflect that the S&P Composite 1500® Index can be considered more broadly representative of the overall applicable securities market.
What Are Key Statistics About The Fund?
(as of April 30, 2025)
| Fund net assets | $184,627,050 |
| Total number of portfolio holdings | 148 |
| Total advisory fees paid | $830,372 |
| Portfolio turnover rate | 73% |
What Comprised The Fund's Holdings?
(as of April 30, 2025)
Top ten holdings*
(% of net assets)
(% of net assets)
| SpartanNash Co. | 1.92% |
| B&G Foods, Inc. | 1.73% |
| ProAssurance Corp. | 1.70% |
| Par Pacific Holdings, Inc. | 1.68% |
| Dana, Inc. | 1.68% |
| World Kinect Corp. | 1.65% |
| Fresh Del Monte Produce, Inc. | 1.65% |
| Viasat, Inc. | 1.58% |
| Titan International, Inc. | 1.57% |
| EZCORP, Inc., Class A | 1.53% |
| * Excluding money market fund holdings, if any. |
Sector allocation
(% of net assets)
(% of net assets)
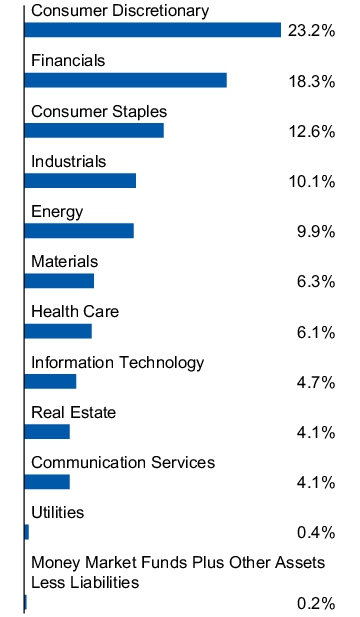
Top ten holdings*
(% of net assets)
(% of net assets)
| SpartanNash Co. | 1.92% |
| B&G Foods, Inc. | 1.73% |
| ProAssurance Corp. | 1.70% |
| Par Pacific Holdings, Inc. | 1.68% |
| Dana, Inc. | 1.68% |
| World Kinect Corp. | 1.65% |
| Fresh Del Monte Produce, Inc. | 1.65% |
| Viasat, Inc. | 1.58% |
| Titan International, Inc. | 1.57% |
| EZCORP, Inc., Class A | 1.53% |
| * Excluding money market fund holdings, if any. |
What Were The Fund Costs For The Last Year ?
(Based on a hypothetical $10,000 investment)
| Fund | Costs of a $10,000 investment | Costs paid as a percentage of a $10,000 investment |
| Invesco Dow Jones Industrial Average Dividend ETF | $7 | 0.07% |
How Did The Fund Perform During The Period?
• During the fiscal year ended April 30, 2025, U.S. equities began the period with strong performance but experienced a more challenging environment near the end of the period due to uncertainty regarding global trade and tariff policy. Despite notable headwinds from significant underweights to the information technology and communications services sectors, the Fund demonstrated relative outperformance versus the Dow Jones Industrial Average Index due to strong security selection results in the industrials, information technology, and communication services sectors.
• The Fund is passively managed and seeks to track the investment results (before fees and expenses) of the Dow Jones Industrial Average Yield Weighted Index (the “Index”). The Fund generally will invest at least 90% of its total assets in securities that comprise the Index.
• For the fiscal year ended April 30, 2025, the Fund's performance, on a net asset value ("NAV") basis, 11.91%, differed from the return of the Index, 12.01%, primarily due to fees and expenses incurred by the Fund during the period.
What contributed to performance?
Sector Allocations | Industrials sector, followed by the financials and information technology sectors, respectively.
Positions | 3M Co., an industrials company, and International Business Machines Corp., an information technology company.
What detracted from performance?
Sector Allocations | Health care sector, followed by the materials and energy sectors, respectively.
Positions | Merck & Co., Inc., a health care company, and NIKE, Inc., Class B, a consumer discretionary company.
How Has The Fund Historically Performed?
Growth of $10,000 Investment
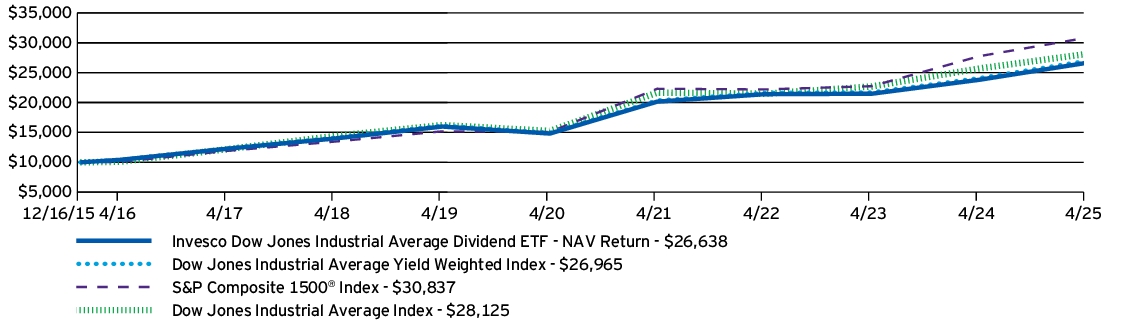
AVERAGE ANNUAL TOTAL RETURNS |
1 Year |
5 Years |
Since Inception (12/16/15) |
| Invesco Dow Jones Industrial Average Dividend ETF — NAV Return | 11.91% | 12.46% | 11.02% |
| Dow Jones Industrial Average Yield Weighted Index | 12.01% | 12.55% | 11.16% |
| S&P Composite 1500® Index | 11.12% | 15.39% | 12.77% |
| Dow Jones Industrial Average Index | 9.48% | 13.05% | 11.66% |
Performance figures do not reflect deduction of taxes a shareholder would pay on Fund distributions or sale of Fund shares.
- Effective August 28, 2024, the Fund changed its broad-based securities market benchmark from the Dow Jones Industrial Average Index to the S&P Composite 1500® Index to reflect that the S&P Composite 1500® Index can be considered more broadly representative of the overall applicable securities market.
What Are Key Statistics About The Fund?
(as of April 30, 2025)
| Fund net assets | $333,616,824 |
| Total number of portfolio holdings | 29 |
| Total advisory fees paid | $221,877 |
| Portfolio turnover rate | 23% |
What Comprised The Fund's Holdings?
(as of April 30, 2025)
Top ten holdings*
(% of net assets)
(% of net assets)
| Verizon Communications, Inc. | 11.66% |
| Chevron Corp. | 6.85% |
| Merck & Co., Inc. | 5.80% |
| Coca-Cola Co. (The) | 5.51% |
| Johnson & Johnson | 5.29% |
| Amgen, Inc. | 5.26% |
| International Business Machines Corp. | 4.73% |
| McDonald's Corp. | 4.49% |
| Cisco Systems, Inc. | 4.48% |
| Home Depot, Inc. (The) | 4.36% |
| * Excluding money market fund holdings, if any. |
Sector allocation
(% of net assets)
(% of net assets)
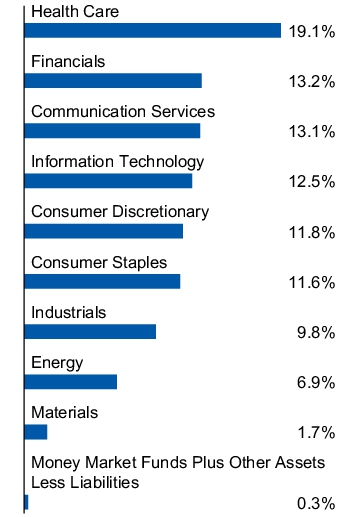
Top ten holdings*
(% of net assets)
(% of net assets)
| Verizon Communications, Inc. | 11.66% |
| Chevron Corp. | 6.85% |
| Merck & Co., Inc. | 5.80% |
| Coca-Cola Co. (The) | 5.51% |
| Johnson & Johnson | 5.29% |
| Amgen, Inc. | 5.26% |
| International Business Machines Corp. | 4.73% |
| McDonald's Corp. | 4.49% |
| Cisco Systems, Inc. | 4.48% |
| Home Depot, Inc. (The) | 4.36% |
| * Excluding money market fund holdings, if any. |
What Were The Fund Costs For The Last Year ?
(Based on a hypothetical $10,000 investment)
| Fund | Costs of a $10,000 investment | Costs paid as a percentage of a $10,000 investment |
| Invesco Zacks Mid-Cap ETF | $71 | 0.69% |
How Did The Fund Perform During The Period?
• During the fiscal year ended April 30, 2025, U.S. mid cap equities finished the period with positive returns, outperforming their smaller cap peers, and underperforming large caps. The Fund underperformed the Russell Midcap® Index primarily due to poor security selection within the industrials and health care sectors.
• The Fund is passively managed and seeks to track the investment results (before fees and expenses) of the Zacks Mid-Cap Core Index (the “Index”). The Fund generally will invest at least 90% of its total assets in securities that comprise the Index, as well as American depositary receipts that represent securities in the Index.
• For the fiscal year ended April 30, 2025, the Fund's performance, on a net asset value ("NAV") basis, 5.60%, differed from the return of the Index, 6.36%, primarily due to fees and expenses incurred by the Fund during the period.
What contributed to performance?
Sector Allocations | Financials sector, followed by the utilities and information technology sectors, respectively.
Positions | Entergy Corp., a utilities company (no longer held at fiscal year-end) and Hartford Insurance Group, Inc., a financials company.
What detracted from performance?
Sector Allocations | Health care sector, followed by the materials and industrials sectors, respectively.
Positions | LyondellBasell Industries N.V., a materials company, and Brown-Forman Corp., Class B, a consumer staples company.
How Has The Fund Historically Performed?
Growth of $10,000 Investment
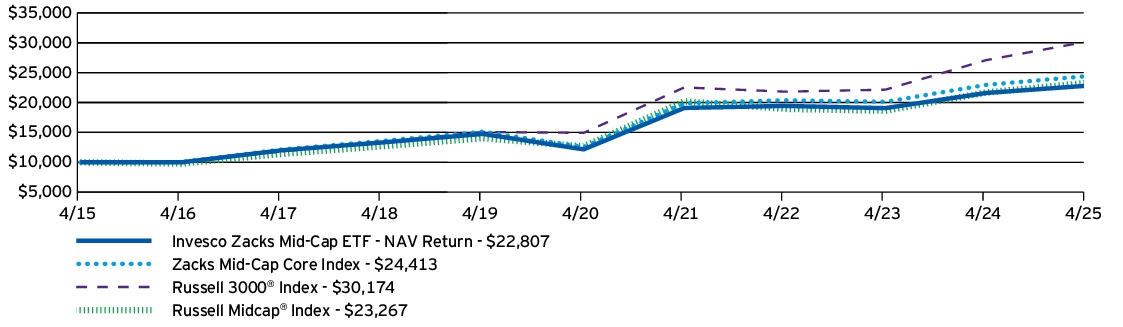
AVERAGE ANNUAL TOTAL RETURNS |
1 Year |
5 Years |
10 Years |
| Invesco Zacks Mid-Cap ETF — NAV Return | 5.60% | 13.40% | 8.59% |
| Zacks Mid-Cap Core Index | 6.36% | 14.21% | 9.34% |
| Russell 3000® Index | 11.40% | 15.12% | 11.68% |
| Russell Midcap® Index | 7.33% | 12.96% | 8.81% |
Performance figures do not reflect deduction of taxes a shareholder would pay on Fund distributions or sale of Fund shares.
- Effective August 28, 2024, the Fund changed its broad-based securities market benchmark from the Russell Midcap® Index to the Russell 3000® Index to reflect that the Russell 3000® Index can be considered more broadly representative of the overall applicable securities market.
What Are Key Statistics About The Fund?
(as of April 30, 2025)
| Fund net assets | $179,405,994 |
| Total number of portfolio holdings | 103 |
| Total advisory fees paid | $988,034 |
| Portfolio turnover rate | 112% |
What Comprised The Fund's Holdings?
(as of April 30, 2025)
Top ten holdings*
(% of net assets)
(% of net assets)
| Hartford Insurance Group, Inc. (The) | 2.24% |
| Constellation Brands, Inc., Class A | 2.20% |
| Extra Space Storage, Inc. | 2.01% |
| Brown & Brown, Inc. | 2.01% |
| Wabtec Corp. | 2.01% |
| Willis Towers Watson PLC | 1.97% |
| Centene Corp. | 1.93% |
| AvalonBay Communities, Inc. | 1.92% |
| Nutrien Ltd. | 1.91% |
| DTE Energy Co. | 1.89% |
| * Excluding money market fund holdings, if any. |
Sector allocation
(% of net assets)
(% of net assets)
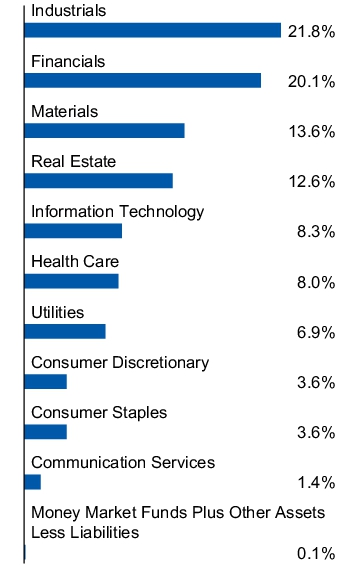
Top ten holdings*
(% of net assets)
(% of net assets)
| Hartford Insurance Group, Inc. (The) | 2.24% |
| Constellation Brands, Inc., Class A | 2.20% |
| Extra Space Storage, Inc. | 2.01% |
| Brown & Brown, Inc. | 2.01% |
| Wabtec Corp. | 2.01% |
| Willis Towers Watson PLC | 1.97% |
| Centene Corp. | 1.93% |
| AvalonBay Communities, Inc. | 1.92% |
| Nutrien Ltd. | 1.91% |
| DTE Energy Co. | 1.89% |
| * Excluding money market fund holdings, if any. |
This report describes changes to the Fund that occurred during the reporting period.
What Were The Fund Costs For The Last Year ?
(Based on a hypothetical $10,000 investment)
| Fund | Costs of a $10,000 investment | Costs paid as a percentage of a $10,000 investment |
| Invesco Zacks Multi-Asset Income ETF | $72 | 0.71%† |
|
† |
Reflects fee waivers and/or expense reimbursements, without which expenses would have been higher. |
How Did The Fund Perform During The Period?
• During the fiscal year ended April 30, 2025, high dividend paying equities underperformed the broader market. The Fund's focus on income led to a significant overweight to a struggling energy sector and an underweight to an above average performing information technology sector. In the first quarter of 2025, there were signs of this trend reversing, but we believe a return to risk assets may cause this headwind to resume.
• The Fund is passively managed and seeks to track the investment results (before fees and expenses) of the Zacks Multi-Asset Income Index (the “Index”). The Fund generally will invest at least 90% of its total assets in securities that comprise the Index, as well as American depositary receipts that represent securities in the Index.
• For the fiscal year ended April 30, 2025, the Fund's performance, on a net asset value ("NAV") basis, 1.97%, differed from the return of the Index, 2.41%, primarily due to fees and expenses incurred by the Fund during the period, partially offset by income received from the securities lending program in which the Fund participates.
What contributed to performance?
Sector Allocations | Financials sector, followed by the real estate sector.
Positions | Banco BBVA Argentina S.A., ADR, a financials company (no longer held at fiscal year-end) and Synchrony Financial, a financials company (no longer held at fiscal year-end).
What detracted from performance?
Sector Allocations | Energy sector followed by the materials and consumer discretionary sectors, respectively.
Positions | PBF Energy, Inc., Class A, an energy company and Cenovus Energy, Inc., an energy company.
How Has The Fund Historically Performed?
Growth of $10,000 Investment
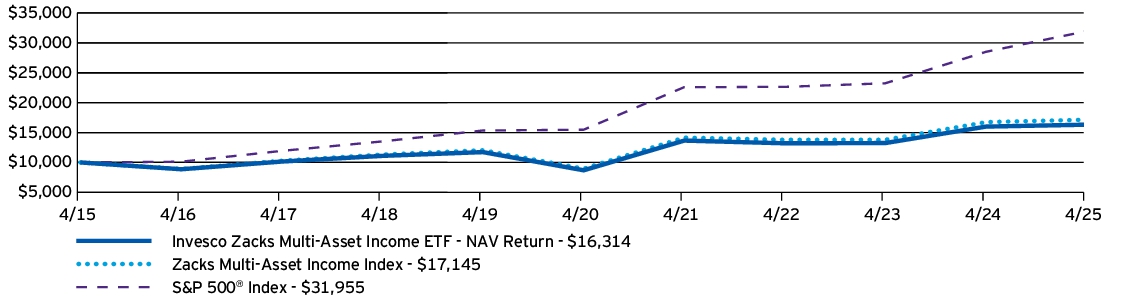
AVERAGE ANNUAL TOTAL RETURNS |
1 Year |
5 Years |
10 Years |
| Invesco Zacks Multi-Asset Income ETF — NAV Return | 1.97% | 13.43% | 5.02% |
| Zacks Multi-Asset Income Index | 2.41% | 13.84% | 5.54% |
| S&P 500® Index | 12.10% | 15.61% | 12.32% |
Performance figures do not reflect deduction of taxes a shareholder would pay on Fund distributions or sale of Fund shares.
What Are Key Statistics About The Fund?
(as of April 30, 2025)
| Fund net assets | $106,553,174 |
| Total number of portfolio holdings | 152 |
| Total advisory fees paid | $573,754 |
| Portfolio turnover rate | 115% |
What Comprised The Fund's Holdings?
(as of April 30, 2025)
Top ten holdings*
(% of net assets)
(% of net assets)
| Itau Unibanco Holding S.A., ADR | 1.30% |
| Alliance Resource Partners L.P. | 1.26% |
| Signet Jewelers Ltd. | 1.23% |
| Kroger Co. (The) | 1.18% |
| Cigna Group (The) | 1.16% |
| Nuveen Preferred & Income Opportunities Fund | 1.14% |
| Bunge Global S.A. | 1.13% |
| Nuveen Floating Rate Income Fund | 1.13% |
| AT&T, Inc., Series C, Pfd., 4.75% | 1.12% |
| Hartford Insurance Group, Inc. (The) | 1.12% |
| * Excluding money market fund holdings, if any. |
Sector allocation
(% of net assets)
(% of net assets)
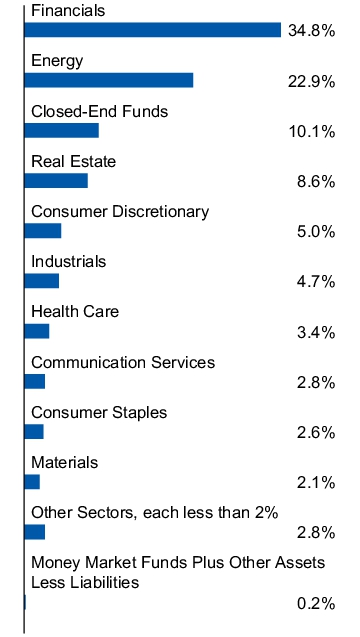
Top ten holdings*
(% of net assets)
(% of net assets)
| Itau Unibanco Holding S.A., ADR | 1.30% |
| Alliance Resource Partners L.P. | 1.26% |
| Signet Jewelers Ltd. | 1.23% |
| Kroger Co. (The) | 1.18% |
| Cigna Group (The) | 1.16% |
| Nuveen Preferred & Income Opportunities Fund | 1.14% |
| Bunge Global S.A. | 1.13% |
| Nuveen Floating Rate Income Fund | 1.13% |
| AT&T, Inc., Series C, Pfd., 4.75% | 1.12% |
| Hartford Insurance Group, Inc. (The) | 1.12% |
| * Excluding money market fund holdings, if any. |
How Has The Fund Changed Over The Past Year?
This is a summary of certain changes to the Fund since April 30, 2024. For more complete information, you may review the Fund's prospectus, which is available at invesco.com/reports or upon request at (800) 983-0903.
The Fund's net expense ratio increased from the prior fiscal year end as a result of a change in operating expenses.
The Fund's net expense ratio increased from the prior fiscal year end as a result of a change in operating expenses.
This is a summary of certain changes to the Fund since April 30, 2024. For more complete information, you may review the Fund's prospectus, which is available at invesco.com/reports or upon request at (800) 983-0903.
This report describes changes to the Fund that occurred during the reporting period.
What Were The Fund Costs For The Last Year ?
(Based on a hypothetical $10,000 investment)
| Fund | Costs of a $10,000 investment | Costs paid as a percentage of a $10,000 investment |
| Invesco Bloomberg Analyst Rating Improvers ETF | $41 | 0.40% |
How Did The Fund Perform During The Period?
• During the fiscal year ended April 30, 2025, U.S. equities had strong performance in the beginning with a more challenging environment at the end due to uncertainty regarding global trade and tariff policy. During the period, companies included in the Bloomberg ANR Improvers Index pursuant to the proprietary security selection methodology generally underperformed the broader stock market, although certain holdings performed well relative to the S&P MidCap 400® Index.
• The Fund is passively managed and seeks to track the investment results (before fees and expenses) of the Bloomberg ANR Improvers Index (the “Index”). The Fund generally will invest at least 90% of its total assets in securities that comprise the Index.
• For the fiscal year ended April 30, 2025, the Fund's performance, on a net asset value ("NAV") basis, 7.15%, differed from the return of the Index, 6.92%, primarily due to income received from the securities lending program in which the Fund participates, partially offset by fees and expenses that the Fund incurred during the period.
What contributed to performance?
Sector Allocations | Utilities sector, followed by the communication services and information technology sectors, respectively.
Positions | Palantir Technologies, Inc., Class A, an information technology company (no longer held at fiscal year-end), and Carvana Co., a consumer discretionary company.
What detracted from performance?
Sector Allocations | Materials sector, followed by the consumer staples sector.
Positions | Dollar Tree, Inc., a consumer staples company (no longer held at fiscal year-end), and UiPath, Inc., Class A, an information technology company (no longer held at fiscal year-end).
How Has The Fund Historically Performed?
Growth of $10,000 Investment
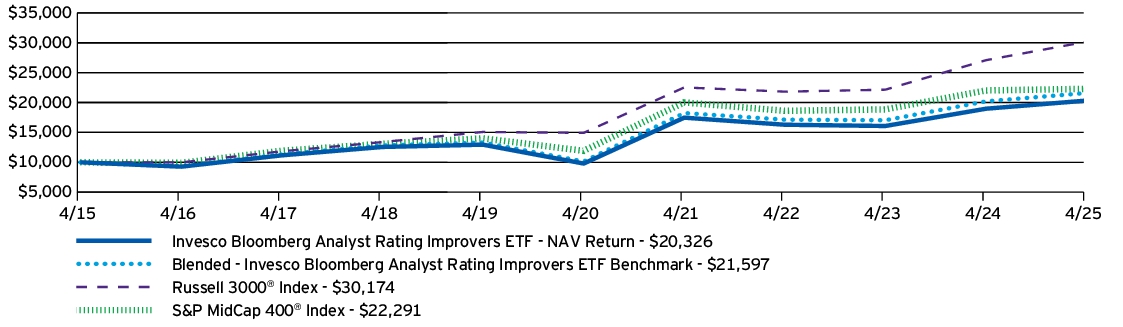
AVERAGE ANNUAL TOTAL RETURNS |
1 Year |
5 Years |
10 Years |
| Invesco Bloomberg Analyst Rating Improvers ETF — NAV Return | 7.15% | 15.73% | 7.35% |
| Blended - Invesco Bloomberg Analyst Rating Improvers ETF Benchmark | 6.92% | 16.33% | 8.00% |
| Russell 3000® Index | 11.40% | 15.12% | 11.68% |
| S&P MidCap 400® Index | 1.19% | 13.34% | 8.35% |
Performance figures do not reflect deduction of taxes a shareholder would pay on Fund distributions or sale of Fund shares.
- Effective August 28, 2024, the Fund changed its broad-based securities market benchmark from the S&P MidCap 400® Index to the Russell 3000® Index to reflect that the Russell 3000® Index can be considered more broadly representative of the overall applicable securities market.
What Are Key Statistics About The Fund?
(as of April 30, 2025)
| Fund net assets | $103,554,187 |
| Total number of portfolio holdings | 53 |
| Total advisory fees paid | $442,822 |
| Portfolio turnover rate | 191% |
What Comprised The Fund's Holdings?
(as of April 30, 2025)
Top ten holdings*
(% of net assets)
(% of net assets)
| Consolidated Edison, Inc. | 2.52% |
| Okta, Inc. | 2.46% |
| Fair Isaac Corp. | 2.41% |
| Northrop Grumman Corp. | 2.39% |
| Lockheed Martin Corp. | 2.35% |
| Kroger Co. (The) | 2.35% |
| Exelon Corp. | 2.34% |
| Albertson's Cos., Inc., Class A | 2.28% |
| WEC Energy Group, Inc. | 2.25% |
| Verizon Communications, Inc. | 2.23% |
| * Excluding money market fund holdings, if any. |
Sector allocation
(% of net assets)
(% of net assets)
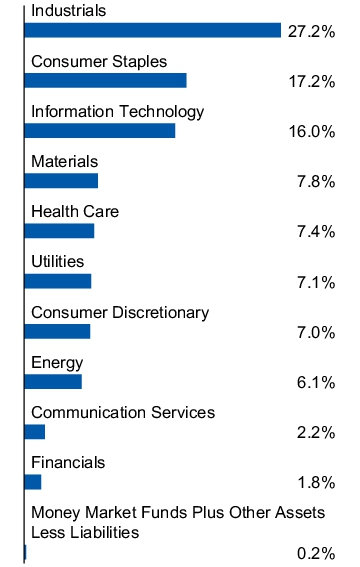
Top ten holdings*
(% of net assets)
(% of net assets)
| Consolidated Edison, Inc. | 2.52% |
| Okta, Inc. | 2.46% |
| Fair Isaac Corp. | 2.41% |
| Northrop Grumman Corp. | 2.39% |
| Lockheed Martin Corp. | 2.35% |
| Kroger Co. (The) | 2.35% |
| Exelon Corp. | 2.34% |
| Albertson's Cos., Inc., Class A | 2.28% |
| WEC Energy Group, Inc. | 2.25% |
| Verizon Communications, Inc. | 2.23% |
| * Excluding money market fund holdings, if any. |
How Has The Fund Changed Over The Past Year?
This is a summary of certain changes to the Fund since April 30, 2024. For more complete information, you may review the Fund's prospectus, which is available at invesco.com/reports or upon request at (800) 983-0903.
The Fund's net expense ratio decreased from the prior fiscal year end as a result of a change in the Fund's investment advisory agreement which became effective on March 25, 2024.
The Fund's net expense ratio decreased from the prior fiscal year end as a result of a change in the Fund's investment advisory agreement which became effective on March 25, 2024.
This is a summary of certain changes to the Fund since April 30, 2024. For more complete information, you may review the Fund's prospectus, which is available at invesco.com/reports or upon request at (800) 983-0903.
What Were The Fund Costs For The Last Year ?
(Based on a hypothetical $10,000 investment)
| Fund | Costs of a $10,000 investment | Costs paid as a percentage of a $10,000 investment |
| Invesco S&P Spin-Off ETF | $68 | 0.65%† |
|
† |
Reflects fee waivers and/or expense reimbursements, without which expenses would have been higher. |
How Did The Fund Perform During The Period?
• During the fiscal year ended April 30, 2025, spin-off activity has generally performed well, with increased scale and complexity. The U.S. saw an increase in spin-off initial public offerings in 2024, doubling 2023 figures. 2025 seems to be carrying that momentum forward, with some analysts predicting a record year for spin-off activity. Security selection within the energy and materials sectors created a tailwind to Fund performance relative to the Russell Midcap® Index.
• The Fund is passively managed and seeks to track the investment results (before fees and expenses) of the S&P U.S. Spin-Off Index (the “Index”). The Fund generally will invest at least 90% of its total assets in securities that comprise the Index.
• For the fiscal year ended April 30, 2025, the Fund's performance, on a net asset value ("NAV") basis, 7.70%, differed from the return of the Index, 8.30%, primarily due to fees and expenses incurred by the Fund during the period.
What contributed to performance?
Sector Allocations | Industrials sector, followed by the utilities and energy sectors, respectively.
Positions | GE Vernova, Inc., an industrials company, and Constellation Energy Corp., a utilities company.
What detracted from performance?
Sector Allocations | Health care sector.
Positions | Fortrea Holdings, Inc., a health care company, and SanDisk Corp., an information technology company.
How Has The Fund Historically Performed?
Growth of $10,000 Investment
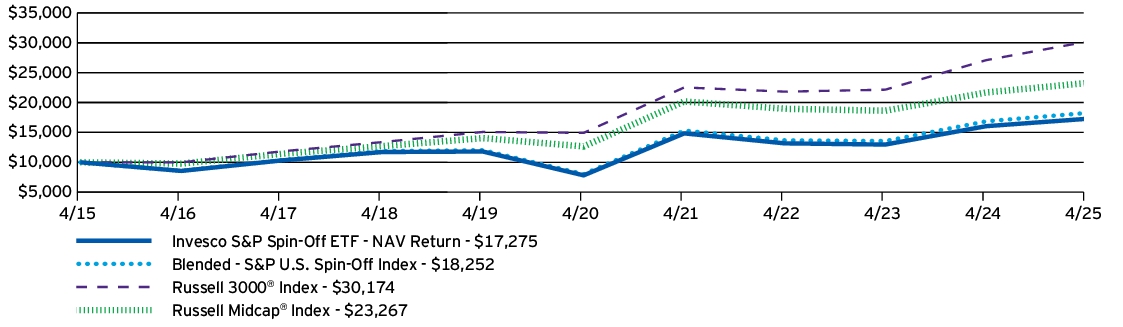
AVERAGE ANNUAL TOTAL RETURNS |
1 Year |
5 Years |
10 Years |
| Invesco S&P Spin-Off ETF — NAV Return | 7.70% | 17.17% | 5.62% |
| Blended - S&P U.S. Spin-Off Index | 8.30% | 17.87% | 6.20% |
| Russell 3000® Index | 11.40% | 15.12% | 11.68% |
| Russell Midcap® Index | 7.33% | 12.96% | 8.81% |
Performance figures do not reflect deduction of taxes a shareholder would pay on Fund distributions or sale of Fund shares.
- Effective August 28, 2024, the Fund changed its broad-based securities market benchmark from the Russell Midcap® Index to the Russell 3000® Index to reflect that the Russell 3000® Index can be considered more broadly representative of the overall applicable securities market.
What Are Key Statistics About The Fund?
(as of April 30, 2025)
| Fund net assets | $61,700,923 |
| Total number of portfolio holdings | 34 |
| Total advisory fees paid | $316,501 |
| Portfolio turnover rate | 74% |
What Comprised The Fund's Holdings?
(as of April 30, 2025)
Top ten holdings*
(% of net assets)
(% of net assets)
| GE Vernova, Inc. | 8.24% |
| GE HealthCare Technologies, Inc. | 7.85% |
| Veralto Corp. | 7.64% |
| Constellation Energy Corp. | 7.53% |
| DT Midstream, Inc. | 6.26% |
| Kyndryl Holdings, Inc. | 4.89% |
| Crane Co. | 4.74% |
| ESAB Corp. | 4.45% |
| Knife River Corp. | 4.43% |
| Solventum Corp. | 4.20% |
| * Excluding money market fund holdings, if any. |
Sector allocation
(% of net assets)
(% of net assets)
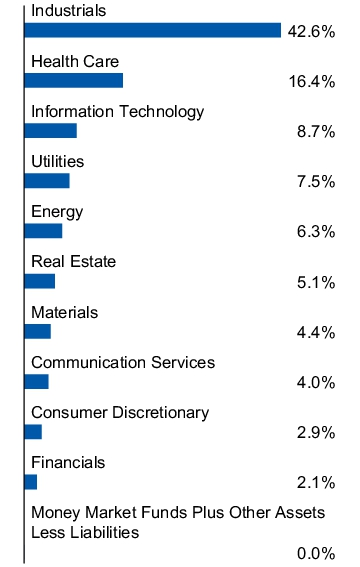
Top ten holdings*
(% of net assets)
(% of net assets)
| GE Vernova, Inc. | 8.24% |
| GE HealthCare Technologies, Inc. | 7.85% |
| Veralto Corp. | 7.64% |
| Constellation Energy Corp. | 7.53% |
| DT Midstream, Inc. | 6.26% |
| Kyndryl Holdings, Inc. | 4.89% |
| Crane Co. | 4.74% |
| ESAB Corp. | 4.45% |
| Knife River Corp. | 4.43% |
| Solventum Corp. | 4.20% |
| * Excluding money market fund holdings, if any. |
What Were The Fund Costs For The Last Year ?
(Based on a hypothetical $10,000 investment)
| Fund | Costs of a $10,000 investment | Costs paid as a percentage of a $10,000 investment |
| Invesco S&P 500® Equal Weight Consumer Staples ETF | $40 | 0.40% |
How Did The Fund Perform During The Period?
• During the fiscal year ended April 30, 2025, U.S. large-cap equities saw significant growth and volatility. Technology stocks were a significant driver of return for the S&P 500® Index in the period due to strong earnings. However, market volatility increased towards the second half of the fiscal year, as a result of aggressive tariffs from the Trump administration. During the period, consumer staples outperformed the broader market. However, the Fund's equal weighting methodology caused it to have greater exposure to some smaller capitalization consumer staples securities compared to their representation in the S&P 500® Index, which created a performance headwind compared to the S&P 500® Index.
• The Fund is passively managed and seeks to track the investment results (before fees and expenses) of the S&P 500® Equal Weight Consumer Staples Index (the “Index”). The Fund generally will invest at least 90% of its total assets in securities that comprise the Index.
• For the fiscal year ended April 30, 2025, the Fund's performance, on a net asset value ("NAV") basis, -2.21%, differed from the return of the Index, -1.82%, primarily due to fees and expenses incurred by the Fund during the period.
What contributed to performance?
Industry Allocations | Tobacco industry, followed by the consumer staples distribution & retail and household products industries, respectively.
Positions | Philip Morris International, Inc., a tobacco company, and Walmart, Inc., a consumer staples distribution & retail company.
What detracted from performance?
Industry Allocations | Food products industry, followed by the personal care products and beverages industries, respectively.
Positions | Estee Lauder Cos., Inc. (The), Class A, a personal care products company, and Target Corp., a consumer staples distribution & retail company.
How Has The Fund Historically Performed?
Growth of $10,000 Investment
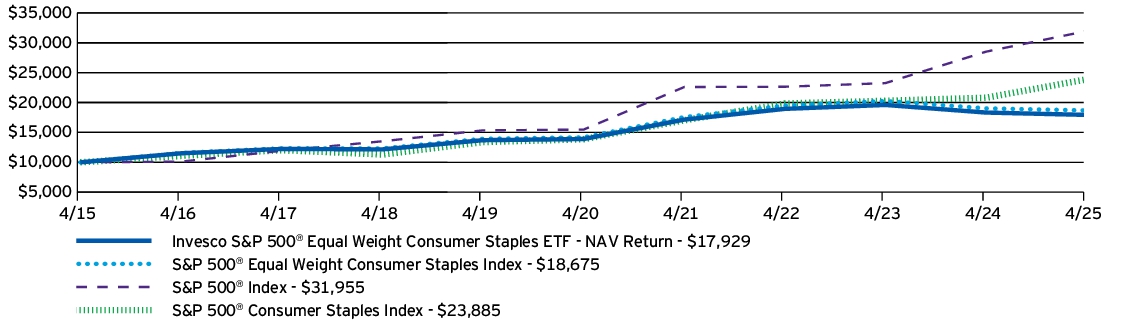
AVERAGE ANNUAL TOTAL RETURNS |
1 Year |
5 Years |
10 Years |
| Invesco S&P 500® Equal Weight Consumer Staples ETF — NAV Return | -2.21% | 5.23% | 6.01% |
| S&P 500® Equal Weight Consumer Staples Index | -1.82% | 5.66% | 6.45% |
| S&P 500® Index | 12.10% | 15.61% | 12.32% |
| S&P 500® Consumer Staples Index | 14.84% | 11.49% | 9.10% |
Performance figures do not reflect deduction of taxes a shareholder would pay on Fund distributions or sale of Fund shares.
What Are Key Statistics About The Fund?
(as of April 30, 2025)
| Fund net assets | $270,257,617 |
| Total number of portfolio holdings | 41 |
| Total advisory fees paid | $1,322,135 |
| Portfolio turnover rate | 20% |
What Comprised The Fund's Holdings?
(as of April 30, 2025)
Top ten holdings*
(% of net assets)
(% of net assets)
| Dollar Tree, Inc. | 3.40% |
| Dollar General Corp. | 3.23% |
| Walmart, Inc. | 2.95% |
| Philip Morris International, Inc. | 2.92% |
| Kroger Co. (The) | 2.87% |
| Monster Beverage Corp. | 2.85% |
| Bunge Global S.A. | 2.78% |
| Costco Wholesale Corp. | 2.76% |
| Keurig Dr Pepper, Inc. | 2.72% |
| Mondelez International, Inc., Class A | 2.71% |
| * Excluding money market fund holdings, if any. |
Industry allocation
(% of net assets)
(% of net assets)
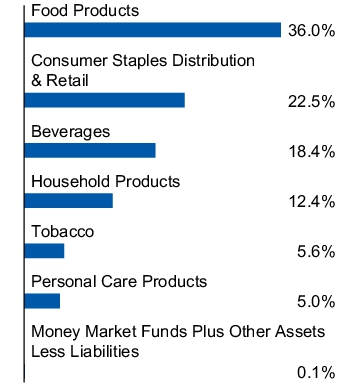
Top ten holdings*
(% of net assets)
(% of net assets)
| Dollar Tree, Inc. | 3.40% |
| Dollar General Corp. | 3.23% |
| Walmart, Inc. | 2.95% |
| Philip Morris International, Inc. | 2.92% |
| Kroger Co. (The) | 2.87% |
| Monster Beverage Corp. | 2.85% |
| Bunge Global S.A. | 2.78% |
| Costco Wholesale Corp. | 2.76% |
| Keurig Dr Pepper, Inc. | 2.72% |
| Mondelez International, Inc., Class A | 2.71% |
| * Excluding money market fund holdings, if any. |
What Were The Fund Costs For The Last Year ?
(Based on a hypothetical $10,000 investment)
| Fund | Costs of a $10,000 investment | Costs paid as a percentage of a $10,000 investment |
| Invesco S&P 500® Equal Weight Energy ETF | $38 | 0.40% |
How Did The Fund Perform During The Period?
• During the fiscal year ended April 30, 2025, U.S. large-cap equities saw significant growth and volatility. Technology stocks were a significant driver of return for the S&P 500® Index in the period due to strong earnings. However, market volatility increased towards the second half of the fiscal year, as a result of aggressive tariffs from the Trump administration. During the period, energy underperformed the broader market. The Fund's focus on energy securities created a performance headwind compared to the S&P 500® Index.
• The Fund is passively managed and seeks to track the investment results (before fees and expenses) of the S&P 500® Equal Weight Energy Plus Index (the “Index”). The Fund generally will invest at least 90% of its total assets in securities that comprise the Index.
• For the fiscal year ended April 30, 2025, the Fund's performance, on a net asset value ("NAV") basis, -12.14%, differed from the return of the Index, -11.75%, primarily due to fees and expenses incurred by the Fund during the period.
What contributed to performance?
Industry Allocations | No industries contributed to the Fund's performance during the period.
Positions | Williams Cos., Inc. (The), an oil, gas & consumable fuels company, and Targa Resources Corp., an oil, gas & consumable fuels company.
What detracted from performance?
Industry Allocations | Oil, gas & consumable fuels industry, followed by the energy equipment & services industry.
Positions | APA Corp., an oil & gas consumable fuels company, and Halliburton Co., an energy equipment & services company.
How Has The Fund Historically Performed?
Growth of $10,000 Investment
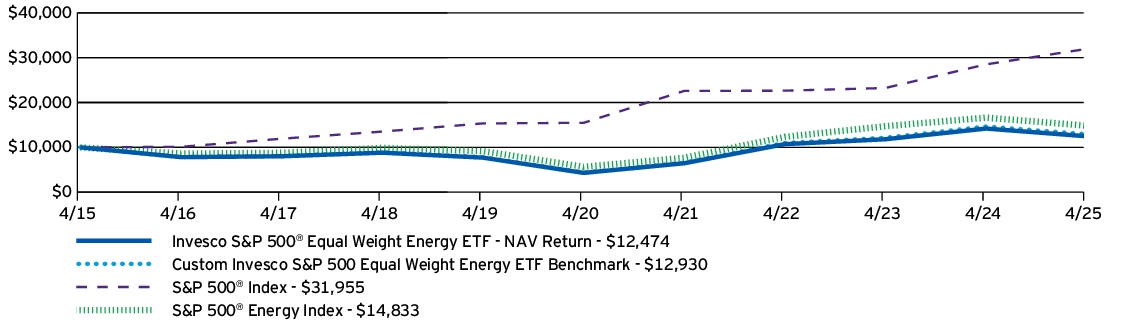
AVERAGE ANNUAL TOTAL RETURNS |
1 Year |
5 Years |
10 Years |
| Invesco S&P 500® Equal Weight Energy ETF — NAV Return | -12.14% | 23.70% | 2.23% |
| Custom Invesco S&P 500 Equal Weight Energy ETF Benchmark | -11.75% | 24.24% | 2.60% |
| S&P 500® Index | 12.10% | 15.61% | 12.32% |
| S&P 500® Energy Index | -10.81% | 21.28% | 4.02% |
Performance figures do not reflect deduction of taxes a shareholder would pay on Fund distributions or sale of Fund shares.
What Are Key Statistics About The Fund?
(as of April 30, 2025)
| Fund net assets | $415,617,412 |
| Total number of portfolio holdings | 25 |
| Total advisory fees paid | $2,146,467 |
| Portfolio turnover rate | 22% |
What Comprised The Fund's Holdings?
(as of April 30, 2025)
Top ten holdings*
(% of net assets)
(% of net assets)
| Williams Cos., Inc. (The) | 5.22% |
| EQT Corp. | 5.07% |
| Marathon Petroleum Corp. | 5.03% |
| Kinder Morgan, Inc. | 4.97% |
| Exxon Mobil Corp. | 4.86% |
| Texas Pacific Land Corp. | 4.80% |
| Valero Energy Corp. | 4.65% |
| Targa Resources Corp. | 4.58% |
| ConocoPhillips | 4.57% |
| Coterra Energy, Inc. | 4.52% |
| * Excluding money market fund holdings, if any. |
Industry allocation
(% of net assets)
(% of net assets)
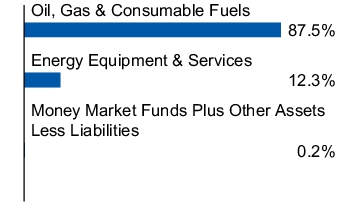
Top ten holdings*
(% of net assets)
(% of net assets)
| Williams Cos., Inc. (The) | 5.22% |
| EQT Corp. | 5.07% |
| Marathon Petroleum Corp. | 5.03% |
| Kinder Morgan, Inc. | 4.97% |
| Exxon Mobil Corp. | 4.86% |
| Texas Pacific Land Corp. | 4.80% |
| Valero Energy Corp. | 4.65% |
| Targa Resources Corp. | 4.58% |
| ConocoPhillips | 4.57% |
| Coterra Energy, Inc. | 4.52% |
| * Excluding money market fund holdings, if any. |
What Were The Fund Costs For The Last Year ?
(Based on a hypothetical $10,000 investment)
| Fund | Costs of a $10,000 investment | Costs paid as a percentage of a $10,000 investment |
| Invesco S&P 500® Equal Weight ETF | $21 | 0.20% |
How Did The Fund Perform During The Period?
• During the fiscal year ended April 30, 2025, U.S. large-cap equities saw significant growth and volatility. Technology stocks were a significant driver of return for the S&P 500® Index in the period due to strong earnings. However, market volatility increased towards the second half of the fiscal year, as a result of aggressive tariffs from the Trump administration. The Fund's equal weighting methodology led to lower exposure to mega cap stocks within the S&P 500® Index which created a performance headwind compared to the S&P 500® Index.
• The Fund is passively managed and seeks to track the investment results (before fees and expenses) of the S&P 500® Equal Weight Index (the “Index”). The Fund generally will invest at least 90% of its total assets in securities that comprise the Index.
• For the fiscal year ended April 30, 2025, the Fund's performance, on a net asset value ("NAV") basis, 6.69%, differed from the return of the Index, 6.91%, primarily due to fees and expenses incurred by the Fund during the period.
What contributed to performance?
Sector Allocations | Financials sector, followed by the utilities and industrials sectors, respectively.
Positions | Palantir Technologies, Inc., Class A, an information technology company, and GE Vernova, Inc., an industrials company.
What detracted from performance?
Sector Allocations | Energy sector, followed by the materials and health care sectors, respectively.
Positions | Moderna, Inc., a health care company, and Estee Lauder Cos., Inc. (The), Class A, a consumer staples company.
How Has The Fund Historically Performed?
Growth of $10,000 Investment
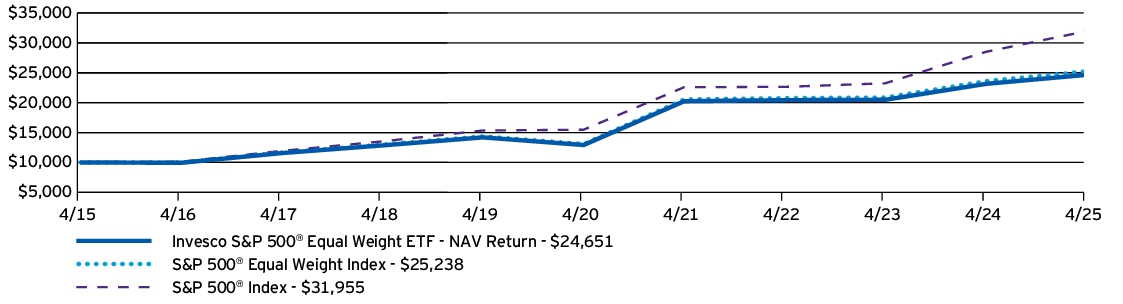
AVERAGE ANNUAL TOTAL RETURNS |
1 Year |
5 Years |
10 Years |
| Invesco S&P 500® Equal Weight ETF — NAV Return | 6.69% | 13.82% | 9.44% |
| S&P 500® Equal Weight Index | 6.91% | 14.05% | 9.70% |
| S&P 500® Index | 12.10% | 15.61% | 12.32% |
Performance figures do not reflect deduction of taxes a shareholder would pay on Fund distributions or sale of Fund shares.
What Are Key Statistics About The Fund?
(as of April 30, 2025)
| Fund net assets | $69,750,494,563 |
| Total number of portfolio holdings | 507 |
| Total advisory fees paid | $131,186,297 |
| Portfolio turnover rate | 24% |
What Comprised The Fund's Holdings?
(as of April 30, 2025)
Top ten holdings*
(% of net assets)
(% of net assets)
| Palantir Technologies, Inc., Class A | 0.28% |
| Dollar Tree, Inc. | 0.27% |
| Dollar General Corp. | 0.25% |
| Cadence Design Systems, Inc. | 0.25% |
| GE Vernova, Inc. | 0.25% |
| CrowdStrike Holdings, Inc., Class A | 0.25% |
| Mosaic Co. (The) | 0.25% |
| Netflix, Inc. | 0.25% |
| Amphenol Corp., Class A | 0.25% |
| Newmont Corp. | 0.24% |
| * Excluding money market fund holdings, if any. |
Sector allocation
(% of net assets)
(% of net assets)
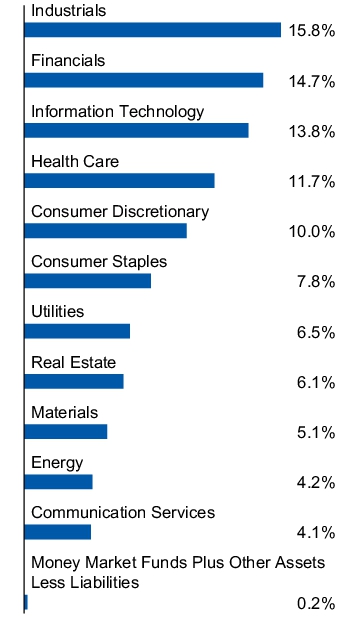
Top ten holdings*
(% of net assets)
(% of net assets)
| Palantir Technologies, Inc., Class A | 0.28% |
| Dollar Tree, Inc. | 0.27% |
| Dollar General Corp. | 0.25% |
| Cadence Design Systems, Inc. | 0.25% |
| GE Vernova, Inc. | 0.25% |
| CrowdStrike Holdings, Inc., Class A | 0.25% |
| Mosaic Co. (The) | 0.25% |
| Netflix, Inc. | 0.25% |
| Amphenol Corp., Class A | 0.25% |
| Newmont Corp. | 0.24% |
| * Excluding money market fund holdings, if any. |
What Were The Fund Costs For The Last Year ?
(Based on a hypothetical $10,000 investment)
| Fund | Costs of a $10,000 investment | Costs paid as a percentage of a $10,000 investment |
| Invesco S&P 500® Equal Weight Financials ETF | $43 | 0.40% |
How Did The Fund Perform During The Period?
• During the fiscal year ended April 30, 2025, U.S. large-cap equities saw significant growth and volatility. Technology stocks were a significant driver of return for the S&P 500® Index in the period due to strong earnings. However, market volatility increased towards the second half of the fiscal year, as a result of aggressive tariffs from the Trump administration. During the period, financials outperformed the broader market. The Fund's focus on financials securities created a performance tailwind compared to the S&P 500® Index.
• The Fund is passively managed and seeks to track the investment results (before fees and expenses) of the S&P 500® Equal Weight Financials Index (the “Index”). The Fund generally will invest at least 90% of its total assets in securities that comprise the Index.
• For the fiscal year ended April 30, 2025, the Fund's performance, on a net asset value ("NAV") basis, 17.21%, differed from the return of the Index, 17.71%, primarily due to fees and expenses incurred by the Fund during the period.
What contributed to performance?
Industry Allocations | Capital markets industry, followed by the insurance and banks industries, respectively.
Positions | Globe Life, Inc., an insurance company, and Discover Financial Services, a consumer finance company.
What detracted from performance?
Industry Allocations | No industries detracted from the Fund's performance during the period.
Positions | Global Payments, Inc., a financial services company, and Erie Indemnity Co., Class A, an insurance company.
How Has The Fund Historically Performed?
Growth of $10,000 Investment
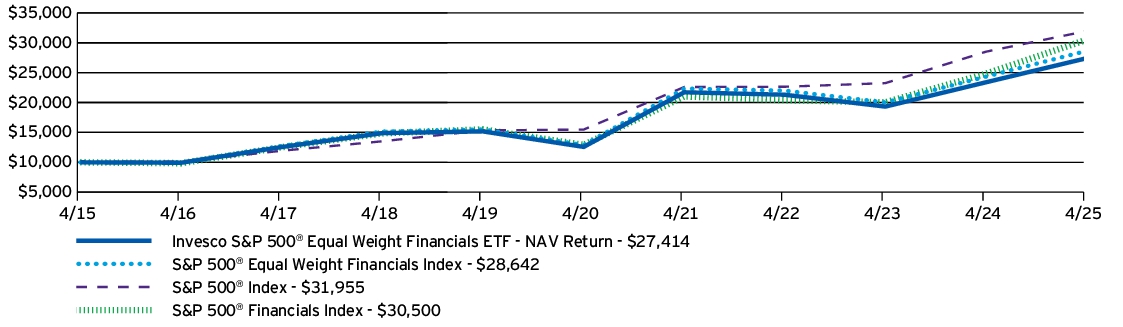
AVERAGE ANNUAL TOTAL RETURNS |
1 Year |
5 Years |
10 Years |
| Invesco S&P 500® Equal Weight Financials ETF — NAV Return | 17.21% | 16.86% | 10.61% |
| S&P 500® Equal Weight Financials Index | 17.71% | 17.33% | 11.10% |
| S&P 500® Index | 12.10% | 15.61% | 12.32% |
| S&P 500® Financials Index | 22.82% | 18.77% | 11.80% |
Performance figures do not reflect deduction of taxes a shareholder would pay on Fund distributions or sale of Fund shares.
What Are Key Statistics About The Fund?
(as of April 30, 2025)
| Fund net assets | $296,751,197 |
| Total number of portfolio holdings | 76 |
| Total advisory fees paid | $1,162,260 |
| Portfolio turnover rate | 19% |
What Comprised The Fund's Holdings?
(as of April 30, 2025)
Top ten holdings*
(% of net assets)
(% of net assets)
| W.R. Berkley Corp. | 1.60% |
| Fidelity National Information Services, Inc. | 1.59% |
| Discover Financial Services | 1.53% |
| Charles Schwab Corp. (The) | 1.50% |
| CME Group, Inc., Class A | 1.48% |
| Berkshire Hathaway, Inc., Class B | 1.47% |
| JPMorgan Chase & Co. | 1.47% |
| MarketAxess Holdings, Inc. | 1.47% |
| Cboe Global Markets, Inc. | 1.46% |
| Hartford Insurance Group, Inc. (The) | 1.45% |
| * Excluding money market fund holdings, if any. |
Industry allocation
(% of net assets)
(% of net assets)
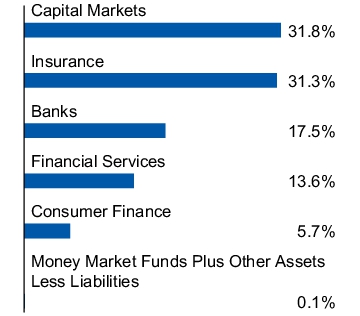
Top ten holdings*
(% of net assets)
(% of net assets)
| W.R. Berkley Corp. | 1.60% |
| Fidelity National Information Services, Inc. | 1.59% |
| Discover Financial Services | 1.53% |
| Charles Schwab Corp. (The) | 1.50% |
| CME Group, Inc., Class A | 1.48% |
| Berkshire Hathaway, Inc., Class B | 1.47% |
| JPMorgan Chase & Co. | 1.47% |
| MarketAxess Holdings, Inc. | 1.47% |
| Cboe Global Markets, Inc. | 1.46% |
| Hartford Insurance Group, Inc. (The) | 1.45% |
| * Excluding money market fund holdings, if any. |
What Were The Fund Costs For The Last Year ?
(Based on a hypothetical $10,000 investment)
| Fund | Costs of a $10,000 investment | Costs paid as a percentage of a $10,000 investment |
| Invesco S&P 500® Equal Weight Health Care ETF | $39 | 0.40% |
How Did The Fund Perform During The Period?
• During the fiscal year ended April 30, 2025, U.S. large-cap equities saw significant growth and volatility. Technology stocks were a significant driver of return for the S&P 500® Index in the period due to strong earnings. However, market volatility increased towards the second half of the fiscal year, as a result of aggressive tariffs from the Trump administration. During the period, health care underperformed the broader market. The Fund's focus on health care securities created a performance headwind compared to the S&P 500® Index.
• The Fund is passively managed and seeks to track the investment results (before fees and expenses) of the S&P 500® Equal Weight Health Care Index (the “Index”). The Fund generally will invest at least 90% of its total assets in securities that comprise the Index.
• For the fiscal year ended April 30, 2025, the Fund's performance, on a net asset value ("NAV") basis, -2.99%, differed from the return of the Index, -2.60%, primarily due to fees and expenses incurred by the Fund during the period.
What contributed to performance?
Industry Allocations | Health care providers & services industry, followed by the pharmaceuticals industry.
Positions | Gilead Sciences, Inc., a biotechnology company, and Boston Scientific Corp., a health care equipment & supplies company.
What detracted from performance?
Industry Allocations | Life sciences tools & services industry, followed by the biotechnology and health care equipment & supplies industries, respectively.
Positions | Moderna, Inc., a biotechnology company, and Charles River Laboratories International, Inc., a life sciences tools & services company.
How Has The Fund Historically Performed?
Growth of $10,000 Investment
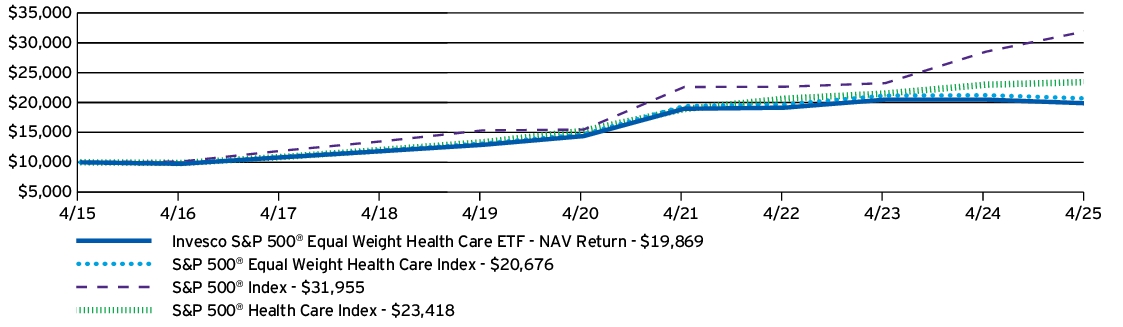
AVERAGE ANNUAL TOTAL RETURNS |
1 Year |
5 Years |
10 Years |
| Invesco S&P 500® Equal Weight Health Care ETF — NAV Return | -2.99% | 6.67% | 7.11% |
| S&P 500® Equal Weight Health Care Index | -2.60% | 7.10% | 7.53% |
| S&P 500® Index | 12.10% | 15.61% | 12.32% |
| S&P 500® Health Care Index | 1.86% | 8.90% | 8.88% |
Performance figures do not reflect deduction of taxes a shareholder would pay on Fund distributions or sale of Fund shares.
What Are Key Statistics About The Fund?
(as of April 30, 2025)
| Fund net assets | $759,204,353 |
| Total number of portfolio holdings | 63 |
| Total advisory fees paid | $3,548,806 |
| Portfolio turnover rate | 23% |
What Comprised The Fund's Holdings?
(as of April 30, 2025)
Top ten holdings*
(% of net assets)
(% of net assets)
| Cencora, Inc. | 1.98% |
| Cardinal Health, Inc. | 1.91% |
| McKesson Corp. | 1.91% |
| HCA Healthcare, Inc. | 1.89% |
| Edwards Lifesciences Corp. | 1.89% |
| Eli Lilly and Co. | 1.88% |
| Cigna Group (The) | 1.88% |
| ResMed, Inc. | 1.85% |
| Quest Diagnostics, Inc. | 1.84% |
| Boston Scientific Corp. | 1.83% |
| * Excluding money market fund holdings, if any. |
Industry allocation
(% of net assets)
(% of net assets)
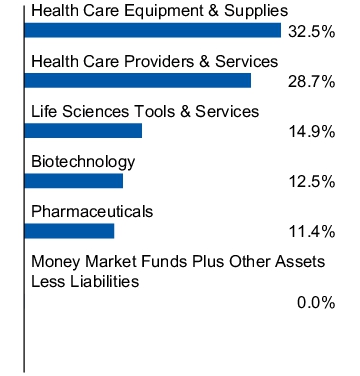
Top ten holdings*
(% of net assets)
(% of net assets)
| Cencora, Inc. | 1.98% |
| Cardinal Health, Inc. | 1.91% |
| McKesson Corp. | 1.91% |
| HCA Healthcare, Inc. | 1.89% |
| Edwards Lifesciences Corp. | 1.89% |
| Eli Lilly and Co. | 1.88% |
| Cigna Group (The) | 1.88% |
| ResMed, Inc. | 1.85% |
| Quest Diagnostics, Inc. | 1.84% |
| Boston Scientific Corp. | 1.83% |
| * Excluding money market fund holdings, if any. |
What Were The Fund Costs For The Last Year ?
(Based on a hypothetical $10,000 investment)
| Fund | Costs of a $10,000 investment | Costs paid as a percentage of a $10,000 investment |
| Invesco S&P 500® Equal Weight Industrials ETF | $42 | 0.40% |
How Did The Fund Perform During The Period?
• During the fiscal year ended April 30, 2025, U.S. large-cap equities saw significant growth and volatility. Technology stocks were a significant driver of return for the S&P 500® Index in the period due to strong earnings. However, market volatility increased towards the second half of the fiscal year, as a result of aggressive tariffs from the Trump administration. During the period, industrials underperformed the broader market. The Fund's focus on industrials securities created a performance headwind compared to the S&P 500® Index.
• The Fund is passively managed and seeks to track the investment results (before fees and expenses) of the S&P 500® Equal Weight Industrials Index (the “Index”). The Fund generally will invest at least 90% of its total assets in securities that comprise the Index.
• For the fiscal year ended April 30, 2025, the Fund's performance, on a net asset value ("NAV") basis, 7.80%, differed from the return of the Index, 8.25%, primarily due to fees and expenses incurred by the Fund during the period.
What contributed to performance?
Industry Allocations | Aerospace & defense industry, followed by commercial services & supplies and professional services industries, respectively.
Positions | GE Vernova, Inc., an electrical equipment company, and Howmet Aerospace, Inc., an aerospace & defense company.
What detracted from performance?
Industry Allocations | Machinery industry, followed by the air freight & logistics and ground transportation industries, respectively.
Positions | Amentum Holdings, Inc., a professional services company (no longer held at fiscal year-end), and United Parcel Service, Inc., Class B, an air freight & logistics company.
How Has The Fund Historically Performed?
Growth of $10,000 Investment
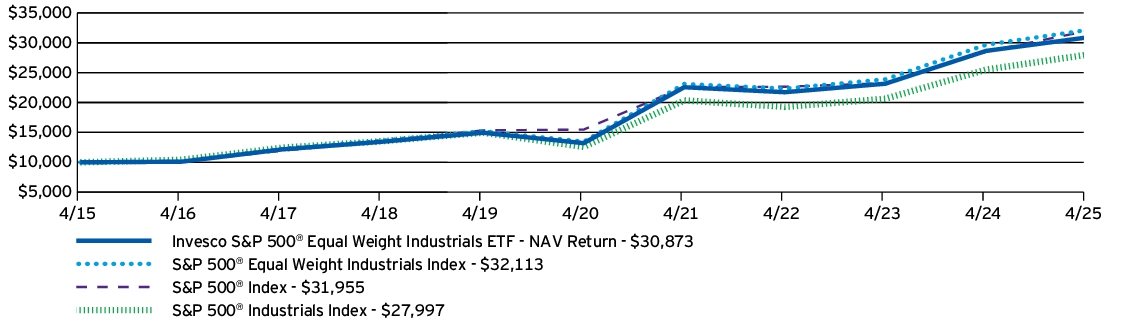
AVERAGE ANNUAL TOTAL RETURNS |
1 Year |
5 Years |
10 Years |
| Invesco S&P 500® Equal Weight Industrials ETF — NAV Return | 7.80% | 18.52% | 11.93% |
| S&P 500® Equal Weight Industrials Index | 8.25% | 19.00% | 12.37% |
| S&P 500® Index | 12.10% | 15.61% | 12.32% |
| S&P 500® Industrials Index | 9.78% | 17.34% | 10.84% |
Performance figures do not reflect deduction of taxes a shareholder would pay on Fund distributions or sale of Fund shares.
What Are Key Statistics About The Fund?
(as of April 30, 2025)
| Fund net assets | $576,860,598 |
| Total number of portfolio holdings | 81 |
| Total advisory fees paid | $2,574,825 |
| Portfolio turnover rate | 21% |
What Comprised The Fund's Holdings?
(as of April 30, 2025)
Top ten holdings*
(% of net assets)
(% of net assets)
| GE Vernova, Inc. | 1.58% |
| Huntington Ingalls Industries, Inc. | 1.53% |
| Quanta Services, Inc. | 1.50% |
| Boeing Co. (The) | 1.47% |
| Copart, Inc. | 1.47% |
| Uber Technologies, Inc. | 1.45% |
| Rollins, Inc. | 1.44% |
| Trane Technologies PLC | 1.44% |
| Allegion PLC | 1.43% |
| Leidos Holdings, Inc. | 1.41% |
| * Excluding money market fund holdings, if any. |
Industry allocation
(% of net assets)
(% of net assets)
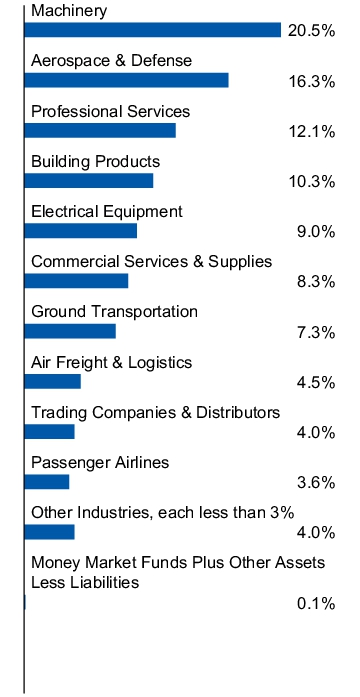
Top ten holdings*
(% of net assets)
(% of net assets)
| GE Vernova, Inc. | 1.58% |
| Huntington Ingalls Industries, Inc. | 1.53% |
| Quanta Services, Inc. | 1.50% |
| Boeing Co. (The) | 1.47% |
| Copart, Inc. | 1.47% |
| Uber Technologies, Inc. | 1.45% |
| Rollins, Inc. | 1.44% |
| Trane Technologies PLC | 1.44% |
| Allegion PLC | 1.43% |
| Leidos Holdings, Inc. | 1.41% |
| * Excluding money market fund holdings, if any. |
What Were The Fund Costs For The Last Year ?
(Based on a hypothetical $10,000 investment)
| Fund | Costs of a $10,000 investment | Costs paid as a percentage of a $10,000 investment |
| Invesco S&P 500® Equal Weight Materials ETF | $38 | 0.40% |
How Did The Fund Perform During The Period?
• During the fiscal year ended April 30, 2025, U.S. large-cap equities saw significant growth and volatility. Technology stocks were a significant driver of return for the S&P 500® Index in the period due to strong earnings. However, market volatility increased towards the second half of the fiscal year, as a result of aggressive tariffs from the Trump administration. During the period, materials underperformed the broader market. The Fund's focus on materials securities created a performance headwind compared to the S&P 500® Index.
• The Fund is passively managed and seeks to track the investment results (before fees and expenses) of the S&P 500® Equal Weight Materials Index (the “Index”). The Fund generally will invest at least 90% of its total assets in securities that comprise the Index.
• For the fiscal year ended April 30, 2025, the Fund's performance, on a net asset value ("NAV") basis, -8.96%, differed from the return of the Index, -8.63%, primarily due to fees and expenses incurred by the Fund during the period.
What contributed to performance?
Industry Allocations | No industries contributed to the Fund's performance during the period.
Positions | Newmont Corp., a metals & mining company, and International Paper Co., a containers & packaging company.
What detracted from performance?
Industry Allocations | Chemicals industry, followed by the containers & packaging industry.
Positions | Celanese Corp., a chemicals company (no longer held at fiscal year-end), and Albemarle Corp., a chemicals company.
How Has The Fund Historically Performed?
Growth of $10,000 Investment
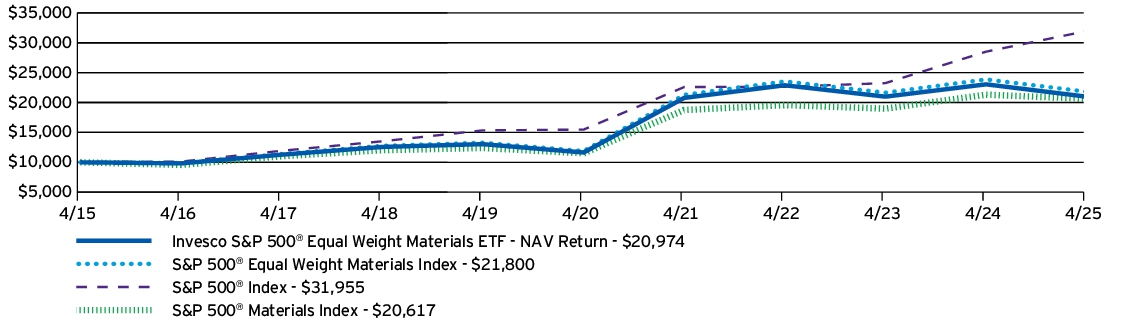
AVERAGE ANNUAL TOTAL RETURNS |
1 Year |
5 Years |
10 Years |
| Invesco S&P 500® Equal Weight Materials ETF — NAV Return | -8.96% | 12.50% | 7.69% |
| S&P 500® Equal Weight Materials Index | -8.63% | 12.91% | 8.10% |
| S&P 500® Index | 12.10% | 15.61% | 12.32% |
| S&P 500® Materials Index | -3.28% | 12.36% | 7.50% |
Performance figures do not reflect deduction of taxes a shareholder would pay on Fund distributions or sale of Fund shares.
What Are Key Statistics About The Fund?
(as of April 30, 2025)
| Fund net assets | $172,678,020 |
| Total number of portfolio holdings | 29 |
| Total advisory fees paid | $999,110 |
| Portfolio turnover rate | 26% |
What Comprised The Fund's Holdings?
(as of April 30, 2025)
Top ten holdings*
(% of net assets)
(% of net assets)
| Mosaic Co. (The) | 4.83% |
| Newmont Corp. | 4.74% |
| Vulcan Materials Co. | 4.53% |
| Martin Marietta Materials, Inc. | 4.43% |
| Corteva, Inc. | 4.13% |
| Steel Dynamics, Inc. | 4.11% |
| Ball Corp. | 3.98% |
| CF Industries Holdings, Inc. | 3.96% |
| Sherwin-Williams Co. (The) | 3.96% |
| Linde PLC | 3.94% |
| * Excluding money market fund holdings, if any. |
Industry allocation
(% of net assets)
(% of net assets)
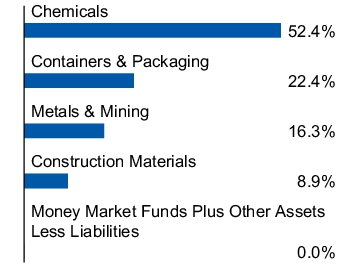
Top ten holdings*
(% of net assets)
(% of net assets)
| Mosaic Co. (The) | 4.83% |
| Newmont Corp. | 4.74% |
| Vulcan Materials Co. | 4.53% |
| Martin Marietta Materials, Inc. | 4.43% |
| Corteva, Inc. | 4.13% |
| Steel Dynamics, Inc. | 4.11% |
| Ball Corp. | 3.98% |
| CF Industries Holdings, Inc. | 3.96% |
| Sherwin-Williams Co. (The) | 3.96% |
| Linde PLC | 3.94% |
| * Excluding money market fund holdings, if any. |
What Were The Fund Costs For The Last Year ?
(Based on a hypothetical $10,000 investment)
| Fund | Costs of a $10,000 investment | Costs paid as a percentage of a $10,000 investment |
| Invesco S&P 500® Equal Weight Communication Services ETF | $45 | 0.40% |
How Did The Fund Perform During The Period?
• During the fiscal year ended April 30, 2025, U.S. large-cap equities saw significant growth and volatility. Technology stocks were a significant driver of return for the S&P 500® Index in the period due to strong earnings. However, market volatility increased towards the second half of the fiscal year, as a result of aggressive tariffs from the Trump administration. During the period, communication services outperformed the broader market. The Fund's focus on communication services securities created a performance tailwind compared to the S&P 500® Index.
• The Fund is passively managed and seeks to track the investment results (before fees and expenses) of the S&P 500® Equal Weight Communication Services Plus Index (the “Index”). The Fund generally will invest at least 90% of its total assets in securities that comprise the Index.
• For the fiscal year ended April 30, 2025, the Fund's performance, on a net asset value ("NAV") basis, 27.06%, differed from the return of the Index, 27.57%, primarily due to fees and expenses incurred by the Fund during the period.
What contributed to performance?
Industry Allocations | Entertainment industry, followed by the diversified telecommunication services and media industries, respectively.
Positions | Netflix, Inc., an entertainment company, and AT&T, Inc., a diversified telecommunication services company.
What detracted from performance?
Industry Allocations | No industries detracted from the Fund's performance during the period.
Positions | Walt Disney Co. (The), an entertainment company, and Interpublic Group of Cos., Inc. (The), a media company.
How Has The Fund Historically Performed?
Growth of $10,000 Investment
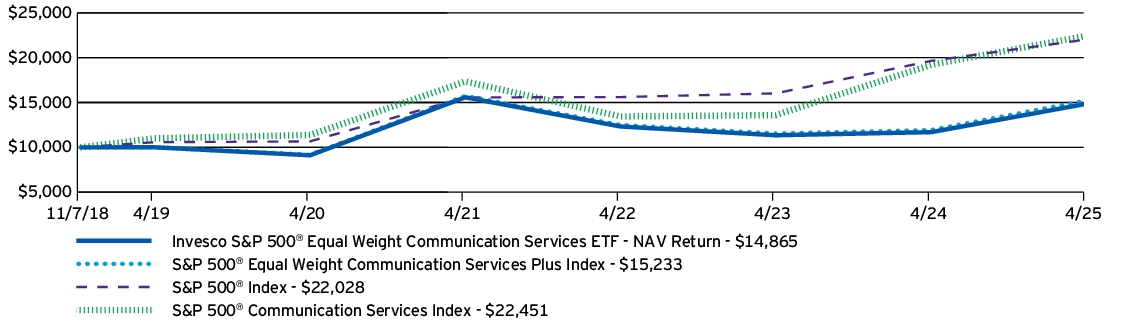
AVERAGE ANNUAL TOTAL RETURNS |
1 Year |
5 Years |
Since Inception (11/7/18) |
| Invesco S&P 500® Equal Weight Communication Services ETF — NAV Return | 27.06% | 10.27% | 6.31% |
| S&P 500® Equal Weight Communication Services Plus Index | 27.57% | 10.68% | 6.71% |
| S&P 500® Index | 12.10% | 15.61% | 12.96% |
| S&P 500 Communication Services Index | 16.83% | 14.56% | 13.29% |
Performance figures do not reflect deduction of taxes a shareholder would pay on Fund distributions or sale of Fund shares.
What Are Key Statistics About The Fund?
(as of April 30, 2025)
| Fund net assets | $60,533,690 |
| Total number of portfolio holdings | 28 |
| Total advisory fees paid | $222,617 |
| Portfolio turnover rate | 22% |
What Comprised The Fund's Holdings?
(as of April 30, 2025)
Top ten holdings*
(% of net assets)
(% of net assets)
| Netflix, Inc. | 5.51% |
| Take-Two Interactive Software, Inc. | 5.08% |
| Charter Communications, Inc., Class A | 5.02% |
| TKO Group Holdings, Inc. | 4.95% |
| New York Times Co. (The), Class A | 4.86% |
| AT&T, Inc. | 4.82% |
| Live Nation Entertainment, Inc. | 4.82% |
| Electronic Arts, Inc. | 4.77% |
| Verizon Communications, Inc. | 4.63% |
| Paramount Global, Class B | 4.53% |
| * Excluding money market fund holdings, if any. |
Industry allocation
(% of net assets)
(% of net assets)
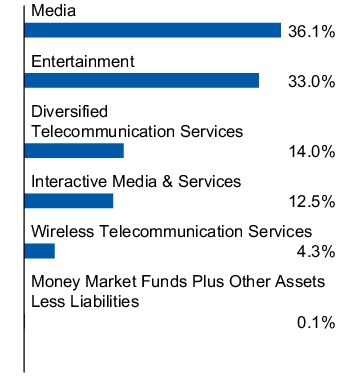
Top ten holdings*
(% of net assets)
(% of net assets)
| Netflix, Inc. | 5.51% |
| Take-Two Interactive Software, Inc. | 5.08% |
| Charter Communications, Inc., Class A | 5.02% |
| TKO Group Holdings, Inc. | 4.95% |
| New York Times Co. (The), Class A | 4.86% |
| AT&T, Inc. | 4.82% |
| Live Nation Entertainment, Inc. | 4.82% |
| Electronic Arts, Inc. | 4.77% |
| Verizon Communications, Inc. | 4.63% |
| Paramount Global, Class B | 4.53% |
| * Excluding money market fund holdings, if any. |
| [1] | Reflects fee waivers and/or expense reimbursements, without which expenses would have been higher. |
| [2] | Reflects fee waivers and/or expense reimbursements, without which expenses would have been higher. |
| [3] | Reflects fee waivers and/or expense reimbursements, without which expenses would have been higher. |
| [4] | Reflects fee waivers and/or expense reimbursements, without which expenses would have been higher. |
| [5] | Reflects fee waivers and/or expense reimbursements, without which expenses would have been higher. |
| [6] | Reflects fee waivers and/or expense reimbursements, without which expenses would have been higher. |
| [7] | Reflects fee waivers and/or expense reimbursements, without which expenses would have been higher. |
| [8] | Reflects fee waivers and/or expense reimbursements, without which expenses would have been higher. |
| [9] | Reflects fee waivers and/or expense reimbursements, without which expenses would have been higher. |
| [10] | Reflects fee waivers and/or expense reimbursements, without which expenses would have been higher. |
| [11] | Reflects fee waivers and/or expense reimbursements, without which expenses would have been higher. |
| [12] | Reflects fee waivers and/or expense reimbursements, without which expenses would have been higher. |
| [13] | Reflects fee waivers and/or expense reimbursements, without which expenses would have been higher. |
| [14] | Reflects fee waivers and/or expense reimbursements, without which expenses would have been higher. |
| [15] | Reflects fee waivers and/or expense reimbursements, without which expenses would have been higher. |
| [16] | Reflects fee waivers and/or expense reimbursements, without which expenses would have been higher. |
| [17] | Reflects fee waivers and/or expense reimbursements, without which expenses would have been higher. |
| [18] | Reflects fee waivers and/or expense reimbursements, without which expenses would have been higher. |