Shareholder Report
Apr. 30, 2025
USD ($)
Holding
What were the Fund costs for the last year?
(Based on a hypothetical $10,000 investment)
| Fund (Class) | Costs of a $10,000 investment | Costs paid as a percentage of a $10,000 investment |
| EIC Value Fund (Class A / EICVX) |
$127 | 1.20% |
Management's Discussion of Fund Performance
Market Overview
Once seen as unstoppable drivers of growth, many large-cap technology related stocks have come under pressure as the monetization of Artificial Intelligence (AI) has, so far, underwhelmed. This renewed market volatility has brought the realization that many portfolios — and even broad-based market indexes — are less diversified than expected. Adding to these concerns are rising geopolitical and policy risks, including the re-emergence of tariffs and heightened uncertainty around global trade.
Summary of Results
Despite a challenging environment, stocks posted solid gains for the year ended April 30, 2025. The EIC Value Fund (EICVX) gained 12.39%, outperforming its benchmark, the Russell 3000® Value Index, which rose 8.11%. The Fund’s outperformance was attributable primarily to stock selection and secondarily to its sector weightings relative to the index.
Top Contributors to Performance
- The Fund's holdings in the communication services sector led the index’s communication services stocks. (AT&T was the Fund's top performer.)
- Stock selection in the health care and energy sectors also contributed to performance as the Fund's holdings gained compared to decreases for the index’s health care and energy stocks. (Williams Companies and Patterson Companies were the Fund's top performers in these two sectors.)
- The Fund’s sector weightings are principally a by-product of stock selection. Nevertheless, they added to relative performance over the trailing year.
Top Detractors from Performance
- The Fund's holdings in the industrials sector fell compared to an increase for the index’s industrial stocks. (UPS was the Fund's worst performer.)
- Stock selection in the consumer staples sector detracted from performance as the Fund's holdings rose less than the index’s consumer staples stocks. (Dollar General and Dollar Tree were the Fund’s worst performers in the sector.)
- The Fund’s financials holdings rose sharply but trailed the index’s financials. (PayPal Holdings was the Fund’s worst performer in the sector.)
Fund Performance
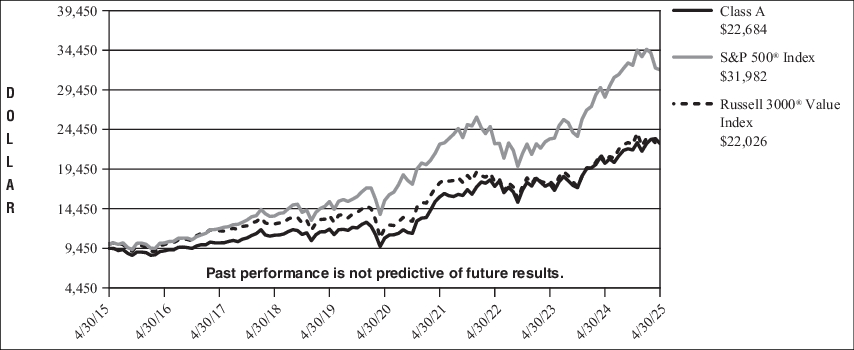
The following is a comparison of the change in value of a $10,000 investment in EIC Value Fund’s Class A over the past 10 years, vs. the S&P 500® Index, which the Fund has designated as its new broad-based securities market index in accordance with the SEC’s revised definition, and the Russell 3000® Value Index, which more closely aligns with the Fund's investment strategy.
Growth of $ 10,000
For the years April 30, 2015 through April 30, 2025
| Average Annual Total Returns | 1 Year | 5 Years | 10 Years |
| Class A (with sales charge) | 6.22% | 14.85% | 8.54% |
| Class A (without sales charge) | 12.39% | 16.15% | 9.15% |
| S&P 500® Index* | 12.10% | 15.61% | 12.32% |
| Russell 3000® Value Index | 8.11% | 12.96% | 8.22% |
| * |
The Fund has designated as its new broad-based securities market index in accordance with the SEC’s revised definition. |
Key Fund Statistics (as of April 30, 2025)
The following table outlines key Fund statistics that you should pay attention to.
| Fund net assets | $318,099,511 |
| Total number of portfolio holdings | 43 |
| Total advisory fee paid, net | $2,152,226 |
| Portfolio turnover rate as of the end of the reporting period | 29% |
Portfolio Holdings Summary Table (as of April 30, 2025)
The following table presents a summary by sector of the portfolio holdings of the Fund, as a percentage of net assets:
Top Ten Holdings
| Verizon Communications, Inc. | 4.2% |
| GSK PLC | 3.6% |
| Wells Fargo & Co. | 3.2% |
| US Bancorp | 3.1% |
| PayPal Holdings, Inc. | 3.0% |
| Sanofi SA | 3.0% |
| Target Corp. | 3.0% |
| Zimmer Biomet Holdings, Inc. | 3.0% |
| AT&T, Inc. | 2.8% |
| TotalEnergies SE | 2.8% |
Sector Allocation
| Financials | 24.9% |
| Healthcare | 16.0% |
| Consumer Staples | 14.5% |
| Energy | 7.9% |
| Communication Services | 7.1% |
| Industrials | 5.6% |
| Real Estate | 5.5% |
| Materials | 3.6% |
| Consumer Discretionary | 3.4% |
| Utilities | 2.6% |
| Short-Term Investments | 8.3% |
| Other Assets in Excess of Liabilities | 0.6% |
| TOTAL | 100% |
Top Ten Holdings
| Verizon Communications, Inc. | 4.2% |
| GSK PLC | 3.6% |
| Wells Fargo & Co. | 3.2% |
| US Bancorp | 3.1% |
| PayPal Holdings, Inc. | 3.0% |
| Sanofi SA | 3.0% |
| Target Corp. | 3.0% |
| Zimmer Biomet Holdings, Inc. | 3.0% |
| AT&T, Inc. | 2.8% |
| TotalEnergies SE | 2.8% |
Material Fund Changes During the Period
There were no material changes to the Fund.
Changes in and Disagreements with Accountants
There were no disagreements with accountants.
What were the Fund costs for the last year?
(Based on a hypothetical $10,000 investment)
| Fund (Class) | Costs of a $10,000 investment | Costs paid as a percentage of a $10,000 investment |
| EIC Value Fund (Class C / EICCX) |
$206 | 1.95% |
Management's Discussion of Fund Performance
Market Overview
Once seen as unstoppable drivers of growth, many large-cap technology related stocks have come under pressure as the monetization of Artificial Intelligence (AI) has, so far, underwhelmed. This renewed market volatility has brought the realization that many portfolios — and even broad-based market indexes — are less diversified than expected. Adding to these concerns are rising geopolitical and policy risks, including the re-emergence of tariffs and heightened uncertainty around global trade.
Summary of Results
Despite a challenging environment, stocks posted solid gains for the year ended April 30, 2025. The EIC Value Fund (EICCX) gained 11.57%, outperforming its benchmark, the Russell 3000® Value Index, which rose 8.11%. The Fund’s outperformance was attributable primarily to stock selection and secondarily to its sector weightings relative to the index.
Top Contributors to Performance
- The Fund's holdings in the communication services sector led the index’s communication services stocks. (AT&T was the Fund's top performer.)
- Stock selection in the health care and energy sectors also contributed to performance as the Fund's holdings gained compared to decreases for the index’s health care and energy stocks. (Williams Companies and Patterson Companies were the Fund's top performers in these two sectors.)
- The Fund’s sector weightings are principally a by-product of stock selection. Nevertheless, they added to relative performance over the trailing year.
Top Detractors from Performance
- The Fund's holdings in the industrials sector fell compared to an increase for the index’s industrial stocks. (UPS was the Fund's worst performer.)
- Stock selection in the consumer staples sector detracted from performance as the Fund's holdings rose less than the index’s consumer staples stocks. (Dollar General and Dollar Tree were the Fund’s worst performers in the sector.)
- The Fund’s financials holdings rose sharply but trailed the index’s financials. (PayPal Holdings was the Fund’s worst performer in the sector.)
Fund Performance
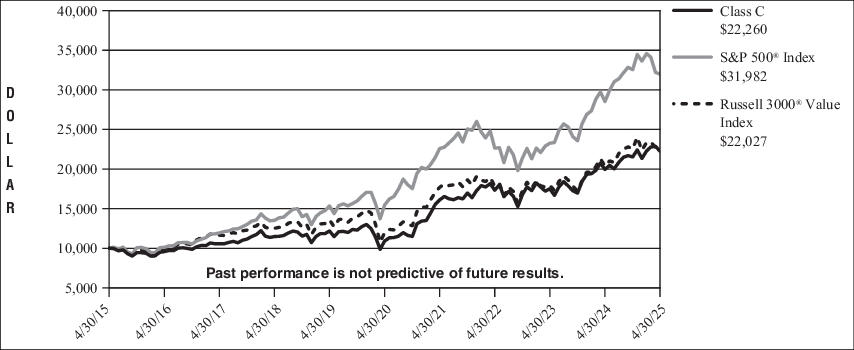
The following is a comparison of the change in value of a $10,000 investment in EIC Value Fund’s Class C over the past 10 years, vs. the S&P 500® Index, which the Fund has designated as its new broad-based securities market index in accordance with the SEC’s revised definition, and the Russell 3000® Value Index, which more closely aligns with the Fund's investment strategy.
Growth of $ 10,000
For the years April 30, 2015 through April 30, 2025
| Average Annual Total Returns | 1 Year | 5 Years | 10 Years |
| Class C (with CDSC charge) | 10.57% | 15.29% | 8.33% |
| Class C (without CDSC charge) | 11.57% | 15.29% | 8.33% |
| S&P 500® Index* | 12.10% | 15.61% | 12.32% |
| Russell 3000® Value Index | 8.11% | 12.96% | 8.22% |
| * |
The Fund has designated as its new broad-based securities market index in accordance with the SEC’s revised definition. |
Key Fund Statistics (as of April 30, 2025)
The following table outlines key Fund statistics that you should pay attention to.
| Fund net assets | $318,099,511 |
| Total number of portfolio holdings | 43 |
| Total advisory fee paid, net | $2,152,226 |
| Portfolio turnover rate as of the end of the reporting period | 29% |
Portfolio Holdings Summary Table (as of April 30, 2025)
The following table presents a summary by sector of the portfolio holdings of the Fund, as a percentage of net assets:
Top 10 Holdings
| Verizon Communications, Inc. | 4.2% |
| GSK PLC | 3.6% |
| Wells Fargo & Co. | 3.2% |
| US Bancorp | 3.1% |
| PayPal Holdings, Inc. | 3.0% |
| Sanofi SA | 3.0% |
| Target Corp. | 3.0% |
| Zimmer Biomet Holdings, Inc. | 3.0% |
| AT&T, Inc. | 2.8% |
| TotalEnergies SE | 2.8% |
Sector Allocation
| Financials | 24.9% |
| Healthcare | 16.0% |
| Consumer Staples | 14.5% |
| Energy | 7.9% |
| Communication Services | 7.1% |
| Industrials | 5.6% |
| Real Estate | 5.5% |
| Materials | 3.6% |
| Consumer Discretionary | 3.4% |
| Utilities | 2.6% |
| Short-Term Investments | 8.3% |
| Other Assets in Excess of Liabilities | 0.6% |
| TOTAL | 100% |
Top 10 Holdings
| Verizon Communications, Inc. | 4.2% |
| GSK PLC | 3.6% |
| Wells Fargo & Co. | 3.2% |
| US Bancorp | 3.1% |
| PayPal Holdings, Inc. | 3.0% |
| Sanofi SA | 3.0% |
| Target Corp. | 3.0% |
| Zimmer Biomet Holdings, Inc. | 3.0% |
| AT&T, Inc. | 2.8% |
| TotalEnergies SE | 2.8% |
Material Fund Changes During the Period
There were no material changes to the Fund.
Changes in and Disagreements with Accountants
There were no disagreements with accountants.
What were the Fund costs for the last year?
(Based on a hypothetical $10,000 investment)
| Fund (Class) | Costs of a $10,000 investment | Costs paid as a percentage of a $10,000 investment |
| EIC Value Fund (Institutional Class / EICIX) |
$101 | 0.95% |
Management's Discussion of Fund Performance
Market Overview
Once seen as unstoppable drivers of growth, many large-cap technology related stocks have come under pressure as the monetization of Artificial Intelligence (AI) has, so far, underwhelmed. This renewed market volatility has brought the realization that many portfolios — and even broad-based market indexes — are less diversified than expected. Adding to these concerns are rising geopolitical and policy risks, including the re-emergence of tariffs and heightened uncertainty around global trade.
Summary of Results
Despite a challenging environment, stocks posted solid gains for the year ended April 30, 2025. The EIC Value Fund (EICIX) gained 12.72%, outperforming its benchmark, the Russell 3000® Value Index, which rose 8.11%. The Fund’s outperformance was attributable primarily to stock selection and secondarily to its sector weightings relative to the index.
Top Contributors to Performance
- The Fund's holdings in the communication services sector led the index’s communication services stocks. (AT&T was the Fund's top performer.)
- Stock selection in the health care and energy sectors also contributed to performance as the Fund's holdings gained compared to decreases for the index’s health care and energy stocks. (Williams Companies and Patterson Companies were the Fund's top performers in these two sectors.)
- The Fund’s sector weightings are principally a by-product of stock selection. Nevertheless, they added to relative performance over the trailing year.
Top Detractors from Performance
- The Fund's holdings in the industrials sector fell compared to an increase for the index’s industrial stocks. (UPS was the Fund's worst performer.)
- Stock selection in the consumer staples sector detracted from performance as the Fund's holdings rose less than the index’s consumer staples stocks. (Dollar General and Dollar Tree were the Fund’s worst performers in the sector.)
- The Fund’s financials holdings rose sharply but trailed the index’s financials. (PayPal Holdings was the Fund’s worst performer in the sector.)
Fund Performance
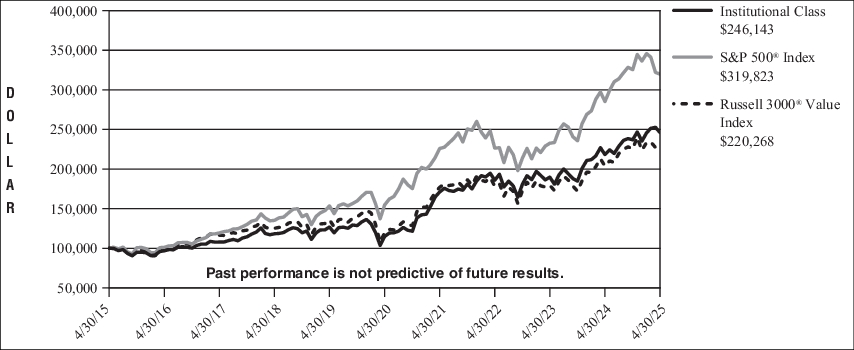
The following is a comparison of the change in value of a $100,000 investment in EIC Value Fund’s Institutional Class over the past 10 years, vs. the S&P 500® Index, which the Fund has designated as its new broad-based securities market index in accordance with the SEC’s revised definition, and the Russell 3000® Value Index, which more closely aligns with the Fund's investment strategy.
Growth of $ 100,000
For the years April 30, 2015 through April 30, 2025
| Average Annual Total Returns | 1 Year | 5 Years | 10 Years |
| Institutional Class | 12.72% | 16.45% | 9.43% |
| S&P 500® Index* | 12.10% | 15.61% | 12.32% |
| Russell 3000® Value Index | 8.11% | 12.96% | 8.22% |
| * |
The Fund has designated as its new broad-based securities market index in accordance with the SEC’s revised definition. |
Key Fund Statistics (as of April 30, 2025)
The following table outlines key Fund statistics that you should pay attention to.
| Fund net assets | $318,099,511 |
| Total number of portfolio holdings | 43 |
| Total advisory fee paid, net | $2,152,226 |
| Portfolio turnover rate as of the end of the reporting period | 29% |
Portfolio Holdings Summary Table (as of April 30, 2025)
The following table presents a summary by sector of the portfolio holdings of the Fund, as a percentage of net assets:
Top 10 Holdings
| Verizon Communications, Inc. | 4.2% |
| GSK PLC | 3.6% |
| Wells Fargo & Co. | 3.2% |
| US Bancorp | 3.1% |
| PayPal Holdings, Inc. | 3.0% |
| Sanofi SA | 3.0% |
| Target Corp. | 3.0% |
| Zimmer Biomet Holdings, Inc. | 3.0% |
| AT&T, Inc. | 2.8% |
| TotalEnergies SE | 2.8% |
Sector Allocation
| Financials | 24.9% |
| Healthcare | 16.0% |
| Consumer Staples | 14.5% |
| Energy | 7.9% |
| Communication Services | 7.1% |
| Industrials | 5.6% |
| Real Estate | 5.5% |
| Materials | 3.6% |
| Consumer Discretionary | 3.4% |
| Utilities | 2.6% |
| Short-Term Investments | 8.3% |
| Other Assets in Excess of Liabilities | 0.6% |
| TOTAL | 100% |
Top 10 Holdings
| Verizon Communications, Inc. | 4.2% |
| GSK PLC | 3.6% |
| Wells Fargo & Co. | 3.2% |
| US Bancorp | 3.1% |
| PayPal Holdings, Inc. | 3.0% |
| Sanofi SA | 3.0% |
| Target Corp. | 3.0% |
| Zimmer Biomet Holdings, Inc. | 3.0% |
| AT&T, Inc. | 2.8% |
| TotalEnergies SE | 2.8% |
Material Fund Changes During the Period
There were no material changes to the Fund.
Changes in and Disagreements with Accountants
There were no disagreements with accountants.