Exhibit 99.2
GOVERNMENT OF ALBERTA
2024-25 Final Results
Year-end Report
| June 2025 |
|
Exhibit 99.2
GOVERNMENT OF ALBERTA
2024-25 Final Results
Year-end Report
| June 2025 |
|
Table of Contents
| 2024–25 Final Results |
||||
| Fiscal Plan Highlights |
3 | |||
| Consolidated Fiscal Summary |
3 | |||
| Revenue Highlights |
4 | |||
| Expense Highlights |
6 | |||
| Fiscal Framework |
9 | |||
| Net Financial and Capital Assets |
11 | |||
| Balance Sheet |
12 | |||
| Economic and Tax Highlights |
13 | |||
| Historical Fiscal Summary |
14 | |||
| Annual Infrastructure Report |
15 | |||
Note: Amounts presented in tables may not add to totals due to rounding.
Note on reclassification:
| • | 2023-24 Actual and 2024-25 Budget and Actual numbers have been reclassified to reflect the revised government structure under the Government Organization Act (Order in Council 234/2024, August 28, 2024, Order in Council 384/2024, December 12, 2024, and Ministerial Order 803/2024, August 28, 2024), and through amendments to Alberta’s Provincial Health Act (Ministerial Orders 701/2024 and 703/2024, June 21, 2024, and Ministerial Orders 330/2024 and 331/2024, November 12, 2024). |
| • | 2023-24 Actual has been reclassified to include $5.85 million in Alberta Enterprise Corporation’s investment-related revenue and expense. The reclassification reflects realized gains in 2023-24, whereas 2024-25 includes realized losses reported as expense. |
Treasury Board and Finance, Government of Alberta
2024–25 Final Results Year-end Report, June 2025
Additional copies of this report may be obtained by visiting our website at: www.alberta.ca/budget-documents.aspx
| 2 | 2024-25 Final Results | Year-End Report | |
2024–25 Final Results
Fiscal Plan Highlights
The 2024-25 final results were an $8.3 billion surplus, an increase of $8 billion from budget, and an increase of $4 billion from 2023-24.
Budget 2024 was developed as Alberta remained one of the fastest growing province in Canada. It focused on a responsible plan to manage the pressures faced by a growing province while securing Alberta’s future by supporting health care and education, reinvigorating the Alberta Heritage Savings Trust Fund (Heritage Fund), and managing the fiscal planning challenges arising from the province’s unique economic and revenue volatility.
Budget 2024 upheld the requirements of the fiscal framework to balance the budget, control spending and use surplus cash to improve the province’s net financial position or invest in areas and services important to Albertans. The Heritage Fund net financial assets grew by $4.3 billion from $22.9 billion at March 31, 2024 to $27.2 billion at March 31, 2025.
Revenue in 2024-25 was higher than budget, driven by solid gains in Alberta’s labour market underpinned by robust growth in Alberta’s population, higher non-renewable resource revenue driven by strong global benchmark crude oil prices, a lower exchange rate and narrower light-heavy differentials. Expense increases in 2024-25 were mainly for health care, education, and disaster and emergency spending.
Total Revenue was $82.5 billion, $8.9 billion more than budget and $7.7 billion more than 2023-24.
| • | Change from Budget. Changes include increases of $4.7 billion in non-renewable resource revenue (NRR), $1.7 billion in tax revenue, $1.5 billion in investment income, $1.1 billion in premiums, fees and licences and other revenue, and a decrease of $0.1 billion in net income from government business enterprise (GBE). |
| • | Change from 2023-24. Comprises increases of $3.6 billion in tax revenue, $2.7 billion in NRR, |
| $0.8 billion in net income from GBEs, $0.6 billion in investment income, federal government transfers, premiums, fees and licences and other revenue. |
Total Expense was $74.1 billion, $3.7 billion more than 2023-24 and up $1 billion from budget. Budget 2024 included $2 billion expense contingency.
| • | Change from Budget. Increases of $1.9 billion in operating expense, and $1.9 billion in disaster assistance, offset by decreases of $0.8 billion in debt servicing, capital grants, pension and other expenses, netted against the $2 billion contingency. |
| • | Change from 2023-24. Increases of $3.9 billion in operating expense, $0.9 billion of capital grants, debt servicing, pension and other expense, and a decrease of $1.1 billion in disaster assistance. |
| • | Capital Plan. Total Capital Plan spending in 2024-25 was $7.2 billion, $1.1 billion below budget and up $0.9 billion from the prior year. |
Consolidated Fiscal Summary
| Change from | ||||||||||||||||||||||
| (millions of dollars) | 2024-25 | 2023-24 | 2023-24 | |||||||||||||||||||
| INCOME STATEMENT | Budget | Actual | Actual | Budget | Actual | |||||||||||||||||
| Revenue | ||||||||||||||||||||||
| 1 | Personal income tax | 15,604 | 16,120 | 15,160 | 516 | 960 | ||||||||||||||||
| 2 | Corporate income tax | 7,028 | 8,125 | 7,044 | 1,097 | 1,080 | ||||||||||||||||
| 3 | Other taxes | 6,013 | 6,111 | 4,543 | 98 | 1,569 | ||||||||||||||||
| 4 | Non-renewable resource revenue | 17,315 | 21,986 | 19,287 | 4,671 | 2,699 | ||||||||||||||||
| 5 | Transfers from Government of Canada | 12,640 | 12,618 | 12,336 | (21) | 283 | ||||||||||||||||
| 6 | Investment income | 3,267 | 4,803 | 4,587 | 1,536 | 216 | ||||||||||||||||
| 7 | Net income / (loss) from government business enterprises | 2,123 | 2,053 | 1,237 | (70) | 816 | ||||||||||||||||
| 8 | Premiums, fees and licences | 5,384 | 5,504 | 5,565 | 120 | (61) | ||||||||||||||||
| 9 | Other revenue | 4,164 | 5,149 | 4,979 | 985 | 170 | ||||||||||||||||
| 10 | Total Revenue | 73,537 | 82,469 | 74,738 | 8,932 | 7,731 | ||||||||||||||||
| Expense | ||||||||||||||||||||||
| 11 | Operating expense | 60,124 | 62,025 | 58,149 | 1,901 | 3,876 | ||||||||||||||||
| 12 | Capital grants | 3,469 | 2,934 | 2,103 | (535) | 831 | ||||||||||||||||
| 13 | Disaster and emergency assistance | - | 1,932 | 3,025 | 1,932 | (1,093) | ||||||||||||||||
| 14 | Capital amort. / inventory consump. / asset disposal losses | 4,564 | 4,446 | 4,399 | (119) | 47 | ||||||||||||||||
| 15 | Debt servicing costs - general | 1,856 | 1,779 | 1,826 | (77) | (47) | ||||||||||||||||
| 16 | Debt servicing costs - Capital Plan | 1,533 | 1,436 | 1,324 | (97) | 113 | ||||||||||||||||
| 17 | Pension recovery | (364) | (403) | (372) | (39) | (31) | ||||||||||||||||
| 18 | Contingency | 2,000 | - | - | (2,000) | - | ||||||||||||||||
| 19 | Total Expense | 73,182 | 74,149 | 70,453 | 967 | 3,695 | ||||||||||||||||
| 20 | Surplus / (Deficit) | 355 | 8,320 | 4,285 | 7,965 | 4,036 | ||||||||||||||||
| CAPITAL PLAN | ||||||||||||||||||||||
| 21 | Capital grants | 3,469 | 2,934 | 2,103 | (535) | 831 | ||||||||||||||||
| 22 | Capital investment | 4,830 | 4,309 | 4,197 | (521) | 112 | ||||||||||||||||
| 23 | Total Capital Plan | 8,299 | 7,243 | 6,300 | (1,056) | 943 | ||||||||||||||||
| 2024-25 Final Results | Year-End Report | 3 | |
Revenue Highlights
Total Revenue
| • | Total revenue was $82.5 billion in 2024-25, an increase of $8.9 billion from Budget 2024 and an increase of $7.7 billion from 2023-24. The increase from budget was primarily due to higher non-renewable resource revenue (NRR), investment income, and income tax revenue. |
| • | Revenue was $1.8 billion higher than the third quarter forecast. Changes included: |
| - | Income and other tax revenue, including related interest and penalties, was $0.9 billion higher due to strong corporate profits, particularly in the oil and gas extraction, construction, finance, and insurance sectors. |
| - | Federal transfers decreased by a net $0.3 billion, due to slower construction progress under the federal Investing in Canada Infrastructure Program for the Calgary and Edmonton LRT programs and lower than anticipated utilization of funding for the Working Together to Improve Health Care for Canadians. The Ministry will engage with the federal government to carry forward the unused funding from previous years. |
| - | Investment income decreased by $0.4 billion due to revisions in long |
| term capital market assumptions provided by AIMCo. |
| - | Other revenue increased by a net $1.6 billion primarily due to the settlement agreement from litigation against three tobacco companies under the Companies’ Creditors Arrangement Act, increased ancillary services revenue from post-secondary institutions driven by growth in student population, and higher than expected endowment contributions and re-invested income. |
Non-Renewable Resource Revenue
| • | NRR was $22 billion in 2024-25, an increase of $4.7 billion from Budget 2024 and an increase of $2.7 billion from 2023-24.The increase was primarily driven by higher bitumen royalties due to lower exchange rates and narrower light-heavy differentials, and lower cost due to lower natural gas prices. |
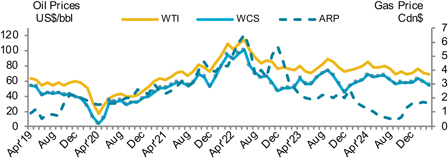
| • | The West Texas Intermediate (WTI) oil price averaged US$74.34 per barrel (/ bbl) in 2024-25, $0.34 more than estimated in Budget 2024, but $3.49 lower than in 2023-24. Total crude oil production was up 9.3 per cent from budget. |
| • | The light-heavy oil price differential averaged US$13.06/bbl. This was $0.14 narrower than budget and $4.23 narrower than 2023-24, |
| influenced by an increased demand for heavier crude and the additional egress capacity from the completion of TMX. |
| • | The US-Canadian dollar exchange rate averaged US¢72/ Cdn$ in 2024-25, four cents lower than estimated in budget and two cents lower than the 2023-24 average. Since oil is priced in US dollars, a lower exchange rate will increase the Canadian dollar revenue. |
| • | Natural gas prices were also lower: The Alberta Reference Price (ARP) averaged Cdn$1.11 per gigajoule in 2024-25, $0.07 below budget and $0.94 below 2023-24. The decrease in natural gas revenues was driven by lower than budgeted gas prices. |
| • | Bitumen royalties were $17.2 billion, $4.6 billion more than budget and $2.6 billion higher than in 2023-24. Conventional crude oil royalties were $3 billion in 2024-25, $0.3 billion higher than budget and very close to 2023-24. Bitumen and conventional oil production volumes rose by 37 per cent and 10 per cent from budget, respectively. |
| • | Natural gas and by-product royalties were $1.2 billion, up $0.2 billion from 2023-24 and down $0.2 from budget, following the fluctuations in oil and gas prices. |
| • | Crown land lease sales slightly increased by $0.1 billion from budget and decreased by $0.1 billion from |
| Change from | ||||||||||||||||||||||||
| Revenue | 2024-25 | 2023-24 | 2023-24 | |||||||||||||||||||||
|
(millions of dollars) |
Budget | Actual | Actual | Budget | Actual | |||||||||||||||||||
| 1 | Personal income tax | 15,604 | 16,120 | 15,160 | 516 | 960 | ||||||||||||||||||
| 2 | Corporate income tax | 7,028 | 8,125 | 7,044 | 1,097 | 1,081 | ||||||||||||||||||
| 3 | Education property tax | 2,733 | 2,797 | 2,526 | 64 | 271 | ||||||||||||||||||
| 4 | Other taxes | 3,280 | 3,314 | 2,017 | 34 | 1,297 | ||||||||||||||||||
| 5 | Bitumen royalty | 12,538 | 17,167 | 14,518 | 4,629 | 2,649 | ||||||||||||||||||
| 6 | Other non-renewable resource revenue | 4,777 | 4,819 | 4,769 | 42 | 50 | ||||||||||||||||||
| 7 | Canada Social Transfer / Canada Health Transfer | 8,165 | 8,154 | 7,872 | (12) | 282 | ||||||||||||||||||
| 8 | Other transfers from Government of Canada | 4,474 | 4,465 | 4,464 | (10) | 1 | ||||||||||||||||||
| 9 | Heritage / endowment fund investment income | 1,333 | 2,571 | 2,592 | 1,238 | (21) | ||||||||||||||||||
| 10 | Other investment income | 1,934 | 2,232 | 1,995 | 299 | 237 | ||||||||||||||||||
| 11 | Net income / (loss) from government business enterprises | 2,123 | 2,053 | 1,237 | (70) | 816 | ||||||||||||||||||
| 12 | Post-secondary institution tuition fees | 1,999 | 2,058 | 1,836 | 59 | 222 | ||||||||||||||||||
| 13 | Other premiums, fees and licences | 3,384 | 3,445 | 3,729 | 62 | (284) | ||||||||||||||||||
| 14 | SUCH sector sales, rentals / fundraising, donations | 1,730 | 1,973 | 1,911 | 242 | 62 | ||||||||||||||||||
| 15 | Other revenue | 2,434 | 3,176 | 3,068 | 743 | 108 | ||||||||||||||||||
| 16 Total Revenue |
73,537 | 82,469 | 74,738 | 8,932 | 7,731 | |||||||||||||||||||
| 4 | 2024-25 Final Results | Year-End Report | |
| Oil and Natural Gas Prices 2019-25
|
growth. However, strong performances of the infrastructure, global, Canadian and private equity investments within the endowment funds resulted in better than anticipated gains.
Other Revenue
• Net income from GBEs was $2.1 billion, consistent with budget expectations and $0.8 billion higher than in 2023-24. The majority of the change from prior year was in the Alberta Petroleum Marketing Corporation (APMC) where a $1.2 billion non-cash adjustment to the Sturgeon Refinery Processing Agreement Provision was recognized. This was partially offset by payments in lieu of taxes revenue and emission credit revenue in the balancing pool due to a decline in market prices.
• Premiums, fees and licences revenue was $5.5 billion, a slight increase of $0.1 billion from budget and remained steady with 2023-24. The increase was primarily due to tuition rate increases and an increase in enrolment in post-secondary institutions, increased number of Alberta Health Services patients that were billable to non-residents and other responsible parties, and the delay in the implementation of the Land Titles Registration Levy.
• Other revenue was $5.2 billion, an increase of $1 billion from budget and $0.2 billion from 2023-24. Changes from budget are comprised of increases in SUCH (schools, universities, colleges and health entities) sector sales, services, fundraising and donations revenue, and the reporting of a portion of the tobacco litigation settlement. This was partially offset by a decrease in Technology Innovation and Emissions Reduction Fund (TIER) compliance payments due to changes in market conditions. | |||
| ||||
|
2023-24 due to higher price per hectare sold partially offset with number of hectares.
Tax Revenue
• Total tax revenue was $30.4 billion, $1.7 billion greater than estimated in Budget 2024 and $3.6 billion more than in 2023-24.
• Personal income tax (PIT) was $16.1 billion, $0.5 billion higher than budget, and $1 billion greater than 2023-24, which can be attributed to strong growth in personal incomes and population. This was partially offset by the introduction of the new eight per cent tax bracket as of January 1, 2025.
• Corporate income tax (CIT) revenue was $8.1 billion, $1.1 billion greater than Budget 2024 , and $1.1 billion greater than 2023-24. The increase was due to strong corporate profits in various sectors such as oil and gas, construction, and finance. There were also increases in revenue from interest and penalties due to larger reassessment of corporate income tax.
• Education property and other tax revenue was $6.1 billion, close to Budget 2024 and $1.6 billion higher than in 2023-24. The change from the prior year is mainly as a result of the fuel tax being collected for the entire fiscal year in 2024-25, whereas in the prior fiscal year the fuel tax was paused for relief to consumers as part |
of the government’s efforts to help drivers with rising costs. Fuel tax relief is provided when the average price of WTI is US$80/bbl or higher.
Transfers from Government of Canada
• Federal government transfers totaled $12.6 billion, resulting in minimal change from Budget 2024 and $0.3 billion higher than 2023-24. The increase was mainly due to Alberta’s larger share of Canada Health Transfer (CHT) and Canada Social Transfer (CST), as well as additional federal funding received for the Canada- Alberta Canada-Wide Early Learning and Child Care agreements. These were partially offset by not qualifying for fiscal stabilization in 2024-25, after receiving $0.6 billion in 2023-24, and the end of the pandemic-related CHT top-up payments.
Investment Income
• Investment income was $4.8 billion, $1.5 billion greater than estimated in budget and $0.2 billion greater than in 2023-24. Income of the Heritage and endowment funds increased $1.2 billion relative to budget and remained stable relative to the prior year. The increase was due to conservative budget assumptions driven by ongoing geopolitical instability which was expected to increase risks for global economic | |||
Energy Prices and Exchange Rates
Fiscal year averages, 2010-11 to 2024-25
| 10-11 | 11-12 | 12-13 | 13-14 | 14-15 | 15-16 | 16-17 | 17-18 | 18-19 | 19-20 | 20-21 | 21-22 | 22-23 | 23-24 | 24-25 | ||||||||||||||||||||||||||||||||||||||||||||||
| Oil Price (WTI US$/bbl) |
83.38 | 97.33 | 92.07 | 99.05 | 80.48 | 45.00 | 47.93 | 53.69 | 62.77 | 54.85 | 42.32 | 77.03 | 89.69 | 77.83 | 74.34 | |||||||||||||||||||||||||||||||||||||||||||||
| WCS @ Hardisty (Cdn$/bbl) |
66.70 | 80.00 | 68.45 | 80.11 | 70.78 | 40.86 | 44.67 | 50.38 | 51.65 | 53.14 | 41.42 | 79.63 | 90.62 | 81.67 | 85.21 | |||||||||||||||||||||||||||||||||||||||||||||
| Natural Gas Price (Cdn$/GJ) |
3.28 | 2.98 | 2.28 | 3.28 | 3.51 | 2.21 | 2.01 | 1.82 | 1.34 | 1.39 | 2.10 | 3.48 | 4.63 | 2.07 | 1.11 | |||||||||||||||||||||||||||||||||||||||||||||
| Exchange rate (US¢/Cdn$) |
98.4 | 100.7 | 99.9 | 95.0 | 88.0 | 76.5 | 76.2 | 78.0 | 76.3 | 75.2 | 75.7 | 79.8 | 75.6 | 74.2 | 71.9 | |||||||||||||||||||||||||||||||||||||||||||||
| 2024-25 Final Results | Year-End Report | 5 | |
Expense Highlights
Total expense was $74.1 billion in 2024-25, comprising $62 billion in operating expense, $2.9 billion in capital grants, $1.9 billion in disaster assistance, $4.1 billion in other expense (including increases of $11 million in amortization and $12 million in inventory consumption, and a decrease of $265 million in loss on disposal and pension), and $3.2 billion in debt servicing costs.
Budget-to-actual changes. Expense was $1 billion higher than budget, net of the $2 billion contingency:
| • | Operating expense. $1.9 billion increase primarily from the increased demands on education, health and social services due to population growth and ongoing litigation claims. |
| • | Capital grants. $0.5 billion decrease primarily due to slower progress on municipal transportation and infrastructure projects and re-profiling projects to future years. |
| • | Disaster assistance. $1.9 billion increase from budget primarily attributed to increased Wildfire Presuppression and Response and from higher indemnity payouts and agriculture program participation, driven by decreases in commodity prices and increased activity in hail and wildlife damage compensation programs as a result of dry conditions. |
| • | Other expense. $0.3 billion decrease primarily due to lower-than-expected borrowing requirements as a result of the higher surplus, and inventory consumption. |
Year-over-year comparison. Expense was $3.7 billion higher than 2023-24:
| • | Operating expense. $3.9 billion net increase primarily from pressures on education, health and social services due to population growth. |
| • | Capital grants. $0.9 billion mainly from the new Local Government Fiscal Framework (LGFF) capital program, which replaced the Municipal Sustainability Initiative Capital program in 2024-25. The LGFF amount was set at $722 million for 2024-25. |
| • | Disaster assistance. $1.1 billion decrease compared to 2023-24 primarily due to the unprecedented wildfire season in 2023-24 and due to lower agriculture support program payments to producers as a result of drought conditions in 2023-24. |
| • | Other expense. No significant year-over-year changes, with a capital amortization increase due to more capital projects, partially offset by a decrease of inventory consumption and a reduction to pension liabilities. |
Third Quarter forecast-to-actual changes. Expense was $783 million lower than the third quarter forecast. Operating expense was $73 million higher mainly from ongoing litigation claims and $360 million lower capital grants mostly for the Calgary and Edmonton LRT projects and municipal infrastructure projects.
Ministry Expense
Total expense includes operating (shown by ministry in facing table), as well as other types of expense (e.g. capital grants, amortization, loss on disposal), for which only major ministries are individually displayed in the table. The remainder are grouped into “Other.”
Health
Total expense of $27.6 billion, includes $25.7 billion in operating expense and $1.9 billion in other expense. This was approximately $1 billion higher than budget and $1.8 billion higher than 2023-24.
| • | The increase from Budget 2024 is due to increases in physician volume, clinical activity, benefit utilization driven by aging population and higher cost of medication, partially offset by delays implementing priority initiatives. |
| • | Increases from 2023-24 include increases in physician volume, clinical activity and emergency room visits, and other increased expenses as a result of higher volume in the system. |
Education
Total expense was $9.9 billion, up $474 million from 2023-24 and $108 million from budget.
| • | The change from budget is comprised of an increase in operating expense from higher instruction expense due to increased enrolment and amortization. |
| • | The increase from 2023-24 comprises higher operating expense, primarily from increased enrolment which resulted in increased costs for teachers and instruction support staff, and increased amortization due to more tangible capital assets and capital projects going into service for schools. |
Advanced Education
Total expense was $7.2 billion, an increase of $148 million from budget and $369 million from 2023-24. The increase was primarily research-related expenses and program expansion costs due to enrolment growth.
Seniors, Community and Social Services
Expense was $5.9 billion, similar to budget and $370 million higher than 2023-24. The increase was primarily due to rising caseloads and related program costs, homelessness task force priorities and Navigation and Support Centres operations, as well as higher capital grants for continuing care and independent housing projects, partially offset by reduced spending in Indigenous and affordable housing due to project re-profiling and unspent affordable housing strategy funding.
Children and Family Services
Expense was $1.5 billion, up $17 million from budget, but $92 million lower than 2023-24. The decrease from 2023-24 was primarily due to lower demand for the Affordability Support Payments program, which ended in June 2023, partially offset by increased spending in facility placements and hiring due to recruitment strategies to attract and maintain staff.
| 6 | 2024-25 Final Results | Year-End Report | |
Total Expense
(millions of dollars)
| 2024-25 | 2023-24 | Change from | ||||||||||||||||||||
| Operating Expense by Ministry | Budget | Actual | Actual | Budget | 2023-24 | |||||||||||||||||
| 1 | Advanced Education |
6,305 | 6,608 | 6,233 | 303 | 375 | ||||||||||||||||
| 2 | Affordability and Utilities |
84 | 125 | 119 | 41 | 7 | ||||||||||||||||
| 3 | Agriculture and Irrigation |
870 | 833 | 743 | (36 | ) | 90 | |||||||||||||||
| 4 | Arts, Culture and Status of Women |
157 | 140 | 132 | (16 | ) | 8 | |||||||||||||||
| 5 | Children and Family Services |
1,498 | 1,515 | 1,603 | 17 | (88 | ) | |||||||||||||||
| 6 | Education |
9,252 | 9,288 | 8,878 | 36 | 410 | ||||||||||||||||
| 7 | Energy and Minerals |
816 | 1,223 | 824 | 407 | 399 | ||||||||||||||||
| 8 | Environment and Protected Areas |
512 | 401 | 377 | (111 | ) | 23 | |||||||||||||||
| 9 | Executive Council |
63 | 57 | 48 | (6 | ) | 9 | |||||||||||||||
| 10 | Forestry and Parks |
351 | 352 | 285 | 1 | 67 | ||||||||||||||||
| 11 | Health |
24,648 | 25,669 | 23,746 | 1,020 | 1,923 | ||||||||||||||||
| 12 | Immigration and Multiculturalism |
42 | 40 | 39 | (2 | ) | - | |||||||||||||||
| 13 | Indigenous Relations |
210 | 222 | 214 | 12 | 8 | ||||||||||||||||
| 14 | Infrastructure |
488 | 467 | 462 | (21 | ) | 5 | |||||||||||||||
| 15 | Jobs, Economy and Trade |
1,849 | 1,856 | 1,557 | 7 | 299 | ||||||||||||||||
| 16 | Justice |
681 | 676 | 652 | (5 | ) | 24 | |||||||||||||||
| 17 | Mental Health and Addiction |
1,548 | 1,597 | 1,523 | 48 | 74 | ||||||||||||||||
| 18 | Municipal Affairs |
235 | 228 | 220 | (6 | ) | 9 | |||||||||||||||
| 19 | Public Safety and Emergency Services |
1,249 | 1,259 | 1,205 | 10 | 54 | ||||||||||||||||
| 20 | Seniors, Community and Social Services |
5,410 | 5,539 | 5,327 | 128 | 211 | ||||||||||||||||
| 21 | Service Alberta and Red Tape Reduction |
180 | 177 | 159 | (3 | ) | 18 | |||||||||||||||
| 22 | Technology and Innovation |
759 | 775 | 729 | 16 | 47 | ||||||||||||||||
| 23 | Tourism and Sport |
126 | 124 | 112 | (1 | ) | 12 | |||||||||||||||
| 24 | Transportation and Economic Corridors |
549 | 583 | 564 | 34 | 20 | ||||||||||||||||
| 25 | Treasury Board and Finance |
2,086 | 2,128 | 2,237 | 42 | (109 | ) | |||||||||||||||
| 26 | Legislative Assembly |
156 | 144 | 160 | (12 | ) | (16 | ) | ||||||||||||||
| 27 | Total Operating Expense |
60,124 | 62,025 | 58,149 | 1,901 | 3,876 | ||||||||||||||||
| Capital Grants |
||||||||||||||||||||||
| 28 | Energy and Minerals |
212 | 165 | 130 | (48 | ) | 35 | |||||||||||||||
| 29 | Municipal Affairs |
1,049 | 1,039 | 765 | (10 | ) | 275 | |||||||||||||||
| 30 | Transportation and Economic Corridors |
1,273 | 1,030 | 819 | (243 | ) | 211 | |||||||||||||||
| 31 | Other |
934 | 700 | 390 | (234 | ) | 310 | |||||||||||||||
| 32 | Total Capital Grants |
3,469 | 2,934 | 2,103 | (535 | ) | 831 | |||||||||||||||
| Disaster / Emergency Assistance |
||||||||||||||||||||||
| 33 | Agriculture and Irrigation – agriculture support |
- | 1,039 | 1,856 | 1,039 | (817 | ) | |||||||||||||||
| 34 | Forestry and Parks – wildfire fighting |
- | 702 | 851 | 702 | (149 | ) | |||||||||||||||
| 35 | Public Safety and Emergency Services – wildfire / flood support |
- | 158 | 260 | 158 | (102 | ) | |||||||||||||||
| 36 | Other |
- | 33 | 58 | 33 | (25 | ) | |||||||||||||||
| 37 | Total Disaster / Emergency Assistance |
- | 1,932 | 3,025 | 1,932 | (1,093 | ) | |||||||||||||||
| 38 | Amortization / Inventory Consumption / Loss on Asset Disposals |
4,564 | 4,446 | 4,399 | (119 | ) | 47 | |||||||||||||||
| Taxpayer-supported Debt Servicing Costs - General |
||||||||||||||||||||||
| 39 | Education – school boards |
9 | 10 | 10 | 1 | - | ||||||||||||||||
| 40 | Treasury Board and Finance |
1,066 | 991 | 917 | (75 | ) | 74 | |||||||||||||||
| 41 | Total Taxpayer-supported General Debt Servicing Costs |
1,075 | 1,001 | 927 | (74 | ) | 74 | |||||||||||||||
| Taxpayer-supported Debt Servicing Costs - Capital Plan |
||||||||||||||||||||||
| 42 | Education – school P3s |
33 | 33 | 30 | - | 3 | ||||||||||||||||
| 43 | Transportation – ring road P3s |
115 | 115 | 92 | - | 23 | ||||||||||||||||
| 44 | Treasury Board and Finance – direct borrowing |
1,385 | 1,288 | 1,201 | (97 | ) | 87 | |||||||||||||||
| 45 | Total Taxpayer-supported Capital Plan Debt Servicing Costs |
1,533 | 1,436 | 1,324 | (97 | ) | 113 | |||||||||||||||
| 46 | Total Taxpayer-supported Debt Servicing Costs |
2,608 | 2,437 | 2,250 | (171 | ) | 187 | |||||||||||||||
| Self-supported Debt Servicing Costs |
||||||||||||||||||||||
| 47 | Treasury Board and Finance – loans to local authorities |
677 | 671 | 802 | (6 | ) | (131 | ) | ||||||||||||||
| 48 | Treasury Board and Finance – Ag Financial Services Corp. |
104 | 106 | 97 | 2 | 9 | ||||||||||||||||
| 49 | Total Self-supported Debt Servicing Costs |
781 | 777 | 899 | (4 | ) | (122 | ) | ||||||||||||||
| 50 | Total Debt Servicing Costs |
3,389 | 3,215 | 3,149 | (175 | ) | 65 | |||||||||||||||
| 51 | Pension Recovery |
(364 | ) | (403 | ) | (372 | ) | (39 | ) | (31 | ) | |||||||||||
| 52 | Contingency |
2,000 | - | - | (2,000 | ) | - | |||||||||||||||
| 53 | Total Expense |
73,182 | 74,149 | 70,453 | 967 | 3,695 | ||||||||||||||||
| 2024-25 Final Results | Year-End Report | 7 | |
Public Safety and Emergency Services
Expense was $1.4 billion, a $167 million increase from budget but a $48 million decrease from 2023-24. The increase from budget is due to an increase in Alberta Emergency Management Agency (AEMA) mainly for the 2024 Jasper and other wildfires and for police support grants provided to Calgary and Edmonton. The decrease from 2023-24 is mainly the result of lower disaster recovery program operating grants following the 2023 summer floods and wildfires, which was partially offset by increases in transit safety and police services grants, expansion of the Sheriff Branch and electronic monitoring.
Energy and Minerals
Total expense was $1.4 billion, an increase of $356 million from budget and $435 million from 2023-24. The increase from both budget and 2023-24 were primarily related to settlement of litigation claims and Cost of Selling Oil. Capital grants were higher compared to 2023-24 as a result of a payment for Inter Pipeline’s Petrochemical Complex project under the Alberta Petrochemicals Incentive Program and lower in 2024-25 as a result of lower spending on carbon capture and storage projects.
Other Ministries
Total expense for other ministries was $19.2 billion in 2024-25, $0.8 billion lower than estimated in Budget 2024 and $0.4 billion higher than 2023-24.
Changes from budget include:
| • | Agriculture and Irrigation expense was $995 million higher mainly due to higher than anticipated indemnities and rise in program participation. |
| • | Environment and Protected Areas was $109 million lower, primarily the result of the revised lower TIER revenue forecast and lower related spending. |
| • | Forestry and Parks increased $671 million mainly for Wildfire Presuppression and Response expense during the 2024 wildfire season. |
| • | Transportation and Economic Corridors expense was $208 million lower primarily due to slower than anticipated construction progress by municipalities on several projects, including Edmonton and Calgary LRTs. |
| • | Infrastructure was $39 million higher than budget mostly due to the disposal of land inventory in Parsons Creek as part of the Land Exchange Agreement settlement with the Regional Municipality of Wood Buffalo. |
| • | Technology and Innovation was $50 million lower than budget mostly due to reprofiling capital grants to future years. |
| • | Treasury Board and Finance expense was $160 million lower due to debt servicing costs as a result of lower-than-expected borrowing requirements from the higher surplus than what was projected in Budget 2024. |
| • | Expense in other ministries was a net of $11 million higher than budget. |
Changes from 2023-24 include:
| • | Agriculture and Irrigation expense was $659 million lower primarily due to decreases in hail and moisture deficiency claims and in Agriculture income support payments. |
| • | Jobs, Economy and Trade was up $302 million from increased spending for child care affordability and access, and child care quality and worker support initiatives. |
| • | Mental Health and Addiction expense increased $142 million primarily due to increased costs related to collective bargaining, population growth, and re-profiling of Indigenous Recovery Community capital grants from 2023-24. |
| • | Municipal Affairs expense increased $299 million primarily due to the new LGFF capital program. |
| • | Transportation and Economic Corridors expense was $310 million higher primarily due to progress on capital grant projects of capital assets. |
| • | Forestry and Parks expense was $85 million lower primarily due to lower disaster and emergency assistance required in 2024-25 |
| compared to 2023-24. Although the 2024 wildfires season was more active than average, the area burned was below the record-breaking level in 2023-24. |
| • | Infrastructure expense was $62 million higher mainly due to the disposal of land inventory in Parsons Creek as part of the Land Exchange Agreement settlement with the Regional Municipality of Wood Buffalo. |
| • | Treasury Board and Finance expense was $64 million lower as a result of a large provision related to the accounting allowance for the a loan made under the Local Authorities Capital Financial Act. |
| • | Technology and Innovation expense was up $70 million primarily due to higher spending on various information technology related initiatives. |
| • | Expense in other ministries was a net $55 million higher than 2023-24. |
Pension Recovery
| • | Public sector pension plan liabilities decreased by $0.4 billion to $7.5 billion at March 31, 2025. |
| • | Liabilities for pre-1992 and other closed plan obligations account for 98 per cent of the liability, with the pre-1992 Teachers’ pension plan accounting for 89 per cent. |
Pension Liabilities
Government obligations for pension plan liabilities (millions of dollars)
| (at March 31) | 2025 | 2024 | ||||||
| Teachers’ (pre-1992) |
6,696 | 7,030 | ||||||
| PS Mgmt. (pre-1992) |
335 | 347 | ||||||
| Univ. Acad. (pre-1992) |
203 | 196 | ||||||
| Spec. Forces (pre-1992) |
61 | 64 | ||||||
| MLA (Closed) |
30 | 32 | ||||||
| Universities Academic |
70 | 128 | ||||||
| Teachers’ (post-1992) |
- | - | ||||||
| Supp. Exec. Retir. Plans |
85 | 82 | ||||||
| PS Mgmt. (Supp.) |
24 | 24 | ||||||
| Prov. Judges / Masters |
- | 1 | ||||||
| Total Pension Liab. |
7,504 | 7,904 | ||||||
| 8 | 2024-25 Final Results | Year-End Report | |
Fiscal Framework
The Sustainable Fiscal Planning and Reporting Act includes a no deficit rule. In 2024-25 the government is reporting a surplus of $8.3 billion.
The framework also limits in-year expense increases, adjusted to exclude expense that is directly offset by a related increase to revenue and non-cash, non-recurring adjustments, to the voted, budgeted contingency.
In 2024-25, the contingency was set at $2 billion. In 2024-25, total expense exceeded budget by $1 billion. Of this increase, $2 billion was offset by the contingency. The remaining increase was mainly in disaster and emergency assistance expense relating to drought and wildfires in 2024 and expense related to dedicated revenue. The fiscal framework provides allowable exceptions for the in-year expense limitation, including exceptions for disasters and emergencies and dedicated-revenue expense.
Surplus cash and Alberta Fund.
The fiscal framework requires the allocation of surplus cash, with the first 50 per cent going to repay maturing debt or to the Alberta Heritage Savings Trust Fund to improve the province’s net financial position and the remaining 50 per cent allocated to the Alberta Fund. There are three allowable uses of cash from the Alberta Fund: further debt repayment, savings in the Alberta Heritage Savings Trust Fund or for one-time initiatives that do not permanently increase government spending.
Surplus cash at March 31, 2025 of $5.1 billion is comprised of $3.7 billion of surplus cash from 2023-24 results, plus the $8.3 billion surplus, less $4.9 billion in cash requirements and adjustments. Preliminary allocations of surplus cash from 2024-25 results include $2.6 billion to improve the government’s net financial position either through debt repayment or deposits into the Heritage Fund and $2.6 billion to the Alberta Fund. These allocations are preliminary and may change as the 2025-26 fiscal year unfolds.
As stated in Budget 2024, the government transferred $2 billion from the 2023-24 Alberta Fund allocation into the Heritage Fund to support the long-term plan to grow the size of the fund.
Cash adjustments such as differences between accrued revenue and cash receipts, non-cash revenue or expense, SUCH sector (schools, universities, colleges and health entities) and entity results, and transfers not reported on the income statement, are necessary to determine the cash balance. The list of cash adjustments are included on page 10 of this report.
| • | Net income of, or retained by, other entities. |
| - | Positive adjustments include: APMC had a net loss of $0.6 billion from Sturgeon Refinery Processing Agreement primarily as a result of higher feedstock costs such as crude oil, and $0.1 billion as the Agriculture Financial Services Corporation (AFSC) funded indemnity payments from the crop fund and underutilized Affordable Housing Strategy funding in the Alberta Social Housing Corporation. |
| - | Negative adjustments include: $1.9 billion of net income was retained in the Alberta Heritage Savings Trust Fund; $0.3 billion of net income was retained in the endowment funds; $0.3 billion of net income was retained by ATB Financial; and $0.1 billion of net income was retained by the TIER Fund. |
| • | Other cash adjustments. |
| - | Non-cash expense: An adjustment is required to remove the impact of SUCH related revenues and expenses as these are reported in the government’s consolidated reporting entity but are funded using the entity’s cash, a net adjustment of $0.3 billion in 2024-25. Inventory consumption of $0.2 billion is an accounting adjustment and does not require |
| cash. $0.4 billion adjustment for pension recovery is added back to cash balance as it is also non-cash. |
| - | Cash requirements not in expense: $0.3 billion for student loans, net of repayments and default provision; $205 million for short-term inventory acquisition. |
| - | Revenue and other cash adjustments: non-renewable resource revenue reported was $0.6 billion less than cash received, income tax revenue reported was $0.5 billion less than cash received. $83 million is still outstanding in Federal Government transfers for disaster recovery assistance, 2016 Wood Buffalo wildfire, 2024 Jasper Wildfires and other disasters where spending incurred in prior years. Cash transfers for capital, reported in revenue over the related asset’s life, exceeded non-cash reported revenue by $4 million. |
| • | Capital Plan cash. Cash for capital investment and P3 principal repayments of $3.5 billion was slightly offset by the $4 million from P3 partners and $1.3 billion in non-cash amortization. |
ATB Financial paid quarterly dividends totaling $0.1 billion to the province in 2024-25.
| 2024-25 Final Results | Year-End Report | 9 | |
Cash Adjustments / Borrowing Requirements
(millions of dollars)
| Change from | ||||||||||||||||||||
| 2024-25 | 2023-24 | 2023-24 | ||||||||||||||||||
| Budget | Actual | Actual | Budget | Actual | ||||||||||||||||
| Cash/Alberta Fund at start of the year |
3,218 | 3,667 | 5,136 | 449 | (1,469 | ) | ||||||||||||||
| AB Fund - Heritage Fund allocation |
(2,000 | ) | (2,000) | - | - | (2,000 | ) | |||||||||||||
| Surplus / (Deficit) | 355 | 8,320 | 4,285 | 7,965 | 4,036 | |||||||||||||||
| Cash Adjustments (negative = cash requirement; positive = cash source) |
||||||||||||||||||||
| Retained Income of Funds and Agencies |
||||||||||||||||||||
| Alberta Heritage Savings Trust Fund |
(907 | ) | (1,871 | ) | (1,892 | ) | (964 | ) | 21 | |||||||||||
| ATB Financial |
(266 | ) | (348 | ) | (337 | ) | (82 | ) | (11 | ) | ||||||||||
| Agriculture Financial Services Corporation |
(1,051 | ) | 46 | 609 | 1,097 | (563 | ) | |||||||||||||
| Heritage Foundation for Medical Research Endowment Fund |
(119 | ) | (169 | ) | (174 | ) | (50 | ) | 5 | |||||||||||
| Heritage Science and Engineering Research Endowment Fund |
(62 | ) | (86 | ) | (87 | ) | (24 | ) | 1 | |||||||||||
| Heritage Scholarship Fund |
(72 | ) | (79 | ) | (83 | ) | (7 | ) | 4 | |||||||||||
| Alberta Social Housing Corporation |
(24 | ) | 7 | 6 | 31 | 1 | ||||||||||||||
| Credit Union Deposit Guarantee Corporation |
(16 | ) | (17 | ) | (9 | ) | (1 | ) | (8 | ) | ||||||||||
| Alberta Petroleum Marketing Commission |
525 | 616 | 1,637 | 91 | (1,021 | ) | ||||||||||||||
| Technology Innovation and Emissions Reduction Fund |
(16 | ) | (89 | ) | (425 | ) | (73 | ) | 336 | |||||||||||
| Balancing Pool |
(65 | ) | (50 | ) | (160 | ) | 15 | 110 | ||||||||||||
| Other |
(27 | ) | (72 | ) | (57 | ) | (45 | ) | (15 | ) | ||||||||||
| Total Retained Income of Funds and Agencies |
(2,099 | ) | (2,111 | ) | (972 | ) | (11 | ) | (1,138 | ) | ||||||||||
| Other Cash Adjustments |
||||||||||||||||||||
| SUCH sector own-source revenue |
(5,877 | ) | (6,805 | ) | (6,020 | ) | (928 | ) | (785 | ) | ||||||||||
| SUCH sector own-source expense |
6,895 | 7,075 | 6,643 | 180 | 432 | |||||||||||||||
| Net deferred capital contribution cash adjustment |
(42 | ) | 4 | 183 | 46 | (179 | ) | |||||||||||||
| Energy royalties (difference between accrued revenue & cash) |
549 | 552 | 274 | 3 | 278 | |||||||||||||||
| Student loans |
(606 | ) | (296 | ) | (540 | ) | 310 | 244 | ||||||||||||
| Other cash adjustments |
(351 | ) | (733 | ) | 922 | (382 | ) | (1,655 | ) | |||||||||||
| 2013 Alberta flood assistance revenue / expense |
(20 | ) | - | (7 | ) | 20 | 7 | |||||||||||||
| Wood Buffalo wildfire revenue / expense |
95 | (1 | ) | (6 | ) | (96 | ) | 5 | ||||||||||||
| Pension recovery (non-cash expense) |
(364 | ) | (403 | ) | (372 | ) | (39 | ) | (31 | ) | ||||||||||
| Inventory acquisition (excluding SUCH sector; non-cash expense) |
(234 | ) | (205 | ) | (157 | ) | 29 | (48 | ) | |||||||||||
| Inventory consumption (excluding SUCH sector; non-cash expense) |
233 | 180 | 361 | (53 | ) | (181 | ) | |||||||||||||
| Total Other Cash Adjustments |
279 | (632 | ) | 1,280 | (911 | ) | (1,913 | ) | ||||||||||||
| Capital Cash Adjustments |
||||||||||||||||||||
| Capital investment (excluding SUCH sector self-financed) |
(4,323 | ) | (3,437 | ) | (3,581 | ) | 886 | 144 | ||||||||||||
| Capital Plan contingency |
800 | - | - | (800 | ) | - | ||||||||||||||
| Current principal repayments (P3s – public-private partnerships) |
(98 | ) | (74 | ) | (92 | ) | 24 | 18 | ||||||||||||
| Alternative financing (P3s – public-private partnerships) |
1 | 4 | 64 | 3 | (60 | ) | ||||||||||||||
| Amortization (excluding SUCH sector - non-cash expense) |
1,363 | 1,305 | 1,212 | (58 | ) | 93 | ||||||||||||||
| Book value of asset disposals (net non-cash expense / revenue) |
- | - | - | - | - | |||||||||||||||
| Total Capital Cash Adjustments |
(2,257 | ) | (2,203 | ) | (2,397 | ) | 55 | 194 | ||||||||||||
| ATB Financial dividend |
100 | 100 | - | - | 100 | |||||||||||||||
| Total Cash Adjustments |
(3,977 | ) | (4,845 | ) | (2,089 | ) | (867 | ) | (2,757 | ) | ||||||||||
| Surplus / (Deficit) plus net cash adjustments |
(3,622 | ) | 3,475 | 2,196 | 7,098 | 1,279 | ||||||||||||||
| Allocation of Surplus Cash |
||||||||||||||||||||
| Surplus cash (balance at start of year +/- AB Fund - Heritage Fund allocation + surplus +/- net cash adjustments) |
(2,404 | ) | 5,142 | 7,333 | 7,546 | (2,191 | ) | |||||||||||||
| Less: |
||||||||||||||||||||
| Debt repayment / Heritage Fund |
- | (2,571 | ) | (3,666 | ) | (2,571 | ) | 1,095 | ||||||||||||
| Allocation to Alberta Fund |
- | (2,571 | ) | (3,667 | ) | (2,571 | ) | 1,096 | ||||||||||||
| Direct borrowing required |
2,404 | - | - | (2,404 | ) | - | ||||||||||||||
| Unallocated Surplus Cash |
- | - | - | - | - | |||||||||||||||
| 10 | 2024-25 Final Results | Year-End Report | |
Net Financial and Capital Assets
At March 31, 2025, the province’s assets exceeded liabilities by $24.5 billion.
This was a $8.3 billion improvement relative to March 31, 2024, due to an increase of $11 billion in financial assets, an increase of $1.4 billion in capital / non-financial assets, netted against a reduction of $4 billion in liabilities. Main changes in financial assets and liabilities include:
| • | The $11 billion increase in financial assets mainly consists of $8.7 billion in the Heritage Fund, endowment funds, debt retirement account, Alberta Fund, and TIER Fund, primarily from income retention; $3 billion in other financial assets; offset by decreases of $0.5 billion in student loans and loans to local authorities, $0.1 billion in net assets of GBEs and $46 million in loans to AFSC. |
| • | The $4 billion increase in liabilities comprised of a $2.9 billion increase in debt, mainly reflecting advanced borrowing due to the pre-funding plan offset by the taxpayer-supported debt repayment; $1.5 billion increase in asset retirement obligation and other liabilities; offset by $0.5 billion reduction in pension and coal phase-out liabilities. |
Financial assets
$97.9 billion at March 31, 2025.
Heritage Fund. $24.8 billion book value. This was a $3.9 billion increase from March 31, 2024, from retaining 100 per cent of its net income and a $2 billion deposit from the Alberta Fund.
Endowment and other funds. $5.6 billion, a $0.3 billion increase from March 31, 2024. This is also due to retaining their net income for the year.
Debt retirement account/Alberta Fund. Balance of $10 billion in the debt retirement account, an increase of $5 billion from March 31, 2024. This cash was set aside to retire upcoming maturing debt. In addition, $2.6 billion has been allocated to the Alberta Fund
in 2024-25.
Self-supporting lending activities. $16.7 billion in assets of AFSC and local authority loans. These assets fully offset the related liabilities.
Equity / (deficit) in commercial enterprises. $0.7 billion, comprising equity of $5.7 billion in ATB Financial, $0.5 billion in Credit Union Deposit Guarantee Corporation, $0.3 billion in Alberta Gaming, Liquor and Cannabis Commission, less deficits of $5.3 billion in APMC and $0.3 billion in the Balancing Pool.
Student loans. $4.9 billion, an increase of $296 million from March 31, 2024, comprising $0.9 billion in loans disbursed less $458 million in repayments and a $147 million in loan default loss provision and other adjustments.
Technology Innovation and Emissions Reduction Fund. $1.1 billion, a $89 million increase from March 31, 2024 as TIER revenue exceeded spending allocations.
Other financial assets. $29 billion, a $3 billion increase from the prior year. These assets include financial assets of school boards, universities and colleges and the health authorities, accounts and interest receivable, natural gas royalty deposits, cash associated with future liabilities such as corporate income tax refunds and derivative financial instruments.
Liabilities
$132.3 billion at March 31, 2025, including debt of $102 billion, alternative financing (public-private partnerships) of $2.5 billion, coal phase- out liabilities of $0.6 billion, pension liabilities of $7.5 billion, $2.6 billion for asset retirement obligations and other liabilities of $19.1 billion.
Liabilities for capital projects. $50.6 billion, a $3 billion increase from March 31, 2024. P3 projects added $4 million in liabilities, less $74 million in repayments.
Fiscal plan borrowing. $34.7 billion,
an increase of $424 million due to the financial restructuring of the pre-1992 Teachers’ Pension Plan.
Self-supporting lending activities. $17.3 billion, consisting of $13.8 billion in debt incurred to provide loans to local authorities and $3.4 billion in AFSC to on-lend to the agriculture sector.
Coal phase-out liabilities. $0.6 billion, $50 million lower than 2023-24, reflecting the net present value of $93 million in annual payments to be made to generators for phasing-out coal use by 2030.
Pension liabilities. $7.5 billion, a decrease of $400 million.
Asset retirement obligations. $2.6 billion, a $188 million increase from 2023-24. The government’s adoption of the Asset Retirement Obligation standard requires recognition of future disposal costs of certain capital assets that need remediation or decommissioning work.
Other liabilities. $19.1 billion. Includes liabilities of school boards, universities and colleges and the health authority, natural gas royalty and security deposits, unearned revenue, estimated corporate income tax refunds, trade payables, other liabilities of AFSC, and derivative financial instruments.
Capital / Non-financial Assets
$63 billion at March 31, 2025. $61.7 billion in capital assets include land, land improvements, buildings, computer hardware and software, equipment, provincial highways, bridges, dams and other water management infrastructure.
Capital assets increased $1.3 billion: $3.9 billion in capital investment less $2.6 billion in amortization, disposals, and accounting adjustments.
Total Capital Plan spending in 2024-25 of $7.2 billion ($4.3 billion investment plus $2.9 billion in grants) was financed from a variety of sources: $5.8 billion from the general revenue fund; $0.8 billion in federal funding, donations and other sources;
| 2024-25 Final Results | Year-End Report | 11 | |
$0.9 billion provided by school boards, post-secondary institutions and AHS; and $55 million from cash of agencies and funds (e.g. Alberta Social Housing Corporation and TIER), and public-private partnerships.
Other non-financial assets include $0.4 billion in inventory assets, $0.6 billion in prepaid expenses, and
$0.2 billion in purchased intangibles. Inventory acquisition was less than consumption / write-downs by $19 million, while prepaid expenses increased by $84 million and purchased intangibles increased by $8 million.
Spent Deferred Capital Contributions
$4.1 billion at March 31, 2025.
Spent deferred capital contributions increased $0.1 billion, reflecting the use of $0.3 billion in cash received for capital that has not yet been reported in revenue, less $0.2 billion in cash previously received and spent, and now being recognized in 2024-25 revenue.
| Balance Sheet | at March 31 | |||||||||||
|
(millions of dollars) |
2025 Actual |
2024 Actual |
Change from 2024 |
|||||||||
| Financial Assets |
||||||||||||
| Alberta Heritage Savings Trust Fund accumulated operating surplus |
24,743 | 20,872 | 3,871 | |||||||||
| Endowment fund accumulated operating surpluses: |
||||||||||||
| Alberta Heritage Foundation for Medical Research |
2,370 | 2,202 | 168 | |||||||||
| Alberta Heritage Science and Engineering Research |
1,374 | 1,288 | 86 | |||||||||
| Alberta Heritage Scholarship |
1,539 | 1,459 | 80 | |||||||||
| Alberta Enterprise Corporation |
323 | 337 | (14 | ) | ||||||||
| General Revenue Fund - surplus cash a |
2,571 | 1,984 | 587 | |||||||||
| General Revenue Fund - debt retirement |
9,952 | 5,035 | 4,917 | |||||||||
| Alberta Fund |
2,571 | 3,667 | (1,096 | ) | ||||||||
| Self-supporting lending organizations / activities: |
||||||||||||
| Local authority loans |
13,823 | 14,590 | (767 | ) | ||||||||
| Agriculture Financial Services Corporation |
2,920 | 2,966 | (46 | ) | ||||||||
| Equity in commercial enterprises: ATB / AGLC / APMC / CUDGCo / Bal. Pool / PSIs |
735 | 862 | (127 | ) | ||||||||
| Student loans |
4,936 | 4,640 | 296 | |||||||||
| Technology Innovation and Emissions Reduction Fund |
1,106 | 1,017 | 89 | |||||||||
| Other financial assets (including SUCH sector / Alberta Innovates Corp.) |
28,972 | 25,970 | 3,002 | |||||||||
| Total Financial Assets | 97,935 | 86,889 | 11,046 | |||||||||
| Liabilities |
||||||||||||
| Taxpayer-supported debt: |
||||||||||||
| Direct borrowing for the Capital Plan |
48,045 | 44,957 | 3,088 | |||||||||
| Alternative financing (P3s - public-private partnerships - Capital Plan) |
2,515 | 2,637 | (122 | ) | ||||||||
| Debt issued to reduce pre-1992 TPP unfunded liability |
451 | 478 | (27 | ) | ||||||||
| Direct borrowing for the Fiscal Plan |
34,214 | 33,763 | 451 | |||||||||
| Total taxpayer-supported debt |
85,225 | 81,835 | 3,390 | |||||||||
| Self-supporting lending organizations / activities debt: |
||||||||||||
| Debt issued to finance local authority loans |
13,823 | 14,590 | (767 | ) | ||||||||
| Agriculture Financial Services Corporation |
3,434 | 3,125 | 309 | |||||||||
| Total debt a |
102,482 | 99,550 | 2,932 | |||||||||
| Coal phase-out liabilities |
514 | 609 | (95 | ) | ||||||||
| Pension liabilities |
7,504 | 7,904 | (400 | ) | ||||||||
| Asset retirement obligations |
2,579 | 2,391 | 188 | |||||||||
| Other liabilities (including SUCH sector / Alberta Innovates Corp.) |
19,193 | 17,799 | 1,394 | |||||||||
| Total Liabilities | 132,272 | 128,253 | 4,019 | |||||||||
| Net Financial Assets / (Debt) (total financial assets less total liabilities) |
(34,337 | ) | (41,364 | ) | 7,027 | |||||||
| Capital / Other Non-financial Assets |
62,925 | 61,515 | 1,410 | |||||||||
| Spent deferred capital contributions |
(4,080 | ) | (3,964 | ) | (116 | ) | ||||||
| Net Assets / (Liabilities) (net financial assets + capital assets - def. capital contributions) |
24,508 | 16,187 | 8,321 | |||||||||
| Net assets / (Liabilities) - statement of operations |
20,966 | 12,649 | ||||||||||
| Accumulated remeasurement gains |
3,542 | 3,538 | ||||||||||
| Change in Net Assets / (Liabilities) - stmt. of operations b |
8,317 | 4,149 | ||||||||||
| Net debt / GDP |
-7.2% | -9.4% | ||||||||||
| a | Does not include term debt of $8,366 million (2024: $8,085 million) issued on behalf of government business enterprises which is included on a net basis in financial assets (“Equity in commercial enterprises” = assets minus debt and other liabilities), nor does it include liabilities for capital leases. |
| b | Change in Net Assets - stmt. of operations differ from the surplus / (deficit) numbers due to net assets adjustments (2025: $(3) million; 2024: $(136) million) on the adoption of PS 3160 Public Private Partnerships (P3), PS 3400 Revenue and PSG-8 Purchased Intangibles accounting standards (see Schedule 17, p.81 of the 2024-25 Consolidated Financial Statements respectively). |
| 12 | 2024-25 Final Results | Year-End Report | |
Economic and Tax Highlights
Economic highlights
(Calendar Year Basis)
Alberta’s economy expanded at a solid pace in 2024, supported by increased pipeline capacity, rapid population growth and falling interest rates. Real gross domestic product (GDP) rose an estimated 2.7% last year, an acceleration from the 2.3% growth recorded in 2023.
The energy sector led the growth in business activity and output. With activity ramping up in the second half, rigs drilling advanced 4.4% in 2024. Annual crude oil production also climbed to a record high of almost four million barrels per day, while natural gas output increased despite weaker prices. Outside the energy sector, business output was slow to gain momentum, weighed down by declines in primary agriculture and manufacturing sectors. Meanwhile, major industrial projects led the increase in non-residential construction investment, although engineering construction and machinery and equipment spending saw more muted growth.
Alberta’s population expanded at an exceptionally strong pace in 2024, although momentum cooled later in the year. It grew by 4.4 per cent year-over-year (y/y) in the 2024 census year, the fastest rate since 1981. However, changes to federal immigration policy slowed the net inflows of temporary residents in the
latter half of the year. This moderated the population growth to 3.5 per cent y/y in the fourth quarter. Nonetheless, Alberta remained the fastest growing province in Canada.
Labour market conditions softened in 2024. After a sluggish start, employment growth accelerated in the second half of the year, with the province adding 76,300 jobs in 2024. While job gains have been exceptionally strong, they lagged behind the rapid expansion in the labour force. This pushed the unemployment rate up to average 7.0 per cent. With layoffs muted, the increase in unemployment was concentrated among new labour market entrants.
Consumer inflation moderated further to 2.9 per cent last year as price pressures eased across a broad range of categories. Rapid population growth put pressure on shelter costs, although the pace of increase moderated throughout the year as interest rates fell and strong residential construction activity brought more supply into the market. Meanwhile, easing inflation and falling interest rates provided some relief to households in 2024.
Tax highlights
Alberta maintained an overall tax advantage compared to all other provinces, with low personal income taxes and no sales tax, payroll tax or health premium. In 2024-25, Albertans
and Alberta businesses would have paid at least $19 billion more in taxes if Alberta had the same tax system as any other province.
As announced in Budget 2025, government is adding to this tax advantage by cutting personal income taxes with a new eight per cent tax bracket that applies on the first $60,000 of income, effective January 1, 2025. The new tax bracket will save individuals up to $750 in 2025.
As of February 13, 2025, a $200 annual tax on battery electric vehicles came into effect. This tax ensures that all drivers contribute to the tax revenue that funds the programs and services that Albertans rely on.
To address the growing issue of contraband tobacco, government established a cross-ministry working group to assess its prevalence and recommend solutions. In Budget 2025, government announced four measures to address contraband tobacco in the province: strengthen enforcement, introduction of new administrative penalties, improve coordination, and advocate for stronger federal action.
Alberta introduced a provincial vaping tax effective January 1, 2025. The tax is collected by the federal government on Alberta’s behalf and is intended to discourage vaping, particularly among youth.
Key Economic Indicators, 2013 to 2024
Calendar year, % change unless otherwise noted
| 2013 | 2014 | 2015 | 2016 | 2017 | 2018 | 2019 | 2020 | 2021 | 2022 | 2023 | 2024 | |||||||||||||||||||||||||||||||||||||
| Nominal GDP growth a |
9.6 | 10.0 | (14.0 | ) | (6.1 | ) | 9.2 | 4.2 | 1.7 | (14.4 | ) | 26.1 | 24.4 | (4.3 | ) | 5.3 | ||||||||||||||||||||||||||||||||
| Real GDP growth a |
5.7 | 5.9 | (3.7 | ) | (3.5 | ) | 4.5 | 2.0 | 0.1 | (7.8 | ) | 5.2 | 6.0 | 2.3 | 2.7 | |||||||||||||||||||||||||||||||||
| Employment (thousands) |
2,215 | 2,250 | 2,263 | 2,198 | 2,218 | 2,279 | 2,306 | 2,137 | 2,246 | 2,356 | 2,443 | 2,519 | ||||||||||||||||||||||||||||||||||||
| Employment growth |
2.3 | 1.6 | 0.6 | (2.9 | ) | 0.9 | 2.7 | 1.1 | (7.3 | ) | 5.1 | 4.9 | 3.7 | 3.1 | ||||||||||||||||||||||||||||||||||
| Unemployment rate |
4.6 | 4.8 | 6.1 | 8.2 | 8.0 | 6.5 | 6.9 | 11.4 | 8.6 | 5.8 | 5.9 | 7.0 | ||||||||||||||||||||||||||||||||||||
| Average weekly earnings ($ / week) |
1,106 | 1,148 | 1,143 | 1,116 | 1,128 | 1,148 | 1,164 | 1,202 | 1,226 | 1,257 | 1,283 | 1,328 | ||||||||||||||||||||||||||||||||||||
| Primary household income a |
6.8 | 6.4 | 3.3 | (10.9 | ) | 4.1 | 1.8 | 2.8 | (4.8 | ) | 6.6 | 10.4 | 5.7 | 7.1 | ||||||||||||||||||||||||||||||||||
| Net corporate operating surplus a |
19.2 | 23.2 | (74.0 | ) | (22.9 | ) | 159.0 | 17.6 | 3.9 | (51.4 | ) | 253.8 | 75.2 | (26.9 | ) | 0.0 | ||||||||||||||||||||||||||||||||
| Housing starts (number of units) |
36,011 | 40,590 | 37,282 | 24,533 | 29,457 | 26,085 | 27,325 | 24,023 | 31,935 | 36,544 | 36,022 | 47,827 | ||||||||||||||||||||||||||||||||||||
| Alberta consumer price index |
1.4 | 2.6 | 1.1 | 1.1 | 1.6 | 2.4 | 1.8 | 1.1 | 3.2 | 6.4 | 3.3 | 2.9 | ||||||||||||||||||||||||||||||||||||
| Population (July 1, thousands) |
3,979 | 4,081 | 4,150 | 4,195 | 4,237 | 4,293 | 4,355 | 4,407 | 4,432 | 4,511 | 4,685 | 4,889 | ||||||||||||||||||||||||||||||||||||
| Population growth |
2.8 | 2.6 | 1.7 | 1.1 | 1.0 | 1.3 | 1.5 | 1.2 | 0.5 | 1.8 | 3.9 | 4.4 | ||||||||||||||||||||||||||||||||||||
| a 2024 is an estimate. |
| |||||||||||||||||||||||||||||||||||||||||||||||
| 2024-25 Final Results | Year-End Report | 13 | |
Historical Fiscal Summary, 2013-14 to 2024-25a
(millions of dollars)
| 1 | 2 | 3 | 4 | 5 | 6 | 7 | 8 | 9 | 10 | 11 | 12 | |||||||||||||||||||||||||||||||||||||||
| Statement of Operations | 2013-14 | 2014-15 | 2015-16 | 2016-17 | 2017-18 | 2018-19 | 2019-20 | 2020-21 | 2021-22 | 2022-23 | 2023-24 |
2024-25 Actual |
||||||||||||||||||||||||||||||||||||||
| Revenue | ||||||||||||||||||||||||||||||||||||||||||||||||||
| 1 |
Personal income tax | 10,537 | 11,042 | 11,357 | 10,763 | 10,775 | 11,874 | 11,244 | 11,257 | 13,335 | 13,925 | 15,160 | 16,120 | |||||||||||||||||||||||||||||||||||||
| 2 |
Corporate income tax | 5,488 | 5,796 | 4,195 | 3,769 | 3,448 | 4,871 | 4,107 | 3,037 | 4,718 | 8,167 | 7,044 | 8,125 | |||||||||||||||||||||||||||||||||||||
| 3 |
Other tax revenue | 4,500 | 4,598 | 5,168 | 5,649 | 6,538 | 6,833 | 5,747 | 5,285 | 5,453 | 4,271 | 4,543 | 6,111 | |||||||||||||||||||||||||||||||||||||
| 4 |
Resource revenue | 9,578 | 8,948 | 2,789 | 3,097 | 4,980 | 5,429 | 5,937 | 3,091 | 16,170 | 25,242 | 19,287 | 21,986 | |||||||||||||||||||||||||||||||||||||
| 5 |
Investment income | 3,423 | 3,113 | 2,544 | 3,698 | 3,126 | 2,349 | 2,828 | 2,643 | 3,579 | 1,334 | 4,587 | 4,803 | |||||||||||||||||||||||||||||||||||||
| 6 |
Premiums, fees and licences | 3,437 | 3,564 | 3,574 | 3,701 | 3,839 | 3,911 | 3,929 | 4,021 | 4,520 | 4,672 | 5,565 | 5,504 | |||||||||||||||||||||||||||||||||||||
| 7 |
Other own-source revenue | 5,412 | 6,438 | 5,850 | 3,637 | 6,983 | 6,292 | 3,360 | 3,272 | 8,952 | 7,008 | 6,216 | 7,202 | |||||||||||||||||||||||||||||||||||||
| 8 |
Total own-source revenue | 42,375 | 43,499 | 35,477 | 34,314 | 39,689 | 41,559 | 37,152 | 32,605 | 56,727 | 64,619 | 62,402 | 69,851 | |||||||||||||||||||||||||||||||||||||
| 9 |
Federal transfers | 7,059 | 5,982 | 7,142 | 7,979 | 7,606 | 8,013 | 9,072 | 10,532 | 11,595 | 11,363 | 12,336 | 12,618 | |||||||||||||||||||||||||||||||||||||
| 10 |
Total Revenue | 49,434 | 49,481 | 42,619 | 42,293 | 47,295 | 49,572 | 46,224 | 43,137 | 68,322 | 75,982 | 74,738 | 82,469 | |||||||||||||||||||||||||||||||||||||
| Expense by Function | ||||||||||||||||||||||||||||||||||||||||||||||||||
| 11 |
Health | 17,967 | 19,366 | 20,115 | 20,687 | 21,239 | 21,921 | 22,408 | 23,984 | 25,143 | 25,486 | 27,447 | 29,560 | |||||||||||||||||||||||||||||||||||||
| 12 |
Basic / advanced education | 12,782 | 13,103 | 13,673 | 14,110 | 14,471 | 14,848 | 14,971 | 14,134 | 14,308 | 15,220 | 16,359 | 17,197 | |||||||||||||||||||||||||||||||||||||
| 13 |
Social services | 4,668 | 4,548 | 4,752 | 5,198 | 5,592 | 5,867 | 6,203 | 5,919 | 5,992 | 7,222 | 8,035 | 8,462 | |||||||||||||||||||||||||||||||||||||
| 14 |
Other program expense | 12,970 | 11,031 | 10,375 | 12,607 | 13,189 | 11,866 | 12,893 | 13,858 | 16,688 | 13,769 | 15,835 | 16,118 | |||||||||||||||||||||||||||||||||||||
| 15 |
Total program expense | 48,387 | 48,048 | 48,915 | 52,602 | 54,491 | 54,502 | 56,475 | 57,895 | 62,131 | 61,691 | 67,676 | 71,337 | |||||||||||||||||||||||||||||||||||||
| 16 |
Debt servicing costs | 601 | 722 | 776 | 1,018 | 1,420 | 1,971 | 2,235 | 2,486 | 2,641 | 2,828 | 3,149 | 3,215 | |||||||||||||||||||||||||||||||||||||
| 17 |
Pension provisions / recovery | 748 | (404 | ) | (630 | ) | (543 | ) | (593 | ) | (190 | ) | (334 | ) | (282 | ) | (365 | ) | (21 | ) | (372 | ) | (403 | ) | ||||||||||||||||||||||||||
| 18 |
Total Expense | 49,736 | 48,366 | 49,061 | 53,077 | 55,318 | 56,283 | 58,376 | 60,099 | 64,407 | 64,498 | 70,453 | 74,149 | |||||||||||||||||||||||||||||||||||||
| 19 |
Surplus / (Deficit) | (302 | ) | 1,115 | (6,442 | ) | (10,784 | ) | (8,023 | ) | (6,711 | ) | (12,152 | ) | (16,962 | ) | 3,915 | 11,484 | 4,285 | 8,320 | ||||||||||||||||||||||||||||||
| Capital Plan b |
5,770 | 6,181 | 6,558 | 6,578 | 9,021 | 6,057 | 5,545 | 6,896 | 6,622 | 5,633 | 6,300 | 7,243 | ||||||||||||||||||||||||||||||||||||||
| Statement of Financial Position |
||||||||||||||||||||||||||||||||||||||||||||||||||
| 20 |
Heritage / endowment funds | 18,562 | 18,860 | 19,262 | 19,836 | 20,306 | 20,700 | 20,670 | 21,090 | 22,176 | 23,920 | 26,158 | 30,349 | |||||||||||||||||||||||||||||||||||||
| 21 |
Contingency Account | 4,658 | 6,529 | 3,625 | 2,299 | 1,661 | 6,342 | - | - | - | - | - | - | |||||||||||||||||||||||||||||||||||||
| 22 |
Other financial assets | 40,039 | 40,688 | 40,990 | 44,152 | 49,010 | 48,701 | 55,711 | 56,996 | 55,950 | 55,570 | 60,731 | 67,586 | |||||||||||||||||||||||||||||||||||||
| 23 |
Taxpayer-supported Capital Plan liabilities | (8,724 | ) | (11,922 | ) | (19,040 | ) | (23,769 | ) | (29,339 | ) | (33,597 | ) | (37,188 | ) | (42,733 | ) | (47,529 | ) | (45,525 | ) | (47,594 | ) | (50,560 | ) | |||||||||||||||||||||||||
| 24 |
Taxpayer-supported operating debt / pre-1992 TPP debt | (1,333 | ) | (1,053 | ) | (1,024 | ) | (10,751 | ) | (19,227 | ) | (29,060 | ) | (36,954 | ) | (50,303 | ) | (45,595 | ) | (33,763 | ) | (34,241 | ) | (34,665 | ) | |||||||||||||||||||||||||
| 25 |
Self-supported debt | (15,775 | ) | (16,592 | ) | (17,373 | ) | (17,822 | ) | (17,848 | ) | (18,134 | ) | (18,066 | ) | (18,398 | ) | (17,028 | ) | (17,596 | ) | (17,715 | ) | (17,257 | ) | |||||||||||||||||||||||||
| 26 |
Total Debt c | (25,832 | ) | (29,567 | ) | (37,437 | ) | (52,342 | ) | (66,414 | ) | (80,791 | ) | (92,208 | ) | (111,434 | ) | (110,152 | ) | (96,884 | ) | (99,550 | ) | (102,482 | ) | |||||||||||||||||||||||||
| 27 |
Pension liabilities | (11,600 | ) | (11,196 | ) | (10,566 | ) | (10,023 | ) | (9,430 | ) | (9,252 | ) | (8,918 | ) | (8,636 | ) | (8,287 | ) | (8,272 | ) | (7,904 | ) | (7,504 | ) | |||||||||||||||||||||||||
| 28 |
Other liabilities | (12,795 | ) | (12,260 | ) | (11,955 | ) | (12,823 | ) | (14,477 | ) | (13,177 | ) | (15,399 | ) | (17,853 | ) | (18,680 | ) | (19,948 | ) | (20,799 | ) | (22,286 | ) | |||||||||||||||||||||||||
| 29 |
Net Financial Assets / (Debt) | 13,032 | 13,054 | 3,919 | (8,901 | ) | (19,344 | ) | (27,477 | ) | (40,144 | ) | (59,837 | ) | (58,993 | ) | (45,614 | ) | (41,364 | ) | (34,337 | ) | ||||||||||||||||||||||||||||
| 30 |
Capital / non-fin. Assets | 40,839 | 42,197 | 44,623 | 46,622 | 49,015 | 50,744 | 51,570 | 54,076 | 55,745 | 56,928 | 57,551 | 58,845 | |||||||||||||||||||||||||||||||||||||
| 31 |
Net Assets / (Liabilities) d | 53,871 | 55,251 | 48,542 | 37,721 | 29,671 | 23,267 | 11,426 | (5,761 | ) | (3,248 | ) | 11,314 | 16,187 | 24,508 | |||||||||||||||||||||||||||||||||||
| Energy prices and exchange rate |
||||||||||||||||||||||||||||||||||||||||||||||||||
| 32 |
Oil price (WTI US$/bbl) | 99.05 | 80.48 | 45.00 | 47.93 | 53.69 | 62.77 | 54.85 | 42.32 | 77.03 | 89.69 | 77.83 | 74.34 | |||||||||||||||||||||||||||||||||||||
| 33 |
Heavy oil price (WCS @ Hardisty; Cdn$/bbl) | 80.11 | 70.78 | 40.86 | 44.67 | 50.38 | 51.65 | 53.14 | 41.42 | 79.63 | 90.62 | 81.67 | 85.21 | |||||||||||||||||||||||||||||||||||||
| 34 |
Natural gas price (ARP; Cdn$/GJ) | 3.28 | 3.51 | 2.21 | 2.01 | 1.82 | 1.34 | 1.39 | 2.10 | 3.48 | 4.63 | 2.07 | 1.11 | |||||||||||||||||||||||||||||||||||||
| 35 |
Exchange rate (US¢/Cdn$) | 94.98 | 88.00 | 76.50 | 76.20 | 78.00 | 76.30 | 75.20 | 75.70 | 79.80 | 75.60 | 74.20 | 71.90 | |||||||||||||||||||||||||||||||||||||
a Numbers are not strictly comparable due to numerous accounting policy changes over time. 2019-20 and 2021-22 expense by function have been re-classified following re-organizations and other adjustments.
b Reflects capital grants and other support included in expense, and capital investment in government-owned assets not included in expense. Capital investment adds to capital assets, which are depreciated over time through amortization expense. Numbers for 2008-09 to 2013-14 are estimates as details required to consolidate SUCH sector capital spending with full accuracy are not readily available.
c Does not include capital lease liabilities, or debt issued on behalf of government business enterprises which is reported on a net equity basis in Other Financial Assets.
d The change in net assets / (debt) year over year does not match the surplus / (deficit) exactly in most years, due to various balance sheet adjustments, most of which are minor. 2021-22 opening amounts were restated to reflect adoption of the Asset Retirement Obligation accounting standard. In 2022-23, Financial Instruments and related standards were implemented resulting in unrealized remeasurement gains and losses being included in Net Assets but not in the surplus/deficit.
| 14 | 2024-25 Final Results | Year-End Report | |
Annual Infrastructure Report
The 2024-25 Capital Plan reached $7.2 billion, an increase of $0.9 billion compared to 2023-24 spending. This supported both new infrastructure development and upgrades to existing capital assets during a time of exceptional population growth.
The 2024-25 capital spending followed a responsible approach during a period of unprecedented growth, balancing the province’s needs with prudent fiscal management to ensure Alberta remains on a sustainable financial path.
The government prioritized strategic investments in the education, health and mental health systems, roadways, bridges, and other public infrastructure to support a growing province.
Highlights include the completion of 12 school projects, roughly 30 bridge projects, 65 road rehabilitation initiatives, 388 housing units, and 17 health facility projects. The plan allocated $1.3 billion to the Capital Maintenance and Renewal (CMR) program aimed at maintaining public infrastructure and delivering programs efficiently to prevent costly repairs or replacements.
New projects announced in 2024-25 included 43 school projects, the Stollery Standalone Children’s Hospital, youth and adult mental health facilities, the NAIT Advanced Skills Centre Planning, Olds College - WJ Elliott Expansion and Renewal, and Kananaskis Area Trails Strategy.
Other significant ongoing projects and programs in various stages of planning, design and construction include the Edmonton and Calgary light rail transit (LRT), Red Deer Polytechnic Centre for Innovation in Manufacturing - Technology Access Centre East Campus Expansion, Highway 3 Twinning (Taber to Burdett), Highway 11 Twinning (Red Deer west to Rocky Mountain House), Recovery Communities, the Affordable Housing Partnership Program, and 87 school projects.
The Aboriginal Business Investment Fund has operated for 10 years. Since 2014, it has provided $58 million for more than 105 community-owned businesses, helping to create nearly 1,000 permanent jobs for Indigenous people in Alberta.
In 2024-25, $10 million was provided for 20 Indigenous community-owned projects across the province.
Capital Plan Initiatives Highlight
The Capital Plan supported several key initiatives in 2024-25.
Economic Development in Rural Alberta Plan
The plan guides rural economic growth, reflecting on innovation, diversification, and sustainable, long-term economic development.
| • | $19 million for the Irrigation Rehabilitation Program which helps irrigation districts to update water infrastructure and optimize current water allocations. |
| • | $236 million in grants under the Strategic Transportation Infrastructure, Water/ Wastewater Partnership and Water for Life programs to support 125 projects in rural communities across Alberta. |
Alberta Petrochemicals Incentive Program (APIP)
APIP invests in petrochemical projects to strengthen and diversify the provincial economy by creating jobs, attracting investments, and increasing the municipal tax base.
| • | $147 million for projects including the Inter-Pipeline – Heartland Petrochemical Complex and Dow Expansion. |
| • | In November 2024, the Rocky Mountain Clean Fuels opened its $173-million synthetic diesel facility in Wheatland County. This project has created 900 jobs and is the first project to be located outside the Edmonton region. |
School Construction Accelerator Program
The government launched the program in fall 2024 to address the growth in the number of K-12 students. The program investment is anticipated to create 200,000 new and modernized student spaces by building up to 90 new schools, modernize or replace up to 24 existing schools, expand the modular classroom program, and expand public charter schools.
| • | Currently, 87 school projects are underway to support over 60,000 new or modernized student spaces. |
Local Government Fiscal Framework (LGFF)
In 2024-25, $724 million was provided to Alberta municipalities with about half (53 per cent) allocated to Calgary and Edmonton and the remainder to other municipalities in Alberta. The LGFF provides funding to Alberta’s municipalities to help them undertake infrastructure projects aligned with their local priorities.
Addressing Mental Health and Addictions
The Alberta Recovery Model provides Albertans, struggling with addiction and mental health issues, access to holistic and long-term treatment.
| • | A total of 11 recovery communities are being established in Alberta. Three recovery communities are open in Red Deer, Lethbridge and Gunn, providing 200 treatment beds. There are eight more recovery communities in development across the province, including five being built in partnership with Indigenous communities. Once complete, these facilities will add more than 500 additional treatment beds. |
| • | Compassionate intervention is an approach to help those who pose a risk of harm to themselves or others. The government initiated work to develop facilities to advance this approach in 2024-25 and passed the Compassionate Intervention Act in May 2025. |
| 2024-25 Final Results | Year-End Report | 15 | |
Budget 2024 Capital Plan Analysis
| Budget 2024 Grant and Investment Spending
The Capital Plan includes:
• Capital Investment – cash spent on acquisition of Government of Alberta capital assets including hospitals, schools, and provincial highways. These transactions are recorded as capital assets on the province’s Statement of Financial Position.
• Capital Grants – cash provided to entities outside of the Government of Alberta for the acquisition of their capital assets, including municipalities, communities and other partners. Examples include the Edmonton and Calgary LRT projects or Strategic Transportation Infrastructure, and Water and Wastewater programs. These transactions are recorded as expenses on the province’s Statement of Operations.
• In 2024-25, Capital Plan spending totaled $7.2 billion, with $4.3 billion or 59 per cent in capital investment and $2.9 billion or 41 per cent in capital grants.
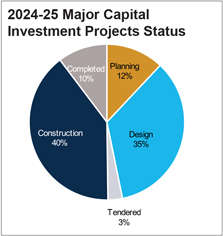
Status of Capital Investment Projects over $5 million as of March 31, 2025
The pie graph below illustrates the status of capital investment projects (excluding capital maintenance and renewal projects).
|
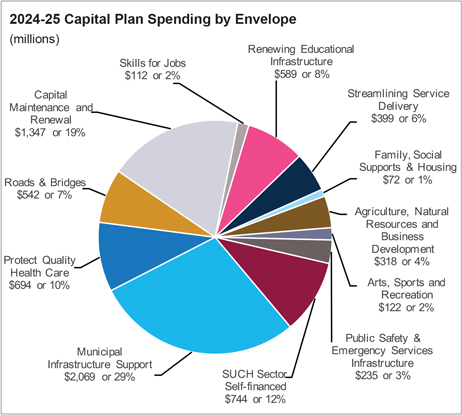
Capital Plan Spending by Envelope
Overall, the 2024-25 Capital Plan envelope spending comprised of:
• $2.1 billion in Municipal Infrastructure Support:
- $762 million in federal and provincial funding for LRT projects.
- $724 million to support municipalities through the LGFF.
- $317 million from federally – funded programs including Canada Community Building Fund and Investing in Canada Infrastructure Program projects.
- $135 million for water supply, treatment, wastewater treatment and disposal system grants.
- $55 million in other municipal capital grants.
- $40 million for municipal roads projects including Terwillegar Expansion and Yellowhead Trail.
- $36 million for the Calgary River District and Event Centre projects. |
• $1.3 billion in Capital Maintenance and Renewal:
- $673 million for bridge and highway rehabilitation; $226 million for Parks, Government Facilities preservation, and Information Technology; $142 million for health facilities; $133 million for post-secondary institutions; $131 million for school facilities; $41 million for family, social support, and housing.
• $0.7 billion for Protect Quality Health Care:
- $375 million for various health equipment and facilities projects including Red Deer Regional Hospital, Provincial Pharmacy Central Drug Production and Distribution Centre, and Medical Equipment Replacement and Upgrade Program.
- $208 million in Continuing Care projects.
- $111 million for Mental Health and Addiction projects primarily for Recovery Communities. | ||
|
| ||||
| 16 | 2024-25 Final Results | Year-End Report | |
| • | $0.6 billion for Renewing Educational Infrastructure: |
| - | 87 school projects currently underway, and 12 completed in 2024-25. |
| • | $0.5 billion for Roads and Bridges: |
| - | $515 million for highway twinning, widening and expansion projects including Deerfoot Trail Upgrades, QEII and 65th Avenue interchange in Leduc, and twinning projects including Highway 3, 11, 40, and 201 Bow River Bridge on SE Stoney Trail. |
| • | $0.4 billion for Streamlining Service Delivery: |
| - | $351 million for General Capital and Information Technology; $48 million for the Alberta Broadband Strategy. |
| • | $0.7 billion in SUCH sector self-financed projects: |
| - | $418 million in projects self-funded by post-secondary institutions; $224 million in health facilities; $94 million in school board self-funded projects, and Technology and Innovation projects. |
| • | $0.9 billion for Agriculture, Natural Resources and Business Development, Public Safety and Emergency Infrastructure, Arts, Sports and Recreation, Skills for Jobs, and Family, Social Supports and Housing. |
2024-25 Budget to Actual Comparison
Capital spending in 2024-25 was $1.1 billion lower than estimated in Budget 2024, mainly due to adjustments and the refining of project cash flows to match project progress and schedules.
| • | Protect Quality Health Care $505 million lower than budgeted: |
| - | $393 million of the variance was from various health facilities including Red Deer Regional Hospital Centre Redevelopment, Arthur J.E. Child Comprehensive Cancer Centre in Calgary, Rockyview General Hospital, and Gene Zwozdesky Centre at Norwood. |
| - | $79 million from recovery communities as project scopes and designs are defined. |
| - | $34 million lower for continuing care projects from planning delays. |
| • | Municipal Infrastructure Support $287 million lower from budget: |
| - | $110 million due to slower than anticipated progress on municipal delivered transportation projects. |
| - | $87 million lower for Edmonton and Calgary LRT projects. |
| - | $66 million Calgary Rivers District and Event Centre due to slower construction progress. |
| - | $22 million for Federal Grant programs including Investing in Canada Infrastructure Program projects and Canada Community – Building Funds. |
| • | Roads and Bridges $55 million lower than budgeted: |
| - | $47 million on West Calgary Ring Road due to timing of construction on the south connection to Highway 8. |
| - | $8 million in highway twinning, widening and expansion projects due to timing of progress. |
| • | Renewing Educational Infrastructure |
| - | $133 million lower than budgeted due to changing project schedules and cash flow timing for various school projects. |
| Capital Plan | Change from | |||||||||||||||||||
| (millions of dollars) | 2024-25 | 2023-24 | 2023-24 | |||||||||||||||||
| BY ENVELOPE | Budget | Actual | Actual | Budget | Actual | |||||||||||||||
| Agriculture, Natural Resources, and Business Development |
434 | 318 | 217 | (116 | ) | 101 | ||||||||||||||
| Arts, Sports and Recreation |
146 | 122 | 151 | (24 | ) | (29 | ) | |||||||||||||
| Capital Maintenance and Renewal |
1,271 | 1,347 | 1,302 | 76 | 45 | |||||||||||||||
| Family, Social Supports and Housing |
192 | 72 | 103 | (120 | ) | (31 | ) | |||||||||||||
| Municipal Infrastructure Support |
2,356 | 2,069 | 1,580 | (287 | ) | 489 | ||||||||||||||
| Protect Quality Health Care |
1,199 | 694 | 376 | (505 | ) | 318 | ||||||||||||||
| Public Safety and Emergency Infrastructure |
220 | 235 | 334 | 15 | (99 | ) | ||||||||||||||
| Renewing Educational Infrastructure |
722 | 589 | 602 | (133 | ) | (13 | ) | |||||||||||||
| Roads and Bridges |
597 | 542 | 514 | (55 | ) | 28 | ||||||||||||||
| Skills for Jobs |
117 | 112 | 83 | (5 | ) | 29 | ||||||||||||||
| Streamlining Service Delivery |
478 | 399 | 305 | (79 | ) | 94 | ||||||||||||||
| Total Capital Plan - Core Government | 7,732 | 6,499 | 5,568 | (1,233 | ) | 931 | ||||||||||||||
| Schools, universities, colleges, health entities |
||||||||||||||||||||
| (SUCH) sector – self-financed investment |
567 | 744 | 732 | 177 | 12 | |||||||||||||||
| Total Capital Plan - Fully Consolidated | 8,299 | 7,243 | 6,300 | (1,056 | ) | 943 | ||||||||||||||
| 2024-25 Final Results | Year-End Report | 17 | |
| • | Family, Social Supports and Housing |
| - | $120 million lower for various projects including the Affordable Housing Partnership Program and Lodge Partnership Program. |
| • | Agriculture, Natural Resources, and Business Development |
$116 million lower than budgeted on various irrigation and water management projects including:
| - | $45 million for Raven Creek Brood Trout Station due to timing of the project. |
| - | $41 million for Alberta Carbon Capture Incentive Program due to lower demand as the program comes to a close. |
| - | $29 million in other re-profiling of funds from the Alberta Petrochemicals Incentive Program and other agriculture and irrigation projects to align with project timelines. |
| • | Streamlining Service Delivery $79 million lower than budgeted primarily due to: |
| - | $51 million for the Alberta Broadband Strategy and $28 million in other government facilities and information technology (IT) related projects primarily due to project schedules and procurement timing. |
| • | Arts, Sports, and Recreation $24 million decrease and Skills for Jobs $5 million decrease to re-align cash flow requirements with project progress and timelines. |
The decrease was partially offset by an increase from budget in several areas:
| • | $178 million increase in self-financed investment by Universities, Schools, Technology and Innovation, and Health (SUCH) entities. This is driven by higher spending on capital projects for post-secondary institutions and donated assets. |
| • | $76 million higher Capital Maintenance and Renewal spending driven by highway rehabilitation, slide repairs, bridge construction, various government facilities, and health facilities projects. |
| • | $15 million higher spending in Public Safety and Emergency Infrastructure fulfilling Alberta’s commitment to support Indigenous police service buildings and other emergent needs. |
| Capital Plan | Change from | |||||||||||||||||||
| (millions of dollars) | 2024-25 | 2023-24 | 2023-24 | |||||||||||||||||
| BY MINISTRY | Budget | Actual | Actual | Budget | Actual | |||||||||||||||
| Advanced Education |
437 | 663 | 575 | 226 | 88 | |||||||||||||||
| Affordability and Utilities |
7 | 7 | 8 | - | (1 | ) | ||||||||||||||
| Agriculture and Irrigation |
97 | 107 | 31 | 10 | 76 | |||||||||||||||
| Arts, Culture and Status of Women |
98 | 91 | 124 | (7 | ) | (33 | ) | |||||||||||||
| Children and Family Services |
3 | 4 | 6 | 1 | (2 | ) | ||||||||||||||
| Education |
946 | 813 | 773 | (133 | ) | 40 | ||||||||||||||
| Energy and Minerals |
228 | 185 | 144 | (43 | ) | 41 | ||||||||||||||
| Environment and Protected Areas |
107 | 53 | 104 | (54 | ) | (51 | ) | |||||||||||||
| Forestry and Parks |
140 | 110 | 75 | (30 | ) | 35 | ||||||||||||||
| Health |
1,201 | 755 | 735 | (446 | ) | 20 | ||||||||||||||
| Indigenous Relations |
10 | 14 | 11 | 4 | 3 | |||||||||||||||
| Infrastructure |
385 | 289 | 351 | (96 | ) | (62 | ) | |||||||||||||
| Jobs, Economy and Trade |
25 | 26 | 14 | 1 | 12 | |||||||||||||||
| Justice |
14 | 11 | 23 | (3 | ) | (12 | ) | |||||||||||||
| Mental Health and Addiction |
140 | 97 | 26 | (43 | ) | 71 | ||||||||||||||
| Municipal Affairs |
1,050 | 1,040 | 765 | (10 | ) | 275 | ||||||||||||||
| Public Safety and Emergency Services |
12 | 11 | 7 | (1 | ) | 4 | ||||||||||||||
| Seniors, Community and Social Services |
444 | 307 | 136 | (137 | ) | 171 | ||||||||||||||
| Service Alberta and Red Tape Reduction |
64 | 41 | 34 | (23 | ) | 7 | ||||||||||||||
| Technology and Innovation |
233 | 174 | 128 | (59 | ) | 46 | ||||||||||||||
| Tourism and Sport |
10 | 10 | - | - | 10 | |||||||||||||||
| Transportation and Economic Corridors |
2,629 | 2,421 | 2,211 | (208 | ) | 210 | ||||||||||||||
| Treasury Board and Finance |
18 | 12 | 18 | (6 | ) | (6 | ) | |||||||||||||
| Legislative Assembly |
1 | 2 | 1 | 1 | 1 | |||||||||||||||
| Total Capital Plan - Fully Consolidated | 8,299 | 7,243 | 6,300 | (1,056 | ) | 943 | ||||||||||||||
| 18 | 2024-25 Final Results | Year-End Report | |
2024-25 Select Completed and Ongoing Projects
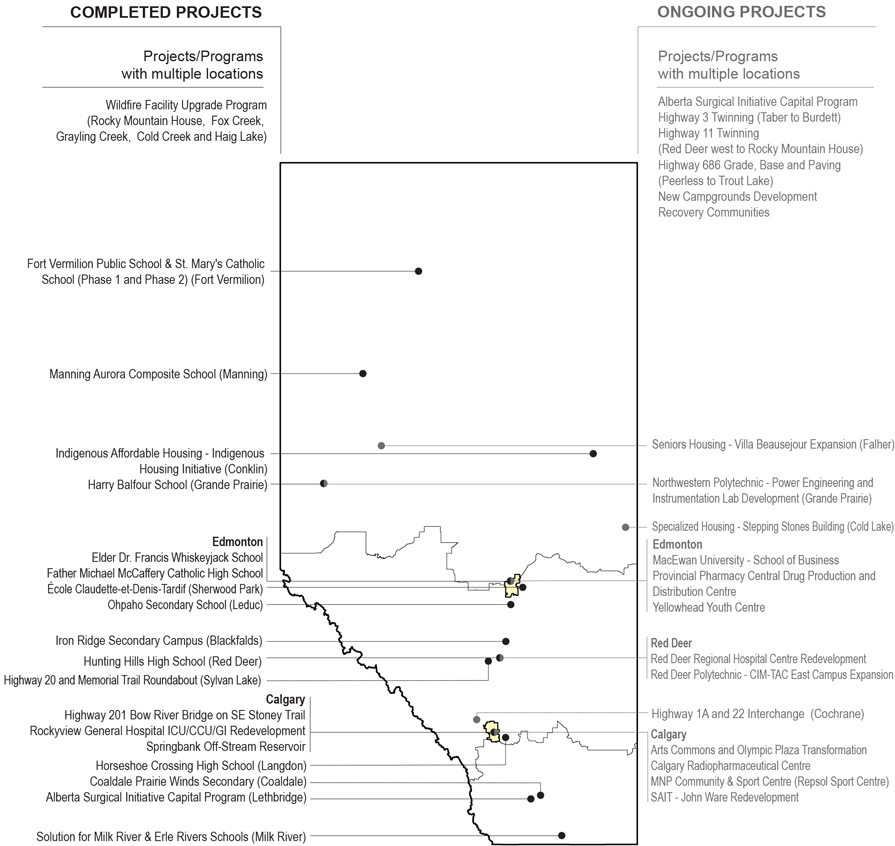
| 2024-25 Final Results | Year-End Report | 19 | |
Year-end Highlights
This section highlights the total projects completed and underway by category, which also includes the total assets existing and in operation in the province as of March 31, 2025.

|
2 health facility projects completed
17 health facility projects in progress |

|
30+ bridge construction and ~65 road rehabilitation projects completed | |||
|
All previously approved health facility projects that include continued renovations, modernizations, expansions and/or redevelopment. |
2 road and bridge expansion projects completed
~64,000 km highway existing (lane kilometres) | |||||
|
11 health facility capital programs in progress
All previously approved health facility capital programs that include multiple projects and initiatives with ongoing implementation. |
|
~4,800 bridge structures existing
388 housing units completed
617 housing units in progress
60,000+ affordable housing units existing | ||||
|
900+ owned or leased buildings Including health facilities, continuing care, community care facilities where health services are provided. | ||||||
|
8 recovery communities (500+ beds) in progress | ||||||
|
3 recovery communities (200 beds) existing |
|
12 school projects completed
87 school projects in progress | ||||

|
4 courthouse projects in progress |
11,000+ new and modernized spaces from school projects completed | ||||
| 77 owned or leased courthouse facilities existing |
60,000+ new and modernized spaces from school projects in progress | |||||
|
10 correctional facilities existing |
1,750+ school buildings existing | |||||
|
6,000+ modular classrooms existing |
| 20 | 2024-25 Final Results | Year-End Report | |
Select Ongoing and Completed Projects - Status as of March 31, 2025
Planning and Design
Total Capital Plan Funding and Expected Completion in planning and design are estimates and subject to change upon finalizing project scope.
Alberta Surgical Initiative Capital Program
Committed as of Budget 2024: $313 million
Expected Completion: TBD
| • | This program will increase provincial surgical capacity and reduce wait times by renovating, improving, and expanding operating rooms and support spaces across the province. Four facilities are in the planning stage and ten facilities in the design stage. |
Beaverlodge Health Centre Replacement
Total Capital Plan Funding: $25 million
Expected Completion: 2028
| • | This project will replace the old Beaverlodge Health Centre with a new complex as an integrated health facility/campus. The new Mountview Health Complex will enable increased collaboration, better coordination of care, and efficiency of services. |
Recovery Communities (Edmonton and Grande Prairie)
Total Capital Plan Funding: $78 million
Expected Completion: TBD
| • | This multi-facility program provides purpose-built facilities for the long-term treatment of Albertans pursuing recovery from addiction. Project planning is underway for a 75-bed facility in Edmonton and a 50-bed facility in Grande Prairie. |
University of Calgary – Multidisciplinary Hub
Total Capital Plan Funding: $220 million
Expected Completion: Summer 2029
| • | The new Multidisciplinary Hub will serve as the primary centre for research and collaboration in the university’s Faculty of Science and will create more student spaces in the fields of science, technology, engineering, and math (STEM). |
NAIT – Advanced Skills Centre Planning
Total Capital Plan Funding: $43 million
Expected Completion: Spring 2027
| • | This project will provide 1.3 million square feet of space for skilled trades learning, allowing NAIT to meet future enrolment growth. |
Olds College – WJ Elliott Expansion and Renovation
Total Capital Plan Funding: $63 million Expected Completion: Fall 2027
| • | This project will renovate existing structure and large labs along with an addition to bring the facility up to modern day building codes and post-secondary institutional standard. |
Telus Spark – World Class Gallery Development (Calgary)
Total Capital Plan Funding: $10 million
Expected Completion: Winter 2028
| • | This project will transform the science center by renovating exhibit halls and educational spaces to create immersive, inclusive, and tech-rich experiences for visitors. |
Kananaskis Area Trail Upgrades
Total Capital Plan Funding: $5 million
Expected Completion: Spring 2028
| • | This project will upgrade existing trails and construct new ones within Kananaskis Country to accommodate increasing visitor numbers, improve the overall outdoor recreation experience, and reduce environmental impacts. |
New Raven Creek Brood Trout Station
Total Capital Plan Funding: $49 million
Expected Completion: TBD
| • | This project will modernize the aging Raven Creek Brood Trout Station to help reduce disease and safety risks, and enable the rearing of species at risk. |
Spruce Grove Supportive Living Lodge
Total Capital Plan Funding: $15 million
Expected Completion: Spring 2026
| • | Construction of 102 seniors lodge supportive living units in Spruce Grove. |
School Projects
| • | There are 87 school projects in various phases of planning, design and construction in 2024-25. |
Construction in Progress
Rural Health Facilities Revitalization Program
Total Capital Plan Funding: $140 million
Expected Completion: 2027
| • | This program delivers smaller strategic projects and renovations in rural health facilities across the province. |
|
The provincial commitment total is $3 billion for LRT projects in Edmonton and Calgary: | ||
|
|
Edmonton - $1.47 billion for the Metro Line LRT Extension, West Valley Line LRT, and Capital Line LRT Extension. | |
|
Calgary - $1.53 billion for the Green Line LRT.
| ||
| 2024-25 Final Results | Year-End Report | 21 | |
| Red Deer Regional Hospital Centre Redevelopment |
Total Capital Plan Funding: $1.8 billion Expected Completion: 2032
| • | This project will expand inpatient capacity, add surgical suites, a cardiac catheterization laboratory, new medical device reprocessing space, additional ambulatory care capacity and increases to other clinical programs. |
Provincial Pharmacy Central Drug Production and Distribution Centre (Edmonton)
Total Capital Plan Funding: $97 million Expected Completion: May 2025
| • | This facility will centralize pharmaceutical production and distribution to supply health care facilities in northern Alberta, improving drug use controls, patient care and safety, and minimizing drug costs. |
Calgary Radiopharmaceutical Centre (formerly Cyclotron Facility - Calgary)
Committed as of Budget 2024: $48 million Expected Completion: TBD
| • | This facility will help save lives by creating medical radioisotopes that are crucial in the treatment of patients with cancer or cardiac conditions. |
Recovery Communities (Indigenous Communities)
Total Capital Plan Funding: $180 million Expected Completion: TBD
| • | In collaboration with Indigenous partners, five recovery communities are under construction in Blood Tribe, Enoch Cree Nation, Métis Nation, Siksika Nation and Tsuut’ina Nation. |
Medical Equipment Replacement and Upgrade Program
Total Capital Plan Funding: $90 million Expected Completion: TBD
| • | This program supports the replacement and upgrade of medical equipment in health facilities across the province. |
Highway 3 Twinning (From Taber to Burdett)
Total Capital Plan Funding: $261 million Expected Completion: Fall 2026
| • | This is part of a multi-phase project that will twin Highway 3. The current phase involves twinning a 46-kilometre section between the Town of Taber and west of the Hamlet of Burdett. |
Highway 11 Twinning (From Red Deer west to Rocky Mountain House)
Total Capital Plan Funding: $368 million Expected Completion: Fall 2029
| • | Highway 11 (David Thompson Highway) will be twinned between Rocky Mountain House and Sylvan Lake, improving access along this popular tourism route. |
Highway 686 Grade, Base and Paving - Peerless to Trout Lake (North/South)
Total Capital Plan Funding: $93 million Expected Completion: Fall 2027
| • | This project will upgrade the gravel road with base paving, construct a new bridge, and correct the alignment. |
Calgary River District, Event Centre and Community Rink
Total Capital Plan Funding: $330 million Expected Completion: Fall 2027
| • | This project provides infrastructure investments, such as land purchases, road and bridge construction, and the demolition of the Saddledome, as part of the $1.2 billion total project cost of the event centre. |
Arts Commons and Olympic Plaza Transformation (Calgary)
Total Capital Plan Funding: $103 million Expected Completion: Winter 2032
| • | This project will expand and modernize Arts Commons in Calgary, including a new facility, upgrades to the existing venue, and revitalization of the Olympic Plaza. |
MNP Community & Sport Centre (formerly Repsol Sport Centre)
Total Capital Plan Funding: $20 million Expected Completion: Winter 2025
| • | The iconic sports facility in Calgary will be modernized, enhancing accessibility and expanding recreational offerings. |
New Campgrounds Development
Total Capital Plan Funding: $52 million Expected Completion: Spring 2033
| • | This program will develop new campgrounds across the province for visitors to connect with nature and community. Development is underway in Lesser Slave Lake Provincial Park, Fish Lake Provincial Recreation Area, Castle Provincial Park, and Writing-on-Stone Provincial Park. |
Red Deer Polytechnic – CIM-TAC East Campus Expansion
Total Capital Plan Funding: $13 million Expected Completion: Fall 2027
| • | This project will create new and innovative teaching and learning spaces at Red Deer Polytechnic, while expanding applied research capacity to support Alberta-based companies. |
SAIT - John Ware Redevelopment (Calgary)
Total Capital Plan Funding: $41 million Expected Completion: Summer 2026
| • | This project will modernize academic spaces, building systems, and infrastructure in the John Ware Building, developing a new Centre of Excellence for SAIT’s culinary program. |
| 22 | 2024-25 Final Results | Year-End Report | |
MacEwan University – School of Business (Edmonton)
Total Capital Plan Funding: $125 million Expected Completion: Winter 2027
| • | The project will create a five-story base building with two additional shell floors for the School of Business. The new building will consolidate all business programs into one location, which will include 30 classrooms, 20 collaboration spaces, and 15 study spaces. |
Northwestern Polytechnic – Power Engineering and Instrumentation Lab Development (Grande Prairie)
Total Capital Plan Funding: $11 million Expected Completion: Summer 2025
| • | This project will expand the power engineering and instrumentation facility with labs, adding approximately 60 new seats. |
Specialized Housing, Cold Lake – Stepping Stones Building
Total Capital Plan Funding: $2 million Expected Completion: Summer 2025
| • | This project will construct a 4-storey emergency shelter, second stage shelter, and community resource building in Cold Lake. |
Seniors Housing, Falher – Villa Beausejour Expansion
Total Capital Plan Funding: $2 million Expected Completion: Spring 2025
| • | This project will construct 20 units of independent living housing for seniors in the District of Smoky River. |
Yellowhead Youth Centre (YYC)
Committed as of Budget 2024: $73 million Expected Completion: Summer 2028
| • | This project includes the redesign and new construction of Alberta’s largest provincial campus-based care facility serving at-risk youth in Edmonton. |
Completed Projects
*Projects are defined as completed when construction has ended, however, they may continue to be supported by the Capital Plan budget due to close out and preoperational costs.
Rockyview General Hospital ICU/CCU/GI Redevelopment (Calgary)
Total Capital Plan Funding: $84 million
| • | Construction is complete for the expansion of the Intensive Care Unit (ICU) and Cardiac Care Unit (CCU) and Gastrointestinal (GI) Clinic. The redevelopment increases single patient units in the ICU and CCU and provides space that better supports patient and family-centered care. |
Alberta Surgical Initiative Capital Program – Lethbridge
Total Capital Plan Funding: $15 million
| • | Construction is complete for the expansion of two operating rooms and more surgical inpatient rooms at the Chinook Regional Hospital. |
Springbank Off-Stream Reservoir
Total Capital Plan Funding: $810 million
| • | The dry reservoir, located approximately 15 kilometres west of Calgary in Rocky View County, will provide flood protection along the Elbow River in Calgary and other downstream communities as part of an overall flood mitigation system. |
Highway 20 and Memorial Trail Roundabout
Total Capital Plan Funding: $6 million
| • | The upgrade is complete to accommodate the growing population and increasing traffic. |
Indigenous Affordable Housing, Conklin – Indigenous Housing Initiative
Total Capital Plan Funding: $4 million
| • | Construction is complete for five four-bedroom units and 10 two-and-three-bedroom units designed for Metis families living in the area. |
Wildfire Facility Upgrade Program
Total Capital Plan Funding: $100 million
| • | This ongoing program supports upgrades to bunkhouses, primary and secondary staging camps, firebases, and lookout towers across the province. In 2024-25, upgrades are completed at fire bases in Rocky Mountain House, Fox Creek, Grayling Creek, Cold Creek and Beaver Lake. |
Highway 201 Bow River Bridge on SE Stoney Trail
Total Capital Plan Funding: $60 million
| • | Widening the existing westbound bridge from 3 lanes to 4 lanes, a new eastbound bridge and a standalone pedestrian crossing. |
School Projects
The following 12 school projects were completed in 2024-25 with total capital plan spending of over $489 million:
| • | Coaldale Prairie Winds Secondary (Coaldale) |
| • | École Claudette-et-Denis-Tardif (Sherwood Park) |
| • | Elder Dr. Francis Whiskeyjack School (Edmonton) |
| • | Father Michael McCaffery Catholic High School (Edmonton) |
| • | Fort Vermilion Public School & St. Mary’s Catholic School (Phase 1 and Phase 2) (Fort Vermilion) |
| • | Harry Balfour School (Grande Prairie) |
| • | Horseshoe Crossing High School (Landon) |
| • | Hunting Hills High School (Red Deer) |
| • | Iron Ridge Secondary Campus (Blackfalds) |
| • | Manning Aurora Composite School (Manning) |
| • | Ohpaho Secondary School (Leduc) |
| • | Solution for Milk River & Erle Rivers Schools (Milk River) |
| 2024-25 Final Results | Year-End Report | 23 | |