Exhibit 99.1
GOVERNMENT OF ALBERTA
Annual Report
Government of Alberta
2024-2025
| ● | Budget 2024 Key Results |
| ● | Consolidated Financial Statements |
| ● | Performance Results |

Exhibit 99.1
GOVERNMENT OF ALBERTA
Annual Report
Government of Alberta
2024-2025
| ● | Budget 2024 Key Results |
| ● | Consolidated Financial Statements |
| ● | Performance Results |
This is the report to Albertans on Budget 2024: A Responsible Plan for a Growing Province.
It is a permanent public record of the revenue, expense and results achieved by the Government of Alberta for the 2024–25 fiscal year.
The Government of Alberta 2024–25 Annual Report consists of three parts:
| • | Budget 2024 Key Results, which provide a description and variance analysis of government’s revenue, spending, assets and liabilities. |
| • | Consolidated Financial Statements, which provide an overall accounting of the government’s revenue and spending, and assets and liabilities. |
| • | Performance Results, which reports on the progress that has been made towards achieving the government’s goals. |
Annual reports for each ministry have also been published, providing additional detailed information on performance and financial results.
©2025 Government of Alberta | Published: June 2025
ISBN 978-1-4601-6304-7
ISSN 2291-6431
This publication is issued under the Open Government Licence – Alberta (http://open.alberta.ca/licence).
Note to Readers: Copies of the annual report are available on the Alberta Open Government Portal website, at https://open.alberta.ca/publications/2291-6431
www.alberta.ca
Preface
The Public Accounts of Alberta are prepared in accordance with the Financial Administration Act and the Sustainable Fiscal Planning and Transparency Act. The Public Accounts consist of the Annual Report of the Government of Alberta and the annual reports of each of the 25 ministries.
This Annual Report of the Government of Alberta contains Budget 2024 Key Results, the audited Consolidated Financial Statements and Performance Results, which compares actual performance results to desired results set out in the government’s strategic plan.
The annual reports of ministries are released concurrently with the Annual Report of the Government of Alberta. The ministry annual reports contain the financial information of the ministries and a comparison of actual performance results to desired results set out in the ministries’ business plans. Each ministry annual report also includes:
| • | Financial statements of entities making up the ministry which includes regulated funds, provincial agencies and Crown-controlled corporations for which the minister is responsible; |
| • | Other financial information as required by the Financial Administration Act and the Sustainable Fiscal Planning and Transparency Act, as separate reports, to the extent that the ministry has anything to report; |
| • | Financial information relating to accountable organizations and trust funds. |
| Government of Alberta | Annual Report 2024–2025 | 1 | |
Table of Contents
| Preface |
1 | |||
| Table of Contents |
2 | |||
| Budget 2024 Key Results |
5 | |||
| Financial Highlights |
7 | |||
| Fiscal Summary |
7 | |||
| Revenue Highlights |
8 | |||
| Expense Highlights |
9 | |||
| Statement of Financial Position |
10 | |||
| Financial Indicators and Risks |
11 | |||
| Historical Fiscal Summary 2013-14 to 2024-25 |
12 | |||
| Consolidated Financial Statements of the Province of Alberta |
13 | |||
| Table of Contents |
15 | |||
| Management’s Responsibility for the Consolidated Financial Statements |
17 | |||
| Independent Auditor’s Report |
18 | |||
| Consolidated Statement of Operations |
25 | |||
| Consolidated Statement of Financial Position |
26 | |||
| Consolidated Statement of Remeasurement Gains and Losses |
27 | |||
| Consolidated Statement of Change in Net Debt |
28 | |||
| Consolidated Statement of Cash Flows |
29 | |||
| Notes to the Consolidated Financial Statements |
30 | |||
| 1 Summary of Significant Accounting Policies and Reporting Practices |
30 | |||
| 2 Valuation of Financial Assets and Liabilities |
39 | |||
| 3 Financial Risk Management |
41 | |||
| 4 Budget and Legislative Authority |
49 | |||
| 5 Contractual Rights |
49 | |||
| 6 Contingent Assets |
50 | |||
| 7 Contractual Obligations and Commitments |
50 | |||
| 8 Contingent Liabilities |
51 | |||
| 9 Trust Funds Under Administration |
54 | |||
| 10 Comparative Figures |
54 | |||
| 2 | Government of Alberta | Annual Report 2024–2025 | |
Table of Contents
| Schedules to the Consolidated Financial Statements |
55 | |||
| 1 Revenues |
55 | |||
| 2 Revenues by Source by Ministry |
56 | |||
| 3 Expenses by Object by Ministry |
57 | |||
| 4 Cash and Cash Equivalents |
58 | |||
| 5 Accounts Receivable and Advances |
58 | |||
| 6 Portfolio Investments |
59 | |||
| 7 Endowment Funds |
60 | |||
| 8 Equity in Government Business Enterprises |
61 | |||
| 9 Loans Receivable |
65 | |||
| 10 Derivative Financial Instruments |
66 | |||
| 11 Accounts Payable and Other Accrued Liabilities |
67 | |||
| 12 Asset Retirement Obligations and Environmental Liabilities |
67 | |||
| 13 Debt |
68 | |||
| 14 Pension Plans and Other Defined Benefit Plans |
72 | |||
| 15 Deferred Contributions |
79 | |||
| 16 Tangible Capital Assets |
80 | |||
| 17 Adjustments to Net Assets - Operating |
81 | |||
| 18 Over-expenditure of Spending Authorities |
82 | |||
| 19 Listing of Organizations |
83 | |||
| Glossary (Unaudited) |
89 | |||
| Performance Results |
95 | |||
| Table of Contents |
96 | |||
| Management’s Responsibility for Reporting |
97 | |||
| Executive Overview |
98 | |||
| Priority One: Securing Alberta’s Future |
100 | |||
| Performance Indicators |
111 | |||
| Priority Two: Standing up for Albertans |
121 | |||
| Performance Indicators |
133 | |||
| Performance Indicators – Sources and Notes |
143 | |||
| Government of Alberta | Annual Report 2024–2025 | 3 | |
BLANK PAGE
| 4 | Government of Alberta | Annual Report 2024–2025 | |
Budget 2024 Key Results
| Government of Alberta | Annual Report 2024–2025 | 5 | |
Table of Contents
| Budget 2024 Key Results |
||||
| Financial Highlights |
7 | |||
| Fiscal Summary |
7 | |||
| Revenue Highlights |
8 | |||
| Expense Highlights |
9 | |||
| Statement of Financial Position |
10 | |||
| Financial Indicators and Risks |
11 | |||
| Historical Fiscal Summary, 2013-14 to 2024-25 |
12 | |||
Note on reclassification:
| • | 2023-24 Actual and 2024-25 Budget and Actual numbers have been reclassified to reflect the revised government structure under the Government Organization Act (Order in Council 234/2024, August 28, 2024, Order in Council 384/2024, December 12, 2024, and Ministerial Order 803/2024, August 28, 2024), and through amendments to Alberta’s Provincial Health Act (Ministerial Orders 701/2024 and 703/2024, June 21, 2024, and Ministerial Orders 330/2024 and 331/2024, November 12, 2024). |
| • | 2023-24 Actual has been reclassified to include $5.85 million in Alberta Enterprise Corporation’s investment-related revenue and expense. The reclassification reflects realized gains in 2023-24, whereas 2024-25 includes realized losses reported as expense. |
| • | 2024-25 budget numbers have been restated to reflect adoption of the new Public Private Partnerships (P3) accounting standard. |
| 6 | Government of Alberta | Annual Report 2024–2025 | |
Financial Highlights
Budget 2024 presented a responsible plan to manage the pressures faced by a growing province by supporting health care and education, and securing the future through a reinvigorated Heritage Fund.
In 2024, Alberta experienced a second year of rapid population growth. Population grew by 4.4 per cent in 2024, following growth of 3.9 per cent in 2023. While this increase in population has supported economic growth, it has also added pressure to government programs and services. In 2024-25, the government focused on health, education and social programs spending. Hot and dry conditions in 2024, following the severe drought in 2023, led to significant wildfires and indemnity payments, income support and emergency relief spending for the agriculture sector.
The 2024-25 results were a surplus of $8.3 billion, an increase of $4 billion from 2023-24 and an increase of $8 billion from Budget 2024, largely from higher resource revenue due to a narrower light-heavy differential and lower exchange rates. The West Texas Intermediate (WTI) oil price averaged US $74.34 per barrel (/bbl) compared to $74.00/bbl at budget.
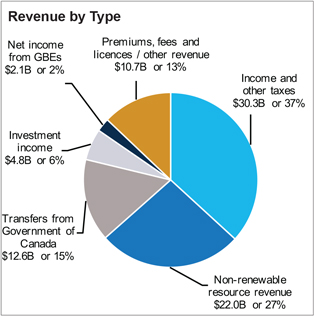
Total Revenue was $82.5 billion, $7.7 billion more than 2023-24 and $8.9 billion more than budget.
Change from 2023-24. Comprises of increases of $3.6 billion in tax revenue, $2.7 billion in
non-renewable resource revenue (NRR), $0.3 billion in federal government transfers, $0.2 billion in investment income, $0.8 billion in government business enterprise net income, and $0.1 billion in premiums, fees, and licences / other revenue.
Change from Budget. Consists of increases of $1.7 billion in tax revenue, $4.7 billion in NRR, $1.5 billion in investment income, and $1.1 billion in premiums, fees and licences / other revenue, offset by slight decrease of $0.1 billion in government business enterprise net income.
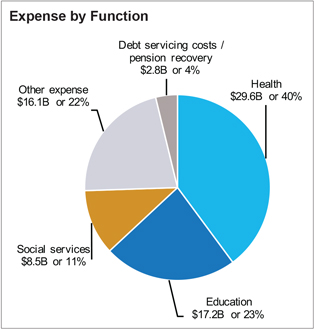
Total Expense was $74.1 billion, $3.7 billion more than 2023-24 and up $1 billion from budget. Budget 2024 included a contingency of $2 billion.
Change from 2023-24. Consists of increases of $2.1 billion in health function expense, $1.3 billion in education and social services function expense, $0.3 billion in other program functions, and minor increase in debt servicing and increase in pension expense.
Change from Budget. Consists of increases of $0.8 billion in health function expense, $0.5 billion in education and social services function expense, and $0.3 billion decreases in other program functions, debt servicing, and pension expense.
Net Financial Debt. At March 31, 2025, net financial debt was $34.3 billion, an improvement of $7.1 billion from $41.4 billion on March 31, 2024. Net debt to GDP in 2024-25 was 7.2 per cent.
| Fiscal Summary | Change from | |||||||||||||||||||
| (millions of dollars) | 2024-25 | 2023-24 | 2023-24 | |||||||||||||||||
| Budget | Actual | Actual | Budget | Actual | ||||||||||||||||
| Revenue |
||||||||||||||||||||
| Income and other taxes |
28,645 | 30,356 | 26,747 | 1,711 | 3,609 | |||||||||||||||
| Non-renewable resource revenue |
17,315 | 21,986 | 19,287 | 4,671 | 2,699 | |||||||||||||||
| Transfers from Government of Canada |
12,640 | 12,618 | 12,336 | (21 | ) | 283 | ||||||||||||||
| Net Investment income |
3,267 | 4,803 | 4,587 | 1,536 | 216 | |||||||||||||||
| Net income / (loss) from government business enterprises |
2,123 | 2,053 | 1,237 | (70 | ) | 816 | ||||||||||||||
| Premiums, fees and licences / other revenue |
9,548 | 10,653 | 10,544 | 1,106 | 108 | |||||||||||||||
| Total Revenue |
73,537 | 82,469 | 74,738 | 8,932 | 7,731 | |||||||||||||||
| Expense by Function |
||||||||||||||||||||
| Health |
28,732 | 29,560 | 27,447 | 828 | 2,113 | |||||||||||||||
| Education |
17,004 | 17,197 | 16,359 | 193 | 838 | |||||||||||||||
| Social Services |
8,143 | 8,462 | 8,035 | 319 | 427 | |||||||||||||||
| Other (Budget incl. 2.0 billion contingency) |
16,278 | 16,118 | 15,835 | (160 | ) | 283 | ||||||||||||||
| Total Program Expense |
70,157 | 71,337 | 67,676 | 1,180 | 3,661 | |||||||||||||||
| Debt servicing costs |
3,389 | 3,215 | 3,149 | (175 | ) | 65 | ||||||||||||||
| Pension recovery |
(364 | ) | (403 | ) | (372 | ) | (39 | ) | (31 | ) | ||||||||||
| Total Expense |
73,182 | 74,149 | 70,453 | 967 | 3,695 | |||||||||||||||
| Surplus |
355 | 8,320 | 4,285 | 7,965 | 4,036 | |||||||||||||||
| Net Financial Debt |
(42,092 | ) | (34,337 | ) | (41,364 | ) | 7,755 | 7,027 | ||||||||||||
| Government of Alberta | Annual Report 2024–2025 | 7 | |
Revenue Highlights
| · | Total 2024-25 revenue was $82.5 billion, $7.7 billion higher than in 2023-24 and $8.9 billion higher than budget. |
| · | Personal and corporate income tax revenue totaled $24.2 billion, comprising $16.1 billion in personal income tax (PIT) and $8.1 billion in corporate income tax (CIT). PIT increased $1 billion and $0.5 billion from 2023-24 and budget respectively, which can be attributed to strong growth in personal incomes and population. CIT increased $1.1 billion from both 2023-24 and budget mainly due to strong corporate profits and increases in interest and penalties due to larger tax reassessments. |
| · | Other tax revenue was $6.1 billion in 2024-25 comprising: $2.8 billion in education property tax and $3.3 billion in fuel, tobacco, insurance and other taxes. Fuel tax relief was provided to consumers in the prior fiscal year, which resulted in an increase of $1.2 billion from 2023-24 as the fuel tax was collected for the entire fiscal year in 2024-25. |
| · | NRR in 2024-25 was $22 billion, an increase of $2.7 billion from 2023-24 revenue and $4.7 billion from budget. Bitumen royalty in 2024-25 was $17.2 billion, an increase of $2.6 billion from 2023-24 and $4.6 billion from budget. The increases were primarily due to a lower exchange rate, narrower light-heavy differential, and lower cost due, in part, to lower natural gas prices. |
| · | The West Texas Intermediate (WTI) oil price averaged US$74.34 per barrel (/bbl) in 2024-25, down $3.49/bbl from 2023-24, but $0.34/bbl higher than the budget estimate. The light-heavy oil price differential averaged US$13.06/bbl in 2024-25, $4.23 narrower than in 2023-24, influenced by increased demand for heavier crude and the completion of the TMX project. |
| · | Federal government transfers in 2024-25 were $12.6 billion, $0.3 billion higher than in 2023-24 and remained steady compared to budget. The increase was mainly the result of the province’s larger revenue share of the Canada Health Transfer (CHT) and Canada Social Transfer (CST), as well as additional federal |
| funding received for the Canada-Alberta Canada- Wide Early Learning Child Care agreements. The increase from the prior year is partially offset by Alberta not qualifying for fiscal stabilization in 2024-25, after receiving $0.6 billion in 2023-24, and end of the pandemic-related CHT top-up payments. |
| · | Investment income was $4.8 billion, $0.2 billion higher than 2023-24 and $1.5 billion higher than budget, mainly due to conservative budget assumptions and strong performances of various equity investments. |
| · | Government business enterprise net income was $2.1 billion in 2024-25, an increase of $0.8 billion from 2023-24 and a decrease of $0.1 billion from budget. The increase is primarily a result of the Alberta Petroleum Marketing Corporation recognizing a $1.2 billion non-cash adjustment to the Sturgeon Refinery Processing Agreement Provision in 2023-24 due to changes in the onerous contract provision. |
| · | Other revenue totaled $10.7 billion, $0.1 billion more than 2023-24, and $1.1 billion higher than budget. The increase includes higher revenue from post-secondary institution tuition fees, increased number of AHS patients that were billable to non-residents and other responsible parties and reporting a portion of the settlement of tobacco litigation, offset by decreases in the Technology Innovation and Emissions Reduction Fund compliance payments due to changes in market conditions. |
| 8 | Government of Alberta | Annual Report 2024–2025 | |
Expense Highlights
| · | Total expense in 2024-25 was $74.1 billion, including $1.9 billion in disaster and emergency assistance. Expense increased by $1 billion from budget and increased $3.7 billion from prior year. The $2.0 billion contingency included in Budget 2024 was fully utilized in 2024-25. |
| · | Health function expense was $29.6 billion, an increase of $2.1 billion from 2023-24 and $0.8 billion from Budget 2024. Alberta’s health care system continues to face pressures, primarily due to growing clinical demands, workforce challenges, and a rising population, with inflation adding to the strain. Increases are mainly from higher physician volumes and service utilization, increased clinical activity and patient volumes across care areas, collective bargaining and overtime, greater benefit and drug utilization, expanded continuing care funding, and increased demand for additional health services. |
| · | Total education function expense was $17.2 billion in 2024-25, $0.8 billion higher than 2023-24, and $0.2 billion higher than Budget 2024. This comprises $9.9 billion for K-12 education and $7.2 billion for post-secondary and skills and training programs. The increase from 2023-24 reflects higher enrolment, resulting in greater expenditures on teaching staff, educational assistants, and support services. Public post-secondary institutions experienced increased costs in research-related activities and program expansions. |
| · | Social services expense was $8.5 billion, an increase of $0.4 billion from 2023-24, and $0.3 billion higher than budget. The increase from 2023-24 was primarily due to rising caseloads and related program costs, new expense tied to homelessness task force priorities and operations of Navigation and Support Centres, as well as higher capital grants for continuing care and independent housing projects. Additional increases were related to child care affordability and access, and initiatives to support child care quality and the workforce. These were partially offset by reduced spending on Indigenous and affordable housing due to project re-profiling and |
| on the Affordability Support Payments program, which ended in June 2023. |
| · | Other expense was $16.1 billion, an increase of $0.3 billion from 2023-24, and a $0.2 billion decrease from budget. Increases were primarily driven by higher spending for resource development and orphan well management, as well as additional capital funding under the new Local Government Fiscal Framework Capital program. Protection of persons and property increased due to police support grants, though overall spending declined from the prior year due to reduced emergency management activity. These increases were partially offset by lower spending in emissions management and slower than anticipated construction progress by municipalities on several projects, including Edmonton and Calgary LRTs. |
| · | Debt servicing costs were $3.2 billion, an increase of $0.1 billion from 2023-24 and $0.2 billion lower than budget. This is mainly due to lower-than expected borrowing requirements as a result of the higher surplus. |
| · | Public sector pension plan liabilities decreased by $0.4 billion to $7.5 billion at March 31, 2025. |
| Government of Alberta | Annual Report 2024–2025 | 9 | |
Statement of Financial Position
| · | At March 31, 2025, total assets exceeded liabilities by $24.5 billion. This was an improvement of $8.3 billion from $16.2 billion on March 31, 2024, mainly due to a $6.3 billion increase in portfolio investments netted against $2.9 billion increase in debt. Net Assets consists of $21 billion in net assets and accumulated remeasurement gains of $3.5 billion. |
| · | Financial assets were $97.9 billion, an increase of $11 billion from March 31, 2024. Changes include a $6.3 billion increase in portfolio investments mainly from increased investment and growth in the market value of the Alberta Heritage Savings Trust Fund, a $1.1 billion increase in loans and other receivables, and a $3.7 billion increase in cash and cash equivalents. |
| · | Liabilities were $132.3 billion at year-end, $4 billion higher than on March 31, 2024, due to a $2.9 billion increase in debt and a $1.1 billion increase in other liabilities. |
| · | Capital / other non-financial assets, net of spent deferred capital contributions, amounted to $58.8 billion on March 31, 2025, an increase of $1.3 billion from the prior year-end, reflecting $4.3 billion in capital asset acquisition, offset by $3 billion in accounting adjustments, |
amortization and disposals. Major capital investment projects included:
| - | $1.3 billion for capital maintenance and renewal of key provincial assets including $0.7 billion for the provincial highway network, $0.2 billion for Parks, Government Facilities preservation, $0.3 billion for health facilities, school facilities and other provincial assets. |
| - | $0.7 billion in SUCH Sector Self-Financed capital spending. |
| - | $0.6 billion for K-12 schools, modernization and modular classrooms, with 12 school projects completed and 87 underway. |
| - | $0.5 billion in various road and bridge projects. |
| - | $0.4 billion for health facilities including completion of the Rockyview General Hospital Redevelopment project. |
| - | $0.3 billion for Information Technology and other capital projects. |
| - | $0.2 billion in public safety, emergency services and disaster mitigation, including $0.1 billion for completing Springbank Off-Stream Reservoir. |
| Summary Statement of Financial Position | at March 31 | |||||||||||
| (millions of dollars) | 2025 | 2024 | Change from | |||||||||
| Actual | Actual | 2024 | ||||||||||
| Financial Assets |
||||||||||||
| Cash and cash equivalents |
9,147 | 5,461 | 3,686 | |||||||||
| Portfolio investments |
53,568 | 47,310 | 6,258 | |||||||||
| Loans receivable |
21,276 | 21,246 | 30 | |||||||||
| Other |
13,944 | 12,872 | 1,072 | |||||||||
| 97,935 | 86,889 | 11,046 | ||||||||||
| Liabilities |
||||||||||||
| Debt |
102,707 | 99,793 | 2,914 | |||||||||
| Pension liabilities |
7,504 | 7,904 | (400 | ) | ||||||||
| Other |
22,061 | 20,556 | 1,505 | |||||||||
| 132,272 | 128,253 | 4,019 | ||||||||||
| Net Financial Debt |
(34,337 | ) | (41,364 | ) | 7,027 | |||||||
| Capital / Other Non-financial Assets |
62,925 | 61,515 | 1,410 | |||||||||
| Spent deferred capital contributions |
(4,080 | ) | (3,964 | ) | (116 | ) | ||||||
| Net Assets |
24,508 | 16,187 | 8,321 | |||||||||
| Net Assets - statement of operations |
20,966 | 12,649 | ||||||||||
| Accumulated remeasurement gains |
3,542 | 3,538 | ||||||||||
| Change in Net Assets - stmt. of operations |
8,317 | 4,149 | ||||||||||
Change in Net Assets - stmt. Of operations differ from the surplus numbers due to net assets adjustments (2025: $(3) million; 2024: ($136) million) on the adoption of PS 3160 Public Private Partnerships (P3), PS 3400 Revenue and PSG-8 Purchased Intangibles accounting standards (see Schedule 17, p.81 of the 2024-25 Consolidated Financial Statements respectively).
| 10 | Government of Alberta | Annual Report 2024–2025 | |
Financial Indicators and Risks
| · | Net financial debt was $34.3 billion, or $6,896 per Albertan on March 31, 2025, a deterioration of $38.3 billion since March 31, 2016, when the province was last in a net financial assets position, but is an improvement of $7 billion since March 31, 2024. Alberta’s fiscal position in 2024-25 continues to reflect the economic and revenue volatility of the province, including past economic shocks which contributed to a significant addition of debt. However, the province has gradually improved its financial position through strong population-driven economic activity and moderated spending contributing to in surpluses in recent years. |
| · | Revenue in 2024-25 reached a record high of $82.5 billion, marking a 10.3 per cent increase over the previous year’s $74.7 billion. This represents a dramatic improvement from 2020-21, when revenue stood at just $43.1 billion, reflecting the province’s strengthened economic performance and improved resource revenues. |
| · | Expense in 2024-25 was $74.1 billion, up from $60.1 billion in 2020-21. This represents a 23.4 per cent increase over four years, or an average annual rate of 5.8 per cent, reflecting rising costs across core public services and population-driven demand. |
| · | Cost drivers, both expected and unpredictable, persisted in 2024-25, with health, education, and social services facing increased demand, and emergency response costs rising due to another severe wildfire season and agriculture sector support. These pressures, alongside population growth and inflationary impacts, led to higher-than-expected spending across multiple ministries. |
| · | Alberta heavily depends on revenue streams that are subject to significant volatility, particularly non-renewable resource royalties, corporate income tax, and other taxes. Revenue volatility is driven by a variety of factors, several of which are outlined below. |
| · | Oil prices are impacted by global supply and demand and have been volatile in recent years due to the global economic conditions and |
Oil and Natural Gas Prices 2021-25
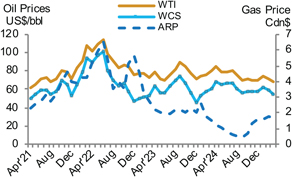
| geopolitical tensions. Oil prices have pulled back since the 2022-23 high but have remained solid. Production climbed to a new record in 2024 as export capacity increased through the completion of TMX. |
| · | Other factors typically influencing energy prices include pipeline or refinery outages, speculative trading, OPEC + supply management, U.S. producer responses to price swings, drilling and investment decisions, Environmental, Social and Governance metrics, economic sanctions, and weather-related disruptions. |
| · | Lower interest rates typically encourage business investments and decrease debt servicing costs. The Bank of Canada reduced its interest rate to 2.75 per cent which was the second cut for 2025, reflecting ongoing trade uncertainties with U.S. A lower exchange rate improved the value of Alberta’s exports, while equity market performance is affected by a wide range of factors. These all add risk to Alberta government fiscal planning. |
| · | Changes in corporate income tax revenue can be difficult to predict as corporate taxable income can vary significantly due to adjustments to estimates of corporate income tax refunds and the carry forward and back of prior year losses. |
| · | To address the revenue and expense uncertainty, a voted, transferable contingency was introduced in Budget 2019. The contingency was budgeted at $2 billion in 2024-25, an increase of $0.5 billion from 2023-24. The government is continuing to adhere to the fiscal framework introduced in Budget 2023 by limiting expense growth, with allowable exceptions to address this uncertainty. |
| Government of Alberta | Annual Report 2024–2025 | 11 | |
Historical Fiscal Summary, 2013-14 to 2024-25 a
(millions of dollars)
| Statement of Operations | 2013-14 | 2014-15 | 2015-16 | 2016-17 | 2017-18 | 2018-19 | 2019-20 | 2020-21 | 2021-22 | 2022-23 | 2023-24 | 2024-25 Actual |
||||||||||||||||||||||||||||||||||||||
| Revenue | ||||||||||||||||||||||||||||||||||||||||||||||||||
| 1 |
Personal income tax | 10,537 | 11,042 | 11,357 | 10,763 | 10,775 | 11,874 | 11,244 | 11,257 | 13,335 | 13,925 | 15,160 | 16,120 | |||||||||||||||||||||||||||||||||||||
| 2 |
Corporate income tax | 5,488 | 5,796 | 4,195 | 3,769 | 3,448 | 4,871 | 4,107 | 3,037 | 4,718 | 8,167 | 7,044 | 8,125 | |||||||||||||||||||||||||||||||||||||
| 3 |
Other tax revenue | 4,500 | 4,598 | 5,168 | 5,649 | 6,538 | 6,833 | 5,747 | 5,285 | 5,453 | 4,271 | 4,543 | 6,111 | |||||||||||||||||||||||||||||||||||||
| 4 |
Resource revenue | 9,578 | 8,948 | 2,789 | 3,097 | 4,980 | 5,429 | 5,937 | 3,091 | 16,170 | 25,242 | 19,287 | 21,986 | |||||||||||||||||||||||||||||||||||||
| 5 |
Investment income | 3,423 | 3,113 | 2,544 | 3,698 | 3,126 | 2,349 | 2,828 | 2,643 | 3,579 | 1,334 | 4,587 | 4,803 | |||||||||||||||||||||||||||||||||||||
| 6 |
Premiums, fees and licences | 3,437 | 3,564 | 3,574 | 3,701 | 3,839 | 3,911 | 3,929 | 4,021 | 4,520 | 4,672 | 5,565 | 5,504 | |||||||||||||||||||||||||||||||||||||
| 7 |
Other own-source revenue | 5,412 | 6,438 | 5,850 | 3,637 | 6,983 | 6,292 | 3,360 | 3,272 | 8,952 | 7,008 | 6,216 | 7,202 | |||||||||||||||||||||||||||||||||||||
| 8 |
Total own-source revenue | 42,375 | 43,499 | 35,477 | 34,314 | 39,689 | 41,559 | 37,152 | 32,605 | 56,727 | 64,619 | 62,402 | 69,851 | |||||||||||||||||||||||||||||||||||||
| 9 |
Federal transfers | 7,059 | 5,982 | 7,142 | 7,979 | 7,606 | 8,013 | 9,072 | 10,532 | 11,595 | 11,363 | 12,336 | 12,618 | |||||||||||||||||||||||||||||||||||||
| 10 |
Total Revenue | 49,434 | 49,481 | 42,619 | 42,293 | 47,295 | 49,572 | 46,224 | 43,137 | 68,322 | 75,982 | 74,738 | 82,469 | |||||||||||||||||||||||||||||||||||||
| Expense by Function | ||||||||||||||||||||||||||||||||||||||||||||||||||
| 11 |
Health | 17,967 | 19,366 | 20,115 | 20,687 | 21,239 | 21,921 | 22,408 | 23,984 | 25,143 | 25,486 | 27,447 | 29,560 | |||||||||||||||||||||||||||||||||||||
| 12 |
Basic / advanced education | 12,782 | 13,103 | 13,673 | 14,110 | 14,471 | 14,848 | 14,971 | 14,134 | 14,308 | 15,220 | 16,359 | 17,197 | |||||||||||||||||||||||||||||||||||||
| 13 |
Social services | 4,668 | 4,548 | 4,752 | 5,198 | 5,592 | 5,867 | 6,203 | 5,919 | 5,992 | 7,222 | 8,035 | 8,462 | |||||||||||||||||||||||||||||||||||||
| 14 |
Other program expense | 12,970 | 11,031 | 10,375 | 12,607 | 13,189 | 11,866 | 12,893 | 13,858 | 16,688 | 13,769 | 15,835 | 16,118 | |||||||||||||||||||||||||||||||||||||
| 15 |
Total program expense | 48,387 | 48,048 | 48,915 | 52,602 | 54,491 | 54,502 | 56,475 | 57,895 | 62,131 | 61,691 | 67,676 | 71,337 | |||||||||||||||||||||||||||||||||||||
| 16 |
Debt servicing costs | 601 | 722 | 776 | 1,018 | 1,420 | 1,971 | 2,235 | 2,486 | 2,641 | 2,828 | 3,149 | 3,215 | |||||||||||||||||||||||||||||||||||||
| 17 |
Pension provisions / recovery | 748 | (404 | ) | (630 | ) | (543 | ) | (593 | ) | (190 | ) | (334 | ) | (282 | ) | (365 | ) | (21 | ) | (372 | ) | (403 | ) | ||||||||||||||||||||||||||
| 18 |
Total Expense | 49,736 | 48,366 | 49,061 | 53,077 | 55,318 | 56,283 | 58,376 | 60,099 | 64,407 | 64,498 | 70,453 | 74,149 | |||||||||||||||||||||||||||||||||||||
| 19 |
Surplus / (Deficit) | (302 | ) | 1,115 | (6,442 | ) | (10,784 | ) | (8,023 | ) | (6,711 | ) | (12,152 | ) | (16,962 | ) | 3,915 | 11,484 | 4,285 | 8,320 | ||||||||||||||||||||||||||||||
| Capital Plan b |
5,770 | 6,181 | 6,558 | 6,578 | 9,021 | 6,057 | 5,545 | 6,896 | 6,622 | 5,633 | 6,300 | 7,243 | ||||||||||||||||||||||||||||||||||||||
| Statement of Financial Position (at March 31) | ||||||||||||||||||||||||||||||||||||||||||||||||||
| 20 |
Heritage / endowment funds | 18,562 | 18,860 | 19,262 | 19,836 | 20,306 | 20,700 | 20,670 | 21,090 | 22,176 | 23,920 | 26,158 | 30,349 | |||||||||||||||||||||||||||||||||||||
| 21 |
Contingency Account | 4,658 | 6,529 | 3,625 | 2,299 | 1,661 | 6,342 | - | - | - | - | - | - | |||||||||||||||||||||||||||||||||||||
| 22 |
Other financial assets | 40,039 | 40,688 | 40,990 | 44,152 | 49,010 | 48,701 | 55,711 | 56,996 | 55,950 | 55,570 | 60,731 | 67,586 | |||||||||||||||||||||||||||||||||||||
| 23 |
Taxpayer-supported Capital Plan liabilities | (8,724 | ) | (11,922 | ) | (19,040 | ) | (23,769 | ) | (29,339 | ) | (33,597 | ) | (37,188 | ) | (42,733 | ) | (47,529 | ) | (45,525 | ) | (47,594 | ) | (50,560 | ) | |||||||||||||||||||||||||
| 24 |
Taxpayer-supported operating debt / pre-1992 TPP debt | (1,333 | ) | (1,053 | ) | (1,024 | ) | (10,751 | ) | (19,227 | ) | (29,060 | ) | (36,954 | ) | (50,303 | ) | (45,595 | ) | (33,763 | ) | (34,241 | ) | (34,665 | ) | |||||||||||||||||||||||||
| 25 |
Self-supported debt | (15,775 | ) | (16,592 | ) | (17,373 | ) | (17,822 | ) | (17,848 | ) | (18,134 | ) | (18,066 | ) | (18,398 | ) | (17,028 | ) | (17,596 | ) | (17,715 | ) | (17,257 | ) | |||||||||||||||||||||||||
| 26 |
Total Debt c |
(25,832 | ) | (29,567 | ) | (37,437 | ) | (52,342 | ) | (66,414 | ) | (80,791 | ) | (92,208 | ) | (111,434 | ) | (110,152 | ) | (96,884 | ) | (99,550 | ) | (102,482 | ) | |||||||||||||||||||||||||
| 27 |
Pension liabilities | (11,600 | ) | (11,196 | ) | (10,566 | ) | (10,023 | ) | (9,430 | ) | (9,252 | ) | (8,918 | ) | (8,636 | ) | (8,287 | ) | (8,272 | ) | (7,904 | ) | (7,504 | ) | |||||||||||||||||||||||||
| 28 |
Other liabilities | (12,795 | ) | (12,260 | ) | (11,955 | ) | (12,823 | ) | (14,477 | ) | (13,177 | ) | (15,399 | ) | (17,853 | ) | (18,680 | ) | (19,948 | ) | (20,799 | ) | (22,286 | ) | |||||||||||||||||||||||||
| 29 |
Net FinancialAssets / (Debt) | 13,032 | 13,054 | 3,919 | (8,901 | ) | (19,344 | ) | (27,477 | ) | (40,144 | ) | (59,837 | ) | (58,993 | ) | (45,614 | ) | (41,364 | ) | (34,337 | ) | ||||||||||||||||||||||||||||
| 30 |
Capital / non-fin. Assets | 40,839 | 42,197 | 44,623 | 46,622 | 49,015 | 50,744 | 51,570 | 54,076 | 55,745 | 56,928 | 57,551 | 58,845 | |||||||||||||||||||||||||||||||||||||
| 31 |
Net Assets / (Liabilities) d | 53,871 | 55,251 | 48,542 | 37,721 | 29,671 | 23,267 | 11,426 | (5,761 | ) | (3,248 | ) | 11,314 | 16,187 | 24,508 | |||||||||||||||||||||||||||||||||||
| Energy prices and exchange rate | ||||||||||||||||||||||||||||||||||||||||||||||||||
| 32 |
Oil price (WTI US$/bbl) | 99.05 | 80.48 | 45.00 | 47.93 | 53.69 | 62.77 | 54.85 | 42.32 | 77.03 | 89.69 | 77.83 | 74.34 | |||||||||||||||||||||||||||||||||||||
| 33 |
Heavy oil price (WCS @ Hardisty; Cdn$/bbl) | 80.11 | 70.78 | 40.86 | 44.67 | 50.38 | 51.65 | 53.14 | 41.42 | 79.63 | 90.62 | 81.67 | 85.21 | |||||||||||||||||||||||||||||||||||||
| 34 |
Natural gas price (ARP; Cdn$/GJ) | 3.28 | 3.51 | 2.21 | 2.01 | 1.82 | 1.34 | 1.39 | 2.10 | 3.48 | 4.63 | 2.07 | 1.11 | |||||||||||||||||||||||||||||||||||||
| 35 |
Exchange rate (US¢/Cdn$) | 94.98 | 88.00 | 76.50 | 76.20 | 78.00 | 76.30 | 75.20 | 75.70 | 79.80 | 75.60 | 74.20 | 71.90 | |||||||||||||||||||||||||||||||||||||
| a | Numbers are not strictly comparable due to numerous accounting policy changes over time. 2019-20 and 2021-22 expense by function have been re-classified following re-organizations and other adjustments. |
| b | Reflects capital grants and other support included in expense, and capital investment in government-owned assets not included in expense. Capital investment adds to capital assets, which are depreciated over time through amortization expense. Numbers for 2013-14 are estimates as details required to consolidate SUCH sector capital spending with full accuracy are not readily available. |
| c | Does not include capital lease liabilities, or debt issued on behalf of government business enterprises which is reported on a net equity basis in Other Financial Assets. |
| d | The change in net assets / (debt) year over year does not match the surplus / (deficit) exactly in most years, due to various balance sheet adjustments, most of which are minor. 2021-22 opening amounts were restated to reflect adoption of the Asset Retirement Obligation accounting standard. In 2022-23, Financial Instruments and related standards were implemented resulting in unrealized remeasurement gains and losses being included in Net Assets but not in the surplus/deficit. |
| 12 | Government of Alberta | Annual Report 2024–2025 | |
Consolidated Financial Statements
| Government of Alberta | Annual Report 2024–2025 | 13 | |
BLANK PAGE
| 14 | Government of Alberta | Annual Report 2024–2025 | |
CONSOLIDATED FINANCIAL STATEMENTS
Table of Contents
| CONSOLIDATED FINANCIAL STATEMENTS OF THE PROVINCE OF ALBERTA |
||||||||||
| Table of Contents | ||||||||||
| Management’s Responsibility for the Consolidated Financial Statements |
17 | |||||||||
| Independent Auditor’s Report |
18 | |||||||||
| Consolidated Statement of Operations |
25 | |||||||||
| Consolidated Statement of Financial Position |
26 | |||||||||
| Consolidated Statement of Remeasurement Gains and Losses |
27 | |||||||||
| Consolidated Statement of Change in Net Debt |
28 | |||||||||
| Consolidated Statement of Cash Flows |
29 | |||||||||
| Notes to the Consolidated Financial Statements |
||||||||||
| 1 | Summary of Significant Accounting Policies and Reporting Practices | 30 | ||||||||
| 2 | Valuation of Financial Assets and Liabilities | 39 | ||||||||
| 3 | Financial Risk Management | 41 | ||||||||
| 4 | Budget and Legislative Authority | 49 | ||||||||
| 5 | Contractual Rights | 49 | ||||||||
| 6 | Contingent Assets | 50 | ||||||||
| 7 | Contractual Obligations and Commitments | 50 | ||||||||
| 8 | Contingent Liabilities | 51 | ||||||||
| 9 | Trust Funds under Administration | 54 | ||||||||
| 10 | Comparative Figures | 54 | ||||||||
| Schedules to the Consolidated Financial Statements |
||||||||||
| 1 | Revenues | 55 | ||||||||
| 2 | Revenues by Source by Ministry | 56 | ||||||||
| 3 | Expenses by Object by Ministry | 57 | ||||||||
| 4 | Cash and Cash Equivalents | 58 | ||||||||
| 5 | Accounts Receivable and Advances | 58 | ||||||||
| 6 | Portfolio Investments | 59 | ||||||||
| 7 | Endowment Funds | 60 | ||||||||
| 8 | Equity in Government Business Enterprises | 61 | ||||||||
| 9 | Loans Receivable. | 65 | ||||||||
| 10 | Derivative Financial Instruments | 66 | ||||||||
| 11 | Accounts Payable and Other Accrued Liabilities | 67 | ||||||||
| Government of Alberta | Annual Report 2024–25 | 15 | |
CONSOLIDATED FINANCIAL STATEMENTS
Table of Contents, continued
| Schedules to the Consolidated Financial Statements (continued) | ||||||||||
| 12 | Asset Retirement Obligations and Environmental Liabilities | 67 | ||||||||
| 13 | Debt | 68 | ||||||||
| 14 | Pension Plans and Other Defined Benefit Plans | 72 | ||||||||
| 15 | Deferred Contributions | 79 | ||||||||
| 16 | Tangible Capital Assets | 80 | ||||||||
| 17 | Adjustments to Net Assets - Operating | 81 | ||||||||
| 18 | Over-expenditure of Spending Authorities | 82 | ||||||||
| 19 | Listing of Organizations | 83 | ||||||||
| Glossary (Unaudited) |
89 | |||||||||
| 16 | Government of Alberta | Annual Report 2024–25 | |
CONSOLIDATED FINANCIAL STATEMENTS
Management’s Responsibility
for the Consolidated Financial Statements
The consolidated financial statements are prepared by the Controller under the general direction of the Deputy Minister of Treasury Board and Finance as authorized by the President of Treasury Board and Minister of Finance pursuant to the Financial Administration Act. The consolidated financial statements are prepared in accordance with Canadian Public Sector Accounting Standards, and of necessity include some amounts that are based on estimates and judgments. As required by the Sustainable Fiscal Planning and Reporting Act, the consolidated financial statements are included in the consolidated annual report of the Province of Alberta that forms part of the Public Accounts.
To fulfill its accounting and reporting responsibilities, management maintains systems of financial management and internal control which give consideration to costs, benefits and risks, and which are designed to:
| · | Provide reasonable assurance that transactions are properly authorized, executed in accordance with prescribed legislation and regulations, and properly recorded so as to maintain accountability for public money; and |
| · | Safeguard the assets and properties of the Province of Alberta under government administration. |
Under the Financial Administration Act, deputy heads are responsible for the collection of revenue payable to the Crown, and for making and controlling disbursements with respect to their departments. They are also responsible for prescribing the accounting systems to be used in their departments. In order to meet government accounting and reporting requirements, the Controller obtains information relating to departments, regulated funds, provincial agencies and Crown-controlled corporations, including schools, universities, colleges, polytechnic institutes, Alberta Health Services and other health entities from ministries as necessary.
The Auditor General of Alberta provides an independent opinion on the consolidated financial statements. The duties of the Auditor General in that respect are contained in the Auditor General Act.
Annually, the consolidated annual report is tabled in the Legislature as a part of the Public Accounts and is referred to the Standing Committee on Public Accounts of the Legislative Assembly.
Approved by:
Katherine White
Deputy Minister of Treasury Board and Finance
Dan Stadlwieser, CPA, CA
Controller
Edmonton, Alberta
June 16, 2025
| Government of Alberta | Annual Report 2024–25 | 17 | |
CONSOLIDATED FINANCIAL STATEMENTS
| Independent Auditor’s Report |

|
To the Members of the Legislative Assembly
Report on the Consolidated Financial Statements
Opinion
I have audited the consolidated financial statements of the Province of Alberta (the Province), which comprise the consolidated statement of financial position as at March 31, 2025, and the consolidated statements of operations, remeasurement gains and losses, change in net debt, and cash flows for the year then ended, and notes and schedules to the consolidated financial statements, including a summary of significant accounting policies.
In my opinion, the accompanying consolidated financial statements present fairly, in all material respects, the consolidated financial position of the Province as at March 31, 2025, and the results of its operations, its remeasurement gains and losses, its changes in net debt, and its cash flows for the year then ended in accordance with Canadian public sector accounting standards (PSAS).
Basis for opinion
I conducted my audit in accordance with Canadian generally accepted auditing standards. My responsibilities under those standards are further described in the Auditor’s Responsibilities for the Audit of the Consolidated Financial Statements section of my report. I am independent of the Province in accordance with the ethical requirements that are relevant to my audit of the consolidated financial statements in Canada, and I have fulfilled my other ethical responsibilities in accordance with these requirements. I believe that the audit evidence I have obtained is sufficient and appropriate to provide a basis for my opinion.
Key audit matters
Key audit matters are those matters that, in my professional judgment, were of most significance in my audit of the Province’s consolidated financial statements for the year ended March 31, 2025. These matters were addressed in the context of my audit of the Province’s consolidated financial statements as a whole, and in forming my opinion thereon, and I do not provide a separate opinion on these key audit matters.
| 18 | Government of Alberta | Annual Report 2024–25 | |
CONSOLIDATED FINANCIAL STATEMENTS
Independent Auditor’s Report, continued
| Key audit matter | How the matter was addressed in the audit | |
| Environmental liabilities | ||
|
The Province records environmental liabilities for remediation of contamination and reclamation of sites it is directly responsible for or when it has accepted responsibility, and when costs can be reasonably estimated.
Under the Province’s polluter-pay principle, those responsible for contamination of sites are responsible for remediation of the sites. For sites where the Province is directly responsible or accepts responsibility for contaminated sites, it estimates costs of required work and records a liability in the Province’s consolidated financial statements.
As at March 31, 2025, the Province recorded $181 million (2024: $168 million) as environmental liabilities (Schedule 12).
The Province did not record a liability for a significant number of sites because it has not determined responsibility, and/or not determined a remediation or reclamation strategy. Management is at various stages of testing, evaluation and studies to determine the extent of contamination and possible site management options and who would do the work. The Province may need to account for additional environmental liabilities in the future as it completes these activities.
I identified accounting for environmental liabilities as a key audit matter since:
● there are a significant number of sites where responsibility and/or strategies for remediation or reclamation have not been established.
● my Report of the Auditor General-June 2021, Processes to Provide information about Government’s Environmental Liabilities describes weaknesses related to the processes to provide information about environmental liabilities.
● it requires interpretation of environmental law and standards to determine who is responsible to do the work when polluters won’t do the work or no longer exist.
|
In the context of the audit of the Province’s consolidated financial statements as a whole, audit work to address this matter included:
● obtaining an understanding of the systems, processes and controls relating to identifying and evaluating contaminated sites.
● assessing the appropriateness of the methods used to estimate the liability.
● examining the liabilities recorded for a sample of sites where the Province was directly responsible or had accepted responsibility by reviewing engineering reports and assessing and verifying if management’s estimates and assumptions were reasonable.
● selecting a sample of sites where management did not record a liability, and reviewing management’s assumptions and explanations and determining that recognition criteria for environmental liabilities had not been met.
● assessing the appropriateness of the disclosures in the consolidated financial statements against the standards for disclosures required by PSAS. | |
| Government of Alberta | Annual Report 2024–25 | 19 | |
CONSOLIDATED FINANCIAL STATEMENTS
Independent Auditor’s Report, continued
|
Key audit matter
|
How the matter was addressed in the audit
| |
|
● it requires expertise to assess the nature and extent of contamination and the work required to remediate and reclaim sites, and then to estimate the costs to do the work.
The consolidated financial statements include the following disclosures: Note 1– Summary of Significant Accounting Policies and Reporting Practices Note 8 – Contingent Liabilities Schedule 12 – Asset Retirement Obligations and Environmental Liabilities
|
||
|
Pension liabilities
| ||
| The Province records pension liabilities relating to several public sector pension plans.
As at March 31, 2025, the Province recorded $7.5 billion (2024: $7.9 billion) as pension liabilities (Schedule 14).
Management estimates pension obligations for each respective pension plan using various assumptions. Key assumptions include salary escalation rates, inflation rates, and discount rates. The valuation of pension liabilities is inherently uncertain and is based on an actuarial extrapolation from the most recent actuarial valuations.
Pension liabilities are net of the investment balances in the pension plans. Pension plan investment balances include significant allocations to private equity and alternative investment asset classes which are subject to measurement uncertainty.
I identified pension liabilities as a key audit matter given the measurement uncertainty inherent in the determination of the pension liability.
The consolidated financial statements include the following disclosures:
Note 1– Summary of Significant Accounting Policies and Reporting Practices
Schedule 14 – Pension Plans and Other Defined Benefit Plans
|
In the context of the audit of the Province’s consolidated financial statements as a whole, audit work to address this matter included:
● examining independent actuaries’ work on the estimate of pension obligations.
● assessing the actuaries’ qualifications.
● reviewing management’s method used to estimate pension obligations.
● assessing the reasonability of the assumptions used in the estimates.
● testing controls over the completeness and accuracy of data provided to the actuaries.
● examining the reasonability of the fair values of pension plan investments.
● assessing the appropriateness of the disclosures in the consolidated financial statements against the standards for disclosures required by PSAS. | |
|
Private equities, inflation sensitive and alternative investments
| ||
| The Province records private equities, inflation sensitive and alternative investments at fair value. Management uses valuation models to estimate the | In the context of the audit of the Province’s consolidated financial statements as a | |
| 20 | Government of Alberta | Annual Report 2024–25 | |
CONSOLIDATED FINANCIAL STATEMENTS
Independent Auditor’s Report, continued
| Key audit matter | How the matter was addressed in the audit | |
|
fair value of these investments. At March 31, 2025, the fair value of these investments was $13.2 billion (2024: $12.2 billion) (Schedule 6).
The valuations of these investments are subject to measurement uncertainty because they are based on valuation models that make use of inputs and assumptions which are not based on observable market data or quoted market prices.
I identified the recording of private equities, inflation sensitive and alternative investments as a key audit matter given that estimated fair values may differ significantly from the value that would have been recorded had readily available market prices existed for these investments.
The consolidated financial statements include the following disclosures: Note 1– Summary of Significant Accounting Policies and Reporting Practices Note 2 – Valuation of Financial Assets and Liabilities Note 3 – Financial Risk Management Schedule 6 – Portfolio Investments |
whole, audit work to address this matter included:
● testing controls over the valuation process, including evidence of review, approval, segregation of duties, and oversight from management and those charged with governance.
● agreeing valuations in investment accounting records to recent valuations.
● assessing the valuators’ qualifications.
● confirming appropriate valuation models were used consistently between similar asset classes.
● assessing the quality of management’s support for key assumptions and inputs used in the valuation models.
● examining management’s process to obtain and consider information obtained subsequent to the valuation date that may provide evidence of conditions that existed at the reporting date.
● assessing the appropriateness of the disclosures in the consolidated financial statements against the standards for disclosures required by PSAS.
| |
| Investments in and toll commitments related to the North West Redwater Partnership (NWRP) | ||
|
The Province, via Alberta Petroleum Marketing Commission (APMC), has entered into a processing agreement, whereby NWRP will process Crown royalty bitumen, and market the refined products on behalf of APMC. APMC is responsible to supply bitumen and pay 75 per cent of the monthly cost of service toll (including the unconditional debt tolls related to paying NWRP’s debt).
At March 31, 2025, the Province:
● recorded the total deficit of APMC in equity in government business enterprises on the consolidated statement of financial position. Included in the liabilities of APMC is a provision of $2.1 billion (2024: $2.0 billion) since it estimated that the unavoidable costs of meeting the obligations under the agreement exceed the economic benefits expected to be received under it.
|
In the context of the audit of the Province’s consolidated financial statements as a whole, audit work to address this matter included:
● examining the cash flow model used to assess if the processing agreement represents an onerous contract.
● assessing the reasonability of inputs and assumptions used in the model.
● verifying appropriate application of onerous contract accounting.
● assessing the appropriateness of the disclosures in the consolidated financial statements against the standards for disclosures required by PSAS. | |
| Government of Alberta | Annual Report 2024–25 | 21 | |
CONSOLIDATED FINANCIAL STATEMENTS
Independent Auditor’s Report, continued
| Key audit matter | How the matter was addressed in the audit | |
|
● estimated the toll commitments to be approximately $35.6 billion (2024: $37.3 billion).
I identified the accounting for the investment in NWRP and the toll commitments as a key audit matter since it requires significant judgements and long-term assumptions about future oil prices, inflation rates, and operation of the refinery over its expected life.
The consolidated financial statements include the following disclosures: Schedule 8 – Equity in Government Business Enterprises
|
||
| Personal income tax revenue | ||
|
The Province estimated personal income tax revenues of $16.1 billion (2024: $15.2 billion) for the year ended March 31, 2025, which is subject to measurement uncertainty because tax assessments are finalized after the consolidated financial statements are published. The Province uses an economic model, which contains several inputs and assumptions, such as population growth, personal income growth, and tax elasticity of income to estimate revenues.
I identified the accounting for personal income tax as a key audit matter since it requires significant judgements and several inputs and assumptions to estimate revenues for the reporting period.
The consolidated financial statements include the following disclosures: Note 1– Summary of Significant Accounting Policies and Reporting Practices Schedule 1 – Revenues
|
In the context of the audit of the Province’s consolidated financial statements as a whole, audit work to address this matter included:
● examining management’s methodology and economic model used to estimate the personal income tax revenues.
● assessing the appropriateness and reasonability of the economic assumptions and data used to generate the personal income tax accrual.
● verifying the mathematical accuracy of the model.
● assessing management’s processes to review and approve the model and assumptions.
● assessing the appropriateness of the disclosures in the consolidated financial statements against the standards for disclosures required by PSAS.
| |
Other information
Management is responsible for the other information. The other information comprises the information included in the 2024-25 Final Results Year-end Report and the 2024-2025 Government of Alberta Annual Report, but does not include the consolidated financial statements and my auditor’s report thereon.
My opinion on the consolidated financial statements does not cover the other information identified above and I do not and will not express any form of assurance conclusion thereon.
| 22 | Government of Alberta | Annual Report 2024–25 | |
CONSOLIDATED FINANCIAL STATEMENTS
Independent Auditor’s Report, continued
In connection with my audit of the consolidated financial statements, my responsibility is to read the other information identified above and, in doing so, consider whether the other information is materially inconsistent with the consolidated financial statements or my knowledge obtained in the audit, or otherwise appears to be materially misstated.
The 2024-25 Final Results Year-end Report and the 2024-2025 Government of Alberta Annual Report are expected to be made available to me after the date of my auditor’s report. If, based on the work I will perform on this other information, I conclude that there is a material misstatement of this other information, I am required to communicate the matter to those charged with governance.
Responsibilities of management and those charged with governance for the consolidated financial statements
Management is responsible for the preparation and fair presentation of the consolidated financial statements in accordance with Canadian public sector accounting standards, and for such internal control as management determines is necessary to enable the preparation of the consolidated financial statements that are free from material misstatement, whether due to fraud or error.
In preparing the consolidated financial statements, management is responsible for assessing the Province’s ability to continue as a going concern, disclosing, as applicable, matters related to going concern and using the going concern basis of accounting unless an intention exists to liquidate or to cease operations, or there is no realistic alternative but to do so.
Those charged with governance are responsible for overseeing the Province’s financial reporting process.
Auditor’s responsibilities for the audit of the consolidated financial statements
My objectives are to obtain reasonable assurance about whether the consolidated financial statements as a whole are free from material misstatement, whether due to fraud or error, and to issue an auditor’s report that includes my opinion. Reasonable assurance is a high level of assurance, but is not a guarantee that an audit conducted in accordance with Canadian generally accepted auditing standards will always detect a material misstatement when it exists. Misstatements can arise from fraud or error and are considered material if, individually or in the aggregate, they could reasonably be expected to influence the economic decisions of users taken on the basis of these consolidated financial statements.
As part of an audit in accordance with Canadian generally accepted auditing standards, I exercise professional judgment and maintain professional skepticism throughout the audit. I also:
| ● | Identify and assess the risks of material misstatement of the consolidated financial statements, whether due to fraud or error, design and perform audit procedures responsive to those risks, and obtain audit evidence that is sufficient and appropriate to provide a basis for my opinion. The risk of not detecting a material misstatement resulting from fraud is higher than for one resulting from error, as fraud may involve collusion, forgery, intentional omissions, misrepresentations, or the override of internal control. |
| ● | Obtain an understanding of internal control relevant to the audit in order to design audit procedures that are appropriate in the circumstances, but not for the purpose of expressing an opinion on the effectiveness of the Province’s internal control. |
| ● | Evaluate the appropriateness of accounting policies used and the reasonableness of accounting estimates and related disclosures made by management. |
| Government of Alberta | Annual Report 2024–25 | 23 | |
CONSOLIDATED FINANCIAL STATEMENTS
Independent Auditor’s Report, continued
| ● | Conclude on the appropriateness of management’s use of the going concern basis of accounting and, based on the audit evidence obtained, whether a material uncertainty exists related to events or conditions that may cast significant doubt on the Province’s ability to continue as a going concern. If I conclude that a material uncertainty exists, I am required to draw attention in my auditor’s report to the related disclosures in the consolidated financial statements or, if such disclosures are inadequate, to modify my opinion. My conclusions are based on the audit evidence obtained up to the date of my auditor’s report. However, future events or conditions may cause the Province to cease to continue as a going concern. |
| ● | Evaluate the overall presentation, structure and content of the consolidated financial statements, including the disclosures, and whether the consolidated financial statements represent the underlying transactions and events in a manner that achieves fair presentation. |
| ● | Plan and perform the group audit to obtain sufficient appropriate audit evidence regarding the financial information of the entities or business activities within the consolidated financial statements as a basis for forming an opinion on the group financial statements. I am responsible for the direction, supervision and review of the audit work performed for purposes of the group audit. I remain solely responsible for my audit opinion. |
I communicate with those charged with governance regarding, among other matters, the planned scope and timing of the audit and significant audit findings, including any significant deficiencies in internal control that I identify during my audit.
I also provide those charged with governance with a statement that I have complied with relevant ethical requirements regarding independence, and to communicate with them all relationships and other matters that may reasonably be thought to bear on my independence, and where applicable, related safeguards.
From the matters communicated with those charged with governance, I determine those matters that were of most significance in the audit of the Province’s consolidated financial statements of the current period and are therefore the key audit matters. I describe these matters in my auditor’s report unless law or regulation precludes public disclosure about the matter or when, in extremely rare circumstances, I determine that a matter should not be communicated in my auditor’s report because the adverse consequences of doing so would reasonably be expected to outweigh the public interest benefits of such communication.
In accordance with the Auditor General Act, I am responsible to report the independent opinion on the consolidated financial statements of the Province completed by my office.
[Original signed by W. Doug Wylie FCPA, FCMA, ICD.D]
Auditor General
June 16, 2025
Edmonton, Alberta
| 24 | Government of Alberta | Annual Report 2024–25 | |
CONSOLIDATED FINANCIAL STATEMENTS
Consolidated Statement of Operations
| Year Ended March 31
|
||||||||||||
| 2025 | 2024 | |||||||||||
| Budget
|
Actual
|
Actual
|
||||||||||
| In millions
|
||||||||||||
| Revenues (Schedules 1 and 2) |
||||||||||||
| Income taxes |
$ 22,632 | $ 24,245 | $ 22,204 | |||||||||
| Other taxes |
6,013 | 6,111 | 4,543 | |||||||||
| Non-renewable resource revenue |
17,315 | 21,986 | 19,287 | |||||||||
| Transfers from Government of Canada |
12,639 | 12,618 | 12,336 | |||||||||
| Net income from government business enterprises (Schedule 8) |
2,123 | 2,053 | 1,237 | |||||||||
| Net investment income |
3,267 | 4,803 | 4,587 | |||||||||
| Premiums, fees and licences |
5,384 | 5,504 | 5,565 | |||||||||
| Other |
4,164 | 5,149 | 4,979 | |||||||||
| 73,537 | 82,469 | 74,738 | ||||||||||
| Expenses by function (Schedule 3) |
||||||||||||
| Health |
28,732 | 29,560 | 27,447 | |||||||||
| Education |
17,004 | 17,197 | 16,359 | |||||||||
| Social services |
8,143 | 8,462 | 8,035 | |||||||||
| Agriculture, resource management and economic development |
2,734 | 4,125 | 4,171 | |||||||||
| General government |
3,831 | 3,445 | 3,503 | |||||||||
| Protection of persons and property |
4,238 | 3,186 | 3,454 | |||||||||
| Transportation, communications and utilities |
2,725 | 2,489 | 2,189 | |||||||||
| Regional planning and development |
1,156 | 1,375 | 1,095 | |||||||||
| Environment |
732 | 647 | 652 | |||||||||
| Recreation and culture |
473 | 445 | 438 | |||||||||
| Housing |
401 | 406 | 333 | |||||||||
| Debt servicing costs (Schedule 13) |
3,365 | 3,215 | 3,149 | |||||||||
| Pension recovery (Schedule 14) |
(364 | ) | (403 | ) | (372 | ) | ||||||
| 73,170 | 74,149 | 70,453 | ||||||||||
| Annual surplus |
367 | 8,320 | 4,285 | |||||||||
| Net assets - operating at beginning of year |
12,649 | 12,649 | 8,500 | |||||||||
| Other adjustments to net assets - operating (Schedule 17) |
- | (3 | ) | (136 | ) | |||||||
| Net assets - operating at end of year |
$ 13,016 | $ 20,966 | $ 12,649 | |||||||||
The accompanying notes and schedules are part of these consolidated financial statements.
| Government of Alberta | Annual Report 2024–25 | 25 | |
CONSOLIDATED FINANCIAL STATEMENTS
Consolidated Statement of Financial Position
| As at March 31 | ||||||||
| 2025 | 2024 | |||||||
| In millions |
||||||||
| Financial assets |
||||||||
| Cash and cash equivalents (Schedule 4) |
$ 9,147 | $ 5,461 | ||||||
| Accounts receivable and advances (Schedule 5) |
12,175 | 10,651 | ||||||
| Portfolio investments (Schedule 6) |
||||||||
| Operating |
49,358 | 43,460 | ||||||
| Endowments (Schedule 7) |
4,210 | 3,850 | ||||||
| Equity in government business enterprises (Schedule 8) |
735 | 862 | ||||||
| Loans receivable (Schedule 9) |
21,276 | 21,246 | ||||||
| Derivative financial instruments (Schedule 10) |
975 | 1,299 | ||||||
| Inventories for resale and other |
59 | 60 | ||||||
| 97,935 | 86,889 | |||||||
| Liabilities |
||||||||
| Accounts payable and other accrued liabilities (Schedule 11) |
15,920 | 13,744 | ||||||
| Asset retirement obligations and environmental liabilities (Schedule 12) |
2,760 | 2,559 | ||||||
| Debt (Schedule 13) |
102,707 | 99,793 | ||||||
| Derivative financial instruments (Schedule 10) |
969 | 1,833 | ||||||
| Pension liabilities (Schedule 14) |
7,504 | 7,904 | ||||||
| Unspent deferred contributions (Schedule 15) |
2,412 | 2,420 | ||||||
| 132,272 | 128,253 | |||||||
| Net debt |
(34,337 | ) | (41,364 | ) | ||||
| Non-financial assets |
||||||||
| Tangible capital assets (Schedule 16) |
61,708 | 60,371 | ||||||
| Prepaid expenses |
631 | 547 | ||||||
| Inventories of supplies |
422 | 441 | ||||||
| Purchased intangibles and other |
164 | 156 | ||||||
| 62,925 | 61,515 | |||||||
| Spent deferred capital contributions (Schedule 15) |
4,080 | 3,964 | ||||||
| Net assets |
$ 24,508 | $ 16,187 | ||||||
| Net assets are comprised of: |
||||||||
| Net assets - operating |
$ 20,966 | $ 12,649 | ||||||
| Accumulated remeasurement gains |
3,542 | 3,538 | ||||||
Contractual rights, obligations and commitments (Notes 5 and 7)
Contingent assets and liabilities (Notes 6 and 8)
The accompanying notes and schedules are part of these consolidated financial statements.
| 26 | Government of Alberta | Annual Report 2024–25 | |
CONSOLIDATED FINANCIAL STATEMENTS
Consolidated Statement of Remeasurement Gains and Losses
| Year Ended March 31 | ||||||||
| 2025 | 2024 | |||||||
| In millions |
||||||||
| Accumulated remeasurement gains at beginning of year |
$ | 3,538 | $ | 2,814 | ||||
| Unrealized gains/(losses) attributable to: |
||||||||
| Foreign exchange |
(1,631 | ) | (40 | ) | ||||
| Derivative financial instruments |
802 | 509 | ||||||
| Portfolio investments |
||||||||
| Quoted in an active market |
138 | 658 | ||||||
| Designated at fair value |
909 | (372 | ) | |||||
| Amounts reclassified to the Consolidated Statement of Operations: |
||||||||
| Foreign exchange |
284 | 215 | ||||||
| Derivative financial instruments |
(286 | ) | (218 | ) | ||||
| Portfolio investments |
||||||||
| Quoted in an active market |
(121 | ) | (66 | ) | ||||
| Designated at fair value |
(251 | ) | (86 | ) | ||||
| Other comprehensive income from government business enterprises (Schedule 8) |
160 | 124 | ||||||
| Net remeasurement gains for the year |
4 | 724 | ||||||
| Accumulated remeasurement gains at end of year |
$ | 3,542 | $ | 3,538 | ||||
The accompanying notes and schedules are part of these consolidated financial statements.
| Government of Alberta | Annual Report 2024–25 | 27 | |
CONSOLIDATED FINANCIAL STATEMENTS
Consolidated Statement of Change in Net Debt
| Year Ended March 31 | ||||||||||||
| 2025 | 2024 | |||||||||||
| Budget | Actual | Actual | ||||||||||
| In millions | ||||||||||||
| Annual surplus |
$ | 367 | $ | 8,320 | $ | 4,285 | ||||||
| Acquisition of tangible capital assets and intangible assets |
(4,829 | ) | (4,247 | ) | (4,121 | ) | ||||||
| Additions to public private partnerships, asset retirement obligations, capital leases, donated capital assets and other |
(1 | ) | (88 | ) | (110 | ) | ||||||
| 10% cash flow adjustment |
800 | - | - | |||||||||
| Amortization of tangible capital assets and purchased intangibles |
2,955 | 2,968 | 2,764 | |||||||||
| Net (gain)/loss on disposal and adjustments of tangible capital assets and purchased intangibles |
- | (56 | ) | 164 | ||||||||
| Proceeds on sale of tangible capital assets |
- | 84 | 129 | |||||||||
| (Increase)/decrease in inventory of supplies |
(26 | ) | 19 | 334 | ||||||||
| Increase in prepaid expenses and other non-financial assets |
- | (90 | ) | (51 | ) | |||||||
| Increase in spent deferred capital contributions (Schedule 15) |
21 | 116 | 268 | |||||||||
| Other adjustments to net assets - operating (Schedule 17) |
- | (3 | ) | (136 | ) | |||||||
| (Increase)/decrease in net debt excluding net remeasurement gains |
(713 | ) | 7,023 | 3,526 | ||||||||
| Net remeasurement gains |
- | 4 | 724 | |||||||||
| (Increase)/decrease in net debt |
(713 | ) | 7,027 | 4,250 | ||||||||
| Net debt at beginning of year |
(41,364 | ) | (41,364 | ) | (45,614 | ) | ||||||
| Net debt at end of year |
$ | (42,077 | )$ | (34,337 | ) | $ | (41,364 | ) | ||||
The accompanying notes and schedules are part of these consolidated financial statements.
| 28 | Government of Alberta | Annual Report 2024–25 | |
CONSOLIDATED FINANCIAL STATEMENTS
Consolidated Statement of Cash Flows
| Year Ended March 31 | ||||||||
| 2025 | 2024 | |||||||
| In millions |
||||||||
| Operating transactions |
||||||||
| Annual surplus |
$ | 8,320 | $ | 4,285 | ||||
| Non-cash items |
||||||||
| Amortization of tangible capital assets and purchased intangibles |
2,968 | 2,764 | ||||||
| Deferred contributions recognized as revenue |
(3,671 | ) | (2,951 | ) | ||||
| Pension recovery |
(403 | ) | (372 | ) | ||||
| Net Income from government business enterprises |
(2,053 | ) | (1,237 | ) | ||||
| Other non-cash items included in annual surplus |
(319 | ) | 153 | |||||
| 4,842 | 2,642 | |||||||
| Decrease/(increase) in accounts receivable and advances, inventories, prepaids and other assets |
142 | (1,281 | ) | |||||
| Increase in accounts payable and other accrued liabilities |
1,711 | 937 | ||||||
| Distribution from government business enterprises |
2,379 | 2,332 | ||||||
| Cash provided by operating transactions |
9,074 | 4,630 | ||||||
| Capital transactions |
||||||||
| Acquisition of tangible capital assets and intangible assets |
(4,241 | ) | (4,218 | ) | ||||
| Proceeds on sale of tangible capital assets |
84 | 129 | ||||||
| Cash applied to capital transactions |
(4,157 | ) | (4,089 | ) | ||||
| Investing transactions |
||||||||
| Purchases of portfolio investments |
(41,592 | ) | (32,163 | ) | ||||
| Disposals of portfolio investments |
36,879 | 25,769 | ||||||
| Loans made |
(2,777 | ) | (3,174 | ) | ||||
| Repayment of loans |
2,602 | 2,380 | ||||||
| Cash applied to investing transactions |
(4,888 | ) | (7,188 | ) | ||||
| Financing transactions |
||||||||
| Retirement of direct borrowing |
(34,734 | ) | (39,591 | ) | ||||
| Issuance of direct borrowing |
34,739 | 42,624 | ||||||
| Contributions restricted for capital and operations |
3,763 | 3,429 | ||||||
| Repayment of liabilities under capital leases and public private partnerships |
(111 | ) | (124 | ) | ||||
| Cash provided by financing transactions |
3,657 | 6,338 | ||||||
| Increase/(decrease) in cash and cash equivalents |
3,686 | (309 | ) | |||||
| Cash and cash equivalents at beginning of year |
5,461 | 5,770 | ||||||
| Cash and cash equivalents at end of year |
$ | 9,147 | $ | 5,461 | ||||
| Supplementary Information
|
||||||||
| Interest received |
$ | 1,410 | $ | 1,446 | ||||
| Interest paid |
3,150 | 3,155 | ||||||
The accompanying notes and schedules are part of these consolidated financial statements.
| Government of Alberta | Annual Report 2024–25 | 29 | |
CONSOLIDATED FINANCIAL STATEMENTS
Notes to the Consolidated Financial Statements
| NOTE 1 | SUMMARY OF SIGNIFICANT ACCOUNTING POLICIES AND REPORTING PRACTICES |
These consolidated financial statements are prepared in accordance with Canadian Public Sector Accounting Standards (PSAS).
| (a) | REPORTING ENTITY |
The consolidated financial statements of the Province of Alberta (Province) include the accounts of organizations that meet the criteria of control as established under PSAS. The consolidated financial statements also include the accounts of the Office of the Legislative Assembly and Offices of the Legislature.
A list of organizations included in these consolidated financial statements can be found in Schedule 19.
| (b) | METHOD OF CONSOLIDATION |
The accounts of government sector entities, except those designated as government business enterprises, are consolidated using the line-by-line method. Under this method, accounting policies of the consolidated entities are adjusted to conform to government accounting policies, and the results of each line item in their financial statements (revenue, expense, assets and liabilities) are included in the Province’s results. Revenue, expense, capital, investing and financing transactions, as well as related asset and liability balances between consolidated entities have been eliminated.
Schools and some post-secondary institutions (PSI), government business enterprises and government organizations have year-ends that are other than March 31. The significant transactions of these organizations that have occurred during the period between their year-ends and the Province’s year-end of March 31, 2025, have been recorded in these financial statements.
In 2024-25, one PSI changed their fiscal year-end from June 30 to March 31 to coincide with the fiscal year of the Province. The Province’s financial statements include adjustments to reflect the PSI’s balances as at March 31.
The accounts of provincial agencies designated as government business enterprises (Schedule 8) are accounted for on the modified equity basis, with the equity being computed based on their results which are prepared in accordance with IFRS Accounting Standards as issued by the International Accounting Standards Board. Under the modified equity method, the accounting policies of government business enterprises are not adjusted to conform to those of the government. Inter-entity revenue and expense transactions and related asset and liability balances are not eliminated except for inter-entity gains and losses, which are eliminated on assets and liabilities remaining within the government reporting entity at the financial statement date.
| (c) | FUTURE CHANGES IN ACCOUNTING STANDARDS |
Effective April 1, 2026, the Province will adopt the new Conceptual Framework for Financial Reporting in the Public Sector (Conceptual Framework) and PS 1202 Financial Statement Presentation. The impact on the consolidated financial statements is currently being assessed.
Conceptual Framework
The Conceptual Framework prescribes the nature, function and limits of financial accounting and reporting. It is the foundation on which PSAS are developed and professional judgment is applied. It will replace the conceptual aspects of PS 1000 Financial Statement Concepts and PS 1100 Financial Statement Objectives.
| 30 | Government of Alberta | Annual Report 2024–25 | |
CONSOLIDATED FINANCIAL STATEMENTS
| NOTE 1 | continued |
PS 1202 Financial Statement Presentation
This standard sets out general and specific requirements for the presentation of information in government consolidated financial statements, based on the concepts within the Conceptual Framework.
| (d) | BASIS OF FINANCIAL REPORTING |
All revenues, expenses, assets and liabilities are reported on the accrual basis of accounting.
Revenues
Revenue from transactions with performance obligations are recognized when the performance obligations are satisfied by providing the promised goods or services to a payor at a point in time or over a period of time depending on the arrangement. Significant disaggregated revenues reported on Schedule 1 with performance obligations include premiums, fees and licenses such as tuition, motor vehicle licenses, health fees and charges; and other sales, rentals and services.
Revenues from transactions without performance obligations are recognized at their realizable value when the Province has the authority to claim or retain an inflow of economic resources and identifies a past transaction or event that gives rise to an asset.
Cash received for which goods or services have not been provided by year end is recognized as unearned revenue and reported in accounts payable and other accrued liabilities (Schedule 11).
The provincial tax system is predicated on self-assessment where taxpayers are expected to understand the tax laws and comply with them. This has an impact on the completeness of tax revenues when taxpayers fail to comply with tax laws, such as, the taxpayer does not report all of their income. The Province has implemented systems and controls in order to detect and correct situations where taxpayers are not complying with the various acts it administers. These systems and controls include performing audits of taxpayer records when determined necessary. However, such procedures cannot identify all sources of unreported income or other cases of non-compliance with tax laws. The Province does not estimate the amount of unreported tax.
Tax revenues are reported net of applicable tax concessions. Tax concessions are defined as tax credits that provide relief to taxpayers from taxes previously paid or currently owing.
Tax credits that provide a financial benefit through the tax system but do not change a taxpayer’s tax liability amount are defined as transfers through the tax system and reported as expenses.
Personal income tax is recognized on an accrual basis based on an economic estimate of the various components of personal income tax for the fiscal year. Gross personal income growth for the taxation year is a key component of the estimate for the fiscal year.
Corporate income tax revenue is recognized when installments are received from corporations. A receivable is established for tax assessments that are outstanding. Revenue and tax receivables will be adjusted in the year in which any additional information becomes available from resulting audits, appeals and court decisions. Corporate income tax refunds payable are accrued based primarily on the prior year’s corporate income tax refunds paid on assessments. Corporate income tax receipts from corporations in anticipation of an upward reassessment of Alberta income tax payable are described as corporate income tax receipts in abeyance and recognized as accounts payable and other accrued liabilities (Schedule 11).
The Province calculates an allowance for corporate income taxes based on the difference between the actual corporate income tax receivable and the estimate of the collectability. The adjustment to the allowance is recorded as an expense. The adjustment may increase or decrease the allowance
| Government of Alberta | Annual Report 2024–25 | 31 | |
CONSOLIDATED FINANCIAL STATEMENTS
| NOTE 1 | continued |
as tax receivables are revalued in subsequent years based on resulting audits, appeals and court decisions.
Other taxes are recognized during the period in which the taxable event occurs and when authorized by legislation.
The provincial royalty system is predicated on self-reporting where the petroleum and natural gas industry is expected to understand the relevant energy legislation (statutes and regulations) and comply with them. This has an impact on the completeness of revenue when the petroleum and natural gas industry does not fully meet the legislative requirements, for example, by reporting inaccurate or incomplete production data. The Province has implemented systems and controls in order to detect and correct situations where the petroleum and natural gas industry has not complied with the various acts and regulations the Province administers. These systems and controls, based on areas of highest risk, include performing audits of the petroleum and natural gas industry records when determined necessary. The Province does not estimate the effect of misreported revenue. Any impacts on revenue of refiling by industry are recognized in the year of refiling.
Royalty revenues are reported net of expenses incurred by provincial oil and gas royalty reduction programs. These programs aim to encourage industry to produce from wells which otherwise would not be economically productive.
Bitumen royalty is determined based on revenues from production sold by projects less the costs of that production and costs of selling the Crown’s royalty share. Crude oil and natural gas royalties are determined based on monthly production. Revenue is recognized when the resource is produced by the mineral right holders. Revenue from bonuses and sales of Crown leases is recognized when the Crown leases are sold.
Transfers from the Government of Canada (GoC) include grants and entitlements. Grants for capital purposes and donated assets with restrictions for their use are recognized as deferred capital contributions. Grants for operating purposes with stipulations for their use are recognized as deferred operating contributions. Entitlements relate to significant intergovernmental transfers where authorization and eligibility criteria have been met by March 31 and amounts can be reasonably estimated. Entitlements with restrictions for their use that create an obligation are recognized as deferred contributions. Deferred contributions are recognized as revenue in the Consolidated Statement of Operations based on relevant stipulations of the transfer taken together with the actions and communications of the Province. All other grants and entitlements, without stipulations for their use, are recognized as revenue in the Consolidated Statement of Operations when authorized and eligibility criteria, if any, are met.
Endowment contributions, matching contributions and associated investment income allocated for preservation of endowment capital purchasing power are recognized as other revenue in the Consolidated Statement of Operations in the period in which they are received.
Income or expense on derivatives used to manage interest rate exposure of loans is recognized as an adjustment to interest income.
Expenses
Expenses represent the cost of resources consumed during the year on government operations. Expenses include amortization of tangible capital assets and purchased intangibles, debt servicing costs and expenses incurred in accordance with the terms of approved grant programs. Grants are recognized as expenses when authorized, eligibility criteria, if any, are met by recipients and a reasonable estimate of the amounts can be made.
| 32 | Government of Alberta | Annual Report 2024–25 | |
CONSOLIDATED FINANCIAL STATEMENTS
| NOTE 1 | continued |
Pension expenses comprise the cost of pension benefits earned by employees during the year, interest on the Province’s share of the unfunded pension liabilities and the amortization of deferred adjustments arising from experience gains and losses and changes in actuarial assumptions over the expected average remaining service life of employees. Pension recovery represents the change in pension assets and liabilities. Schedule 14 provides additional information on the components of pension expenses, assets and liabilities.
In the Consolidated Statement of Operations, pension costs of government sector entities which are funded are included in expenses by function, while costs which have not been funded are recognized as pension provisions.
Costs arising from obligations under guarantees and indemnities are recognized as expenses when management determines that the Province will likely be called upon to make payment. The expense represents management’s best estimate of future payments less recoveries.
The estimated increase or decrease for the year in accrued employee vacation entitlements is recognized in the related expense function.
Income or expense on derivatives used to manage interest rate or foreign currency exposure of debentures is recognized as an adjustment to debt servicing costs.
Financial Assets
Financial assets are the Province’s financial claims on external organizations, individuals and government business enterprises, as well as cash and inventories for resale at year-end.
Cash includes deposits in banks and cash-in-transit. Cash equivalents include directly held interest-bearing securities with original term to maturity of primarily less than three months.
Accounts receivable is recognized at the lower of cost or net recoverable value. A valuation allowance is recognized when recovery is uncertain.
Derivatives and portfolio investments quoted in an active market or managed on a fair value basis are recognized at fair value. Portfolio investments held in pooled investment funds (pools) provide exposure to the risks and rewards of ownership associated with the underlying financial instruments in a pool through the ownership of pool units. The pool units are included in the total balance of portfolio investments and recognized in the Consolidated Statement of Financial Position at the market-based fair value that is derived from the fair value of the underlying financial instruments held in the pools. The pools include various financial instruments such as bonds, equities, real estate, derivatives, investment receivables and payables and cash. Valuation methods of investments held by pools are described in Note 2. Unrealized gains and losses of derivatives and investments recognized at fair value are reported in the Consolidated Statement of Remeasurement Gains and Losses, or as deferred contributions for certain endowment funds.
All other portfolio investments are recognized at cost or amortized cost. Discounts or premiums arising on the purchase of fixed income securities are amortized using the effective interest method over the life of the investments. The carrying value of these portfolio investments is net of initial measurements and any write-downs associated with a loss in value that is other than a temporary decline. A write-down of a portfolio investment to reflect a loss in value is not reversed for a subsequent increase in value. Impairment losses are included as an expense in the Consolidated Statement of Operations. The reduced value is deemed to be the new cost of the portfolio investments.
Purchases and dispositions of portfolio investments are recognized on the trade date. Transaction costs incurred for the portfolio investments recognized at fair value are expensed in the year, and for the portfolio investments recognized at cost or amortized cost, transaction costs are included
| Government of Alberta | Annual Report 2024–25 | 33 | |
CONSOLIDATED FINANCIAL STATEMENTS
| NOTE 1 | continued |
in balances of portfolio investments in the year. Management fees paid are expensed in the year. Realized gains and losses on disposal of investments are included in calculating the net investment income for the year in the Consolidated Statement of Operations.
Portfolio investments restricted for endowments (Schedule 7) are from donors who have placed restrictions on their contributions to the endowment funds, for example, capital preservation. The principal restriction is that the original contribution should be maintained intact in perpetuity. Other restrictions may include spending investment income earned by endowments for specific operational or capital purposes, or capitalizing a certain amount of investment income to maintain and grow the real value of endowments.
Loans are recognized at cost less any discounts and allowance for credit loss. Where there is no longer reasonable assurance of timely collection of the full amount of principal and interest of a loan, a provision for credit loss is made and the carrying amount of the loan is reduced to its estimated realizable amount.
Derivative Financial Instruments
Derivative financial instruments are held directly for hedging purposes to manage specific loan receivable and debt related risks, or indirectly through pooled funds included in portfolio investments. Types of derivative financial instruments and their classification in these financial statements are described further in Schedule 10.
Directly held derivative financial instruments are recorded at fair value in the Consolidated Statement of Financial Position, and changes in fair value are recorded as unrealized gains and losses in the Consolidated Statement of Remeasurement Gains and Losses. When a derivative financial instrument is derecognized, accumulated remeasurement gains or losses are reclassified to the Consolidated Statement of Operations and recognized as interest income or debt servicing costs, based on their intended purpose. All transaction costs are expensed. Derivative instruments held indirectly through investment pools are included in portfolio investments in the Consolidated Statement of Financial Position.
Liabilities
Liabilities represent present obligations of the Province to external organizations, individuals and government business enterprises, arising from past transactions or events occurring before year-end, the settlement of which is expected to result in the future sacrifice of economic benefits. They are recognized when there is an appropriate basis of measurement and management can reasonably estimate the amount.
Debentures included in direct borrowing are recognized at the face value, adjusted for transaction costs, premiums or discounts and underwriting commissions arising from the issuance of debentures and amortized over the term of the debenture using the effective interest method. Accrued interest payable on direct borrowing is reported separately from the carrying value of the debentures in the Consolidated Statement of Financial Position. Debt servicing costs on debentures include interest, amortization of premiums or discounts and settlements of derivatives used to manage debt related risks, and are measured using the effective interest method.
Public private partnerships (P3) are legally binding contracts between the Province and one or more public/private/not-for-profit partners for the provision of assets and the delivery of services that allocate responsibilities and business risks among various partners.
| 34 | Government of Alberta | Annual Report 2024–25 | |
CONSOLIDATED FINANCIAL STATEMENTS
| NOTE 1 | continued |
The Province accounts for P3 projects in accordance with the substance of the underlying agreements. These agreements are accounted for as follows:
| • | Costs incurred during construction are recognized as capital assets (classified as work-in-progress), with the corresponding liability recorded on an estimated percentage of completion basis. The costs represents fair value at the time of signing P3 agreements. |
| • | The liability is initially reduced by progress payments made by the Province during the construction phase. The liability is subsequently measured at amortized cost using the effective interest method. The interest rate used to calculate the finance charge embedded in the liability was determined at the time of signing P3 agreements and remains consistent throughout the P3 arrangement unless the terms of the arrangement have been renegotiated. |
| • | Amortization of the asset is on a straight-line basis over its estimated useful life and begins when the asset is put into service. |
A liability for an asset retirement obligation is recognized when, as at the financial reporting date:
| • | There is a legal obligation to incur retirement costs in relation to a tangible capital asset; |
| • | The past transaction or event giving rise to the liability has occurred; |
| • | It is expected that future economic benefits will be given up; and |
| • | A reasonable estimate of the amount can be made. |
Asset retirement obligations are initially measured as of the date the legal obligation was incurred, based on management’s best estimate of the amount required to retire tangible capital assets and may be subsequently remeasured at each financial reporting date taking into account any new information and the appropriateness of assumptions used.
A present value technique is used to determine the amount of the obligation for some of the assets. Where a present value technique is used to measure a liability, the liability is adjusted for the passage of time and is recognized as accretion expense in the Consolidated Statement of Operations. When a present value technique is not used, the asset retirement obligation is valued at current estimated cost to settle or otherwise extinguish the liability.
When a liability for an asset retirement obligation is recognized, asset retirement costs related to recognized tangible capital assets in productive use are capitalized by increasing the carrying amount of the related asset by the same amount as the liability and are amortized over the estimated remaining useful life of the underlying tangible capital asset. Asset retirement costs related to unrecognized tangible capital assets and those not in productive use are expensed.
Environmental liabilities mainly consists of liabilities for contaminated sites which are a result of contamination of a chemical, organic or radioactive material or live organism that exceeds an environmental standard, being introduced into soil, water or sediment.
The Province recognizes environmental liabilities (Schedule 12) when all of the following criteria are met:
| • | Environmental standard exists; |
| • | Contamination exceeds the environmental standard; |
| • | It is expected that future economic benefits will be given up; |
| • | A reasonable estimate of the amount can be made; and |
| • | The Province is directly responsible or accepts responsibility. |
| Government of Alberta | Annual Report 2024–25 | 35 | |
CONSOLIDATED FINANCIAL STATEMENTS
| NOTE 1 | continued |
Under the polluter-pay principle, those responsible for contamination of sites are responsible for remediation of the sites.
Thus, where the Province is directly responsible for contamination it recognizes a liability when the above criteria are met. The Province is also responsible for any reclamation work, if statutory environmental directors determine that additional reclamation work is required after certain legislative warranty periods in the Environmental Protection and Enhancement Act have expired (referred to as section 142 sites).
In addition, the Province has a mandate, through its various environment and energy regulators, to protect public safety and the environment. The Province may decide to accept responsibility on a case-by-case basis, when statutory environmental directors have assessed risks to people and the environment and concluded that work is needed to protect public safety and the environment when there are no responsible parties to do any required remediation work (referred to as legacy sites).
A provision for future cleanup costs is accrued based on preliminary environmental assessments, or best estimations for those sites where an assessment has not been conducted.
Schedule 12 includes the liabilities recorded by the Province. Note 8(e) provides additional information about contingent environmental liabilities where the Province has not recognized environmental liabilities.
The value of pension liabilities and associated changes during the year are based on an actuarial extrapolation of the most recent actuarial valuation. This valuation technique uses the projected benefit method pro-rated on service and management’s best estimate as at the extrapolation date of various economic and non-economic assumptions. Where the Province is a participating employer in the plan, experience gains and losses to the extent of the Province’s employer share are amortized over the estimated average remaining service life of employees. Where the Province has a liability for pre-1992 pension obligations, experience gains or losses are recognized in the year incurred.
Liabilities also include:
| • | All financial claims payable by the Province at year-end; |
| • | Contingent liabilities where future liabilities are likely and the amount can be reasonably estimated; |
| • | Accrued employee vacation entitlements; |
| • | Coal phase-out agreement liabilities, included in grants (Schedule 11); |
| • | Unspent deferred contributions for capital and operating purposes (Schedule 15); and |
| • | Spent deferred capital contributions which are excluded from net debt (Schedule 15). |
Non-financial Assets
Non-financial assets include tangible capital assets, prepaid expenses, inventories of supplies, purchased intangibles and other non-financial assets.
Tangible capital assets and purchased intangibles with finite lives are valued at cost less accumulated amortization. Land and purchased intangibles with indefinite lives are valued at cost. Cost is the gross amount of consideration given up to acquire an asset and includes all costs directly attributable to acquisition, construction, development, betterment or retirement of the tangible capital asset and intangible assets. Amortization is provided on a straight-line basis over the estimated useful lives of the tangible capital assets (Schedule 16) and purchased intangibles. The annual amortization costs are allocated to the functions of the Province that employ those assets and are reported in the Consolidated Statement of Operations.
| 36 | Government of Alberta | Annual Report 2024–25 | |
CONSOLIDATED FINANCIAL STATEMENTS
| NOTE 1 | continued |
Prepaid expenses are recorded at cost and amortized based on the terms of the agreement.
Inventories of supplies are valued at the lower of cost, determined on a weighted average or first-in, first-out basis and replacement cost.
Other Assets
Intangible assets, collections of historical artifacts, provincial, national and international works of art and tangible capital assets acquired by right and that have not been purchased, such as Crown lands, forests, water and mineral resources, are not recognized in the Consolidated Statement of Financial Position as a reasonable estimate of the amounts involved cannot be made.
Foreign Currency
Foreign currency transactions are translated into Canadian dollars using the average exchange rate for the day. Monetary assets and liabilities denominated in a foreign currency are translated at the year-end rate of exchange. Unrealized gains and losses arising from translation are recognized in the Consolidated Statement of Remeasurement Gains and Losses or as deferred contributions for certain endowment funds, and are reclassified to the Consolidated Statement of Operations when settled.
Measurement Uncertainty
Estimates are used in accruing revenues, expenses, assets and liabilities in circumstances where the actual results are unknown at the time the financial statements are prepared. Uncertainty in the determination of the amount at which an item is recognized in financial statements is known as measurement uncertainty. Such uncertainty exists when there is a variance between the recognized amount and another reasonably possible amount, whenever estimates are used. Measurement uncertainty that is material to these financial statements exists in the accrual of personal and corporate income taxes; royalties derived from non-renewable resources; health transfers; private equities; inflation sensitive and alternative investments; loans receivable; asset retirement obligations; environmental liabilities; and pension liabilities.
The evolving global trade environment, including shifting tariffs and geopolitical tensions, contributes to heightened economic uncertainty and market volatility. These factors introduce an additional level of uncertainty for the measurement of certain accrued revenues, expenses, assets and liabilities recorded in these financial statements. While the estimates used are based on the best available information, near-term changes in conditions could materially impact the amounts recognized or disclosed.
Personal income tax revenue (Schedule 1) of $16,120 million (2024: $15,160 million) is subject to measurement uncertainty primarily due to the absence of final tax assessment data, and consequent reliance on economic estimates of population growth, personal income growth and the tax elasticity of income. Personal income growth is inherently difficult to estimate due to subsequent revisions to personal income data. The current fiscal year estimate of primary household income growth used in determining personal income tax is 7.1% for 2024 calendar year and 4.8% for 2025 calendar year (the 2024 estimate was 7.2% for 2023 calendar year and 6.7% for 2024 calendar year). This includes the effects of changes in taxable government transfers to individuals on total taxable income. Based on the last 10-years of historical data, excluding 2024-25 as the 2024 tax year is still open, there is an uncertainty of plus or minus $481 million (2024: $418 million) in the personal income tax revenue estimate.
Corporate income tax revenue (Schedule 1) of $7,892 million (2024: $6,882 million), the related accounts receivable (Schedule 5) of $1,851 million (2024: $1,458 million) and refunds payable
| Government of Alberta | Annual Report 2024–25 | 37 | |
CONSOLIDATED FINANCIAL STATEMENTS
| NOTE 1 | continued |
(Schedule 11) of $678 million (2024: $648 million) are subject to measurement uncertainty due to estimates of amounts not yet assessed based on cash received as well as taxpayer objections to assessed taxes (Note 8). Estimates are based on cash received from tax installments, payments with a filed return, current year refunds paid and amounts assessed where payment has not yet been received. The methodology of calculating the refund liability estimate is back tested and the estimate is revised as necessary. Based on historical data, the reasonable range for measurement uncertainty is from negative $39 million to positive $263 million. Final assessed taxes may differ from original estimates due to reassessments in subsequent years. The impact of future reassessments cannot reasonably be determined. The amounts included in the corporate income tax accounts receivable are evaluated for collectability annually. A valuation allowance of $383 million (2024: $373 million) is the reduction to receivables to determine the estimated net recoverable amount. The methodology to calculate the allowance is back tested and revised as required.
Bitumen royalty of $17,167 million (2024: $14,518 million) and natural gas and by-products revenue (Schedule 1) of $1,220 million (2024: $1,057 million) are subject to measurement uncertainty. For projects from which bitumen royalty is paid and where the project has reached payout, the royalty rate used to determine the royalties is based on the average price of West Texas Intermediate (WTI) crude oil in Canadian dollars for the calendar year. Royalty rates will start at 25% of net profits or 1% of gross revenue when oil is priced at $55 per barrel or less, and increase to a maximum of 40% of net profits or 9% of gross revenue when oil is priced at $120 per barrel or more. Royalties are based on 25% to 40% of net revenue or 1% to 9% of gross revenue, whichever is higher. Payout is defined at the first date at which the cumulative revenue of a project first equals the cumulative cost of the project. Natural gas and by-products royalty is calculated based on allowable costs incurred by the royalty payers and production volumes that are reported to the Province by royalty payers. Industry may modify their royalty and gas cost allowance for non-statute barred years. The Province estimates what the costs, volumes and royalty rates for the fiscal year should be based on statistical analysis of industry data. Based on historical data, changes to natural gas and by-products revenues resulted from a $35 million decrease (2024: $29 million increase) in the refiling adjustments.
The fair value of portfolio investments classified in the level 3 category of $16,334 million (2024: $15,323 million) (Schedule 6) is subject to measurement uncertainty as the fair value may differ significantly from the values that would have been used had a ready market for these investments existed.
Loans receivable (Schedule 9) relating to net student loans receivable of $4,936 million (2024: $4,640 million) made under the authority of the Student Financial Assistance Act is subject to measurement uncertainty. Allowances totaling $1,009 million (2024: $907 million) have been recognized for impaired loans, loan subsidies and repayment assistance. The Province has made certain estimates in the following areas:
| • | Recovery, recall, rehabilitation and default rates in the determination of the allowance for impaired loans; |
| • | Blended student lending rate, the annual average provincial borrowing rate, the average repayment period, default rate and repayment assistance rate in the determination of the allowance for loan subsidy; and |
| • | Future loan amounts approved for repayment assistance and loan forgiveness rates in the determination of the allowance for repayment assistance. |
The revenue from the Technology Innovation and Emissions Reduction fund for this period of $172 million (2024: $907 million) (Schedule 1) includes estimates that are subject to
| 38 | Government of Alberta | Annual Report 2024–25 | |
CONSOLIDATED FINANCIAL STATEMENTS
| NOTE 1 | continued |
measurement uncertainty. Estimates are derived from Monte Carlo simulation, which models system behaviour through random sampling of variables. The minimum revenue that could occur if compliance credits are fully utilized is $306 million (2024: $392 million) while the maximum revenue could be $2,350 million (2024: $2,519 million) if compliance credits are not utilized.
There is measurement uncertainty related to asset retirement obligations as it involves estimates in determining settlement amount, discount rates and timing of settlement. Changes to any of these estimates and assumptions may result in change to the obligation.
Estimates of liabilities for contaminated sites are subject to measurement uncertainty because the existence and extent of contamination, the responsibility for cleanup and the timing and cost of remediation cannot be reasonably estimated in all circumstances. The degree of measurement uncertainty cannot be reasonably determined.
Pension liabilities (Schedule 14) of $7,504 million (2024: $7,904 million) are subject to measurement uncertainty because the actual experience of a plan may differ significantly from assumptions used in the calculation of the pension liabilities.
Some of the government organizations have year-ends that are other than March 31. The accounts of these organizations are consolidated based on the results of their latest financial year-end.
Estimation of transactions for the period between their year-ends and March 31 is therefore subject to measurement uncertainty.
While best estimates have been used for reporting items subject to measurement uncertainty, management considers that it is possible, based on existing knowledge, that changes in future conditions in the near term could require a material change in the recognized amounts. Near term is defined as a period of time not to exceed one year from the date of the financial statements.
Segment Disclosure
Segment information reflects the existing accountability framework for government and the way in which operations are managed. Inter-segment transfers are measured at carrying value. Segment information is reported in Schedules 1, 2, 3, 8 and 16 and is based on accountability, budgetary practices and governance relationships within the Province. Additional information is provided in ministry and other entity annual reports.
| NOTE 2 | VALUATION OF FINANCIAL ASSETS AND LIABILITIES |
The Province’s financial assets and liabilities are measured as follows:
| Financial Statement Component |
Measurement | |
| Cash and cash equivalents |
Cost | |
| Accounts receivable and advances |
Lower of cost or net recoverable value | |
| Portfolio investments |
Fair value and cost or amortized cost | |
| Loans receivable |
Lower of cost or net recoverable value | |
| Inventories for resale |
Lower of cost or net realizable value | |
| Derivative financial instruments |
Fair value | |
| Accounts payable and other accrued liabilities |
Cost | |
| Direct borrowing |
Amortized cost | |
| Government of Alberta | Annual Report 2024–25 | 39 | |
CONSOLIDATED FINANCIAL STATEMENTS
| NOTE 2 | continued |
The methods used to determine the fair values of portfolio investments (Schedule 6) are as follows:
| • | Interest-bearing securities: Public interest-bearing securities are valued at the year-end closing sale price or the average of the latest bid and ask prices quoted by an independent securities valuation company. Private mortgages are valued based on the net present value of future cash flows discounted using appropriate interest rate premiums over similar GoC benchmark bonds trading in the market. Private debt and loans are valued similar to private mortgages. |
| • | Equities: Public equities are valued at the year-end closing sale price or the average of the latest bid and ask prices quoted by an independent securities valuation company. The fair value of hedge fund investments is estimated by external managers. The fair value of private equities is estimated by managers or general partners of private equity funds, pools and limited partnerships. Valuation methods for private equities may encompass a broad range of approaches. The cost approach is used to value companies without either profits or cash flows. Established private companies are valued using the fair market value approach reflecting conventional valuation methods including discounted cash flows and earnings multiple analysis. |
| • | Inflation sensitive and alternative investments: The estimated fair value of private real estate investments is reported at the most recent appraised value, net of any liabilities against the real property. Real estate properties are appraised annually by qualified external real estate appraisers. Appraisers use a combination of methods to determine fair value including replacement cost, direct comparison, direct capitalization of earnings and discounted cash flows. The fair value of renewable resources investments is appraised annually by independent third-party evaluators. Infrastructure investments are valued similar to private equity investments. |
| • | Strategic, tactical and currency investments: The estimated fair value of infrastructure investments held in emerging market countries are valued similar to private equities. For tactical asset allocations, investments in derivative financial instruments provide overweight or underweight exposure to global equity and bond markets, including emerging markets. Currency investments consist of directly held currency forward and spot contracts. |
| • | Portfolio investments have indirect exposure to repurchase agreements through pooled funds, the carrying value of which is a component in the determination of net fair value of investments within the pools. |
The fair value of derivative financial instrument assets and liabilities (Schedule 10) relating to direct borrowing, loans receivable and portfolio investments at the reporting date is determined by the following methods:
| • | Equity and bond index swaps are valued based on changes in the appropriate market-based index net of accrued floating rate interest. |
| • | Equity index and interest rate future contracts are valued based on quoted market prices. |
| • | Forward foreign exchange contracts are valued based on differences between contractual foreign exchange rates and foreign exchange forward rates. |
| • | Interest rate swaps and cross currency interest rate swaps are valued based on discounted cash flows using current market yields and exchange rates. |
| • | Credit default swaps are valued based on discounted cash flows using current market yields and calculated default probabilities. |
| • | Options to enter into interest rate swap contracts are valued based on discounted cash flows using current market yields and volatility parameters which measure change in the underlying swap. |
| • | Warrants and rights are valued at the year-end closing sale price or the average of the latest bid and ask prices quoted by an independent securities valuation company. |
| 40 | Government of Alberta | Annual Report 2024–25 | |
CONSOLIDATED FINANCIAL STATEMENTS
| NOTE 2 | continued |
The fair value of derivative financial instruments represents the amount that the Province would receive (positive fair value) or pay (negative fair value) in the event contracts were terminated at year-end.
The quality and reliability of information used to estimate the fair value is classified according to the following fair value hierarchy with Level 1 being the highest quality and reliability:
Level 1: Unadjusted quoted prices in active markets for identical assets or liabilities traded in active markets.
Level 2: Valuation methods that make use of inputs, other than quoted prices included within Level 1, that are observable by market participation either directly through quoted prices for similar but not identical assets or indirectly through observable market information used in valuation models.
Level 3: Valuation methods where inputs that are based on non-observable market data have a significant impact on the valuation.
| NOTE 3 | FINANCIAL RISK MANAGEMENT |
The Province is exposed to the risks below, which may arise from both financial assets and financial liabilities. These financial risks include credit risk, market risk (comprised of currency risk, interest rate risk and price risk), liquidity risk and other financial risk. Identification and management of these risks are important to the fiscal health of the Province and are governed by prescriptive mandates, policies and legislative guidance. Changes associated with sensitivities to the risks disclosed in this note would be reflected in the Consolidated Statement of Remeasurement Gains and Losses. Sensitivity changes that impact realized revenues or expenses would be reflected in the Consolidated Statement of Operations.
| (a) | FINANCIAL ASSETS |
A large percentage of the Province’s financial assets are in the Alberta Heritage Savings Trust Fund (AHSTF). The objective is to invest in a diversified portfolio to maximize long-term returns at an acceptable level of risk. Investments in the Alberta Heritage Foundation for Medical Research Endowment Fund, the Alberta Heritage Scholarship Fund and the Alberta Heritage Science and Engineering Research Endowment Fund are managed to provide income, which can be used by the funds to fulfill their respective mandates for the purpose of making grants to students and to researchers in the fields of medicine, science and engineering.
In order to earn the best possible return at an acceptable level of risk, the Province has established policies for the asset mix of its investment portfolios through fund-specific statements of investment policies and goals/guidelines (SIP&Gs). The purpose of the SIP&Gs is to ensure funds are invested and managed in a prudent manner in accordance with current accepted governance practices incorporating an appropriate level of risk. The Province reduces its investment risk by holding many different types of assets, investing in securities from various governments and companies in different industries and countries, having quality constraints on fixed income instruments and restricting amounts exposed to countries designated as emerging markets. Forward foreign exchange contracts may be used to manage currency exposure in connection with securities purchased in a foreign currency.
| Government of Alberta | Annual Report 2024–25 | 41 | |
CONSOLIDATED FINANCIAL STATEMENTS
| NOTE 3 | continued |
| (b) | DEBT MANAGEMENT |
The majority of the Province’s non-derivative financial obligations relate to debt. The objective of the Province’s debt management activity is to raise funding for the Province and its agencies in a cost-effective manner, while ensuring that interest and principal for borrowed funds can be repaid as scheduled. The Province’s debt management goals include:
| • | ensuring sufficient liquidity to meet the Province’s financial commitments and withstand market disruptions; |
| • | providing stable and low-cost funding for the Province; |
| • | maintaining access to both domestic and global debt markets to provide financing and liquidity for the Province; and |
| • | strategically structuring the debt portfolio to allow for prudent management of maturities and refinancing. |
| (c) | CREDIT RISK |
The Province is primarily exposed to credit risk in the form of default risk, which is the risk that borrowers or counterparties to derivative contracts default on their payment obligations, and to a lesser extent downgrade risk, which is the risk of decline in value of debt security investments due to a credit downgrade of the issuer.
Loans Receivable
The following loans receivable are the most significant to the Province and represent where most of the concentration of credit risk resides within loans receivable.
Loans under the Local Authorities Capital Financing Act
The Province has policies in place to provide for the approval and monitoring of all lending activity, which includes establishing clear lines of authority for decision making and accountability. The Province also maintains a loan portfolio consisting of several different borrower categories, each with their own source of security to ensure repayment. The major categories of borrowers are as follows:
| • | Cities, towns, villages, specialized municipalities, counties, municipal districts, irrigation districts and regional services commissions account for a majority of loan assets held by the Province. This borrower category is regulated by the Municipal Government Act, which stipulates specific debt limits and debt servicing limits. The aforementioned group of borrowers is required to agree to raise and levy taxes and/or fees in an amount sufficient to pay their indebtedness to the Province as per the signed master loan agreements. Borrowers within 25% of their debt or debt service limit must include credit review documentation with applications, which includes 3 years audited financial statements and 3-5 years operating and capital budgets. Borrowers exceeding their regulated debt or debt service limit must obtain approval from the Minister of Municipal Affairs to incur additional debt. |
| • | Regional airport authorities utilize airport improvement fees to ensure repayment of existing loans. Security is also taken in the form of adequate land registration. |
Under the Local Authorities Capital Financing Act, there are two borrowers with loan portfolios comprising 57.4% (2024: two borrowers with loan portfolios comprising 56.1%) of the total loans made under this Act.
| 42 | Government of Alberta | Annual Report 2024–25 | |
CONSOLIDATED FINANCIAL STATEMENTS
| NOTE 3 | continued |
For the year ended March 31, 2025, all loans were performing in accordance with related terms and conditions and none were in arrears. One loan has been considered impaired and a valuation allowance recorded. Further details of the loans receivable made under the Local Authorities Capital Financing Act can be found in Schedule 9.
Loans under the Student Financial Assistance Act
There is credit risk associated with loans made under the Student Financial Assistance Act. To manage this risk, student loans are capped at $8,500 per term and a lifetime limit of $85,000 for a bachelor’s degree and $125,000 for a graduate program. Default payments are assigned to Crown Debt Collections, and the borrower is registered with a Canada Revenue Agency refund set-off program to redirect tax refunds and other government credits towards repayment of the loan. The Province assesses its loan receivables balance and its ability to collect on an annual basis. Further details of the loans receivable made under the Student Financial Assistance Act can be found in Schedule 9.
Loans under the Agriculture Financial Services Act
Security requirements for a loan or guarantee made under the Agriculture Financial Services Act depend on the risk involved in each individual operation. Adequate security is required for new and emerging businesses as well as for enterprises needing specialized or customized equipment. To mitigate credit risk, loan accounts are continually monitored to ensure prompt response to any financial difficulties customers may encounter.
Details of the loans receivable under the Agriculture Financial Services Act are outlined in Schedule 9. The majority of the loans receivable under this Act are from the grain and oilseeds as well as livestock sector.
Counterparty Default Risk - Derivative Financial Instruments
The Province enters into derivative financial instruments, both directly and indirectly through investment pools, to manage risk arising from financial assets and liabilities. The counterparties to these contracts often have obligations to the Province based on movements in value of the underlying asset, index or rate.
The Province has strict guidelines and strategies when entering directly into derivative financial instruments with counterparties which serve to mitigate default risk. To be an approved derivatives counterparty of the Province, a counterparty must have an International Swaps and Derivatives Association Master Agreement signed with the Province with no active events of default or termination and two or more investment grade long-term senior unsecured ratings (minimum A-/A3/A(low)) assigned by at least two reputable credit rating agencies. In addition, new derivative trades shall be transacted with an approved counterparty if the total market exposure of all existing derivative trades between the counterparty and the Province is within the assigned Current Exposure Limit and Term Limit (based on counterparty credit rating and credit support annex status). Where prudent, collateral agreements shall be negotiated with financial counterparties to reduce the Province’s exposure to a particular counterparty.
| Government of Alberta | Annual Report 2024–25 | 43 | |
CONSOLIDATED FINANCIAL STATEMENTS
| NOTE 3 | continued |
The Province’s maximum credit exposure is the amount of loss that would occur if all counterparties to contracts in a net favorable position were to default at once.
| Directly held | Indirectly held | |||||||||||||||
| Number of counterparties |
2025 | Number of counterparties |
2025 | |||||||||||||
| In millions |
||||||||||||||||
| Contracts in net favourable position |
||||||||||||||||
| (current credit exposure) |
2 | $ | 218 | 99 | $ | 43 | ||||||||||
| Contracts in net unfavourable position |
5 | (212 | ) | 18 | (340 | ) | ||||||||||
| Net fair value of derivative financial instruments |
$ | 6 | $ | (297 | ) | |||||||||||
| Directly held | Indirectly held | |||||||||||||||
| Number of counterparties |
2024 | Number of counterparties |
2024 | |||||||||||||
| In millions |
||||||||||||||||
| Contracts in net favourable position |
||||||||||||||||
| (current credit exposure) |
2 | $ | 50 | 102 | $ | 240 | ||||||||||
| Contracts in net unfavourable position |
6 | (584 | ) | 9 | (16 | ) | ||||||||||
| Net fair value of derivative financial instruments |
$ | (534 | ) | $ | 224 | |||||||||||
As at March 31, 2025, cash collateral for directly held derivative financial instruments pledged (Schedule 5) and received (Schedule 11), respectively, totaled $289 million and $157 million (2024: $134 million and $79 million). Cash and non-cash collateral for indirectly held derivative financial instruments pledged and received, respectively, totaled $388 million and $nil (2024: $221 million and $nil).
Credit Downgrade Risk
The Province holds, in its investment portfolio, debt securities whose value can be impacted by credit rating. Downgrade risk can generate losses when issuers of debt securities are downgraded by the debt securities’ credit rating agencies, leading to a fall in the fair value of the debt securities. The credit quality of financial assets is generally assessed by reference to external credit ratings. The credit rating of a debt security may be impacted by the overall credit rating of the counterparty, the seniority of the debt issue, bond covenants, maturity distribution and other factors. The majority of investments in debt securities have credit ratings considered to be investment grade. Unrated debt securities consist primarily of private mortgages, private debt and loan placements.
The table below summarizes the Province’s investment in debt securities by credit rating:
| 2025 | 2024 | |||
| Credit Rating | % | % | ||
| Investment Grade (AAA to BBB) |
87 | 86 | ||
| BB+ or lower |
2 | 2 | ||
| Unrated |
11 | 12 | ||
| Total |
100 | 100 | ||
| (d) | MARKET RISK |
The objective of market risk management is to manage and control market risk exposures within acceptable parameters set in various policies while optimizing the Province’s fiscal position.
| 44 | Government of Alberta | Annual Report 2024–25 | |
CONSOLIDATED FINANCIAL STATEMENTS
| NOTE 3 | continued |
Interest Rate Risk
The Province is exposed to interest rate risk associated with:
| • | Interest-bearing securities held in portfolio investments: A rise in interest rates will typically mean a drop in fair value (and vice versa), with longer-term interest bearing securities being more sensitive to interest rate changes than shorter-term bonds. If interest rates increased by 1.0%, and all other variables were held constant, there would be a potential unrealized loss of $447 million (2024: $405 million), or approximately 0.8% (2024: 0.9%) of total investments. This rate change would also result in a potential gain in net investment income over the next 12 months, based on investments held as at the reporting date, of approximately $10 million (2024: $8 million). |
| • | Loans under the Local Authorities Capital Financing Act and related direct borrowing: Interest rate risk arises when debt issued to fund loans made under the Local Authorities Capital Financing Act does not match the term and rate of those loans. The Province manages this risk by swapping its fixed rate interest to floating rates (receive floating/pay fixed for loan interest income; pay floating/receive fixed for debt interest expense) so that movements in market interest rates are counterbalanced by offsetting revenue and expense streams. |
Since derivatives are utilized for risk management purposes, it is not the practice of the Province to terminate derivative financial instruments before maturity and realize gains or losses on early terminations. On occasion, borrowers under the Local Authorities Capital Financing Act will prepay loans which have swap contracts attached to them. The borrower is required to pay a penalty which serves to offset the Province’s cost to unwind the associated swap.
The table below shows maturities and cash inflows and outflows of the Province’s interest rate swaps:
| 2026 | 2027-2031 | 2032 and after | Total | |||||||||||||
| In millions |
||||||||||||||||
| Canadian dollar interest rate swaps |
||||||||||||||||
| Interest outflows |
$ | (549) | $ | (2,008) | $ | (1,860) | $ | (4,417) | ||||||||
| Interest inflows |
562 | 2,098 | 2,132 | 4,792 | ||||||||||||
| Cross-currency interest rate swaps (a) |
||||||||||||||||
| Principal outflows |
(1,682 | ) | (1,458 | ) | (619 | ) | (3,759 | ) | ||||||||
| Principal inflows |
1,725 | 1,498 | 676 | 3,899 | ||||||||||||
| Interest outflows |
(111 | ) | (178 | ) | (375 | ) | (664 | ) | ||||||||
| Interest inflows |
52 | 86 | 101 | 239 | ||||||||||||
| Net cash (outflows)/inflows |
$ | (3 | ) | $ | 38 | $ | 55 | $ | 90 | |||||||
| (a) | Canadian dollar equivalent, converted at the year-end rate of exchange for each currency. Currency includes US dollar, Swedish kronor, Euro and Australian dollar. Future floating legs paid/received are assumed to be at the year-end rate of exchange. |
Fluctuations in interest rates will impact the Province’s interest income and debt servicing costs, as the Province accounts for net expense on loan swaps (pay fixed/receive floating) as a component of interest income and accounts for net expense on debt swaps (pay floating/receive fixed) as a component of debt servicing costs. Sensitivity to these fluctuations can be represented by the outstanding notional amounts of the debt and loan swaps. The interest sensitivity arises due to the floating leg of the interest rate swap.
| Government of Alberta | Annual Report 2024–25 | 45 | |
CONSOLIDATED FINANCIAL STATEMENTS
| NOTE 3 | continued |
A 1.0% increase/(decrease) in interest rates, other variables held constant, would result in an increase/(decrease) in debt servicing cost of $63 million (2024: $58 million) and an increase/(decrease) in interest income of $84 million (2024: $70 million).
| • | Loans under the Student Financial Assistance Act: Interest income is affected by the fluctuation and degree of volatility in interest rates. Interest free grace period on repayments of student loans is one year, effective July 1, 2023. In addition, since July 1, 2023, interest rates charged on student loans is the prime lending rate. Both interest rates and prime lending rates are monitored and compared to other jurisdictions and adjusted accordingly. If interest rate increased/(decreased) by 1.0%, there would be an increase/(decrease) to loan interest revenue by $15 million (2024: $13 million). Further details of the loans receivable under the Student Financial Assistance Act are outlined in Schedule 9. |
| • | Loans under the Agriculture Financial Services Act: These consist of loans with interest rates fixed either until maturity date or for a term with a renewable option. In prior years, customers were allowed to prepay their loans without any prepayment penalties. On most new loans, customers can pay a maximum of 25% of the loan balance without prepayment penalty. In the normal course of business, loan customers prepay their loans in part or in full prior to the contractual maturity date. Impact of interest rate changes on performance of loan portfolio and cash flows could be significant as a result of changes in market interest rates and borrower’s repayment preferences. Further details of the loans receivable under the Agriculture Financial Services Act are outlined in Schedule 9. |
Foreign Currency Risk
The Province’s most significant exposure to foreign currency risk arises from:
| • | Underlying securities held in pooled investment funds and other investments that are denominated in currencies other than the Canadian dollar; and |
| • | Issuance of debt in foreign currency. |
Investment Foreign Currency Risks
The Province is exposed to foreign currency risk associated with the underlying securities held in the pools and other investments that are denominated in currencies other than the Canadian dollar. Fluctuations in the relative value of the Canadian dollar against these foreign currencies can result in a positive or negative effect on the fair value of investments. Approximately 34.2% (2024: 29.3%) of the Province’s investments, or $18,345 million (2024: $13,850 million), are exposed to foreign currency risk, with the largest foreign currency exposure being to the US dollar, 23.1% (2024: 19.3%) and the Euro, 3.7% (2024: 2.8%). If the value of the Canadian dollar increased by 10% against all other currencies, and all other variables were held constant, there would be a potential unrealized loss of $1,835 million (2024: $1,385 million), or approximately 3.4% (2024: 2.9%) of total investments. This value change would also result in a potential loss in investment income over the next 12 months, based on investments held as at the reporting date, of approximately $20 million (2024: $47 million).
| 46 | Government of Alberta | Annual Report 2024–25 | |
CONSOLIDATED FINANCIAL STATEMENTS
| NOTE 3 | continued |
The following table summarizes the Province’s exposure to foreign currency investments related to unrealized gains and losses:
| 2025 | 2024 | |||||||||||||||
| Carrying value | Sensitivity - 10% | Carrying value | Sensitivity - 10% | |||||||||||||
| (CAD) | increase (CAD) | (CAD) | increase (CAD) | |||||||||||||
| In millions |
||||||||||||||||
| US dollars |
$ | 12,387 | $ | (1,239) | $ | 9,146 | $ | (915) | ||||||||
| Euros |
1,958 | (196) | 1,306 | (131) | ||||||||||||
| British pounds |
1,162 | (116) | 905 | (90) | ||||||||||||
| Japanese yen |
515 | (52) | 512 | (51) | ||||||||||||
| Other foreign currency |
2,323 | (232) | 1,981 | (198) | ||||||||||||
| Total foreign currency investments |
$ | 18,345 | $ | (1,835) | $ | 13,850 | $ | (1,385) | ||||||||
Debt Foreign Currency Risks
The Province is also exposed to foreign currency risk through issuance of debt in foreign currency. If left unhedged, the cost of repaying and servicing foreign currency debt will vary with changes in the value of the Canadian dollar relative to other currencies. This has the potential to significantly increase the cost of making interest and principal payments.
A 10% increase in the strength of the Canadian dollar versus all other currencies, other variables held constant, would result in a decrease to the carrying value of debt of $2,658 million
(2024: $2,269 million - restated) and a decrease in the fair value of derivatives of $2,478 million (2024: $2,150 million). A 10% decrease in the strength of the Canadian dollar would result in an increase in the carrying value of debt of $3,249 million (2024: $2,773 million - restated) and an increase in the fair value of derivatives of $3,028 million (2024: $2,628 million).
The Province uses cross-currency swaps to hedge against the fluctuations in foreign currency by matching all critical terms of foreign currency term debt and locking in the exchange rate, thus providing consistent Canadian dollar equivalent cash flows throughout the term of the contract. At each interest payment date and at maturity of a foreign currency bond, the Province will pay Canadian dollars at a fixed rate and receive a fixed amount in foreign currency. Currency forwards lock in future exchange rates for short-term borrowing in the US Commercial Paper market.
The carrying value of foreign currency debt in the Consolidated Statement of Financial Position is impacted by fluctuations in foreign exchange rates, and correspondingly the carrying value of foreign currency derivatives is also impacted. Throughout the life of a foreign currency bond and associated derivative, these impacts are not perfectly offsetting due to other factors and create volatility in the Consolidated Statement of Financial Position and in the Consolidated Statement of Remeasurement Gains and Losses, despite a perfect functioning hedging relationship. This volatility is never realized in the Consolidated Statement of Operations as hedging derivatives are not terminated prior to maturity. Change in the foreign debt due to foreign currency fluctuation is equal to the change in carrying value of the associated derivative immediately prior to maturity.
| Government of Alberta | Annual Report 2024–25 | 47 | |
CONSOLIDATED FINANCIAL STATEMENTS
| NOTE 3 | continued |
The table below shows maturities and cash inflows and outflows of the Province’s foreign currency swaps and currency forwards:
| Derivative Type | 2026 | 2027-2031 | 2032 and after | Total | ||||||||||||
| In millions |
||||||||||||||||
| Currency forwards (a) |
||||||||||||||||
| Principal outflows |
$ | (501 | ) | $ | - | $ | - | $ | (501 | ) | ||||||
| Principal inflows |
503 | - | - | 503 | ||||||||||||
| Cross-currency swaps (b) |
||||||||||||||||
| Principal outflows |
$ | (9,339 | ) | $ | (8,515) | $ | (8,012) | $ | (25,866) | |||||||
| Principal inflows |
9,417 | 9,096 | 8,252 | 26,765 | ||||||||||||
| Interest outflows |
(629 | ) | (2,290 | ) | (1,499 | ) | (4,418 | ) | ||||||||
| Interest inflows |
507 | 2,170 | 1,326 | 4,003 | ||||||||||||
| Net cash inflows/(outflows) |
$ | (42) | $ | 461 | $ | 67 | $ | 486 | ||||||||
| (a) | Canadian dollar equivalent, converted at the year-end rate of exchange for each currency. Currency forwards are used for US dollar transactions only. |
| (b) | Excludes cross-currency interest rate swaps, whose maturity and cashflow profile is disclosed in the table for Interest Rate Risk. Canadian dollar equivalent, converted at the year-end rate of exchange for each currency. Currencies include US dollars, Swedish kronor, Euros, Australian dollars, New Zealand dollars and Swiss francs. Future floating legs paid/received are assumed to be at the year-end rate of exchange. |
Price Risk
The Province is exposed to price risk associated with equities held in portfolio investments. Price risk is managed through diversification of asset class allocations and security selection within equity products. If equity market indices were to decline by 10%, and all other variables were held constant, there would be a potential unrealized loss of $2,745 million (2024: $2,230 million) or 5.1% (2024: 4.7%) of total investments. This indices change would also result in a potential loss in investment income over the next 12 months, based on investments held as at the reporting date, of approximately $311 million (2024: $507 million).
| (e) | LIQUIDITY RISK |
The Province takes active approaches to address liquidity risk through borrowing strategy, cash flow forecasting and modelling, cash reserves and pooling, credit facilities, use of derivative financial instruments and other strategies.
Cash pooling through the Consolidated Liquidity Solution (CLS) helps the Province manage liquidity risk by pooling surplus cash and providing greater access to surplus cash reserves. In the event the Province has a liquidity shortfall, surplus cash in the CLS can provide funding to cover the shortfall, reducing the risk of default or missed payments and reducing overall cost of borrowing.
The Province also maintains cash reserves that are reported under the deposit and short-term securities included in portfolio investments (Schedule 6) to ensure funds are available in the event it is unable to access the capital markets in a timely manner and at a reasonable cost, as well as sets aside sufficient funds to retire maturing debt. These funds are investment-grade, highly liquid short-term investments managed for liquidity and effective cash management.
In addition, the Province maintains credit and overdraft facilities to fund its obligations and operational needs when there is a cash flow timing mismatch. The Province expects to meet its
| 48 | Government of Alberta | Annual Report 2024–25 | |
CONSOLIDATED FINANCIAL STATEMENTS
| NOTE 3 | continued |
obligations from operating cash flows, results of bond issuances and proceeds of maturing financial assets.
Accounts payable and other accrued liabilities are primarily short-term in nature and due within a year. Liabilities from coal phase-out agreements totaling $514 million (2024: $610 million), included in grants payable (Schedule 11), relate to payments that will be made by the Province for the next five years to phase out coal usage. They are repayable as follows: less than one year - $79 million; one to five years - $435 million. Maturities for direct borrowing are disclosed in Schedule 13.
| (f) | OTHER FINANCIAL RISK |
Refinancing Risk
The orderly retirement of future debt obligations without incurring undue refinancing risk is important both in terms of managing future interest costs and accessing required funding in future years. To this end, the Province will use its best efforts to smooth out short-term debt maturities from less than one year to greater than 30 years. The Province’s Debt Management Policy ensures that no more than 15% of its total outstanding term debt (including term debt borrowed and lent to provincial corporations), based on par value, matures in any 12-month period. The use of short-term debt increases the amount of interest rate risk as it requires more frequent refinancing and resetting of interest rates. However, short-term debt does typically provide an opportunity to lower overall interest costs, to capitalize on periods of low interest rates and to repay outstanding debt more quickly should excess funds be available. The Province also identifies bond buy-back opportunities, whereby short-term borrowing or excess cash can be used to buy back outstanding term debt, thus reducing refinancing risk and future liquidity risk.
| NOTE 4 | BUDGET AND LEGISLATIVE AUTHORITY |
The Province’s Fiscal Plan is prepared in accordance with the Sustainable Fiscal Planning and Reporting Act consistent with the scope and accounting policies used in the Province’s consolidated financial statements. The Fiscal Plan documents, which describe the Province’s budget for the 2025 fiscal year, were tabled in the Legislature on February 29, 2024.
| NOTE 5 | CONTRACTUAL RIGHTS |
Contractual rights are rights of the Province to economic resources arising from contracts or agreements that will result in both assets and revenues in the future when the terms of those contracts or agreements are met.
| 2025 | 2024 | |||||||
| In millions |
||||||||
| Contractual rights from operating leases, contracts and programs |
$ | 3,597 | $ | 4,057 | ||||
| Other capital contracts |
47 | 69 | ||||||
| $ | 3,644 | $ | 4,126 | |||||
| Government of Alberta | Annual Report 2024–25 | 49 | |
CONSOLIDATED FINANCIAL STATEMENTS
| NOTE 5 | continued |
Estimated amounts that will be received or receivable for each of the next five years and thereafter are as follows:
| Contractual rights from operating leases, contracts and programs |
Other capital contracts |
Total | ||||||||||||
| In millions | ||||||||||||||
| 2025-26 |
$ | 656 | $ | 32 | $ | 688 | ||||||||
| 2026-27 |
1,114 | 8 | 1,122 | |||||||||||
| 2027-28 |
876 | 7 | 883 | |||||||||||
| 2028-29 |
411 | - | 411 | |||||||||||
| 2029-30 |
373 | - | 373 | |||||||||||
| Thereafter |
167 | - | 167 | |||||||||||
| $ | 3,597 | $ | 47 | $ | 3,644 | |||||||||
| NOTE 6 | CONTINGENT ASSETS |
The Province has contingent assets for fine revenues. Fine revenues are recognized at the point of conviction, which excludes certain outstanding federal statute and provincial statute fines that are satisfied by means other than cash payment. As at March 31, 2025, the estimate of contingent assets for fines revenues is $25 million (2024: $25 million).
| NOTE 7 | CONTRACTUAL OBLIGATIONS AND COMMITMENTS |
Contractual obligations represent a legal obligation of the Province to others and will become liabilities in the future when the terms of the contract are met.
| 2025 | 2024 | |||||||
| In millions |
||||||||
| Obligations under operating leases, contracts and programs |
$ | 35,773 | $ | 38,344 | ||||
| Obligations under capital leases and public private partnerships |
||||||||
| Operations and maintenance payments |
3,704 | 3,333 | ||||||
| Capital payments |
335 | 147 | ||||||
| Interest payments |
186 | 23 | ||||||
| Other Capital Obligations (a) |
5,259 | 3,850 | ||||||
| $ | 45,257 | $ | 45,697 | |||||
| (a) | Obligations associated with contracts for capital projects includes procurement for facilities, equipment and information technology and capital grants. |
| 50 | Government of Alberta | Annual Report 2024–25 | |
CONSOLIDATED FINANCIAL STATEMENTS
| NOTE 7 | continued |
Estimated payment requirements for each of the next five years and thereafter are as follows:
| Operating leases, contracts and programs |
Operations and maintenance payments |
Capital payments |
Interest payments |
Other capital obligations |
Total | |||||||||||||||||||
| In millions | ||||||||||||||||||||||||
| 2025-26 |
$ | 11,344 | $ | 191 | $ | 22 | $ | 1 | $ | 2,597 | $ | 14,155 | ||||||||||||
| 2026-27 |
6,037 | 166 | 20 | 1 | 1,135 | 7,359 | ||||||||||||||||||
| 2027-28 |
4,907 | 180 | 18 | 6 | 581 | 5,692 | ||||||||||||||||||
| 2028-29 |
2,903 | 182 | 15 | 11 | 404 | 3,515 | ||||||||||||||||||
| 2029-30 |
2,294 | 166 | 13 | 11 | 313 | 2,797 | ||||||||||||||||||
| Thereafter |
8,288 | 2,819 | 247 | 156 | 229 | 11,739 | ||||||||||||||||||
| $ | 35,773 | $ | 3,704 | $ | 335 | $ | 186 | $ | 5,259 | $ | 45,257 | |||||||||||||
Major commitments included in the above figures are commitments for capital construction and service contracts for health and education facilities and highways.
The Province has various commitments relating to the devolution of services or disposition of assets to the private sector. Those commitments include the performance of duties and obligations if the private sector organization fails to meet them.
The Province provides financial incentives in the form of grants to encourage the private sector investment in new or expanded Alberta-based petrochemical manufacturing facilities, including those producing value-added petrochemical, hydrogen, fertilizer and fuel products under the Alberta Petrochemicals Incentive Program (APIP). To qualify for the APIP grants, the project must be commercially operational for a year and reach agreed-upon milestones in the grant agreement. As at March 31, 2025, five (2024: three) grant agreements were approved under this program with $380 million (2024: $445 million) remaining to be disbursed.
The Province also has various commitments for investments in limited partnerships totalling $144 million (2024: $115 million). Committed funds are paid to limited partnerships in amounts and at times determined by the general partner in order to meet the limited partnership funding commitments.
The Province has outstanding approved undisbursed loan commitments of $263 million (2024: $246 million).
| NOTE 8 | CONTINGENT LIABILITIES |
Set out below are details of contingent liabilities resulting from guarantees, indemnities, litigation and possible obligations, other than those reported as liabilities. Any losses arising from the settlement of contingent liabilities are treated as current year expenses.
| (a) | GUARANTEES AND INDEMNITIES |
The Province provided guarantees under the Feeder Associations Guarantee Act of $150 million (2024: $149 million). The authorized guarantee limit set by Order in Council is $150 million. The lender takes appropriate security prior to issuing a loan to the borrower, which is guaranteed by the Province. The security taken depends on the nature of the loan. Interest rates are negotiated with the lender by the borrower.
| Government of Alberta | Annual Report 2024–25 | 51 | |
CONSOLIDATED FINANCIAL STATEMENTS
| NOTE 8 | continued |
Through the Public Trustee Act, the Province also unconditionally guarantees the amount outstanding on a client’s guaranteed account as administered by the Office of the Public Guardian and Trustee. As at March 31, 2025, the potential liability of the Province based on the outstanding balance of the Client Guaranteed Accounts is $482 million (2024: $486 million).
The Province has an indemnity associated with the Canadian Blood Services (CBS). The CBS has established two wholly-owned captive insurance corporations, CBS Insurance Company Limited (CBSI) and Canadian Blood Services Captive Insurance Company Limited (CBSE). The CBSI provides insurance coverage up to $300 million with respect to risks associated with the operation of the blood system, while the excess policy held by CBSE provides coverage up to $700 million. The CBSE was capitalized in whole through funding from the provinces and territories (except Quebec), through a Captive Support Agreement (CSA) dated September 28, 2006, between the provinces, territories and CBSE. Under the CSA, each of the provinces and territories provided their Pro Rata Share (as defined in the CSA) through an indemnity. Alberta’s Pro Rata Share is 15% of CBSE’s total capital amount, which amounts to $105 million. Authority for Alberta to provide the indemnity under the CSA is pursuant to section 5.05 of the Indemnity Authorization Regulation 22/1997, under the Financial Administration Act. The expense recognition criterion for the indemnity is notification from CBS indicating that the indemnity is required. As at March 31, 2025, no amount has been recognized for this indemnity.
The Province, through the Canadian Securities Administrators National Systems operations management and governance agreement, has committed to pay 25% of any shortfall from approved system operating costs that exceed revenues should there not be an accumulated operating surplus available to offset. As at March 31, 2025, the accumulated operating surplus is $163 million (2024: $184 million). Payments under guarantees are a statutory charge on the Province.
The Province has authorized Alberta Investment Management Corporation (AIMCo) to acquire a revolving credit facility with CIBC to access up to a maximum of $2.0 billion in cash. The facility allows AIMCo to borrow money for the purpose of performing its functions under its investment management agreements with clients by providing the pools with necessary liquidity. The Province has guaranteed the amounts borrowed from CIBC used to finance investments within the pools, amounting to $nil at March 31, 2025 (2024: $nil). Since the funds are used to finance investments within the pools, the liability is recognized by clients as part of their pool investment net asset value and is not recognized as a liability for AIMCo or the Province.
The Province entered into multiple agreements to provide loan guarantees of $747 million
(2024: $682 million) in favour of ATB Financial or other Canadian financial institutions as agents and other secured creditors (Creditor Groups) to enable various consortiums of Alberta First Nations, Indigenous Communities and private entities (borrowers) participation in various projects. In the event loan conditions are breached and that breach remains uncured, the Creditor Groups have a right against the Province to call on their individual loan guarantees to offset any losses incurred by the Creditor Groups with respect to amounts loaned to the borrowers by the Creditor Groups. As at March 31, 2025, no known breaches have been identified for any agreements.
The Province has contingent liabilities with respect to various indemnities as permitted under the Financial Administration Act. The indemnified amount and corresponding liability cannot be reasonably estimated.
| (b) | LEGAL ACTIONS |
As at March 31, 2025, the Province is involved in legal matters where damages are being sought. These matters give rise to contingent liabilities.
| 52 | Government of Alberta | Annual Report 2024–25 | |
CONSOLIDATED FINANCIAL STATEMENTS
| NOTE 8 | continued |
Accruals have been made in specific instances where it is likely that losses will be incurred based on a reasonable estimate. As at March 31, 2025, the Province has been named in 103 (2024: 92) claims and the total claimed amount for these likely claims is $13,282 million (2024: $15,010 million), of which $736 million (2024: $378 million) has been accrued as a liability. The resulting liability, if any, from likely claims in excess of the amounts accrued is not determinable or a reasonable estimate cannot be made.
The Province has been named in 623 (2024: 667) claims of which the outcome is not determinable. Of these claims, 488 (2024: 509) have specified amounts totaling $22.1 billion (2024: $18.5 billion). The remaining 135 (2024: 158) claims have no amounts specified. The resolution of indeterminable claims may result in a liability, if any, that may be significantly lower than the claimed amount.
In addition, the Province has been named in 21 (2024: 19) claims in matters such as Aboriginal rights, Aboriginal title and treaty rights. In most cases, these claims have been filed jointly and severally against the Province and the GoC and in some cases involve third parties. Of these claims, nine (2024: nine) have specified amounts totaling $102.7 billion (2024: $102.7 billion) plus a provision for interest and other costs that are not determinable. The remaining 12 (2024: 10) claims have no amounts specified. Included in the total claims above, there are seven (2024: seven) claims for treaty land entitlement for which the Province may have an obligation under the Natural Resources Transfer Agreement. Of these claims, three (2024: three) have specified amounts totaling $26.7 billion (2024: $26.7 billion). The remaining four claims (2024: four) have no amounts specified.
| (c) | TAX ASSESSMENTS |
As at March 31, 2025, 949 (2024: 942) corporate income tax files totaling $1,389 million (2024: $1,115 million) are under objection or dispute. The resulting loss, if any, cannot be reasonably estimated.
| (d) | LAND AND PROPERTY RIGHTS TRIBUNAL |
The Land and Property Rights Tribunal (Tribunal) was established by the Land and Property Rights Tribunal Act. The Province facilitates payments with “Direction to Pay” from the Tribunal to the applicants for the rental recovery. As at March 31, 2025, $13 million (2024: $9 million) has been accrued as a liability. There is an estimated backlog of applications totaling $14 million (2024: $17 million). The outcome for all applications is not determinable.
| (e) | CONTINGENT ENVIRONMENTAL LIABILITIES |
While clean-up work may be required in the future, the Province has not recognized a liability for a significant number of section 142 and legacy sites (Note 1(d)) as the Province is at various stages of testing, evaluation and studies to determine the extent of contamination and possible site management options. Legacy sites are sites where there is no person or organization responsible and covers various industries such as energy sites, coal mines and other industrial sites that often pre-dates existing environmental legislation. The Province has regulatory systems to determine the nature and extent of potential environmental concerns, if any responsible party can be identified to clean up the site, the applicable environmental standard the site is to be cleaned up to, if needed, and developing site management options with reasonable cost estimates to complete any required work. The outcome of these activities may result in the recognition of additional environmental liabilities in the future when they are likely, measurable and the Province has accepted responsibility.
| Government of Alberta | Annual Report 2024–25 | 53 | |
CONSOLIDATED FINANCIAL STATEMENTS
| NOTE 9 | TRUST FUNDS UNDER ADMINISTRATION |
Trust funds consist of public money over which the Legislature has no power of appropriation. They are not included in the consolidated financial statements because the Province has no equity in the funds and administers them for the purposes of various trusts. As at March 31, 2025, trust funds under administration are as follows:
| 2025 | 2024 | |||||||
| In millions |
||||||||
| Public Sector Pension Plan Funds |
$ | 8,081 | $ 7,477 | |||||
| Public Trustee |
686 | 667 | ||||||
| Special Areas Trust Account |
348 | 347 | ||||||
| Environmental risk mitigation cash and securities (Schedule 12) |
278 | 270 | ||||||
| Various Court Offices and Fines Distribution Trust |
166 | 149 | ||||||
| Miscellaneous trust funds |
1,103 | 904 | ||||||
| $ | 10,662 | $ 9,814 | ||||||
Supplementary Information
Certain pension plan assets and other funds for which the Alberta Investment Management Corporation provides investment management services are excluded from the table above, as the Province is not the trustee of these plan assets and other funds, which have a total value of $138.9 billion (2024: $127.2 billion).
| NOTE 10 | COMPARATIVE FIGURES |
Certain 2024 figures have been reclassified, where necessary, to conform to 2025 presentation.
| 54 | Government of Alberta | Annual Report 2024–25 | |
CONSOLIDATED FINANCIAL STATEMENTS
Schedules to the Consolidated Financial Statements
| REVENUES | SCHEDULE 1 |
| 2025 | 2024 | |||||||||||
| Budget | Actual | Actual | ||||||||||
| In millions | ||||||||||||
| Income taxes |
||||||||||||
| Personal income tax |
$ 15,604 | $ 16,120 | $ 15,160 | |||||||||
| Corporate income tax |
7,028 | 7,892 | 6,882 | |||||||||
| Interest and penalties on corporate income tax |
- | 233 | 162 | |||||||||
| 22,632 | 24,245 | 22,204 | ||||||||||
| Other taxes |
||||||||||||
| Education property tax |
2,733 | 2,797 | 2,526 | |||||||||
| Fuel tax |
1,398 | 1,431 | 269 | |||||||||
| Insurance taxes |
908 | 914 | 846 | |||||||||
| Tobacco tax and cannabis levy |
669 | 646 | 649 | |||||||||
| Tourism levy |
118 | 126 | 116 | |||||||||
| Freehold mineral rights tax |
100 | 124 | 125 | |||||||||
| Land Titles Registration Levy |
77 | 62 | - | |||||||||
| Interest and penalties on other tax |
10 | 11 | 12 | |||||||||
| 6,013 | 6,111 | 4,543 | ||||||||||
| Non-renewable resource revenue |
||||||||||||
| Bitumen royalty |
12,538 | 17,167 | 14,518 | |||||||||
| Crude oil royalty |
2,779 | 3,037 | 2,972 | |||||||||
| Natural gas and by-products royalty |
1,468 | 1,220 | 1,057 | |||||||||
| Bonuses and sales of Crown leases |
321 | 385 | 498 | |||||||||
| Coal royalty, rentals and fees |
209 | 177 | 242 | |||||||||
| 17,315 | 21,986 | 19,287 | ||||||||||
| Transfers from Government of Canada |
||||||||||||
| Canada health transfers |
6,164 | 6,161 | 5,964 | |||||||||
| Canada social transfers |
2,001 | 1,993 | 1,908 | |||||||||
| Early learning child care agreements |
1,139 | 1,208 | 881 | |||||||||
| Infrastructure Support |
840 | 767 | 715 | |||||||||
| Agriculture support programs |
537 | 507 | 615 | |||||||||
| Labour market agreements |
322 | 252 | 322 | |||||||||
| Other |
1,636 | 1,730 | 1,931 | |||||||||
| 12,639 | 12,618 | 12,336 | ||||||||||
| Net income/(loss) from government business enterprises (Schedule 8) |
||||||||||||
| Alberta Gaming, Liquor and Cannabis Commission |
2,302 | 2,263 | 2,370 | |||||||||
| ATB Financial |
266 | 348 | 337 | |||||||||
| Balancing Pool |
65 | 50 | 160 | |||||||||
| Alberta Petroleum Marketing Commission |
(525 | ) | (616 | ) | (1,637 | ) | ||||||
| Other |
15 | 8 | 7 | |||||||||
| 2,123 | 2,053 | 1,237 | ||||||||||
| Net investment income |
3,267 | 4,803 | 4,587 | |||||||||
| Premiums, fees and licences |
||||||||||||
| Tuition |
1,999 | 2,058 | 1,836 | |||||||||
| Health fees and charges |
621 | 662 | 623 | |||||||||
| Crop, hail and livestock insurance premiums |
695 | 639 | 619 | |||||||||
| Motor vehicle licences |
594 | 603 | 969 | |||||||||
| Energy Industry Levies |
394 | 409 | 400 | |||||||||
| Other |
1,081 | 1,133 | 1,118 | |||||||||
| 5,384 | 5,504 | 5,565 | ||||||||||
| Other |
||||||||||||
| Sales, rentals and services |
947 | 1,159 | 1,175 | |||||||||
| Investment management charges |
936 | 918 | 860 | |||||||||
| Fundraising, donations, gifts and contributions |
784 | 844 | 784 | |||||||||
| Tobacco Settlement (Schedule 5) |
- | 713 | - | |||||||||
| Fines and penalties |
203 | 222 | 174 | |||||||||
| Endowment contributions and reinvested income |
- | 216 | 87 | |||||||||
| Technology innovation and emissions reduction |
539 | 172 | 907 | |||||||||
| Other |
755 | 905 | 992 | |||||||||
| 4,164 | 5,149 | 4,979 | ||||||||||
| $ 73,537 | $ 82,469 | $ 74,738 | ||||||||||
| Government of Alberta | Annual Report 2024–25 | 55 | |
CONSOLIDATED FINANCIAL STATEMENTS
| REVENUES BY SOURCE BY MINISTRY | SCHEDULE 2 |
| Income taxes |
Other taxes |
Non- renewable resource revenue |
Transfers from Government of Canada |
Net income from government business enterprises (Schedule 8) |
Net investment income |
Premiums, fees and licences |
Other | Subtotal | Consolidation adjustments |
2025 Total |
2024 Total (a) |
|||||||||||||||||||||||||||||||||||||
| In millions | ||||||||||||||||||||||||||||||||||||||||||||||||
| Office of the Legislative Assembly and Offices of the Legislature |
$ | - | $ | - | $ | - | $ | - | $ | - | $ | - | $ | - | $ | - | $ | - | $ | - | $ | - | $ | - | ||||||||||||||||||||||||
| Ministries (a) |
||||||||||||||||||||||||||||||||||||||||||||||||
| Advanced Education |
- | - | - | 666 | (9 | ) | 600 | 2,063 | 1,897 | 5,217 | (441 | ) | 4,776 | 4,205 | ||||||||||||||||||||||||||||||||||
| Affordability and Utilities |
- | - | - | - | 50 | 1 | 32 | 77 | 160 | (1 | ) | 159 | 268 | |||||||||||||||||||||||||||||||||||
| Agriculture and Irrigation |
- | - | - | 508 | - | 131 | 682 | 28 | 1,349 | (49 | ) | 1,300 | 1,413 | |||||||||||||||||||||||||||||||||||
| Arts, Culture and Status of Women |
- | - | - | 24 | - | - | 11 | 13 | 48 | (1 | ) | 47 | 55 | |||||||||||||||||||||||||||||||||||
| Children and Family Services |
- | - | - | 103 | - | - | - | 16 | 119 | - | 119 | 124 | ||||||||||||||||||||||||||||||||||||
| Education |
- | 2,797 | - | 147 | - | 61 | 213 | 699 | 3,917 | (396 | ) | 3,521 | 3,213 | |||||||||||||||||||||||||||||||||||
| Energy and Minerals |
- | 124 | 21,986 | - | (616 | ) | 6 | 381 | 3 | 21,884 | (1 | ) | 21,883 | 18,157 | ||||||||||||||||||||||||||||||||||
| Environment and Protected Areas |
- | - | - | 22 | - | 28 | 6 | 295 | 351 | (39 | ) | 312 | 1,045 | |||||||||||||||||||||||||||||||||||
| Executive Council |
- | - | - | - | - | - | - | - | - | - | - | - | ||||||||||||||||||||||||||||||||||||
| Forestry and Parks |
- | - | - | 25 | - | - | 248 | 25 | 298 | (2 | ) | 296 | 309 | |||||||||||||||||||||||||||||||||||
| Health |
- | - | - | 6,444 | - | 174 | 701 | 1,926 | 9,245 | (627 | ) | 8,618 | 7,439 | |||||||||||||||||||||||||||||||||||
| Immigration and Multiculturalism |
- | - | - | 2 | - | - | 11 | - | 13 | - | 13 | 14 | ||||||||||||||||||||||||||||||||||||
| Indigenous Relations |
- | - | - | 8 | - | - | 4 | 2 | 14 | - | 14 | 15 | ||||||||||||||||||||||||||||||||||||
| Infrastructure |
- | - | - | 9 | - | - | 3 | 83 | 95 | (43 | ) | 52 | 95 | |||||||||||||||||||||||||||||||||||
| Jobs, Economy and Trade |
- | - | - | 1,263 | - | - | 1 | 84 | 1,348 | - | 1,348 | 1,083 | ||||||||||||||||||||||||||||||||||||
| Justice |
- | - | - | 41 | - | 1 | 29 | 175 | 246 | (25 | ) | 221 | 215 | |||||||||||||||||||||||||||||||||||
| Mental Health and Addiction |
- | - | - | 155 | - | 9 | 4 | 37 | 205 | (12 | ) | 193 | 149 | |||||||||||||||||||||||||||||||||||
| Municipal Affairs |
- | - | - | 282 | - | 1 | 22 | 16 | 321 | - | 321 | 319 | ||||||||||||||||||||||||||||||||||||
| Public Safety and Emergency Services |
- | - | - | 174 | - | 2 | 53 | 185 | 414 | (5 | ) | 409 | 287 | |||||||||||||||||||||||||||||||||||
| Seniors, Community and Social Services |
- | - | - | 356 | - | 8 | 7 | 45 | 416 | (5 | ) | 411 | 417 | |||||||||||||||||||||||||||||||||||
| Service Alberta and Red Tape Reduction |
- | 61 | - | - | 2,263 | - | 723 | 34 | 3,081 | (29 | ) | 3,052 | 3,494 | |||||||||||||||||||||||||||||||||||
| Technology and Innovation |
- | - | - | 5 | - | 6 | - | 201 | 212 | (159 | ) | 53 | 70 | |||||||||||||||||||||||||||||||||||
| Tourism and Sport |
- | - | - | 1 | - | 1 | - | 1 | 3 | - | 3 | 7 | ||||||||||||||||||||||||||||||||||||
| Transportation and Economic Corridors |
- | - | - | 385 | - | 1 | 33 | 48 | 467 | - | 467 | 396 | ||||||||||||||||||||||||||||||||||||
| Treasury Board and Finance |
24,245 | 3,129 | - | 1,998 | 365 | 4,157 | 298 | 1,039 | 35,231 | (350 | ) | 34,881 | 31,949 | |||||||||||||||||||||||||||||||||||
| Consolidation adjustments |
- | - | - | - | (384 | ) | (21 | ) | (1,780 | ) | (2,185 | ) | ||||||||||||||||||||||||||||||||||||
| Total at March 31, 2025 |
$ | 24,245 | $ | 6,111 | $ | 21,986 | $ | 12,618 | $ | 2,053 | $ | 4,803 | $ | 5,504 | $ | 5,149 | $ | 82,469 | ||||||||||||||||||||||||||||||
| Total at March 31, 2024 |
$ | 22,204 | $ | 4,543 | $ | 19,287 | $ | 12,336 | $ | 1,237 | $ | 4,587 | $ | 5,565 | $ | 4,979 | $ | 74,738 | ||||||||||||||||||||||||||||||
| (a) | The Province is in the process of refocusing Alberta’s health care system from one health authority to an integrated system of sector-based provincial health agencies. To facilitate the transformation, the Lieutenant Governor in Council made the Designation and Transfer of Responsibility Amendment Regulation set out in the Order in Council 384/2024, effective December 12, 2024, to authorize further changes to ministries’ responsibilities. This changeover affects the Ministries of Health, Mental Health and Addiction and Seniors, Community and Social Services. The comparatives were reclassified as if the new structure existed in the prior year. |
| 56 | Government of Alberta | Annual Report 2024–25 | |
CONSOLIDATED FINANCIAL STATEMENTS
| EXPENSES BY OBJECT BY MINISTRY | SCHEDULE 3 |
| Budget(a) | Salaries, wages, employment contracts and benefits |
Grants | Supplies and services |
Amortization of tangible capital assets and purchased intangibles |
Consumption of inventories of supplies |
Debt servicing costs (b) |
Pension recovery (Schedule 14) |
Other | Subtotal | Consolidation adjustments |
2025 Total |
2024 Total (a) |
||||||||||||||||||||||||||||||||||||||||
| In millions | ||||||||||||||||||||||||||||||||||||||||||||||||||||
| Office of the Legislative Assembly and Offices of the Legislature |
$ | 158 | $ | 85 | $ | - | $ | 39 | $ | 1 | $ | - | $ | - | $ | - | $ | 19 | $ | 144 | $ | - | $ | 144 | $ | 162 | ||||||||||||||||||||||||||
| Ministries (a) |
||||||||||||||||||||||||||||||||||||||||||||||||||||
| Advanced Education |
7,003 | 4,068 | 691 | 1,720 | 539 | 3 | 34 | (56 | ) | 243 | 7,242 | (91 | ) | 7,151 | 6,782 | |||||||||||||||||||||||||||||||||||||
| Affordability and Utilities |
92 | 39 | 62 | 14 | 1 | - | - | - | 17 | 133 | - | 133 | 127 | |||||||||||||||||||||||||||||||||||||||
| Agriculture and Irrigation |
993 | 137 | 213 | 1,604 | 29 | - | 106 | - | 7 | 2,096 | (108 | ) | 1,988 | 2,647 | ||||||||||||||||||||||||||||||||||||||
| Arts, Culture and Status of Women |
260 | 54 | 154 | 23 | 7 | - | - | - | 1 | 239 | (2 | ) | 237 | 263 | ||||||||||||||||||||||||||||||||||||||
| Children and Family Services |
1,498 | 309 | 208 | 646 | - | - | - | - | 356 | 1,519 | (4 | ) | 1,515 | 1,607 | ||||||||||||||||||||||||||||||||||||||
| Education |
9,798 | 7,038 | 516 | 1,733 | 542 | 24 | 56 | - | 33 | 9,942 | (36 | ) | 9,906 | 9,432 | ||||||||||||||||||||||||||||||||||||||
| Energy and Minerals |
1,041 | 222 | 166 | 1,001 | 12 | - | - | (2 | ) | (2 | ) | 1,397 | (1 | ) | 1,396 | 962 | ||||||||||||||||||||||||||||||||||||
| Environment and Protected Areas |
557 | 143 | 182 | 113 | 3 | - | - | - | 36 | 477 | (29 | ) | 448 | 465 | ||||||||||||||||||||||||||||||||||||||
| Executive Council |
63 | 30 | 1 | 26 | - | - | - | - | - | 57 | - | 57 | 49 | |||||||||||||||||||||||||||||||||||||||
| Forestry and Parks |
410 | 200 | 123 | 736 | 27 | - | - | - | (2 | ) | 1,084 | (3 | ) | 1,081 | 1,166 | |||||||||||||||||||||||||||||||||||||
| Health |
26,557 | 9,823 | 8,957 | 7,192 | 589 | 1,284 | 15 | - | 142 | 28,002 | (449 | ) | 27,553 | 25,779 | ||||||||||||||||||||||||||||||||||||||
| Immigration and Multiculturalism |
42 | 20 | 18 | 2 | - | - | - | - | - | 40 | 40 | 39 | ||||||||||||||||||||||||||||||||||||||||
| Indigenous Relations |
220 | 24 | 206 | 6 | - | - | - | - | - | 236 | - | 236 | 225 | |||||||||||||||||||||||||||||||||||||||
| Infrastructure |
650 | 67 | 1,025 | 419 | 172 | 1 | - | - | 26 | 1,710 | (1,021 | ) | 689 | 627 | ||||||||||||||||||||||||||||||||||||||
| Jobs, Economy and Trade |
1,862 | 158 | 1,647 | 63 | 1 | - | - | - | - | 1,869 | (9 | ) | 1,860 | 1,558 | ||||||||||||||||||||||||||||||||||||||
| Justice |
685 | 478 | 119 | 75 | 7 | - | - | - | 6 | 685 | (1 | ) | 684 | 653 | ||||||||||||||||||||||||||||||||||||||
| Mental Health and Addiction |
1,699 | 962 | 206 | 544 | 1 | 17 | - | - | - | 1,730 | (24 | ) | 1,706 | 1,564 | ||||||||||||||||||||||||||||||||||||||
| Municipal Affairs |
1,287 | 58 | 1,204 | 26 | - | - | - | - | - | 1,288 | - | 1,288 | 989 | |||||||||||||||||||||||||||||||||||||||
| Public Safety and Emergency Services |
1,279 | 477 | 438 | 513 | 28 | - | - | - | 1 | 1,457 | (11 | ) | 1,446 | 1,494 | ||||||||||||||||||||||||||||||||||||||
| Seniors, Community and Social Services |
5,870 | 360 | 4,367 | 1,210 | 54 | - | - | - | 4 | 5,995 | (126 | ) | 5,869 | 5,499 | ||||||||||||||||||||||||||||||||||||||
| Service Alberta and Red Tape Reduction |
203 | 101 | 50 | 44 | 17 | 1 | - | - | 16 | 229 | (30 | ) | 199 | 179 | ||||||||||||||||||||||||||||||||||||||
| Technology and Innovation |
938 | 221 | 340 | 415 | 67 | - | - | - | 38 | 1,081 | (193 | ) | 888 | 818 | ||||||||||||||||||||||||||||||||||||||
| Tourism and Sport |
136 | 16 | 78 | 41 | - | - | - | - | - | 135 | (1 | ) | 134 | 112 | ||||||||||||||||||||||||||||||||||||||
| Transportation and Economic Corridors |
2,846 | 68 | 1,037 | 479 | 848 | 61 | 116 | - | 55 | 2,664 | (26 | ) | 2,638 | 2,328 | ||||||||||||||||||||||||||||||||||||||
| Treasury Board and Finance |
7,023 | 558 | 144 | 928 | 23 | - | 3,272 | (345 | ) | 665 | 5,245 | (382 | ) | 4,863 | 4,927 | |||||||||||||||||||||||||||||||||||||
| Consolidation adjustments |
- | - | (1,459 | ) | (576 | ) | - | - | (384 | ) | - | (128 | ) | (2,547 | ) | |||||||||||||||||||||||||||||||||||||
| Total at March 31, 2025 |
$ | 73,170 | $ | 25,716 | $ | 20,693 | $ | 19,036 | $ | 2,968 | $ | 1,391 | $ | 3,215 | $ | (403 | ) | $ | 1,533 | $ | 74,149 | |||||||||||||||||||||||||||||||
| Total at March 31, 2024 |
$ | 68,282 | $ | 23,986 | $ | 18,323 | $ | 18,942 | $ | 2,764 | $ | 1,267 | $ | 3,149 | $ | (372 | ) | $ | 2,394 | $ | 70,453 | |||||||||||||||||||||||||||||||
| (a) | The Province is in the process of refocusing Alberta’s health care system from one health authority to an integrated system of sector-based provincial health agencies. To facilitate the transformation, the Lieutenant Governor in Council made the Designation and Transfer of Responsibility Amendment Regulation set out in the Order in Council 384/2024, effective December 12, 2024, to authorize further changes to ministries’ responsibilities. This changeover affects the Ministries of Health, Mental Health and Addiction and Seniors, Community and Social Services. The comparatives were reclassified as if the new structure existed in the prior year. |
| (b) | Debt servicing costs (DSC) consist of interest paid on various forms of government debt and derivatives settled to DSC. Interest on pension liabilities is included in pension expense, which is reported under salaries, wages, employment contracts and benefits. Pension liability funding is reported under other expenses. |
| Government of Alberta | Annual Report 2024–25 | 57 | |
CONSOLIDATED FINANCIAL STATEMENTS
| CASH AND CASH EQUIVALENTS | SCHEDULE 4 |
| 2025 | 2024 | |||||||
| In millions |
||||||||
| Cash |
$ | 8,856 | $ | 5,393 | ||||
| Cash equivalents |
291 | 68 | ||||||
| $ | 9,147 | $ | 5,461 | |||||
| ACCOUNTS RECEIVABLE AND ADVANCES | SCHEDULE 5 |
| 2025 | 2024 | |||||||
| In millions |
||||||||
| Income taxes |
$ | 2,870 | $ | 2,481 | ||||
| Proceeds from issuance of direct borrowings |
1,916 | - | ||||||
| Due from Government of Canada |
1,616 | 2,464 | ||||||
| Royalties (a) |
1,324 | 1,907 | ||||||
| Tobacco settlement (b) |
783 | - | ||||||
| Other taxes |
500 | 447 | ||||||
| Due from government business enterprises |
460 | 506 | ||||||
| Collateral pledged (c) |
289 | 134 | ||||||
| Interest receivable |
202 | 212 | ||||||
| Other receivables & accountable advances |
2,886 | 3,098 | ||||||
| 12,846 | 11,249 | |||||||
| Less: allowance for doubtful accounts |
(671 | ) | (598 | ) | ||||
| $ | 12,175 | $ | 10,651 | |||||
| (a) | Includes $173 million (2024: $186 million) receivables related to the crude oil royalty that will be collected through the Alberta Petroleum Marketing Commission. |
| (b) | On March 6, 2025, the Ontario Superior Court of Justice approved a $32.5 billion settlement agreement in Canada under the Companies’ Creditors Arrangement Act arising from litigation against three major tobacco companies for healthcare-related costs. The total settlement will be payable partly by an upfront lump-sum payment and the balance through annual payments. The annual payments will be a percentage of these tobacco companies’ after-tax income and depend on the profit they earn in each subsequent year. The percentage commences with 85% of the net after-tax income for the first five years, reduced by 5% for each increment of five years. The annual payments are reduced to 70% of the net after tax income starting year 16 until the total amount is paid. |
| Under the terms of the settlement, $24.7 billion is payable to the Provinces and Territories with upfront payment being $6.2 billion. Alberta’s share of the Provinces and Territories portion is approximately 12.63% which represents $3.1 billion of the total settlement with $783 million being upfront payment and the balance to be paid over the settlement period. |
| The Province recognized $713 million as revenue (Schedule 1) for this fiscal year, representing upfront contribution receivable of $783 million net of associated legal fees payable of $70 million under “Supplies, services and other accrued liabilities” in Schedule 11. The remaining balance of the settlement has not been recognized given the significant uncertainty related to the amount of future annual payments from these tobacco companies based on their long-term financial performance and estimated future profits that may be affected by economic, regulatory and the changing market preferences for combustible tobacco products. Subsequently revenue will be recognized annually when there is certainty of the amounts, determined by these tobacco companies’ annual after-tax profits. |
| (c) | The Province paid cash collateral to counterparties under the terms of the credit support annex agreements as disclosed in Note 3. |
| 58 | Government of Alberta | Annual Report 2024–25 | |
CONSOLIDATED FINANCIAL STATEMENTS
| PORTFOLIO INVESTMENTS | SCHEDULE 6 |
| 2025 | 2024
|
|||||||||||||||||||||||||||
| Cost/ amortized cost (a) |
Fair value | Total carrying value |
Carrying value |
|||||||||||||||||||||||||
| Level 1 (b) | Level 2 (b) (c) | Level 3 (b) (c) (d) | Subtotal (e) | |||||||||||||||||||||||||
| In millions | ||||||||||||||||||||||||||||
| Interest-bearing securities |
||||||||||||||||||||||||||||
| Deposits and short-term securities |
$ | 12,106 | $ | 144 | $ | 953 | $ | - | $ | 1,097 | $ | 13,203 | $ | 10,319 | ||||||||||||||
| Bonds and mortgages |
80 | 111 | 6,951 | 2,864 | 9,926 | $ | 10,006 | 8,963 | ||||||||||||||||||||
| 12,186 | 255 | 7,904 | 2,864 | 11,023 | 23,209 | 19,282 | ||||||||||||||||||||||
| Equities |
||||||||||||||||||||||||||||
| Canadian equities |
- | 449 | 3,212 | - | 3,661 | 3,661 | 3,455 | |||||||||||||||||||||
| Global developed equities |
- | 1,551 | 9,861 | 222 | 11,634 | 11,634 | 10,608 | |||||||||||||||||||||
| Emerging markets equities |
- | 30 | 1,115 | - | 1,145 | 1,145 | 1,034 | |||||||||||||||||||||
| Private equities |
- | - | 7 | 3,457 | 3,464 | 3,464 | 3,137 | |||||||||||||||||||||
| Hedge funds |
- | - | 616 | - | 616 | 616 | 606 | |||||||||||||||||||||
| - | 2,030 | 14,811 | 3,679 | 20,520 | 20,520 | 18,840 | ||||||||||||||||||||||
| Inflation sensitive and alternative investments |
||||||||||||||||||||||||||||
| Real estate |
- | - | - | 5,466 | 5,466 | 5,466 | 4,935 | |||||||||||||||||||||
| Infrastructure |
- | - | - | 3,484 | 3,484 | 3,484 | 3,374 | |||||||||||||||||||||
| Renewable resources |
- | - | - | 708 | 708 | 708 | 696 | |||||||||||||||||||||
| Other investments |
2 | - | 39 | 50 | 89 | 91 | 104 | |||||||||||||||||||||
| 2 | - | 39 | 9,708 | 9,747 | 9,749 | 9,109 | ||||||||||||||||||||||
| Strategic, tactical and currency investments |
- | - | 7 | 83 | 90 | 90 | 79 | |||||||||||||||||||||
| $ | 12,188 | $ | 2,285 | $ | 22,761 | $ | 16,334 | $ | 41,380 | $ | 53,568 | |||||||||||||||||
| Total at March 31, 2024 |
$ | 9,228 | $ | 2,418 | $ | 20,341 | $ | 15,323 | $ | 38,082 | $ | 47,310 | ||||||||||||||||
| (a) | Included in these balances is $12,002 million (2024: $8,981 million) for marketable securities. The quoted market value for these marketable securities is $12,012 million (2024: $9,026 million). |
| (b) | During the year, $5 million (2024: $nil) of Level 1 and Level 2 portfolio investments were transferred to Level 3 and $nil (2024: $10 million) of Level 3 portfolio investments were transferred into Level 1 and 2 portfolio investments to better align to the terms of the underlying securities. |
| (c) | Included in these balances is $19,772 million (2024: $17,308 million) for pooled investment funds that are classified as Level 2 and $14,900 million (2024: $14,109 million) classified as Level 3 even though pool units may contain investments that might otherwise be classified as Level 1. Although the pools may ultimately hold publicly traded/listed equity investments, the pool units themselves are not listed in an active market and cannot be classified as Level 1 for fair value hierarchy purposes. |
| Repurchase agreements (Note 2) are also included in the pooled investment funds and used primarily for general liquidity, risk management and active management purposes. The exposure to repurchase agreement liabilities at March 31, 2025, was approximately $2,121 million (2024: $1,632 million) which is offset by the balances within the pool. |
| Derivatives related to pooled investments included in the balances above are disclosed in Schedule 10. |
| (d) | The table below presents the reconciliation of portfolio investments classified as Level 3: |
| 2025 | 2024 | |||||||
| In millions |
||||||||
| Balance at beginning of year |
$ | 15,323 | $ | 14,809 | ||||
| Purchases |
2,750 | 2,746 | ||||||
| Cost of investments sold |
(2,078) | (1,811 | ) | |||||
| Realized losses/(gains) |
40 | (52 | ) | |||||
| Unrealized gains/(losses) |
294 | (359 | ) | |||||
| Transfer in/(out) |
5 | (10 | ) | |||||
| Balance at end of year |
$ | 16,334 | $ | 15,323 | ||||
| Government of Alberta | Annual Report 2024–25 | 59 | |
CONSOLIDATED FINANCIAL STATEMENTS
| PORTFOLIO INVESTMENTS | SCHEDULE 6 (continued) |
| (e) | Fair value is based on quoted prices in an active market. Portfolio investments measured at fair value consist of: |
| 2025 | 2024 | |||||||
| In millions |
||||||||
| Portfolio investments in equity instruments that are quoted in an active market |
$ | 2,030 | $ | 2,157 | ||||
| Portfolio investments designated to the fair value category |
39,350 | 35,925 | ||||||
| $ | 41,380 | $ | 38,082 | |||||
The breakdown for the carrying value of portfolio investments:
| 2025 | 2024 | |||||||
| Carrying value |
Carrying value |
|||||||
| In millions |
||||||||
| Operating |
||||||||
| Internally designated assets (a) |
$ | 30,462 | $ | 27,804 | ||||
| Other funds and agencies |
18,896 | 15,656 | ||||||
| 49,358 | 43,460 | |||||||
| Endowments (Schedule 7) |
4,210 | 3,850 | ||||||
| Total portfolio investments |
$ | 53,568 | $ | 47,310 | ||||
| (a) | Internally designated assets are designated in legislation for specific purposes. Some of these assets are to provide stewardship of savings from the Province’s non-renewable resources revenues and support specific purposes such as medical research, science and engineering research and post-secondary scholarships. These balances include portfolio investment assets of $24.1 billion (2024: $21.9 billion) designated to AHSTF, in addition to the $3.0 billion (2024: $1.0 billion) cash balance reported in Schedule 4. |
| ENDOWMENT FUNDS | SCHEDULE 7 | |
The endowment balance represents the principal that will be maintained intact in perpetuity. As at March 31, 2025, endowment funds are as follows:
| 2025 | 2024 | |||||||
| In millions |
||||||||
| Balance at beginning of year |
$ | 3,846 | $ | 3,540 | ||||
| Endowment contributions |
130 | 77 | ||||||
| Reinvested income |
87 | 11 | ||||||
| Transfers to endowment funds |
14 | 8 | ||||||
| Remeasurement gains |
133 | 210 | ||||||
| Balance at end of year (a) |
$ | 4,210 | $ | 3,846 | ||||
| (a) | Some investment income earned by endowments for specific operational or capital purposes of $nil (2024: $4 million) is excluded from the endowment balance but included in the portfolio investment restricted for endowments (Schedule 6). |
| 60 | Government of Alberta | Annual Report 2024–25 | |
CONSOLIDATED FINANCIAL STATEMENTS
| EQUITY IN GOVERNMENT BUSINESS ENTERPRISES | SCHEDULE 8 |
| Alberta Gaming, Liquor and Cannabis Commission (AGLC) |
Alberta Petroleum Marketing Commission (APMC) |
ATB Financial | Balancing Pool (BP) |
Credit Union Deposit Guarantee Corporation (CUDGC) |
Other | 2025 Total |
2024 Total |
|||||||||||||||||||||||||
| In millions | ||||||||||||||||||||||||||||||||
| Equity/(deficit) in government business enterprises, beginning of year | $ | 262 | $ | (4,707 | ) | $ | 5,260 | $ | (379 | ) | $ | 430 | $ | (4 | ) | $ | 862 | $ | 1,846 | |||||||||||||
| Total revenue |
3,980 | 2,484 | 2,187 | 96 | 26 | 19 | 8,792 | 8,867 | ||||||||||||||||||||||||
| Total expense (a) |
1,717 | 3,100 | 1,839 | 46 | 9 | 28 | 6,739 | 7,630 | ||||||||||||||||||||||||
| Net income/(loss) |
2,263 | (616 | ) | 348 | 50 | 17 | (9 | ) | 2,053 | 1,237 | ||||||||||||||||||||||
| Other comprehensive income/(loss) from Government Business Enterprises (b) | (32 | ) | - | 174 | - | 18 | - | 160 | 124 | |||||||||||||||||||||||
| Transfers from government business enterprise/ dividends (i) |
(2,229 | ) | - | (100 | ) | - | - | (11 | ) | (2,340 | ) | (2,345 | ) | |||||||||||||||||||
| Total equity/(deficit) |
$ | 264 | $ | (5,323 | ) | $ | 5,682 | $ | (329 | ) | $ | 465 | $ | (24 | ) | $ | 735 | $ | 862 | |||||||||||||
| Assets |
||||||||||||||||||||||||||||||||
| Cash (c) |
$ | 138 | $ | 87 | $ | 1,012 | $ | 13 | $ | 2 | $ | 2 | $ | 1,254 | $ | 1,962 | ||||||||||||||||
| Accounts receivable |
66 | 458 | - | - | 3 | 11 | 538 | 612 | ||||||||||||||||||||||||
| Investments in Keystone (a) (d) |
- | 2 | - | - | - | - | 2 | 10 | ||||||||||||||||||||||||
| Investments in North West Redwater Partnership (e) |
- | 287 | - | - | - | - | 287 | 259 | ||||||||||||||||||||||||
| Other investments |
152 | - | 6,578 | - | 456 | 146 | 7,332 | 6,390 | ||||||||||||||||||||||||
| Loans |
- | - | 54,317 | - | 2 | - | 54,319 | 51,271 | ||||||||||||||||||||||||
| Derivative financial instruments |
- | - | 1,082 | - | - | - | 1,082 | 929 | ||||||||||||||||||||||||
| Tangible capital assets |
328 | 5 | 546 | - | 2 | - | 881 | - | ||||||||||||||||||||||||
| Other |
176 | 65 | 653 | 30 | 3 | 68 | 995 | 1,602 | ||||||||||||||||||||||||
| Total assets |
860 | 904 | 64,188 | 43 | 468 | 227 | 66,690 | 63,035 | ||||||||||||||||||||||||
| Liabilities |
||||||||||||||||||||||||||||||||
| Accounts payable and other accrued liabilities |
316 | 410 | 24 | 6 | 3 | 16 | 775 | 811 | ||||||||||||||||||||||||
| Payable to the Province |
280 | 182 | 172 | - | - | - | 634 | 692 | ||||||||||||||||||||||||
| Deposits (f) |
- | - | 43,332 | - | - | 2 | 43,334 | 40,584 | ||||||||||||||||||||||||
| Debt (g) |
- | 3,410 | 11,158 | 366 | - | 217 | 15,151 | 15,283 | ||||||||||||||||||||||||
| Sturgeon refinery processing agreement provision (h) |
- | 2,054 | - | - | - | - | 2,054 | 1,989 | ||||||||||||||||||||||||
| Derivative financial instruments |
- | - | 1,001 | - | - | - | 1,001 | 1,070 | ||||||||||||||||||||||||
| Other |
- | 171 | 2,819 | - | - | 16 | 3,006 | 1,744 | ||||||||||||||||||||||||
| Total liabilities |
596 | 6,227 | 58,506 | 372 | 3 | 251 | 65,955 | 62,173 | ||||||||||||||||||||||||
| Equity/(deficit) in government business enterprises, end of year |
$ | 264 | $ | (5,323) | $ | 5,682 | $ | (329) | $ | 465 | $ | (24) | $ | 735 | $ | 862 | ||||||||||||||||
| (a) | Included in the total expense are $104 million (2024: $101 million) of payment in lieu of taxes of ATB Financial that was paid to the Province; and the damage claims related to Keystone XL expansion for the year ended March 31, 2025 is $1.6 billion (2024: $nil). |
| (b) | As at March 31, 2025, the Province has a $193 million accumulated unrealized gain (2024: $11 million). |
| (c) | As at March 31, 2025, cash includes deposits for AGLC, CUDGC and APMC totaling $151 million (2024: $88 million) in CLS. |
| Government of Alberta | Annual Report 2024–25 | 61 | |
CONSOLIDATED FINANCIAL STATEMENTS
| EQUITY IN GOVERNMENT BUSINESS ENTERPRISES | SCHEDULE 8 (continued) |
| (d) | On June 9, 2021, APMC entered into the final Keystone XL agreement (Final KXL Agreement) with TC Energy for an orderly exit from the Keystone XL project and partnership. APMC provided total contribution of $1.04 billion on behalf of TC Energy partnerships to fund debt guarantee cancellation payments to the lenders as part of the original investment agreement. The debt guarantee cancellation payments were paid on June 16, 2021 and APMC has no further obligations relating to the investment Agreement and/ or the debt guarantee. The APMC has reflected the terms of the Final KXL Agreement in determining its fair value estimates for the Investment in the KXL Expansion Project. As the liquidation process under the abandonment scenario continues, the estimated fair value will be impacted by events after the reporting period. |
| (e) | On June 30, 2021, APMC negotiated a series of agreements through which APMC would purchase a limited partnership interest in the North West Redwater Partnership (Optimization Transaction). To effect this purchase, APMC acquired two subsidiaries of North West Refining Inc. (NWU LP) holding the interest in the North West Redwater Partnership (NWRP). The acquisition enables APMC to provide oversight and governance of various Refinery functions. APMC assessed the acquisition to be a joint venture and has accounted for the arrangement using the equity method of accounting. As a result of the Optimization Transaction, APMC is a 50% owner in NWRP, in addition to being a 75% toll payer in the Sturgeon Refinery. |
| As per the Partnership Interest Purchase Agreement, the contractual purchase price for the Optimization Transaction was one dollar payable upon closing on June 30, 2021. The initial investment of $274 million in NWRP comprises the purchase price, contingent consideration based on IFRS and any directly attributable expenditures to obtain the limited partnership interest. The $274 million cost of the investment is allocated to APMC’s acquired share of the fair value of the net identifiable assets and liabilities, which amounted to $372 million in net liabilities, and resulting goodwill of $646 million. As at March 31, 2025, APMC recognized a $27 million gain (2024: $29 million gain) on its share of the joint venture’s income resulting in a cumulative investment in NWRP of $287 million (2024: $259 million). |
| (f) | The Province ensures the repayment of all deposits without limit, including accrued interest, for ATB Financial. The Province assesses an annual deposit guarantee fee of $68 million (2024: $64 million) payable by ATB Financial. |
| (g) | Repayment schedule for long-term debt contracts with the Province and other external parties is as follows: |
| Payments to be made in | ||||||||||||||||||||||||||||||||||
| (In millions) |
2025 | 2024 | 2026 | 2027 | 2028 | 2029 | 2030 | Thereafter | ||||||||||||||||||||||||||
| Through the Province |
$ | 8,383 | $ | 8,271 | $ | 4,052 | $ | 773 | $ | 669 | $ | 73 | $ | 1,142 | $ | 1,674 | ||||||||||||||||||
| External parties |
6,768 | 7,012 | 1,334 | 1,287 | 1,449 | 1,068 | 729 | 902 | ||||||||||||||||||||||||||
| Total |
$ | 15,151 | $ | 15,283 | $ | 5,386 | $ | 2,060 | $ | 2,118 | $ | 1,141 | $ | 1,871 | $ | 2,576 | ||||||||||||||||||
| (h) | As at March 31, 2025, APMC recognized a non-cash $104 million recovery (2024: $1.26 billion charge) to the onerous contract provision due to lower forecasted electricity costs offset partially by lower forecasted gross margin (2024: lower forecasted crack spreads) and recorded related accretion expense of $169 million (2024: $57 million) resulting in an ending provision of $2.05 billion (2024: $1.99 billion). |
| (i) | Under the Gaming, Liquor and Cannabis Act, AGLC is required to transfer their net income, less allowance withheld for capital expenditures, amounting to $2,229 million (2024: $2,345 million), to the Province’s General Revenue Fund. |
| On February 29, 2024, ATB Financial announced it was in the position to declare quarterly dividends totaling $100 million (2024: $nil) in the fiscal year of 2024-25. Consequential dividend payable declarations occurred and resulted in amounts paid to the Province. |
| 62 | Government of Alberta | Annual Report 2024–25 | |
CONSOLIDATED FINANCIAL STATEMENTS
| EQUITY IN GOVERNMENT BUSINESS ENTERPRISES | SCHEDULE 8 (continued) |
Contractual Obligations and Commitments
AGLC, ATB AND CUDGC
Contractual obligations are $700 million (2024: $603 million), which comprises of: AGLC - $298 million (2024: $140 million), ATB - $400 million (2024: $460 million) and CUDGC - $2 million (2024: $3 million). These amounts include service contracts and obligations under operating leases that expire on various dates.
APMC
North West Redwater Partnership Toll Commitment
The Province, via APMC, has entered into a Processing Agreement whereby NWRP will process Crown royalty bitumen, and market the refined products on behalf of APMC. The Sturgeon Refinery achieved the Commercial Operations Date on June 1, 2020; APMC started paying a debt toll on June 1, 2018, and a monthly operating toll on June 1, 2020.
The Processing Agreement has a term of 40 years (expiring May 31, 2058) starting with the Toll Commencement Date of June 1, 2018, and may be renewed for successive five-year periods at APMC’s option.
The APMC has very restricted rights to terminate the Processing Agreement and is unconditionally obligated to pay its 75% pro rata share of the debt component of the monthly cost of service toll over the 40-year tolling period.
Under the Processing Agreement the estimated future toll commitments are $35,630 million (2024: $37,327 million). APMC’s estimated future cost of service toll commitments are as follows:
| In millions | ||||
| 2025-26 |
$ | 1,055 | ||
| 2026-27 |
805 | |||
| 2027-28 |
815 | |||
| 2028-29 |
946 | |||
| 2029-30 |
726 | |||
| Thereafter |
31,283 | |||
| $ | 35,630 | |||
The above undiscounted tolls do not take into account the net margin received on the sale of APMC’s bitumen feedstock.
Contingent Liabilities
As at March 31, 2025, the government business enterprises are involved in various legal actions. Accruals have been made in specific instances where it is probable that losses will be incurred which can be reasonably estimated. The resulting loss, if any, from claims in excess of the amounts accrued cannot be determined.
Of the various legal actions, the government business enterprises are jointly or separately named as a defendant in 49 (2024: 34) legal claims of which the outcome is not determinable. Of the 49 claims, 46 (2024: 25) have specified amounts totaling approximately $112 million (2024: $55 million) and three claims (2024: nine) have no specified amount. Two (2024: two) claims totaling approximately $1 million (2024: $1 million) are covered by the Alberta Risk Management Fund.
| Government of Alberta | Annual Report 2024–25 | 63 | |
CONSOLIDATED FINANCIAL STATEMENTS
| EQUITY IN GOVERNMENT BUSINESS ENTERPRISES | SCHEDULE 8 (continued) |
ATB FINANCIAL
As at March 31, 2025, ATB Financial has a contingent liability under guarantees and letters of credit of $1,406 million (2024: $1,171 million) and outstanding loan commitments of $27.7 billion (2024: $23.2 billion).
CUDGC
The Province, through the CUDGC which operates under the authority of the Credit Union Act, has a potential liability under guarantees relating to deposits of credit unions. As at March 31, 2025, credit unions in Alberta has deposits totaling $29.1 billion (2024: $28.3 billion). Substantial assets are available from credit unions to safeguard the Province from the risk of loss from its potential obligation under the Credit Union Act.
Measurement Uncertainty
ATB FINANCIAL
ATB records an allowance for losses for all loans by incorporating a forward-looking expected credit losses approach. This process involves complex models with inputs and assumptions requiring a high degree of judgment to assess forecasts of macroeconomic variables and significant increases in credit risk. Therefore, uncertainty in judgments and assumptions remains elevated as at March 31, 2025.
APMC
North West Redwater Partnership Toll Commitment
APMC’s estimate of the cost of service toll commitments is subject to measurement uncertainty. The undiscounted cost of service tolls used in the estimate, such as future interest rates, operating costs, oil prices, refined product prices, gas prices and foreign exchange, do not take into account the net margin received on the sale of APMC’s bitumen feedstock.
APMC uses a cash flow model to assess if the Processing Agreement represents an onerous contract annually. Under this model, if the unavoidable costs of meeting the obligations under the Processing Agreement exceed the economic benefits expected to be received, the contract becomes onerous and a Processing Agreement provision is recorded. The model uses a number of variables, such as pricing related variables including crude oil prices (WTI), heavy-light differentials, ultra-low sulphur diesel-WTI premiums, exchange rates, capital costs, operating costs, interest rates, discount rates, etc., to calculate a discounted net cash flow for APMC (i.e., net present value), and hence, is subject to measurement uncertainty.
Investment in Keystone XL Expansion Project
APMC has estimated the fair value of the Keystone XL Investment at March 31, 2025 and 2024, using a probability-weighted valuation technique. The fair value of the Keystone XL Investment requires the use of significant unobservable assumptions in the valuation techniques used to determine the fair value estimate. The determination of the fair value of the Keystone XL Investment is complex and relies on several critical judgements and estimates. These critical assumptions and estimates used in determining the fair value of the Keystone XL Investment are: the identification of potential scenarios that would impact the amount and timing of cash flows relating to the Keystone XL Investment, the expected probability of those outcomes and the estimated cash inflows and outflows relating to potential outcomes. Fair value estimates may not necessarily be indicative of the amounts that could be realized or settled, and changes in assumptions could affect the reported fair value of the financial instrument. Assumptions used in the determination of the fair value of the Keystone XL Investment will continue to be refined as outcomes become known and more information becomes available.
| 64 | Government of Alberta | Annual Report 2024–25 | |
CONSOLIDATED FINANCIAL STATEMENTS
| LOANS RECEIVABLE | SCHEDULE 9 |
| 2025 | 2024 | |||||||
| In millions |
||||||||
| Loans receivable made under the authority of: |
||||||||
| Local Authorities Capital Financing Act (a) |
$ | 13,152 | $ | 13,225 | ||||
| Student Financial Assistance Act (b) (e) |
5,945 | 5,547 | ||||||
| Agriculture Financial Services Act (c) |
3,132 | 2,980 | ||||||
| Oil and Gas Conservation Act (d) |
145 | 170 | ||||||
| Seniors’ Property Tax Deferral Act |
46 | 44 | ||||||
| Seniors’ Home Adaptation and Repair Act |
31 | 31 | ||||||
| Alberta Housing Act |
17 | 17 | ||||||
| Regulated Rate Option Stability Act |
3 | 122 | ||||||
| Electric Utilities Act |
- | 199 | ||||||
| 22,471 | 22,335 | |||||||
| Less allowance for doubtful accounts (a) (b) (c) |
1,195 | 1,089 | ||||||
| $ | 21,276 | $ | 21,246 | |||||
The loan repayment schedule is as follows:
| Principal | Interest | Total payments | ||||||||||
| In millions | ||||||||||||
| 2025-26 |
$ | 1,496 | $ | 788 | $ | 2,284 | ||||||
| 2026-27 |
1,458 | 691 | 2,149 | |||||||||
| 2027-28 |
1,403 | 638 | 2,041 | |||||||||
| 2028-29 |
1,303 | 588 | 1,891 | |||||||||
| 2029-30 |
1,436 | 539 | 1,975 | |||||||||
| Thereafter |
12,526 | 3,744 | 16,270 | |||||||||
| Total |
$ | 19,622 | $ | 6,988 | $ | 26,610 | ||||||
| (a) | Under the Local Authorities Capital Financing Act, the Province maintains a portfolio of loans to various categories of local authorities. The loans fund capital projects and security, by borrower, is obtained to ensure repayment. An impairment of $168 million (2024: $168 million) is recorded as an allowance for doubtful account. Municipal loans on average yield 4.2% (2024: 4.1%) per annum. |
| (b) | Student loans become payable and interest is earned starting twelve months after students discontinue their studies or graduate. Loans are unsecured and repayable to a maximum term of 114 months. The interest rates on student loans are a floating rate of prime rate. Allowance for doubtful accounts of $1,009 million (2024: $907 million) includes allowance for repayment assistance, impaired loans and loan subsidy. |
| The allowance for repayment assistance is a provision that estimates the amount of loans receivable that will be forgiven through the repayment assistance program. The key assumptions used to determine the provision are future loan amounts approved for repayment assistance and loan forgiveness rates of 7.3% (2024: 7.3%). |
| The allowance for impaired loans is a provision that estimates the amount of loans receivable that will be impaired. The key assumptions used to determine this provision are default rates of 10.5% (2024: 9.1%) and recovery rates of 39.6% (2024: 24.9%). |
| The allowance for loan subsidy is a provision that reflects the future benefit provided to students. The key assumptions used to determine this provision are a blended student lending rate of 4.1% (2024: 4.2%), the annual average provincial borrowing rate of 3.2% (2024: 3.6%) for similar maturities, the average repayment period of 11 years (2024: 10 years), default rate assumptions and Repayment Assistance Plan rate assumptions. |
| (c) | The weighted average annual interest rate of the Agricultural Financial Services loan portfolios is 4.3% (2024: 4.1%). |
| Loans have fixed interest rates for the term of the loan or renewal period. Loans have blended repayments during the term. A significant number of loans in the portfolio can be repaid in full or part during the term without any penalty. The loans are secured by tangible assets consisting predominantly of land followed by buildings, equipment and other assets. The estimated values of such assets are $6.6 billion (2024: $6.2 billion) and an allowance for doubtful accounts amount of $18 million (2024: $14 million). |
| Government of Alberta | Annual Report 2024–25 | 65 | |
CONSOLIDATED FINANCIAL STATEMENTS
| LOANS RECEIVABLE | SCHEDULE 9 (continued) |
| (d) | Pursuant to section 76.2 of the Oil and Gas Conservation Act, the Province entered into an agreement with the Alberta Oil and Gas Orphan Abandonment and Reclamation Association (also known as Orphan Well Association or OWA) to provide OWA with a series of interest-free loan advances to clean up orphaned oil and gas wells. A discount of $16 million (2024: $21 million) for the present value of foregone interest will be amortized to revenue in subsequent periods over the remaining life of the loan. |
| (e) | Some loans, such as loans under Student Financial Assistance Act, are excluded from the repayment schedule as no terms of repayment have been established. |
| DERIVATIVE FINANCIAL INSTRUMENTS | SCHEDULE 10 |
The Province holds derivative financial instruments both directly and indirectly. Directly-held derivatives serve to manage foreign currency risk and interest rate risk. Indirectly-held derivatives are utilized within the Province’s investment pool structure to cost-effectively gain access to equity markets in the pools, manage asset exposure within the pools, enhance pool returns and manage interest rate risk, foreign currency risk and credit risk in the pools. The use of derivatives in managing financial risks is described in Note 3.
The following table is a summary of the fair value of the Province’s directly-held and indirectly-held derivatives by type:
| 2025 | 2024 | |||||||||||||||||||||||
| Directly held | Indirectly held | Directly held | Indirectly held | |||||||||||||||||||||
| Assets | Liabilities | Assets | Liabilities | |||||||||||||||||||||
| In millions |
||||||||||||||||||||||||
| Interest rate derivatives (a) |
$ | 546 | $ | (498 | ) | $ | (34 | ) | $ | 1,091 | $ | (1,038 | ) | $ | 27 | |||||||||
| Equity-based derivatives (b) |
- | - | (102 | ) | - | - | 197 | |||||||||||||||||
| Foreign currency derivatives (c) |
429 | (471 | ) | (155 | ) | 208 | (795 | ) | (4 | ) | ||||||||||||||
| Credit risk derivatives (d) |
- | - | 1 | - | - | 4 | ||||||||||||||||||
| Other derivatives (e) |
- | - | (7 | ) | - | - | - | |||||||||||||||||
| Net fair value of derivative contracts |
$ | 975 | $ | (969 | ) | $ | (297 | ) | $ | 1,299 | $ | (1,833 | ) | $ | 224 | |||||||||
| (a) | Interest rate derivatives allow the Province to exchange interest rate cash flows (fixed, floating and bond index) based on a notional amount. Interest rate derivatives primarily include interest rate swaps, cross currency interest rate swaps, bond index swaps, futures contracts and options. |
| (b) | Equity-based derivatives include equity swaps. Equity swaps are contracts where one counterparty agrees to pay or receive from the other, cash flows based on changes in the value of an equity index, a basket of stocks or a single stock in exchange for a return based on a fixed or floating interest rate or the return on another instrument. Rights, warrants, futures and options are also included as equity-based derivatives. |
| (c) | Foreign currency derivatives include contractual agreements to exchange specified currencies at an agreed-upon exchange rate and on an agreed settlement date in the future. |
| (d) | Credit risk derivatives include credit default swaps allowing the Province to buy and sell protection on credit risk inherent in a bond. A premium is paid or received, based on a notional amount, in exchange for a contingent payment should a defined credit event occur with respect to the underlying security. |
| (e) | Other derivatives include financial contract for differences to hedge against electricity prices. |
Both directly-held and indirectly-held derivative financial instruments are classified as Level 2 according to the fair value hierarchy, defined in Note 2.
| 66 | Government of Alberta | Annual Report 2024–25 | |
CONSOLIDATED FINANCIAL STATEMENTS
| ACCOUNTS PAYABLE AND OTHER ACCRUED LIABILITIES | SCHEDULE 11 |
| 2025 | 2024 | |||||||
| In millions |
||||||||
| Salaries, wages, employment contracts and benefits |
$ | 3,990 | $ | 3,187 | ||||
| Grants |
2,942 | 2,416 | ||||||
| Corporate income tax receipts in abeyance and tax refunds payable |
1,149 | 1,163 | ||||||
| Accrued interest |
802 | 734 | ||||||
| Unearned revenue |
721 | 722 | ||||||
| Tangible capital assets |
517 | 511 | ||||||
| Gas Royalty Deposits |
480 | 593 | ||||||
| Collateral received (a) |
157 | 79 | ||||||
| Supplies, services and other accrued liabilities |
5,162 | 4,339 | ||||||
| $ | 15,920 | $ | 13,744 | |||||
| (a) | The Province received cash collateral from counterparties under the terms of the credit support annex agreements as disclosed in Note 3. |
| ASSET RETIREMENT OBLIGATIONS AND ENVIRONMENTAL LIABILITIES | SCHEDULE 12 |
| 2025 | 2024 | |||||||
| In millions |
||||||||
| Asset retirement obligations (i) |
$ | 2,579 | $ | 2,391 | ||||
| Environmental liabilities (ii) |
181 | 168 | ||||||
| $ | 2,760 | $ | 2,559 | |||||
(i) Asset Retirement Obligations (ARO)
The Province has identified various tangible capital assets where ARO exist. As at March 31, 2025, the total ARO liabilities are as follows:
| 2025 | 2024 | |||||||
| In millions |
||||||||
| Asset retirement obligations beginning of year |
$ | 2,391 | $ | 2,287 | ||||
| Adjustments from prior period |
- | 22 | ||||||
| ARO liabilities incurred |
8 | 9 | ||||||
| ARO liabilities settled |
(24 | ) | (20 | ) | ||||
| Accretion expense |
9 | 10 | ||||||
| Revision in estimates |
200 | 95 | ||||||
| Reduction of ARO liabilities resulting from disposals of tangible capital assets |
(5 | ) | (12 | ) | ||||
| Asset retirement obligations end of year (a) |
$ | 2,579 | $ | 2,391 | ||||
| (a) | Included in the total ARO liabilities is $294 million (2024: $265 million) valued using the present value technique, and the undiscounted amount of estimated future cash flows required to settle this obligation is $405 million (2024: $361 million). The discount rates used for the present value technique ranged from 2.5% to 5.0%, and these obligations are expected to be settled between 2027 and 2060. The total ARO liabilities also include $2,285 million (2024: $2,126 million) of undiscounted future cash flows valued using the cost escalation technique, as the settlement dates related to these liabilities have not been determined. |
| Government of Alberta | Annual Report 2024–25 | 67 | |
CONSOLIDATED FINANCIAL STATEMENTS
| ASSET RETIREMENT OBLIGATIONS AND ENVIRONMENTAL LIABILITIES | SCHEDULE 12 (continued) |
The above asset retirement obligations mainly relate to buildings, bridges, equipment, land improvements and others. The Province estimated the nature and extent of hazardous materials in its buildings based on the potential square meters and the average costs per square meter to remove and dispose of the hazardous materials. The estimate of these obligations is mainly based on assessments provided by third-party experts, internal experts and engineers.
(ii) Environmental Liabilities
Environmental liabilities include liabilities for contaminated sites and other environmental liabilities. As at March 31, 2025, the liabilities for 245 (2024: 248) contaminated sites along with other environmental liabilities and likely contingent environmental liabilities (Note 8) with known contamination levels are as follows:
| 2025 | 2024 | |||||||
| In millions |
||||||||
| Liabilities for contaminated sites at beginning of year |
$ | 168 | $ | 117 | ||||
| Additions to liabilities during the year |
11 | 41 | ||||||
| Change in estimate |
5 | 12 | ||||||
| Remediation work performed |
(3 | ) | (2 | ) | ||||
| Liabilities for contaminated sites end of year |
$ | 181 | $ | 168 | ||||
The above liabilities are mainly relating to contamination of land by salt and hydrocarbons, former rail sites exposed to harmful metals, storage tanks exposed to petroleum hydrocarbons and glycols, former gas stations leaking to nearby sites, waste disposal sites and industrial sites with various different contaminants. The estimated liabilities include costs directly attributable to remediation activities and costs relating to ongoing operation, maintenance and monitoring that are an integral part of the remediation strategy for the contaminated sites. These liabilities are valued using either the present value or the cost escalation techniques and are based on valuation reports provided by the third-party experts and internal experts.
The Province implemented programs to manage coal, oil sands, landfills, etc. related liabilities. The objective of the program is to protect the public from paying for project closure costs. The Province holds guarantees in the form of letters of credit, surety bonds and guaranteed investment certificates amounting to $2.4 billion (2024: $2.3 billion), and cash amounting to $278 million (2024: $270 million) in trust funds under administration (Note 9), in relation to the reclamation of coal and oil sands operations, sand and gravel pits, landfills, hazardous waste management and hazardous recyclable facilities. The Province would have access to these funds if an operator that provided security fails to complete the required work and reclaim the land.
| DEBT | SCHEDULE 13 |
The debt for the Province is as follows:
| 2025 | 2024 | |||||||
| In millions |
||||||||
| Direct borrowing |
$ | 99,967 | $ | 96,913 | ||||
| Liabilities under public private partnerships |
2,515 | 2,637 | ||||||
| Capital lease liabilities |
225 | 243 | ||||||
| $ | 102,707 | $ | 99,793 | |||||
| 68 | Government of Alberta | Annual Report 2024–25 | |
CONSOLIDATED FINANCIAL STATEMENTS
| DEBT | SCHEDULE 13 (continued) |
The consolidated gross debt of the Province totaling $111,073 million (2024: $107,878 million) is comprised of debt of the Province of $102,707 million (2024: $99,793 million) and debt on behalf of government business enterprises totaling $8,366 million (2024: $8,085 million).
The consolidated gross debt servicing cost of the Province totaling $3,536 million (2024: $3,421 million) is comprised of $3,215 million (2024: $3,149 million) on debt of the Province and $321 million (2024: $272 million) on debt issued on behalf of government business enterprises.
Direct Borrowing
The Province meets financing requirements set out in the Fiscal Plan by issuing bonds and promissory notes in the domestic and international capital markets. As at March 31, 2025, the maturity schedule for the Province’s outstanding borrowing is as follows:
| Fiscal Year of Maturity Ending March 31 | Direct Borrowing (a) | |||||||||||||||||||||||
| Effective | (in Canadian dollars) | 2025 | 2024 | |||||||||||||||||||||
| interest rate (b) |
Canadian dollar |
US dollar |
Other currencies |
Total | Total | |||||||||||||||||||
| In millions | ||||||||||||||||||||||||
| Fixed rate direct borrowing |
||||||||||||||||||||||||
| 2025 |
$ | - | $ | - | $ | - | $ | - | $ | 11,490 | ||||||||||||||
| 2026 |
2.45 | % | 12,853 | 7,692 | 9,301 | 29,846 | 12,453 | |||||||||||||||||
| 2027 |
2.10 | % | 3,117 | 1,438 | 453 | 5,008 | 5,117 | |||||||||||||||||
| 2028 |
2.72 | % | 3,191 | 1,797 | - | 4,988 | 6,795 | |||||||||||||||||
| 2029 |
2.33 | % | 3,602 | - | 1,826 | 5,428 | 4,961 | |||||||||||||||||
| 2030 |
2.94 | % | 3,835 | - | 155 | 3,990 | - | |||||||||||||||||
| 2026-2030 (< 5 years) |
2.47 | % | 26,598 | 10,927 | 11,735 | 49,260 | 40,816 | |||||||||||||||||
| 2031-2035 (6-10 years) |
2.08 | % | 14,964 | 2,875 | 153 | 17,992 | 23,848 | |||||||||||||||||
| 2036-2045 (11-20 years) |
2.86 | % | 5,602 | - | 3,112 | 8,714 | 4,953 | |||||||||||||||||
| 2046-2122 (> 21 years) |
2.90 | % | 23,108 | 57 | 385 | 23,550 | 26,818 | |||||||||||||||||
| Total direct borrowing issued at face value |
2.76 | % | $ | 70,272 | $ | 13,859 | $ | 15,385 | $ | 99,516 | $ | 96,435 | ||||||||||||
| Net unamortized premium |
451 | 478 | ||||||||||||||||||||||
| Total direct borrowing |
$ | 99,967 | $ | 96,913 | ||||||||||||||||||||
| (a) | Direct borrowing includes the following foreign currency denominated direct borrowing that is fully hedged to Canadian dollars to eliminate exposure to future fluctuations in exchange rates. The hedging instruments are reported as derivative financial instruments in Schedule 10. Fully hedged foreign currency direct borrowing is translated into Canadian dollars at the year-end rate of exchange. As at March 31, 2025, the translation resulted in accumulated unrealized loss of $1,060 million (2024: gain of $293 million). |
| Direct borrowing at par | Direct borrowing at cost (CAD$) | |||||||||||||||||
| Fully Hedged Foreign Currency | 2025 | 2024 | 2025 | 2024 | ||||||||||||||
| In millions |
||||||||||||||||||
|
|
US dollars |
$ | 9,640 | $ | 11,365 | $ | 13,855 | $ | 15,402 | |||||||||
| Other currencies |
||||||||||||||||||
| Euros |
€ | 7,527 | € | 4,777 | 11,688 | 6,990 | ||||||||||||
| Swedish kronor |
kr | 2,500 | kr | 2,500 | 358 | 317 | ||||||||||||
| Australian dollars |
$ | 2,535 | $ | 1,435 | 2,274 | 1,267 | ||||||||||||
| Swiss francs |
CHF | 585 | CHF | 585 | 952 | 879 | ||||||||||||
| New Zealand dollars |
$ | 128 | $ | 128 | 104 | 103 | ||||||||||||
| Total other currencies |
$ | 15,376 | $ | 9,556 | ||||||||||||||
| (b) | The effective interest rate is based on the weighted average of direct borrowing issues. The effective rate is the rate that exactly discounts estimated future cash payments through the expected term of the direct borrowing to the net carrying amount and includes the effects of interest rate and currency swaps. |
| Government of Alberta | Annual Report 2024–25 | 69 | |
CONSOLIDATED FINANCIAL STATEMENTS
| DEBT | SCHEDULE 13 (continued) |
Liabilities under Public Private Partnerships
The Province has entered into 33 to 35 year contracts for the design, finance, build, operations and maintenance of ring road segments under the following P3: Anthony Henday - South East, North West and North East Edmonton Ring Road; Stoney Trail - North East and South East Calgary Ring Road; and Tsuut’ina Trail - South West Calgary Ring Road. In addition, the Province has entered into 30-year contracts for the design, finance, build and maintenance of schools under the Alberta Schools Alternative Procurement Phase I, Phase II, Phase III and Schools Bundles 2 and 5. These contracts include a construction period followed by a 30-year operations period for the ring roads and a 30-year maintenance period for the schools. The Province has also entered into a 12-year contract for the design, finance, build and operation of the Evan-Thomas Water and Wastewater Treatment Facilities, which concluded in August 2024.
The details of the contract under construction are as follows:
| Contractor | Date contract entered into |
Scheduled completion |
Date capital payments | |||||
| Alberta P3 Schools Bundle (P3SB5) |
Ellisdon Infrastructure Alberta P3SB5 General Partnership |
March 2025 | September 2027 | September 2027 | ||||
| The details of the contracts for those projects that are already operational are as follows:
| ||||||||
| Contractor | Date contract entered into |
Completion date |
Date capital payments | |||||
| Anthony Henday – South East Edmonton Ring Road |
Access Roads Edmonton Ltd. |
January 2005 | October 2007 | November 2007 | ||||
| Stoney Trail – North East Calgary Ring Road |
Stoney Trail Group |
February 2007 | October 2009 | November 2009 | ||||
| Alberta Schools Alternative Procurement Phase I |
BBPP Alberta Schools Ltd. |
September 2008 | June 2010 | July 2010 | ||||
| Anthony Henday – North West Edmonton Ring Road |
NorthwestConnect General Partnership |
July 2008 | October 2011 | November 2011 | ||||
| Alberta Schools Alternative Procurement Phase II |
B2L Partnership |
April 2010 | June 2012 | August 2012 | ||||
| Stoney Trail – South East Calgary Ring Road |
Chinook Roads Partnership |
March 2010 | November 2013 | November 2013 | ||||
| Alberta Schools Alternative Procurement Phase III |
ABC Schools Partnership |
September 2012 | June 2014 | July 2014 | ||||
| Evan-Thomas Water and Wastewater Treatment Facilities |
EPCOR Water Services Inc. |
October 2012 | August 2014 | August 2014 | ||||
| Anthony Henday – North East Edmonton Ring Road |
Capital City Link General Partnership |
May 2012 | September 2016 | October 2016 | ||||
| Tsuut’ina Trail – South West Calgary Ring Road |
Mountain View Partners GP |
September 2016 | October 2021 | October 2020 | ||||
| Alberta P3 Schools Bundle (P3SB2) |
Concert-Bird Partners P3SB2 General Partnership |
September 2021 | May 2024 | June 2024 | ||||
| 70 | Government of Alberta | Annual Report 2024–25 | |
CONSOLIDATED FINANCIAL STATEMENTS
| DEBT | SCHEDULE 13 (continued) |
The estimated capital payment requirements for each of the next five years and thereafter along with the total reported P3 liabilities at year end are as follows:
| In millions | ||||
| 2025-26 |
$ | 224 | ||
| 2026-27 |
224 | |||
| 2027-28 |
223 | |||
| 2028-29 |
223 | |||
| 2029-30 |
223 | |||
| Thereafter |
3,103 | |||
| 4,220 | ||||
| Less interest |
(1,705 | ) | ||
| Total liabilities |
$ | 2,515 | ||
The capital payments for P3 are fixed, equal monthly payments for the privately financed portion of the costs of building the infrastructure. The present value of these capital payments is recorded as a liability in the Consolidated Statement of Financial Position.
Capital Lease Liabilities
Capital lease liabilities consist of the present value of the minimum lease payments related to leased capital assets. The Province has lease agreements with terms up to 25 years with interest rates ranging between 1.8% and 5.9%.
The following is a breakdown of capital lease liabilities by major category:
| 2025 | 2024 | |||||||
| In millions |
||||||||
| Building |
$ | 162 | $ | 177 | ||||
| Equipment |
63 | 66 | ||||||
| $ | 225 | $ | 243 | |||||
Major leases include:
| • | Bentall Investment Management building administration for Calgary Board of Education of $67 million (2024: $75 million) with weighted average interest rate of 4.7% and maturing February 28, 2031. |
| • | Leased buildings for community services for $44 million (2024: $47 million) with weighted average interest rate of 2.5% and latest maturity on September 4, 2040. |
| • | Leased laboratory equipment for $29 million (2024: $35 million) with weighted average interest rate of 4.0% and latest maturity on August 24, 2043. |
| • | Leased buildings for ambulances for $29 million (2024: $31 million) with weighted average interest rate of 3.1% and latest maturity on December 31, 2039. |
| • | School buildings for three (2024: three) school jurisdictions of $22 million (2024: $24 million) with weighted average interest rate of 4.7% and latest maturity on August 31, 2044. |
| Government of Alberta | Annual Report 2024–25 | 71 | |
CONSOLIDATED FINANCIAL STATEMENTS
| DEBT | SCHEDULE 13 (continued) |
Aggregate lease payments for each of the next five years and thereafter are as follows:
| Lease Payments | ||||
| In millions | ||||
| 2025-26 |
$ | 43 | ||
| 2026-27 |
40 | |||
| 2027-28 |
35 | |||
| 2028-29 |
30 | |||
| 2029-30 |
26 | |||
| Thereafter |
85 | |||
| Total lease payments |
259 | |||
| Less interest |
34 | |||
| Total capital lease liabilities |
$ | 225 | ||
| PENSION PLANS AND OTHER DEFINED BENEFIT PLANS | SCHEDULE 14 |
Pension Plans
The President of Treasury Board and Minister of Finance serves as the trustee for the following pension plans: Management Employees Pension Plan (MEPP) and the Public Service Management (Closed Membership) Pension Plan (PSMC) under the Public Sector Pension Plans Act; the Supplementary Retirement Plan for Public Service Managers (MSRP) under the Supplementary Retirement Plan – Retirement Compensation Arrangement Directive (Treasury Board Directive 01/06); and the Provincial Judges and Applications Judges (Registered and Unregistered) Pension Plan (PJAJPP) under the Provincial Court Act. All of these pension plans are open with the exception of PSMC.
On March 1, 2019, Local Authorities Pension Plan (LAPP), Public Service Pension Plan (PSPP) and Special Forces Pension Plan (SFPP) transitioned to a joint governance structure in accordance with the Joint Governance of Public Sector Pension Plans Act passed on December 5, 2018. On the transition date, ownership of the Plan funds transferred from the President of Treasury Board and Minister of Finance as the trustee to the newly established LAPP Corporation, PSPP Corporation and SFPP Corporation, respectively. The corporation of each plan is the administrator and trustee of these plans. Under joint governance, a Sponsor Board is responsible for each plan and is comprised of nominees from employee and employer sponsor organizations.
Financial statements for MEPP, PSMC, PJAJPP and MSRP as of their December 31, 2024, year-end or March 31, 2025, year-end are included as supplementary information in the Ministry of Treasury Board and Finance Annual Report. Financial statements for LAPP, PSPP and SFPP are available on the respective corporation’s website. All of the plans, except PJAJPP, are multi-employer plans.
The Teachers’ Pension Plan (Teachers’) and the Universities Academic Pension Plan (UAPP) are administered by their respective boards.
In addition to the aforementioned plans, there are several agencies which maintain their own plans to compensate senior staff members that do not participate in the regular government pension plans. These entities include Alberta Energy Regulator, Alberta Utilities Commission, Alberta Securities Commission, Alberta Investment Management Corporation, Alberta Health Services and some PSIs. Summaries of these plans are included in these financial statements as Supplementary Executive Retirement Plans (SERP), Supplementary Retirement Plan (SRP), Supplemental Pension Plan (SPP) and Senior Employee Pension Plans (SEPP), but are collectively referred to as SERP in the tables following. Additional information can be found in the entities’ financial statements.
| 72 | Government of Alberta | Annual Report 2024–25 | |
CONSOLIDATED FINANCIAL STATEMENTS
| PENSION PLANS AND OTHER DEFINED BENEFIT PLANS | SCHEDULE 14 (continued) |
The following is a summary of the plans for the year ended March 31, 2025:
| Defined benefit pension plans |
Approximate number of active employees |
Average age of active employees |
Approximate to future benefits (b) |
Approximate number of retirees receiving benefits |
Employee contributions |
Employer contributions |
Benefit payments |
|||||||||||||||||||||
| In millions | ||||||||||||||||||||||||||||
| LAPP |
180,819 | 45 | 45,808 | 92,779 | 1,138 | 1,252 | 2,257 | |||||||||||||||||||||
| PSPP |
43,022 | 43 | 17,734 | 32,852 | 284 | 282 | 720 | |||||||||||||||||||||
| MEPP |
5,989 | 47 | 1,425 | 7,067 | 96 | 94 | 309 | |||||||||||||||||||||
| MLAPP (a) |
- | - | - | 78 | - | - | 3 | |||||||||||||||||||||
| MSRP |
844 | 51 | 236 | 1,521 | 3 | 3 | 12 | |||||||||||||||||||||
| PJAJPP (Unregistered) |
122 | 60 | 3 | 200 | 1 | 1 | 14 | |||||||||||||||||||||
| PJAJPP (Registered) |
126 | 60 | 4 | 206 | 2 | 5 | 10 | |||||||||||||||||||||
| PSMC (a) |
- | - | 27 | 1,279 | - | - | 37 | |||||||||||||||||||||
| SFPP (a) |
4,884 | 41 | 285 | 3,113 | 82 | 88 | 163 | |||||||||||||||||||||
| Teachers’ Pre-1992 |
1,628 | 59 | 454 | 27,368 | - | - | 502 | |||||||||||||||||||||
| Teachers’ Post-1992 |
40,928 | 42 | 10,644 | 29,337 | 379 | 362 | 835 | |||||||||||||||||||||
| UAPP Pre-1992 (a) |
157 | 65 | - | 3,769 | 20 | 20 | 130 | |||||||||||||||||||||
| UAPP Post-1992 |
7,851 | 49 | 2,751 | 6,660 | 115 | 116 | 225 | |||||||||||||||||||||
| (a) | During the year, these plans also received contributions, primarily related to pre-1992 commitments, from the Province as follows: PSMC $38 million, SFPP $8 million, UAPP Pre-1992 $13 million and MLAPP $3 million. |
| (b) | Includes vested former employees in the pension plan and non-vested former employees entitled to a refund of their contributions. |
The plans provide a defined benefit retirement income based on a formula for each plan that considers final average years of salary, length of service and a percentage ranging from 1.4% to 2.0% per year of service.
The Province accounts for the liabilities for pension obligations on a defined benefit basis as a participating employer for former and current employees in LAPP, MEPP, MSRP, PJAJPP, PSPP, Teachers’ and UAPP for the government’s consolidated reporting entities except for government business enterprises that report under IFRS and are required to account directly for participation in the public service pension plans under IFRS.
In addition, the Province accounts for the specific commitments made for pre-1992 pension obligations to the Teachers’, PSMC, UAPP and SFPP. In 1992, there was pension plan reform resulting in pre-1992 and post-1992 arrangements for several pension plans.
The Province also accounts for the obligation to the Members of the Legislative Assembly Pension Plan (MLAPP).
| Government of Alberta | Annual Report 2024–25 | 73 | |
CONSOLIDATED FINANCIAL STATEMENTS
| PENSION PLANS AND OTHER DEFINED BENEFIT PLANS | SCHEDULE 14 (continued) |
The following table contains summary information on these specific pension plans. Additional financial reporting is available through each pension plan. Pension liabilities and assets are as follows:
| 2025 | 2024 | |||||||||||
| Pension liabilities/assets |
Pension provision/(recovery) (Schedule 3) |
Pension liabilities/assets |
||||||||||
| In millions | ||||||||||||
| Liabilities for the Province’s employer share for former and current employees |
||||||||||||
| LAPP (a) |
$ | - | $ | - | $ | - | ||||||
| MEPP (b) |
- | - | - | |||||||||
| MSRP (c) |
24 | - | 24 | |||||||||
| PJAJPP (d) |
- | (1 | ) | 1 | ||||||||
| PSPP (e) |
- | - | - | |||||||||
| Teachers’ (f) |
- | - | - | |||||||||
| UAPP (g) |
70 | (58 | ) | 128 | ||||||||
| SERP (h) |
85 | 3 | 82 | |||||||||
| 179 | (56 | ) | 235 | |||||||||
| Liabilities for the Province’s commitment towards pre-1992 obligations |
||||||||||||
| Teachers’ (f) |
6,696 | (334 | ) | 7,030 | ||||||||
| PSMC (i) |
335 | (12 | ) | 347 | ||||||||
| UAPP (g) |
203 | 7 | 196 | |||||||||
| SFPP (g) |
61 | (3 | ) | 64 | ||||||||
| 7,295 | (342 | ) | 7,637 | |||||||||
| MLAPP (j) |
30 | (2 | ) | 32 | ||||||||
| Total |
$ | 7,504 | $ | (400 | ) | $ | 7,904 | |||||
| Assets recognized under other financial assets |
||||||||||||
| SERP (h) |
$ | 17 | $ | (3 | ) | $ | 14 | |||||
| $ | (403 | ) | ||||||||||
Pension provision/(recovery) represents the change in pension liabilities and assets.
The following is a description of each pension liability:
| (a) | The LAPP is a contributory defined benefit pension plan for eligible employees of local authorities and approved public bodies. These include cities, towns, villages, municipal districts, hospitals, Alberta Health Services, school divisions, school districts, colleges, technical institutes and certain commissions, foundations, agencies, libraries, corporations, associations and societies. In accordance with the Employment Pension Plans Act, as modified by the Joint Governance of Public Sector Pension Plans Act and the Exemption (Public Sector Pension) Regulation (AR 3/2019) under the Employment Pension Plans Act, the Plan remains in an actuarial excess position, as disclosed in the latest actuarial funding valuation report, and no special payments are required. Current service costs are funded by employers and employees. |
| (b) | The MEPP is a contributory defined benefit pension plan for eligible management employees of the Province and certain approved provincial agencies and public bodies. Members of the former Public Service Management Pension Plan who were active contributors at August 1,1992, and have not withdrawn from the Plan since that date, continue as members of this Plan. In accordance with the Public Sector Pension Plans Act, as reported in the latest actuarial funding valuation, the Plan is fully funded, therefore no special payments are required. |
| (c) | The MSRP is a contributory defined benefit pension plan for certain public service managers of designated employers who participate in the MEPP and whose annual salary exceeds the maximum pensionable salary limit under the Income Tax Act. The Plan is supplementary to the MEPP. |
| 74 | Government of Alberta | Annual Report 2024–25 | |
CONSOLIDATED FINANCIAL STATEMENTS
| PENSION PLANS AND OTHER DEFINED BENEFIT PLANS | SCHEDULE 14 (continued) |
| (d) | The PJAJPP collectively are contributory defined benefit pension plans for Judges and Application Judges of the Province. Current service costs in the Registered Plan are funded by the Province and plan members at rates which are expected to provide for all benefits payable under the Plan. Benefits are payable by the Province if assets are insufficient to pay for all benefits under the plans. |
| (e) | The PSPP is a contributory defined benefit pension plan for eligible employees of the Province, approved provincial agencies and public bodies. In accordance with the Employment Pension Plans Act, as modified by the Joint Governance of Public Sector Pension Plans Act and the Exemption (Public Sector Pension) Regulation (AR 3/2019) under the Employment Pension Plans Act, the Plan remains in an actuarial excess position, as disclosed in the latest actuarial funding valuation report, and no special payments are required. |
| (f) | The Teachers’ Pension Plans Act requires all teachers under contract with jurisdictions in Alberta to contribute to the Teachers’ Pension Plan. The Province assumed responsibility for the entire unfunded pre-1992 pension obligation of the Teachers’ Pension Plan. In 2009-10 there was a repayment of $1,187 million towards the liability. As of September 1, 2009, the costs of all benefits under the Pre-1992 Plan are paid by the Province. |
| (g) | Under the Employment Pension Plans Act, as modified by the Joint Governance of Public Sector Pension Plans Act and the Exemption (Public Sector Pension) Regulation (AR 3/2019) under the Employment Pension Plans Act, the Province has a liability for payment of additional contributions under defined benefit pension plans for certain employees of municipalities and post-secondary educational institutions. The plans are the Universities Academic and the Special Forces plans. |
For the UAPP, the unfunded liability for service credited prior to January 1, 1992, is being financed by additional contributions of 1.3% of pensionable salaries by the Province, and contributions by employers and employees to fund the remaining amount, as determined by the plan valuation, over the period ending on or before December 31, 2043. Employers and employees fund current service costs.
For the SFPP, the unfunded liability for service credited prior to January 1, 1992 is being financed by additional contributions in the ratio of 1.3% by the Province and 0.8% each by employers and employees, over the period ending on or before December 31, 2036. Current service costs are funded by employers and employees. The Act provides that payment of all benefits arising from pensionable service prior to 1994, excluding post-1991 cost of living adjustment benefits, is guaranteed by the Province.
| (h) | Certain consolidated entities provide defined supplementary executive retirement plans for certain management staff, and other benefit plans for all or specific groups of staff, depending on the plans. The costs of these benefits are actuarially determined on an annual basis using the projected benefit method pro-rated on services, a market interest rate and management’s best estimate of expected costs and the period of benefit coverage. |
| (i) | The PSMC provides benefits to former members of the Public Service Management Pension Plan who were retired, were entitled to receive a deferred pension or had attained 35 years of service before August 1, 1992. The costs of all benefits under the Plan are paid by the Province. |
| (j) | The Province has a liability for payment of pension benefits under a defined benefit pension plan for Members of the Legislative Assembly. Active participation in this plan was terminated as of June 1993, and no benefits can be earned for service after this date. The costs of all benefits under the plan are paid by the Province. |
| Government of Alberta | Annual Report 2024–25 | 75 | |
CONSOLIDATED FINANCIAL STATEMENTS
| PENSION PLANS AND OTHER DEFINED BENEFIT PLANS | SCHEDULE 14 (continued) |
The liability for pension obligations as a participating employer is as follows:
As at March 31, 2025
| Teachers’ | UAPP | 2025 | 2024 | |||||||||||||||||||||||||||||
| LAPP | MEPP | PSPP | Post-1992 | Post-1992 | Others (e) | Total | Total | |||||||||||||||||||||||||
| In millions | ||||||||||||||||||||||||||||||||
| Net assets available for benefits (a) |
$ | 70,699 | $ | 7,267 | $ | 20,996 | $ | 25,558 | $ | 3,682 | $ | 933 | ||||||||||||||||||||
| Pension obligations (a) |
51,142 | 5,401 | 14,522 | 20,870 | 3,367 | 941 | ||||||||||||||||||||||||||
| Pension plan (surplus)/deficit |
(19,557 | ) | (1,866 | ) | (6,474 | ) | (4,688 | ) | (315 | ) | 8 | |||||||||||||||||||||
| Unamortized gains (b) |
10,270 | 745 | 3,190 | 3,486 | 385 | 95 | ||||||||||||||||||||||||||
| Timing differences (c) |
(288 | ) | (29 | ) | (100 | ) | - | - | (1 | ) | ||||||||||||||||||||||
| (Accrued benefit asset)/future benefit liability |
$ | (9,575 | ) | $ | (1,150 | ) | $ | (3,384 | ) | $ | (1,202 | ) | $ | 70 | $ | 102 | ||||||||||||||||
| Liability for the Province’s share for former and current employees |
(2,913 | ) | (548 | ) | (1,500 | ) | (601 | ) | 70 | 100 | (5,392 | ) | (4,131 | ) | ||||||||||||||||||
| Valuation adjustment (d) |
2,913 | 548 | 1,500 | 601 | - | 9 | 5,571 | 4,366 | ||||||||||||||||||||||||
| Liability for the Province’s commitment towards pre-1992 obligation |
7,295 | 7,637 | ||||||||||||||||||||||||||||||
| MLAPP |
30 | 32 | ||||||||||||||||||||||||||||||
| Total pension liability of the Province |
$ | 7,504 | $ | 7,904 | ||||||||||||||||||||||||||||
| (a) | As reported in pension plan financial statements or actuarial reports. |
| (b) | Gains and losses are amortized over the employee average remaining service life of each plan, which range from eight to 14 years. |
| (c) | Accounting timing differences between the pension plan fiscal year-ends and March 31 are for payments and interest expense. |
| (d) | The valuation adjustments reflect that the assets belong to the members and others entitled to benefits under these pension plans and the administrators/trustees have no claim to any of these assets. |
| (e) | Others include the MSRP, PJAJPP and SERP. |
| 76 | Government of Alberta | Annual Report 2024–25 | |
CONSOLIDATED FINANCIAL STATEMENTS
| PENSION PLANS AND OTHER DEFINED BENEFIT PLANS | SCHEDULE 14 (continued) |
The pension expense for the Province is as follows:
| Teachers’ | 2025 | 2024 | ||||||||||||||||||||||||||||||||||
| LAPP | MEPP | PSPP | Pre-1992 | Post-1992 | UAPP | Others (c) | Total | Total | ||||||||||||||||||||||||||||
| In millions | ||||||||||||||||||||||||||||||||||||
| Pension expense |
||||||||||||||||||||||||||||||||||||
| Current period benefit cost (a) |
$ | 1,731 | $ | 151 | $ | 475 | $ | - | $ | 637 | $ | 102 | $ | 31 | $ | 3,127 | $ | 2,929 | ||||||||||||||||||
| Amortization of actuarial (gains)/losses (b) |
(1,394 | ) | (74 | ) | (372 | ) | 16 | (383 | ) | (28 | ) | 10 | (2,225 | ) | (2,091 | ) | ||||||||||||||||||||
| Total |
$ | 337 | $ | 77 | $ | 103 | $ | 16 | $ | 254 | $ | 74 | $ | 41 | $ | 902 | $ | 838 | ||||||||||||||||||
| Province’s share of pension expense |
$ | 103 | $ | 37 | $ | 45 | $ | 16 | $ | 127 | $ | 74 | $ | 41 | $ | 443 | $ | 368 | ||||||||||||||||||
| Interest expense |
||||||||||||||||||||||||||||||||||||
| Interest on pension liability (a) |
- | - | - | 217 | - | 8 | 22 | 247 | 264 | |||||||||||||||||||||||||||
| Total pension expense of the Province |
$ | 103 | $ | 37 | $ | 45 | $ | 233 | $ | 127 | $ | 82 | $ | 63 | $ | 690 | $ | 632 | ||||||||||||||||||
| (a) | As reported in pension plan financial statements or actuarial reports. Numbers in UAPP are net of employees’ share. |
| (b) | Numbers are adjusted to March 31, 2025. |
| (c) | Others includes the MSRP, PJAJPP, SFPP, SERP, MLAPP and PSMC. |
Pension liabilities are based upon actuarial valuations performed at least triennially using the projected benefit method pro-rated on services and actuarial extrapolations performed at December 31, 2024 or March 31, 2025. The assumptions used in the valuations and extrapolations were adopted after consultation between the pension plan boards, the government and the actuaries, depending on the plan, and represent best estimates of future events. The non-economic assumptions include considerations such as mortality as well as withdrawal and retirement rates. The primary economic assumptions include salary escalation rate, discount rate and inflation rate. Each plan’s future experience will inevitably vary, perhaps significantly, from the assumptions. Any differences between the actuarial assumptions and future experience will emerge as gains or losses in future valuations. Gains and losses are amortized over the expected average remaining service lives of the related employee groups.
| Government of Alberta | Annual Report 2024–25 | 77 | |
CONSOLIDATED FINANCIAL STATEMENTS
| PENSION PLANS AND OTHER DEFINED BENEFIT PLANS | SCHEDULE 14 (continued) |
The date of actuarial extrapolation and primary economic assumptions used for accounting purposes were:
| Plan | Latest
valuation
date |
Latest
extrapolation
date |
Salary
escalation
rate
% |
Inflation
rate
% |
Discount
rate (a)
% | |||||
| Teachers’ Pre-1992 |
31-Aug-23 | 31-Mar-25 | - | 2.0 | 3.3 | |||||
| Teachers’ Post-1992 |
31-Aug-23 | 31-Mar-25 | 2.0 | 2.0 | 6.2 | |||||
| PSMC (b) |
31-Dec-23 | 31-Dec-24 | - | 2.5 - 2.0 | 3.3 | |||||
| UAPP (b) |
31-Dec-22 | 31-Mar-25 | 3.0 | 2.5 - 2.0 | 6.1 | |||||
| LAPP (c) |
31-Dec-23 | 31-Dec-24 | 3.0 | 3.5 - 2.0 | 5.9 | |||||
| PSPP |
31-Dec-21 | 31-Dec-24 | 3.0 | 2.0 | 6.2 | |||||
| MLAPP (b) |
31-Mar-25 | N/A | - | 2.5 - 2.0 | 3.3 | |||||
| MEPP (b) |
31-Dec-23 | 31-Dec-24 | 3.0 | 2.5 - 2.0 | 6.2 | |||||
| PJAJPP (Unregistered) (b) |
31-Mar-24 | 31-Mar-25 | 3.0 | 2.5 - 2.0 | 5.5 | |||||
| PJAJPP (Registered) (b) |
31-Mar-24 | 31-Mar-25 | 3.0 | 2.5 - 2.0 | 5.4 | |||||
| MSRP (b) |
31-Dec-23 | 31-Dec-24 | 3.0 | 2.5 - 2.0 | 5.3 | |||||
| SFPP (b) (d) |
31-Dec-23 | 31-Dec-24 | 3.75 - 3.0 | 2.5 - 2.0 | 6.2 | |||||
| (a) | The discount rate is used to measure the pension obligation. The discount rate used for Plans with assets is the expected rate of return on the assets based on their asset mix. The discount rate used for Plans with no assets is the Province’s average cost of borrowing. |
| (b) | Inflation rates: 2025 - 2.5%; thereafter - 2.0%. |
| (c) | Inflation rates: 2024 - 3.5%; 2025 - 3.0%; 2026 - 2.5%; thereafter - 2.0%. |
| (d) | Salary escalation rate: 3.75% for 2 years and 3.0% thereafter. |
The actual return on major funded plans’ assets during the period ranges from 6.9% to 14.8% (2024: 4.4% to 10.6%). This range includes returns for LAPP, Teachers’ Post-1992 Plan, PSPP, MEPP, SFPP, PJAJPP (Registered) and UAPP.
A separate pension plan fund is maintained for each pension plan except for the Teachers’ Pre-1992 Pension Plan and the MLAPP. Each pension plan fund reports annually through financial statements.
Other Defined Benefit Plans
Long-Term Disability Income Continuance Plans
The Province administers two long-term disability income continuance plans. As at March 31, 2025, the Bargaining Unit Plan reported an actuarial surplus of $8.9 million (2024: deficit of $3.7 million) and the Management, Opted Out and Excluded Plan reported an actuarial deficit of $0.8 million (2024: deficit of $6.9 million).
Accumulating Non-Vesting Sick Leave Liability
Sick leave benefits are paid by the Province without employees’ contributions and no assets are set aside to fund the obligation. The sick leave liability is based on an actuarial valuation as at March 31, 2025. As at March 31, 2025, the sick leave liability is $134 million (2024: $138 million). These liabilities are reported in accounts payable and other accrued liabilities (Schedule 11).
| 78 | Government of Alberta | Annual Report 2024–25 | |
CONSOLIDATED FINANCIAL STATEMENTS
| DEFERRED CONTRIBUTIONS | SCHEDULE 15 |
Deferred contributions represent funding or capital assets received from the GoC or other sources with stipulations or external restrictions related to the use of the funding or capital assets. Operating contributions are recognized as revenue when the funding is expended for the restricted purposes. Capital contributions are recognized as revenue over the estimated useful life of the underlying capital assets once constructed or acquired.
| Unspent Deferred Contributions | ||||||||
| 2025 | 2024 | |||||||
| In millions | ||||||||
| Deferred operating contributions |
||||||||
| Deferred operating contributions beginning of year |
$ | 2,249 | $ | 2,098 | ||||
| Contributions restricted for operating |
3,547 | 3,102 | ||||||
| Other transfers and adjustments |
(119 | ) | (205 | ) | ||||
| Deferred operating contributions recognized as revenue |
(3,456 | ) | (2,746 | ) | ||||
| Deferred operating contributions end of year |
2,221 | 2,249 | ||||||
| Unspent deferred capital contributions |
||||||||
| Unspent deferred capital contributions beginning of year |
171 | 186 | ||||||
| Adjustments to the opening balance |
- | 3 | ||||||
| Contributions restricted for capital |
181 | 132 | ||||||
| Transfers to spent deferred capital contributions |
(167 | ) | (145 | ) | ||||
| Other transfers and adjustments |
12 | - | ||||||
| Deferred capital contributions recognized as revenue |
(6 | ) | (5 | ) | ||||
| Unspent deferred capital contributions end of year |
191 | 171 | ||||||
| Unspent deferred contributions end of year |
$ | 2,412 | $ | 2,420 | ||||
| Spent Deferred Capital Contributions |
||||||||
| 2025 | 2024 | |||||||
| In millions | ||||||||
| Spent deferred capital contributions beginning of year |
$ | 3,964 | $ | 3,696 | ||||
| Adjustments to the opening balance |
- | 10 | ||||||
| Capital asset contributions received during the year |
31 | 31 | ||||||
| Cash contributions received/receivable per reimbursement arrangement |
35 | 195 | ||||||
| Transfers from unspent deferred capital contributions |
167 | 145 | ||||||
| Other transfers and adjustments |
92 | 87 | ||||||
| Deferred capital contributions recognized as revenue |
(209 | ) | (200 | ) | ||||
| Spent deferred capital contributions end of year |
$ | 4,080 | $ | 3,964 | ||||
| Government of Alberta | Annual Report 2024–25 | 79 | |
CONSOLIDATED FINANCIAL STATEMENTS
| TANGIBLE CAPITAL ASSETS | SCHEDULE 16 |
| General Capital Assets | Infrastructure Assets | 2025 | 2024 | |||||||||||||||||||||||||||||||||||||||||||||||||
| Total | Total | |||||||||||||||||||||||||||||||||||||||||||||||||||
| Computer | Provincial | Dams and | ||||||||||||||||||||||||||||||||||||||||||||||||||
| hardware | highways, | water | ||||||||||||||||||||||||||||||||||||||||||||||||||
| and | Sub | Land | roads and | management | Sub | |||||||||||||||||||||||||||||||||||||||||||||||
| Land (b) | Buildings (c) | Equipment (d) | software | Other (e) | total | improvements (f) | airstrips (g) | Bridges | structures (h) | total | ||||||||||||||||||||||||||||||||||||||||||
| Estimated Useful Life | Indefinite | 10-70 yrs | 3-25 yrs | 3-15 yrs | 3-50 yrs | 5-40 yrs | 3-50 yrs | 50-75 yrs | 25-80 yrs | |||||||||||||||||||||||||||||||||||||||||||
| In millions | ||||||||||||||||||||||||||||||||||||||||||||||||||||
| Historical cost (i) |
||||||||||||||||||||||||||||||||||||||||||||||||||||
| Beginning of year |
$ | 3,165 | $ | 52,227 | $ | 8,374 | $ | 6,625 | $ | 1,434 | $ | 71,825 | $ | 880 | $ | 29,782 | $ | 2,807 | $ | 2,258 | $ | 35,727 | $ | 107,552 | $ | 104,311 | ||||||||||||||||||||||||||
| Adjustment on adoption of accounting standards (a) |
- | - | - | - | - | - | - | - | - | - | - | (781 | ) | |||||||||||||||||||||||||||||||||||||||
| Additions |
28 | 1,773 | 589 | 386 | 53 | 2,829 | 85 | 1,069 | 147 | 179 | 1,480 | 4,309 | 4,202 | |||||||||||||||||||||||||||||||||||||||
| Transfers and adjustments (j) |
70 | 159 | 8 | (5 | ) | (1 | ) | 231 | 30 | (90 | ) | (14 | ) | 6 | (68 | ) | 163 | 127 | ||||||||||||||||||||||||||||||||||
| Disposals including write-downs |
(42 | ) | (165 | ) | (196 | ) | (123 | ) | (13 | ) | (539 | ) | (1 | ) | - | - | (3 | ) | (4 | ) | (543 | ) | (307 | ) | ||||||||||||||||||||||||||||
| 3,221 | 53,994 | 8,775 | 6,883 | 1,473 | 74,346 | 994 | 30,761 | 2,940 | 2,440 | 37,135 | 111,481 | 107,552 | ||||||||||||||||||||||||||||||||||||||||
| Accumulated amortization |
||||||||||||||||||||||||||||||||||||||||||||||||||||
| Beginning of year |
$ | - | $ | 22,399 | $ | 6,266 | $ | 5,114 | $ | 1,071 | $ | 34,850 | $ | 462 | $ | 10,133 | $ | 1,088 | $ | 648 | $ | 12,331 | $ | 47,181 | $ | 44,974 | ||||||||||||||||||||||||||
| Adjustment on adoption of accounting standards (a) |
- | - | - | - | - | - | - | - | - | - | - | - | (234 | ) | ||||||||||||||||||||||||||||||||||||||
| Amortization expense |
- | 1,206 | 447 | 355 | 49 | 2,057 | 18 | 781 | 66 | 24 | 889 | 2,946 | 2,744 | |||||||||||||||||||||||||||||||||||||||
| Transfers and adjustments (j) |
- | 28 | 1 | - | (9 | ) | 20 | - | 50 | - | - | 50 | 70 | (50 | ) | |||||||||||||||||||||||||||||||||||||
| Effect of disposals including write-downs |
- | (98 | ) | (194 | ) | (118 | ) | (13 | ) | (423 | ) | - | - | - | (1 | ) | (1 | ) | (424 | ) | (253 | ) | ||||||||||||||||||||||||||||||
| - | 23,535 | 6,520 | 5,351 | 1,098 | 36,504 | 480 | 10,964 | 1,154 | 671 | 13,269 | 49,773 | 47,181 | ||||||||||||||||||||||||||||||||||||||||
| Net book value as at March 31, 2025 |
||||||||||||||||||||||||||||||||||||||||||||||||||||
| $ | 3,221 | $ | 30,459 | $ | 2,255 | $ | 1,532 | $ | 375 | $ | 37,842 | $ | 514 | $ | 19,797 | $ | 1,786 | $ | 1,769 | $ | 23,866 | $ | 61,708 | |||||||||||||||||||||||||||||
| Net book value as at March 31, 2024 |
$ | 3,165 | $ | 29,828 | $ | 2,108 | $ | 1,511 | $ | 363 | $ | 36,975 | $ | 418 | $ | 19,649 | $ | 1,719 | $ | 1,610 | $ | 23,396 | $ | 60,371 | ||||||||||||||||||||||||||||
| (a) | Historical cost and accumulated amortization, have been adjusted upon adoption of PS 3160 P3 and PSG-8 Purchased Intangibles in 2023-24. For P3, the net book value of tangible capital assets had decreased by $415 million. Other tangible capital assets with a net book value of $132 million (historical cost - $258 million; accumulated amortization - $126 million) had been reclassified and reported under purchased intangibles and other non-financial assets. |
| (b) | Land includes land acquired for parks and recreation, building sites, infrastructure and other program use. It does not include land held for resale or Crown lands acquired by right. |
| (c) | The cost of buildings under capital leases is $813 million (2024: $796 million). |
| (d) | Equipment includes SuperNet, vehicles, heavy equipment, fire protection equipment, office equipment and furniture and other equipment. |
| (e) | Other tangible capital assets include leasehold improvements (amortized over the life of the lease). |
| (f) | Land improvements include parks development and grazing reserves. |
| (g) | Provincial highways, roads and airstrips consist of original pavement, roadbed, drainage works and traffic control devices, and include secondary highways and bridges and some key arterial roadways within cities. Included in these numbers are $6,161 million (2024: $6,219 million-restated) in historical cost and $1,150 million (2024: $1,029 million-restated) in accumulated amortization for alternatively financed capital assets. |
| (h) | Dams and water management structures include dams, reservoirs, weirs, canals, dikes, ditches, channels, diversions, cut-offs, pump houses and erosion protection structures. Measurement uncertainty exists in the estimated useful life of dams and water management structures. |
| (i) | Historical costs include $4,737 million (2024: $4,409 million-restated) in construction in progress which is not amortized until the tangible capital assets are completed and in use. |
| (j) | Transfers and adjustments relate to accounting policy alignments and reclassifications between capital asset categories. |
| 80 | Government of Alberta | Annual Report 2024–25 | |
CONSOLIDATED FINANCIAL STATEMENTS
| TANGIBLE CAPITAL ASSETS | SCHEDULE 16 (continued) |
The Province’s net book value of tangible capital assets by ministry is as follows:
| 2025 | 2024 (a) | |||||||
| In millions |
||||||||
| Ministries |
||||||||
| Transportation and Economic Corridors |
$ | 23,556 | $ | 23,154 | ||||
| Health |
10,797 | 10,495 | ||||||
| Education |
9,977 | 9,802 | ||||||
| Advanced Education |
8,789 | 8,648 | ||||||
| Infrastructure |
3,980 | 3,847 | ||||||
| Seniors, Community and Social Services |
1,433 | 1,428 | ||||||
| Agriculture and Irrigation |
1,036 | 1,021 | ||||||
| Forestry and Parks |
1,005 | 922 | ||||||
| Technology and Innovation |
421 | 385 | ||||||
| Other |
714 | 669 | ||||||
| $ | 61,708 | $ | 60,371 | |||||
| (a) | The Province is in the process of refocusing Alberta’s health care system from one health authority to an integrated system of sector-based provincial health agencies. To facilitate the transformation, the Lieutenant Governor in Council made the Designation and Transfer of Responsibility Amendment Regulation set out in the Order in Council 384/2024, effective December 12, 2024, to authorize further changes to ministries’ responsibilities. This changeover affects the Ministries of Health, Mental Health and Addiction and Seniors, Community and Social Services. The comparatives were reclassified as if the new structure existed in the prior year. |
| ADJUSTMENTS TO NET ASSETS - OPERATING | SCHEDULE 17 |
| 2025 | 2024 | |||||||
| In millions |
||||||||
| Adjustment on adoption of the P3 standard |
$ | - | $ | (62 | ) | |||
| Asset retirement obligation adjustment from prior period |
21 | (22 | ) | |||||
| Correcting adjustments |
(34 | ) | (53 | ) | ||||
| Other |
10 | 1 | ||||||
| $ | (3) | $ (136 | ) | |||||
| Government of Alberta | Annual Report 2024–25 | 81 | |
CONSOLIDATED FINANCIAL STATEMENTS
| OVER-EXPENDITURE OF SPENDING AUTHORITIES | SCHEDULE 18 |
The authority of the Legislative Assembly is required before public monies from the General Revenue Fund can be used to fund the operations of the Government. The 2024-25 Government Estimates identifies the total requirements for public monies from the General Revenue Fund for the year. Approvals are provided in the form of annually approved limits through appropriations. Appropriations may be created by an appropriation act or other statute. Appropriations under an appropriation act must be created pursuant to a supply vote or set of supply votes. Supply votes are divided along departmental lines. During the year, expenditures were made under the four general types of supply votes: Expense, Capital Investment, Financial Transactions and Contingency.
Details about the source and disposition of authorities and the details of departmental expenditures are provided in each Ministry’s Annual Report.
An encumbrance is incurred when, on a vote by vote basis, the total of actual disbursements in the 2024-25 fiscal year exceed the total estimate. As required by the Financial Administration Act, these amounts must be charged against the voted appropriation for the year ending March 31, 2026.
During the year, departments exceeded their supply votes as follows:
| Adjusted voted estimate |
Voted actuals |
Over expended |
Explanation | |||||||||||
| Departments | In millions | |||||||||||||
| Transportation and Economic Corridors |
||||||||||||||
| Capital Investment |
$ | 1,374.3 | $ | 1,375.3 | $ | (1.0 | ) | Additional spending related to provincial highway rehabilitation projects. | ||||||
| Energy and Minerals |
||||||||||||||
| Expense |
$ | 657.1 | $ | 973.1 | $ | (316.0 | ) | Accrual for settlement of litigation claims. | ||||||
| 82 | Government of Alberta | Annual Report 2024–25 | |
CONSOLIDATED FINANCIAL STATEMENTS
| LISTING OF ORGANIZATIONS | SCHEDULE 19 |
The financial results of the following entities are included in these financial statements:
GOVERNMENT COMPONENTS
Office of the Legislative Assembly and Offices of the Legislature
Office of the Legislative Assembly
Office of the Auditor General
Office of the Ombudsman
Office of the Chief Electoral Officer
Office of the Ethics Commissioner
Office of the Information and Privacy Commissioner
Office of the Child and Youth Advocate
Office of the Public Interest Commissioner
Departments
Advanced Education
Affordability and Utilities
Agriculture and Irrigation
Arts, Culture and Status of Women
Children and Family Services
Education
Energy and Minerals
Environment and Protected Areas
Executive Council
Forestry and Parks Health
Immigration and Multiculturalism
Indigenous Relations
Infrastructure
Jobs, Economy and Trade
Justice
Mental Health and Addiction
Municipal Affairs
Public Safety and Emergency Services
Seniors, Community and Social Services
Service Alberta and Red Tape Reduction
Technology and Innovation
Tourism and Sport
Transportation and Economic Corridors
Treasury Board and Finance
REGULATED FUNDS
Alberta Heritage Foundation for Medical Research Endowment Fund
Alberta Heritage Savings Trust Fund
| Government of Alberta | Annual Report 2024–25 | 83 | |
CONSOLIDATED FINANCIAL STATEMENTS
| LISTING OF ORGANIZATIONS | SCHEDULE 19 (continued) |
Regulated Funds (continued)
Alberta Heritage Scholarship Fund
Alberta Heritage Science and Engineering Research Endowment Fund
Alberta Risk Management Fund
Alberta School Foundation Fund
Human Rights Education and Multiculturalism Fund
Land Stewardship Fund
Post-closure Stewardship Fund
Provincial Judges and Application Judges Reserve Fund
Supplementary Retirement Plan Reserve Fund
Technology Innovation and Emissions Reduction Fund
Victims of Crime and Public Safety Fund
GOVERNMENT ORGANIZATIONS (b)
Agriculture Financial Services Corporation
Alberta Energy Regulator
Alberta Enterprise Corporation
Alberta Foundation for the Arts
Alberta Indigenous Opportunities Corporation
Alberta Innovates Corporation
Alberta Insurance Council
Alberta Investment Management Corporation
Alberta Pensions Services Corporation
Alberta Post-secondary Application System
Alberta Securities Commission
Alberta Social Housing Corporation
Alberta Utilities Commission
Canadian Energy Centre
Gainers Inc.
Heritage Fund Opportunities Corporation
Invest Alberta Corporation
Natural Resources Conservation Board
Safety Codes Council
Travel Alberta Corporation
School Jurisdictions and Charter Schools
Alberta Classical Academy Ltd.
Almadina School Society
Aspen View School Division
Aurora School Ltd.
| 84 | Government of Alberta | Annual Report 2024–25 | |
CONSOLIDATED FINANCIAL STATEMENTS
| LISTING OF ORGANIZATIONS | SCHEDULE 19 (continued) |
School Jurisdictions and Charter Schools (continued)
Battle River School Division
Black Gold School Division
Boyle Street Education Centre
Buffalo Trail School Division
Calgary Arts Academy Society
Calgary Girls’ School Society
Calgary Roman Catholic Separate School Division
Calgary School Division
Canadian Rockies School Division
CAPE-Centre for Academic and Personal Excellence Institute
Chinook’s Edge School Division
Christ the Redeemer Catholic Separate School Division
Clearview School Division
Connect Charter School Society
East Central Alberta Catholic Separate School Division
East Central Francophone Education Region
Edmonton Catholic Separate School Division
Edmonton School Division
Elk Island Catholic Separate School Division
Elk Island School Division
Evergreen Catholic Separate School Division
Foothills School Division
Footprints for Learning Society
Fort McMurray Roman Catholic Separate School Division
Fort McMurray School Division
Fort Vermilion School Division
Foundations for the Future Charter Academy Charter School Society
Fusion Education Association
Golden Hills School Division
Grande Prairie Roman Catholic Separate School Division
Grande Prairie School Division
Grande Yellowhead School Division Grasslands School Division
Greater North Central Francophone Education Region
Greater St. Albert Roman Catholic Separate School Division
Gwynne Valley Rural Education Association
High Prairie School Division
Holden Rural Academy
Holy Family Catholic Separate School Division
Holy Spirit Roman Catholic Separate School Division
Horizon School Division
| Government of Alberta | Annual Report 2024–25 | 85 | |
CONSOLIDATED FINANCIAL STATEMENTS
| LISTING OF ORGANIZATIONS | SCHEDULE 19 (continued) |
School Jurisdictions and Charter Schools (continued)
Lakeland Roman Catholic Separate School Division
Lethbridge School Division
Living Waters Catholic Separate School Division
Livingstone Range School Division
Medicine Hat Roman Catholic Separate School Division
Medicine Hat School Division
Mother Earth’s Children’s Charter School Society (c)
New Horizons Charter School Society
New Humble Community School Association
Northern Gateway School Division
Northern Lights School Division Northland School Division
Northwest Francophone Education Region
Palliser School Division
Parkland School Division
Peace River School Division
Peace Wapiti School Division
Pembina Hills School Division (including Alberta Distance Learning Centre)
Prairie Land School Division
Prairie Rose School Division
Red Deer Catholic Separate School Division
Red Deer School Division
Rocky View School Division
St. Albert School Division
St. Paul School Division
St. Thomas Aquinas Roman Catholic Separate School Division
Southern Francophone Education Region
STEM Collegiate Canada Society
STEM Innovation Academy Society
Sturgeon School Division
Suzuki Charter School Society
Thrive Charter School Society
Valhalla School Foundation
Westmount Charter School Society
Westwind School Division
Wetaskiwin School Division
Wild Rose School Division
WISE Charter Society
Wolf Creek School Division
| 86 | Government of Alberta | Annual Report 2024–25 | |
CONSOLIDATED FINANCIAL STATEMENTS
| LISTING OF ORGANIZATIONS | SCHEDULE 19 (continued) |
Post-secondary Institutions
Alberta University of Arts
Athabasca University
Banff Centre
Bow Valley College
Keyano College
Lakeland College
Lethbridge Polytechnic
MacEwan University
Medicine Hat College
Mount Royal University
NorQuest College
Northern Alberta Institute of Technology
Northern Lakes College
Northwestern Polytechnic
Olds College
Portage College
Red Deer Polytechnic
Southern Alberta Institute of Technology
University of Alberta
University of Calgary
University of Lethbridge
Alberta Health Services and Other Health Entities (b)
Acute Care Alberta (a)
Alberta Health Services
Canadian Centre of Recovery Excellence (a)
Health Quality Council of Alberta
Primary Care Alberta (a)
Recovery Alberta (a)
| Government of Alberta | Annual Report 2024–25 | 87 | |
CONSOLIDATED FINANCIAL STATEMENTS
| LISTING OF ORGANIZATIONS | SCHEDULE 19 (continued) |
The following organizations are accounted for on the modified equity basis in these financial statements:
GOVERNMENT BUSINESS ENTERPRISES (b)
Alberta Gaming, Liquor and Cannabis Commission
Alberta Petroleum Marketing Commission
ATB Financial
Balancing Pool
Credit Union Deposit Guarantee Corporation
| (a) | On May 30, 2024, Bill 22 - Health Statutes Amendment Act came into force, which supports the implementation of Alberta’s health system refocusing from one health authority to an integrated system of sector-based provincial health agencies. As part of this initiative, Acute Care Alberta, Primary Care Alberta and Recovery Alberta became legally established during the fiscal year. The Canadian Centre of Recovery Excellence, a crown corporation, was also legally established during this period to inform best practices in mental and addiction services. |
| (b) | Subsidiaries of government organizations and government business enterprises are not included in the list. |
| (c) | Mother Earth’s Children’s Charter School Society was dissolved at the end of August 2024. Any surplus that can be attributed to Provincial funding will be deposited in the Province’s General Revenue Fund. Any assets acquired by donation or purchase by the school during the time of its existence will be sold and the proceeds will be used to pay off any outstanding debts. The remainder will be donated to a charitable organization of similar aims and objectives chosen by the Board at the time of dissolution. |
| 88 | Government of Alberta | Annual Report 2024–25 | |
CONSOLIDATED FINANCIAL STATEMENTS
Glossary (Unaudited)
| Accrued interest: Interest income that has been earned but not paid in cash at the financial statement date.
Active market: An active market is a financial market with a high volume of trading activity, significant liquidity and frequent transactions. In an active market, assets such as stocks, bonds, commodities and currencies are bought and sold regularly, often with narrow bid-ask spreads and readily available price information.
Alternative investments: Investments considered outside of the traditional asset class of stocks, bonds and cash. Examples include hedge funds, private equities, private income, timberland and asset-backed commercial paper.
Amortized cost: Amortized cost is the amount at which a financial asset or a financial liability is measured at initial recognition minus principal repayments, plus or minus the cumulative amortization using the effective interest method of any difference between that initial amount and the maturity amount, and minus any reduction (directly or through the use of an allowance account) for impairment or uncollectibility.
Ask price: The price that a seller is willing to accept for a security, also known as the offer price.
Asset retirement obligations: Asset retirement obligations are legal obligations associated with the retirement of a tangible capital asset. Asset retirement activities include all activities relating to an asset retirement obligation. These may include, but are not limited to:
• Decommissioning or dismantling a tangible capital asset that was acquired, constructed or developed;
• Remediation (cleanup) of contamination of a tangible capital asset created by its normal use;
• Post-retirement activities such as monitoring; and
• Constructing other tangible capital assets to perform post-retirement activities.
Asset mix: The percentage of an investment fund’s assets allocated to major asset classes (for example 50% equities, 30% interest-bearing securities and 20% inflation sensitive and alternative investments). |
Carrying Value: A measure of value for the assets presented on the Statement of Financial Position. The carrying value represents the asset value in cost, amortized cost, a mix of cost and fair value, net book value or net present value.
Cash equivalents: Cash equivalents are short-term, highly liquid investments that are readily convertible to known amounts of cash and that are subject to insignificant risk of changes in value. Cash equivalents are held for the purpose of meeting short-term cash commitments rather than for investing or other purposes.
Contingent liabilities: Possible obligations that may result in the future sacrifice of economic benefits arising from existing conditions or situations involving uncertainty. That uncertainty will ultimately be resolved when one or more future events not wholly within the government’s control occurs or fails to occur. Resolution of the uncertainty will confirm the incurrence or non-incurrence of a liability.
Cost escalation technique: A method whereby a liability is initially recorded at today’s estimated cost to settle, without applying present value techniques. Reflects an approximation of today’s required cash flows to settle or otherwise extinguish the liability. Subsequent re-measurement of the liability at each financial statement date may be based on accepted escalator methodologies or re-assessments. For example, the effects of inflation or other documented evidence.
Credit risk: The risk that one party to a financial instrument will cause a financial loss for the other party by failing to discharge an obligation.
Currency risk: The risk that the fair value or future cash flows of a financial instrument will fluctuate because of changes in foreign exchange rates. Sometimes referred to as foreign currency risk.
Debenture: A financial instrument showing a debt where the issuer promises to pay interest and repay the principal by the maturity date. It is usually unsecured, meaning there are no liens or pledges on specific assets.
Debt servicing cost: Debt servicing cost consists of interest paid on various forms of government debt. |
| Government of Alberta | Annual Report 2024–25 | 89 | |
CONSOLIDATED FINANCIAL STATEMENTS
Glossary (continued)
| Defined benefit pension plan: A pension plan that specifies either the benefits to be received by an employee, or the method of determining those benefits, such as a pension benefit equal to 2.0% of the average of the five highest consecutive years’ salary times the total years of service.
Derecognition: The removal of previously recognized financial assets or financial liabilities from a government’s statement of financial position.
Derivative Financial Instrument: Financial contracts, the value of which is derived from the value of underlying assets, indices, interest rates, or currency rates. They usually give rise to a financial asset of one party and a financial liability or equity instrument of another party, require no initial net investment and are settled at a future date.
A derivative financial instrument has the following three characteristics:
• Its value changes in response to the change in a specified interest rate, financial instrument price, commodity price, foreign exchange rate, index of prices or rates, or credit rating or other variable;
• It requires no initial net investment or the initial investment is smaller than would be required for other types of contracts that would be expected to have a smaller response to changes in market factors; and
• It is settled in the future.
Discount/Premium: The difference between the price of a bond and its par or face value, when it is bought or issued for lower or higher than the par or face value. Because bond price fluctuates with prevailing market interest rates, price will differ from the face value. For example, if market interest rates are higher than the coupon rate, the bond is bought or issued at a discount to adjust the bond’s yield to market rates. Conversely, if market interest rates are lower than the coupon rate, the bond is bought or issued at a premium to adjust the bond’s yield to market rates.
Effective interest method: It is a method of calculating the amortized cost of a financial asset or a financial liability (or group of financial assets or financial liabilities) and of allocating the interest income or interest expense over the relevant period. The effective interest rate is the rate that exactly discounts estimated future cash payments or receipts through the expected life of the financial instrument or, when appropriate, a shorter period to the net carrying amount of the financial asset or financial liability. |
Emerging market: An economy in the early stages of development, with markets of sufficient size and liquidity and receptive to foreign investment.
Endowment funds: Endowment funds generally are established by donor gifts and bequests to provide either a permanent endowment, which is to provide a permanent source of income, or a term endowment, which is to provide income for a specified period. The principal restriction is that the original contribution should be maintained intact in perpetuity. The income generated from the endowments may or may not be restricted in how it is used.
Fair value: The amount of consideration agreed upon in an arm’s length transaction between knowledgeable, willing parties who are under no compulsion to act. Fair value is similar to market value.
Financial asset: Assets that could be used to discharge existing liabilities or finance future operations and are not for consumption in the normal course of operations. A financial asset could be cash, a right to receive cash or another financial asset from another party, a right to exchange financial instruments with another party under conditions that are potentially favourable or equity of another entity.
Financial instruments: They are any contracts that give rise to financial assets of one entity and financial liabilities or equity instruments of another entity.
Financial liabilities: They are any liabilities that are contractual obligations: (a) to deliver cash or another financial asset to another entity; or (b) to exchange financial instruments with another entity under conditions that are potentially unfavourable to a government.
First-in, first-out: A method of valuing inventory where the cost of the first goods purchased or acquired is the cost assigned to the first goods sold. Therefore, the cost allocated to the inventory items on hand at the end of the period is the cost of those items most recently acquired.
Fixed income instrument: Interest-bearing instrument that provides a return in the form of fixed periodic payments and eventual return of principal at maturity, or money market instrument such as treasury bills and discount notes. |
| 90 | Government of Alberta | Annual Report 2024–25 | |
CONSOLIDATED FINANCIAL STATEMENTS
Glossary (continued)
| Floating rate: An interest rate that is reset periodically, usually every couple of months or sometimes daily.
Forward contract: A contract that obligates one party to buy, and another party to sell, a specified amount of a particular asset at a specified price on a given date in the future.
Government business enterprise: A government organization that is a separate legal entity with the power to contract in its own name and that can sue and be sued; has been delegated the financial and operational authority to carry on a business; sells goods and services to individuals and organizations outside of the government reporting entity as its principal activity; and can, in the normal course of its operations, maintain its operations and meet its liabilities from revenues received from sources outside of the government reporting entity.
Hedging: An activity designed to manage exposure to one or more risks.
Interest rate risk: Interest rate risk represents the risk that the fair value or future cash flows of a financial asset or financial liability will fluctuate because of changes in market interest rates.
Liquidity: The ease with which an asset can be turned into cash and the certainty of the value it will obtain.
Liquidity risk: The risk that a government may encounter difficulty in meeting obligations associated with financial liabilities and operational requirements.
Market risk: Market risk represent the risk that changes in market prices, such as foreign exchange rates, interest rates and prices of investment securities, will affect a government’s revenue or the value of its financial assets and liabilities. Market risk comprises three types of risk: currency risk, interest rate risk and price risk.
Modified equity: Under the modified equity method, the equity method of accounting is modified only to the extent that the government business enterprise’s accounting policies are not adjusted to conform with those of the government. Thus, the government aggregates a government business enterprise’s net assets and net income by adjusting the investment shown in the government’s statement of financial position and by presenting the net income as a separate item on the government’s statement of operations. |
Monte Carlo: Monte Carlo typically refers to a broad class of computational algorithms used to model the probability of different outcomes in a system that cannot be easily predicted due to the interference of random variables. These methods are used in various fields including mathematics, physics, engineering, finance and more. Monte Carlo methods involve simulating the behavior of systems using random sampling of variables to approximate complex mathematical problems that may be difficult to solve analytically. The basic principle involves generating a large number of random samples or simulations of the system and using statistical methods to analyze these samples to obtain numerical results or estimates.
Net realizable value: The selling price less the estimated costs of completion and costs necessary to make the sale.
Non-financial assets: Assets that are acquired, constructed or developed and do not normally provide resources to discharge existing liabilities, but instead are normally employed to deliver government services; may be consumed in the normal course of operations; and are not for sale in the normal course of operations.
Onerous contract: A contract in which the unavoidable costs of meeting the obligations under the contract exceed the economic benefits expected to be received under it.
Operational risk: The risk that results from internal human and system errors or inadequate processes and controls.
Other comprehensive income from government business enterprises: It comprises items of income and expense (including reclassification adjustments) that are not recognized in the profit or loss of the government business enterprise’s Statement of Income (loss). Government Business Enterprise’s other comprehensive income is reported in the Consolidated Statement of Remeasurement Gains and Losses.
Other-than-temporary loss: A significant or prolonged decline in the fair value of an investment below its carrying value is evidence of an other-than- temporary loss in value of an investment. |
| Government of Alberta | Annual Report 2024–25 | 91 |
CONSOLIDATED FINANCIAL STATEMENTS
Glossary (continued)
| Par value: A value set as the face or principal amount of a security, typically expressed as multiples of $100 or $1,000. Bondholders receive par value for their bonds at maturity.
Pooled investment funds: Also called “pooled funds” or “pools”, are funds in a portfolio from numerous individual investors that are aggregated for the purposes of investment, usually by investment management professionals, and may include, but not limited to, mutual funds, hedge funds, exchange traded funds and unit investment trusts, etc. They are aggregated to achieve economies of scale, diversification and professional management and allow investors to diversify their holdings and reduce risk without the need to buy individual securities.
Prepaid expenses: An expenditure that is paid for in one accounting period, but which will not be entirely consumed until a future period. Consequently, it is carried on the government’s statement of financial position as an asset until it is consumed.
Present value: Today’s value of one or more future cash payments, determined by discounting the future cash payments using interest rates.
Present value technique: A method for evaluating the current value of future sum of money or stream of cash flow given a specified rate of return. The method accounts for the time value of money.
Price risk: Price risk is the risk that the fair value or future cash flows of a financial instrument will fluctuate because of changes in market prices (other than those arising from interest rate risk or currency risk), whether those changes are caused by factors specific to the individual financial instrument or its issuer, or factors affecting all similar financial instruments traded in the market. Price risk is influenced by the geopolitical environment, economic conditions and changes in the regulatory environment.
Private equity: An ownership interest in a privately held company.
Public private partnership (P3): A legally binding contract between the Province and one or more public or private partners for the provision of assets and the delivery of services that allocates responsibilities and business risks among the various partners.
|
Purchased intangibles: Purchased intangibles are identifiable non-monetary economic resources without physical substance acquired through an arm’s length exchange transaction between knowledgeable, willing parties who are under no compulsion to act.
Realized gains and losses: Gains or losses are realized when investments are sold at a price over or below its book value and selling costs.
Refinancing risk: The risk that the fair value or future cash flows of a financial instrument will fluctuate due to refinancing.
Remeasurement gains and losses: Revenues and expenses recognized in the Consolidated Statement of Remeasurement Gains and Losses arising when prior to an item’s settlement, an exchange gain or loss is recognized; and when financial instruments in the fair value category are remeasured.
Repurchase agreements: Repurchase agreements are short-term agreements to sell securities in order to buy them back at a slightly higher price at a later time. The proceeds from the sale may be used to purchase other fixed income securities. The party selling the repurchase agreement is effectively borrowing, and the other party is lending. The lender is credited the implicit interest in the yield and price difference between the securities sold to be repurchased and the securities acquired from the sale proceeds. The securities sold under repurchase agreements are accounted for as secured borrowing.
Segment: A distinguishable activity or group of activities of a government for which it is appropriate to separately report financial information to help users of the financial statements identify the resources allocated to support the major activities of the government.
Settlement risk: The risk that arises from non-simultaneous payment exchanges (late or missed payments).
Spent deferred capital contributions: Spent deferred capital contributions represent the total net book value of contributed tangible capital assets and the portion of capital funding that has been expended on acquisition of tangible capital assets. |
| 92 | Government of Alberta | Annual Report 2024–25 | |
CONSOLIDATED FINANCIAL STATEMENTS
Glossary (continued)
|
SuperNet: The Alberta SuperNet is a network of fibre-optic cables and wireless connections across Alberta. The SuperNet was built to connect public institutions (schools, hospitals, colleges, universities, libraries and municipal offices) to a broadband network for high-speed Internet access, video conferencing and other services.
Unspent deferred contributions: Unspent deferred contributions consist of two components: unspent deferred operating contributions and unspent deferred capital contributions. These unspent deferred contributions represent the funding received by the government and not yet used in accordance with relevant stipulations or restrictions.
|
| Government of Alberta | Annual Report 2024–25 | 93 |
CONSOLIDATED FINANCIAL STATEMENTS
| 94 | Government of Alberta | Annual Report 2024–25 | |
Performance Results
| Government of Alberta | Annual Report 2024–2025 | 95 | |
PERFORMANCE RESULTS
Table of Contents
| Management’s Responsibility for Reporting |
97 | |||
| Executive Overview |
98 | |||
| Priority One: Boosting Alberta’s Advantage |
103 | |||
| Performance Indicators |
111 | |||
| Performance Indicator: Private sector employment |
111 | |||
| Performance Indicator: Long term unemployment rate |
112 | |||
| Performance Indicator: Wages and salaries growth |
112 | |||
| Performance Indicator: Apprenticeship graduates employment rate |
113 | |||
| Performance Indicator: Enrollment in facility-based child care programs, family day home, and group family child care |
114 | |||
| Performance Indicator: Alberta Activity Index |
115 | |||
| Performance Indicator: Non-residential capital investment in Alberta |
116 | |||
| Performance Indicator: Value of Alberta’s exported products |
117 | |||
| Performance Indicator: Upstream oil and gas investment |
118 | |||
| Performance Indicator: Net Debt to GDP in Alberta and comparator provinces (B.C., Ontario, Quebec) |
119 | |||
| Performance Indicator: Per capita expenditure in Alberta and comparator provinces (B.C., Ontario, Quebec) |
120 | |||
| Priority Two: Investing in Albertans |
121 | |||
| Performance Indicators |
133 | |||
| Performance Indicator: High school completion rate |
133 | |||
| Performance Indicator: Post-Secondary graduates employment rate |
134 | |||
| Performance Indicator: Violent and property crime in urban and rural areas |
135 | |||
| Performance Indicator: Change in violent and non-violent crime indices |
137 | |||
| Performance Indicator: New affordable housing units and rent subsidies |
139 | |||
| Performance Indicator: Annual number of surgeries provided |
140 | |||
| Performance Indicator: Family physician and nurse practitioner workforce |
141 | |||
| Performance Indicator: Mental health and addiction-related emergency department visits with no physician or community provided mental health services in previous two years |
142 | |||
| Performance Indicators – Sources and Notes |
143 | |||
| 96 | Government of Alberta | Annual Report 2024–2025 | |
PERFORMANCE RESULTS
Management’s Responsibility for Reporting
The Performance Results section of the Government of Alberta Annual Report is prepared by the Senior Assistant Deputy Minister, Treasury Board Secretariat under the general direction of the Deputy Minister of Treasury Board and Finance, as authorized by the President of Treasury Board and Minister of Finance pursuant to Section 8 of the Sustainable Fiscal Planning and Reporting Act (the Act). The Government of Alberta is responsible for the integrity and objectivity of information contained therein.
Under Section 8 of the Act, the Government of Alberta is to prepare and make public on or before June 30 of each year an annual report for the Province of Alberta for the fiscal year ending on the preceding March 31. The annual report must include a comparison of the actual performance results to the targets included in the Government of Alberta Strategic Plan and an explanation of any significant variances. Performance Results is prepared in accordance with this requirement and is published with the consolidated annual report of the Government of Alberta that forms part of the Public Accounts. In order to meet Government of Alberta reporting requirements, the Senior Assistant Deputy Minister, Treasury Board Secretariat obtains performance results relating to each ministry as necessary. Deputy Heads in each ministry are responsible for maintaining management and internal control systems to ensure that the information provided by their ministry for presentation in Performance Results, including performance measure reporting and results reporting for key initiatives and activities, is prepared in accordance with the following criteria:
| • | Reliable – information used in applying performance measure methodologies agrees with the underlying source data for the current and prior years’ results. |
| • | Understandable – the performance measure methodologies and results are presented clearly. |
| • | Comparable – the methodologies for performance measure preparation are applied consistently for the current and prior years’ results. |
| • | Complete – outcomes, performance measures and related targets match those included in the Government of Alberta Strategic Plan and Budget 2024. |
The Government of Alberta Annual Report is tabled in the Legislature as a part of the Public Accounts and is referred to the Standing Committee on Public Accounts of the Legislative Assembly.
[Original signed by]
Katherine White
Deputy Minister of Treasury Board and Finance
June 16, 2025
| Government of Alberta | Annual Report 2024–2025 | 97 | |
PERFORMANCE RESULTS
Executive Overview
Performance Results 2025 reports on government’s priorities and objectives as identified in the 2024-25 Government of Alberta Strategic Plan which is part of Budget 2024, tabled in February 2024, and delivers on government’s commitment to openness and accountability by reporting on more than just financial information. This report, in concert with the Consolidated Financial Statements, Key Results, and Ministry Annual Reports enables Albertans to assess whether government has fulfilled its commitments and understand government’s progress towards achieving its priorities.
Alberta continues to lead the country in population growth and surpass the national economy in job creation. While the province’s growing population puts pressure on government programs and services, the Government of Alberta continues to focus on our solid economic fundamentals and enabling Albertans’ access to services and supports where and when they need them.
Key highlights
Boosting Alberta’s Advantage
| • | Government announced a renewed strategy for the Heritage Savings Trust Fund. The Fund recorded strong growth, with a market value increase from $22.9 billion in 2023-24 to $27.2 billion in 2024-25. |
| • | A no net increases in regulation framework was introduced to ensure government maintains, at minimum, a 33 per cent reduction in red tape. |
| • | Government continued to invest in quality, accessible, inclusive, and affordable child care programs. Through the Canada-Alberta Canada-Wide Early Learning and Child agreement, in 2024-25, Alberta provided $797.2 million in Affordability Grant funding to make child care more affordable for parents and there was an increase of 14,300 child care spaces and an increase in enrollment of 8,300 from the previous year. |
| • | Alberta businesses, municipalities, Indigenous communities and industry associations were supported through the Alberta Export Expansion Program, where 344 applications for grants were supported in 2024-25. This program granted nearly $1 million in 2024-25 to help these organizations access international markets and attract global buyers. |
| • | The Government of Alberta led 28 international business development and investment attraction missions for companies across the province. Alberta companies and trade-related organizations participated in over 450 engagements, with an average of 16 companies per mission. They benefited from targeted business-to-business meetings, information sessions, and networking opportunities. |
| • | Government worked closely with industry and through intergovernmental advocacy to stand up for Alberta’s natural resources, including signing a letter of intent with Enbridge in January 2025, which will form a working group with the Alberta Petroleum Marketing Commission to evaluate future opportunities across more than 29,000 kilometres of the Enbridge energy transportation network in North America. |
| 98 | Government of Alberta | Annual Report 2024–2025 | |
PERFORMANCE RESULTS
Investing in Albertans
| • | Government made significant progress in refocusing the health care system through a transition to four sector-based provincial health agencies – Acute Care Alberta, Primary Care Alberta, Assisted Living Alberta, and Recovery Alberta – and seven regional health corridors. |
| • | Progress was made to improve Emergency Medical Services (EMS) response times, including providing $704 million for Emergency Health Service (EHS) to increase system capacity, hiring 419 new EMS staff, and providing $15 million to the EMS Vehicle Capital Grant Program in 2024-25. |
| • | Work is ongoing to reduce surgical wait times and in 2024-25, approximately 318,601 surgeries were completed, exceeding the target of 310,000. |
| • | Government continues to support work to recruit and retain health care workers in the province, including investing in additional Doctor of Medicine seats, finalizing the primary care physician compensation model, providing physician compensation through the Rural Remote Northern Program, and providing support to recruit internationally educated nurses. |
| • | Government invested more than $106 million to continue to build and operate recovery communities, including five in direct partnership with Indigenous communities, as part of the Alberta Recovery Model. Once fully operational, 11 recovery communities will add over 700 additional long-term addiction treatment beds capable of supporting more than 2,000 Albertans over the age of 18 every year. |
| • | During 2024-25 12 school capital projects were completed to make more than 11,000 new and updated student spaces available throughout the province. |
| • | Government provided $18.4 million in provincial funding to the Calgary Police Service and Edmonton Police Service to continue the implementation of the Safe Streets Action Plan. |
| • | Government introduced the Rate of Last Resort, which replaces the Regulated Rate Option, to protect Albertans who are unable to sign a competitive electricity contract from power price spikes. |
| • | As part of the National Action Plan to End Gender-Based Violence, the federal government will provide Alberta with $54 million in funding over four years (2023- 27). $15.7 million was allocated in 2024-25 to the Government of Alberta to support survivors and prevent gender-based violence. Funding was provided to cross-ministry partners to reinforce work already underway across the province, support new gender-based violence prevention opportunities and expand Indigenous-led services. |
| • | The Alberta Indigenous Opportunities Corporation (AIOC) aggregate loan limit was increased to $3 billion, thereby increasing the capacity of Indigenous communities in Alberta to participate in economic opportunities. This included two new energy projects with Indigenous equity ownership, which secured their contribution to critical energy assets. |
| Government of Alberta | Annual Report 2024–2025 | 99 | |
PERFORMANCE RESULTS
Priority One: Boosting Alberta’s Advantage
Objectives
| 1. | Growing Alberta’s Advantage |
Status: Ongoing - Alberta maintained its overall tax advantage compared to all other provinces. Government also accomplished its goal of reducing red tape by 33 per cent since 2019 and continues to grow the Heritage Fund.
| 2. | Connecting Albertans to jobs |
Status: Ongoing - Government delivered a broad suite of training programs to connect Albertans to jobs and address labour demands and worked to increase access to child care.
| 3. | Strengthening economic activity and attracting investment |
Status: Ongoing - Alberta continued to attract investment, supported access to new markets for Alberta exports, and took action to diversify the economy.
| 4. | Standing up for Alberta’s natural resources |
Status: Ongoing - Government continued to promote Alberta as a responsible steward for energy development and advance Alberta’s natural resource development through partnerships and access to new markets.
| 5. | Ensuring the health and integrity of Alberta’s environment and ecosystem |
Status: Ongoing - Government continued to support environmental resource stewardship and conservation, emergency preparedness, and a balanced and responsible approach to managing the impacts of resource development activities.
| 6. | Building Alberta |
Status: Ongoing - Government invested in priority infrastructure projects, capital maintenance and renewal projects, and local infrastructure projects across the province.
Performance Indicators
Private sector employment
Status: Increasing - The number of jobs in the private sector increased from 1,640,000 in 2023 to 1,720,000 in 2024.
Long-term unemployment rate
Status: Improving - The share of unemployed Albertans who were unemployed long-term increased from 16 per cent in 2023 to 21 per cent in 2024.
Wages and salaries growth
Status: Increasing - Wages and salaries in Alberta grew 5 per cent year over year in 2024 alongside a 3.1 per cent increase in overall employment.
Apprenticeship graduates employment rate
Status: Stable - In 2024, 96 per cent of recent apprenticeship graduates reported they were employed.
Enrollment in facility-based child care programs, family day home, and group family child care
Status: Increasing - The total number of children enrolled in a licensed child care program stood at 194,000.
Alberta Activity Index
Status: Increasing - Between 2023 and 2024, the Alberta Activity Index grew by 2.2 per cent.
Non-residential capital investment in Alberta
Status: Stable - Non-residential capital investment decreased slightly by 3.1 per cent from 2023 to 2024.
Value of Alberta’s exported products
Status: Increasing - The value of Alberta’s exports was $182.7 billion in 2024, up 4.5 per cent from 2023.
Upstream energy investment
Status: Increasing - Upstream oil and gas development grew to $30.2 billion in 2024, a 5.6 per cent increase from 2023.
| 100 | Government of Alberta | Annual Report 2024–2025 | |
PERFORMANCE RESULTS
Net debt to GDP in Alberta and comparator provinces (B.C., Ontario, Quebec)
Status: Improving - Alberta’s net financial position improved by $7 billion and Alberta remained the least-indebted Canadian province.
Per capita expenditure in Alberta and comparator provinces (B.C., Ontario, Quebec)
Status: Improving - Between 2020-21 and 2023- 24, the gap with comparator provinces narrowed significantly (from over $700 per capita to $542), with Alberta’s per capita spending now lower than these comparator provinces.
Priority Two: Investing in Albertans
Objectives
| 1. | Ensuring an accessible, responsive, and refocused health care system |
Status: Ongoing - Government made progress toward a refocused health system that prioritizes patients and empowers frontline health care professionals.
| 2. | Accelerating mental health and addiction support |
Status: Ongoing - Government moved quickly to prioritize access to mental health and addiction services through operating and capital investments in communities across the province.
| 3. | Providing high quality education and opportunities for skill development |
Status: Ongoing - Alberta continued to focus on providing high quality K-12 and post-secondary education with continued investments into school capital projects and supporting innovative career education pathways.
Performance Indicators
High School completion rate
Status: Stable - In 2023-24, 87.1 per cent of students completed high school within five years of entering Grade 10.
Post-secondary graduates employment rate
Status: Stable - In 2024, 95 per cent of post- secondary graduates reported being employed approximately two years after graduation.
Violent and property crime in urban and rural areas
Status: Stable - In 2023, Alberta saw a 1.9 per cent increase in violent crime and a 6.1 per cent decrease in property crime.
Change in violent and non-violent crime indices
Status: Stable - In 2023, Alberta’s crime severity index decreased by 2.2 per cent.
New affordable housing units and rent subsidies
Status: Decreasing - In 2024-25, government delivered 798 new affordable housing units and new rental subsidies.
| Government of Alberta | Annual Report 2024–2025 | 101 | |
PERFORMANCE RESULTS
| 4. | Strengthening safe and thriving communities |
Status: Ongoing - Alberta continued its focus on increasing responsiveness in the justice system to better serve Albertans, partnered with the Edmonton and Calgary Police Services to address public safety concerns, and invested in partnerships to combat organized and hate- motivated crime.
| 5. | Supporting Albertans most in need |
Status: Ongoing - Government continued to modernize social service delivery for seniors, persons with disabilities and low-income Albertans, and partnered with community and civil society to support Alberta’s most vulnerable.
| 6. | Forming lasting and meaningful partnerships with Indigenous communities |
Status: Ongoing - Government increased the loan capacity of the Alberta Indigenous Opportunities Corporations, continued to partner with Indigenous communities to pursue economic opportunities through the First Nations Development Fund and other programs, and supported efforts to improve access to key services, including education and health care.
| 7. | Building better communities |
Status: Ongoing - Government continued investing in services to support newcomers, the arts, parks, and recreational opportunities to improve Alberta communities and enhance the quality of life for Albertans.
Annual number of surgeries provided
Status: Increasing - The total number of surgeries performed in Alberta was 318,601 in 2024-25, up by almost 15,000 from the previous year.
Family physician and nurse practitioner workforce
Status: Increasing - The number of registered family physicians grew by 5.2 per cent in 2024 and the number of registered nurse practitioners grew by 3.2 per cent.
Mental health and addiction-related emergency department visits with no physician or community provided mental health services in previous two years
Status: Stable - In 2023-24, 19.7 per cent of individuals who accessed emergency departments for mental health and addiction-related issues had not received publicly funded mental health and addiction services in the previous two years.
| 102 | Government of Alberta | Annual Report 2024–2025 | |
PERFORMANCE RESULTS
Priority One: Boosting Alberta’s Advantage
Alberta continues to drive the country’s prosperity as the economic and job creation engine of Canada. The Government of Alberta continues to defend and advance Alberta’s interests and to invest in key priority sectors such as oil and gas, technology, economic infrastructure, and rural communities and to build on the province’s solid foundation of strong economic fundamentals. Government continues to uphold respect for treaty rights and relationships with First Nations, Métis and Inuit peoples of Alberta while implementing programming and strategic engagements that attract investments in the Alberta’s energy sector and market its responsible and affordable energy to the world.
Objective 1 | Growing Alberta’s Advantage
| • | Alberta maintained an overall tax advantage compared to all other provinces, with low personal income taxes, and no sales tax, payroll tax or health premium. In 2024-25, Albertans and Alberta businesses would have paid at least $19 billion more in taxes if Alberta had the same tax system as any other province. |
| • | Alberta’s tax advantage was enhanced with the introduction of a new personal income tax bracket of eight per cent on the first $60,000 of income, effective January 1, 2025. This new tax bracket will save Albertans approximately $1.2 billion in 2025. |
| • | The Government of Alberta continues to grow the Heritage Fund through the renewed Heritage Fund strategy and the establishment of the Heritage Fund Opportunities Corporation. The market value of the Heritage Fund increased from $22.9 billion in 2023-24 to $27.2 billion in 2024-25. |
| • | Government established the Alberta is Calling Attraction Bonus, a one-time, refundable tax credit aimed at attracting skilled workers from outside Alberta to high-demand occupations. Up to $10 million will be granted in 2025-26 to support up to 2,000 workers who moved to the province between May 1 and December 31, 2024. |
| • | Government remains committed to reducing red tape: |
| - | In 2024, Government accomplished its goal of reducing red tape by 33 per cent. This saved Albertans at least $2.9 billion since 2019 and cut 200,000 regulatory requirements. |
| - | To maintain the 33 per cent reduction, government introduced a no net increases to regulations framework that requires ministries to offset any new regulatory requirements within two years. |
| - | To streamline review processes and reduce permit approval backlogs, Government introduced an “Automatic Yes” toolkit which aims to reduce approval times for nearly 500 government permits. |
| • | Alberta seniors aged 65 and older benefited from a 25 per cent discount on camping fees, drivers’ medical exams, and registry services. |
| - | Seniors saved more than $19 million in overall discounts on personal registry services, including over $1 million in medical report discounts. |
| - | By March 31, 2025, more than 700 seniors received a discount on their Alberta Parks camping reservations for the 2025 camping season. |
| Government of Alberta | Annual Report 2024–2025 | 103 | |
PERFORMANCE RESULTS
Objective 2 | Connecting Albertans to jobs
| • | Government continued to invest in making high-quality child care more affordable and accessible for Albertans. |
| - | $797.2 million in Affordability Grant funding was provided directly to 2,500 licenced child care programs. In turn, this reduced child care fees to an average of $15 per day, saving families approximately $750 per month or $9,000 per year, per child. |
| - | Alberta’s mixed market child care system provided choices to Alberta parents. There are approximately 2,700 child care programs in the province with 194,600 licensed spaces. This includes 17,400 net new spaces in facility-based, home-based, preschools and out-of-school care programs. |
| - | Licenced child care programs across the province were expanded through various targeted Government of Alberta grant programs including the Space Creation Grant, which awarded 108 grants worth $31.8 million, and the Inclusive Spaces Grant, which awarded 105 grants worth $5.1 million. |
| - | Invested $19.7 million in professional development and support for the child care workforce, providing up to $4,387.50 per educator per year, with approximately 5,300 early childhood educators accessing funding in 2024-25. |
| • | Government maintained its focus on modernizing apprenticeship and skilled trades and transforming the adult learning system by allowing apprenticeships to be recognized and credentialled as a form of post-secondary education and increasing advanced placement access for apprenticeship graduates at post-secondary institutions. |
| - | $76 million was provided through the Apprenticeship Learning Grant to fund a total of 28,250 apprenticeship classroom instruction seats at 11 post-secondary institutions across Alberta. |
| - | The government advocated and championed opportunities in apprenticeship programs in the skilled trades through Trades and Apprenticeship Promotion program, including the successful #WouldntTradeIt advertising campaign viewed 24 million times between September and November 2024. |
| - | Alberta remained near an all-time high of 72,000 registered apprenticeships in 2024-25. |
| • | The Expert Panel on Post-Secondary Institution Funding and Alberta’s Competitiveness was established in December 2024 to review current and alternate post-secondary institution funding mechanisms, the impacts of federal immigration policies on Alberta’s post- secondary institutions, the costs of the administrative and regulatory burden on post- secondary institutions, and the overall competitiveness of Alberta’s post-secondary education system. |
| • | Significant progress was made to help Albertans develop new skills, access training and career development opportunities, and grow their careers through Alberta at Work and various skills training programs. |
| - | Invested $70 million in Targeted Enrolment Expansion, resulting in 2,080 new enrolments in high-demand post-secondary programs that support priority industry sectors and have high workforce and student demand. |
| - | Government supported the commercial driving industry in addressing labour shortages, by providing $5.4 million in grant funding to 600 Albertans to complete training for their Class 1 driver’s license, $300,000 to the Class 2 and 4 Post-Licensing Competency Training Grant to address the school bus driver shortage by covering costs of on-the-job competency training, and $1.7 million provided via Women Building Futures to support women in becoming professional drivers. |
| 104 | Government of Alberta | Annual Report 2024–2025 | |
PERFORMANCE RESULTS
| - | $2.4 million in bursaries were awarded to 315 students to train for jobs in northern Alberta through the Northern Alberta Development Bursary program. |
| - | Government continued to respond to skilled labour shortages in the aviation sector in 2024-25, including providing $1.5 million in operational funding as part of a $6 million investment over three years (2023-26). The government also invested $590,000 in the Air Access Bursary to support approximately 59 students in pilot training programs. In total, government has committed $4.5 million between 2023-26 for the Air Access Bursary to encourage students to enter high demand aviation programs. |
| - | The Alberta Industry Skills grant invested $5.2 million in industry-led training projects that aim to equip more than 850 Albertans with in-demand skills for high growth sectors, including aviation and aerospace, construction and technology. |
| - | Through Alberta at Work, government funded 4,822 student enrolments through the first round of the micro-credential pilot program, aimed at helping Albertans re-skill and upskill through shorter-term and specialized programs in areas of high labour market demand. Additionally, the Work-Integrated Learning Industry Voucher Expansion project created an additional 161 placements in 2024 (building off the 945 placements in the previous two years), providing post secondary students and recent graduates with more opportunities to gain work experience in their area of study. |
Objective 3 | Strengthening economic activity and attracting investment
| • | $22 million was allocated through the Alberta Technology and Innovation Strategy for initiatives such as $5 million for the Quantum City strategic partnership between the University of Calgary, the Government of Alberta, and Mphasis, an industry partner, aimed at building an ecosystem for quantum science and technology in Alberta, and other investments in emerging technologies such as artificial intelligence, entrepreneurship training, and developing recent graduates. |
| • | Five post-secondary institutions were provided $1.1 million in grant funding to develop micro-credential programs that aim to enhance awareness of managing and commercializing intellectual property. |
| • | In 2024-25, $4.2 million was provided through the Investment and Growth Fund, which drove economic expansion and diversification and secured four projects which totalled $399 million in investment in the province. These projects included Logistik Unicorp’s hemp processing facility in Elk Point, NewCold’s food storage facility in Coaldale, Lufthansa Technik Canada’s aircraft engine maintenance and repair facility in Calgary, and Crust Craft’s bakery expansion in Edmonton. These projects are expected to create 261 permanent and 445 temporary jobs across the province. |
| • | Government provided $162,500 in funding to support the 2024 Banff World Media Festival, ensuring content that promotes Alberta’s screen-production sector and showcases Alberta as a location for film and television production were featured throughout the event to an international audience from 32 countries. |
| • | The Alberta Made Screen Industries Program contributes to the creation of Alberta-made content and intellectual property through three film and television sector grant programs, including the Alberta Made Production Grant, the Project/Script Development Grant, and the Post-Production, Visual Effects and Digital Animation Grant. In 2024-25, funding was awarded to 28 Alberta Made Production Grant projects, more than 75 Project-Script Development Grant projects and 51 post-production companies. |
| Government of Alberta | Annual Report 2024–2025 | 105 | |
PERFORMANCE RESULTS
| • | Alberta’s film and television industry continued to grow through targeted investment and incentive programs. |
| - | The Film and Television Tax Credit authorized 39 applications to participate in the program, with expected investments in Alberta totalling $219 million. A total of 34 productions were issued tax credits, with a total tax credit value of $55.3 million and Alberta expenditure value of $235.5 million. The net expenditure in Alberta was $4.26 for every $1 in tax credits issued. |
| - | The Alberta Made Production Grant, the Project/Script Development Grant, and the Post-Production, Visual Effects and Digital Animation Grant cumulatively invested $4.8 million in support of 156 projects. |
| • | Promoting Alberta by pursuing new markets and trading partners to advance shared interests and create new opportunities for Albertans and businesses. |
| - | In 2024-25, the Government of Alberta led 28 international missions for companies across the province. Alberta companies and trade-related organizations participated in over 450 engagements, with an average of 16 companies per mission. They benefited from targeted business-to-business meetings, information sessions, and networking opportunities. Many companies took part in multiple missions. |
| - | Alberta businesses, municipalities, Indigenous communities and industry associations were supported through the Alberta Export Expansion Program, where 344 applications for grants, from 195 organizations, were supported in 2024-25. This program granted nearly $1 million in 2024-25 to help these organizations access international markets and attract global buyers. |
| - | A $2.8 million grant was awarded to Calgary Economic Development to administer the Trade Accelerator Program and establish a new levelling up market diversification program for Alberta companies to build export capacity and expand to new markets from 2025-30. These programs serve a vital role in enhancing export readiness of small and medium-sized enterprises, which is a critical driver of Alberta’s economic growth and diversification. |
| • | The Financial Services Concierge supported financial innovation and attracted new investment. This included: |
| - | Assisting 19 entities with navigating Alberta’s legislative and regulatory regimes, including digital asset custodians, prospective credit unions, and financial technology companies. |
| - | Supporting credit unions and ATB Financial to offer alternative finance mortgage products. |
| - | Participating in discussions with trade associations and prospective investment firms. |
| • | Government maintained its efforts to remove barriers to out-of-province credentials recognition and to ensure Alberta employers have access to the skilled workforce needed to diversify the economy. |
| - | The Foreign Credential Advisory Committee was established to provide recommendations on improving the process for recognizing foreign credentials. The committee’s recommendations are to be submitted to government in June 2025. |
| - | Government nominated 9,941 foreign nationals for permanent residency through the Alberta Advantage Immigration Program (AAIP) to deliver on critical economic immigration needs in sectors such as health care, technology, tourism and hospitality, and law enforcement. |
| - | Government continued to add and support designated communities in the Rural Renewal Stream. |
| - | Through the AAIP’s Dedicated Health Care Pathway, 659 internationally trained health professionals were nominated, 80 per cent of which were registered nurses and licensed practical nurses and |
| 106 | Government of Alberta | Annual Report 2024–2025 | |
PERFORMANCE RESULTS
| 15 per cent were physicians. Over one-third of those nominees were destined to work in locations outside of the metropolitan cities of Edmonton and Calgary. |
| - | Fifty-four applications were approved under the AAIP’s Entrepreneur Stream that cumulatively committed more than $7 million through the creation of new businesses and purchase of existing businesses. |
Objective 4 | Standing up for Alberta’s natural resources
| • | Through the Alberta Petrochemicals Incentive Program, significant strides were made to attract investment and incentivize job creation in the liquid natural gas, petrochemicals, and hydrogen sectors. |
| - | $20.8 million was committed to Rocky Mountain Clean Fuels Inc. for the Carseland Project, a $173 million facility that will employ carbon capture utilization and storage to reduce emissions. The project created 670 jobs during construction and is expected to add 15 full time jobs once operational. |
| - | Construction advanced on the Air Products hydrogen energy complex – the first major Carbon Capture Utilization and Storage integrated hydrogen project in Canada. |
| • | Government worked closely with industry and the trilateral working groups (which include British Columbia and the federal government) to address challenges associated with moving large quantities of ammonia by rail to tidewater export facilities. |
| • | Government continues to advance policy that supports a competitive regulatory environment and encourages the development of Alberta’s energy and natural resources. |
| - | Exploring opportunities to advance nuclear development opportunities in Alberta. This included signing a Memorandum of Understanding with Saskatchewan in May 2024 to collaborate on nuclear energy, industrial decarbonization and strengthening the grid. Participating in the Alberta-NRCan Bilateral Table on Small Modular Reactors to support collaboration and work where Alberta and the federal government have common priorities. |
| - | Working with cross-ministry and agency partners to implement the action items identified under the Minerals Strategy and Action Plan. The plan identified 43 action items, of which 13 are completed, 20 ongoing, and 10 pending. |
| - | Initiating work to modernize the Minerals Royalty framework for brine-hosted minerals. As part of this work, government hosted two discussion sessions to discuss the framework, engaging with stakeholder groups and Indigenous communities. |
| - | Advocating to extend critical minerals development policies to include helium developers, ensuring their eligibility for investment tax credit and flow-through shares. In 2024, total helium production in Alberta was 3,800 cubic metres per day from seven wells. |
| • | Government continued to facilitate Indigenous participation in the province’s resource development sector and low carbon projects with First Nations, Metis Settlements, Métis communities and Indigenous organizations. The Aboriginal Consultation Office ensured these communities’ perspectives are considered as part of Alberta’s legal duty to consult. |
| - | The Aboriginal Consultation Office reviewed and consistently met review target timelines for approximately 8,400 land and natural resource development applications for pre-consultation assessment and adequacy of consultation, leading to about 11,400 activities on public land in Alberta. |
| Government of Alberta | Annual Report 2024–2025 | 107 | |
PERFORMANCE RESULTS
| - | The Indigenous Consultation Capacity Program provided 60 Indigenous communities $110,000 each in funding to facilitate their participation in Alberta’s consultation process on land and natural resource development. |
| • | Government engaged with global partners to advocate for Alberta’s energy sector, highlighting the province’s investment potential across the entire energy value chain, and showcasing Alberta’s leadership in global energy security. |
| - | Engaged with industry, government officials and other stakeholders at the Japan Energy Summit and Exhibition in June 2024, Energy and Mines Ministers’ Conference in July 2024, and CERAWeek in March 2025. |
| - | Advocated for Alberta’s energy and resources sector through participation in industry committees, such as the Canada Energy Regulator (CER) proceedings and the Energy-CER working table. |
| • | Amendments to the Agri-Processing Investment Tax Credit program allowed partnerships to apply using a single application and investment. The program offers a 12 per cent, non-refundable capital investment tax credit to businesses that invest $10 million or more in a project to build a new or expand an existing value-added agricultural processing facility. Through the tax credit, government has issued conditional approvals to 11 companies, representing more than $1.3 billion in new investment and the estimated creation of 1,621 permanent and temporary jobs. |
Objective 5 | Ensuring the health and integrity of Alberta’s environment and ecosystem
| • | Government continued work to expand and improve Alberta’s irrigation networks to enhance agricultural production, improve yields, and ensure water availability across the province. Government partnered with the Canada Infrastructure Bank and several irrigation districts in 2021 to provide $933 million over seven years through the Irrigating Alberta Infrastructure Investment Grant. Since 2021, of 92 total modernization projects, 51 are mostly completed, 25 are in progress, and four off stream water storage projects are in progress. |
| • | Environmental resource stewardship and conservation were strengthened through partnerships with municipalities, Indigenous communities, and the public. |
| - | Approximately $2.6 million was invested in flood mapping, including more than $1.5 million in federal funding. This investment supported 22 flood mapping studies in 52 municipalities and four First Nations communities, and the launch of four new flood studies. |
| - | The Drought and Flood Protection Program will invest $125 million over five-years until 2029 to help communities plan, design, and construct projects to protect critical infrastructure and ensure public safety during drought and flood events. In 2024-25, $25 million supported 18 projects. |
| - | In 2024-25, government facilitated completion of the greatest number of water-sharing agreements in the province’s history to prepare for drought situations and build community resiliency. |
| • | Alberta’s emergency preparedness was enhanced through wildfire prevention, preparedness, response, and mitigation efforts. Government actions included: |
| - | Declaring the 2024 wildfire season 10 days earlier than usual to encourage Albertans to proactively prepare for wildfires, and direct resources to additional firefighters so that more than 900 seasonal firefighters and support staff were available to address hazardous conditions. |
| 108 | Government of Alberta | Annual Report 2024–2025 | |
PERFORMANCE RESULTS
| - | Increasing the number and availability of aircraft, water bombers, heavy equipment operators, and employing enhanced nighttime wildfire operations. |
| - | Providing $17.5 million for investments in Community Fireguard and FireSmart programs to support regional and local wildfire mitigation. |
| • | Investing over $16 million for capital enhancements for equipment, facility and network system upgrades. Up to $50 million was committed for the Alberta Drilling Accelerator, to test and develop drilling techniques and technologies, to support the acceleration of geothermal, helium, critical minerals, carbon capture, and other industries which rely on the drilling sector. The province continues to support stewardship of the province’s ecosystems and conservation efforts. Government actions include: |
| - | Eleven Watershed Planning and Advisory Councils received $3.5 million for management activities and operations including plan development and education. |
| - | Nine airshed organizations received $1.1 million to provide local information about air quality and programming focused on air quality awareness across the province. |
| - | $5 million is allocated over three years, until 2028, to undertake water feasibility studies to support additional water storage infrastructure and increased conveyance capacity in the South Saskatchewan River Basin. |
| • | Government continues to pursue a balanced and responsible approach to managing the impacts of resource development activities. Among other actions, government is collaborating with the Orphan Wells Association (OWA) to decommission and reclaim orphan wells, pipelines, and facilities in Alberta. Between 2017 and 2020, government loaned the OWA $335 million to accelerate reclamation of orphan well sites. As of January 2025, the OWA has repaid approximately $174.6 million and expects to fully repay the loan by 2031. |
| • | Government continues to work toward a low carbon future through the ongoing implementation of the 2023 Emissions Reduction and Energy Development Plan, including: |
| - | Investing $109 million from the Technology Innovation and Emissions Reduction fund to support projects and initiatives focused on emissions reductions, clean technology development, job creation, economic diversification, and climate adaptation and resilience. |
| - | Providing $56.7 million in grants to Emissions Reduction Alberta to support 41 projects across multiple industrial sectors in Alberta. |
| - | Establishing new and modernizing existing regulatory frameworks for resources and technologies, including mineral resources and small modular reactors, creating opportunities for new investment with regulatory certainty and responsible resource development by advancing oil and gas site rehabilitation throughout the province. |
| • | Collaboration is ongoing with non-profit groups, community organizations, and Indigenous communities to advance environmental stewardship in Alberta. |
| - | $51.4 million was invested through the Oil Sands Monitoring Program, which was funded by industry and jointly managed by the governments of Alberta and Canada, to support ambient environmental monitoring in the oil sands region. |
| - | The province’s air quality monitoring program was expanded in 2024-25 to include a new permanent air monitoring station in Brooks and a portable station in High Level. |
| Government of Alberta | Annual Report 2024–2025 | 109 | |
PERFORMANCE RESULTS
| - | The province is working to deliver year-round monitoring of water quality and quantity and is partnering with the University of Calgary and University of Waterloo to support drought planning and mitigation efforts, through a study of groundwater and hydrometric monitoring networks, including surface water connections. |
Objective 6 | Building Alberta
| • | In 2024-25, Government invested $1.3 billion in capital maintenance and renewal projects in the province. This included: |
| - | Maintenance and vital repairs to government-owned facilities, schools, health and seniors’ facilities, courthouses, and provincial buildings. |
| - | Maintenance and repair of provincial highway networks required $667.7 million. Approximately 1,900 kilometres of existing lanes of highways were paved, and 33 bridge construction and rehabilitation projects were completed. |
| • | The Local Government Fiscal Framework (LGFF) provided $724 million in capital funding to support local infrastructure. |
| - | The framework set a baseline funding level of $722 million for 2024, with $382 million allocated to Calgary and Edmonton, and $340 million allocated to the remaining local governments. |
| - | Budget 2024 included a one-time top-up of $2.2 million to ensure no municipality experienced a decrease in funding during the transition from the Municipal Sustainability Initiative to the LGFF. |
| • | Government invested in priority infrastructure projects to promote economic growth, create jobs, and enhance community resilience, including: |
| - | $32.6 million for the Strategic Transportation Infrastructure Program to develop and maintain key local transportation infrastructure. The program supported 178 projects across 63 rural municipalities in Alberta in 2024-25. |
| - | $61.6 million for fifteen projects to upgrade and construct water supply and treatment facilities. |
| - | $121 million was budgeted to support 50 bridge construction projects, including more than 30 that were completed in 2024-25. Government also introduced a new $100 million bridge bundle program that will address an additional 50 bridge projects by 2031. |
| - | $20 million to support seven projects through the Local Growth and Sustainability Grant in 2024-25. More than $17 million supported four Growth projects, while $2.3 million was allocated to three Sustainability projects. |
| • | Alberta invested more than $1.1 million in 10 airport improvement business case and feasibility study projects through the Regional Airport Development Grant. |
| • | Government provided more than $8.3 million to help rural communities access essential services like gas, power and water at a reasonable cost contributing to the overall economic development and sustainability of rural Alberta. |
| - | In collaboration with the Alberta Federation of Rural Electrification Association and FedGas (formerly known as Federation of Alberta Gas Co-ops), government provided $6.4 million in capital grants through the Rural Gas and Electric programs to assist gas and electricity distributors in providing utility services to rural Albertans. |
| 110 | Government of Alberta | Annual Report 2024–2025 | |
PERFORMANCE RESULTS
Performance Indicators
Performance Indicator: Private sector employment
Status: Increasing
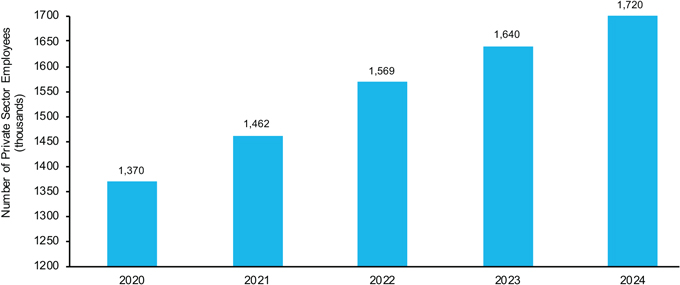
Source: Statistics Canada
For sources and notes see page 143.
The employment population in the private sector is an indicator of economic health that reflects the strength of the private sector (versus the public sector) in generating employment. Growth in private sector employment would typically correspond with an expanding economy, characterized by private sector growth.
This indicator reports on the number of jobs in the private sector. In 2024, the number of jobs in the private sector increased by 4.9 per cent, or 80,000, from 1,640,000 in 2023 to 1,720,000 in 2024. Growth in private sector employment also accelerated in 2024 compared to 2023.
Methodology Description
Statistics Canada’s Labour Force Survey is the primary source of statistics on employment and unemployment in Canada and the provinces. The Labour Force Survey is conducted by Statistics Canada across the country. The target population is the non-institutionalized population 15 years of age and over. The survey is conducted nationwide in all provinces and territories. Excluded from the survey’s coverage are persons living on reserves and other Indigenous settlements in the provinces, full-time members of the Canadian Armed Forces, the institutionalized population, and households in extremely remote areas with very low population density. These groups together represent an exclusion of less than two per cent of the Canadian population aged 15 and over. Results are reported by calendar year.
| Government of Alberta | Annual Report 2024–2025 | 111 | |
PERFORMANCE RESULTS
Performance Indicator: Long term unemployment rate
Status: Increasing
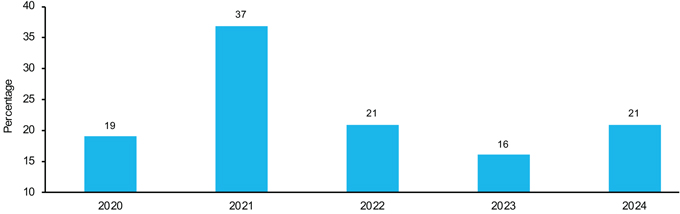
Source: Statistics Canada
For sources and notes see page 143.
The share of unemployed Albertans who were unemployed long-term increased from 16 per cent in 2023 to 21 per cent in 2024. Although employment growth in Alberta was robust in 2024, the surge in the province’s population and labour force led to a growing number of unemployed Albertans. The increase in unemployment was most pronounced among new entrants to the labour market such as youth and newcomers.
Performance Indicator: Wages and salaries growth
Status: Increasing
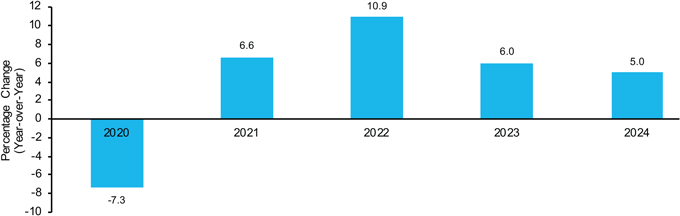
Source: Statistics Canada
For sources and notes see page 143.
Wages and salaries growth measures percentage changes year-over-year. They are an indicator of labour income and reflect changes in employment, labour force participation and wage growth.
Wages and salaries in Alberta grew 5 per cent year-over-year in 2024. This resulted from the strong employment growth in the year and a competitive labour market. Overall employment grew by 3.1 percent in 2024, which was among the strongest results in the country and above the national average.
| 112 | Government of Alberta | Annual Report 2024–2025 | |
PERFORMANCE RESULTS
Performance Indicator: Apprenticeship graduates employment rate
Status: Stable
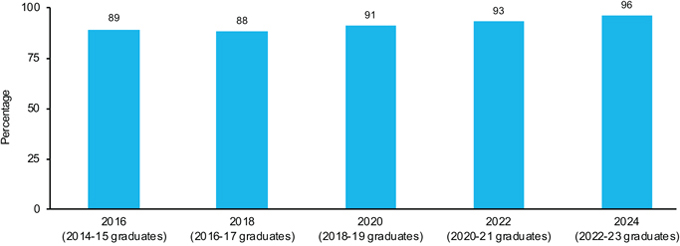
Source: Alberta Advanced Education, Apprenticeship Education Survey
For sources and notes see page 144.
This metric describes the proportion of recent apprenticeship graduates in the labour force who are employed.
Alberta’s apprenticeship education combines on-the-job learning through mentorship and formal classroom instruction that is usually provided at a post-secondary institution. Tracking employment rates of recent apprenticeship graduates provides insights into whether Alberta’s apprenticeship education is supporting graduates to achieve labour market outcomes.
In 2024, 96 per cent of recent apprenticeship graduates in the labour force reported they were employed at the time of data collection, which is the highest result in recent reporting cycles. Employment rates of apprenticeship graduates are highly influenced by the economy.
| Government of Alberta | Annual Report 2024–2025 | 113 | |
PERFORMANCE RESULTS
Performance Indicator: Enrollment in facility-based child care programs, family day home, and group family child care
Status: Increasing
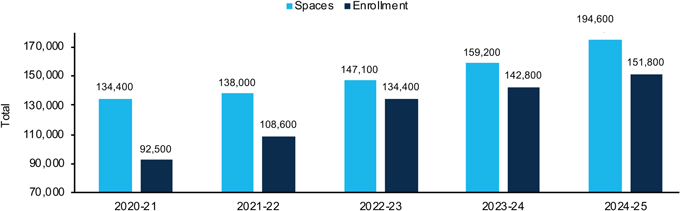
Source: Ministry of Jobs, Economy and Trade, Child Care Information System
For sources and notes see page 144.
Discussion and Analysis of Results (from control document)
This performance indicator reports on the total number of child-care spaces and the number of children enrolled.
Enrollment in licensed child care is influenced by several factors: availability of appropriate care, costs, and personal choice. Space creation and enrollment are in alignment with the goals of the CAELCCA. As more spaces are opened and child care has become more affordable in Alberta, enrollment has increased. Per cent of total enrollment decreased slightly from 2023-24 as the number of spaces opened in 2024-25 at a greater pace than enrollment and the child population of Alberta grew faster than enrollment in licensed child care. The greatest gains in enrollment were in full time care for children under the age of six, which reflects the support provided by the provincial government to lower parent costs.
| 114 | Government of Alberta | Annual Report 2024–2025 | |
PERFORMANCE RESULTS
Performance Indicator: Alberta Activity Index
Status: Increasing
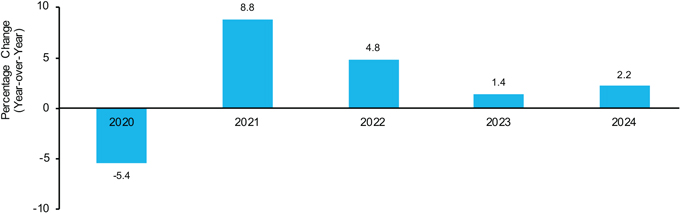
Source: Alberta Treasury Board and Finance
For sources and notes see page 144.
Discussion and Analysis of Results (from control document)
The Alberta Activity Index (AAX) tracks nine indicators of overall economic activity in the province, including employment, housing starts, truck sales and activity in the energy sector. Between 2023 and 2024, the AAX grew by 2.2 per cent. Growth in AAX also accelerated in 2024 compared to 2023.
| Government of Alberta | Annual Report 2024–2025 | 115 | |
PERFORMANCE RESULTS
Performance Indicator: Non-residential capital investment in Alberta
Status: Stable
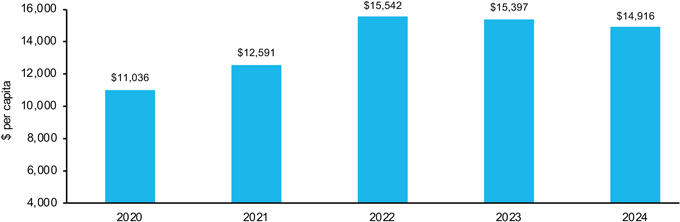
Source: Statistics Canada
For sources and notes see page 145.
Non-residential investment refers to the amount of per capita capital investment in non-residential buildings, machinery and equipment. As companies expand, they purchase property, build facilities and buy equipment. This contributes to Alberta’s GDP and improves Alberta’s long-term economic performance and investment attraction ecosystem.
Alberta non-residential investment was $14,916 in 2024, a decrease of 3.1 per cent from 2023.
| 116 | Government of Alberta | Annual Report 2024–2025 | |
PERFORMANCE RESULTS
Performance Indicator: Value of Alberta’s exported products
Status: Increasing
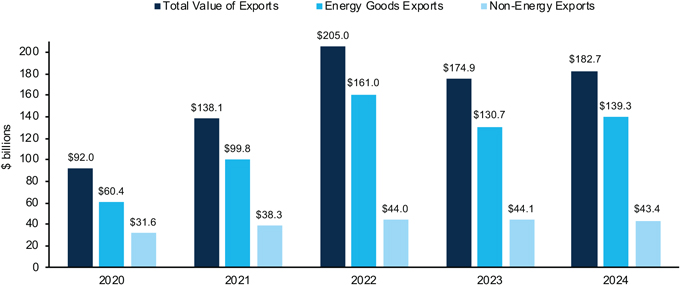
Source: Statistics Canada, International Merchandise Trade
For sources and notes see page 145.
This indicator represents the total value of Alberta international goods exports across all sectors. This indicator does not include Alberta’s service exports, as well as exports of goods and services to other provinces.
The value of Alberta’s exports was $182.7 billion in 2024, up 4.5 per cent year-over-year from 2023. The increase was led by exports of energy products, which rose 6.6 per cent year-over-year on the back of higher oil prices and increased export capacity. Other categories - such as forestry & building products and industrial machinery & equipment - also contributed to growth.
| Government of Alberta | Annual Report 2024–2025 | 117 | |
PERFORMANCE RESULTS
Performance Indicator: Upstream oil and gas investment
Status: Increasing
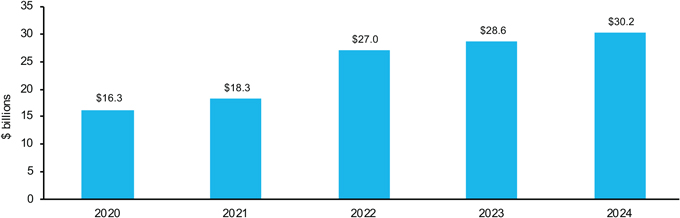
Source: Statistics Canada, Capital Repair and Expenditures Survey
For sources and notes see page 145.
Upstream oil and gas investment tracks capital investments by companies engaged in the exploration and production of crude oil and natural gas. Fixed non-residential capital investment in Alberta’s oil and gas extraction sector is an indicator of the health and future growth of the oil and gas sector in Alberta.
Upstream oil and gas investment in Alberta saw the fourth consecutive year of growth, buoyed by solid oil prices and expanded pipeline capacity. The growth in investment is being driven both in the conventional and oil sands sectors with Alberta receiving the largest share of investments among Canadian provinces. In 2024, investment grew to $30.2 billion (preliminary actual), an increase of 5.6 per cent from 2023.
| 118 | Government of Alberta | Annual Report 2024–2025 | |
PERFORMANCE RESULTS
Performance Indicator: Net Debt to GDP in Alberta and comparator provinces (B.C., Ontario, Quebec)
Status: Improving
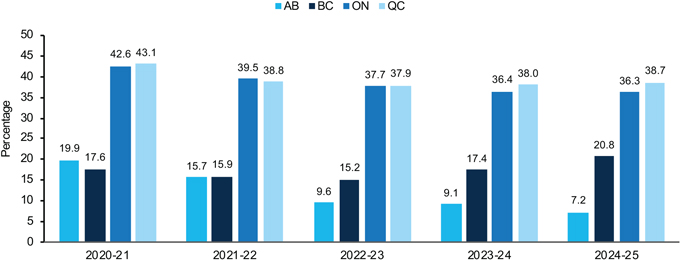
Source: Provincial Accounts and Budgets/Statistics Canada
For sources and notes see page 146.
Net-debt-to- gross domestic product (GDP) measures the proportion of a province’s public debt to its gross domestic product and is a measure of the health and sustainability of a province’s finances. In 2024-25, Alberta remained the least-indebted Canadian province and its net-debt-to GDP declined to 7.2 per cent from 9.1 per cent in 2023-24.
In 2024-25, the province’s net financial debt improved by $7 billion, mainly as a result of the higher surplus, and Alberta’s credit rating improved across the major ratings agencies. Over the longer term, this translates into lower debt servicing costs, which will save Alberta taxpayers money and free up resources for funding government services.
| Government of Alberta | Annual Report 2024–2025 | 119 | |
PERFORMANCE RESULTS
Performance Indicator: Per capita expenditure in Alberta and comparator provinces (B.C., Ontario, Quebec)
Status: Improving
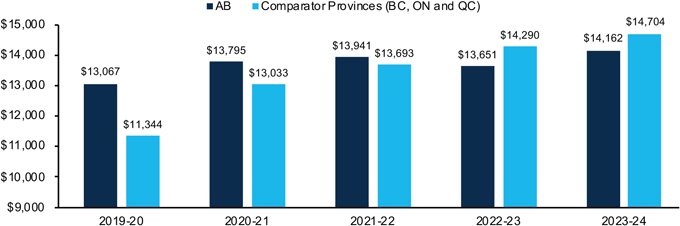
Source: Statistics Canada
For sources and notes see page 146.
Alberta has maintained a disciplined approach to expenditure management to align with the spirit of the MacKinnon Panel and bring per capita spending in line with comparator provinces (BC, ON and QC). The gap has steadily reduced in recent years: between 2020-21 and 2023 24, the gap with comparator provinces narrowed significantly (from over $700 per capita to $542), with Alberta’s per capita spending now lower than these comparator provinces.
| 120 | Government of Alberta | Annual Report 2024–2025 | |
PERFORMANCE RESULTS
Priority Two: Investing in Albertans
In 2024-25, government continued to invest in Albertans by providing them a refocused health care system and a strong education system with new schools being built across the province. Government maintained a responsible approach to fiscal management while making strategic investments in programs that Albertans rely on, including compassionate approaches to addiction recovery, supports for vulnerable Albertans, services for rural, remote and Indigenous communities, and specialized provisions for immigrants and newcomers. Government took action to enhance the law enforcement and justice systems for safer and thriving communities in Alberta.
Objective 1 | Ensuring an accessible, responsive, and refocused health care system
| • | Government made significant progress to create a refocused health system that prioritizes patients and empowers frontline health care professionals to support Albertans. |
| - | Through public engagements with more than 30,000 patients, families, caregivers, and health care workers across Alberta, and enactment of the Health Statutes Amendment Act in May 2024 and the Health Statutes Amendment Act 2024 (No. 2) in May 2024 and December 2024, respectively, government remains committed to timely access to health services within an integrated system of four provincial health agencies. |
| • | Government provided $92.9 million to physicians under the Rural Remote Northern Program. This funding supports recruitment and retention of physicians providing insured medical services to Albertans in underserved rural, remote, and/or northern parts of the province. |
| • | Government continued to work with the Alberta Medical Association (AMA) to develop a new primary care physician compensation model (PCPCM), promote patient-focused care, and increase access to primary care by alleviating system pressures and incentivizing growing patient panels, full time practice, after hours care, technology adoption, and team-based care. The PCPCM was launched on April 1, 2025. |
| • | Government continued to improve Emergency Medical Services (EMS) response times, surgical and emergency wait times, and laboratory and diagnostic services. Key actions included: |
| - | Purchasing new EMS vehicles by investing $15 million in the EMS Vehicle Capital Program in 2024-25. |
| - | Providing $704 million for EMS to increase system capacity as recommended by the Alberta Emergency Services Provincial Advisory Committee and Alberta Emergency Medical Dispatch Review. |
| - | Enhancing rare disease care through a three-year bilateral agreement from 2024-25 to 2026-27 which provides $54 million annually for rare disease drugs and $5.4 million annually for improved screening and diagnostics of rare diseases. |
| - | Allocating $2 million for the independent review of the Provincial Air Ambulance System and the Paramedic Workforce Study to inform future improvements. |
| - | Reducing surgical wait times by completing approximately 318,601 surgeries, exceeding the target of 310,000 for 2024-25. As of March 31, 2025, 74,928 cases were waiting for surgery at adult sites. Of these cases, 57.8 per cent were waiting within clinically recommended timelines. |
| Government of Alberta | Annual Report 2024–2025 | 121 | |
PERFORMANCE RESULTS
| • | Government made significant progress towards strengthening and modernizing Alberta’s primary health care, and digital health system. Actions included: |
| - | Investing $30 million to expand services at four community health centres: the Alex Community Health Centre and CUPS Calgary Society in Calgary and the Jasper Place Wellness Centre and Radius Community Health and Healing in Edmonton. |
| - | Expanding coverage of continuous glucose monitors to eligible adults with diabetes, benefitting an estimated 23,500 Albertans. Funding for the first two years of the $66 million expansion will come from Canada-Alberta health care agreement with the federal government. |
| - | Improving access to patient health information by enabling more than 1.7 million registrants to access MyHealth Records, connecting more than 2,100 community clinics and 1,700 pharmacies to Alberta NetCare, and improving NetCare usability for more than 45,000 clinicians with new features and docking capabilities. |
| • | Work is ongoing to recruit and retain health care workers in the province. Actions include: |
| - | The Alberta Health Workforce Oversight Committee first met in September 2024, in support of the Health Workforce Strategy released in December 2024 to recruit and retain health care workers. |
| - | Over $7.4 million was provided through the Rural Health Professional Action Plan to support rural health education, workforce recognition, attraction and retention, and to ensure high-quality care access across Alberta. In 2024-25, $445,000 was spent to fulfil ongoing commitments through the plan. |
| - | $8.5 million has been invested under the Undergraduate Medical Education Expansion Initiative in conjunction with the Rural Medical Education Program Training Centres initiative to create more seats in Doctor of Medicine programs at the University of Alberta and the University of Calgary. A total of 60 additional seats were funded in 2024-25. |
| - | $16 million over two years, 2024-25 and 2025-26, has been invested in the Rural and Remote Family Medicine Resident Physician Bursary Pilot Program, which provides bursaries to family medicine residents in exchange for a three-year return of service commitment to practice in rural or remote Alberta after completing residency. |
| - | The number of physicians in the province increased by 491 from March 2024, resulting in a four per cent year-over-year increase in the number of physicians practicing in Alberta. |
| - | To address the province’s critical nursing shortage, nearly $5 million was provided to support seat creation in new and existing bridging programs to assist internationally educated nurses with achieving a nursing licence to practice Alberta’s health care system. |
| - | Since January 2023, over 330 students have been funded under the Bursary for Internationally Educated Nurses, which provides funding for education costs, living expenses and certification costs to internationally educated nurses as they complete bridging training to practice as a Licensed Practical Nurse or a Registered Nurse, in exchange for a period of time spent working in rural Alberta. All students funded have signed return in service agreements to work in rural locations. |
| • | The Alberta Midwifery Strategy improves continuity of maternal care, reduces wait times for maternal services and offers greater choice for expecting families, promoting community-based care and reducing dependence on hospital infrastructure for routine maternity services. |
| - | Up to $10 million has been committed to grant funding initiatives over three years with short, medium, and long-term goals to enhance care for rural and remote communities with limited access to care. |
| 122 | Government of Alberta | Annual Report 2024–2025 | |
PERFORMANCE RESULTS
| - | $1.4 million is supporting the development of Indigenous 2nd birth attendants, an Indigenous midwifery curriculum, and an Indigenous care centre for birthing families. The Kihew Awasis Wakamik Cultural Society has received funding and is in the early implementation stages of this project. |
| • | Government invested $4.5 billion over three years in capital funding to maintain and expand various health care projects. Select projects and the total estimated cost include: |
| - | The Red Deer Regional Hospital redevelopment project, which will receive $1.8 billion in total investment, expected to be completed in 2032. Construction started on a new patient tower in 2025. |
| - | The $1.4 billion Arthur J.E. Child Comprehensive Cancer Centre opened in October 2024, providing Albertans with access to comprehensive cancer care services in a world-class setting. |
| - | An $84 million expansion of Rockyview General Hospital’s intensive care, coronary care, and endoscopy services was completed. |
Objective 2 | Accelerating mental health and addiction support
| • | Government moved quickly to prioritize access to mental health and addiction services, spending $1.5 billion to deliver services across the province. |
| • | In 2024-25, government provided an initial $5 million to establish the Canadian Centre of Recovery Excellence as a statutory corporation dedicated to empowering decision-makers with data and evidence to supporting people with mental illness or addiction in their pursuit of recovery. |
| • | Government is investing $66 million over three years (until 2026) to bring up to 60 mental health classrooms online that will serve a catchment area of more than 140 communities and address the need for more treatment capacity for youth. CASA Mental Health opened 12 new classrooms in nine communities in 2024-25, more than doubling the number of operational classrooms over the previous year. |
| • | Government provided $29 million in combined capital and operating funding to support planning and construction of new CASA Houses in Calgary, Fort McMurray, and Medicine Hat, and relocation of an existing facility to Edmonton. Once fully operational, these facilities have the potential to help more than 300 youth with complex mental illnesses access live-in and day programming supports every year. |
| • | In 2024-25, government spent $1.1 million in capital funding for the Northern Alberta Youth Recovery Centre, which is expected to be complete in 2026. The facility will have a capacity of 105 beds and serve up to 300 youth annually, increasing the total number of youth addiction treatment beds in Alberta from 70 to 175 once fully operational. |
| • | Government announced plans to develop two new compassionate intervention centres in Calgary and Edmonton to support implementation of the Compassionate Intervention Act. In 2024-25, government spent $5.9 million in capital funding to support early planning activities for these centres. |
| • | In 2024-25, $9.6 million was spent to support the Virtual Opioid Dependency Program, enabling immediate access to evidence-based addiction treatment medication for Albertans in more than 400 communities across the province, helping divert them from the correctional system and emergency departments into a recovery-oriented system of care. |
| • | Government spent more than $106 million to build and operate recovery communities across the province as part of the Alberta Recovery Model. Once fully operational, 11 recovery communities will add over 700 additional long-term addiction treatment beds capable of supporting more than 2,000 Albertans over the age of 18 every year. This includes investing more than $72 million to build five recovery communities |
| Government of Alberta | Annual Report 2024–2025 | 123 | |
PERFORMANCE RESULTS
| in direct partnership with Indigenous communities to address the need for culturally relevant addiction and mental health supports for First Nations, Inuit and Métis peoples in Alberta across the continuum of care. These and the remaining three sites are in various stages of development, and will join Red Deer, Lethbridge and Gunn recovery communities that are already operational. |
| • | Government continued to expand efforts to enable culturally appropriate addiction and mental health community supports are in place for First Nations, Inuit and Métis peoples in Alberta across the continuum of care by investing $4.6 million to support community-based programs and initiatives pertaining to Indigenous ways of knowing and healing that address barriers to care. |
| • | More than $6.5 million was spent to provide accessible, affordable, outcomes-driven counselling across the province with no waitlist through Counselling Alberta’s online and in-person services. |
| • | Government strengthened prevention and intervention services, investing more than $2.9 million to enhance 211 Alberta mental health and addiction navigation supports and improve access to culturally and locally relevant care. 211 Alberta is a free, confidential, 24/7 information and referral service that provides comprehensive supports for all Albertans. In 2024-25, 211 Alberta logged more than 117,000 interactions, an increase of about 33 per cent over the prior year. |
| • | The Calgary and Edmonton Human-centred Engagement and Liaison Partnership (HELP) teams provide community outreach services to support vulnerable and at-risk individuals by diverting them from the justice system toward appropriate services and supports. Collectively, HELP teams provided more than 5,300 referrals for community-based supports in 2024-25. |
| • | Government provided $11 million to support therapeutic living units (TLUs) in correctional facilities. TLUs provide voluntary, holistic addiction treatment to eligible inmates who are anticipated to remain in custody for 90 days or more. The TLU program includes structured interventions, long-term support, and evidence-based treatment. |
Objective 3 | Providing high quality education and opportunities for skill development
| • | Government addressed the needs of growing student enrolment through investments to build new schools and maintain and enhance existing school infrastructure. |
| - | Twelve schools were completed serving 11,056 students across 11 communities. |
| - | The School Construction Accelerator Program was announced to deliver more than 100 new and updated schools over the next seven years. School capital projects ready to proceed to the next step can now be approved within the same budget cycle, reducing project timelines by up to six months. |
| • | Government invested almost $1.5 billion in learning supports funding, including $42.5 million through the Classroom Complexity Grant, to provide specialized services and supports for students requiring additional help in education settings. |
| • | Government worked towards increasing access to innovative career education pathways and labour market opportunities for Alberta students. |
| - | Almost $4.4 million was invested into new and enhancement dual credit grants across the province to help high school students to earn high school and post secondary credits at the same time. |
| 124 | Government of Alberta | Annual Report 2024–2025 | |
PERFORMANCE RESULTS
| - | $23.7 million was invested to expand access to collegiate programs to support the start-up and expansion costs for collegiate schools to provide students clearer pathways into post-secondary education and careers in their chosen field. |
| • | In 2024-25, government funded various post-secondary capital projects to expand facilities in programs that serve high-demand economic sectors across the province, including: |
| - | $75 million over three years (2024-27) for MacEwan University Business School to expand capacity by 5,000 students. |
| - | $63 million for Olds College over three years (2024-27) to renovate and expand student spaces in the W.J. Elliot Building. |
| - | $215 million for the University of Calgary over five years (2024-29) to increase student capacity by over 1,000 spaces in science, technology, engineering, and math (STEM) programs. |
| - | $376 million over four years (2023-27) to increase the number of graduates from Alberta’s medical schools by 60 each year through new Rural Medical Education Program Training Centres in Grande Prairie and Lethbridge. |
| - | $43 million for the NAIT Advanced Skills Centre to expand training capacity in the trades. |
| - | $12.9 million over three years (2024-27) for Red Deer Polytechnic to create purpose-built space to help businesses conduct applied research. |
| - | $2.3 million in 2024-25 for the launch and expansion of the Bachelor of Aviation Management program at Mount Royal University, which will have an annual intake of 40 students per year over three years (2024-27). |
| • | Government worked to increase access to innovative career and education pathways and labour market opportunities for Alberta students to advance the recommendations of the Career Education Task Force. |
| - | A review of new collegiate school applications, designed to provided specialized, hands-on learning experiences for students in grades 7-12 to align with labour market needs, informed future approaches to ease student transition to post-secondary education and the workforce. |
| • | Alberta Student Aid continued to enhance accessibility of post-secondary education. Alberta aligned with the Canada Student Financial Assistance Program to modernize shelter cost allowance on Alberta student aid applications to better reflect the actual rental housing costs faced by most post-secondary students. Advanced Education invested approximately $905 million in student loans that assisted 108,100 students, approximately $63 million in grants that supported 18,100 students, and approximately $101 million in scholarships and awards supporting 49,200 students. |
| • | $3.1 million was invested in the Mental Health Professional Enrolment Expansion initiative to add more spaces in Alberta’s post-secondary institutions for in-demand professionals such as psychologist, social workers, child and youth care experts and addiction counsellors. |
| • | Government continued to support the education system to improve outcomes for Indigenous and non-Indigenous learners by incorporating Indigenous histories, cultures, languages, and perspectives in curriculum, and promoting foundational knowledge for teachers and school leaders. |
| - | The Bridging Classrooms to Communities Pilot Program provided $3.4 million to help strengthen student connections and foster relationships with Indigenous communities and advance truth and reconciliation. |
| Government of Alberta | Annual Report 2024–2025 | 125 | |
PERFORMANCE RESULTS
| - | School authorities will receive approximately $88.3 million in the 2024-25 school year to provide system, program and instructional supports under the First Nations, Métis and Inuit Grant. |
Objective 4 | Strengthening safe and thriving communities
| • | A modernized Electronic Monitoring Program was implemented in January 2025 for adults on bail or serving community-based sentences who pose a potential risk as identified by the courts. Enabled by $2.8 million and amendments to the Corrections Act and Corrections Regulation, the program uses ankle bracelets to monitor compliance with court-ordered conditions. A Central Monitoring Unit within Correctional Services provides 24/7 oversight, working in coordination with community-based probation officers. |
| • | Several measures were taken to enhance the responsiveness of the justice system and improve access to justice for all Albertans. |
| - | The Alberta Family Resolution Hub was launched, providing online services for Albertans, and was accessed more than 30,000 times by first time users looking to find options for resolving family disputes related to parenting, child support, or divorce. |
| - | The expansion of mediation and dispute services helped families resolve 72 per cent of their family law issues without attending court, a 13 per cent increase compared with the previous year. |
| - | Videoconferencing capabilities were rolled out to additional courtrooms, enabling the courts to operate more efficiently and increase Albertans’ access to justice. |
| - | Rollout of the pre-charge assessment system allows Crown prosecutors to review investigative materials before police decide to lay charge to ensure only cases meeting the prosecution standard proceed, reducing unnecessary court appearances and improving efficiency. Implementation at RCMP detachments in Alberta was completed, and pilot screening work began with the Calgary Police Service. |
| - | Investment of $3.5 million in funding of seven drug treatment courts, which along with the Edmonton Mental Health Court, offer alternatives to incarceration and support accused persons in addressing complex problems underlying their offending behaviours. Over the past two years, $1 million in Alberta Community Justice Grants was provided to 39 community organizations to explore and develop innovative community justice initiatives that provide alternatives to the formal legal system. |
| - | Investing $1.4 million in restorative justice and Youth Justice Committee programs focused on ensuring offender accountability, and addressing harm caused by crimes and healing for victims, offenders and communities. |
| - | The Justice Digital Initiative that invested $5.6 million to enhance scheduling and improve digital accessibility, enabling hundreds of thousands of digital submissions and information requests, reducing the time Albertans and lawyers who represent them spend in courts. |
| • | Government provided $18.4 million in provincial funding to the Calgary Police Service and Edmonton Police Service to continue the implementation of the Safe Streets Action Plan. Fifty additional street-level police officers were deployed in Calgary and 32 police officers in Edmonton with a plan for additional 18 police officers in 2025-26. |
| • | Training, equipment, and operational partnerships were used to combat organized and hate-motivated crime and enhance public safety through law enforcement initiatives, interdiction teams, and collaborations. |
| 126 | Government of Alberta | Annual Report 2024–2025 | |
PERFORMANCE RESULTS
| - | In 2024-25, $55.7 million advanced efforts to dismantle organized crime through intelligence collaborations of Alberta Law Enforcement Response Teams. |
| - | $28.6 million supported the establishment of the Sheriffs Interdiction Patrol Teams to target cross-border trafficking of drugs and firearms. The first unit was deployed in January 2025, conducting joint patrols with federal law enforcement. Full operational capacity is expected in 2025-26. |
| - | More than $2.1 million was allocated in grants through the Alberta Security Infrastructure Program to 95 organizations, including faith-based organizations, high-risk schools and community organizations to enhance public safety and combat hate-motivated crime. |
| - | Culturally informed public safety engagements with Indigenous communities continued to address trends and risk factors through the Public Security Indigenous Advisory Committee and partnerships with rural communities support anti-bullying and leadership programming. |
| • | Progress was made implementing recommendations of the Human Trafficking Task Force to better protect and assist survivors and disrupt traffickers. |
| - | The non-profit Alberta Centre to End Trafficking in Persons received $2 million in operational support to lead system coordination, develop a provincial response model and advance a survivor-centred approach to services and supports. |
| - | Nineteen community organizations received $5.5 million through the Combatting Trafficking in Persons grant to address frontline service gaps and enhance safety for those impacted by human trafficking. About 40 per cent of funding supported Indigenous-led or serving organizations across Alberta. |
| • | Four Alberta Regional Victim Serving Societies aligned with RCMP districts were implemented through $25.7 million in funding to replace 60 independent societies and complement Court and Support Navigators that continue to operate from local RCMP detachments. This model ensures timely, trauma-informed assistance and collaboration across criminal justice partners, and ensure consistent, regionally coordinated services for victims of crime. |
| • | Government provided more than $7.3 million to ensure victims of crime receive emergency funds for urgent needs, crisis counseling and longer-term psychological supports, and extended medical benefits through the Victims of Crime Assistance Program. Expedited treatment access was enhanced by enabling medical service providers to bill Alberta Blue Cross directly to mitigate immediate financial pressures. |
| • | In 2024-25, the government invested $8 million to support the Alberta Chief Firearms Office, which includes administering the Canadian Firearms Program in Alberta, promoting public safety and advocating for Alberta’s lawful firearms owners. |
Objective 5 | Supporting Albertans most in need
| • | Government helped Albertans to better understand the utility rates they are paying and encouraged them to seek the best option for their electricity needs, while protecting consumers from unpredictable power price spikes. |
| - | The Rate of Last Resort (RoLR) came into effect on January 1, 2025, replacing the Regulated Rate Option. The RoLR is fixed for a two-year term, with a 10 per cent rate adjustment cap between terms, protecting Albertans not on a competitive electricity contract from significant fluctuations in their utility bills. |
| Government of Alberta | Annual Report 2024–2025 | 127 | |
PERFORMANCE RESULTS
| - | Communications about how to choose optimal electricity plans included notifications to all RoLR consumers every 90 days, and a $2.8 million advertising campaign that resulted in a 700 per cent monthly increase in visits to the Utilities Consumer Advocate website towards the end of the fiscal year. |
| - | The Market Power Mitigation and Supply Cushion Regulations were implemented to protect ratepayers and ensure system reliability. Combined with other factors, commitments addressing tight supply conditions prices decreased by nearly 82 per cent year-over-year in August 2024. |
| - | Evidence and arguments cited in 44 Alberta Utilities Commission decisions led to a total of $280 million in cost disallowances, meaning that proposed costs by utility providers were not approved, preventing them from being included in consumer utility bills. |
| • | Alberta announced updates to the province’s transmission policy where infrastructure will only be built when necessary for reliability reasons or when benefits outweigh the costs. Alberta Electric System Operator oversight now requires new transmission infrastructure projects to use lines already in service and implement a cost-causation model, so Alberta ratepayers no longer must pay the full cost of new transmission lines. |
| • | Design of a restructured energy market began with the aim to prioritize reliability and affordability to ensure the market delivers the power Albertans need, regardless of the weather. |
| • | Government conducted seven engagement sessions across the province focused on affordability, engaging nearly 200 participants from a broad range of key stakeholders—including non-profits, housing organizations, industry, post-secondary institutions, and more. Participants shared their concerns, feedback, and suggestions to help inform future affordability initiatives. |
| • | The Stronger Foundations strategy improved and expanded affordable housing by increasing the number of affordable housing units and enhancing access for those in need. |
| - | Alberta’s government spent $395.5 million to build, renew, maintain, and operate affordable housing in Alberta through the government-supported affordable housing programs, including rent supplements. |
| - | The Affordable Housing Partnership Program brings together public, non profit, and private-sector housing providers to address priority needs. $15 million was spent through the program to complete nearly 260 new housing units in four municipalities, covering one-third of total eligible project costs. As of March 31, 2025, 20 projects are committed to and ongoing for a total of 1,035 new units and 359 shelter spaces. |
| - | $79.9 million was spent through the Family and Community Housing Program to subsidize rental housing operators to keep rental costs low for over 10,500 housing units for families, seniors, and individuals with low income who cannot afford other housing options. |
| - | The Seniors Self-Contained Housing Program received $40 million to support 14,300 apartment-style units, continuing to ensure seniors living independently have access to safe and affordable housing. |
| - | Three housing projects were completed under the Indigenous Housing Capital Program to create 37 new housing units through collaborations with housing providers, municipalities, Indigenous organizations and non-profits. As of March 31, 2025, 15 projects are committed to an ongoing for a total of 496 new units that include rental and lease-to-purchase options. |
| - | Improving and maintaining government-owned housing infrastructure remained a top investment priority. The Capital Maintenance and Renewal Program received $37.1 million to maintain and repair 10,354 government owned affordable housing units and sped up contractor selection by nearly three times. |
| 128 | Government of Alberta | Annual Report 2024–2025 | |
PERFORMANCE RESULTS
| - | $19.6 million was provided through the Specialized Housing program to support more than 2,000 units for individuals with unique housing requirements, including those with developmental disabilities, physical challenges, victims of family violence and the hard-to-house. |
| - | Government launched the Stop Housing Delays web portal to enable developers, municipalities and other housing partners to identify areas that are preventing fast and efficient residential construction. |
| • | Personal data integration across the Assured Income for the Severely Handicapped and Income Support applications improved data accuracy while simplifying access to supports. |
| • | Government invested $104.3 million in the Family and Community Support Services program, which is a partnership with participating municipalities and Metis Settlements to design and deliver locally driven preventive social programming that helps meet the changing needs of vulnerable Albertans and support the well-being of Alberta’s diverse communities. |
| • | Programs designed to assist seniors included access to essential services and financial support. |
| - | Healthy Aging Alberta’s accessible and affordable transportation services for seniors and other Albertans with mobility issues was delivered across 19 rural communities, enabling more Alberta seniors to age in place in their homes and communities. |
| - | The Home and Community Supports Program expanded to 27 communities, empowering older adults to take care of their psychosocial and mental well-being, seek homemaking support and caregiving for medical appointments, recreation, social engagement, and efficiently navigate resources. |
| - | Financial assistance and essential health and personal supports tailored to the needs of over 194,000 seniors with low income included $517.5 million in grants and low-interest home equity loans to strengthen age-friendly communities that remain accessible and inclusive of older adults to maintain independence and engagement with their communities. |
| - | Collaborations with community organizations, government agencies and individuals to raise awareness of and address elder abuse received $3.4 million for initiatives such as training to identify and respond to elder abuse, access to helplines, support services and legal tools, and create community-based networks of support. The Safe Spaces program was expanded to support older adults fleeing abuse in rural and Indigenous communities where supports may be less available. Coordinated Community Response case managers work with local seniors’ lodge housing management bodies to find and use appropriate vacant spaces to shelter seniors escaping abuse. |
| - | Government implemented improvements to the Seniors Lodge Program, including providing additional funding to respond to the challenges facing seniors housing providers. In 2024-25, $56.8 million was provided to operators through the Lodge Assistance Program grant to supplement the reduced revenue from housing 7,000 residents below the income threshold. This was an increase of $19.3 million from 2023-24, raising the rate per eligible resident by 51 per cent. |
| • | Government spent $76.4 million to provide essential services to youth leaving the child intervention system or government care. |
| - | The Transition to Adulthood Program provided individualized financial support to approximately 2,126 young adults to find stable housing, access education and training opportunities, and develop essential life skills that promote independence. |
| - | The Advancing Futures program equipped 1,051 young adults formerly in care with transitional, social, and emotional funding supports for academic upgrading, earning a license or certificate, or learning a trade. |
| Government of Alberta | Annual Report 2024–2025 | 129 | |
PERFORMANCE RESULTS
| - | The Youth Employment Connections Program supported 295 youth to access viable career opportunities in residential construction, gain hands-on experiences and interactions with potential employers, and participate in mentoring circles to help underemployed individuals and new immigrants build networks and gain insights into career paths. |
| - | The Youth Apprenticeship Connections Program supports youth in care and young adults transitioning out of government care to find and access opportunities to explore a career in the trades and participate in apprenticeships. The program served 78 participants previously in care to gain work experience, education, and life skills to enter the trades workforce, with 67 of the participants previously in care. |
| • | The Alberta Child and Family Benefit provided $355 million in tax-free direct financial assistance to more than 185,000 low-income families with children under 18, while maintaining incentives to join and remain in the workforce. |
| • | Through the Rural Sexual Assault Support project, government continued to support training for health care workers in rural and remote communities so that victims of sexual assault do not have to travel significant distances to access a health facility that can administer a sexual assault evidence kit. To date, 350 medical professionals and more than 100 nursing and/or medical students have taken Rural Sexual Assault Support-sponsored training and increased their competency to provide comprehensive and trauma-informed medical care for sexual assault survivors. |
Objective 6 | Forming lasting and meaningful partnerships with Indigenous communities
| • | The Alberta Indigenous Opportunities Corporation (AIOC) aggregate loan limit increased to $3 billion, thereby increasing the capacity of Indigenous communities in Alberta to participate in economic opportunities, including two new energy projects with Indigenous equity ownership, which secured their contribution to critical energy assets. In 2024, the AIOC expanded its mandate to include tourism. |
| • | The First Nations Development Fund applied more than $159 million of proceeds from government-owned slot machines operating in First Nations casinos to support 317 economic, social, and community development projects for First Nations. |
| • | The Aboriginal Business Investment Fund invested $10 million in capital funding for 20 Indigenous community-owned economic development projects, including oil and gas, construction, agriculture, and tourism. The projects will help to create approximately 145 jobs for Indigenous people and stimulate local economies. Metis Settlements directly benefitted from more than $2.5 million in grants that create employment opportunities and support equipment purchases, construction or improvements to buildings and infrastructure. |
| • | A total of $4 million from the Canada-Alberta Labour Market Development Agreement and the Canada-Alberta Workforce Development Agreement was allocated to the Employment Partnerships Program, fostering industry partnerships across 23 initiatives for projects serving approximately 1,300 Indigenous community members in urban and rural locations. Funded training included safety tickets, driver training, and other applied career skills to meet labour market needs. |
| • | Government worked with First Nations communities to improve access to key services, such as education. |
| - | The Specialized Learning Supports for First Nations Grant provided $3.4 million for customized learning supports while building the capacity of First Nations schools to deliver specialized supports and services in a culturally competent way. |
| 130 | Government of Alberta | Annual Report 2024–2025 | |
PERFORMANCE RESULTS
| - | Almost $3.9 million in Enhancement Funding was provided to the Maskwacîs Education Schools Commission and $1.8 million in Enhancement Funding to the Kee Tas Kee Now Tribal Council Education Authority. |
| • | In 2024-25, $10 million was distributed to 14 First Nations, Métis, and Inuit communities and organizations across Alberta through the Indigenous Primary Health care Innovation Fund. The fund supported the expansion of the Alberta Indigenous Virtual Care Clinic, enabling more Indigenous individuals to access remote consultations through phone or video appointments, and the Métis Nation of Alberta’s Medical Travel Program, which enhanced primary care access for a greater number of individuals. |
| • | Eighteen Patient Navigators were funded through the Indigenous Patient Navigator grant program for First Nations, Métis, and Indigenous-serving organizations to improve care coordination and cultural and community-specific assistance to optimize health and promote health literacy. Over three years, starting August 2024, government is providing a total of $7.6 million to recipients through the program. |
| - | In addition, $6.3 million over three years will be collaboratively invested by the Government of Alberta and the Government of Canada to support the program. This bilateral funding has supported fourteen Bilateral Patient Navigator Programs in First Nations, Métis, and Indigenous-serving organizations to improve care coordination and cultural and community-specific assistance to optimize health and promote health literacy. |
| • | The Community Support Fund provided approximately $4 million to support 24 community-based projects in the delivery of cultural and mental health programs, youth focused healing workshops, and safety initiatives for women, girls and two spirit plus (2S+) people. These efforts support long-term healing and contribute to strengthening communities. Projects included entrepreneurship development and financial literacy training to increase economic security for Indigenous women and 2S+ people. |
| • | The Royal Alberta Museum has been developing a new government repatriation policy that will guide the return of objects that fall outside of the First Nations Sacred Ceremonial Objects Repatriation Act. To date, the museum has completed six engagements with representatives from fourteen Treaty 7 and 8 First Nations as well as ten Métis communities. A repatriation framework will be drafted after Treaty 6 engagements are completed. |
Objective 7 | Building better communities
| • | Alberta continued to build welcoming communities for newcomers by applying $10.9 million in grant funding to support the settlement and integration of newcomers across Alberta. Of this amount, the Government of Alberta invested $9.3 million, with the remaining $1.6 million provided by the federal government. |
| - | $3.6 million was invested in the Settlement, Integration, and Language Project for system improvement, capacity building, and enhancing labour market attachment for newcomers. |
| - | An additional $7.3 million was directed to the Supports for Newcomer Integration program. These funds advanced community-based services, including language assessment and referral, as well as English as an Additional Language drop-in programming. |
| • | To further recognize the contributions of newcomers, the Government of Alberta honoured 35 immigrants through the Alberta Immigrant Impact Awards in October 2024. These awards celebrate individuals who have made outstanding contributions to the social, cultural, and economic life of the province. |
| Government of Alberta | Annual Report 2024–2025 | 131 | |
PERFORMANCE RESULTS
| • | Government prioritized the promotion of active lifestyles and community engagement to enhance the overall well-being of communities through the Active Communities Initiative, which approved $1.5 million in capital grants for 19 projects to facilitate construction and renovation of small to mid-sized facilities across Alberta. |
| • | Government invested $50 million through the Community Facility Enhancement Program to support 444 projects, almost 70 more projects than the previous year. This funding supported projects such as community halls, playgrounds, parks, arts venues, indoor and outdoor sport and recreational facilities and cultural establishments. |
| • | A culture of active living was promoted through the Every Kid Can Play program that addressed the challenges of affordability and accessibility in sport, physical activity and recreation for children and youth. |
| - | Alberta’s government provided $3.5 million to KidSport Alberta to subsidize registration costs for families facing financial barriers. |
| - | $4.5 million was provided to community-level non-profit organizations and to provincial scope non-profit organizations to increase affordability and access to sport, physical activity and recreation. |
| • | Annual funding concluded for the Edmonton and Calgary Metropolitan Regional Boards, with the final $1 million for each board from the Alberta Community Partnership program transitioning the municipal members to voluntary membership and self-funded operations. Member municipalities ultimately chose to wind down board operations at the end of March and April 2025, respectively. |
| • | Through the Alberta Foundation for the Arts (AFA), Alberta’s government supports artists and arts organizations across the province to inspire minds, encourage expression, foster creativity and help diversify Alberta’s economy. In 2024-25, the foundation provided approximately $20.4 million through 656 grants to arts organizations and approximately $5.2 million through 446 grants to individual artists. This represents a 25 per cent increase in the number of grants provided compared to the previous year. With the increased funding, the AFA was able to increase the maximum eligible grant amount for individual artists from $15,000 to $18,000. |
| • | Supported sustainable outdoor recreation on Alberta’s Crown land through a capital investment of over $79 million in 2024-25 to advance 172 projects, including infrastructure updates in high use areas and enhancements at 78 campgrounds, day use areas and trail sites. |
| 132 | Government of Alberta | Annual Report 2024–2025 | |
PERFORMANCE RESULTS
Performance Indicators
Performance Indicator: High school completion rate
Status: Stable
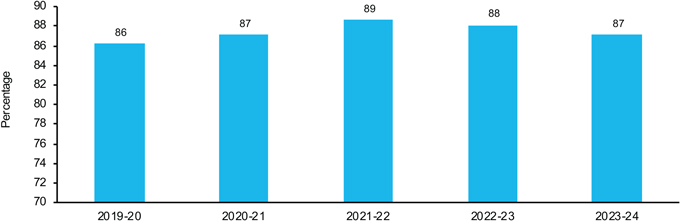
Source: Ministry of Education
For sources and notes see page 146.
The high school completion rate indicates the percentage of students who completed high school within five years of entering Grade 10. While the majority of students complete high school within three years of entering Grade 10, the five-year rate recognizes that it may take more time for some students to finish high school.
In 2023-24, 87.1 per cent of students completed high school within five years of entering Grade 10. Based on data from 2019-20 to 2023-24, the high school completion rate has improved over time by 0.9 per cent. Data for 2024-25 will be available in June 2026 as there is a one-year lag in the availability of results.
| Government of Alberta | Annual Report 2024–2025 | 133 | |
PERFORMANCE RESULTS
Performance Indicator: Post-Secondary graduates employment rate
Status: Stable
Source: Alberta Advanced Education, Graduate Outcomes Survey
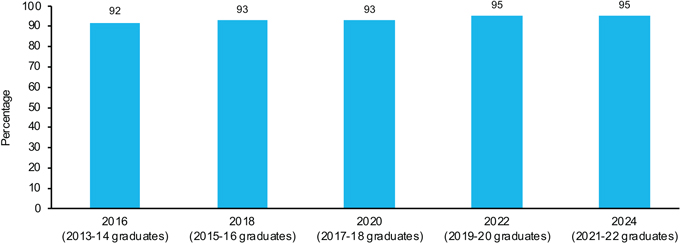
For sources and notes please see page 147.
This metric describes the employment rate of recent post-secondary graduates who are in the labour force and are not enrolled as full-time students. It includes graduates from Alberta’s publicly funded post-secondary institutions. Employment status is one of the most important indicators of labour market outcomes as it provides insights into whether Alberta’s post-secondary education is supporting graduates to achieve labour market outcomes.
In 2024, 95 per cent of post-secondary graduates reported being employed approximately two years after graduation. Results for this indicator may be influenced by the economy and labour market conditions during the time when graduates were looking for work.
| 134 | Government of Alberta | Annual Report 2024–2025 | |
PERFORMANCE RESULTS
Performance Indicator: Violent and property crime in urban and rural areas
Status: Stable
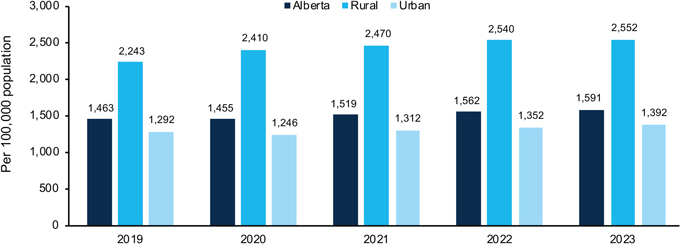
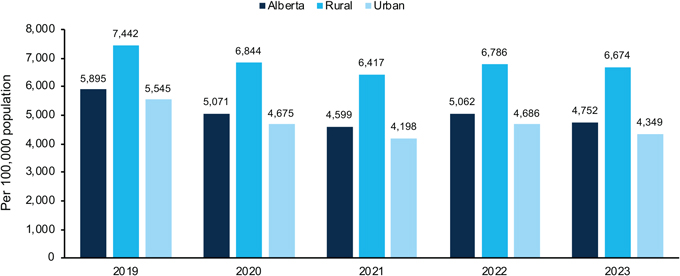
Source: Canadian Crime Statistics, Statistics Canada: Canadian Centre for Justice Statistics - Uniform Crime Reporting Survey, The Canadian Centre for Justice Statistics - Police-reported crime rates and crime severity index by offence group, Alberta, urban and rural police services, 2019 to 2023 – custom data provided by CCJCSS in July 2024.
For sources and notes see page 147.
Crime rate measures the volume of crime, including all Criminal Code violations (except traffic) relative to population size and is shown as urban and rural results. Violent crime includes homicide, attempted murder, robbery, abduction and various forms of sexual assault. It does not include traffic incidents that result in death or bodily harm.
| Government of Alberta | Annual Report 2024–2025 | 135 | |
PERFORMANCE RESULTS
Violent Crime
In 2023, Alberta saw a small increase in violent crime. The overall rate went up by 1.9 per cent compared to the year before. Urban Alberta had a 3 per cent increase, while rural areas had a slight increase of 0.5 per cent. Most of the increase was due to a rise in extortion cases, which went up by 25.7 per cent. However, some serious crimes dropped. Attempted murder went down by 14 per cent, firearm-related incidents reduced by nearly 1 per cent, and abductions decreased by 2 per cent. These crimes were the main drivers of violent crime in the previous year.
Property Crime
In 2023, property crime in Alberta went down by 6.1 per cent overall. Rural areas saw a drop of 1.7 per cent, while urban areas had a larger decrease of 7.2 per cent. Compared to 2019, property crime is down 19.4 per cent across the province: 22 per cent lower in urban areas and 10 per cent lower in rural communities. The decrease in 2023 was mainly due to fewer cases of trafficking in stolen property (down 13 per cent), identity fraud (down 2.2 per cent), and identity theft (down 9.5 per cent).
| 136 | Government of Alberta | Annual Report 2024–2025 | |
PERFORMANCE RESULTS
Performance Indicator: Change in violent and non-violent crime indices
Status: Stable

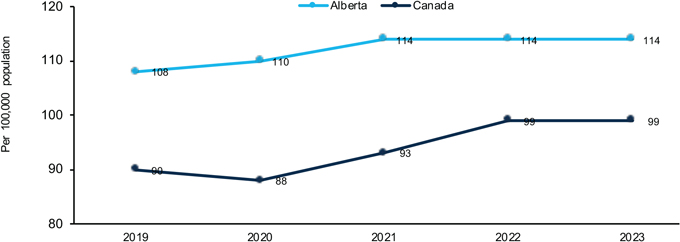
Source: Violent and property crime in urban and rural communities: Canadian Crime Statistics, Statistics Canada: Canadian Centre for Justice Statistics - Uniform Crime Reporting Survey.
Change in violent and non-violent crime indices: The Canadian Centre for Justice Statistics - Police-reported crime rates and crime severity index by offence group, Alberta, urban and rural police services, 2019 to 2023 - custom data provided by CCJCSS in July 2024.
For sources and notes see page 148.
The Crime Severity Index (CSI) measures the volume and severity of police-reported crime in Canada. It has a base index value of 100 for 2006. The Violent CSI measures the overall volume and severity of violent crime. Non-violent crime involves all police-reported property violations, other Criminal Code violations, Criminal Code traffic violations and other federal statute violations.
| Government of Alberta | Annual Report 2024–2025 | 137 | |
PERFORMANCE RESULTS
Overall Crime Severity Index
In 2023, Canada’s CSI rose by 2.2 per cent, mainly due to increase in non-violent crimes. While 10 of 13 provinces and territories saw increases, Alberta’s CSI dropped by 2.1 per cent. Calgary and Red Deer saw notable decreases of 8.5 per cent and 10.6 per cent, while Lethbridge and Edmonton experienced increases of 6.9 per cent and 2.9 per cent. Alberta’s overall decline in CSI was driven by decreases in property crimes and serious violent offences like attempted murder and child sexual offences, though this was partly offset by increase in extortion and arson.
Violent Crime Severity Index
The national violent CSI was 99.4 in 2023, a 0.39 per cent increase over the 2022 index of 99, and 35 per cent higher than in 2013. Similarly, Alberta saw a slight increase of 0.27 per cent in the Violent CSI in 2023 over the 2022 index as a result of the increase in extortion.
Non-violent Crime Severity Index
In 2023, the national non-violent CSI was 73.5, 3.1 per cent higher than in 2022. In 2023, Alberta’s Non-violent CSI decreased by 3.2 per cent from the level in 2022. This was a result of the declines seen in most of the property crimes, including trafficking in stolen property, motor vehicle theft, theft over and under $5,000, identity theft and identity fraud.
| 138 | Government of Alberta | Annual Report 2024–2025 | |
PERFORMANCE RESULTS
Performance Indicator: New affordable housing units and rent subsidies
Status: Decreasing
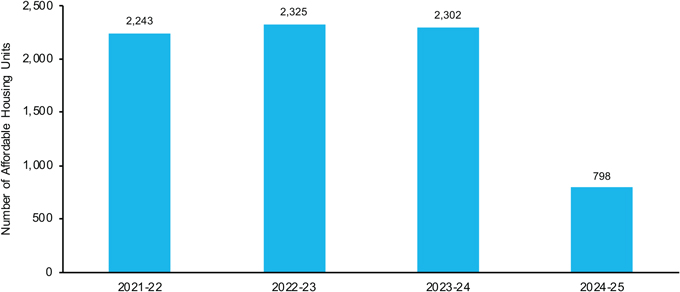
Source: Seniors, Community and Social Services, The HOME system
For sources and notes see page 149.
This measure reports on the number of new affordable housing units and new rental subsidies government has funded or supported for Albertans in need within a fiscal year. The results of this measure include newly built, refurbished or upgraded (i.e., regenerated) affordable housing units across five capital programs and additional households supported under the Rent Supplement program (including the Housing Benefit for Survivors of Gender-Based Violence, which launched in 2024-25).
In 2024-25, government delivered 798 new affordable housing units and new rental subsidies to Albertans with low income. While this is a decrease from recent years, the results reflect the timing and status of capital builds and the state of the rental market. Most of the capital projects are currently under construction and in progress that will be coming online in future years. As of March 31, 2025, 1,626 units and 359 shelter spaces are in progress. Rising rent prices in the rental market and corresponding increase in the maximum benefit available have led to higher individual rent benefits. As a result, more funds are allocated to ensure households already in the program can maintain their housing, leaving fewer resources available to expand to new households.
| Government of Alberta | Annual Report 2024–2025 | 139 | |
PERFORMANCE RESULTS
Performance Indicator: Annual number of surgeries provided
Status: Increasing
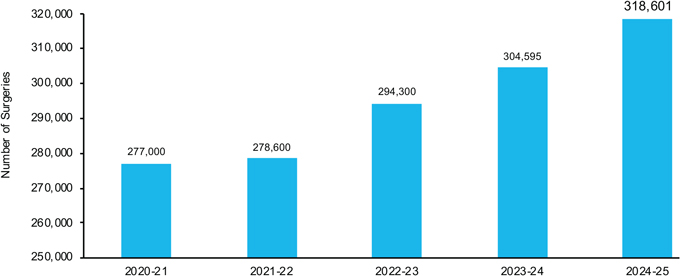
Source: Local Operating Room (OR) Information Systems, Alberta Health Services (AHS), and OR Data Repository
For sources and notes see page 149.
This indicator is used to monitor growth in surgical capacity to keep pace with demand and reduce the length of time Albertans are waiting for scheduled surgeries through implementation of initiatives such as the Alberta Surgical Initiative.
The total number of surgeries performed in Alberta was 318,601 in 2024-25, up almost 15,000 from around 304,595 in 2023-24. This represents an increase of 4.6 per cent and can in part be credited to the Alberta Surgical Initiative - the government’s plan to increase the number of surgeries so Albertans receive their procedures within medically suggested time frames.
Under the ASI, AHS performed more surgeries at underutilized facilities in rural communities and more publicly funded surgeries at chartered surgical facilities. In late fiscal year 2022-23, AHS was able to enter into new contracts to add an additional 6,000 orthopedic and 30,000 ophthalmology surgeries helping to improve surgical capacity in 2023 24.
| 140 | Government of Alberta | Annual Report 2024–2025 | |
PERFORMANCE RESULTS
Performance Indicator: Family physician and nurse practitioner workforce
Status: Increasing
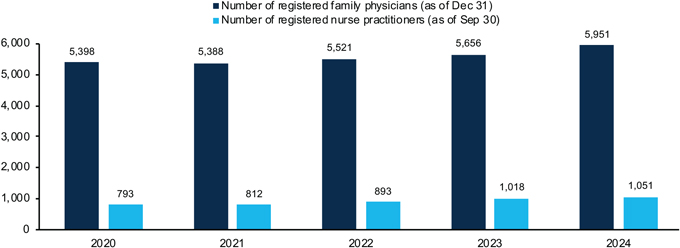
Source: College of Physicians and Surgeons of Alberta
For sources and notes see page 149.
This indicator reflects the number of registered family physicians and nurse practitioners (NPs) in Alberta and is used to monitor the growth in capacity of physicians and NPs resulting from implementation of initiatives such as the Health Workforce Strategy.
Except for a 0.2 per cent decrease in 2021, the number of registered family physicians in Alberta has continued to grow annually at an increasing rate - 2.5 per cent in 2022, 2.4 per cent in 2023, and 5.2 per cent in 2024. From 2021 to 2024, the number of registered family physicians in Alberta increased by over 10 per cent, and average annual growth rate within the same period was 2.5 per cent.
Between 2020 and 2025, the number of registered nurse practitioners in Alberta increased steadily from 793 to 1,051, representing a 33 per cent growth over five years, which equates to year-to-year growth of 7 per cent. The most significant annual growth occurred between 2022 2023 and 2023–2024 with an increase of 125 (14 per cent) practitioners, respectively.
Expanding the number of family physicians and registered nurses in the province supply will improve the efficiency and quality of primary health care delivery.
| Government of Alberta | Annual Report 2024–2025 | 141 | |
PERFORMANCE RESULTS
Performance Indicator: Mental health and addiction-related emergency department visits with no physician or community provided mental health services in previous two years
Status: Stable
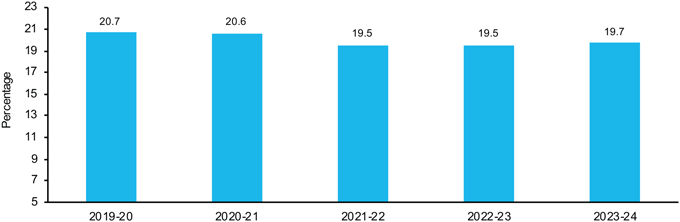
Source: Alberta Mental Health and Addiction
For sources and notes see page 150.
This measure describes the proportion of mental health or addiction-related emergency department visits in a fiscal year with no interaction with publicly funded mental health and addiction services (such as visits to physician office or emergency department, hospitalizations and prescription drug dispensations for mental health or addiction issues) in the previous two fiscal years. A reduced score is indicative of improvement in the access to the mental health and substance use related services in the community before reaching to crisis.
In 2023-24, 19.7 per cent of individuals who accessed emergency departments for mental health and addiction-related issues had not received publicly funded mental health and addiction services in the previous two years.
| 142 | Government of Alberta | Annual Report 2024–2025 | |
PERFORMANCE RESULTS
Performance Indicators – Sources and Notes
Priority One: Boosting Alberta’s Advantage
Employment
Performance Indicator: Private sector employment
Source: Statistics Canada, Labour Force Survey
Note(s):
Statistics Canada’s Labour Force Survey is the primary source of statistics on employment and unemployment in Canada and the provinces. The Labour Force Survey is conducted by Statistics Canada across the country. The target population is the non-institutionalized population 15 years of age and over. The survey is conducted nationwide in all provinces and territories. Excluded from the survey’s coverage are persons living on reserves and other Indigenous settlements in the provinces, full-time members of the Canadian Armed Forces, the institutionalized population, and households in extremely remote areas with very low population density. These groups together represent an exclusion of less than two per cent of the Canadian population aged 15 and over. Results are reported by calendar year.
Performance Indicator: Long-term unemployment rate
Source: Statistics Canada, Labour Force Survey
Note(s):
Statistics Canada’s Labour Force Survey is the primary source of statistics on employment and unemployment in Canada and the provinces. The Labour Force Survey is conducted by Statistics Canada across the country. The target population is the non-institutionalized population 15 years of age and over. The survey is conducted nationwide in all provinces and territories. Excluded from the survey’s coverage are persons living on reserves and other Indigenous settlements in the provinces, full-time members of the Canadian Armed Forces, the institutionalized population, and households in extremely remote areas with very low population density. These groups together represent an exclusion of less than two per cent of the Canadian population aged 15 and over. Results are reported by calendar year.
Performance Indicator: Wages and salaries growth
Source: Statistics Canada, Estimates of Labour Income
Note(s):
Estimates of Labour Income is undertaken by Statistics Canada across the country on a monthly basis and is also broken down by industry. Results are reported by calendar year. In addition to regular remuneration, they include directors’ fees, bonuses, commissions, gratuities, income in kind, taxable allowances, retroactive wage payments and stock options.
| Government of Alberta | Annual Report 2024–2025 | 143 | |
PERFORMANCE RESULTS
Wages and salaries are an indicator of labour income and reflect changes in employment, labour force participation, hours worked and wage growth.
Performance Indicator: Apprenticeship Employment Rate
Source: Advanced Education, Apprenticeship Education Survey
Note(s):
Results of this metric are obtained from the Apprenticeship Education Survey. This is a biennial survey conducted with recent apprenticeship graduates about their program and labour market experience (e.g., program satisfaction, employment status, earnings, and relatedness of employment to their program). In 2024, 2,364 graduates were surveyed, resulting in a response rate of 47 per cent. The margin of error was ±1.5 percentage points at the 95 per cent confidence level.
Performance Indicator: Enrollment in facility-based child care programs, family day home, innovative, and group family child care
Source: Ministry of Jobs, Economy and Trade, Child Care Information System
Note(s):
This performance indicator shows the total number of licensed child care spaces, the number of children enrolled, the total enrollment rate and the number of children receiving subsidy.
Spaces indicates the maximum number of children a child care center can accommodate based on their licensed capacity. The number of spaces available reflects a point-in-time count measured at the end of March of the current fiscal year.
Enrollment: The number of children enrolled is the actual number of children served by child care programs and can include both part-time and full-time enrollments.
Rate of enrollment is the number of children divided by the total number of child care spaces (licensed capacity). It is then expressed as a percentage.
The number of children receiving child care subsidy is calculated as the total subsidy caseload count. Data from the end of March is typically used for the caseload count. The amount of subsidy varies depending on the age of the child, family income, type of child care program and number of hours attended. The subsidy caseload includes full and partial subsidies.
Investment and business activity
Performance Indicator: Alberta Activity Index
Source: Treasury Board and Finance
Note(s):
The Alberta Activity Index is a monthly measure of economic activity in Alberta. Real gross domestic product (GDP) is the most comprehensive measure of economic activity. However, at the provincial level, estimates of real GDP are released with a significant lag, with estimates for 2024 released in November 2024. Given its
| 144 | Government of Alberta | Annual Report 2024–2025 | |
PERFORMANCE RESULTS
strong correlation with real GDP growth, the AAX provides a timely measure of changes in Alberta’s economic activity. Results are reported by calendar year. It is a weighted average of nine monthly indicators, each measuring an important aspect of macroeconomic activity, including employment, average weekly earnings, wholesale trade, manufacturing shipments, new truck sales, housing starts, rigs drilling, and oil production. Year-over-year change is calculated by taking the average of monthly data from January to December of the calendar year.
Treasury Board and Finance obtains the data from multiple sources (Statistics Canada, Alberta Energy Regulator, Canada Mortgage and Housing Corporation and Canadian Association of Energy Contractors) and then weights the variables.
Performance Indicator: Non-residential capital investment
Source: Statistics Canada, Capital Repair and Expenditures Survey
Note(s):
Statistics Canada’s Capital and Repair Expenditures Survey collects information from all industries once a year about their actual past year’s capital investments as well as their intended investments for the current year. On occasion when economic changes justify the need, data on the revised intentions are also collected for the current year. Results are reported by calendar year.
This indicator tracks investment in plant and equipment in Alberta’s non-residential sector divided by the province’s total population.
Performance Indicator: Value of Alberta’s exports
Source: Statistics Canada, International Merchandise Trade
Note(s):
Statistics Canada’s International Merchandise Trade program tracks the total value of Canada’s merchandise exports and imports by commodity, province or territory. The value of international goods exported by Alberta internationally indicates growth and diversification of the economy and government efforts to access new markets. Results are reported by calendar year.
Performance Indicator: Upstream oil and gas investment
Source: Statistics Canada, Capital Repair and Expenditures Survey
Note(s):
Statistics Canada’s Capital and Repair Expenditures Survey collects information from all industries once a year about their actual past year’s capital investments, as well as their intended investments for the current year. On occasion when economic changes justify the need, data on the revised intentions are also collected for the current year. Results are reported by calendar year.
| Government of Alberta | Annual Report 2024–2025 | 145 | |
PERFORMANCE RESULTS
Performance Indicator: Energy goods exports
Source: Statistics Canada, International Merchandise Trade
Note(s):
Statistics Canada’s International Merchandise Trade program tracks the total value of Canada’s merchandise exports and imports by commodity, province or territory. Results are reported by calendar year. Overall, energy good exports increased for both Alberta and Canada as a whole. The value of energy products (crude oil, natural gas and electricity) exported by Alberta internationally is an indicator of the health of the oil and gas industry and efforts to increase market access.
Performance Indicator: Net debt to GDP in Alberta and comparator provinces
Source: Alberta Treasury Board and Finance, Statistics Canada for GDP figures
Note(s):
The net-debt-to-GDP ratio is the metric comparing a jurisdiction’s net debt to its nominal gross domestic product (GDP). By comparing what a jurisdiction owes with what it produces annually, the net-debt-to-GDP ratio is one of the most widely recognized measures of debt burden and fiscal sustainability. The performance indicator provides a comparison of Alberta’s net-debt-to-GDP ratio to comparator provinces: British Columbia, Ontario, and Quebec. Results are reported by fiscal year.
Performance Indicator: Per Capita Expenditure
Source: StatsCan for population estimates and expenditure information
Note(s):
Per capita expenditure is determined as the total government expenditure (excluding debt servicing costs) divided by the total population. Expenditure and population data for Alberta and other provinces are provided by Statistics Canada. Results are reported by fiscal year.
This is a high-level indicator of the overall cost of providing public services in Alberta compared to other large Canadian provinces. This high-level comparison does not account for the difference in provincial expenditure needs or service delivery models.
Priority Two: Investing in Albertans
Education
Performance Indicator: High School completion rate
Source: Ministry of Education
Note(s):
The high school completion rate reports the percentage of Alberta students in public, separate, francophone, charter, and accredited funded independent (private) schools who, within five years of entering Grade 10:
| 146 | Government of Alberta | Annual Report 2024–2025 | |
PERFORMANCE RESULTS
| • | received an Alberta High School Diploma, an Alberta High School Equivalency Diploma (GED or CAEC), or the Certificate of High School Achievement (completion of Knowledge and Employability courses and the certificate requirements); |
| • | entered into an Alberta post-secondary program or an apprenticeship program; or |
| • | passed a minimum of five Grade 12 courses, including a Language Arts diploma examination course and three other diploma examination courses |
Data for this measure are from Alberta Education and Alberta Advanced Education systems. The provincial rate is calculated by dividing the number of high school completers, as defined above, by the number of students in the Grade 10 Cohort, adjusted for attrition.
While the majority of students complete high school within three years of entering Grade 10, the five-year rate recognizes that it may take more time for some students to finish high school.
This measure is important for entry to the labour force and post-secondary programs.
Performance Indicator: Post-Secondary graduates employment rate
Source: Alberta Advanced Education, Graduate Outcomes Survey
Note(s):
The Graduate Outcomes Survey is conducted biennially with graduates approximately two years after their graduation from a publicly funded post-secondary institution in Alberta (except the Banff Centre for Arts and Creativity).
For the 2024 survey, a census approach was used for publicly funded post-secondary institutions with fewer than 1,500 graduates, and a stratified sampling approach was used for institutions with 1,500 graduates or more. Based on the sampling population of 46,385 (after removing duplicates), 15,761 surveys were completed, resulting in a response rate of 34 per cent. The margin of error was ±0.63 percentage points at the 95 per cent confidence level.
Community Safety
Performance Indicator: Violent and property crime in urban and rural communities
Source: Canadian Crime Statistics, Statistics Canada: Canadian Centre for Justice Statistics – Uniform Crime Reporting Survey, The Canadian Centre for Justice Statistics - Police-reported crime rates and crime severity index by offence group, Alberta, urban and rural police services, 2019 to 2023 – custom data provided by CCJCSS in July 2024.
Note(s):
Crime rate is calculated using Incident-based Uniform Crime Reporting Survey (UCR2) data, which measures police-reported crime in each Canadian jurisdiction. The crime rate measures the volume of police-reported crime in Canada. Crime rates are expressed as the number of crimes per 100,000 people.
| Government of Alberta | Annual Report 2024–2025 | 147 | |
PERFORMANCE RESULTS
For Rural vs. Urban crime rates:
Census metropolitan area (CMA) and census agglomeration (CA): A CMA or CA is formed by one or more adjacent municipalities centered on a population centre (known as the core). A CMA must have a total population of at least 100,000, of which 50,000 or more must live in the core. A CA must have a core population of at least 10,000. To be included in the CMA or CA, adjacent municipalities must have a high degree of integration with the core, as measured by commuting flows derived from census data. A CMA or CA may have more than one police service.
Rural and small-town area: Rural police services serve a territory where the majority of the population lives outside a CMA or CA. While small towns that do not qualify as CAs are included in this category, the term “rural area” will be used for the sake of brevity.
Police services are classified “rural” or “urban” based on the majority of the population they serve, rather than on the exact place of residence of each Canadian. Consequently, urban residents can be served by a police service classified as “rural” and vice versa. In the interest of conciseness, the terms “rural” (or “rural area”) and “urban” (or “urban area”) are used to designate areas or populations based on the classification of the police services that serve them. The definitions of “rural” and “urban” in this report may differ from those used in other Statistics Canada reports.
Urban: Urban police services serve an area where the majority of the population lives within a CMA or CA.
Performance Indicator: Change in violent and non-violent crime indices
Source: Canadian Crime Statistics, Statistics Canada: Canadian Centre for Justice Statistics – Uniform Crime Reporting Survey, The Canadian Centre for Justice Statistics - Police-reported crime rates and crime severity index by offence group, Alberta, urban and rural police services, 2019 to 2023 – custom data provided by CCJCSS in July 2024.
Note(s):
Crime Severity Index (CSI) is calculated using Incident-based Uniform Crime Reporting Survey (UCR2) data, which measures police-reported crime in each Canadian jurisdiction. The CSI measures both the volume and seriousness of police-reported crime in Canada. To determine the severity of a crime, all crimes are assigned a weight based on actual sentences handed down by the courts in all provinces and territories. More serious crimes are assigned higher weights, while less serious crimes are assigned lower weights. As a result, more serious offences have a greater impact on changes in the index.
| 148 | Government of Alberta | Annual Report 2024–2025 | |
PERFORMANCE RESULTS
Affordable Housing
Performance Indicator: New affordable housing units rent subsidies
Source: Seniors, Community and Social Services, The HOME system (Housing Division data management software)
Note(s):
This measure is a direct reflection of progress made toward achieving the goal of supporting 25,000 more households by 2032-33 set out in Stronger Foundations: Alberta’s 10-year strategy to improve and expand affordable housing.
Affordable housing includes government-owned or supported housing provided by the private, public and nonprofit sectors for persons who, because of financial, social or other circumstances, require assistance to obtain or maintain social housing.
Health
Performance Indicator: Annual number of surgeries
Source: Local Operating Room (OR) Information Systems, Alberta Health Services (AHS), and OR Data Repository
Note(s):
More scheduled and emergency surgeries performed reflects progress towards expanding surgical capacity which consequently contributes towards lowering wait times.
By providing the total number of surgeries performed, this indicator monitors the responsiveness of the health care system in relation to surgeries, from year to year.
Volumes are presented as estimates as reconciliation of actual volumes requires detailed review of surgical charts to determine actual procedures and volumes.
Performance Indicator: Family physician and registered nurse practitioner workforce
Source: College of Physicians and Surgeons of Alberta
Note(s):
College of Physicians and Surgeons of Alberta (CPSA) data reflects physicians who maintain an active license in Alberta and cannot be interpreted as those who are actively practicing in the province.
College of Registered Nurses of Alberta (CRNA) data reflects registered nurses (RN) and nurse practitioners (NP) who maintain an active license to practice in Alberta and cannot be interpreted as those who are actively practicing in the province. The data reflects supply and not workforce.
| Government of Alberta | Annual Report 2024–2025 | 149 | |
PERFORMANCE RESULTS
Performance Indicator: Mental health and addiction-related emergency department visits with no physician or community provided mental health services in previous two years
Source: Alberta Health Business Intelligence Environment: National Ambulatory Care Reporting System; Discharge Abstract Database; Practitioners Claim Database under Alberta Health Care Insurance Plan; Pharmaceutical Information Network; Population Registry Files; and Alberta Health Postal Code Translator File.
Note(s):
Only the first visit is counted in a given fiscal year for individuals with multiple emergency department visits. Individuals with invalid or missing Provincial Health Numbers and less than two years of eligibility under the Alberta Health Care Insurance Plan are excluded. Results are reported by fiscal year and can lag by up to 10 months; 2024-25 results were not available at the time of preparing this report. Historical results for this metric have been recalculated for comparability using a revised methodology described below.
The Ministry of Mental Health and Addiction made updates to the title, definition, methodology, and reporting structure for this metric in 2023-24. The revised definition considers both mental health and addiction related service utilization in the previous two years, whereas the former definition was limited to mental health related service utilization. The revised methodology includes all age groups, in contrast to the earlier methodology which included only those aged 10 years and older. In addition, mental health or addiction related drugs dispensation data from the Pharmaceutical Information Network database has been incorporated into the methodology.
| 150 | Government of Alberta | Annual Report 2024–2025 | |