Shareholder Report
Apr. 30, 2025
USD ($)
Holding


| [1] | Annualized. |
| [2] | Annualized. |
| [3] | Annualized. |
| [4] | Annualized. |
| [5] | Annualized. |
| [6] | Annualized. |
| [7] | Annualized. |
| [8] | Annualized. |
Shareholder Report |
6 Months Ended | |||||||||||||||||
|---|---|---|---|---|---|---|---|---|---|---|---|---|---|---|---|---|---|---|
|
Apr. 30, 2025
USD ($)
Holding
| ||||||||||||||||||
| Shareholder Report [Line Items] | ||||||||||||||||||
| Document Type | N-CSRS | |||||||||||||||||
| Amendment Flag | false | |||||||||||||||||
| Registrant Name | Columbia ETF Trust I | |||||||||||||||||
| Entity Central Index Key | 0001551950 | |||||||||||||||||
| Entity Investment Company Type | N-1A | |||||||||||||||||
| Document Period End Date | Apr. 30, 2025 | |||||||||||||||||
| C000169559 | ||||||||||||||||||
| Shareholder Report [Line Items] | ||||||||||||||||||
| Fund Name | Columbia International Equity Income ETF | |||||||||||||||||
| Class Name | Columbia International Equity Income ETF | |||||||||||||||||
| Trading Symbol | INEQ | |||||||||||||||||
| Security Exchange Name | NYSEArca | |||||||||||||||||
| Annual or Semi-Annual Statement [Text Block] | This semi-annual shareholder report contains important information about Columbia International Equity Income ETF (the Fund) for the period of November 1, 2024 to April 30, 2025. | |||||||||||||||||
| Shareholder Report Annual or Semi-Annual | Semi-Annual Shareholder Report | |||||||||||||||||
| Additional Information [Text Block] | You can find additional information about the Fund at columbiathreadneedleus.com/resources/literature. You can also request this information by contacting us at 1-800-426-3750. | |||||||||||||||||
| Additional Information Phone Number | 1-800-426-3750 | |||||||||||||||||
| Additional Information Website | columbiathreadneedleus.com/resources/literature | |||||||||||||||||
| Expenses [Text Block] | ||||||||||||||||||
| Expenses Paid, Amount | $ 23 | |||||||||||||||||
| Expense Ratio, Percent | 0.45% | [1] | ||||||||||||||||
| AssetsNet | $ 33,014,456 | |||||||||||||||||
| Holdings Count | Holding | 101 | |||||||||||||||||
| InvestmentCompanyPortfolioTurnover | 44.00% | |||||||||||||||||
| Additional Fund Statistics [Text Block] | ||||||||||||||||||
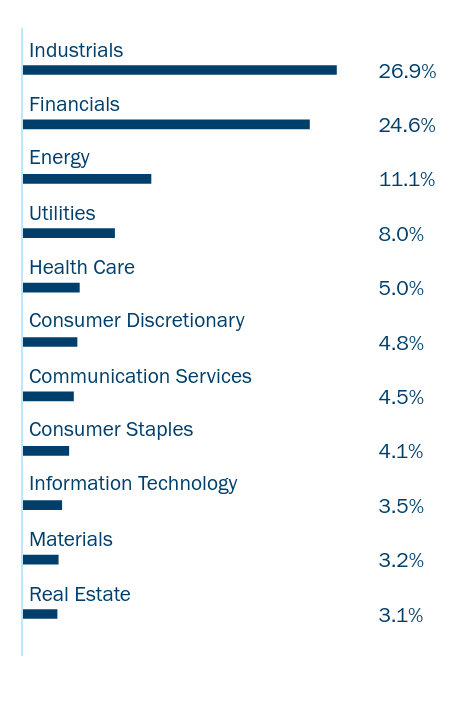
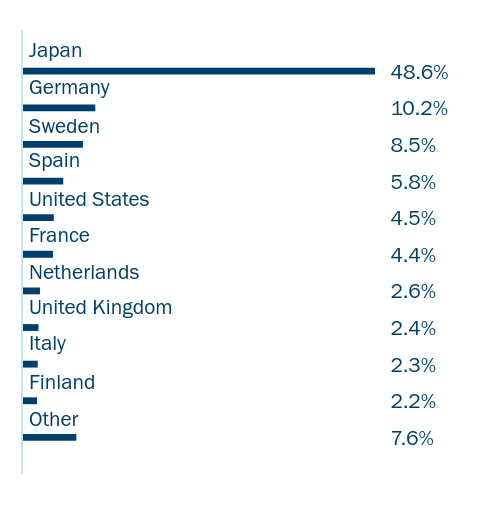
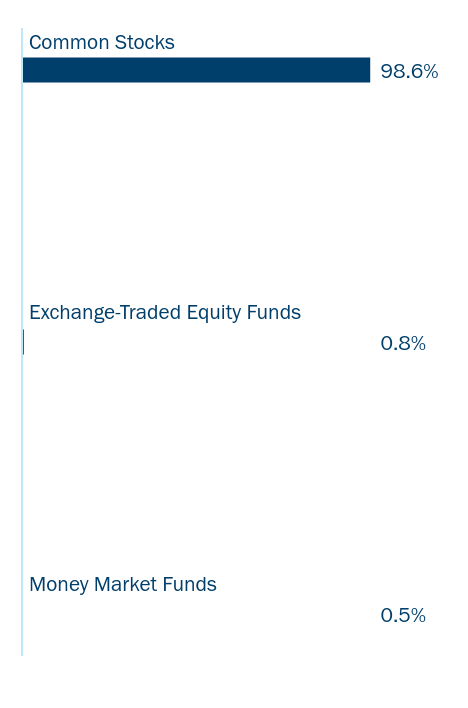
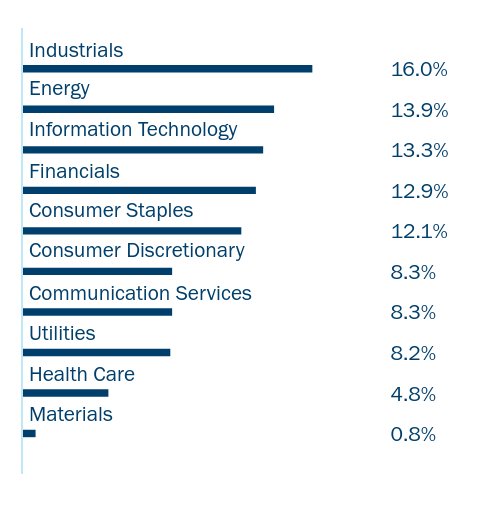
| Holdings [Text Block] | ||||||||||||||||||
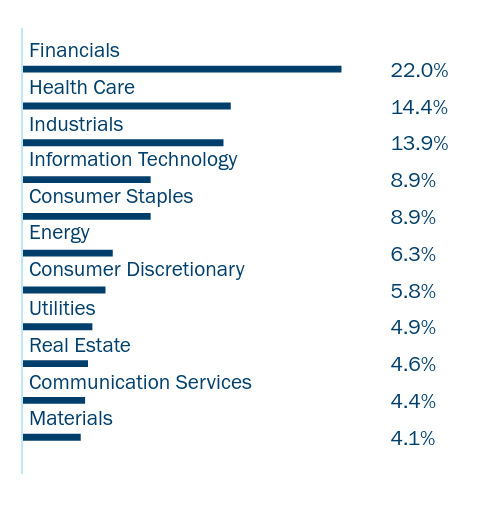
| Largest Holdings [Text Block] | ||||||||||||||||||
| C000169560 | ||||||||||||||||||
| Shareholder Report [Line Items] | ||||||||||||||||||
| Fund Name | Columbia U.S. Equity Income ETF | |||||||||||||||||
| Class Name | Columbia U.S. Equity Income ETF | |||||||||||||||||
| Trading Symbol | EQIN | |||||||||||||||||
| Security Exchange Name | NYSEArca | |||||||||||||||||
| Annual or Semi-Annual Statement [Text Block] | This semi-annual shareholder report contains important information about Columbia U.S. Equity Income ETF (the Fund) for the period of November 1, 2024 to April 30, 2025. | |||||||||||||||||
| Shareholder Report Annual or Semi-Annual | Semi-Annual Shareholder Report | |||||||||||||||||
| Additional Information [Text Block] | You can find additional information about the Fund at columbiathreadneedleus.com/resources/literature. You can also request this information by contacting us at 1-800-426-3750. | |||||||||||||||||
| Additional Information Phone Number | 1-800-426-3750 | |||||||||||||||||
| Additional Information Website | columbiathreadneedleus.com/resources/literature | |||||||||||||||||
| Expenses [Text Block] | ||||||||||||||||||
| Expenses Paid, Amount | $ 17 | |||||||||||||||||
| Expense Ratio, Percent | 0.35% | [2] | ||||||||||||||||
| AssetsNet | $ 182,528,911 | |||||||||||||||||
| Holdings Count | Holding | 101 | |||||||||||||||||
| InvestmentCompanyPortfolioTurnover | 18.00% | |||||||||||||||||
| Additional Fund Statistics [Text Block] | ||||||||||||||||||
| Holdings [Text Block] | ||||||||||||||||||
| Largest Holdings [Text Block] | ||||||||||||||||||
| C000193701 | ||||||||||||||||||
| Shareholder Report [Line Items] | ||||||||||||||||||
| Fund Name | Columbia Diversified Fixed Income Allocation ETF | |||||||||||||||||
| Class Name | Columbia Diversified Fixed Income Allocation ETF | |||||||||||||||||
| Trading Symbol | DIAL | |||||||||||||||||
| Security Exchange Name | NYSEArca | |||||||||||||||||
| Annual or Semi-Annual Statement [Text Block] | This semi-annual shareholder report contains important information about Columbia Diversified Fixed Income Allocation ETF (the Fund) for the period of November 1, 2024 to April 30, 2025. | |||||||||||||||||
| Shareholder Report Annual or Semi-Annual | Semi-Annual Shareholder Report | |||||||||||||||||
| Additional Information [Text Block] | You can find additional information about the Fund at columbiathreadneedleus.com/resources/literature. You can also request this information by contacting us at 1-800-426-3750. | |||||||||||||||||
| Additional Information Phone Number | 1-800-426-3750 | |||||||||||||||||
| Additional Information Website | columbiathreadneedleus.com/resources/literature | |||||||||||||||||
| Expenses [Text Block] | ||||||||||||||||||
| Expenses Paid, Amount | $ 14 | |||||||||||||||||
| Expense Ratio, Percent | 0.28% | [3] | ||||||||||||||||
| AssetsNet | $ 346,608,635 | |||||||||||||||||
| Holdings Count | Holding | 571 | |||||||||||||||||
| InvestmentCompanyPortfolioTurnover | 93.00% | |||||||||||||||||
| Additional Fund Statistics [Text Block] | ||||||||||||||||||
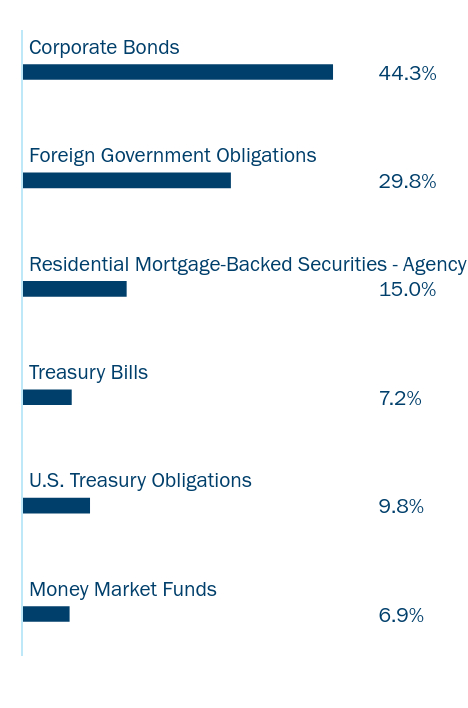
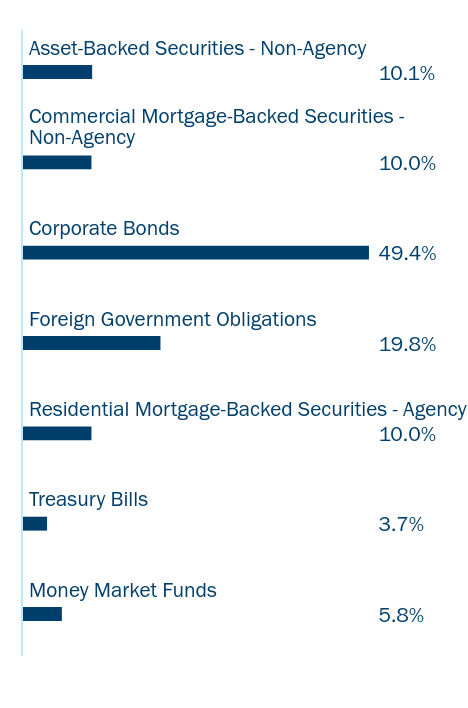
| Holdings [Text Block] | ||||||||||||||||||
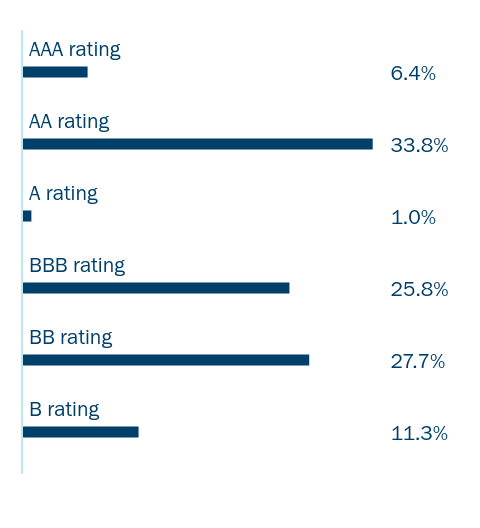
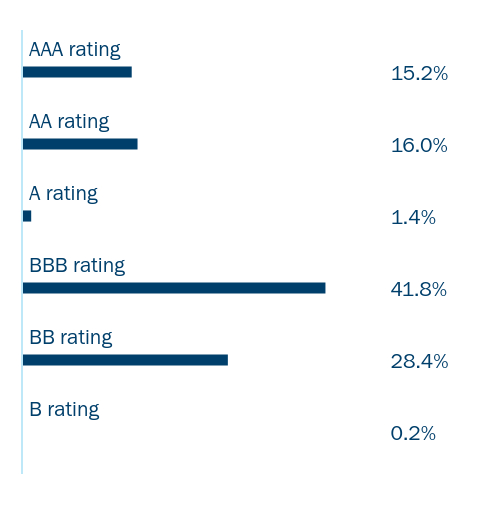
| Credit Quality Explanation [Text Block] | Bond ratings on Fund holdings are divided into categories ranging from highest to lowest credit quality, determined by using the middle rating of Moody’s Ratings, S&P and Fitch, after dropping the highest and lowest available ratings. When ratings are available from only two rating agencies, the lower rating is used. When a rating is available from only one rating agency, that rating is used. If a security is not rated by Moody's Ratings, S&P or Fitch, but has a rating by Kroll and/or DBRS, the same methodology is applied to those bonds that would otherwise be not rated. When a bond is not rated by any rating agency, it is designated as “Not rated.” Credit quality ratings assigned by a rating agency are subjective opinions, not statements of fact, and are subject to change, including daily. | |||||||||||||||||
| Largest Holdings [Text Block] | ||||||||||||||||||
| C000202583 | ||||||||||||||||||
| Shareholder Report [Line Items] | ||||||||||||||||||
| Fund Name | Columbia Multi-Sector Municipal Income ETF | |||||||||||||||||
| Trading Symbol | MUST | |||||||||||||||||
| Security Exchange Name | NYSEArca | |||||||||||||||||
| Annual or Semi-Annual Statement [Text Block] | This semi-annual shareholder report contains important information about Columbia Multi-Sector Municipal Income ETF (the Fund) for the period of November 1, 2024 to April 30, 2025. | |||||||||||||||||
| Shareholder Report Annual or Semi-Annual | Semi-Annual Shareholder Report | |||||||||||||||||
| Additional Information [Text Block] | You can find additional information about the Fund at columbiathreadneedleus.com/resources/literature. You can also request this information by contacting us at 1-800-426-3750. | |||||||||||||||||
| Additional Information Phone Number | 1-800-426-3750 | |||||||||||||||||
| Additional Information Website | columbiathreadneedleus.com/resources/literature | |||||||||||||||||
| Expenses [Text Block] | ||||||||||||||||||
| Expenses Paid, Amount | $ 11 | |||||||||||||||||
| Expense Ratio, Percent | 0.23% | [4] | ||||||||||||||||
| AssetsNet | $ 400,854,440 | |||||||||||||||||
| Holdings Count | Holding | 542 | |||||||||||||||||
| InvestmentCompanyPortfolioTurnover | 8.00% | |||||||||||||||||
| Additional Fund Statistics [Text Block] | ||||||||||||||||||
| Holdings [Text Block] | ||||||||||||||||||
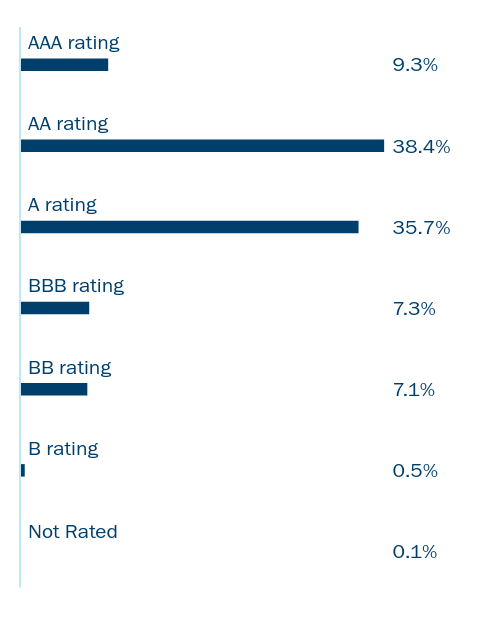
| Credit Quality Explanation [Text Block] | Bond ratings on Fund holdings are divided into categories ranging from highest to lowest credit quality, determined by using the middle rating of Moody’s Ratings, S&P and Fitch, after dropping the highest and lowest available ratings. When ratings are available from only two rating agencies, the lower rating is used. When a rating is available from only one rating agency, that rating is used. If a security is not rated by Moody's Ratings, S&P or Fitch, but has a rating by Kroll and/or DBRS, the same methodology is applied to those bonds that would otherwise be not rated. When a bond is not rated by any rating agency, it is designated as “Not rated.” Credit quality ratings assigned by a rating agency are subjective opinions, not statements of fact, and are subject to change, including daily. | |||||||||||||||||
| Largest Holdings [Text Block] | ||||||||||||||||||
| C000213611 | ||||||||||||||||||
| Shareholder Report [Line Items] | ||||||||||||||||||
| Fund Name | Columbia Research Enhanced Core ETF | |||||||||||||||||
| Class Name | Columbia Research Enhanced Core ETF | |||||||||||||||||
| Trading Symbol | RECS | |||||||||||||||||
| Security Exchange Name | NYSEArca | |||||||||||||||||
| Annual or Semi-Annual Statement [Text Block] | This semi-annual shareholder report contains important information about Columbia Research Enhanced Core ETF (the Fund) for the period of November 1, 2024 to April 30, 2025. | |||||||||||||||||
| Shareholder Report Annual or Semi-Annual | Semi-Annual Shareholder Report | |||||||||||||||||
| Additional Information [Text Block] | You can find additional information about the Fund at columbiathreadneedleus.com/resources/literature. You can also request this information by contacting us at 1-800-426-3750. | |||||||||||||||||
| Additional Information Phone Number | 1-800-426-3750 | |||||||||||||||||
| Additional Information Website | columbiathreadneedleus.com/resources/literature | |||||||||||||||||
| Expenses [Text Block] | ||||||||||||||||||
| Expenses Paid, Amount | $ 7 | |||||||||||||||||
| Expense Ratio, Percent | 0.15% | [5] | ||||||||||||||||
| AssetsNet | $ 2,461,868,461 | |||||||||||||||||
| Holdings Count | Holding | 367 | |||||||||||||||||
| InvestmentCompanyPortfolioTurnover | 19.00% | |||||||||||||||||
| Additional Fund Statistics [Text Block] | ||||||||||||||||||
| Holdings [Text Block] | ||||||||||||||||||
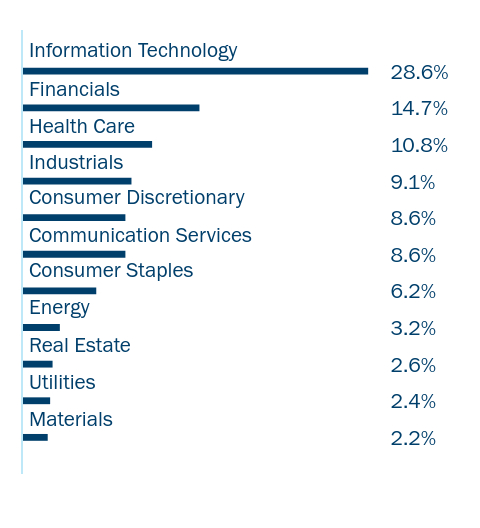
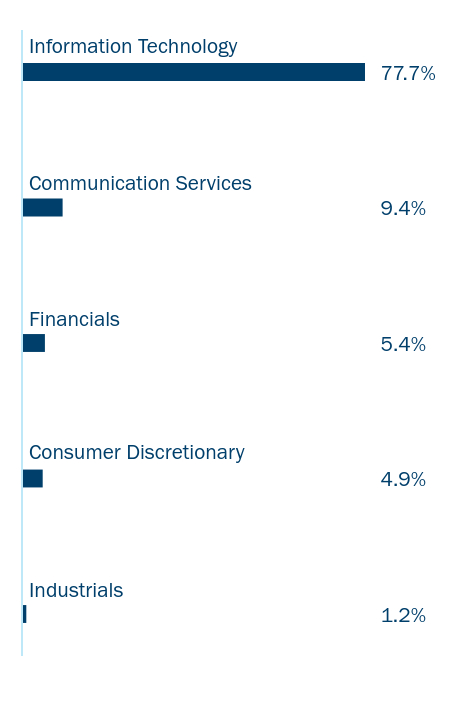
| Largest Holdings [Text Block] | ||||||||||||||||||
| C000213612 | ||||||||||||||||||
| Shareholder Report [Line Items] | ||||||||||||||||||
| Fund Name | Columbia Research Enhanced Value ETF | |||||||||||||||||
| Class Name | Columbia Research Enhanced Value ETF | |||||||||||||||||
| Trading Symbol | REVS | |||||||||||||||||
| Security Exchange Name | NYSEArca | |||||||||||||||||
| Annual or Semi-Annual Statement [Text Block] | This semi-annual shareholder report contains important information about Columbia Research Enhanced Value ETF (the Fund) for the period of November 1, 2024 to April 30, 2025. | |||||||||||||||||
| Shareholder Report Annual or Semi-Annual | Semi-Annual Shareholder Report | |||||||||||||||||
| Additional Information [Text Block] | You can find additional information about the Fund at columbiathreadneedleus.com/resources/literature. You can also request this information by contacting us at 1-800-426-3750. | |||||||||||||||||
| Additional Information Phone Number | 1-800-426-3750 | |||||||||||||||||
| Additional Information Website | columbiathreadneedleus.com/resources/literature | |||||||||||||||||
| Expenses [Text Block] | ||||||||||||||||||
| Expenses Paid, Amount | $ 9 | |||||||||||||||||
| Expense Ratio, Percent | 0.19% | [6] | ||||||||||||||||
| AssetsNet | $ 68,616,505 | |||||||||||||||||
| Holdings Count | Holding | 317 | |||||||||||||||||
| InvestmentCompanyPortfolioTurnover | 27.00% | |||||||||||||||||
| Additional Fund Statistics [Text Block] | ||||||||||||||||||
| Holdings [Text Block] | ||||||||||||||||||
| Largest Holdings [Text Block] | ||||||||||||||||||
| C000230513 | ||||||||||||||||||
| Shareholder Report [Line Items] | ||||||||||||||||||
| Fund Name | Columbia Short Duration Bond ETF | |||||||||||||||||
| Class Name | Columbia Short Duration Bond ETF | |||||||||||||||||
| Trading Symbol | SBND | |||||||||||||||||
| Security Exchange Name | NYSEArca | |||||||||||||||||
| Annual or Semi-Annual Statement [Text Block] | This semi-annual shareholder report contains important information about Columbia Short Duration Bond ETF (the Fund) for the period of November 1, 2024 to April 30, 2025. | |||||||||||||||||
| Shareholder Report Annual or Semi-Annual | Semi-Annual Shareholder Report | |||||||||||||||||
| Additional Information [Text Block] | You can find additional information about the Fund at columbiathreadneedleus.com/resources/literature. You can also request this information by contacting us at 1-800-426-3750. | |||||||||||||||||
| Additional Information Phone Number | 1-800-426-3750 | |||||||||||||||||
| Additional Information Website | columbiathreadneedleus.com/resources/literature | |||||||||||||||||
| Expenses [Text Block] | ||||||||||||||||||
| Expenses Paid, Amount | $ 12 | |||||||||||||||||
| Expense Ratio, Percent | 0.24% | [7] | ||||||||||||||||
| AssetsNet | $ 54,008,960 | |||||||||||||||||
| Holdings Count | Holding | 575 | |||||||||||||||||
| InvestmentCompanyPortfolioTurnover | 105.00% | |||||||||||||||||
| Additional Fund Statistics [Text Block] | ||||||||||||||||||
| Holdings [Text Block] | ||||||||||||||||||
| Credit Quality Explanation [Text Block] | Bond ratings on Fund holdings are divided into categories ranging from highest to lowest credit quality, determined by using the middle rating of Moody’s Ratings, S&P and Fitch, after dropping the highest and lowest available ratings. When ratings are available from only two rating agencies, the lower rating is used. When a rating is available from only one rating agency, that rating is used. If a security is not rated by Moody's Ratings, S&P or Fitch, but has a rating by Kroll and/or DBRS, the same methodology is applied to those bonds that would otherwise be not rated. When a bond is not rated by any rating agency, it is designated as “Not rated.” Credit quality ratings assigned by a rating agency are subjective opinions, not statements of fact, and are subject to change, including daily. | |||||||||||||||||
| Largest Holdings [Text Block] | ||||||||||||||||||
| C000234649 | ||||||||||||||||||
| Shareholder Report [Line Items] | ||||||||||||||||||
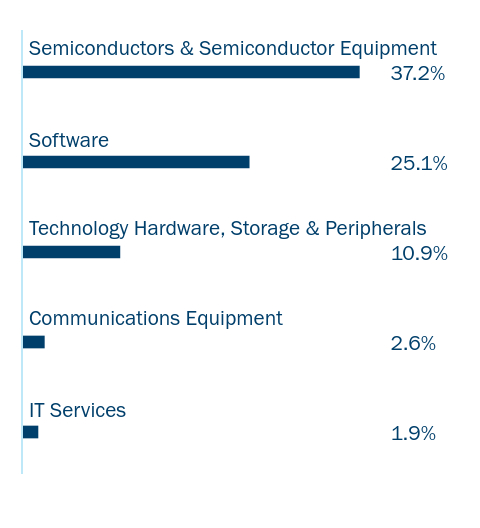
| Fund Name | Columbia Select Technology ETF | |||||||||||||||||
| Class Name | Columbia Select Technology ETF | |||||||||||||||||
| Trading Symbol | SEMI | |||||||||||||||||
| Security Exchange Name | NYSEArca | |||||||||||||||||
| Annual or Semi-Annual Statement [Text Block] | This semi-annual shareholder report contains important information about Columbia Select Technology ETF (the Fund) for the period of November 1, 2024 to April 30, 2025. | |||||||||||||||||
| Shareholder Report Annual or Semi-Annual | Semi-Annual Shareholder Report | |||||||||||||||||
| Additional Information [Text Block] | You can find additional information about the Fund at columbiathreadneedleus.com/resources/literature. You can also request this information by contacting us at 1-800-426-3750. | |||||||||||||||||
| Additional Information Phone Number | 1-800-426-3750 | |||||||||||||||||
| Additional Information Website | columbiathreadneedleus.com/resources/literature | |||||||||||||||||
| Expenses [Text Block] | ||||||||||||||||||
| Expenses Paid, Amount | $ 36 | |||||||||||||||||
| Expense Ratio, Percent | 0.75% | [8] | ||||||||||||||||
| AssetsNet | $ 33,319,562 | |||||||||||||||||
| Holdings Count | Holding | 36 | |||||||||||||||||
| InvestmentCompanyPortfolioTurnover | 58.00% | |||||||||||||||||
| Additional Fund Statistics [Text Block] | ||||||||||||||||||
| Holdings [Text Block] | ||||||||||||||||||
| Largest Holdings [Text Block] | ||||||||||||||||||
| ||||||||||||||||||