Shareholder Report
Apr. 30, 2025
USD ($)
$ / shares
WHAT WERE THE FUND COSTS FOR THE LAST SIX MONTHS? (based on a hypothetical $10,000 investment)
|
Fund Name
|
Costs of a $10,000 investment
|
Costs paid as a percentage of a $10,000 investment*
|
|
Congress Intermediate Bond ETF
|
$18
|
0.35%
|
Visit https://etfs.congressasset.com/intermediate-bond-etf.html for more recent performance information.
KEY FUND STATISTICS (as of April 30, 2025)
|
Net Assets
|
$327,110,059
|
|
Number of Holdings
|
48
|
|
Portfolio Turnover
|
31%
|
|
Average Credit Quality
|
AA-/A+
|
|
Effective Duration
|
3.83 Years
|
|
30-Day SEC Yield
|
4.07%
|
|
30-Day SEC Yield Unsubsidized
|
4.07%
|
|
Weighted Average Maturity
|
4.94 Years
|
|
Top Holdings
|
(% of Net Assets)
|
|
United States Treasury Note/Bond
|
4.7%
|
|
United States Treasury Note/Bond
|
4.7%
|
|
United States Treasury Note/Bond
|
4.5%
|
|
United States Treasury Note/Bond
|
4.3%
|
|
United States Treasury Note/Bond
|
4.0%
|
|
United States Treasury Note/Bond
|
3.4%
|
|
United States Treasury Note/Bond
|
3.4%
|
|
United States Treasury Note/Bond
|
3.4%
|
|
United States Treasury Note/Bond
|
3.1%
|
|
United States Treasury Note/Bond
|
2.3%
|
|
Industry
|
(% of Net Assets)
|
|
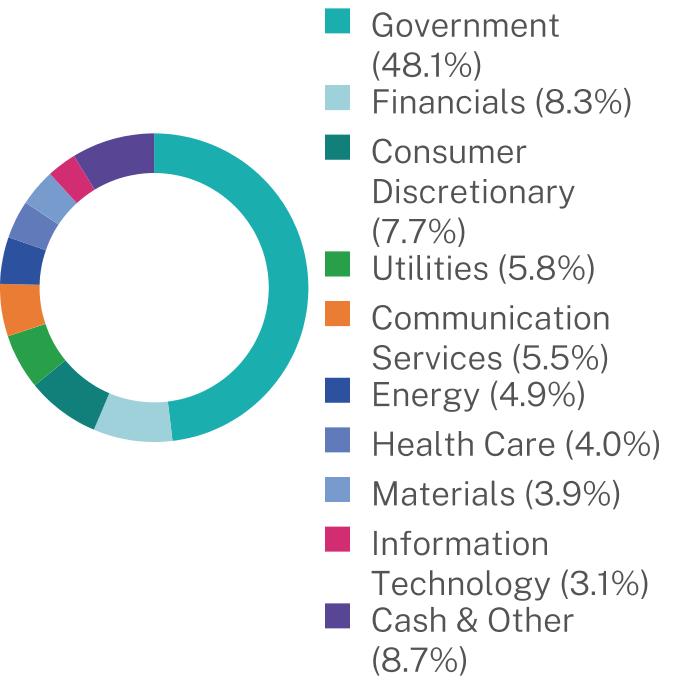
Public Finance Activities
|
31.1%
|
|
Sovereign
|
17.0%
|
|
Banks
|
6.2%
|
|
Auto Manufacturers
|
5.9%
|
|
Mining
|
3.9%
|
|
Electric
|
3.7%
|
|
Diversified Telecommunication Services
|
3.5%
|
|
Oil & Gas
|
3.1%
|
|
Collateralized Mortgage Obligation
|
2.5%
|
|
Cash & Other
|
23.1%
|
WHAT WERE THE FUND COSTS FOR THE LAST SIX MONTHS? (based on a hypothetical $10,000 investment)
|
Fund Name
|
Costs of a $10,000 investment
|
Costs paid as a percentage of a $10,000 investment*
|
|
Congress Large Cap Growth ETF
|
$32
|
0.65%
|
Visit https://etfs.congressasset.com/large-cap-growth-etf.html for more recent performance information.
KEY FUND STATISTICS (as of April 30, 2025)
|
Net Assets
|
$265,791,665
|
|
Number of Holdings
|
40
|
|
Net Advisory Fee
|
$865,035
|
|
Portfolio Turnover
|
42%
|
|
Top Holdings
|
(% of Net Assets)
|
|
NVIDIA Corp.
|
4.3%
|
|
Microsoft Corp.
|
3.8%
|
|
Apple, Inc.
|
3.5%
|
|
Costco Wholesale Corp.
|
3.5%
|
|
Eli Lilly & Co.
|
3.2%
|
|
ServiceNow, Inc.
|
3.2%
|
|
Netflix, Inc.
|
3.2%
|
|
Howmet Aerospace, Inc.
|
3.2%
|
|
Meta Platforms, Inc. - Class A
|
3.2%
|
|
Boston Scientific Corp.
|
3.1%
|
|
Industry
|
(% of Net Assets)
|
|
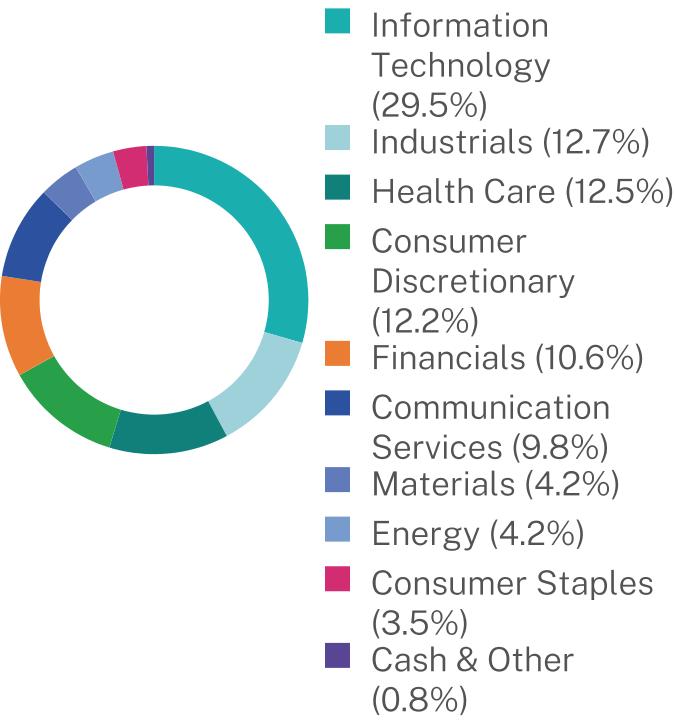
Software
|
11.3%
|
|
Specialty Retail
|
7.5%
|
|
Semiconductors & Semiconductor Equipment
|
6.9%
|
|
Health Care Equipment & Supplies
|
5.9%
|
|
Interactive Media & Services
|
5.7%
|
|
Technology Hardware, Storage & Peripherals
|
5.0%
|
|
Communications Equipment
|
4.6%
|
|
Capital Markets
|
4.5%
|
|
Consumer Staples Distribution & Retail
|
3.5%
|
|
Cash & Other
|
45.1%
|
WHAT WERE THE FUND COSTS FOR THE LAST SIX MONTHS? (based on a hypothetical $10,000 investment)
|
Fund Name
|
Costs of a $10,000 investment
|
Costs paid as a percentage of a $10,000 investment*
|
|
Congress SMid Growth ETF
|
$33
|
0.68%
|
Visit https://etfs.congressasset.com/smid-growth-etf.html for more recent performance information.
KEY FUND STATISTICS (as of April 30, 2025)
|
Net Assets
|
$272,198,158
|
|
Number of Holdings
|
44
|
|
Net Advisory Fee
|
$821,437
|
|
Portfolio Turnover
|
44%
|
|
Top Holdings
|
(% of Net Assets)
|
|
Comfort Systems USA, Inc.
|
4.3%
|
|
BJ’s Wholesale Club Holdings, Inc.
|
4.1%
|
|
CyberArk Software Ltd.
|
3.9%
|
|
Curtiss-Wright Corp.
|
3.6%
|
|
Halozyme Therapeutics, Inc.
|
3.1%
|
|
Tractor Supply Co.
|
3.0%
|
|
AZEK Co., Inc.
|
2.9%
|
|
Prestige Consumer Healthcare, Inc.
|
2.9%
|
|
Duolingo, Inc.
|
2.7%
|
|
PTC, Inc.
|
2.7%
|
|
Industry
|
(% of Net Assets)
|
|
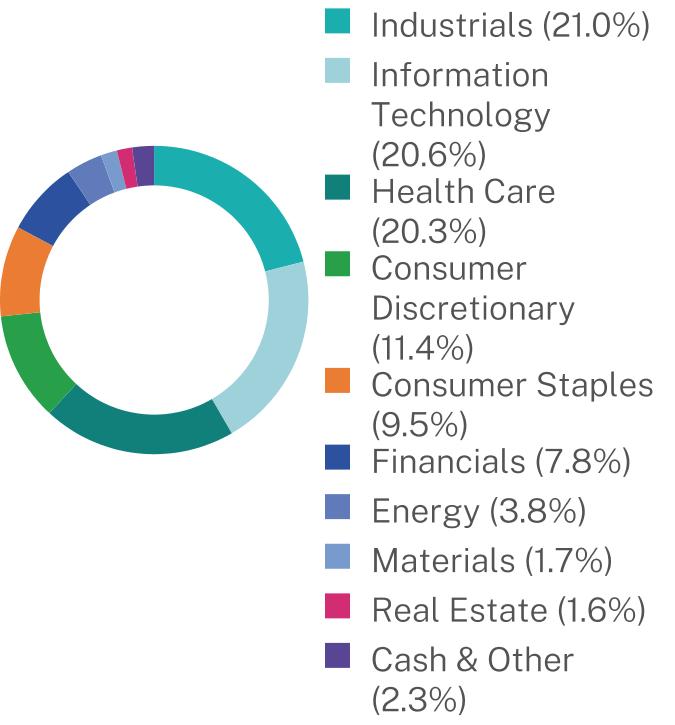
Software
|
12.9%
|
|
Health Care Equipment & Supplies
|
10.5%
|
|
Construction & Engineering
|
9.5%
|
|
Consumer Staples Distribution & Retail
|
5.9%
|
|
Electronic Equipment Instruments & Components
|
4.3%
|
|
Capital Markets
|
4.2%
|
|
Life Sciences Tools & Services
|
3.8%
|
|
Aerospace & Defense
|
3.6%
|
|
Semiconductors & Semiconductor Equipment
|
3.4%
|
|
Cash & Other
|
41.9%
|
| [1] |
|
||
| [2] |
|
||
| [3] |
|