Shareholder Report
Apr. 30, 2025
USD ($)
Holding
columbiathreadneedleus.com/resources/literature
. You can also request more information by contacting us at 1-800-345-6611.
What were the Fund costs for the reporting period?
(Based on a hypothetical $10,000 investment)
| Class | Cost of a $10,000 investment | Cost paid as a percentage of a $10,000 investment |
| Class A | $ 61 | 1.26 % (a) |
(a) | Annualized. |
Key Fund Statistics
| Fund net assets | $ 2,128,392,277 |
| Total number of portfolio holdings | 68 |
| Portfolio turnover for the reporting period | 11% |
Graphical Representation of Fund Holdings
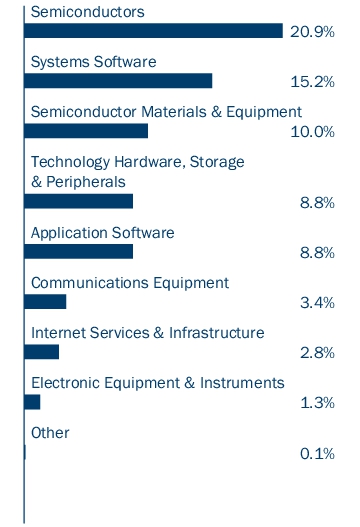
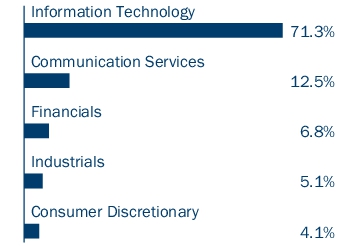
The tables below show the investment makeup of the Fund represented as a percentage of Fund net assets. Derivatives are excluded from the tables unless otherwise noted. The Fund's portfolio composition is subject to change.
Top Holdings
| Broadcom, Inc. | 5.8 % |
| Lam Research Corp. | 5.2 % |
| NVIDIA Corp. | 5.2 % |
| Microsoft Corp. | 5.1 % |
| Alphabet, Inc., Class A | 4.3 % |
| Apple, Inc. | 4.1 % |
| Bloom Energy Corp., Class A | 3.7 % |
| Visa, Inc., Class A | 3.1 % |
| Applied Materials, Inc. | 2.9 % |
| Oracle Corp. | 2.6 % |
Equity Sector Allocation

Information Technology Sub-industry Allocation

Top Holdings
| Broadcom, Inc. | 5.8 % |
| Lam Research Corp. | 5.2 % |
| NVIDIA Corp. | 5.2 % |
| Microsoft Corp. | 5.1 % |
| Alphabet, Inc., Class A | 4.3 % |
| Apple, Inc. | 4.1 % |
| Bloom Energy Corp., Class A | 3.7 % |
| Visa, Inc., Class A | 3.1 % |
| Applied Materials, Inc. | 2.9 % |
| Oracle Corp. | 2.6 % |
columbiathreadneedleus.com/resources/literature
. You can also request more information by contacting us at 1-800-345-6611.
What were the Fund costs for the reporting period?
(Based on a hypothetical $10,000 investment)
| Class | Cost of a $10,000 investment | Cost paid as a percentage of a $10,000 investment |
| Class C | $ 96 | 2.01 % (a) |
(a) | Annualized. |
Key Fund Statistics
| Fund net assets | $ 2,128,392,277 |
| Total number of portfolio holdings | 68 |
| Portfolio turnover for the reporting period | 11% |
Graphical Representation of Fund Holdings
The tables below show the investment makeup of the Fund represented as a percentage of Fund net assets. Derivatives are excluded from the tables unless otherwise noted. The Fund's portfolio composition is subject to change.
Top Holdings
| Broadcom, Inc. | 5.8 % |
| Lam Research Corp. | 5.2 % |
| NVIDIA Corp. | 5.2 % |
| Microsoft Corp. | 5.1 % |
| Alphabet, Inc., Class A | 4.3 % |
| Apple, Inc. | 4.1 % |
| Bloom Energy Corp., Class A | 3.7 % |
| Visa, Inc., Class A | 3.1 % |
| Applied Materials, Inc. | 2.9 % |
| Oracle Corp. | 2.6 % |
Equity Sector Allocation

Information Technology Sub-industry Allocation
Top Holdings
| Broadcom, Inc. | 5.8 % |
| Lam Research Corp. | 5.2 % |
| NVIDIA Corp. | 5.2 % |
| Microsoft Corp. | 5.1 % |
| Alphabet, Inc., Class A | 4.3 % |
| Apple, Inc. | 4.1 % |
| Bloom Energy Corp., Class A | 3.7 % |
| Visa, Inc., Class A | 3.1 % |
| Applied Materials, Inc. | 2.9 % |
| Oracle Corp. | 2.6 % |
columbiathreadneedleus.com/resources/literature
. You can also request more information by contacting us at 1-800-345-6611.
What were the Fund costs for the reporting period?
(Based on a hypothetical $10,000 investment)
| Class | Cost of a $10,000 investment | Cost paid as a percentage of a $10,000 investment |
| Institutional Class | $ 49 | 1.01 % (a) |
(a) | Annualized. |
Key Fund Statistics
| Fund net assets | $ 2,128,392,277 |
| Total number of portfolio holdings | 68 |
| Portfolio turnover for the reporting period | 11% |
Graphical Representation of Fund Holdings
The tables below show the investment makeup of the Fund represented as a percentage of Fund net assets. Derivatives are excluded from the tables unless otherwise noted. The Fund's portfolio composition is subject to change.
Top Holdings
| Broadcom, Inc. | 5.8 % |
| Lam Research Corp. | 5.2 % |
| NVIDIA Corp. | 5.2 % |
| Microsoft Corp. | 5.1 % |
| Alphabet, Inc., Class A | 4.3 % |
| Apple, Inc. | 4.1 % |
| Bloom Energy Corp., Class A | 3.7 % |
| Visa, Inc., Class A | 3.1 % |
| Applied Materials, Inc. | 2.9 % |
| Oracle Corp. | 2.6 % |
Equity Sector Allocation

Information Technology Sub-industry Allocation

Top Holdings
| Broadcom, Inc. | 5.8 % |
| Lam Research Corp. | 5.2 % |
| NVIDIA Corp. | 5.2 % |
| Microsoft Corp. | 5.1 % |
| Alphabet, Inc., Class A | 4.3 % |
| Apple, Inc. | 4.1 % |
| Bloom Energy Corp., Class A | 3.7 % |
| Visa, Inc., Class A | 3.1 % |
| Applied Materials, Inc. | 2.9 % |
| Oracle Corp. | 2.6 % |
columbiathreadneedleus.com/resources/literature
. You can also request more information by contacting us at 1-800-345-6611.
What were the Fund costs for the reporting period?
(Based on a hypothetical $10,000 investment)
| Class | Cost of a $10,000 investment | Cost paid as a percentage of a $10,000 investment |
| Institutional 2 Class | $ 46 | 0.96 % (a) |
(a) | Annualized. |
Key Fund Statistics
| Fund net assets | $ 2,128,392,277 |
| Total number of portfolio holdings | 68 |
| Portfolio turnover for the reporting period | 11% |
Graphical Representation of Fund Holdings
The tables below show the investment makeup of the Fund represented as a percentage of Fund net assets. Derivatives are excluded from the tables unless otherwise noted. The Fund's portfolio composition is subject to change.
Top Holdings
| Broadcom, Inc. | 5.8 % |
| Lam Research Corp. | 5.2 % |
| NVIDIA Corp. | 5.2 % |
| Microsoft Corp. | 5.1 % |
| Alphabet, Inc., Class A | 4.3 % |
| Apple, Inc. | 4.1 % |
| Bloom Energy Corp., Class A | 3.7 % |
| Visa, Inc., Class A | 3.1 % |
| Applied Materials, Inc. | 2.9 % |
| Oracle Corp. | 2.6 % |
Equity Sector Allocation

Information Technology Sub-industry Allocation

Top Holdings
| Broadcom, Inc. | 5.8 % |
| Lam Research Corp. | 5.2 % |
| NVIDIA Corp. | 5.2 % |
| Microsoft Corp. | 5.1 % |
| Alphabet, Inc., Class A | 4.3 % |
| Apple, Inc. | 4.1 % |
| Bloom Energy Corp., Class A | 3.7 % |
| Visa, Inc., Class A | 3.1 % |
| Applied Materials, Inc. | 2.9 % |
| Oracle Corp. | 2.6 % |
columbiathreadneedleus.com/resources/literature
. You can also request more information by contacting us at 1-800-345-6611.
What were the Fund costs for the reporting period?
(Based on a hypothetical $10,000 investment)
| Class | Cost of a $10,000 investment | Cost paid as a percentage of a $10,000 investment |
| Institutional 3 Class | $ 44 | 0.91 % (a) |
(a) | Annualized. |
Key Fund Statistics
| Fund net assets | $ 2,128,392,277 |
| Total number of portfolio holdings | 68 |
| Portfolio turnover for the reporting period | 11% |
Graphical Representation of Fund Holdings
The tables below show the investment makeup of the Fund represented as a percentage of Fund net assets. Derivatives are excluded from the tables unless otherwise noted. The Fund's portfolio composition is subject to change.
Top Holdings
| Broadcom, Inc. | 5.8 % |
| Lam Research Corp. | 5.2 % |
| NVIDIA Corp. | 5.2 % |
| Microsoft Corp. | 5.1 % |
| Alphabet, Inc., Class A | 4.3 % |
| Apple, Inc. | 4.1 % |
| Bloom Energy Corp., Class A | 3.7 % |
| Visa, Inc., Class A | 3.1 % |
| Applied Materials, Inc. | 2.9 % |
| Oracle Corp. | 2.6 % |
Equity Sector Allocation

Information Technology Sub-industry Allocation

Top Holdings
| Broadcom, Inc. | 5.8 % |
| Lam Research Corp. | 5.2 % |
| NVIDIA Corp. | 5.2 % |
| Microsoft Corp. | 5.1 % |
| Alphabet, Inc., Class A | 4.3 % |
| Apple, Inc. | 4.1 % |
| Bloom Energy Corp., Class A | 3.7 % |
| Visa, Inc., Class A | 3.1 % |
| Applied Materials, Inc. | 2.9 % |
| Oracle Corp. | 2.6 % |
columbiathreadneedleus.com/resources/literature
. You can also request more information by contacting us at 1-800-345-6611.
What were the Fund costs for the reporting period?
(Based on a hypothetical $10,000 investment)
| Class | Cost of a $10,000 investment | Cost paid as a percentage of a $10,000 investment |
| Class R | $ 73 | 1.51 % (a) |
(a) | Annualized. |
Key Fund Statistics
| Fund net assets | $ 2,128,392,277 |
| Total number of portfolio holdings | 68 |
| Portfolio turnover for the reporting period | 11% |
Graphical Representation of Fund Holdings
The tables below show the investment makeup of the Fund represented as a percentage of Fund net assets. Derivatives are excluded from the tables unless otherwise noted. The Fund's portfolio composition is subject to change.
Top Holdings
| Broadcom, Inc. | 5.8 % |
| Lam Research Corp. | 5.2 % |
| NVIDIA Corp. | 5.2 % |
| Microsoft Corp. | 5.1 % |
| Alphabet, Inc., Class A | 4.3 % |
| Apple, Inc. | 4.1 % |
| Bloom Energy Corp., Class A | 3.7 % |
| Visa, Inc., Class A | 3.1 % |
| Applied Materials, Inc. | 2.9 % |
| Oracle Corp. | 2.6 % |
Equity Sector Allocation
Information Technology Sub-industry Allocation

Top Holdings
| Broadcom, Inc. | 5.8 % |
| Lam Research Corp. | 5.2 % |
| NVIDIA Corp. | 5.2 % |
| Microsoft Corp. | 5.1 % |
| Alphabet, Inc., Class A | 4.3 % |
| Apple, Inc. | 4.1 % |
| Bloom Energy Corp., Class A | 3.7 % |
| Visa, Inc., Class A | 3.1 % |
| Applied Materials, Inc. | 2.9 % |
| Oracle Corp. | 2.6 % |
columbiathreadneedleus.com/resources/literature
. You can also request more information by contacting us at 1-800-345-6611.
What were the Fund costs for the reporting period?
(Based on a hypothetical $10,000 investment)
| Class | Cost of a $10,000 investment | Cost paid as a percentage of a $10,000 investment |
| Class S | $ 49 | 1.01 % (a) |
(a) | Annualized. |
Key Fund Statistics
| Fund net assets | $ 2,128,392,277 |
| Total number of portfolio holdings | 68 |
| Portfolio turnover for the reporting period | 11% |
Graphical Representation of Fund Holdings
The tables below show the investment makeup of the Fund represented as a percentage of Fund net assets. Derivatives are excluded from the tables unless otherwise noted. The Fund's portfolio composition is subject to change.
Top Holdings
| Broadcom, Inc. | 5.8 % |
| Lam Research Corp. | 5.2 % |
| NVIDIA Corp. | 5.2 % |
| Microsoft Corp. | 5.1 % |
| Alphabet, Inc., Class A | 4.3 % |
| Apple, Inc. | 4.1 % |
| Bloom Energy Corp., Class A | 3.7 % |
| Visa, Inc., Class A | 3.1 % |
| Applied Materials, Inc. | 2.9 % |
| Oracle Corp. | 2.6 % |
Equity Sector Allocation

Information Technology Sub-industry Allocation

Top Holdings
| Broadcom, Inc. | 5.8 % |
| Lam Research Corp. | 5.2 % |
| NVIDIA Corp. | 5.2 % |
| Microsoft Corp. | 5.1 % |
| Alphabet, Inc., Class A | 4.3 % |
| Apple, Inc. | 4.1 % |
| Bloom Energy Corp., Class A | 3.7 % |
| Visa, Inc., Class A | 3.1 % |
| Applied Materials, Inc. | 2.9 % |
| Oracle Corp. | 2.6 % |
| [1] | Annualized. |