Shareholder Report
Apr. 30, 2025
USD ($)
Holding
columbiathreadneedleus.com/resources/literature
. You can also request more information by contacting us at 1-800-345-6611.
What were the Fund costs for the reporting period?
(Based on a hypothetical $10,000 investment)
| Class | Cost of a $10,000 investment | Cost paid as a percentage of a $10,000 investment |
| Class A | $ 37 | 0.76 % (a) |
(a) | Annualized. |
Key Fund Statistics
| Fund net assets | $ 117,120,890 |
| Total number of portfolio holdings | 101 |
| Portfolio turnover for the reporting period | 5% |
Graphical Representation of Fund Holdings
The tables below show the investment makeup of the Fund represented as a percentage of Fund net assets. Derivatives are excluded from the tables unless otherwise noted. The Fund's portfolio composition is subject to change.
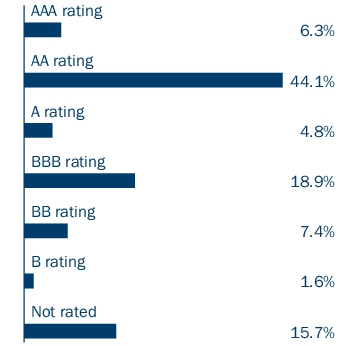
Bond ratings on Fund holdings are divided into categories ranging from highest to lowest credit quality, determined by using the middle rating of Moody’s Ratings, S&P and Fitch, after dropping the highest and lowest available ratings. When ratings are available from only two rating agencies, the lower rating is used. When a rating is available from only one rating agency, that rating is used. If a security is not rated by Moody's Ratings, S&P or Fitch, but has a rating by Kroll and/or DBRS, the same methodology is applied to those bonds that would otherwise be not rated. When a bond is not rated by any rating agency, it is designated as “Not rated.” Credit quality ratings assigned by a rating agency are subjective opinions, not statements of fact, and are subject to change, including daily.
Top Holdings
| New York City Municipal Water Finance Authority 06/15/2054 5.250% | 2.7 % |
| Triborough Bridge & Tunnel Authority 05/15/2064 5.250% | 2.7 % |
| New York Transportation Development Corp. 06/30/2060 5.375% | 2.6 % |
| TSASC, Inc. 06/01/2041 5.000% | 2.5 % |
| New York City Transitional Finance Authority 08/01/2048 4.000% | 2.3 % |
| New York State Dormitory Authority 03/15/2054 4.000% | 2.3 % |
| City of New York 09/01/2046 4.000% | 2.3 % |
| Triborough Bridge & Tunnel Authority 05/15/2062 5.250% | 2.2 % |
| Port Authority of New York & New Jersey 06/01/2094 6.125% | 1.9 % |
| Triborough Bridge & Tunnel Authority 05/15/2063 5.500% | 1.8 % |
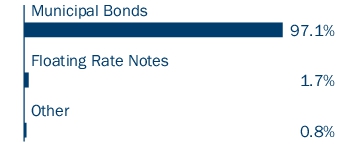
Asset Categories

Credit Quality
Top Holdings
| New York City Municipal Water Finance Authority 06/15/2054 5.250% | 2.7 % |
| Triborough Bridge & Tunnel Authority 05/15/2064 5.250% | 2.7 % |
| New York Transportation Development Corp. 06/30/2060 5.375% | 2.6 % |
| TSASC, Inc. 06/01/2041 5.000% | 2.5 % |
| New York City Transitional Finance Authority 08/01/2048 4.000% | 2.3 % |
| New York State Dormitory Authority 03/15/2054 4.000% | 2.3 % |
| City of New York 09/01/2046 4.000% | 2.3 % |
| Triborough Bridge & Tunnel Authority 05/15/2062 5.250% | 2.2 % |
| Port Authority of New York & New Jersey 06/01/2094 6.125% | 1.9 % |
| Triborough Bridge & Tunnel Authority 05/15/2063 5.500% | 1.8 % |
columbiathreadneedleus.com/resources/literature
. You can also request more information by contacting us at 1-800-345-6611.
What were the Fund costs for the reporting period?
(Based on a hypothetical $10,000 investment)
| Class | Cost of a $10,000 investment | Cost paid as a percentage of a $10,000 investment |
| Class C | $ 59 | 1.21 % (a) |
(a) | Annualized. |
Key Fund Statistics
| Fund net assets | $ 117,120,890 |
| Total number of portfolio holdings | 101 |
| Portfolio turnover for the reporting period | 5% |
Graphical Representation of Fund Holdings
The tables below show the investment makeup of the Fund represented as a percentage of Fund net assets. Derivatives are excluded from the tables unless otherwise noted. The Fund's portfolio composition is subject to change.
Bond ratings on Fund holdings are divided into categories ranging from highest to lowest credit quality, determined by using the middle rating of Moody’s Ratings, S&P and Fitch, after dropping the highest and lowest available ratings. When ratings are available from only two rating agencies, the lower rating is used. When a rating is available from only one rating agency, that rating is used. If a security is not rated by Moody's Ratings, S&P or Fitch, but has a rating by Kroll and/or DBRS, the same methodology is applied to those bonds that would otherwise be not rated. When a bond is not rated by any rating agency, it is designated as “Not rated.” Credit quality ratings assigned by a rating agency are subjective opinions, not statements of fact, and are subject to change, including daily.
Top Holdings
| New York City Municipal Water Finance Authority 06/15/2054 5.250% | 2.7 % |
| Triborough Bridge & Tunnel Authority 05/15/2064 5.250% | 2.7 % |
| New York Transportation Development Corp. 06/30/2060 5.375% | 2.6 % |
| TSASC, Inc. 06/01/2041 5.000% | 2.5 % |
| New York City Transitional Finance Authority 08/01/2048 4.000% | 2.3 % |
| New York State Dormitory Authority 03/15/2054 4.000% | 2.3 % |
| City of New York 09/01/2046 4.000% | 2.3 % |
| Triborough Bridge & Tunnel Authority 05/15/2062 5.250% | 2.2 % |
| Port Authority of New York & New Jersey 06/01/2094 6.125% | 1.9 % |
| Triborough Bridge & Tunnel Authority 05/15/2063 5.500% | 1.8 % |
Asset Categories

Credit Quality

Top Holdings
| New York City Municipal Water Finance Authority 06/15/2054 5.250% | 2.7 % |
| Triborough Bridge & Tunnel Authority 05/15/2064 5.250% | 2.7 % |
| New York Transportation Development Corp. 06/30/2060 5.375% | 2.6 % |
| TSASC, Inc. 06/01/2041 5.000% | 2.5 % |
| New York City Transitional Finance Authority 08/01/2048 4.000% | 2.3 % |
| New York State Dormitory Authority 03/15/2054 4.000% | 2.3 % |
| City of New York 09/01/2046 4.000% | 2.3 % |
| Triborough Bridge & Tunnel Authority 05/15/2062 5.250% | 2.2 % |
| Port Authority of New York & New Jersey 06/01/2094 6.125% | 1.9 % |
| Triborough Bridge & Tunnel Authority 05/15/2063 5.500% | 1.8 % |
columbiathreadneedleus.com/resources/literature
. You can also request more information by contacting us at 1-800-345-6611.
What were the Fund costs for the reporting period?
(Based on a hypothetical $10,000 investment)
| Class | Cost of a $10,000 investment | Cost paid as a percentage of a $10,000 investment |
| Institutional Class | $ 25 | 0.51 % (a) |
(a) | Annualized. |
Key Fund Statistics
| Fund net assets | $ 117,120,890 |
| Total number of portfolio holdings | 101 |
| Portfolio turnover for the reporting period | 5% |
Graphical Representation of Fund Holdings
The tables below show the investment makeup of the Fund represented as a percentage of Fund net assets. Derivatives are excluded from the tables unless otherwise noted. The Fund's portfolio composition is subject to change.
Bond ratings on Fund holdings are divided into categories ranging from highest to lowest credit quality, determined by using the middle rating of Moody’s Ratings, S&P and Fitch, after dropping the highest and lowest available ratings. When ratings are available from only two rating agencies, the lower rating is used. When a rating is available from only one rating agency, that rating is used. If a security is not rated by Moody's Ratings, S&P or Fitch, but has a rating by Kroll and/or DBRS, the same methodology is applied to those bonds that would otherwise be not rated. When a bond is not rated by any rating agency, it is designated as “Not rated.” Credit quality ratings assigned by a rating agency are subjective opinions, not statements of fact, and are subject to change, including daily.
Top Holdings
| New York City Municipal Water Finance Authority 06/15/2054 5.250% | 2.7 % |
| Triborough Bridge & Tunnel Authority 05/15/2064 5.250% | 2.7 % |
| New York Transportation Development Corp. 06/30/2060 5.375% | 2.6 % |
| TSASC, Inc. 06/01/2041 5.000% | 2.5 % |
| New York City Transitional Finance Authority 08/01/2048 4.000% | 2.3 % |
| New York State Dormitory Authority 03/15/2054 4.000% | 2.3 % |
| City of New York 09/01/2046 4.000% | 2.3 % |
| Triborough Bridge & Tunnel Authority 05/15/2062 5.250% | 2.2 % |
| Port Authority of New York & New Jersey 06/01/2094 6.125% | 1.9 % |
| Triborough Bridge & Tunnel Authority 05/15/2063 5.500% | 1.8 % |
Asset Categories

Credit Quality

Top Holdings
| New York City Municipal Water Finance Authority 06/15/2054 5.250% | 2.7 % |
| Triborough Bridge & Tunnel Authority 05/15/2064 5.250% | 2.7 % |
| New York Transportation Development Corp. 06/30/2060 5.375% | 2.6 % |
| TSASC, Inc. 06/01/2041 5.000% | 2.5 % |
| New York City Transitional Finance Authority 08/01/2048 4.000% | 2.3 % |
| New York State Dormitory Authority 03/15/2054 4.000% | 2.3 % |
| City of New York 09/01/2046 4.000% | 2.3 % |
| Triborough Bridge & Tunnel Authority 05/15/2062 5.250% | 2.2 % |
| Port Authority of New York & New Jersey 06/01/2094 6.125% | 1.9 % |
| Triborough Bridge & Tunnel Authority 05/15/2063 5.500% | 1.8 % |
columbiathreadneedleus.com/resources/literature
. You can also request more information by contacting us at 1-800-345-6611.
What were the Fund costs for the reporting period?
(Based on a hypothetical $10,000 investment)
| Class | Cost of a $10,000 investment | Cost paid as a percentage of a $10,000 investment |
| Institutional 2 Class | $ 24 | 0.49 % (a) |
(a) | Annualized. |
Key Fund Statistics
| Fund net assets | $ 117,120,890 |
| Total number of portfolio holdings | 101 |
| Portfolio turnover for the reporting period | 5% |
Graphical Representation of Fund Holdings
The tables below show the investment makeup of the Fund represented as a percentage of Fund net assets. Derivatives are excluded from the tables unless otherwise noted. The Fund's portfolio composition is subject to change.
Bond ratings on Fund holdings are divided into categories ranging from highest to lowest credit quality, determined by using the middle rating of Moody’s Ratings, S&P and Fitch, after dropping the highest and lowest available ratings. When ratings are available from only two rating agencies, the lower rating is used. When a rating is available from only one rating agency, that rating is used. If a security is not rated by Moody's Ratings, S&P or Fitch, but has a rating by Kroll and/or DBRS, the same methodology is applied to those bonds that would otherwise be not rated. When a bond is not rated by any rating agency, it is designated as “Not rated.” Credit quality ratings assigned by a rating agency are subjective opinions, not statements of fact, and are subject to change, including daily.
Top Holdings
| New York City Municipal Water Finance Authority 06/15/2054 5.250% | 2.7 % |
| Triborough Bridge & Tunnel Authority 05/15/2064 5.250% | 2.7 % |
| New York Transportation Development Corp. 06/30/2060 5.375% | 2.6 % |
| TSASC, Inc. 06/01/2041 5.000% | 2.5 % |
| New York City Transitional Finance Authority 08/01/2048 4.000% | 2.3 % |
| New York State Dormitory Authority 03/15/2054 4.000% | 2.3 % |
| City of New York 09/01/2046 4.000% | 2.3 % |
| Triborough Bridge & Tunnel Authority 05/15/2062 5.250% | 2.2 % |
| Port Authority of New York & New Jersey 06/01/2094 6.125% | 1.9 % |
| Triborough Bridge & Tunnel Authority 05/15/2063 5.500% | 1.8 % |
Asset Categories

Credit Quality

Top Holdings
| New York City Municipal Water Finance Authority 06/15/2054 5.250% | 2.7 % |
| Triborough Bridge & Tunnel Authority 05/15/2064 5.250% | 2.7 % |
| New York Transportation Development Corp. 06/30/2060 5.375% | 2.6 % |
| TSASC, Inc. 06/01/2041 5.000% | 2.5 % |
| New York City Transitional Finance Authority 08/01/2048 4.000% | 2.3 % |
| New York State Dormitory Authority 03/15/2054 4.000% | 2.3 % |
| City of New York 09/01/2046 4.000% | 2.3 % |
| Triborough Bridge & Tunnel Authority 05/15/2062 5.250% | 2.2 % |
| Port Authority of New York & New Jersey 06/01/2094 6.125% | 1.9 % |
| Triborough Bridge & Tunnel Authority 05/15/2063 5.500% | 1.8 % |
columbiathreadneedleus.com/resources/literature
. You can also request more information by contacting us at 1-800-345-6611.
What were the Fund costs for the reporting period?
(Based on a hypothetical $10,000 investment)
| Class | Cost of a $10,000 investment | Cost paid as a percentage of a $10,000 investment |
| Institutional 3 Class | $ 22 | 0.44 % (a) |
(a) | Annualized. |
Key Fund Statistics
| Fund net assets | $ 117,120,890 |
| Total number of portfolio holdings | 101 |
| Portfolio turnover for the reporting period | 5% |
Graphical Representation of Fund Holdings
The tables below show the investment makeup of the Fund represented as a percentage of Fund net assets. Derivatives are excluded from the tables unless otherwise noted. The Fund's portfolio composition is subject to change.
Bond ratings on Fund holdings are divided into categories ranging from highest to lowest credit quality, determined by using the middle rating of Moody’s Ratings, S&P and Fitch, after dropping the highest and lowest available ratings. When ratings are available from only two rating agencies, the lower rating is used. When a rating is available from only one rating agency, that rating is used. If a security is not rated by Moody's Ratings, S&P or Fitch, but has a rating by Kroll and/or DBRS, the same methodology is applied to those bonds that would otherwise be not rated. When a bond is not rated by any rating agency, it is designated as “Not rated.” Credit quality ratings assigned by a rating agency are subjective opinions, not statements of fact, and are subject to change, including daily.
Top Holdings
| New York City Municipal Water Finance Authority 06/15/2054 5.250% | 2.7 % |
| Triborough Bridge & Tunnel Authority 05/15/2064 5.250% | 2.7 % |
| New York Transportation Development Corp. 06/30/2060 5.375% | 2.6 % |
| TSASC, Inc. 06/01/2041 5.000% | 2.5 % |
| New York City Transitional Finance Authority 08/01/2048 4.000% | 2.3 % |
| New York State Dormitory Authority 03/15/2054 4.000% | 2.3 % |
| City of New York 09/01/2046 4.000% | 2.3 % |
| Triborough Bridge & Tunnel Authority 05/15/2062 5.250% | 2.2 % |
| Port Authority of New York & New Jersey 06/01/2094 6.125% | 1.9 % |
| Triborough Bridge & Tunnel Authority 05/15/2063 5.500% | 1.8 % |
Asset Categories
Credit Quality

Top Holdings
| New York City Municipal Water Finance Authority 06/15/2054 5.250% | 2.7 % |
| Triborough Bridge & Tunnel Authority 05/15/2064 5.250% | 2.7 % |
| New York Transportation Development Corp. 06/30/2060 5.375% | 2.6 % |
| TSASC, Inc. 06/01/2041 5.000% | 2.5 % |
| New York City Transitional Finance Authority 08/01/2048 4.000% | 2.3 % |
| New York State Dormitory Authority 03/15/2054 4.000% | 2.3 % |
| City of New York 09/01/2046 4.000% | 2.3 % |
| Triborough Bridge & Tunnel Authority 05/15/2062 5.250% | 2.2 % |
| Port Authority of New York & New Jersey 06/01/2094 6.125% | 1.9 % |
| Triborough Bridge & Tunnel Authority 05/15/2063 5.500% | 1.8 % |
| [1] | Annualized. |