Shareholder Report
Apr. 30, 2025
USD ($)
Holding
columbiathreadneedleus.com/resources/literature
. You can also request more information by contacting us at 1-800-345-6611.
What were the Fund costs for the reporting period?
(Based on a hypothetical $10,000 investment)
| Class | Cost of a $10,000 investment | Cost paid as a percentage of a $10,000 investment |
| Class A | $ 33 | 0.32 % |
Management's Discussion of Fund Performance
The performance of Class A shares for the period presented is shown in the Average Annual Total Returns table.
Top Performance Contributors
Allocation
| Performance was driven by intermediate maturity U.S. Treasuries, as 3-5 Yr Treasuries returned 8.56% and 5-10 year Treasuries returned 9.02%, both outperforming shorter and longer maturity issues.Yield curve
| The yield curve steepened over the year, with yields on all Treasuries under 5-years falling at least 1.00%, all of which benefited from the corresponding price appreciation. Treasuries longer than seven years also experienced lower yields but by a smaller margin, the longer the bond’s maturity.Top Performance Detractors
Allocation
| 1-3 year Treasuries, which made up one-third of the Fund’s portfolio, posted positive returns of 6.68% during the annual period, but contributed less to overall performance. U.S. Treasuries longer than 10 years, approximately 20% of the Fund’s portfolio, returned 4.89% for the same period.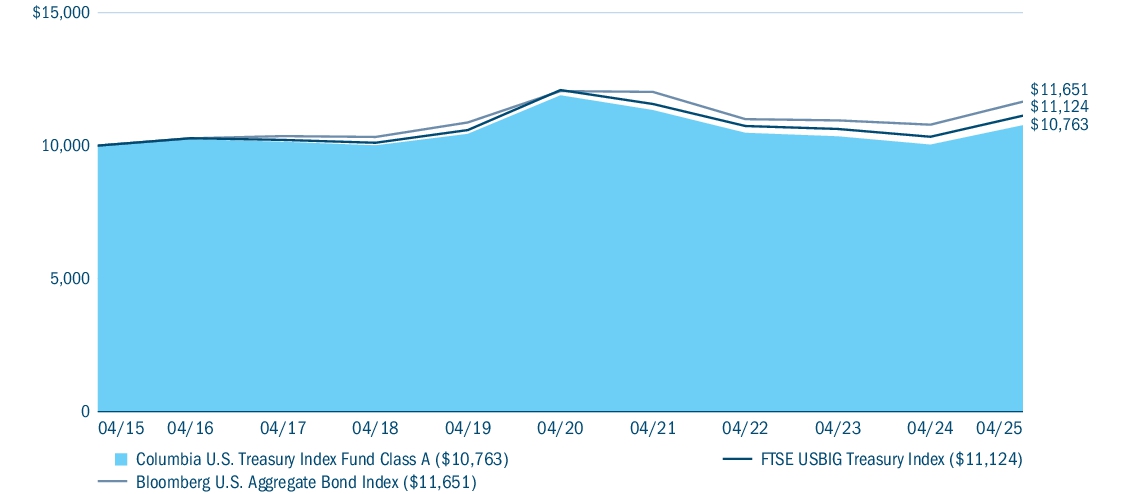
| Average Annual Total Returns (%) | 1 year | 5 years | 10 years |
| Class A | 7.26 | (1.97 ) | 0.74 |
| FTSE USBIG Treasury Index | 7.67 | (1.65 ) | 1.07 |
| Bloomberg U.S. Aggregate Bond Index (a) | 8.02 | (0.67 ) | 1.54 |
(a) | Effective August 1, 2024, the Fund compares its performance to the Bloomberg U.S. Aggregate Bond Index, a broad-based performance index, as required by new regulatory requirements. The Fund’s performance also continues to be compared to its prior benchmarks, which management believes more closely represent the market sectors/and or asset classes in which the Fund primarily invests. |
columbiathreadneedleus.com/investment-products/mutual-funds
for more recent performance information.
Key Fund Statistics
| Fund net assets | $ 817,580,549 |
| Total number of portfolio holdings | 275 |
| Management services fees (represents 0.40% of Fund average net assets) | $ 3,412,975 |
| Portfolio turnover for the reporting period | 42% |
Graphical Holdings
Representation
of FundThe tables below show the investment makeup of the Fund represented as a percentage of Fund net assets. Derivatives are excluded from the tables unless otherwise noted. The Fund's portfolio composition is subject to change.
Bond ratings on Fund holdings are divided into categories ranging from highest to lowest credit quality, determined by using the middle rating of Moody’s Ratings, S&P and Fitch, after dropping the highest and lowest available ratings. When ratings are available from only two rating agencies, the lower rating is used. When a rating is available from only one rating agency, that rating is used. If a security is not rated by Moody's Ratings, S&P or Fitch, but has a rating by Kroll and/or DBRS, the same methodology is applied to those bonds that would otherwise be not rated. When a bond is not rated by any rating agency, it is designated as “Not rated.” Credit quality ratings assigned by a rating agency are subjective opinions, not statements of fact, and are subject to change, including daily.
Top Holdings
| U.S. Treasury 02/15/2035 4.625% | 0.9 % |
| U.S. Treasury 05/15/2034 4.375% | 0.9 % |
| U.S. Treasury 02/15/2034 4.000% | 0.9 % |
| U.S. Treasury 11/15/2034 4.250% | 0.9 % |
| U.S. Treasury 11/15/2033 4.500% | 0.9 % |
| U.S. Treasury 08/15/2034 3.875% | 0.9 % |
| U.S. Treasury 08/15/2033 3.875% | 0.8 % |
| U.S. Treasury 02/28/2030 4.000% | 0.8 % |
| U.S. Treasury 11/15/2032 4.125% | 0.8 % |
| U.S. Treasury 02/15/2033 3.500% | 0.7 % |
Asset Categories

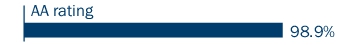
Credit Quality

Top Holdings
| U.S. Treasury 02/15/2035 4.625% | 0.9 % |
| U.S. Treasury 05/15/2034 4.375% | 0.9 % |
| U.S. Treasury 02/15/2034 4.000% | 0.9 % |
| U.S. Treasury 11/15/2034 4.250% | 0.9 % |
| U.S. Treasury 11/15/2033 4.500% | 0.9 % |
| U.S. Treasury 08/15/2034 3.875% | 0.9 % |
| U.S. Treasury 08/15/2033 3.875% | 0.8 % |
| U.S. Treasury 02/28/2030 4.000% | 0.8 % |
| U.S. Treasury 11/15/2032 4.125% | 0.8 % |
| U.S. Treasury 02/15/2033 3.500% | 0.7 % |
columbiathreadneedleus.com/resources/literature
. You can also request more information by contacting us at 1-800-345-6611.
What were the Fund costs for the reporting period?
(Based on a hypothetical $10,000 investment)
| Class | Cost of a $10,000 investment | Cost paid as a percentage of a $10,000 investment |
| Institutional Class | $ 18 | 0.17 % |
Management's Discussion of Fund Performance
The performance of Institutional Class shares for the period presented is shown in the Average Annual Total Returns table.
Top Performance Contributors
Allocation
| Performance was driven by intermediate maturity U.S. Treasuries, as 3-5 Yr Treasuries returned 8.56% and 5-10 year Treasuries returned 9.02%, both outperforming shorter and longer maturity issues.Yield curve
| The yield curve steepened over the year, with yields on all Treasuries under 5-years falling at least 1.00%, all of which benefited from the corresponding price appreciation. Treasuries longer than seven years also experienced lower yields but by a smaller margin, the longer the bond’s maturity.Top Performance Detractors
Allocation
| 1-3 year Treasuries, which made up one-third of the Fund’s portfolio, posted positive returns of 6.68% during the annual period, but contributed less to overall performance. U.S. Treasuries longer than 10 years, approximately 20% of the Fund’s portfolio, returned 4.89% for the same period.
| Average Annual Total Returns (%) | 1 year | 5 years | 10 years |
| Institutional Class | 7.53 | (1.80 ) | 0.90 |
| FTSE USBIG Treasury Index | 7.67 | (1.65 ) | 1.07 |
| Bloomberg U.S. Aggregate Bond Index (a) | 8.02 | (0.67 ) | 1.54 |
(a) | Effective August 1, 2024, the Fund compares its performance to the Bloomberg U.S. Aggregate Bond Index, a broad-based performance index, as required by new regulatory requirements. The Fund’s performance also continues to be compared to its prior benchmarks, which management believes more closely represent the market sectors/and or asset classes in which the Fund primarily invests. |
columbiathreadneedleus.com/investment-products/mutual-funds
for more recent performance information.
Key Fund Statistics
| Fund net assets | $ 817,580,549 |
| Total number of portfolio holdings | 275 |
| Management services fees (represents 0.40% of Fund average net assets) | $ 3,412,975 |
| Portfolio turnover for the reporting period | 42% |
Graphical Representation of Fund Holdings
The tables below show the investment makeup of the Fund represented as a percentage of Fund net assets. Derivatives are excluded from the tables unless otherwise noted. The Fund's portfolio composition is subject to change.
Bond ratings on Fund holdings are divided into categories ranging from highest to lowest credit quality, determined by using the middle rating of Moody’s Ratings, S&P and Fitch, after dropping the highest and lowest available ratings. When ratings are available from only two rating agencies, the lower rating is used. When a rating is available from only one rating agency, that rating is used. If a security is not rated by Moody's Ratings, S&P or Fitch, but has a rating by Kroll and/or DBRS, the same methodology is applied to those bonds that would otherwise be not rated. When a bond is not rated by any rating agency, it is designated as “Not rated.” Credit quality ratings assigned by a rating agency are subjective opinions, not statements of fact, and are subject to change, including daily.
Top Holdings
| U.S. Treasury 02/15/2035 4.625% | 0.9 % |
| U.S. Treasury 05/15/2034 4.375% | 0.9 % |
| U.S. Treasury 02/15/2034 4.000% | 0.9 % |
| U.S. Treasury 11/15/2034 4.250% | 0.9 % |
| U.S. Treasury 11/15/2033 4.500% | 0.9 % |
| U.S. Treasury 08/15/2034 3.875% | 0.9 % |
| U.S. Treasury 08/15/2033 3.875% | 0.8 % |
| U.S. Treasury 02/28/2030 4.000% | 0.8 % |
| U.S. Treasury 11/15/2032 4.125% | 0.8 % |
| U.S. Treasury 02/15/2033 3.500% | 0.7 % |
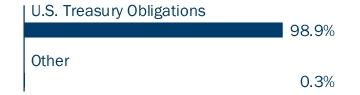
Asset Categories

Credit Quality

Top Holdings
| U.S. Treasury 02/15/2035 4.625% | 0.9 % |
| U.S. Treasury 05/15/2034 4.375% | 0.9 % |
| U.S. Treasury 02/15/2034 4.000% | 0.9 % |
| U.S. Treasury 11/15/2034 4.250% | 0.9 % |
| U.S. Treasury 11/15/2033 4.500% | 0.9 % |
| U.S. Treasury 08/15/2034 3.875% | 0.9 % |
| U.S. Treasury 08/15/2033 3.875% | 0.8 % |
| U.S. Treasury 02/28/2030 4.000% | 0.8 % |
| U.S. Treasury 11/15/2032 4.125% | 0.8 % |
| U.S. Treasury 02/15/2033 3.500% | 0.7 % |
columbiathreadneedleus.com/resources/literature
. You can also request more information by contacting us at 1-800-345-6611.
What were the Fund costs for the reporting period?
(Based on a hypothetical $10,000 investment)
| Class | Cost of a $10,000 investment | Cost paid as a percentage of a $10,000 investment |
| Institutional 2 Class | $ 18 | 0.17 % |
Management's Discussion of Fund Performance
The performance of Institutional 2 Class shares for the period presented is shown in the Average Annual Total Returns table.
Top Performance Contributors
Allocation
| Performance was driven by intermediate maturity U.S. Treasuries, as 3-5 Yr Treasuries returned 8.56% and 5-10 year Treasuries returned 9.02%, both outperforming shorter and longer maturity issues.Yield curve
| The yield curve steepened over the year, with yields on all Treasuries under 5-years falling at least 1.00%, all of which benefited from the corresponding price appreciation. Treasuries longer than seven years also experienced lower yields but by a smaller margin, the longer the bond’s maturity.Top Performance Detractors
Allocation
| 1-3 year Treasuries, which made up one-third of the Fund’s portfolio, posted positive returns of 6.68% during the annual period, but contributed less to overall performance. U.S. Treasuries longer than 10 years, approximately 20% of the Fund’s portfolio, returned 4.89% for the same period.
| Average Annual Total Returns (%) | 1 year | 5 years | 10 years |
| Institutional 2 Class | 7.54 | (1.79 ) | 0.90 |
| FTSE USBIG Treasury Index | 7.67 | (1.65 ) | 1.07 |
| Bloomberg U.S. Aggregate Bond Index (a) | 8.02 | (0.67 ) | 1.54 |
(a) | Effective August 1, 2024, the Fund compares its performance to the Bloomberg U.S. Aggregate Bond Index, a broad-based performance index, as required by new regulatory requirements. The Fund’s performance also continues to be compared to its prior benchmarks, which management believes more closely represent the market sectors/and or asset classes in which the Fund primarily invests. |
columbiathreadneedleus.com/investment-products/mutual-funds
for more recent performance information.
Key Fund
Statistics
| Fund net assets | $ 817,580,549 |
| Total number of portfolio holdings | 275 |
| Management services fees (represents 0.40% of Fund average net assets) | $ 3,412,975 |
| Portfolio turnover for the reporting period | 42% |
Graphical Representation of Fund Holdings
The tables below show the investment makeup of the Fund represented as a percentage of Fund net assets. Derivatives are excluded from the tables unless otherwise noted. The Fund's portfolio composition is subject to change.
Bond ratings on Fund holdings are divided into categories ranging from highest to lowest credit quality, determined by using the middle rating of Moody’s Ratings, S&P and Fitch, after dropping the highest and lowest available ratings. When ratings are available from only two rating agencies, the lower rating is used. When a rating is available from only one rating agency, that rating is used. If a security is not rated by Moody's Ratings, S&P or Fitch, but has a rating by Kroll and/or DBRS, the same methodology is applied to those bonds that would otherwise be not rated. When a bond is not rated by any rating agency, it is designated as “Not rated.” Credit quality ratings assigned by a rating agency are subjective opinions, not statements of fact, and are subject to change, including daily.
Top Holdings
| U.S. Treasury 02/15/2035 4.625% | 0.9 % |
| U.S. Treasury 05/15/2034 4.375% | 0.9 % |
| U.S. Treasury 02/15/2034 4.000% | 0.9 % |
| U.S. Treasury 11/15/2034 4.250% | 0.9 % |
| U.S. Treasury 11/15/2033 4.500% | 0.9 % |
| U.S. Treasury 08/15/2034 3.875% | 0.9 % |
| U.S. Treasury 08/15/2033 3.875% | 0.8 % |
| U.S. Treasury 02/28/2030 4.000% | 0.8 % |
| U.S. Treasury 11/15/2032 4.125% | 0.8 % |
| U.S. Treasury 02/15/2033 3.500% | 0.7 % |
Asset Categories

Credit Quality
Top Holdings
| U.S. Treasury 02/15/2035 4.625% | 0.9 % |
| U.S. Treasury 05/15/2034 4.375% | 0.9 % |
| U.S. Treasury 02/15/2034 4.000% | 0.9 % |
| U.S. Treasury 11/15/2034 4.250% | 0.9 % |
| U.S. Treasury 11/15/2033 4.500% | 0.9 % |
| U.S. Treasury 08/15/2034 3.875% | 0.9 % |
| U.S. Treasury 08/15/2033 3.875% | 0.8 % |
| U.S. Treasury 02/28/2030 4.000% | 0.8 % |
| U.S. Treasury 11/15/2032 4.125% | 0.8 % |
| U.S. Treasury 02/15/2033 3.500% | 0.7 % |
columbiathreadneedleus.com/resources/literature
. You can also request more information by contacting us at 1-800-345-6611.
What were the Fund costs for the reporting period?
(Based on a hypothetical $10,000 investment)
| Class | Cost of a $10,000 investment | Cost paid as a percentage of a $10,000 investment |
| Institutional 3 Class | $ 18 | 0.17 % |
Management's Discussion of Fund Performance
The performance of Institutional 3 Class shares for the period presented is shown in the Average Annual Total Returns table.
Top Performance Contributors
Allocation
| Performance was driven by intermediate maturity U.S. Treasuries, as 3-5 Yr Treasuries returned 8.56% and 5-10 year Treasuries returned 9.02%, both outperforming shorter and longer maturity issues.Yield curve
| The yield curve steepened over the year, with yields on all Treasuries under 5-years falling at least 1.00%, all of which benefited from the corresponding price appreciation. Treasuries longer than seven years also experienced lower yields but by a smaller margin, the longer the bond’s maturity.Top Performance Detractors
Allocation
| 1-3 year Treasuries, which made up one-third of the Fund’s portfolio, posted positive returns of 6.68% during the annual period, but contributed less to overall performance. U.S. Treasuries longer than 10 years, approximately 20% of the Fund’s portfolio, returned 4.89% for the same period.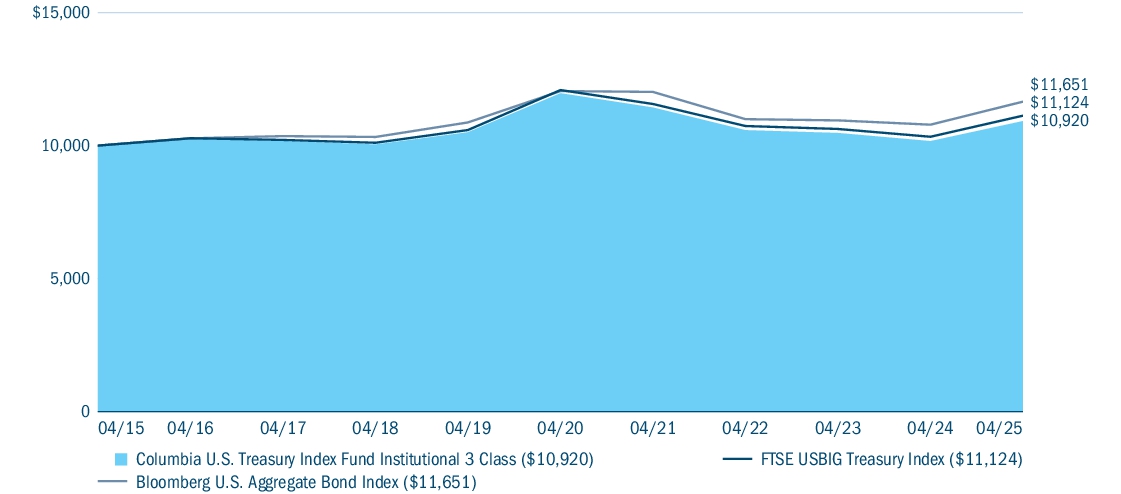
| Average Annual Total Returns (%) | 1 year | 5 years | 10 years |
| Institutional 3 Class (a) | 7.40 | (1.81 ) | 0.88 |
| FTSE USBIG Treasury Index | 7.67 | (1.65 ) | 1.07 |
| Bloomberg U.S. Aggregate Bond Index (b) | 8.02 | (0.67 ) | 1.54 |
(a) | The returns shown for periods prior to March 1, 2017 (including Since Fund Inception returns, if shown) include the returns of Institutional Class. These returns are adjusted to reflect any higher class-related operating expenses of the newer share classes, as applicable. Please visit columbiathreadneedleus.com/investment-products/mutual-funds/appended-performance for more information. |
(b) | Effective August 1, 2024, the Fund compares its performance to the Bloomberg U.S. Aggregate Bond Index, a broad-based performance index, as required by new regulatory requirements. The Fund’s performance also continues to be compared to its prior benchmarks, which management believes more closely represent the market sectors/and or asset classes in which the Fund primarily invests. |
columbiathreadneedleus.com/investment-products/mutual-funds
for more recent performance information.
Key
Fund
Statistics| Fund net assets | $ 817,580,549 |
| Total number of portfolio holdings | 275 |
| Management services fees (represents 0.40% of Fund average net assets) | $ 3,412,975 |
| Portfolio turnover for the reporting period | 42% |
Graphical Representation of Fund Holdings
The tables below show the investment makeup of the Fund represented as a percentage of Fund net assets. Derivatives are excluded from the tables unless otherwise noted. The Fund's portfolio composition is subject to change.
Bond ratings on Fund holdings are divided into categories ranging from highest to lowest credit quality, determined by using the middle rating of Moody’s Ratings, S&P and Fitch, after dropping the highest and lowest available ratings. When ratings are available from only two rating agencies, the lower rating is used. When a rating is available from only one rating agency, that rating is used. If a security is not rated by Moody's Ratings, S&P or Fitch, but has a rating by Kroll and/or DBRS, the same methodology is applied to those bonds that would otherwise be not rated. When a bond is not rated by any rating agency, it is designated as “Not rated.” Credit quality ratings assigned by a rating agency are subjective opinions, not statements of fact, and are subject to change, including daily.
Top Holdings
| U.S. Treasury 02/15/2035 4.625% | 0.9 % |
| U.S. Treasury 05/15/2034 4.375% | 0.9 % |
| U.S. Treasury 02/15/2034 4.000% | 0.9 % |
| U.S. Treasury 11/15/2034 4.250% | 0.9 % |
| U.S. Treasury 11/15/2033 4.500% | 0.9 % |
| U.S. Treasury 08/15/2034 3.875% | 0.9 % |
| U.S. Treasury 08/15/2033 3.875% | 0.8 % |
| U.S. Treasury 02/28/2030 4.000% | 0.8 % |
| U.S. Treasury 11/15/2032 4.125% | 0.8 % |
| U.S. Treasury 02/15/2033 3.500% | 0.7 % |
Asset Categories
Credit Quality

Top Holdings
| U.S. Treasury 02/15/2035 4.625% | 0.9 % |
| U.S. Treasury 05/15/2034 4.375% | 0.9 % |
| U.S. Treasury 02/15/2034 4.000% | 0.9 % |
| U.S. Treasury 11/15/2034 4.250% | 0.9 % |
| U.S. Treasury 11/15/2033 4.500% | 0.9 % |
| U.S. Treasury 08/15/2034 3.875% | 0.9 % |
| U.S. Treasury 08/15/2033 3.875% | 0.8 % |
| U.S. Treasury 02/28/2030 4.000% | 0.8 % |
| U.S. Treasury 11/15/2032 4.125% | 0.8 % |
| U.S. Treasury 02/15/2033 3.500% | 0.7 % |