Shareholder Report
Apr. 30, 2025
USD ($)
Holding
columbiathreadneedleus.com/resources/literature
. You can also request more information by contacting us at 1-800-345-6611.
What were the Fund costs for the reporting period?
(Based on a hypothetical $10,000 investment)
| Class | Cost of a $10,000 investment | Cost paid as a percentage of a $10,000 investment |
| Class A | $ 120 |
1.21 % |
Management's Discussion of Fund Performance
The performance of Class A shares for the period presented is shown in the Average Annual Total Returns table.
Top Performance Contributors
Stock selection
| Selections in the information technology, financials and utilities sectors boosted the Fund’s relative results most during the annual period.Allocations
| Smaller allocations to the energy and health care sectors and a larger allocation to the information technology sector buoyed Fund relative results during the annual period.Individual holdings
| Positions in ThredUp, Inc., an online clothing resale platform; Insmed, Inc., a biopharmaceutical company; Kyndryl Holdings, Inc., an information systems company; Cerence, Inc., a developer of AI assistants for cars; and StoneX Group, Inc., a financial services company, were among the top absolute contributors to Fund performance.Top Performance Detractors
Stock selection
| Selections in the consumer discretionary, consumer staples and real estate sectors hurt the Fund’s relative results during the annual period.Allocations
| Smaller weightings to the financials and utilities sectors and a larger allocation to the consumer discretionary sector detracted from relative performance.Individual holdings
| Fund positions in Synaptics, Inc., a smart tech developer; Tronox Holdings PLC, a chemicals company; Murphy Oil Corp., an oil and natural gas company; KinderCare Learning Cos, Inc., a daycare and preschool operator; and Apellis Pharmaceuticals, Inc., a biopharmaceutical company, were top absolute detractors during the period.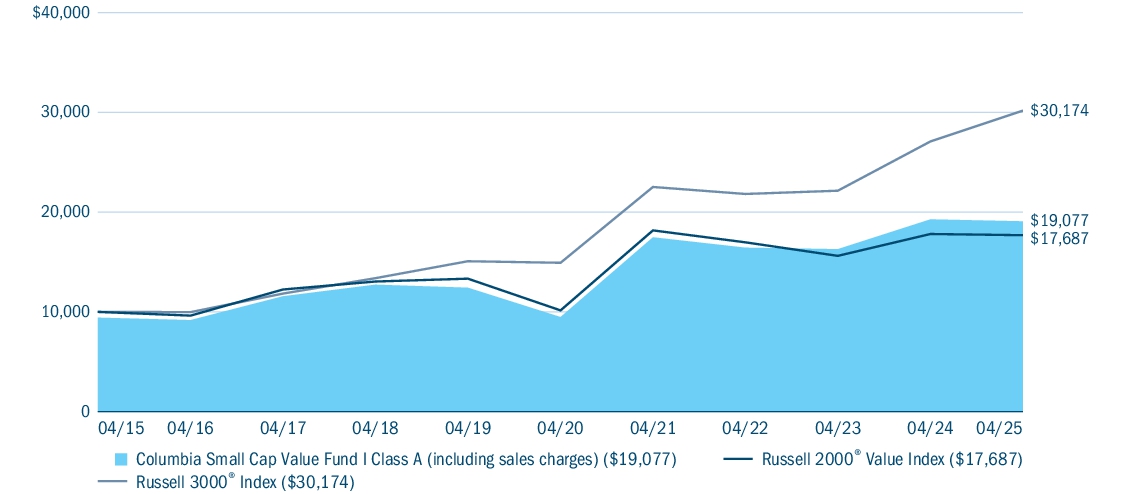
| Average Annual Total Returns (%) | 1 year | 5 years | 10 years |
| Class A (excluding sales charges) | (1.02 ) |
15.01 | 7.31 |
| Class A (including sales charges) | (6.72 ) |
13.66 | 6.67 |
| Russell 2000® Value Index | (0.68 ) |
11.74 | 5.87 |
| Russell 3000 ® Index (a) |
11.40 | 15.12 | 11.68 |
|
(a)
|
Effective August 1, 2024, the Fund compares its performance to the Russell 3000 ® Index, a broad-based performance index as required by new regulatory requirements. The Fund’s performance also continues to be compared to its prior benchmark, which management believes more closely represents the market sectors and/or asset classes in which the Fund primarily invests. |
®
Index, a broad-based performance index as required by new regulatory requirements.
columbiathreadneedleus.com/investment-products/mutual-funds
for more recent performance information.
Key Fund S
tatis
tics| Fund net assets | $ 1,436,927,343 |
| Total number of portfolio holdings | 216 |
| Management services fees (represents 0.80% of Fund average net assets) |
$ 12,206,095 |
| Portfolio turnover for the reporting period | 72% |
Graphical Representation of Fund Holdings
The tables below show the investment makeup of the Fund represented as a percentage of Fund net assets. Derivatives are excluded from the
tab
les unless otherwise noted. The Fund's portfolio composition is subject to change.Top Holdings
| National Fuel Gas Co. | 1.6 % |
| Popular, Inc. | 1.4 % |
| Essent Group Ltd. | 1.4 % |
| UGI Corp. | 1.3 % |
| JBT Marel Corp. |
1.3 % |
| Kirby Corp. | 1.3 % |
| StoneX Group, Inc. | 1.3 % |
| Telephone and Data Systems, Inc. | 1.1 % |
| Moog, Inc., Class A | 1.1 % |
| MP Materials Corp. | 1.0 % |
Asset Categories

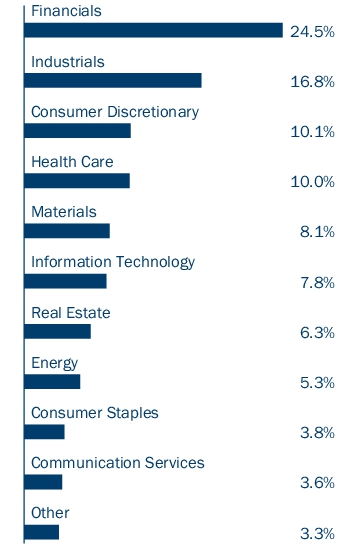
Equity Sector Allocation

Top Holdings
| National Fuel Gas Co. | 1.6 % |
| Popular, Inc. | 1.4 % |
| Essent Group Ltd. | 1.4 % |
| UGI Corp. | 1.3 % |
| JBT Marel Corp. |
1.3 % |
| Kirby Corp. | 1.3 % |
| StoneX Group, Inc. | 1.3 % |
| Telephone and Data Systems, Inc. | 1.1 % |
| Moog, Inc., Class A | 1.1 % |
| MP Materials Corp. | 1.0 % |
columbiathreadneedleus.com/resources/literature
. You can also request more information by contacting us at 1-800-345-6611.
What were the Fund costs for the reporting period?
(Based on a hypothetical $10,000 investment)
| Class | Cost of a $10,000 investment | Cost paid as a percentage of a $10,000 investment |
| Class C | $ 194 |
1.96 % |
Management's Discussion of Fund Performance
The performance of Class C shares for the period presented is shown in the Average Annual Total Returns table.
Top Performance Contributors
Stock selection
| Selections in the information technology, financials and utilities sectors boosted the Fund’s relative results most during the annual period.Allocations
| Smaller allocations to the energy and health care sectors and a larger allocation to the information technology sector buoyed Fund relative results during the annual period.Individual holdings
| Positions in ThredUp, Inc., an online clothing resale platform; Insmed, Inc., a biopharmaceutical company; Kyndryl Holdings, Inc., an information systems company; Cerence, Inc., a developer of AI assistants for cars; and StoneX Group, Inc., a financial services company, were among the top absolute contributors to Fund performance.Top Performance Detractors
Stock selection
| Selections in the consumer discretionary, consumer staples and real estate sectors hurt the Fund’s relative results during the annual period.Allocations
| Smaller weightings to the financials and utilities sectors and a larger allocation to the consumer discretionary sector detracted from relative performance.Individual holdings
| Fund positions in Synaptics, Inc., a smart tech developer; Tronox Holdings PLC, a chemicals company; Murphy Oil Corp., an oil and natural gas company; KinderCare Learning Cos, Inc., a daycare and preschool operator; and Apellis Pharmaceuticals, Inc., a biopharmaceutical company, were top absolute detractors during the period.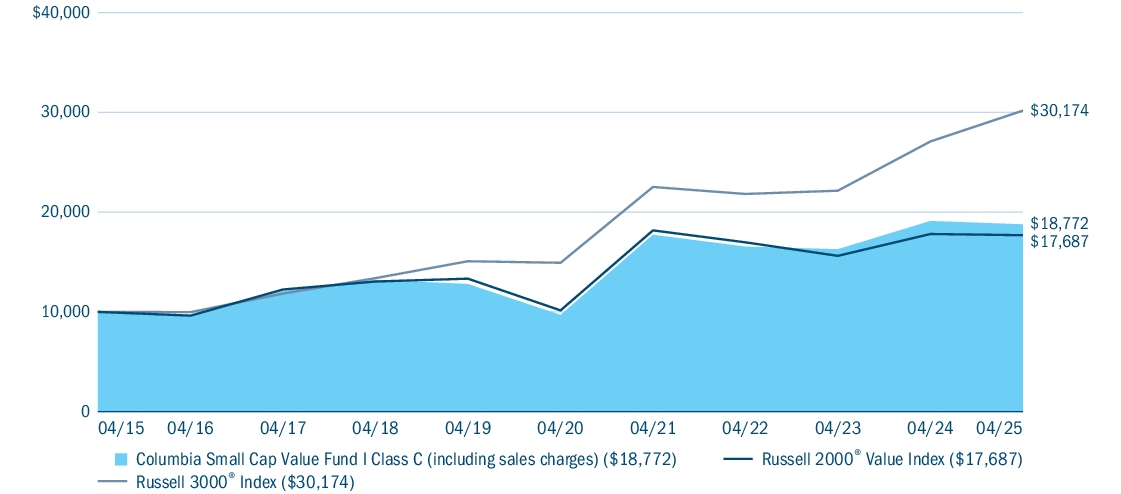
| Average Annual Total Returns (%) | 1 year | 5 years | 10 years |
| Class C (excluding sales charges) | (1.76 ) |
14.14 | 6.50 |
| Class C (including sales charges) | (2.63 ) |
14.14 | 6.50 |
| Russell 2000® Value Index | (0.68 ) |
11.74 | 5.87 |
| Russell 3000 ® Index (a) |
11.40 | 15.12 | 11.68 |
|
(a)
|
Effective August 1, 2024, the Fund compares its performance to the Russell 3000 ® Index, a broad-based performance index as required by new regulatory requirements. The Fund’s performance also continues to be compared to its prior benchmark, which management believes more closely represents the market sectors and/or asset classes in which the Fund primarily invests. |
®
Index, a broad-based performance index as required by new regulatory requirements.
columbiathreadneedleus.com/investment-products/mutual-funds
for more recent performance information.
Key F
u
nd Statistics| Fund net assets | $ 1,436,927,343 |
| Total number of portfolio holdings | 216 |
| Management services fees (represents 0.80% of Fund average net assets) |
$ 12,206,095 |
| Portfolio turnover for the reporting period | 72% |
Graphical Representation of Fund Holdings
The tables below show the investment makeup of the Fund represented as a percentage of Fund net assets. Derivatives are excluded from the ta
bl
es unless otherwise noted. The Fund's portfolio composition is subject to change.Top Holdings
| National Fuel Gas Co. | 1.6 % |
| Popular, Inc. | 1.4 % |
| Essent Group Ltd. | 1.4 % |
| UGI Corp. | 1.3 % |
| JBT Marel Corp. |
1.3 % |
| Kirby Corp. | 1.3 % |
| StoneX Group, Inc. | 1.3 % |
| Telephone and Data Systems, Inc. | 1.1 % |
| Moog, Inc., Class A | 1.1 % |
| MP Materials Corp. | 1.0 % |
Asset Categories

Equity Sector Allocation
Top Holdings
| National Fuel Gas Co. | 1.6 % |
| Popular, Inc. | 1.4 % |
| Essent Group Ltd. | 1.4 % |
| UGI Corp. | 1.3 % |
| JBT Marel Corp. |
1.3 % |
| Kirby Corp. | 1.3 % |
| StoneX Group, Inc. | 1.3 % |
| Telephone and Data Systems, Inc. | 1.1 % |
| Moog, Inc., Class A | 1.1 % |
| MP Materials Corp. | 1.0 % |
columbiathreadneedleus.com/resources/literature
. You can also request more information by contacting us at 1-800-345-6611.
What were the Fund costs for the reporting period?
(Based on a hypothetical $10,000 investment)
| Class | Cost of a $10,000 investment | Cost paid as a percentage of a $10,000 investment |
| Institutional Class | $ 96 |
0.96 % |
Management's Discussion of Fund Performance
The performance of Institutional Class shares for the period presented is shown in the Average Annual Total Returns table.
Top Performance Contributors
Stock selection
| Selections in the information technology, financials and utilities sectors boosted the Fund’s relative results most during the annual period.Allocations
| Smaller allocations to the energy and health care sectors and a larger allocation to the information technology sector buoyed Fund relative results during the annual period.Individual holdings
| Positions in ThredUp, Inc., an online clothing resale platform; Insmed, Inc., a biopharmaceutical company; Kyndryl Holdings, Inc., an information systems company; Cerence, Inc., a developer of AI assistants for cars; and StoneX Group, Inc., a financial services company, were among the top absolute contributors to Fund performance.Top Performance Detractors
Stock selection
| Selections in the consumer discretionary, consumer staples and real estate sectors hurt the Fund’s relative results during the annual period.Allocations
| Smaller weightings to the financials and utilities sectors and a larger allocation to the consumer discretionary sector detracted from relative performance.Individual holdings
| Fund positions in Synaptics, Inc., a smart tech developer; Tronox Holdings PLC, a chemicals company; Murphy Oil Corp., an oil and natural gas company; KinderCare Learning Cos, Inc., a daycare and preschool operator; and Apellis Pharmaceuticals, Inc., a biopharmaceutical company, were top absolute detractors during the period.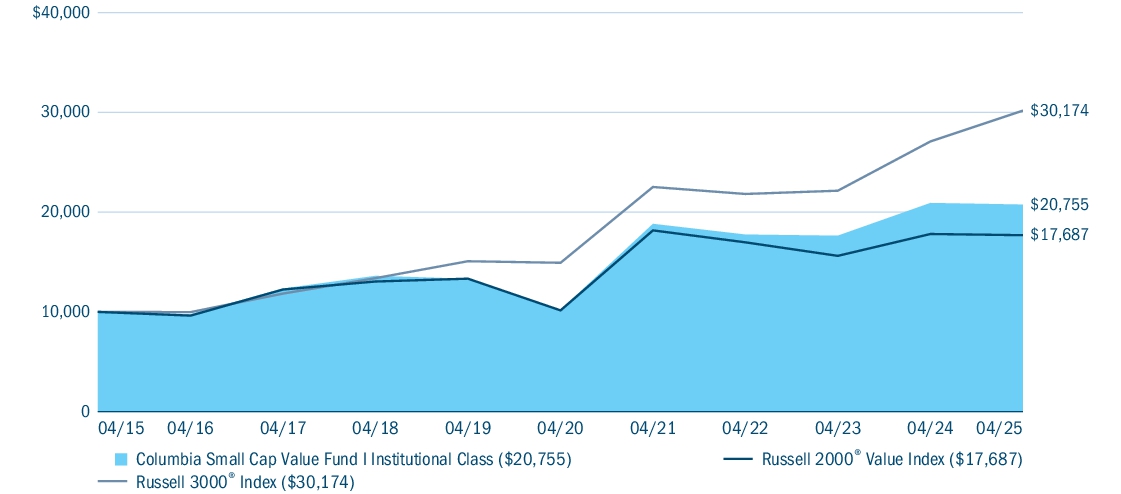
| Average Annual Total Returns (%) | 1 year | 5 years | 10 years |
| Institutional Class | (0.77 ) |
15.29 | 7.58 |
| Russell 2000® Value Index | (0.68 ) |
11.74 | 5.87 |
| Russell 3000 ® Index (a) |
11.40 | 15.12 | 11.68 |
|
(a)
|
Effective August 1, 2024, the Fund compares its performance to the Russell 3000 ® Index, a broad-based performance index as required by new regulatory requirements. The Fund’s performance also continues to be compared to its prior benchmark, which management believes more closely represents the market sectors and/or asset classes in which the Fund primarily invests. |
®
Index, a broad-based performance index as required by new regulatory requirements.
columbiathreadneedleus.com/investment-products/mutual-funds
for more recent performance information.
Key Fu
n
d Statistics| Fund net assets | $ 1,436,927,343 |
| Total number of portfolio holdings | 216 |
| Management services fees (represents 0.80% of Fund average net assets) |
$ 12,206,095 |
| Portfolio turnover for the reporting period | 72% |
Graphical Representation of Fund Holdings
The tables below show the investment makeup of the Fund represented as a percentage of Fund net assets. Derivatives are excluded from the tables unless oth
erw
ise noted. The Fund's portfolio composition is subject to change.Top Holdings
| National Fuel Gas Co. | 1.6 % |
| Popular, Inc. | 1.4 % |
| Essent Group Ltd. | 1.4 % |
| UGI Corp. | 1.3 % |
| JBT Marel Corp. |
1.3 % |
| Kirby Corp. | 1.3 % |
| StoneX Group, Inc. | 1.3 % |
| Telephone and Data Systems, Inc. | 1.1 % |
| Moog, Inc., Class A | 1.1 % |
| MP Materials Corp. | 1.0 % |
Asset Categories

Equity Sector Allocation

Top Holdings
| National Fuel Gas Co. | 1.6 % |
| Popular, Inc. | 1.4 % |
| Essent Group Ltd. | 1.4 % |
| UGI Corp. | 1.3 % |
| JBT Marel Corp. |
1.3 % |
| Kirby Corp. | 1.3 % |
| StoneX Group, Inc. | 1.3 % |
| Telephone and Data Systems, Inc. | 1.1 % |
| Moog, Inc., Class A | 1.1 % |
| MP Materials Corp. | 1.0 % |
columbiathreadneedleus.com/resources/literature
. You can also request more information by contacting us at 1-800-345-6611.
What were the Fund costs for the reporting period?
(Based on a hypothetical $10,000 investment)
| Class | Cost of a $10,000 investment | Cost paid as a percentage of a $10,000 investment |
| Institutional 2 Class | $ 87 |
0.87 % |
Management's Discussion of Fund Performance
The performance of Institutional 2 Class shares for the period presented is shown in the Average Annual Total Returns table.
Top Performance Contributors
Stock selection
| Selections in the information technology, financials and utilities sectors boosted the Fund’s relative results most during the annual period.Allocations
| Smaller allocations to the energy and health care sectors and a larger allocation to the information technology sector buoyed Fund relative results during the annual period.Individual holdings
| Positions in ThredUp, Inc., an online clothing resale platform; Insmed, Inc., a biopharmaceutical company; Kyndryl Holdings, Inc., an information systems company; Cerence, Inc., a developer of AI assistants for cars; and StoneX Group, Inc., a financial services company, were among the top absolute contributors to Fund performance.Top Performance Detractors
Stock selection
| Selections in the consumer discretionary, consumer staples and real estate sectors hurt the Fund’s relative results during the annual period.Allocations
| Smaller weightings to the financials and utilities sectors and a larger allocation to the consumer discretionary sector detracted from relative performance.Individual holdings
| Fund positions in Synaptics, Inc., a smart tech developer; Tronox Holdings PLC, a chemicals company; Murphy Oil Corp., an oil and natural gas company; KinderCare Learning Cos, Inc., a daycare and preschool operator; and Apellis Pharmaceuticals, Inc., a biopharmaceutical company, were top absolute detractors during the period.
| Average Annual Total Returns (%) | 1 year | 5 years | 10 years |
| Institutional 2 Class | (0.67 ) |
15.41 | 7.70 |
| Russell 2000® Value Index | (0.68 ) |
11.74 | 5.87 |
| Russell 3000 ® Index (a) |
11.40 | 15.12 | 11.68 |
|
(a)
|
Effective August 1, 2024, the Fund compares its performance to the Russell 3000 ® Index, a broad-based performance index as required by new regulatory requirements. The Fund’s performance also continues to be compared to its prior benchmark, which management believes more closely represents the market sectors and/or asset classes in which the Fund primarily invests. |
®
Index, a broad-based performance index as required by new regulatory requirements.
columbiathreadneedleus.com/investment-products/mutual-funds
for more recent performance information.
Key Fund S
ta
tistics| Fund net assets | $ 1,436,927,343 |
| Total number of portfolio holdings | 216 |
| Management services fees (represents 0.80% of Fund average net assets) |
$ 12,206,095 |
| Portfolio turnover for the reporting period | 72% |
Graphical Representation of Fund Holdings
The tables below show the investment makeup of the Fund represented as a percentage of Fund net assets. Derivatives are excluded from the tables u
nle
ss otherwise noted. The Fund's portfolio composition is subject to change.Top Holdings
| National Fuel Gas Co. | 1.6 % |
| Popular, Inc. | 1.4 % |
| Essent Group Ltd. | 1.4 % |
| UGI Corp. | 1.3 % |
| JBT Marel Corp. |
1.3 % |
| Kirby Corp. | 1.3 % |
| StoneX Group, Inc. | 1.3 % |
| Telephone and Data Systems, Inc. | 1.1 % |
| Moog, Inc., Class A | 1.1 % |
| MP Materials Corp. | 1.0 % |
Asset Categories

Equity Sector Allocation

Top Holdings
| National Fuel Gas Co. | 1.6 % |
| Popular, Inc. | 1.4 % |
| Essent Group Ltd. | 1.4 % |
| UGI Corp. | 1.3 % |
| JBT Marel Corp. |
1.3 % |
| Kirby Corp. | 1.3 % |
| StoneX Group, Inc. | 1.3 % |
| Telephone and Data Systems, Inc. | 1.1 % |
| Moog, Inc., Class A | 1.1 % |
| MP Materials Corp. | 1.0 % |
annual shareholder report
contains important information about Columbia Small Cap Value Fund I (the Fund) for the period of May 1, 2024 to April 30, 2025.
columbiathreadneedleus.com/resources/literature
. You can also request more information by contacting us at 1-800-345-6611.
What were the Fund costs for the reporting period?
(Based on a hypothetical $10,000 investment)
| Class | Cost of a $10,000 investment | Cost paid as a percentage of a $10,000 investment |
| Institutional 3 Class | $ 82 |
0.82 % |
Management's Discussion of Fund Performance
The performance of Institutional 3 Class shares for the period presented is shown in the Average Annual Total Returns table.
Top Performance Contributors
Stock selection
| Selections in the information technology, financials and utilities sectors boosted the Fund’s relative results most during the annual period.Allocations
| Smaller allocations to the energy and health care sectors and a larger allocation to the information technology sector buoyed Fund relative results during the annual period.Individual holdings
| Positions in ThredUp, Inc., an online clothing resale platform; Insmed, Inc., a biopharmaceutical company; Kyndryl Holdings, Inc., an information systems company; Cerence, Inc., a developer of AI assistants for cars; and StoneX Group, Inc., a financial services company, were among the top absolute contributors to Fund performance.Top Performance Detractors
Stock selection
| Selections in the consumer discretionary, consumer staples and real estate sectors hurt the Fund’s relative results during the annual period.Allocations
| Smaller weightings to the financials and utilities sectors and a larger allocation to the consumer discretionary sector detracted from relative performance.Individual holdings
| Fund positions in Synaptics, Inc., a smart tech developer; Tronox Holdings PLC, a chemicals company; Murphy Oil Corp., an oil and natural gas company; KinderCare Learning Cos, Inc., a daycare and preschool operator; and Apellis Pharmaceuticals, Inc., a biopharmaceutical company, were top absolute detractors during the period.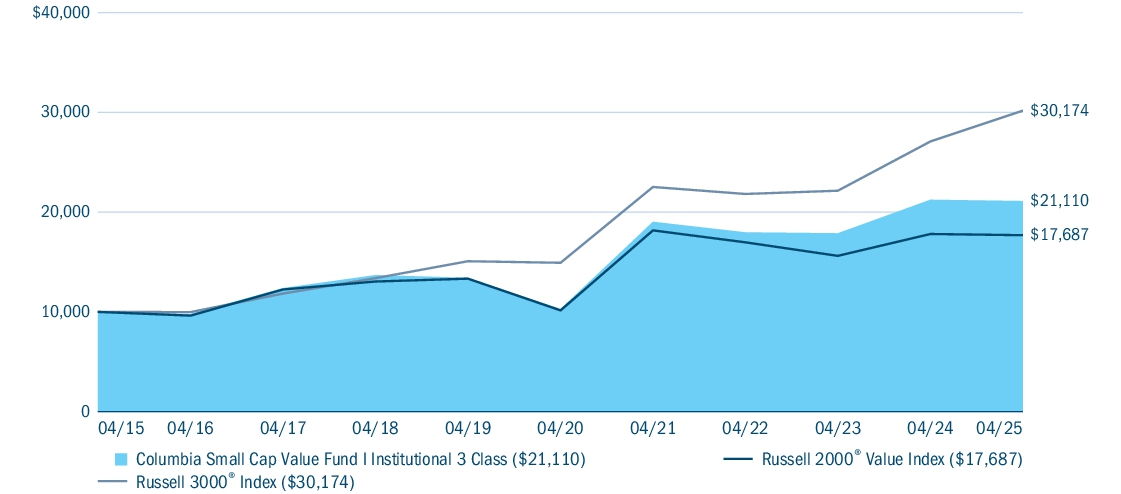
| Average Annual Total Returns (%) | 1 year | 5 years | 10 years |
| Institutional 3 Class | (0.63 ) |
15.46 | 7.76 |
| Russell 2000® Value Index | (0.68 ) |
11.74 | 5.87 |
| Russell 3000 ® Index (a) |
11.40 | 15.12 | 11.68 |
|
(a)
|
Effective August 1, 2024, the Fund compares its performance to the Russell 3000 ® Index, a broad-based performance index as required by new regulatory requirements. The Fund’s performance also continues to be compared to its prior benchmark, which management believes more closely represents the market sectors and/or asset classes in which the Fund primarily invests. |
®
Index, a broad-based performance index as required by new regulatory requirements.
columbiathreadneedleus.com/investment-products/mutual-funds
for more recent performance information.
Key Fund Sta
tis
tics| Fund net assets | $ 1,436,927,343 |
| Total number of portfolio holdings | 216 |
| Management services fees (represents 0.80% of Fund average net assets) |
$ 12,206,095 |
| Portfolio turnover for the reporting period | 72% |
Graphical Representation of Fund Holdings
The tables below show the investment makeup of the Fund represented as a percentage of Fund net assets. Derivatives are excluded from the t
abl
es unless otherwise noted. The Fund's portfolio composition is subject to change.Top Holdings
| National Fuel Gas Co. | 1.6 % |
| Popular, Inc. | 1.4 % |
| Essent Group Ltd. | 1.4 % |
| UGI Corp. | 1.3 % |
| JBT Marel Corp. |
1.3 % |
| Kirby Corp. | 1.3 % |
| StoneX Group, Inc. | 1.3 % |
| Telephone and Data Systems, Inc. | 1.1 % |
| Moog, Inc., Class A | 1.1 % |
| MP Materials Corp. | 1.0 % |
Asset Categories

Equity Sector Allocation

Top Holdings
| National Fuel Gas Co. | 1.6 % |
| Popular, Inc. | 1.4 % |
| Essent Group Ltd. | 1.4 % |
| UGI Corp. | 1.3 % |
| JBT Marel Corp. |
1.3 % |
| Kirby Corp. | 1.3 % |
| StoneX Group, Inc. | 1.3 % |
| Telephone and Data Systems, Inc. | 1.1 % |
| Moog, Inc., Class A | 1.1 % |
| MP Materials Corp. | 1.0 % |
columbiathreadneedleus.com/resources/literature
. You can also request more information by contacting us at 1-800-345-6611.
What were the Fund costs for the reporting period?
(Based on a hypothetical $10,000 investment)
| Class | Cost of a $10,000 investment | Cost paid as a percentage of a $10,000 investment |
| Class R | $ 145 |
1.46 % |
Management's Discussion of Fund Performance
The performance of Class R shares for the period presented is shown in the Average Annual Total Returns table.
Top Performance Contributors
Stock selection
| Selections in the information technology, financials and utilities sectors boosted the Fund’s relative results most during the annual period.Allocations
| Smaller allocations to the energy and health care sectors and a larger allocation to the information technology sector buoyed Fund relative results during the annual period.Individual holdings
| Positions in ThredUp, Inc., an online clothing resale platform; Insmed, Inc., a biopharmaceutical company; Kyndryl Holdings, Inc., an information systems company; Cerence, Inc., a developer of AI assistants for cars; and StoneX Group, Inc., a financial services company, were among the top absolute contributors to Fund performance.Top Performance Detractors
Stock selection
| Selections in the consumer discretionary, consumer staples and real estate sectors hurt the Fund’s relative results during the annual period.Allocations
| Smaller weightings to the financials and utilities sectors and a larger allocation to the consumer discretionary sector detracted from relative performance.Individual holdings
| Fund positions in Synaptics, Inc., a smart tech developer; Tronox Holdings PLC, a chemicals company; Murphy Oil Corp., an oil and natural gas company; KinderCare Learning Cos, Inc., a daycare and preschool operator; and Apellis Pharmaceuticals, Inc., a biopharmaceutical company, were top absolute detractors during the period.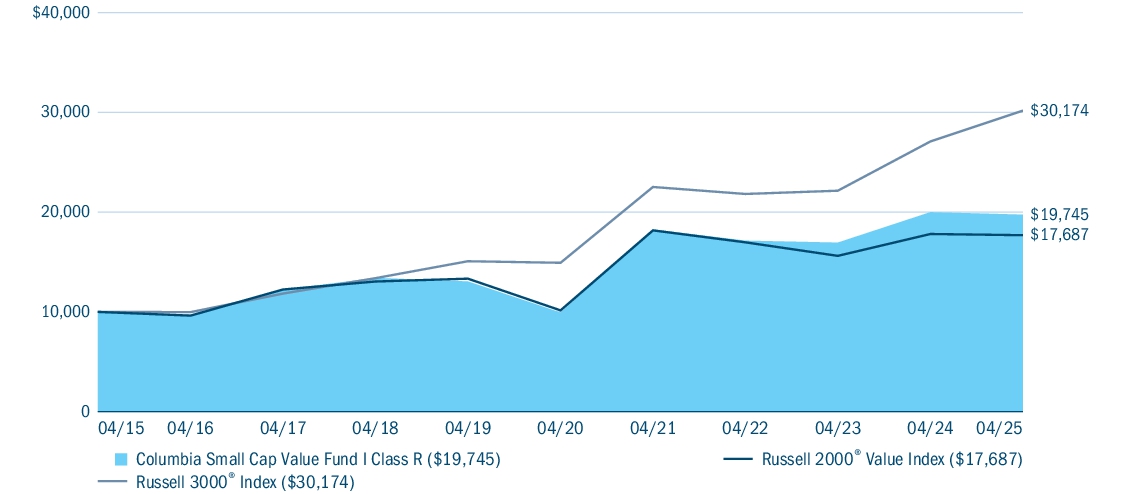
| Average Annual Total Returns (%) | 1 year | 5 years | 10 years |
| Class R | (1.25 ) |
14.72 | 7.04 |
| Russell 2000® Value Index | (0.68 ) |
11.74 | 5.87 |
| Russell 3000 ® Index (a) |
11.40 | 15.12 | 11.68 |
|
(a)
|
Effective August 1, 2024, the Fund compares its performance to the Russell 3000 ® Index, a broad-based performance index as required by new regulatory requirements. The Fund’s performance also continues to be compared to its prior benchmark, which management believes more closely represents the market sectors and/or asset classes in which the Fund primarily invests. |
®
Index, a broad-based performance index as required by new regulatory requirements.
columbiathreadneedleus.com/investment-products/mutual-funds
for more recent performance information.
Key Fund St
ati
stics| Fund net assets | $ 1,436,927,343 |
| Total number of portfolio holdings | 216 |
| Management services fees (represents 0.80% of Fund average net assets) |
$ 12,206,095 |
| Portfolio turnover for the reporting period | 72% |
Graphical Representation of Fund Holdings
The tables below show the investment makeup of the Fund represented as a percentage of Fund net assets. Derivatives are excluded from the tables unless
other
wise noted. The Fund's portfolio composition is subject to change.Top Holdings
| National Fuel Gas Co. | 1.6 % |
| Popular, Inc. | 1.4 % |
| Essent Group Ltd. | 1.4 % |
| UGI Corp. | 1.3 % |
| JBT Marel Corp. |
1.3 % |
| Kirby Corp. | 1.3 % |
| StoneX Group, Inc. | 1.3 % |
| Telephone and Data Systems, Inc. | 1.1 % |
| Moog, Inc., Class A | 1.1 % |
| MP Materials Corp. | 1.0 % |
Asset Categories

Equity Sector Allocation

Top Holdings
| National Fuel Gas Co. | 1.6 % |
| Popular, Inc. | 1.4 % |
| Essent Group Ltd. | 1.4 % |
| UGI Corp. | 1.3 % |
| JBT Marel Corp. |
1.3 % |
| Kirby Corp. | 1.3 % |
| StoneX Group, Inc. | 1.3 % |
| Telephone and Data Systems, Inc. | 1.1 % |
| Moog, Inc., Class A | 1.1 % |
| MP Materials Corp. | 1.0 % |
columbiathreadneedleus.com/resources/literatur
e1-800-345-6611.
What were the Fund costs for the reporting period?
(Based on a hypothetical $10,000 investment)
| Class | Cost of a $10,000 investment | Cost paid as a percentage of a $10,000 investment |
| Class S | $ 52(a) |
0.95 % (b) |
(a) |
Based on operations from October 2, 2024 (commencement of operations) through the stated period end. Had the class been open for the entire reporting period, expenses shown in the table above would have been higher. |
(b) |
Annualized. |
Management's Discussion of Fund Performance
The performance of Class S shares for the period presented is shown in the Average Annual Total Returns table.
Top Performance Contributors
Stock selection
| Selections in the information technology, financials and utilities sectors boosted the Fund’s relative results most during the annual period.Allocations
| Smaller allocations to the energy and health care sectors and a larger allocation to the information technology sector buoyed Fund relative results during the annual period.Individual holdings
| Positions in ThredUp, Inc., an online clothing resale platform; Insmed, Inc., a biopharmaceutical company; Kyndryl Holdings, Inc., an information systems company; Cerence, Inc., a developer of AI assistants for cars; and StoneX Group, Inc., a financial services company, were among the top absolute contributors to Fund performance.Top Performance Detractors
Stock selection
| Selections in the consumer discretionary, consumer staples and real estate sectors hurt the Fund’s relative results during the annual period.Allocations
| Smaller weightings to the financials and utilities sectors and a larger allocation to the consumer discretionary sector detracted from relative performance.Individual holdings
| Fund positions in Synaptics, Inc., a smart tech developer; Tronox Holdings PLC, a chemicals company; Murphy Oil Corp., an oil and natural gas company; KinderCare Learning Cos, Inc., a daycare and preschool operator; and Apellis Pharmaceuticals, Inc., a biopharmaceutical company, were top absolute detractors during the period.
| Average Annual Total Returns (%) | 1 year | 5 years | 10 years |
| Class S (a) |
(0.87 ) |
15.04 | 7.32 |
| Russell 2000® Value Index | (0.68 ) |
11.74 | 5.87 |
| Russell 3000 ® Index (b) |
11.40 | 15.12 | 11.68 |
|
(a)
|
The returns shown for periods prior to October 2, 2024 (including Since Fund Inception returns, if shown) include the returns of Class A. These returns are adjusted to reflect any higher class-related operating expenses of the newer share classes, as applicable. Please visit columbiathreadneedleus.com/investment-products/mutual-funds/appended-performance |
|
(b)
|
Effective August 1, 2024, the Fund compares its performance to the Russell 3000 ® Index, a broad-based performance index as required by new regulatory requirements. The Fund’s performance also continues to be compared to its prior benchmark, which management believes more closely represents the market sectors and/or asset classes in which the Fund primarily invests. |
®
Index, a broad-based performance index as required by new regulatory requirements.
columbiathreadneedleus.com/investment-products/mutual-funds
for more recent performance information.
Key Fund S
tat
istics| Fund net assets | $ 1,436,927,343 |
| Total number of portfolio holdings | 216 |
| Management services fees (represents 0.80% of Fund average net assets) |
$ 12,206,095 |
| Portfolio turnover for the reporting period | 72% |
Graphical Representation of Fund Holdings
The tables below show the investment makeup of the Fund represented as a percentage of Fund net assets. Derivatives are excluded from the tables unless oth
erwi
se noted. The Fund's portfolio composition is subject to change.Top Holdings
| National Fuel Gas Co. | 1.6 % |
| Popular, Inc. | 1.4 % |
| Essent Group Ltd. | 1.4 % |
| UGI Corp. | 1.3 % |
| JBT Marel Corp. |
1.3 % |
| Kirby Corp. | 1.3 % |
| StoneX Group, Inc. | 1.3 % |
| Telephone and Data Systems, Inc. | 1.1 % |
| Moog, Inc., Class A | 1.1 % |
| MP Materials Corp. | 1.0 % |
Asset Categories

Equity Sector Allocation

Top Holdings
| National Fuel Gas Co. | 1.6 % |
| Popular, Inc. | 1.4 % |
| Essent Group Ltd. | 1.4 % |
| UGI Corp. | 1.3 % |
| JBT Marel Corp. |
1.3 % |
| Kirby Corp. | 1.3 % |
| StoneX Group, Inc. | 1.3 % |
| Telephone and Data Systems, Inc. | 1.1 % |
| Moog, Inc., Class A | 1.1 % |
| MP Materials Corp. | 1.0 % |
| [1] | Based on operations from October 2, 2024 (commencement of operations) through the stated period end. Had the class been open for the entire reporting period, expenses shown in the table above would have been higher. |
| [2] | Annualized. |