Shareholder Report
Apr. 30, 2025
USD ($)
Holding
columbiathreadneedleus.com/resources/literature
. You can also request more information by contacting us at 1-800-345-6611.
What were the Fund costs for the reporting period?
(Based on a hypothetical $10,000 investment)
| Class | Cost of a $10,000 investment | Cost paid as a percentage of a $10,000 investment |
| Class A | $ 73 | 0.73 % |
Management's Discussion of Fund Performance
The performance of Class A shares for the period presented is shown in the Average Annual Total Returns table.
Top Performance Contributors
Security selection
| Strong security selection in education, airport, local general obligation (GO) and special tax bonds contributed to Fund performance relative to the benchmark.Credit quality allocation
| Credit quality allocation added to the Fund’s relative performance. Overweights to higher yielding, lower rated A, BBB and non-rated bonds and an underweight to AA bonds added to performance during a period in which investors favored the income generated by higher yielding bonds.Credit quality selection
| Positive contributions to benchmark-relative performance were driven by security selection in bonds rated AA.Yield curve allocation
| Shorter maturities outperformed longer maturities, with the strongest index returns coming from the 2-4-year range. The portfolio maintained its barbell profile with heavier exposures on the short and long ends. Exposure to the shorter portion (0-2 years) of the barbell produced the strongest returns, topping all maturity buckets in the index.Top Performance Detractors
Interest rate positioning
| The Fund’s modest underweight to the shortest maturities within the benchmark (2-to-3 years) detracted from relative performance as municipal market interest rates declined in this portion of the curve. An overweight position to the long end of the curve detracted from relative performance, as market rates in this space moved markedly higher.Sector allocations
| Underweight positions in pre-paid gas and state general obligation (GO) bonds detracted from relative performance.Credit quality selection
| Security selection in BBB and single-A rated bonds detracted from relative performance, with selection in BBB rated charter schools and 10-year single-A airport bonds, and the timing of prepay natural gas bonds notable detractors.Security Selection
| Selection in single-A rated Los Angeles Department of Water and Power bonds, which were impacted by the fires in early 2025, detracted from relative performance.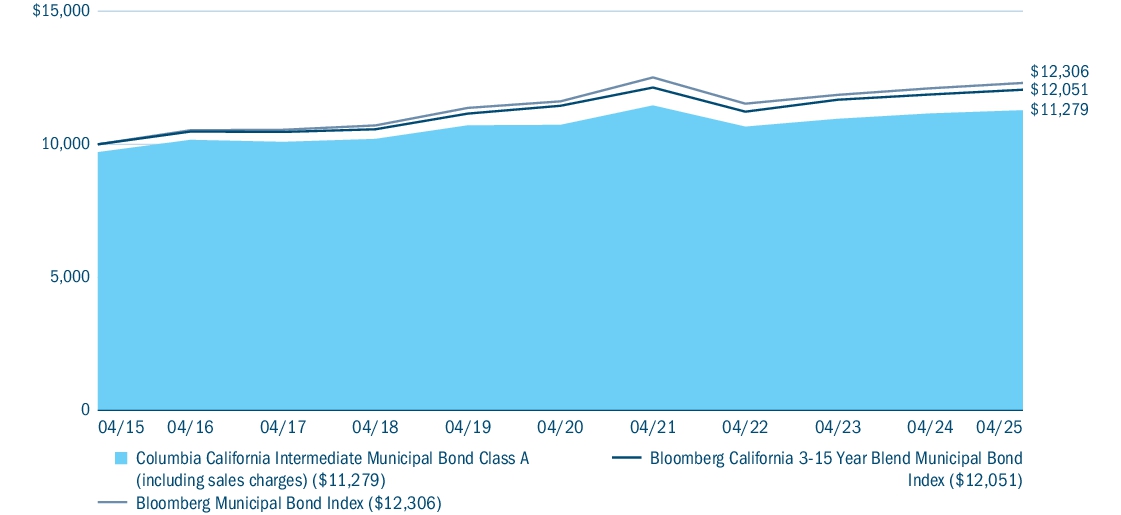
| Average Annual Total Returns (%) | 1 year | 5 years | 10 years |
| Class A (excluding sales charges) | 1.08 | 1.00 | 1.52 |
| Class A (including sales charges) | (1.94 ) | 0.39 | 1.21 |
| Bloomberg California 3-15 Year Blend Municipal Bond Index | 1.50 | 1.03 | 1.88 |
| Bloomberg Municipal Bond Index (a) | 1.66 | 1.17 | 2.10 |
(a) | Effective August 1, 2024, the Fund compares its performance to the Bloomberg Municipal Bond Index, a broad-based performance index, as required by new regulatory requirements. The Fund’s performance also continues to be compared to its prior benchmarks, which management believes more closely represent the market sectors/and or asset classes in which the Fund primarily invests. |
columbiathreadneedleus.com/investment-products/mutual-funds
for more recent performance information.
Key Fund Statistics
| Fund net assets | $ 292,380,359 |
| Total number of portfolio holdings | 219 |
| Management services fees (represents 0.47% of Fund average net assets) | $ 1,409,905 |
| Portfolio turnover for the reporting period | 16% |
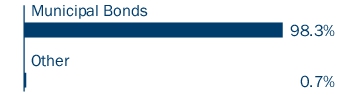
Graphical Representation of Fund Holdings
The tables below show the investment makeup of the Fund represented as a percentage of Fund net assets. Derivatives are excluded from the tables unless otherwise noted. The Fund's portfolio composition is subject to change.
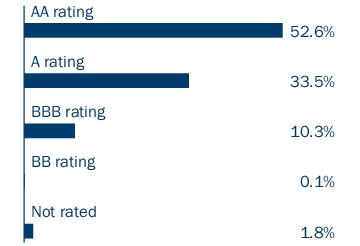
Bond ratings on Fund holdings are divided into categories ranging from highest to lowest credit quality, determined by using the middle rating of Moody’s Ratings, S&P and Fitch, after dropping the highest and lowest available ratings. When ratings are available from only two rating agencies, the lower rating is used. When a rating is available from only one rating agency, that rating is used. If a security is not rated by Moody's Ratings, S&P or Fitch, but has a rating by Kroll and/or DBRS, the same methodology is applied to those bonds that would otherwise be not rated. When a bond is not rated by any rating agency, it is designated as “Not rated.” Credit quality ratings assigned by a rating agency are subjective opinions, not statements of fact, and are subject to change, including daily.
Top Holdings
| Southern California Public Power Authority 04/01/2055 5.000% | 2.1 % |
| Los Angeles Department of Water & Power 07/01/2041 5.000% | 2.1 % |
| California State Public Works Board 08/01/2036 5.000% | 1.9 % |
| Burbank-Glendale-Pasadena Airport Authority Brick Campaign 07/01/2044 5.250% | 1.8 % |
| State of California 08/01/2044 5.250% | 1.5 % |
| California State University 11/01/2042 5.000% | 1.5 % |
| Los Angeles Unified School District 07/01/2032 5.000% | 1.4 % |
| Golden State Tobacco Securitization Corp. 06/01/2033 5.000% | 1.4 % |
| Foothill-Eastern Transportation Corridor Agency 01/15/2033 0.000% | 1.3 % |
| Southern California Public Power Authority 07/01/2041 5.000% | 1.3 % |
Asset Categories

Credit Quality

Top Holdings
| Southern California Public Power Authority 04/01/2055 5.000% | 2.1 % |
| Los Angeles Department of Water & Power 07/01/2041 5.000% | 2.1 % |
| California State Public Works Board 08/01/2036 5.000% | 1.9 % |
| Burbank-Glendale-Pasadena Airport Authority Brick Campaign 07/01/2044 5.250% | 1.8 % |
| State of California 08/01/2044 5.250% | 1.5 % |
| California State University 11/01/2042 5.000% | 1.5 % |
| Los Angeles Unified School District 07/01/2032 5.000% | 1.4 % |
| Golden State Tobacco Securitization Corp. 06/01/2033 5.000% | 1.4 % |
| Foothill-Eastern Transportation Corridor Agency 01/15/2033 0.000% | 1.3 % |
| Southern California Public Power Authority 07/01/2041 5.000% | 1.3 % |
Certain Fund Changes
This is a summary of certain changes to the Fund during the reporting period. For more complete information, you may review the Fund’s prospectus, which is available at
columbiathreadneedleus.com/resources/literature
or upon request at 1-800-345-6611
.Effective August 1, 2024, the Fund amended its Prospectus’ Principal Investment Strategies to reflect that the Fund may enter into tender option bond (TOB) transactions and may invest in derivatives, such as floating rate municipal securities (floaters) and inverse floating rate municipal securities (inverse floaters) to add incremental income, futures (including interest rate and Treasury bond futures) to manage duration and hedge against changes in interest rates, and swaps, including Municipal Market Data Rate Locks (MMD Rate Locks) to manage duration and hedge against changes in interest rates. In addition, the Fund amended its Prospectus’ Principal Risks to include disclosure of the risks associated with investing in these instruments and derivatives generally.
columbiathreadneedleus.com/resources/literature
or upon request at 1-800-345-6611
.
columbiathreadneedleus.com/resources/literature
. You can also request more information by contacting us at 1-800-345-6611.
What were the Fund costs for the reporting period?
(Based on a hypothetical $10,000 investment)
| Class | Cost of a $10,000 investment | Cost paid as a percentage of a $10,000 investment |
| Institutional Class | $ 48 | 0.48 % |
Management's Discussion of Fund Performance
The performance of Institutional Class shares for the period presented is shown in the Average Annual Total Returns table.
Top Performance Contributors
Security selection
| Strong security selection in education, airport, local general obligation (GO) and special tax bonds contributed to Fund performance relative to the benchmark.Credit quality allocation
| Credit quality allocation added to the Fund’s relative performance. Overweights to higher yielding, lower rated A, BBB and non-rated bonds and an underweight to AA bonds added to performance during a period in which investors favored the income generated by higher yielding bonds.Credit quality selection
| Positive contributions to benchmark-relative performance were driven by security selection in bonds rated AA.Yield curve allocation
| Shorter maturities outperformed longer maturities, with the strongest index returns coming from the 2-4-year range. The portfolio maintained its barbell profile with heavier exposures on the short and long ends. Exposure to the shorter portion (0-2 years) of the barbell produced the strongest returns, topping all maturity buckets in the index.Top Performance Detractors
Interest rate positioning
| The Fund’s modest underweight to the shortest maturities within the benchmark (2-to-3 years) detracted from relative performance as municipal market interest rates declined in this portion of the curve. An overweight position to the long end of the curve detracted from relative performance, as market rates in this space moved markedly higher.Sector allocations
| Underweight positions in pre-paid gas and state general obligation (GO) bonds detracted from relative performance.Credit quality selection
| Security selection in BBB and single-A rated bonds detracted from relative performance, with selection in BBB rated charter schools and 10-year single-A airport bonds, and the timing of prepay natural gas bonds notable detractors.Security Selection
| Selection in single-A rated Los Angeles Department of Water and Power bonds, which were impacted by the fires in early 2025, detracted from relative performance.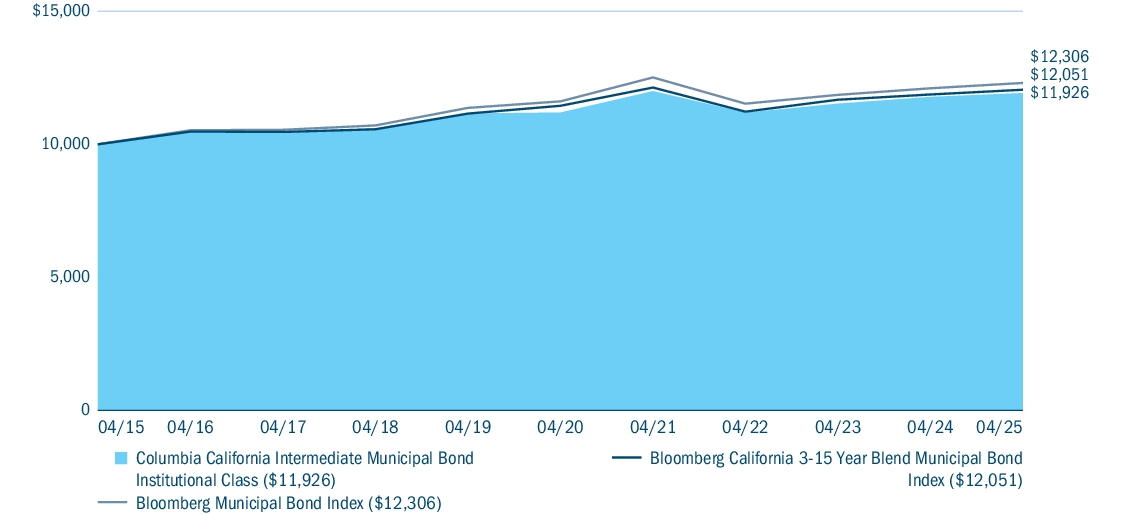
| Average Annual Total Returns (%) | 1 year | 5 years | 10 years |
| Institutional Class | 1.22 | 1.27 | 1.78 |
| Bloomberg California 3-15 Year Blend Municipal Bond Index | 1.50 | 1.03 | 1.88 |
| Bloomberg Municipal Bond Index (a) | 1.66 | 1.17 | 2.10 |
(a) | Effective August 1, 2024, the Fund compares its performance to the Bloomberg Municipal Bond Index, a broad-based performance index, as required by new regulatory requirements. The Fund’s performance also continues to be compared to its prior benchmarks, which management believes more closely represent the market sectors/and or asset classes in which the Fund primarily invests. |
columbiathreadneedleus.com/investment-products/mutual-funds
for more recent performance information.
| Fund net assets | $ 292,380,359 |
| Total number of portfolio holdings | 219 |
| Management services fees (represents 0.47% of Fund average net assets) | $ 1,409,905 |
| Portfolio turnover for the reporting period | 16% |
Graphical Representation of Fund Holdings
The tables below show the investment makeup of the Fund represented as a percentage of Fund net assets. Derivatives are excluded from the tables unless otherwise noted. The Fund's portfolio composition is subject to change.
Bond ratings on Fund holdings are divided into categories ranging from highest to lowest credit quality, determined by using the middle rating of Moody’s Ratings, S&P and Fitch, after dropping the highest and lowest available ratings. When ratings are available from only two rating agencies, the lower rating is used. When a rating is available from only one rating agency, that rating is used. If a security is not rated by Moody's Ratings, S&P or Fitch, but has a rating by Kroll and/or DBRS, the same methodology is applied to those bonds that would otherwise be not rated. When a bond is not rated by any rating agency, it is designated as “Not rated.” Credit quality ratings assigned by a rating agency are subjective opinions, not statements of fact, and are subject to change, including daily.
Top Holdings
| Southern California Public Power Authority 04/01/2055 5.000% | 2.1 % |
| Los Angeles Department of Water & Power 07/01/2041 5.000% | 2.1 % |
| California State Public Works Board 08/01/2036 5.000% | 1.9 % |
| Burbank-Glendale-Pasadena Airport Authority Brick Campaign 07/01/2044 5.250% | 1.8 % |
| State of California 08/01/2044 5.250% | 1.5 % |
| California State University 11/01/2042 5.000% | 1.5 % |
| Los Angeles Unified School District 07/01/2032 5.000% | 1.4 % |
| Golden State Tobacco Securitization Corp. 06/01/2033 5.000% | 1.4 % |
| Foothill-Eastern Transportation Corridor Agency 01/15/2033 0.000% | 1.3 % |
| Southern California Public Power Authority 07/01/2041 5.000% | 1.3 % |
Asset Categories

Credit Quality

Top Holdings
| Southern California Public Power Authority 04/01/2055 5.000% | 2.1 % |
| Los Angeles Department of Water & Power 07/01/2041 5.000% | 2.1 % |
| California State Public Works Board 08/01/2036 5.000% | 1.9 % |
| Burbank-Glendale-Pasadena Airport Authority Brick Campaign 07/01/2044 5.250% | 1.8 % |
| State of California 08/01/2044 5.250% | 1.5 % |
| California State University 11/01/2042 5.000% | 1.5 % |
| Los Angeles Unified School District 07/01/2032 5.000% | 1.4 % |
| Golden State Tobacco Securitization Corp. 06/01/2033 5.000% | 1.4 % |
| Foothill-Eastern Transportation Corridor Agency 01/15/2033 0.000% | 1.3 % |
| Southern California Public Power Authority 07/01/2041 5.000% | 1.3 % |
Certain Fund Changes
This is a summary of certain changes to the Fund during the reporting period. For more complete information, you may review the Fund’s prospectus, which is available at
columbiathreadneedleus.com/resources/literature
or upon request at 1-800-345-6611
.Effective August 1, 2024, the Fund amended its Prospectus’ Principal Investment Strategies to reflect that the Fund may enter into tender option bond (TOB) transactions and may invest in derivatives, such as floating rate municipal securities (floaters) and inverse floating rate municipal securities (inverse floaters) to add incremental income, futures (including interest rate and Treasury bond futures) to manage duration and hedge against changes in interest rates, and swaps, including Municipal Market Data Rate Locks (MMD Rate Locks) to manage duration and hedge against changes in interest rates. In addition, the Fund amended its Prospectus’ Principal Risks to include disclosure of the risks associated with investing in these instruments and derivatives generally.
columbiathreadneedleus.com/resources/literature
or upon request at 1-800-345-6611
.
columbiathreadneedleus.com/resources/literature
. You can also request more information by contacting us at 1-800-345-6611.
What were the Fund costs for the reporting period?
(Based on a hypothetical $10,000 investment)
| Class | Cost of a $10,000 investment | Cost paid as a percentage of a $10,000 investment |
| Institutional 2 Class | $ 47 | 0.47 % |
Management's Discussion of Fund Performance
The performance of Institutional 2 Class shares for the period presented is shown in the Average Annual Total Returns table.
Top Performance Contributors
Security selection
| Strong security selection in education, airport, local general obligation (GO) and special tax bonds contributed to Fund performance relative to the benchmark.Credit quality allocation
| Credit quality allocation added to the Fund’s relative performance. Overweights to higher yielding, lower rated A, BBB and non-rated bonds and an underweight to AA bonds added to performance during a period in which investors favored the income generated by higher yielding bonds.Credit quality selection
| Positive contributions to benchmark-relative performance were driven by security selection in bonds rated AA.Yield curve allocation
| Shorter maturities outperformed longer maturities, with the strongest index returns coming from the 2-4-year range. The portfolio maintained its barbell profile with heavier exposures on the short and long ends. Exposure to the shorter portion (0-2 years) of the barbell produced the strongest returns, topping all maturity buckets in the index.Top Performance Detractors
Interest rate positioning
| The Fund’s modest underweight to the shortest maturities within the benchmark (2-to-3 years) detracted from relative performance as municipal market interest rates declined in this portion of the curve. An overweight position to the long end of the curve detracted from relative performance, as market rates in this space moved markedly higher.Sector allocations
| Underweight positions in pre-paid gas and state general obligation (GO) bonds detracted from relative performance.Credit quality selection
| Security selection in BBB and single-A rated bonds detracted from relative performance, with selection in BBB rated charter schools and 10-year single-A airport bonds, and the timing of prepay natural gas bonds notable detractors.Security Selection
| Selection in single-A rated Los Angeles Department of Water and Power bonds, which were impacted by the fires in early 2025, detracted from relative performance.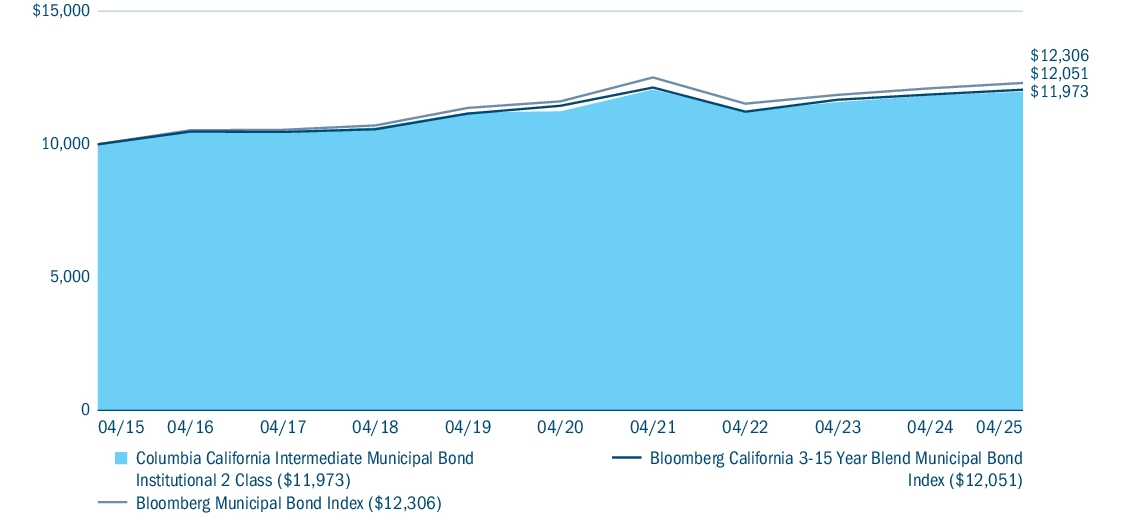
| Average Annual Total Returns (%) | 1 year | 5 years | 10 years |
| Institutional 2 Class | 1.23 | 1.28 | 1.82 |
| Bloomberg California 3-15 Year Blend Municipal Bond Index | 1.50 | 1.03 | 1.88 |
| Bloomberg Municipal Bond Index (a) | 1.66 | 1.17 | 2.10 |
(a) | Effective August 1, 2024, the Fund compares its performance to the Bloomberg Municipal Bond Index, a broad-based performance index, as required by new regulatory requirements. The Fund’s performance also continues to be compared to its prior benchmarks, which management believes more closely represent the market sectors/and or asset classes in which the Fund primarily invests. |
columbiathreadneedleus.com/investment-products/mutual-funds
for more recent performance information.
| Fund net assets | $ 292,380,359 |
| Total number of portfolio holdings | 219 |
| Management services fees (represents 0.47% of Fund average net assets) | $ 1,409,905 |
| Portfolio turnover for the reporting period | 16% |
Graphical Representation of Fund Holdings
The tables below show the investment makeup of the Fund represented as a percentage of Fund net assets. Derivatives are excluded from the tables unless otherwise noted. The Fund's portfolio composition is subject to change.
Bond ratings on Fund holdings are divided into categories ranging from highest to lowest credit quality, determined by using the middle rating of Moody’s Ratings, S&P and Fitch, after dropping the highest and lowest available ratings. When ratings are available from only two rating agencies, the lower rating is used. When a rating is available from only one rating agency, that rating is used. If a security is not rated by Moody's Ratings, S&P or Fitch, but has a rating by Kroll and/or DBRS, the same methodology is applied to those bonds that would otherwise be not rated. When a bond is not rated by any rating agency, it is designated as “Not rated.” Credit quality ratings assigned by a rating agency are subjective opinions, not statements of fact, and are subject to change, including daily.
Top Holdings
| Southern California Public Power Authority 04/01/2055 5.000% | 2.1 % |
| Los Angeles Department of Water & Power 07/01/2041 5.000% | 2.1 % |
| California State Public Works Board 08/01/2036 5.000% | 1.9 % |
| Burbank-Glendale-Pasadena Airport Authority Brick Campaign 07/01/2044 5.250% | 1.8 % |
| State of California 08/01/2044 5.250% | 1.5 % |
| California State University 11/01/2042 5.000% | 1.5 % |
| Los Angeles Unified School District 07/01/2032 5.000% | 1.4 % |
| Golden State Tobacco Securitization Corp. 06/01/2033 5.000% | 1.4 % |
| Foothill-Eastern Transportation Corridor Agency 01/15/2033 0.000% | 1.3 % |
| Southern California Public Power Authority 07/01/2041 5.000% | 1.3 % |
Asset Categories

Credit Quality

Top Holdings
| Southern California Public Power Authority 04/01/2055 5.000% | 2.1 % |
| Los Angeles Department of Water & Power 07/01/2041 5.000% | 2.1 % |
| California State Public Works Board 08/01/2036 5.000% | 1.9 % |
| Burbank-Glendale-Pasadena Airport Authority Brick Campaign 07/01/2044 5.250% | 1.8 % |
| State of California 08/01/2044 5.250% | 1.5 % |
| California State University 11/01/2042 5.000% | 1.5 % |
| Los Angeles Unified School District 07/01/2032 5.000% | 1.4 % |
| Golden State Tobacco Securitization Corp. 06/01/2033 5.000% | 1.4 % |
| Foothill-Eastern Transportation Corridor Agency 01/15/2033 0.000% | 1.3 % |
| Southern California Public Power Authority 07/01/2041 5.000% | 1.3 % |
Certain Fund Changes
This is a summary of certain changes to the Fund during the reporting period. For more complete information, you may review the Fund’s prospectus, which is available at
columbiathreadneedleus.com/resources/literature
or upon request at 1-800-345-6611
.Effective August 1, 2024, the Fund amended its Prospectus’ Principal Investment Strategies to reflect that the Fund may enter into tender option bond (TOB) transactions and may invest in derivatives, such as floating rate municipal securities (floaters) and inverse floating rate municipal securities (inverse floaters) to add incremental income, futures (including interest rate and Treasury bond futures) to manage duration and hedge against changes in interest rates, and swaps, including Municipal Market Data Rate Locks (MMD Rate Locks) to manage duration and hedge against changes in interest rates. In addition, the Fund amended its Prospectus’ Principal Risks to include disclosure of the risks associated with investing in these instruments and derivatives generally.
columbiathreadneedleus.com/resources/literature
or upon request at 1-800-345-6611
.
columbiathreadneedleus.com/resources/literature
. You can also request more information by contacting us at 1-800-345-6611.
What were the Fund costs for the reporting period?
(Based on a hypothetical $10,000 investment)
| Class | Cost of a $10,000 investment | Cost paid as a percentage of a $10,000 investment |
| Institutional 3 Class | $ 42 | 0.42 % |
Management's Discussion of Fund Performance
The performance of Institutional 3 Class shares for the period presented is shown in the Average Annual Total Returns table.
Top Performance Contributors
Security selection
| Strong security selection in education, airport, local general obligation (GO) and special tax bonds contributed to Fund performance relative to the benchmark.Credit quality allocation
| Credit quality allocation added to the Fund’s relative performance. Overweights to higher yielding, lower rated A, BBB and non-rated bonds and an underweight to AA bonds added to performance during a period in which investors favored the income generated by higher yielding bonds.Credit quality selection
| Positive contributions to benchmark-relative performance were driven by security selection in bonds rated AA.Yield curve allocation
| Shorter maturities outperformed longer maturities, with the strongest index returns coming from the 2-4-year range. The portfolio maintained its barbell profile with heavier exposures on the short and long ends. Exposure to the shorter portion (0-2 years) of the barbell produced the strongest returns, topping all maturity buckets in the index.Top Performance Detractors
Interest rate positioning
| The Fund’s modest underweight to the shortest maturities within the benchmark (2-to-3 years) detracted from relative performance as municipal market interest rates declined in this portion of the curve. An overweight position to the long end of the curve detracted from relative performance, as market rates in this space moved markedly higher.Sector allocations
| Underweight positions in pre-paid gas and state general obligation (GO) bonds detracted from relative performance.Credit quality selection
| Security selection in BBB and single-A rated bonds detracted from relative performance, with selection in BBB rated charter schools and 10-year single-A airport bonds, and the timing of prepay natural gas bonds notable detractors.Security Selection
| Selection in single-A rated Los Angeles Department of Water and Power bonds, which were impacted by the fires in early 2025, detracted from relative performance.
| Average Annual Total Returns (%) | 1 year | 5 years | 10 years |
| Institutional 3 Class (a) | 1.28 | 1.33 | 1.85 |
| Bloomberg California 3-15 Year Blend Municipal Bond Index | 1.50 | 1.03 | 1.88 |
| Bloomberg Municipal Bond Index (b) | 1.66 | 1.17 | 2.10 |
(a) | The returns shown for periods prior to March 1, 2017 (including Since Fund Inception returns, if shown) include the returns of Institutional Class. These returns are adjusted to reflect any higher class-related operating expenses of the newer share classes, as applicable. Please visit columbiathreadneedleus.com/investment-products/mutual-funds/appended-performance |
(b) | Effective August 1, 2024, the Fund compares its performance to the Bloomberg Municipal Bond Index, a broad-based performance index, as required by new regulatory requirements. The Fund’s performance also continues to be compared to its prior benchmarks, which management believes more closely represent the market sectors/and or asset classes in which the Fund primarily invests. |
columbiathreadneedleus.com/investment-products/mutual-funds
for more recent performance information.
| Fund net assets | $ 292,380,359 |
| Total number of portfolio holdings | 219 |
| Management services fees (represents 0.47% of Fund average net assets) | $ 1,409,905 |
| Portfolio turnover for the reporting period | 16% |
Graphical Representation of Fund Holdings
The tables below show the investment makeup of the Fund represented as a percentage of Fund net assets. Derivatives are excluded from the tables unless otherwise noted. The Fund's portfolio composition is subject to change.
Bond ratings on Fund holdings are divided into categories ranging from highest to lowest credit quality, determined by using the middle rating of Moody’s Ratings, S&P and Fitch, after dropping the highest and lowest available ratings. When ratings are available from only two rating agencies, the lower rating is used. When a rating is available from only one rating agency, that rating is used. If a security is not rated by Moody's Ratings, S&P or Fitch, but has a rating by Kroll and/or DBRS, the same methodology is applied to those bonds that would otherwise be not rated. When a bond is not rated by any rating agency, it is designated as “Not rated.” Credit quality ratings assigned by a rating agency are subjective opinions, not statements of fact, and are subject to change, including daily.
Top Holdings
| Southern California Public Power Authority 04/01/2055 5.000% | 2.1 % |
| Los Angeles Department of Water & Power 07/01/2041 5.000% | 2.1 % |
| California State Public Works Board 08/01/2036 5.000% | 1.9 % |
| Burbank-Glendale-Pasadena Airport Authority Brick Campaign 07/01/2044 5.250% | 1.8 % |
| State of California 08/01/2044 5.250% | 1.5 % |
| California State University 11/01/2042 5.000% | 1.5 % |
| Los Angeles Unified School District 07/01/2032 5.000% | 1.4 % |
| Golden State Tobacco Securitization Corp. 06/01/2033 5.000% | 1.4 % |
| Foothill-Eastern Transportation Corridor Agency 01/15/2033 0.000% | 1.3 % |
| Southern California Public Power Authority 07/01/2041 5.000% | 1.3 % |
Asset Categories

Credit Quality

Top Holdings
| Southern California Public Power Authority 04/01/2055 5.000% | 2.1 % |
| Los Angeles Department of Water & Power 07/01/2041 5.000% | 2.1 % |
| California State Public Works Board 08/01/2036 5.000% | 1.9 % |
| Burbank-Glendale-Pasadena Airport Authority Brick Campaign 07/01/2044 5.250% | 1.8 % |
| State of California 08/01/2044 5.250% | 1.5 % |
| California State University 11/01/2042 5.000% | 1.5 % |
| Los Angeles Unified School District 07/01/2032 5.000% | 1.4 % |
| Golden State Tobacco Securitization Corp. 06/01/2033 5.000% | 1.4 % |
| Foothill-Eastern Transportation Corridor Agency 01/15/2033 0.000% | 1.3 % |
| Southern California Public Power Authority 07/01/2041 5.000% | 1.3 % |
Certain Fund Changes
This is a summary of certain changes to the Fund during the reporting period. For more complete information, you may review the Fund’s prospectus, which is available at
columbiathreadneedleus.com/resources/literature
or upon request at 1-800-345-6611
.Effective August 1, 2024, the Fund amended its Prospectus’ Principal Investment Strategies to reflect that the Fund may enter into tender option bond (TOB) transactions and may invest in derivatives, such as floating rate municipal securities (floaters) and inverse floating rate municipal securities (inverse floaters) to add incremental income, futures (including interest rate and Treasury bond futures) to manage duration and hedge against changes in interest rates, and swaps, including Municipal Market Data Rate Locks (MMD Rate Locks) to manage duration and hedge against changes in interest rates. In addition, the Fund amended its Prospectus’ Principal Risks to include disclosure of the risks associated with investing in these instruments and derivatives generally.
columbiathreadneedleus.com/resources/literature
or upon request at 1-800-345-6611
.
columbiathreadneedleus.com/resources/literature
. You can also request more information by contacting us at 1-800-345-6611.
What were the Fund costs for the reporting period?
(Based on a hypothetical $10,000 investment)
| Class | Cost of a $10,000 investment | Cost paid as a percentage of a $10,000 investment |
| Class S | $ 27(a) | 0.48 % (b) |
(a) | Based on operations from October 2, 2024 (commencement of operations) through the stated period end. Had the class been open for the entire reporting period, expenses shown in the table above would have been higher. |
(b) | Annualized. |
Management's Discussion of Fund Performance
The performance of Class S shares for the period presented is shown in the Average Annual Total Returns table.
Top Performance Contributors
Security selection
| Strong security selection in education, airport, local general obligation (GO) and special tax bonds contributed to Fund performance relative to the benchmark.Credit quality allocation
| Credit quality allocation added to the Fund’s relative performance. Overweights to higher yielding, lower rated A, BBB and non-rated bonds and an underweight to AA bonds added to performance during a period in which investors favored the income generated by higher yielding bonds.Credit quality selection
| Positive contributions to benchmark-relative performance were driven by security selection in bonds rated AA.Yield curve allocation
| Shorter maturities outperformed longer maturities, with the strongest index returns coming from the 2-4-year range. The portfolio maintained its barbell profile with heavier exposures on the short and long ends. Exposure to the shorter portion (0-2 years) of the barbell produced the strongest returns, topping all maturity buckets in the index.Top Performance Detractors
Interest rate positioning
| The Fund’s modest underweight to the shortest maturities within the benchmark (2-to-3 years) detracted from relative performance as municipal market interest rates declined in this portion of the curve. An overweight position to the long end of the curve detracted from relative performance, as market rates in this space moved markedly higher.Sector allocations
| Underweight positions in pre-paid gas and state general obligation (GO) bonds detracted from relative performance.Credit quality selection
| Security selection in BBB and single-A rated bonds detracted from relative performance, with selection in BBB rated charter schools and 10-year single-A airport bonds, and the timing of prepay natural gas bonds notable detractors.Security Selection
| Selection in single-A rated Los Angeles Department of Water and Power bonds, which were impacted by the fires in early 2025, detracted from relative performance.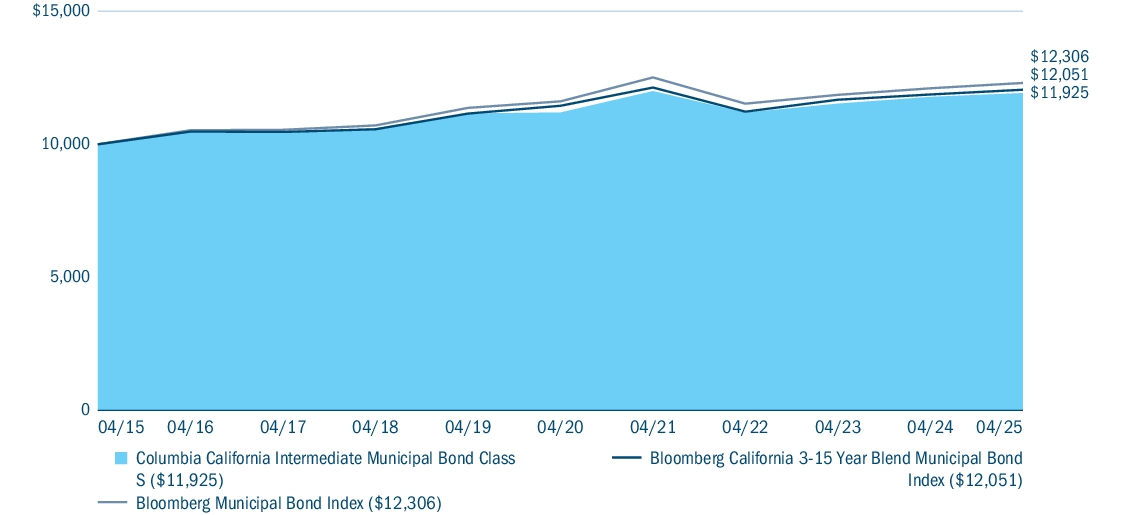
| Average Annual Total Returns (%) | 1 year | 5 years | 10 years |
| Class S (a) | 1.22 | 1.27 | 1.78 |
| Bloomberg California 3-15 Year Blend Municipal Bond Index | 1.50 | 1.03 | 1.88 |
| Bloomberg Municipal Bond Index (b) | 1.66 | 1.17 | 2.10 |
(a) | The returns shown for periods prior to October 2, 2024 (including Since Fund Inception returns, if shown) include the returns of Institutional Class. These returns are adjusted to reflect any higher class-related operating expenses of the newer share classes, as applicable. Please visit columbiathreadneedleus.com/investment-products/mutual-funds/appended-performance |
(b) | Effective August 1, 2024, the Fund compares its performance to the Bloomberg Municipal Bond Index, a broad-based performance index, as required by new regulatory requirements. The Fund’s performance also continues to be compared to its prior benchmarks, which management believes more closely represent the market sectors/and or asset classes in which the Fund primarily invests. |
columbiathreadneedleus.com/investment-products/mutual-funds
for more recent performance information.
| Fund net assets | $ 292,380,359 |
| Total number of portfolio holdings | 219 |
| Management services fees (represents 0.47% of Fund average net assets) | $ 1,409,905 |
| Portfolio turnover for the reporting period | 16% |
Graphical Representation of Fund Holdings
The tables below show the investment makeup of the Fund represented as a percentage of Fund net assets. Derivatives are excluded from the tables unless otherwise noted. The Fund's portfolio composition is subject to change.
Bond ratings on Fund holdings are divided into categories ranging from highest to lowest credit quality, determined by using the middle rating of Moody’s Ratings, S&P and Fitch, after dropping the highest and lowest available ratings. When ratings are available from only two rating agencies, the lower rating is used. When a rating is available from only one rating agency, that rating is used. If a security is not rated by Moody's Ratings, S&P or Fitch, but has a rating by Kroll and/or DBRS, the same methodology is applied to those bonds that would otherwise be not rated. When a bond is not rated by any rating agency, it is designated as “Not rated.” Credit quality ratings assigned by a rating agency are subjective opinions, not statements of fact, and are subject to change, including daily.
Top Holdings
| Southern California Public Power Authority 04/01/2055 5.000% | 2.1 % |
| Los Angeles Department of Water & Power 07/01/2041 5.000% | 2.1 % |
| California State Public Works Board 08/01/2036 5.000% | 1.9 % |
| Burbank-Glendale-Pasadena Airport Authority Brick Campaign 07/01/2044 5.250% | 1.8 % |
| State of California 08/01/2044 5.250% | 1.5 % |
| California State University 11/01/2042 5.000% | 1.5 % |
| Los Angeles Unified School District 07/01/2032 5.000% | 1.4 % |
| Golden State Tobacco Securitization Corp. 06/01/2033 5.000% | 1.4 % |
| Foothill-Eastern Transportation Corridor Agency 01/15/2033 0.000% | 1.3 % |
| Southern California Public Power Authority 07/01/2041 5.000% | 1.3 % |
Asset Categories
Credit Quality
Top Holdings
| Southern California Public Power Authority 04/01/2055 5.000% | 2.1 % |
| Los Angeles Department of Water & Power 07/01/2041 5.000% | 2.1 % |
| California State Public Works Board 08/01/2036 5.000% | 1.9 % |
| Burbank-Glendale-Pasadena Airport Authority Brick Campaign 07/01/2044 5.250% | 1.8 % |
| State of California 08/01/2044 5.250% | 1.5 % |
| California State University 11/01/2042 5.000% | 1.5 % |
| Los Angeles Unified School District 07/01/2032 5.000% | 1.4 % |
| Golden State Tobacco Securitization Corp. 06/01/2033 5.000% | 1.4 % |
| Foothill-Eastern Transportation Corridor Agency 01/15/2033 0.000% | 1.3 % |
| Southern California Public Power Authority 07/01/2041 5.000% | 1.3 % |
Certain Fund Changes
This is a summary of certain changes to the Fund during the reporting period. For more complete information, you may review the Fund’s prospectus, which is available at
columbiathreadneedleus.com/resources/literature
or upon request at 1-800-345-6611
.Effective August 1, 2024, the Fund amended its Prospectus’ Principal Investment Strategies to reflect that the Fund may enter into tender option bond (TOB) transactions and may invest in derivatives, such as floating rate municipal securities (floaters) and inverse floating rate municipal securities (inverse floaters) to add incremental income, futures (including interest rate and Treasury bond futures) to manage duration and hedge against changes in interest rates, and swaps, including Municipal Market Data Rate Locks (MMD Rate Locks) to manage duration and hedge against changes in interest rates. In addition, the Fund amended its Prospectus’ Principal Risks to include disclosure of the risks associated with investing in these instruments and derivatives generally.
columbiathreadneedleus.com/resources/literature
or upon request at 1-800-345-6611
.
| [1] | Based on operations from October 2, 2024 (commencement of operations) through the stated period end. Had the class been open for the entire reporting period, expenses shown in the table above would have been higher. |
| [2] | Annualized. |