Shareholder Report
Apr. 30, 2025
USD ($)
Holding
®
U.S. Large Cap Growth Fund (the “Fund”) for the period November 1, 2024 to April 30, 2025.
What were the Fund costs for the last six months?
(Based on a hypothetical $10,000 investment)
Share Class |
Costs of a $10,000 investment |
Costs paid as a percentage of a $10,000 investment |
||||
Class A |
$44 | 0.90% |
Fund Statistics |
||||||||
(as of April 30, 2025) |
||||||||
Net Assets |
$ |
168,766,417 |
||||||
Number of Portfolio Holdings |
190 |
|||||||
Portfolio Turnover Rate |
4% |
What did the Fund invest in?
(as of April 30, 2025)
Sector Weightings (as a % of Net Assets) |
||||||
Information Technology |
42.1 | % | ||||
Consumer Discretionary |
16.3 | % | ||||
Communication Services |
12.7 | % | ||||
Financials |
7.6 | % | ||||
Industrials |
7.4 | % | ||||
Health Care |
6.5 | % | ||||
Consumer Staples |
3.7 | % | ||||
Energy |
2.2 | % | ||||
Materials |
0.6 | % | ||||
Utilities |
0.6 | % | ||||
Short-Term Investments |
0.1 | % | ||||
Cash and Other Assets Less Liabilities |
0.2 | % | ||||
Top Ten Holdings (as a % of Net Assets) |
||||||
Apple, Inc. |
10.7 | % | ||||
Microsoft Corp. |
9.4 | % | ||||
NVIDIA Corp. |
8.1 | % | ||||
Amazon.com, Inc. |
6.2 | % | ||||
Meta Platforms, Inc., Class A |
5.1 | % | ||||
Alphabet, Inc., Class A |
3.2 | % | ||||
Broadcom, Inc. |
3.0 | % | ||||
Alphabet, Inc., Class C |
2.7 | % | ||||
Mastercard, Inc., Class A |
1.8 | % | ||||
Netflix, Inc. |
1.6 | % | ||||
®
U.S. Large Cap Growth Fund (the “Fund”) for the period November 1, 2024 to April 30, 2025.
What were the Fund costs for the last six months?
(Based on a hypothetical $10,000 investment)
Share Class |
Costs of a $10,000 investment |
Costs paid as a percentage of a $10,000 investment |
||||
| Class I | $32 | 0.65% |
Fund Statistics |
||||||||
(as of April 30, 2025) |
||||||||
Net Assets |
$ |
168,766,417 |
||||||
Number of Portfolio Holdings |
190 |
|||||||
Portfolio Turnover Rate |
4% |
What did the Fund invest in?
(as of April 30, 2025)
Sector Weightings (as a % of Net Assets) |
||||||
Information Technology |
42.1 | % | ||||
Consumer Discretionary |
16.3 | % | ||||
Communication Services |
12.7 | % | ||||
Financials |
7.6 | % | ||||
Industrials |
7.4 | % | ||||
Health Care |
6.5 | % | ||||
Consumer Staples |
3.7 | % | ||||
Energy |
2.2 | % | ||||
Materials |
0.6 | % | ||||
Utilities |
0.6 | % | ||||
Short-Term Investments |
0.1 | % | ||||
Cash and Other Assets Less Liabilities |
0.2 | % | ||||
Top Ten Holdings (as a % of Net Assets) |
||||||
Apple, Inc. |
10.7 | % | ||||
Microsoft Corp. |
9.4 | % | ||||
NVIDIA Corp. |
8.1 | % | ||||
Amazon.com, Inc. |
6.2 | % | ||||
Meta Platforms, Inc., Class A |
5.1 | % | ||||
Alphabet, Inc., Class A |
3.2 | % | ||||
Broadcom, Inc. |
3.0 | % | ||||
Alphabet, Inc., Class C |
2.7 | % | ||||
Mastercard, Inc., Class A |
1.8 | % | ||||
Netflix, Inc. |
1.6 | % | ||||
Top Ten Holdings (as a % of Net Assets) |
||||||
Apple, Inc. |
10.7 | % | ||||
Microsoft Corp. |
9.4 | % | ||||
NVIDIA Corp. |
8.1 | % | ||||
Amazon.com, Inc. |
6.2 | % | ||||
Meta Platforms, Inc., Class A |
5.1 | % | ||||
Alphabet, Inc., Class A |
3.2 | % | ||||
Broadcom, Inc. |
3.0 | % | ||||
Alphabet, Inc., Class C |
2.7 | % | ||||
Mastercard, Inc., Class A |
1.8 | % | ||||
Netflix, Inc. |
1.6 | % | ||||
1-888-310-0416.
What were the Fund costs for the last six months?
(Based on a hypothetical $10,000 investment)
Share Class |
Costs of a $10,000 investment |
Costs paid as a percentage of a $10,000 investment |
||||
Class A |
$38 | 0.75% |
Fund Statistics |
||||||||
(as of April 30, 2025) |
||||||||
Net Assets |
$ |
608,794,040 |
||||||
Number of Portfolio Holdings |
109 |
|||||||
Portfolio Turnover Rate |
75% |
What did the Fund invest in?
(as of April 30, 2025)
Sector Weightings (as a % of Net Assets)
1-888-310-0416.
What were the Fund costs for the last six months?
(Based on a hypothetical $10,000 investment)
Share Class |
Costs of a $10,000 investment |
Costs paid as a percentage of a $10,000 investment |
||||
Class I |
$25 | 0.50% |
Fund Statistics |
||||||||
(as of April 30, 2025) |
||||||||
Net Assets |
$ |
608,794,040 |
||||||
Number of Portfolio Holdings |
109 |
|||||||
Portfolio Turnover Rate |
75% |
What did the Fund invest in?
(as of April 30, 2025)
Sector Weightings (as a % of Net Assets)
1-888-310-0416.
What were the Fund costs for the last six months?
(Based on a hypothetical $10,000 investment)
Share Class |
Costs of a $10,000 investment |
Costs paid as a percentage of a $10,000 investment |
||||
Class R |
$50 | 1.00% |
Fund Statistics |
||||||||
(as of April 30, 2025) |
||||||||
Net Assets |
$ |
608,794,040 |
||||||
Number of Portfolio Holdings |
109 |
|||||||
Portfolio Turnover Rate |
75% |
What did the Fund invest in?
(as of April 30, 2025)
Sector Weighti
ng
s (as a % of Net Assets)
What were the Fund costs for the last six months?
(Based on a hypothetical $10,000 investment)
Share Class |
Costs of a $10,000 investment |
Costs paid as a percentage of a $10,000 investment |
||||
Class A |
$55 | 1.13% |
Fund Statistics |
||||||||
(as of April 30, 2025) |
||||||||
Net Assets |
$ |
63,742,994 |
||||||
Number of Portfolio Holdings |
103 |
|||||||
Portfolio Turnover Rate |
20% |
What did th
e
Fun
d invest in? (as of April 30, 2025)
Sector Weight ing s (as a % of Net Assets) |
||||||
Industrials |
31.3 | % | ||||
Health Care |
23.6 | % | ||||
Information Technology |
23.4 | % | ||||
Financials |
7.4 | % | ||||
Consumer Discretionary |
6.0 | % | ||||
Energy |
1.8 | % | ||||
Consumer Staples |
1.5 | % | ||||
Communication Services |
1.2 | % | ||||
Materials |
0.2 | % | ||||
Exchange Traded Fund |
1.1 | % | ||||
Short-Term Investments |
3.5 | % | ||||
Cash and Other Assets Less Liabilities |
-1.0 | % | ||||
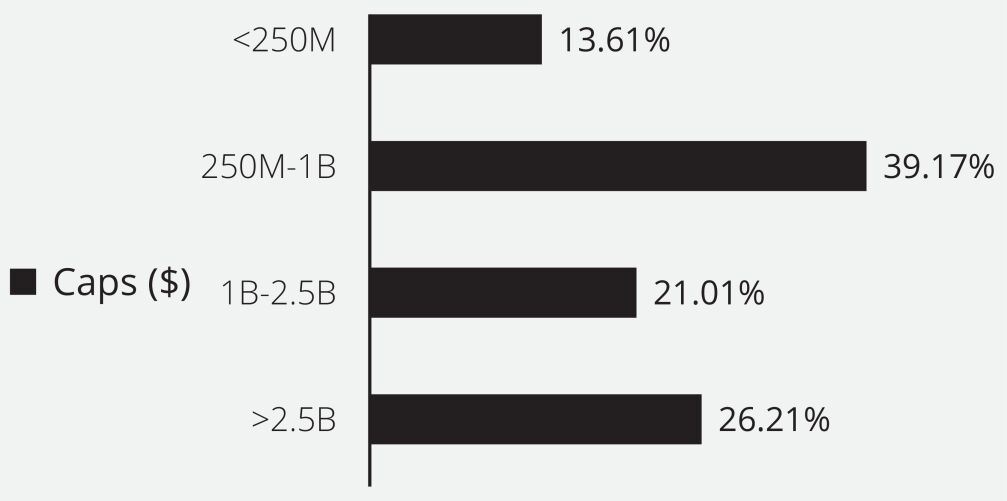
Market Ca pitaliz ation (as a % of Net Assets) | ||
| ||
What were the Fund costs for the last six months?
(Based on a hypothetical $10,000 investment)
Share Class |
Costs of a $10,000 investment |
Costs paid as a percentage of a $10,000 investment |
||||
Class I |
$43 | 0.88% |
Fund Statistics |
||||||||
(as of April 30, 2025) |
||||||||
Net Assets |
$ |
63,742,994 |
||||||
Number of Portfolio Holdings |
103 |
|||||||
Portfolio Turnover Rate |
20% |
What did the Fund invest in?
(as of April 30, 2025)
Sector Weightings (as a % of Net Assets) |
||||||
Industrials |
31.3 | % | ||||
Health Care |
23.6 | % | ||||
Information Technology |
23.4 | % | ||||
Financials |
7.4 | % | ||||
Consumer Discretionary |
6.0 | % | ||||
Energy |
1.8 | % | ||||
Consumer Staples |
1.5 | % | ||||
Communication Services |
1.2 | % | ||||
Materials |
0.2 | % | ||||
Exchange Traded Fund |
1.1 | % | ||||
Short-Term Investments |
3.5 | % | ||||
Cash and Other Assets Less Liabilities |
-1.0 | % | ||||
Market Capitalization (as a % of Net Assets) | ||
|
| ||
1-888-310-0416.
What were the Fund costs for the last six months?
(Based on a hypothetical $10,000 investment)
Share Class |
Costs of a $10,000 investment |
Costs paid as a percentage of a $10,000 investment |
||||
Class R |
$67 | 1.38% |
Fund Statistics |
||||||||
(as of April 30, 2025) |
||||||||
Net Assets |
$ |
63,742,994 |
||||||
Number of Portfolio Holdings |
103 |
|||||||
Portfolio Turnover Rate |
20% |
What did the Fund invest in?
(as of April 30, 2025)
Sector Weightings (as a % of Net Assets) |
||||||
Industrials |
31.3 | % | ||||
Health Care |
23.6 | % | ||||
Information Technology |
23.4 | % | ||||
Financials |
7.4 | % | ||||
Consumer Discretionary |
6.0 | % | ||||
Energy |
1.8 | % | ||||
Consumer Staples |
1.5 | % | ||||
Communication Services |
1.2 | % | ||||
Materials |
0.2 | % | ||||
Exchange Traded Fund |
1.1 | % | ||||
Short-Term Investments |
3.5 | % | ||||
Cash and Other Assets Less Liabilities |
-1.0 | % | ||||
Market Capitalization (as a % of Net Assets) | ||
|
| ||
What were the Fund costs for the last six months?
(Based on a hypothetical $10,000 investment)
Share Class |
Costs of a $10,000 investment |
Costs paid as a percentage of a $10,000 investment |
||||
Class A |
$57 | 1.20% |
Fund Statistics |
||||||||
(as of April 30, 2025) |
||||||||
Net Assets |
$ |
144,471,594 |
||||||
Number of Portfolio Holdings |
180 |
|||||||
Portfolio Turnover Rate |
4% |
What did the Fund invest in?
(as of April 30, 2025)
Sector Weightings (as a % of Net Assets) |
||||||
Industrials |
33.8 | % | ||||
Communication Services |
19.4 | % | ||||
Consumer Discretionary |
14.6 | % | ||||
Consumer Staples |
8.3 | % | ||||
Materials |
6.8 | % | ||||
Utilities |
5.6 | % | ||||
Health Care |
2.4 | % | ||||
Financials |
2.3 | % | ||||
Information Technology |
2.2 | % | ||||
Energy |
1.0 | % | ||||
Real Estate |
0.6 | % | ||||
Short-Term Investments |
5.9 | % | ||||
Cash and Other Assets Less Liabilities |
-2.9 | % | ||||
Top Ten Holdings (as a % of Net Assets) | ||||
JPMorgan Prime Money Market Fund, IM Shares |
2.8% | |||
Mueller Industries, Inc. |
2.6% | |||
National Fuel Gas Co. |
2.2% | |||
Crane Co. |
2.1% | |||
Madison Square Garden Sports Corp. |
2.0% | |||
Paramount Global, Class A |
2.0% | |||
Sinclair, Inc. |
1.7% | |||
Astec Industries, Inc. |
1.7% | |||
Iveco Group NV |
1.6% | |||
AZZ, Inc. |
1.6% | |||
What were the Fund costs for the last six months?
(Based on a hypothetical $10,000 investment)
Share Class |
Costs of a $10,000 investment |
Costs paid as a percentage of a $10,000 investment |
||||
Class I |
$45 | 0.95% |
Fund Statistics |
||||||||
(as of April 30, 2025) |
||||||||
Net Assets |
$ |
144,471,594 |
||||||
Number of Portfolio Holdings |
180 |
|||||||
Portfolio Turnover Rate |
4% |
What did the Fund invest in?
(as of April 30, 2025)
Sector Weightings (as a % of Net Assets) |
||||||
Industrials |
33.8 | % | ||||
Communication Services |
19.4 | % | ||||
Consumer Discretionary |
14.6 | % | ||||
Consumer Staples |
8.3 | % | ||||
Materials |
6.8 | % | ||||
Utilities |
5.6 | % | ||||
Health Care |
2.4 | % | ||||
Financials |
2.3 | % | ||||
Information Technology |
2.2 | % | ||||
Energy |
1.0 | % | ||||
Real Estate |
0.6 | % | ||||
Short-Term Investments |
5.9 | % | ||||
Cash and Other Assets Less Liabilities |
-2.9 | % | ||||
Top Ten Holdings (as a % of Net Assets) |
||||||
JPMorgan Prime Money Market Fund, IM Shares |
2.8 | % | ||||
Mueller Industries, Inc. |
2.6 | % | ||||
National Fuel Gas Co. |
2.2 | % | ||||
Crane Co. |
2.1 | % | ||||
Madison Square Garden Sports Corp. |
2.0 | % | ||||
Paramount Global, Class A |
2.0 | % | ||||
Sinclair, Inc. |
1.7 | % | ||||
Astec Industries, Inc. |
1.7 | % | ||||
Iveco Group NV |
1.6 | % | ||||
AZZ, Inc. |
1.6 | % | ||||
semi-annual shareholder report
contains important information about the 1290 GAMCO Small/Mid Cap Value Fund (the “Fund”) for the period November 1, 2024 to April 30, 2025.
What were the Fund costs for the last six months?
(Based on a hypothetical $10,000 investment)
Share Class |
Costs of a $10,000 investment |
Costs paid as a percentage of a $10,000 investment |
||||
Class R |
$68 | 1.45% |
Fund Statistics |
||||||||
(as of April 30, 2025) |
||||||||
Net Assets |
$ |
144,471,594 |
||||||
Number of Portfolio Holdings |
180 |
|||||||
Portfolio Turnover Rate |
4% |
What did the Fund invest in?
(as of April 30, 2025)
Sector Weightings (as a % of Net Assets) |
||||||
Industrials |
33.8 | % | ||||
Communication Services |
19.4 | % | ||||
Consumer Discretionary |
14.6 | % | ||||
Consumer Staples |
8.3 | % | ||||
Materials |
6.8 | % | ||||
Utilities |
5.6 | % | ||||
Health Care |
2.4 | % | ||||
Financials |
2.3 | % | ||||
Information Technology |
2.2 | % | ||||
Energy |
1.0 | % | ||||
Real Estate |
0.6 | % | ||||
Short-Term Investments |
5.9 | % | ||||
Cash and Other Assets Less Liabilities |
-2.9 | % | ||||
Top Ten Holdings (as a % of Net Assets) |
||||||
JPMorgan Prime Money Market Fund, IM Shares |
2.8 | % | ||||
Mueller Industries, Inc. |
2.6 | % | ||||
National Fuel Gas Co. |
2.2 | % | ||||
Crane Co. |
2.1 | % | ||||
Madison Square Garden Sports Corp. |
2.0 | % | ||||
Paramount Global, Class A |
2.0 | % | ||||
Sinclair, Inc. |
1.7 | % | ||||
Astec Industries, Inc. |
1.7 | % | ||||
Iveco Group NV |
1.6 | % | ||||
AZZ, Inc. |
1.6 | % | ||||
Top Ten Holdings (as a % of Net Assets) |
||||||
JPMorgan Prime Money Market Fund, IM Shares |
2.8 | % | ||||
Mueller Industries, Inc. |
2.6 | % | ||||
National Fuel Gas Co. |
2.2 | % | ||||
Crane Co. |
2.1 | % | ||||
Madison Square Garden Sports Corp. |
2.0 | % | ||||
Paramount Global, Class A |
2.0 | % | ||||
Sinclair, Inc. |
1.7 | % | ||||
Astec Industries, Inc. |
1.7 | % | ||||
Iveco Group NV |
1.6 | % | ||||
AZZ, Inc. |
1.6 | % | ||||
1-888-310-0416.
What were the Fund costs for the last six months?
(Based on a hypothetical $10,000 investment)
Share Class |
Costs of a $10,000 investment |
Costs paid as a percentage of a $10,000 investment |
||||
Class A |
$50 | 1.00% |
Fund Statistics |
||||||||
(as of April 30, 2025) |
||||||||
Net Assets |
$ |
79,398,837 |
||||||
Number of Portfolio Holdings |
277 |
|||||||
Portfolio Turnover Rate |
17% |
What did the Fund invest in?
(as of April 30, 2025)
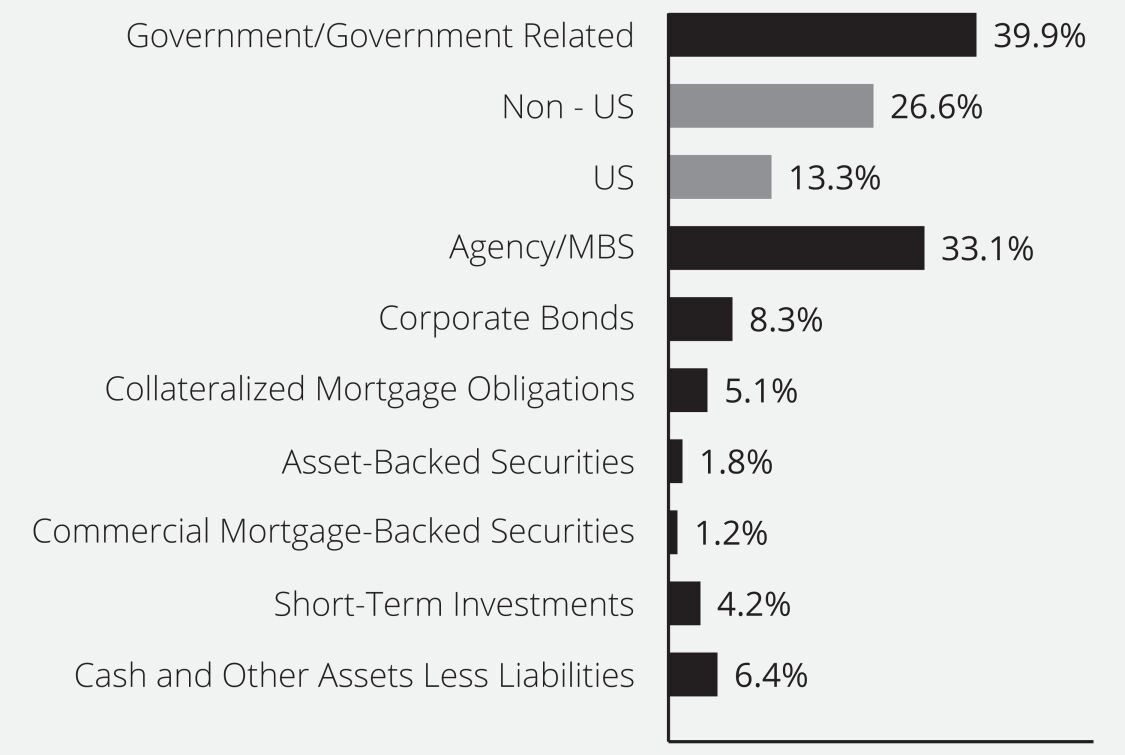
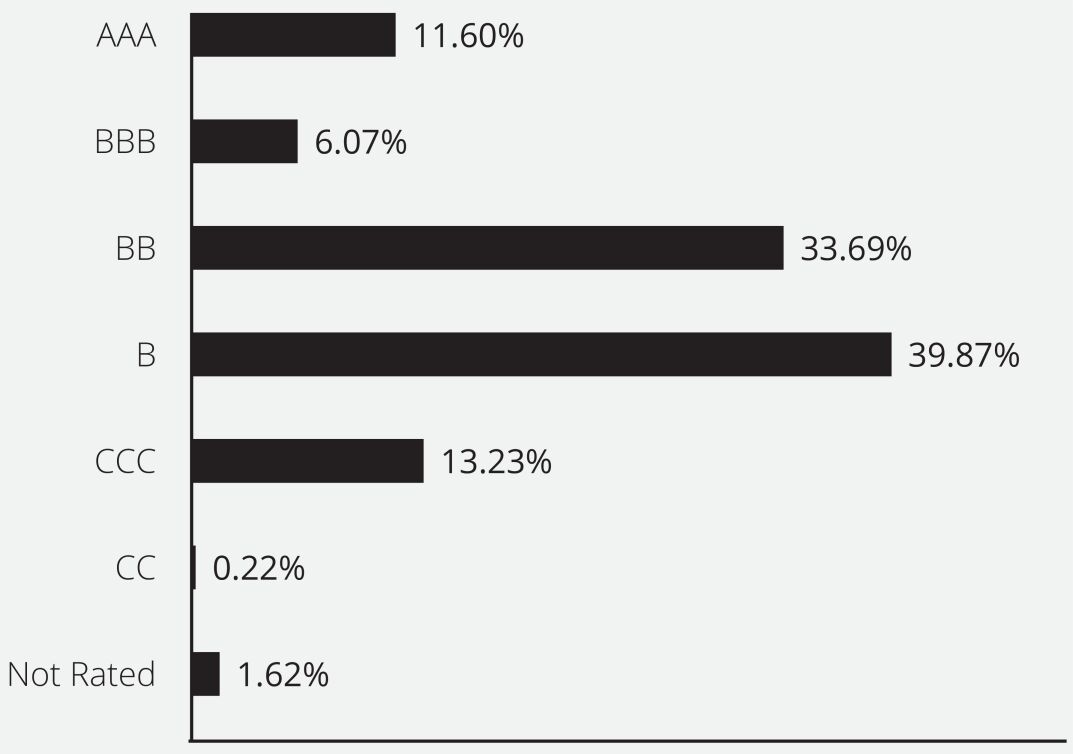
Credit Quality Ratings (as a % of Net Assets)
What were the Fund costs for the last six months?
(Based on a hypothetical $10,000 investment)
Share Class |
Costs of a $10,000 investment |
Costs paid as a percentage of a $10,000 investment |
||||
Class I |
$37 | 0.75% |
Fund Statistics |
||||||||
(as of April 30, 2025) |
||||||||
Net Assets |
$ |
79,398,837 |
||||||
Number of Portfolio Holdings |
277 |
|||||||
Portfolio Turnover Rate |
17% |
What did the Fund invest in?
(as of April 30, 2025)
Credit Quality Ratings (as a % of Net Assets)
What were the Fund costs for the last six months?
(Based on a hypothetical $10,000 investment)
Share Class |
Costs of a $10,000 investment |
Costs paid as a percentage of a $10,000 investment |
||||
Class R |
$62 | 1.25% |
Fund Statistics |
||||||||
(as of April 30, 2025) |
||||||||
Net Assets |
$ |
79,398,837 |
||||||
Number of Portfolio Holdings |
277 |
|||||||
Portfolio Turnover Rate |
17% |
What did the Fund invest in?
(as of April 30, 2025)
Credit Quality Ratings (as a % of Net Assets)
1-888-310-0416.
What were the Fund costs for the last six months?
(Based on a hypothetical $10,000 investment)
Share Class |
Costs of a $10,000 investment |
Costs paid as a percentage of a $10,000 investment |
||||
Class A |
$52 | 1.05% |
Fund Statistics |
||||||||
(as of April 30, 2025) |
||||||||
Net Assets |
$ |
77,754,631 |
||||||
Number of Portfolio Holdings |
622 |
|||||||
Portfolio Turnover Rate |
111% |
What did the Fund invest in?
(as of April 30, 2025)
Asset Allocation (as a % of Net Assets)
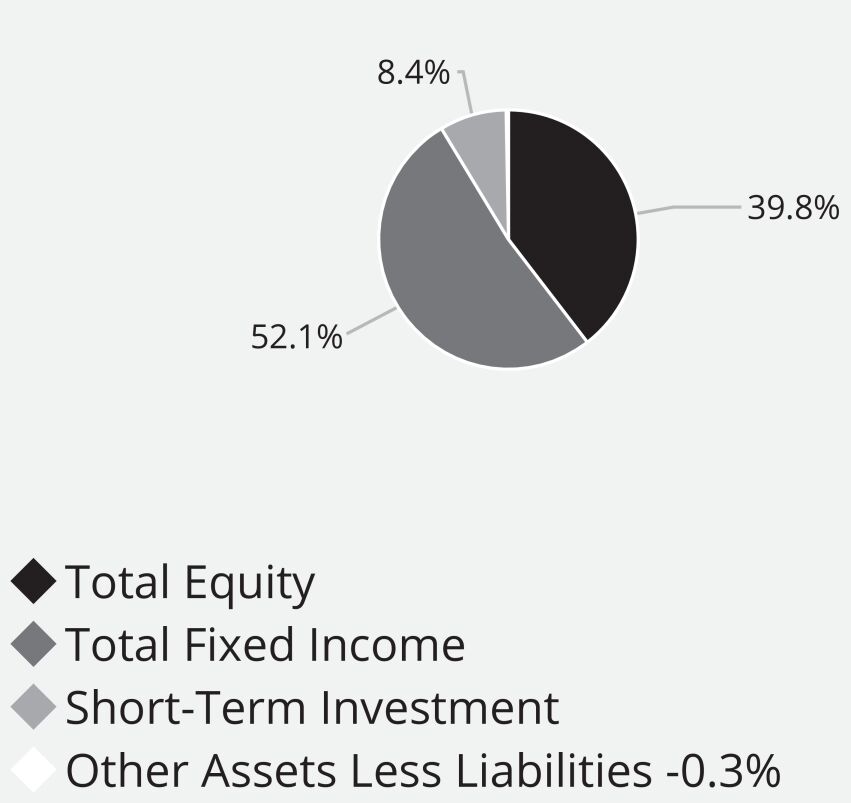
his semi-annual shareholder report contains important information about the 1290 Loomis Sayles Multi-Asset Income Fund (the “Fund”) for the period November 1, 2024 to April 30, 2025.
What were the Fund costs for the last six months?
(Based on a hypothetical $10,000 investment)
Share Class |
Costs of a $10,000 investment |
Costs paid as a percentage of a $10,000 investment |
||||
Class I |
$40 | 0.80% |
Fund Statistics |
||||||||
(as of April 30, 2025) |
||||||||
Net Assets |
$ |
77,754,631 |
||||||
Number of Portfolio Holdings |
622 |
|||||||
Portfolio Turnover Rate |
111% |
What did the Fund invest in?
(as of April 30, 2025)
Asset Allocation (as a % of Net Assets)
What were the Fund costs for the last six months?
(Based on a hypothetical $10,000 investment)
Share Class |
Costs of a $10,000 investment |
Costs paid as a percentage of a $10,000 investment |
||||
Class R |
$65 | 1.30% |
Fund Statistics |
||||||||
(as of April 30, 2025) |
||||||||
Net Assets |
$ |
77,754,631 |
||||||
Number of Portfolio Holdings |
622 |
|||||||
Portfolio Turnover Rate |
111% |
What did the Fund invest in?
(as of April 30, 2025)
Asset Allocation (as a % of Net Assets)
What were the Fund costs for the last six months?
(Based on a hypothetical $10,000 investment)
Share Class |
Costs of a $10,000 investment |
Costs paid as a percentage of a $10,000 investment |
||||
Class A |
$55 | 1.10% |
Fund Statistics |
||||||||
(as of April 30, 2025) |
||||||||
Net Assets |
$ |
19,564,023 |
||||||
Number of Portfolio Holdings |
11 |
|||||||
Portfolio Turnover Rate |
14% |
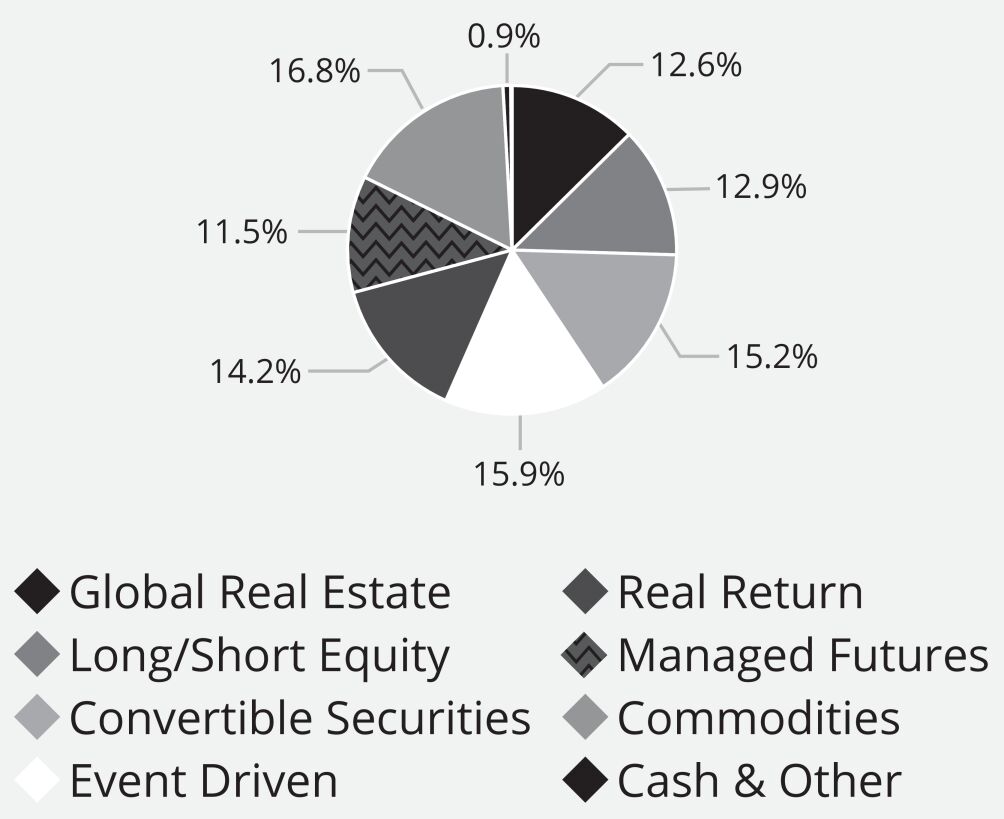
What did the Fund invest in?
(as of April 30, 2025)
Alternative Category and Strategy Allocation (as a % of
Net Assets)
What were the Fund costs for the last six months?
(Based on a hypothetical $10,000 investment)
Share Class |
Costs of a $10,000 investment |
Costs paid as a percentage of a $10,000 investment |
||||
Class I |
$43 | 0.85% |
Fund Statistics |
||||||||
(as of April 30, 2025) |
||||||||
Net Assets |
$ |
19,564,023 |
||||||
Number of Portfolio Holdings |
11 |
|||||||
Portfolio Turnover Rate |
14% |
What did the Fund invest in?
(as of April 30, 2025)
Alternative Category and Strategy Allocation (as a % of
Net Assets)
What were the Fund costs for the last six months?
(Based on a hypothetical $10,000 investment)
Share Class |
Costs of a $10,000 investment |
Costs paid as a percentage of a $10,000 investment |
||||
Class R |
$67 | 1.35% |
Fund Statistics |
||||||||
(as of April 30, 2025) |
||||||||
Net Assets |
$ |
19,564,023 |
||||||
Number of Portfolio Holdings |
11 |
|||||||
Portfolio Turnover Rate |
14% |
What did the Fund invest in?
(as of April 30, 2025)
Alternative Category and Strategy Allocation (as a % of
Net Assets)
1-888-310-0416.
What were the Fund costs for the last six months?
(Based on a hypothetical $10,000 investment)
| Share Class |
Costs of a $10,000 investment |
Costs paid as a percentage of a $10,000 investment |
||||
| Class I |
$28 | 0.56% |
| Fund Statistics |
||||||||
| (as of April 30, 2025) |
||||||||
| Net Assets |
$ |
1,252,061 |
||||||
| Number of Portfolio Holdings |
17 |
|||||||
| Portfolio Turnover Rate |
1% |
What did the Fund invest in?
(as of April 30, 2025)
| Security Type & Asset Class (as a % of Net Assets) |
||||||||
| Exchange Traded Funds |
99.7% | |||||||
| Fixed Income |
57.7% | |||||||
| Equity |
42.0% | |||||||
| Cash and Other Assets Less Liabilities |
0.3% | |||||||
Material Fund Changes
This is a summary of material Fund changes since November 1, 2024. For more information contact 1-888-310-0416.
At a meeting held on March 18-19, 2025, the Trust’s Board of Trustees (the “Board”), upon the recommendation of Equitable Investment Management, LLC, the Trust’s investment adviser, approved a Plan of Liquidation and Termination (the “Plan”) pursuant to which the Fund would liquidate and terminate on or about May 30, 2025 (the “Liquidation Date”). Pursuant to the Plan, the Fund sold its portfolio securities for cash and converted any other assets to cash or cash equivalents to pay any liabilities by the Liquidation Date. On the Liquidation Date, the Fund made a liquidating distribution to each remaining shareholder equal to the shareholder’s proportionate interest in the net assets of the Fund, in complete redemption and cancellation of the Fund’s shares held by each shareholder. The Fund terminated upon completion of the distribution.
What were the Fund costs for the last six months?
(Based on a hypothetical $10,000 investment)
| Share Class |
Costs of a $10,000 investment |
Costs paid as a percentage of a $10,000 investment |
||||
| Class I |
$28 | 0.55% |
| Fund Statistics |
||||||||
| (as of April 30, 2025) |
||||||||
| Net Assets |
$ |
142,368 |
||||||
| Number of Portfolio Holdings |
17 |
|||||||
| Portfolio Turnover Rate |
3% |
What did the Fund invest in?
(as of April 30, 2025)
| Security Type & Asset Class (as a % of Net Assets) |
||||||||
| Exchange Traded Funds |
102.4 | % | ||||||
| Equity |
53.3 | % | ||||||
| Fixed Income |
49.1 | % | ||||||
| Cash and Other Assets Less Liabilities |
-2.4 |
% | ||||||
Material Fund Changes
This is a summary of material Fund changes since November 1, 2024. For more information contact
1-888-310-0416.
At a meeting held on March
18-19,
2025, the Trust’s Board of Trustees (the “Board”), upon the recommendation of Equitable Investment Management, LLC, the Trust’s investment adviser, approved a Plan of Liquidation and Termination (the “Plan”) pursuant to which the Fund would liquidate and terminate on or about May 30, 2025 (the “Liquidation Date”). Pursuant to the Plan, the Fund sold its portfolio securities for cash and converted any other assets to cash or cash equivalents to pay any liabilities by the Liquidation Date. On the Liquidation Date, the Fund made a liquidating distribution to each remaining shareholder equal to the shareholder’s proportionate interest in the net assets of the Fund, in complete redemption and cancellation of the Fund’s shares held by each shareholder. The Fund terminated upon completion of the distribution. 1-888-310-0416.
What were the Fund costs for the last six months?
(Based on a hypothetical $10,000 investment)
| Share Class |
Costs of a $10,000 investment |
Costs paid as a percentage of a $10,000 investment |
||||
| Class I |
$28 | 0.55% |
| Fund Statistics |
||||||||
| (as of April 30, 2025) |
||||||||
| Net Assets |
$ |
1,646,329 |
||||||
| Number of Portfolio Holdings |
17 |
|||||||
| Portfolio Turnover Rate |
3% |
What did the Fund invest in?
(as of April 30, 2025)
| Security Type & Asset Class (as a % of Net Assets) |
||||||||
| Exchange Traded Funds |
99.1 | % | ||||||
| Equity |
61.3 | % | ||||||
| Fixed Income |
37.8 | % | ||||||
| Cash and Other Assets Less Liabilities |
0.9 | % | ||||||
Material Fund Changes
This is a summary of material Fund changes since November 1, 2024. For more information contact 1-888-310-0416.
At a meeting held on March 18-19, 2025, the Trust’s Board of Trustees (the “Board”), upon the recommendation of Equitable Investment Management, LLC, the Trust’s investment adviser, approved a Plan of Liquidation and Termination (the “Plan”) pursuant to which the Fund would liquidate and terminate on or about May 30, 2025 (the “Liquidation Date”). Pursuant to the Plan, the Fund sold its portfolio securities for cash and converted any other assets to cash or cash equivalents to pay any liabilities by the Liquidation Date. On the Liquidation Date, the Fund made a liquidating distribution to each remaining shareholder equal to the shareholder’s proportionate interest in the net assets of the Fund, in complete redemption and cancellation of the Fund’s shares held by each shareholder. The Fund terminated upon completion of the distribution.
What were the Fund costs for the last six months?
(Based on a hypothetical $10,000 investment)
| Share Class |
Costs of a $10,000 investment |
Costs paid as a percentage of a $10,000 investment |
||||
| Class I |
$27 | 0.54% |
| Fund Statistics |
||||||||
| (as of April 30, 2025) |
||||||||
| Net Assets |
$ |
1,750,887 |
||||||
| Number of Portfolio Holdings |
14 |
|||||||
| Portfolio Turnover Rate |
7% |
What did the Fund invest in?
(as of April 30, 2025)
| Security Type & Asset Class (as a % of Net Assets) |
||||||||
| Exchange Traded Funds |
98.2 | % | ||||||
| Equity |
69.6 | % | ||||||
| Fixed Income |
28.6 | % | ||||||
| Cash and Other Assets Less Liabilities |
1.8 | % | ||||||
Material Fund Changes
This is a summary of material Fund changes since November 1, 2024. For more information contact
1-888-310-0416.
At a meeting held on March
18-19,
2025, the Trust’s Board of Trustees (the “Board”), upon the recommendation of Equitable Investment Management, LLC, the Trust’s investment adviser, approved a Plan of Liquidation and Termination (the “Plan”) pursuant to which the Fund would liquidate and terminate on or about May 30, 2025 (the “Liquidation Date”). Pursuant to the Plan, the Fund sold its portfolio securities for cash and converted any other assets to cash or cash equivalents to pay any liabilities by the Liquidation Date. On the Liquidation Date, the Fund made a liquidating distribution to each remaining shareholder equal to the shareholder’s proportionate interest in the net assets of the Fund, in complete redemption and cancellation of the Fund’s shares held by each shareholder. The Fund terminated upon completion of the distribution. What were the Fund costs for the last six months?
(Based on a hypothetical $10,000 investment)
| Share Class |
Costs of a $10,000 investment |
Costs paid as a percentage of a $10,000 investment |
||||
| Class I |
$27 | 0.54% |
| Fund Statistics |
||||||||
| (as of April 30, 2025) |
||||||||
| Net Assets |
$ |
3,566,856 |
||||||
| Number of Portfolio Holdings |
14 |
|||||||
| Portfolio Turnover Rate |
4% |
What did the Fund invest in?
(as of April 30, 2025)
| Security Type & Asset Class (as a % of Net Assets) |
||||||||
| Exchange Traded Funds |
98.6 | % | ||||||
| Equity |
74.6 | % | ||||||
| Fixed Income |
24.0 | % | ||||||
| Cash and Other Assets Less Liabilities |
1.4 | % | ||||||
Material Fund Changes
This is a summary of material Fund changes since November 1, 2024. For more information contact
1-888-310-0416.
At a meeting held on March
18-19,
2025, the Trust’s Board of Trustees (the “Board”), upon the recommendation of Equitable Investment Management, LLC, the Trust’s investment adviser, approved a Plan of Liquidation and Termination (the “Plan”) pursuant to which the Fund would liquidate and terminate on or about May 30, 2025 (the “Liquidation Date”). Pursuant to the Plan, the Fund sold its portfolio securities for cash and converted any other assets to cash or cash equivalents to pay any liabilities by the Liquidation Date. On the Liquidation Date, the Fund made a liquidating distribution to each remaining shareholder equal to the shareholder’s proportionate interest in the net assets of the Fund, in complete redemption and cancellation of the Fund’s shares held by each shareholder. The Fund terminated upon completion of the distribution. What were the Fund costs for the last six months?
(Based on a hypothetical $10,000 investment)
| Share Class |
Costs of a $10,000 investment |
Costs paid as a percentage of a $10,000 investment |
||||
| Class I |
$27 | 0.54% |
| Fund Statistics |
||||||||
| (as of April 30, 2025) |
||||||||
| Net Assets |
$ |
3,799,577 |
||||||
| Number of Portfolio Holdings |
14 |
|||||||
| Portfolio Turnover Rate |
5% |
What did the Fund invest in?
(as of April 30, 2025)
| Security Type & Asset Class (as a % of Net Assets) |
||||||||
| Exchange Traded Funds |
98.6 | % | ||||||
| Equity |
79.5 | % | ||||||
| Fixed Income |
19.1 | % | ||||||
| Cash and Other Assets Less Liabilities |
1.4 | % | ||||||
Material Fund Changes
This is a summary of material Fund changes since November 1, 2024. For more information contact
1-888-310-0416.
At a meeting held on March
18-19,
2025, the Trust’s Board of Trustees (the “Board”), upon the recommendation of Equitable Investment Management, LLC, the Trust’s investment adviser, approved a Plan of Liquidation and Termination (the “Plan”) pursuant to which the Fund would liquidate and terminate on or about May 30, 2025 (the “Liquidation Date”). Pursuant to the Plan, the Fund sold its portfolio securities for cash and converted any other assets to cash or cash equivalents to pay any liabilities by the Liquidation Date. On the Liquidation Date, the Fund made a liquidating distribution to each remaining shareholder equal to the shareholder’s proportionate interest in the net assets of the Fund, in complete redemption and cancellation of the Fund’s shares held by each shareholder. The Fund terminated upon completion of the distribution. 1-888-310-0416.
What were the Fund costs for the last six months?
(Based on a hypothetical $10,000 investment)
| Share Class |
Costs of a $10,000 investment |
Costs paid as a percentage of a $10,000 investment |
||||
| Class I |
$27 | 0.53% |
| Fund Statistics |
||||||||
| (as of April 30, 2025) |
||||||||
| Net Assets |
$ |
3,982,670 |
||||||
| Number of Portfolio Holdings |
14 |
|||||||
| Portfolio Turnover Rate |
4% |
What did the Fund invest in?
(as of April 30, 2025)
| Security Type & Asset Class (as a % of Net Assets) |
||||||||
| Exchange Traded Funds |
98.6 | % | ||||||
| Equity |
84.5 | % | ||||||
| Fixed Income |
14.1 | % | ||||||
| Cash and Other Assets Less Liabilities |
1.4 | % | ||||||
Material Fund Changes
This is a summary of material Fund changes since November 1, 2024. For more information contact 1-888-310-0416.
At a meeting held on March 18-19, 2025, the Trust’s Board of Trustees (the “Board”), upon the recommendation of Equitable Investment Management, LLC, the Trust’s investment adviser, approved a Plan of Liquidation and Termination (the “Plan”) pursuant to which the Fund would liquidate and terminate on or about May 30, 2025 (the “Liquidation Date”). Pursuant to the Plan, the Fund sold its portfolio securities for cash and converted any other assets to cash or cash equivalents to pay any liabilities by the Liquidation Date. On the Liquidation Date, the Fund made a liquidating distribution to each remaining shareholder equal to the shareholder’s proportionate interest in the net assets of the Fund, in complete redemption and cancellation of the Fund’s shares held by each shareholder. The Fund terminated upon completion of the distribution.
What were the Fund costs for the last six months?
(Based on a hypothetical $10,000 investment)
| Share Class |
Costs of a $10,000 investment |
Costs paid as a percentage of a $10,000 investment |
||||
| Class I |
$27 | 0.53% |
| Fund Statistics |
||||||||
| (as of April 30, 2025) |
||||||||
| Net Assets |
$ |
3,880,288 |
||||||
| Number of Portfolio Holdings |
14 |
|||||||
| Portfolio Turnover Rate |
7% |
What did the Fund invest in?
(as of April 30, 2025)
| Security Type & Asset Class (as a % of Net Assets) |
||||||||
| Exchange Traded Funds |
98.5 | % | ||||||
| Equity |
89.4 | % | ||||||
| Fixed Income |
9.1 | % | ||||||
| Cash and Other Assets Less Liabilities |
1.5 | % | ||||||
Material Fund Changes
This is a summary of material Fund changes since November 1, 2024. For more information contact
1-888-310-0416.
At a meeting held on March
18-19,
2025, the Trust’s Board of Trustees (the “Board”), upon the recommendation of Equitable Investment Management, LLC, the Trust’s investment adviser, approved a Plan of Liquidation and Termination (the “Plan”) pursuant to which the Fund would liquidate and terminate on or about May 30, 2025 (the “Liquidation Date”). Pursuant to the Plan, the Fund sold its portfolio securities for cash and converted any other assets to cash or cash equivalents to pay any liabilities by the Liquidation Date. On the Liquidation Date, the Fund made a liquidating distribution to each remaining shareholder equal to the shareholder’s proportionate interest in the net assets of the Fund, in complete redemption and cancellation of the Fund’s shares held by each shareholder. The Fund terminated upon completion of the distribution. 1-888-310-0416.
What were the Fund costs for the last six months?
(Based on a hypothetical $10,000 investment)
Share Class |
Costs of a $10,000 investment |
Costs paid as a percentage of a $10,000 investment |
||||
Class A |
$55 | 1.10% |
Fund Statistics |
||||||||
(as of April 30, 2025) |
||||||||
Net Assets |
$ |
217,470,791 |
||||||
Number of Portfolio Holdings |
274 |
|||||||
Portfolio Turnover Rate |
17% |
What did the Fund invest in?
(as of April 30, 2025)
Sector Weightings (as a % of Net Assets) |
||||||
| Financials | 19.7 | % | ||||
| Information Technology | 19.3 | % | ||||
| Industrials | 14.8 | % | ||||
| Consumer Staples | 11.6 | % | ||||
| Consumer Discretionary | 9.3 | % | ||||
| Health Care | 8.9 | % | ||||
| Communication Services | 6.7 | % | ||||
| Utilities | 4.5 | % | ||||
| Materials | 2.2 | % | ||||
| Energy | 1.5 | % | ||||
| Real Estate | 0.7 | % | ||||
| Short-Term Investments | 0.6 | % | ||||
| Cash and Other Assets Less Liabilities | 0.2 | % | ||||
Regional Breakdown (as a % of Net Assets) |
||||||
| North America | 81.5 | % | ||||
| Europe EU | 9.6 | % | ||||
| Asia | 4.1 | % | ||||
| Europe non-EU |
2.4 | % | ||||
| Australasia | 1.6 | % | ||||
| United Kingdom | 0.6 | % | ||||
What were the Fund costs for the last six months?
(Based on a hypothetical $10,000 investment)
Share Class |
Costs of a $10,000 investment |
Costs paid as a percentage of a $10,000 investment |
||||
Class I |
$43 | 0.85% |
Fund Statistics |
||||||||
(as of April 30, 2025) |
||||||||
Net Assets |
$ |
217,470,791 |
||||||
Number of Portfolio Holdings |
274 |
|||||||
Portfolio Turnover Rate |
17% |
What did the Fund invest in?
(as of April 30, 2025)
Sector Weightings (as a % of Net Assets) |
||||||
| Financials | 19.7 | % | ||||
| Information Technology | 19.3 | % | ||||
| Industrials | 14.8 | % | ||||
| Consumer Staples | 11.6 | % | ||||
| Consumer Discretionary | 9.3 | % | ||||
| Health Care | 8.9 | % | ||||
| Communication Services | 6.7 | % | ||||
| Utilities | 4.5 | % | ||||
| Materials | 2.2 | % | ||||
| Energy | 1.5 | % | ||||
| Real Estate | 0.7 | % | ||||
| Short-Term Investments | 0.6 | % | ||||
| Cash and Other Assets Less Liabilities | 0.2 | % | ||||
Regional Breakdown (as a % of Net Assets) |
||||||
| North America | 81.5 | % | ||||
| Europe EU | 9.6 | % | ||||
| Asia | 4.1 | % | ||||
| Europe non-EU |
2.4 | % | ||||
| Australasia | 1.6 | % | ||||
| United Kingdom | 0.6 | % | ||||
1-888-310-0416.
What were the Fund costs for the last six months?
(Based on a hypothetical $10,000 investment)
Share Class |
Costs of a $10,000 investment |
Costs paid as a percentage of a $10,000 investment |
||||
Class R |
$68 | 1.35% |
Fund Statistics |
||||||||
(as of April 30, 2025) |
||||||||
Net Assets |
$ |
217,470,791 |
||||||
Number of Portfolio Holdings |
274 |
|||||||
Portfolio Turnover Rate |
17% |
What did the Fund invest in?
(as of April 30, 2025)
Sector Weightings (as a % of Net Assets) |
||||||
Financials |
19.7 | % | ||||
Information Technology |
19.3 | % | ||||
Industrials |
14.8 | % | ||||
Consumer Staples |
11.6 | % | ||||
Consumer Discretionary |
9.3 | % | ||||
Health Care |
8.9 | % | ||||
Communication Services |
6.7 | % | ||||
Utilities |
4.5 | % | ||||
Materials |
2.2 | % | ||||
Energy |
1.5 | % | ||||
Real Estate |
0.7 | % | ||||
Short-Term Investments |
0.6 | % | ||||
Cash and Other Assets Less Liabilities |
0.2 | % | ||||
Regional Breakdown (as a % of Net Assets) |
||||||
North America |
81.5 | % | ||||
Europe EU |
9.6 | % | ||||
Asia |
4.1 | % | ||||
Europe non-EU |
2.4 | % | ||||
Australasia |
1.6 | % | ||||
United Kingdom |
0.6 | % | ||||