The bar chart and table below illustrate the annual calendar year returns of the Fund based on NAV as well as the average annual Fund returns. The bar chart and table provide an indication of the risks of investing in the Fund by showing changes in the Fund’s performance from year-to-year and by showing how the Fund’s average annual total returns based on NAV compare to those of two broad-based market indices: the S&P 500 Total Return Index and the S&P 500 Price Index. Both indices have the same constituents in the same weights. However, the S&P 500 Total Return Index assumes that any dividends paid out by index constituents have been reinvested in the index and the S&P 500 Price Return Index, which measures only the price movements of index constituents, does not. Although the Outcomes the Fund seeks to provide are based upon the price performance of the Underlying ETF, the returns of the S&P 500 Total Return Index have been provided in accordance with the requirements of Form N-1A of the 1940 Act. The Fund’s performance information is accessible on the Fund’s website at www.innovatoretfs.com.
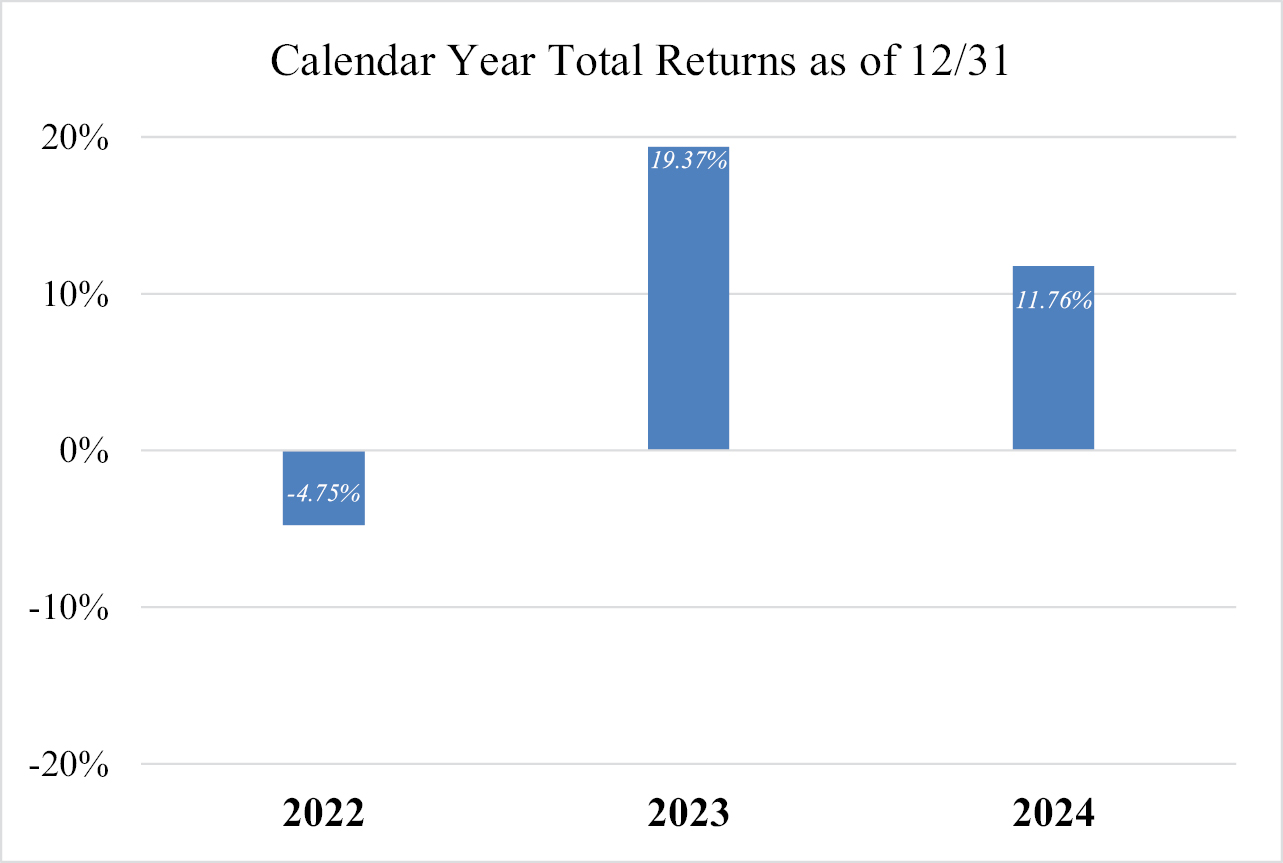
The Fund’s highest quarterly return was 7.50% (quarter ended December 31, 2023) and the Fund’s lowest quarterly return was (7.89)% (quarter ended June 30, 2022).
| Average Annual Total Return as of December 31, 2024 | ||
| Innovator U.S. Equity Accelerated 9 Buffer ETF™ – July | 1 Year | Since |
| Return Before Taxes | 11.76% | 8.50% |
| Return After Taxes on Distributions | 11.76% | 8.50% |
| Return After Taxes on Distributions and Sale of Fund Shares | 6.96% | 6.63% |
| S&P 500® Total Return Index (reflects no deduction for fees, expenses or taxes) | 25.02% | 11.05% |
| S&P 500® Price Return Index (reflects no deduction for fees, expenses or taxes) | 23.31% | 9.37% |
The Fund’s past performance (before and after taxes) is not necessarily an indication of how the Fund will perform in the future.
Returns before taxes do not reflect the effects of any income or capital gains taxes. All after-tax returns are calculated using the historical highest individual federal marginal income taxes and do not reflect the impact of any state or local tax. Returns after taxes on distributions reflect the taxed return on the payment of dividends and capital gains.
Your own actual after-tax returns will depend on your specific tax situation and may differ from what is shown here. After-tax returns are not relevant to investors who hold Shares in tax-deferred accounts such as individual retirement accounts (IRAs) or employee-sponsored retirement plans.