Pay vs Performance Disclosure - USD ($)
|
12 Months Ended |
Dec. 31, 2024 |
Dec. 31, 2023 |
Dec. 31, 2022 |
Dec. 31, 2021 |
| Pay vs Performance Disclosure |
|
|
|
|
| Pay vs Performance Disclosure, Table |
| | | | | | | | | | | | | | | | | | | | | | | | | | | | | | | | | | | | | | | | | | | | | | Pay Versus Performance | | Year | | Summary
Compensation
Table Total
for PEO | | Compensation
Actually
Paid
to PEO | | Average
Summary
Compensation
Table Total
for Non-PEO
NEOs | | Average
Compensation
Actually
Paid to
Non-PEO
NEOs | | Value of Initial Fixed $100
Investment Based On: | | Net
Loss | | | | | | Rocket Lab
Total
Shareholder
Return | | Peer Group
Total
Shareholder
Return | | | (1) | | (2) | | (3) | | (2) | | (4) | | (5) | | (6) | | | 2024 | | $ | 20,110,758 | | $ | 22,052,615 | | $ | 4,051,311 | | $ | 20,115,446 | | $ | 244 | | $ | 95 | | $ | (190,175,000) | | 2023 | | $ | 962,714 | | $ | 962,714 | | $ | 644,478 | | $ | 2,330,238 | | $ | 53 | | $ | 75 | | $ | (182,571,000) | | 2022 | | $ | 837,820 | | $ | 837,820 | | $ | 4,688,684 | | $ | 2,278,142 | | $ | 36 | | $ | 60 | | $ | (135,944,000) | | 2021 | | $ | 325,246 | | $ | 325,246 | | $ | 5,098,005 | | $ | 7,036,152 | | $ | 118 | | $ | 92 | | $ | (117,320,000) |
|
|
|
|
| Named Executive Officers, Footnote |
1.Peter Beck served as the Company’s Principal Executive (our “PEO”) for the entirety of fiscal years 2021, 2022, 2023, and 2024. The Company’s other Reported NEOs for the indicated fiscal years were as follows: •2024: A. Spice, F. Klein, and A. Kampani •2023: A. Spice and A. Kampani •2022: A. Spice, S. O’Donnell, and A. Kampani •2021: A. Spice and S. O’Donnell
|
|
|
|
| Peer Group Issuers, Footnote |
The TSR Peer Group is the ARK Space Exploration & Innovation ETF. This calculation assumes that $100 was invested in this index on August 25, 2021 (aligned with the period used in footnote #5 above).
|
|
|
|
| PEO Total Compensation Amount |
$ 20,110,758
|
$ 962,714
|
$ 837,820
|
$ 325,246
|
| PEO Actually Paid Compensation Amount |
$ 22,052,615
|
962,714
|
837,820
|
325,246
|
| Adjustment To PEO Compensation, Footnote |
Amounts reported in these columns represent (i) the total compensation reported in the Summary Compensation Table for the indicated fiscal year in the case of our PEO and (ii) the average of the total compensation reported in the Summary Compensation Table for the Reported NEOs in the indicated year for such years. 3.Amounts reported in these columns represent the compensation actually paid to our PEO for the indicated fiscal year, as calculated under Item 402(v) of Regulation S-K based on his total compensation reported in the Summary Compensation Table for the indicated fiscal years and adjusted per the PVP Rules to determine compensation actually paid. Such adjustments for 2024 are shown in the table below. | | | | | | | | | | | | | | | | | | | | | | | PEO | | +/- | | | | | | | | | | | 2024 | | | Summary Compensation Table - Total Compensation | | | | | | | | | $ | 20,110,758 | | | - | | Grant Date Fair Value of Stock Awards and Option Awards Granted in Fiscal Year | | | | | | | | | $ | 18,163,473 | | | + | | Fair Value at Fiscal Year End of Outstanding and Unvested Stock Awards and Option Awards Granted in Fiscal Year | | | | | | | | | $ | 20,105,330 | | | + | | Change in Fair Value of Outstanding and Unvested Stock Awards and Option Awards Granted in Prior Fiscal Years | | | | | | | | | $ | — | | + | | Fair Value at Vesting of Stock Awards and Option Awards Granted in Fiscal Year That Vested During Fiscal Year | | | | | | | | | $ | — | | + | | Change in Fair Value as of Vesting Date of Stock Awards and Option Awards Granted in Prior Fiscal Years For Which Applicable Vesting Conditions Were Satisfied During Fiscal Year | | | | | | | | | $ | — | | + | | Value of Dividends or other Earnings Paid on Equity Awards not Otherwise Reflected in Fair Value or Total Compensation | | | | | | | | | $ | — | | - | | Fair Value as of Prior Fiscal Year End of Stock Awards and Option Awards Granted in Prior Fiscal Years That Failed to Meet Applicable Vesting Conditions During Fiscal Year | | | | | | | | | $ | — | | = | | Compensation Actually Paid | | | | | | | | | $ | 22,052,615 | |
Equity Award values are calculated in accordance with FASB ASC Topic 718, and the valuation assumptions used to calculate fair values did not materially differ from those disclosed at the time of grant.
|
|
|
|
| Non-PEO NEO Average Total Compensation Amount |
$ 4,051,311
|
644,478
|
4,688,684
|
5,098,005
|
| Non-PEO NEO Average Compensation Actually Paid Amount |
$ 20,115,446
|
2,330,238
|
2,278,142
|
7,036,152
|
| Adjustment to Non-PEO NEO Compensation Footnote |
Amounts reported in these columns represent (i) the total compensation reported in the Summary Compensation Table for the indicated fiscal year in the case of our PEO and (ii) the average of the total compensation reported in the Summary Compensation Table for the Reported NEOs in the indicated year for such years.Amounts reported in these columns represent the average compensation actually paid to the Reported NEOs in the indicated fiscal year, as calculated under Item 402(v) of Regulation S-K based on their total compensation reported in the Summary Compensation Table for the indicated fiscal years and adjusted per the PVP Rules to determine compensation actually paid. Such adjustments for 2024 are shown in the table below. | | | | | | | | | | | | | | | | | | | | | | | NEO Average | | | | | | | | | | | | 2024 | | | Summary Compensation Table - Total Compensation | | | | | | | | | $ | 4,051,311 | | | - | | Grant Date Fair Value of Stock Awards and Option Awards Granted in Fiscal Year | | | | | | | | | $ | 3,482,404 | | | + | | Fair Value at Fiscal Year End of Outstanding and Unvested Stock Awards and Option Awards Granted in Fiscal Year | | | | | | | | | $ | 11,751,820 | | | + | | Change in Fair Value of Outstanding and Unvested Stock Awards and Option Awards Granted in Prior Fiscal Years | | | | | | | | | $ | 6,122,783 | | | + | | Fair Value at Vesting of Stock Awards and Option Awards Granted in Fiscal Year That Vested During Fiscal Year | | | | | | | | | $ | 809,099 | | | + | | Change in Fair Value as of Vesting Date of Stock Awards and Option Awards Granted in Prior Fiscal Years For Which Applicable Vesting Conditions Were Satisfied During Fiscal Year | | | | | | | | | $ | 862,838 | | | + | | Average Value of Dividends or other Earnings Paid on Equity Awards not Otherwise Reflected in Fair Value or Total Compensation | | | | | | | | | $ | — | | | - | | Fair Value as of Prior Fiscal Year End of Stock Awards and Option Awards Granted in Prior Fiscal Years That Failed to Meet Applicable Vesting Conditions During Fiscal Year | | | | | | | | | $ | — | | | = | | Compensation Actually Paid | | | | | | | | | $ | 20,115,446 | |
Please see footnote 1 for the Reported NEOs included in the average for each indicated fiscal year. Equity Award values are calculated in accordance with FASB ASC Topic 718, and the valuation assumptions used to calculate fair values did not materially differ from those disclosed at the time of grant.
|
|
|
|
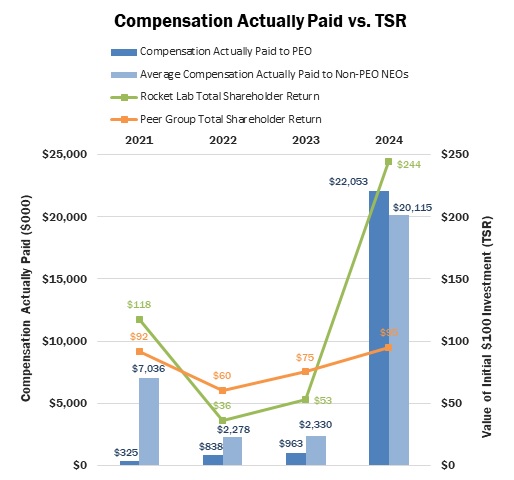
| Compensation Actually Paid vs. Total Shareholder Return |
|
|
|
|
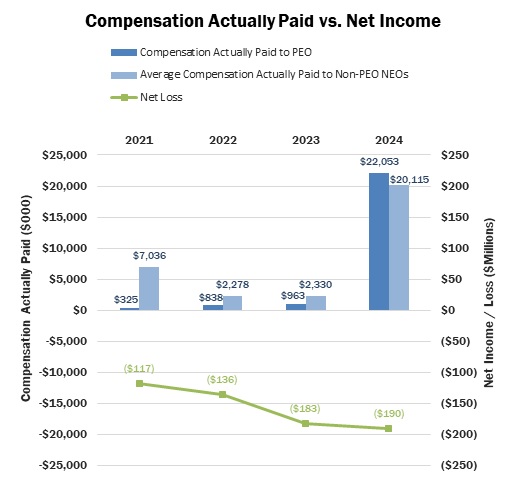
| Compensation Actually Paid vs. Net Income |
|
|
|
|
| Total Shareholder Return Amount |
$ 244
|
53
|
36
|
118
|
| Peer Group Total Shareholder Return Amount |
95
|
75
|
60
|
92
|
| Net Income (Loss) |
$ (190,175,000)
|
$ (182,571,000)
|
$ (135,944,000)
|
$ (117,320,000)
|
| PEO Name |
Peter Beck
|
|
|
|
| Additional 402(v) Disclosure |
Pursuant to Pursuant to Item 402(v) of Regulation S-K, the comparison assumes $100 was invested in our Common Stock on August 25, 2021, using the closing stock price of the end of the day we began training on the NASDAQ after our merger with Vector Acquisition Corporation (the “Business Combination”). Historic stock price performance is not necessarily indicative of future stock price performance.
|
|
|
|
| PEO | Aggregate Grant Date Fair Value of Equity Award Amounts Reported in Summary Compensation Table |
|
|
|
|
| Pay vs Performance Disclosure |
|
|
|
|
| Adjustment to Compensation, Amount |
$ (18,163,473)
|
|
|
|
| PEO | Year-end Fair Value of Equity Awards Granted in Covered Year that are Outstanding and Unvested |
|
|
|
|
| Pay vs Performance Disclosure |
|
|
|
|
| Adjustment to Compensation, Amount |
20,105,330
|
|
|
|
| PEO | Year-over-Year Change in Fair Value of Equity Awards Granted in Prior Years That are Outstanding and Unvested |
|
|
|
|
| Pay vs Performance Disclosure |
|
|
|
|
| Adjustment to Compensation, Amount |
0
|
|
|
|
| PEO | Vesting Date Fair Value of Equity Awards Granted and Vested in Covered Year |
|
|
|
|
| Pay vs Performance Disclosure |
|
|
|
|
| Adjustment to Compensation, Amount |
0
|
|
|
|
| PEO | Change in Fair Value as of Vesting Date of Prior Year Equity Awards Vested in Covered Year |
|
|
|
|
| Pay vs Performance Disclosure |
|
|
|
|
| Adjustment to Compensation, Amount |
0
|
|
|
|
| PEO | Prior Year End Fair Value of Equity Awards Granted in Any Prior Year that Fail to Meet Applicable Vesting Conditions During Covered Year |
|
|
|
|
| Pay vs Performance Disclosure |
|
|
|
|
| Adjustment to Compensation, Amount |
0
|
|
|
|
| PEO | Dividends or Other Earnings Paid on Equity Awards not Otherwise Reflected in Total Compensation for Covered Year |
|
|
|
|
| Pay vs Performance Disclosure |
|
|
|
|
| Adjustment to Compensation, Amount |
0
|
|
|
|
| Non-PEO NEO | Aggregate Grant Date Fair Value of Equity Award Amounts Reported in Summary Compensation Table |
|
|
|
|
| Pay vs Performance Disclosure |
|
|
|
|
| Adjustment to Compensation, Amount |
(3,482,404)
|
|
|
|
| Non-PEO NEO | Year-end Fair Value of Equity Awards Granted in Covered Year that are Outstanding and Unvested |
|
|
|
|
| Pay vs Performance Disclosure |
|
|
|
|
| Adjustment to Compensation, Amount |
11,751,820
|
|
|
|
| Non-PEO NEO | Year-over-Year Change in Fair Value of Equity Awards Granted in Prior Years That are Outstanding and Unvested |
|
|
|
|
| Pay vs Performance Disclosure |
|
|
|
|
| Adjustment to Compensation, Amount |
6,122,783
|
|
|
|
| Non-PEO NEO | Vesting Date Fair Value of Equity Awards Granted and Vested in Covered Year |
|
|
|
|
| Pay vs Performance Disclosure |
|
|
|
|
| Adjustment to Compensation, Amount |
809,099
|
|
|
|
| Non-PEO NEO | Change in Fair Value as of Vesting Date of Prior Year Equity Awards Vested in Covered Year |
|
|
|
|
| Pay vs Performance Disclosure |
|
|
|
|
| Adjustment to Compensation, Amount |
862,838
|
|
|
|
| Non-PEO NEO | Prior Year End Fair Value of Equity Awards Granted in Any Prior Year that Fail to Meet Applicable Vesting Conditions During Covered Year |
|
|
|
|
| Pay vs Performance Disclosure |
|
|
|
|
| Adjustment to Compensation, Amount |
0
|
|
|
|
| Non-PEO NEO | Dividends or Other Earnings Paid on Equity Awards not Otherwise Reflected in Total Compensation for Covered Year |
|
|
|
|
| Pay vs Performance Disclosure |
|
|
|
|
| Adjustment to Compensation, Amount |
$ 0
|
|
|
|