In accordance with rules adopted by the SEC pursuant to the Dodd-Frank Act, below is the disclosure regarding executive compensation for Harvey S. Kanter, our principal executive officer (“PEO”), our non-PEO NEOs, and our Company's financial performance for the fiscal years listed below. The Compensation Committee did not consider the pay versus performance disclosure below in making its pay decisions for any of the years shown. The amounts shown for “Compensation Actually Paid” have been calculated in accordance with Item 402(v) of Regulation S-K and do not reflect compensation actually earned, realized, or received by our NEO's. These amounts reflect total compensation per the “Summary Compensation Table,” with certain required adjustments as described in the following table and footnotes.
For more information concerning our philosophy of how we align compensation for our NEOs to certain performance metrics, refer to the “Compensation Discussion and Analysis” above.
|
|
|
|
|
|
|
|
|
Value of Initial Fixed $100 Investment Based on: |
|
|
|
|
|
||||||||||
Year |
Summary Compensation Table |
|
Compensation Actually Paid |
|
Average Summary Compensation Table Total for Non-PEO NEOs ($)(2) |
|
Average Compensation Actually Paid to Non-PEO NEOs ($)(3) |
|
Total Shareholder Return |
|
Peer Group Total Shareholder Return |
|
Net Income (Loss) |
|
Adjusted EBITDA |
|
||||||||
(a) |
(b) |
|
(c) |
|
(d) |
|
(e) |
|
(f) |
|
(g) |
|
(h) |
|
(i) |
|
||||||||
2024 |
$ |
2,894,568 |
|
$ |
844,299 |
|
$ |
822,773 |
|
$ |
712,029 |
|
$ |
245.05 |
|
$ |
173.20 |
|
$ |
3,055 |
|
$ |
19,913 |
|
2023 |
$ |
5,959,023 |
|
$ |
2,431,858 |
|
$ |
929,250 |
|
$ |
464,918 |
|
$ |
374.77 |
|
$ |
141.23 |
|
$ |
27,854 |
|
$ |
55,893 |
|
2022 |
$ |
4,221,881 |
|
$ |
7,093,048 |
|
$ |
954,500 |
|
$ |
1,482,529 |
|
$ |
663.06 |
|
$ |
124.59 |
|
$ |
89,123 |
|
$ |
73,808 |
|
2021 |
$ |
3,616,278 |
|
$ |
13,729,433 |
|
$ |
909,752 |
|
$ |
1,878,242 |
|
$ |
390.09 |
|
$ |
114.78 |
|
$ |
56,713 |
|
$ |
76,862 |
|
2020 |
$ |
2,110,929 |
|
$ |
2,270,835 |
|
$ |
579,831 |
|
$ |
563,984 |
|
$ |
72.07 |
|
$ |
106.22 |
|
$ |
(64,538 |
) |
$ |
(24,197 |
) |
Fiscal Year: |
2020 |
|
2021 |
|
2022 |
|
2023 |
|
2024 |
|
|||||
Summary Compensation Table ("SCT") Total for PEO (column (b)) |
$ |
2,110,929 |
|
$ |
3,616,278 |
|
$ |
4,221,881 |
|
$ |
5,959,023 |
|
$ |
2,894,568 |
|
Deduct - SCT "Stock Award" value |
|
— |
|
|
(443,260 |
) |
|
(829,813 |
) |
|
(2,765,938 |
) |
|
(722,498 |
) |
Deduct - SCT "Option Award" value |
|
(436,880 |
) |
|
(207,035 |
) |
|
— |
|
|
— |
|
|
— |
|
Add or Deduct - year-over-year change in fair value of equity awards granted in prior year that vested in current year |
|
(81,267 |
) |
|
4,203,022 |
|
|
227,798 |
|
|
(1,201,866 |
) |
|
(242,851 |
) |
Add or Deduct - year-over-year change in fair value of equity awards granted in prior year that are outstanding and unvested as of the current year-end |
|
(59,872 |
) |
|
4,412,134 |
|
|
2,474,982 |
|
|
(1,524,935 |
) |
|
(1,722,956 |
) |
Add - year-end fair value of equity awards granted in the current year that are outstanding and unvested as of the current year-end |
|
737,926 |
|
|
2,148,295 |
|
|
998,200 |
|
|
1,982,373 |
|
|
638,036 |
|
Add or Deduct - vesting date fair value of equity awards granted and vested in current year |
|
— |
|
|
— |
|
|
— |
|
|
— |
|
|
— |
|
Deduct - fair value as of prior year end of equity awards granted in prior years that failed to vest in the current year |
|
— |
|
|
— |
|
|
— |
|
|
(16,800 |
) |
|
— |
|
Compensation Actually Paid to PEO (column (c)) |
$ |
2,270,835 |
|
$ |
13,729,433 |
|
$ |
7,093,048 |
|
$ |
2,431,858 |
|
$ |
844,299 |
|
Fiscal Year: |
2020 |
|
2021 |
|
2022 |
|
2023 |
|
2024 |
|
|||||
Average Summary Compensation Table Total for Non-PEO NEOs (column (d)) |
$ |
579,831 |
|
$ |
909,752 |
|
$ |
954,500 |
|
$ |
929,250 |
|
$ |
822,773 |
|
Deduct - SCT "Stock Award" value |
|
— |
|
|
(79,352 |
) |
|
(156,331 |
) |
|
(69,310 |
) |
|
(142,471 |
) |
Deduct - SCT "Option Award" value |
|
(53,009 |
) |
|
(44,496 |
) |
|
— |
|
|
— |
|
|
— |
|
Add or Deduct - year-over-year change in fair value of equity awards granted in prior year that vested in current year |
|
(44,540 |
) |
|
122,413 |
|
|
31,521 |
|
|
(158,089 |
) |
|
(43,328 |
) |
Add or Deduct - year-over-year change in fair value of equity awards granted in prior year that are outstanding and unvested as of the current year-end |
|
(14,636 |
) |
|
524,801 |
|
|
464,934 |
|
|
(302,611 |
) |
|
(49,931 |
) |
Add - year-end fair value of equity awards granted in the current year that are outstanding and unvested as of the current year-end |
|
96,338 |
|
|
445,124 |
|
|
187,905 |
|
|
65,679 |
|
|
124,986 |
|
Add or Deduct - vesting date fair value of equity awards granted and vested in current year |
|
— |
|
|
— |
|
|
— |
|
|
— |
|
|
— |
|
Deduct - fair value as of prior year end of equity awards granted in prior years that failed to vest in the current year |
|
— |
|
|
— |
|
|
— |
|
|
— |
|
|
— |
|
Average Compensation Actually Paid to Non-PEO NEOs (column (e)) |
$ |
563,984 |
|
$ |
1,878,242 |
|
$ |
1,482,529 |
|
$ |
464,918 |
|
$ |
712,029 |
|
Fiscal Year: |
2020 |
|
2021 |
|
2022 |
|
2023 |
|
2024 |
|
|||||
Summary Compensation Table ("SCT") Total for PEO (column (b)) |
$ |
2,110,929 |
|
$ |
3,616,278 |
|
$ |
4,221,881 |
|
$ |
5,959,023 |
|
$ |
2,894,568 |
|
Deduct - SCT "Stock Award" value |
|
— |
|
|
(443,260 |
) |
|
(829,813 |
) |
|
(2,765,938 |
) |
|
(722,498 |
) |
Deduct - SCT "Option Award" value |
|
(436,880 |
) |
|
(207,035 |
) |
|
— |
|
|
— |
|
|
— |
|
Add or Deduct - year-over-year change in fair value of equity awards granted in prior year that vested in current year |
|
(81,267 |
) |
|
4,203,022 |
|
|
227,798 |
|
|
(1,201,866 |
) |
|
(242,851 |
) |
Add or Deduct - year-over-year change in fair value of equity awards granted in prior year that are outstanding and unvested as of the current year-end |
|
(59,872 |
) |
|
4,412,134 |
|
|
2,474,982 |
|
|
(1,524,935 |
) |
|
(1,722,956 |
) |
Add - year-end fair value of equity awards granted in the current year that are outstanding and unvested as of the current year-end |
|
737,926 |
|
|
2,148,295 |
|
|
998,200 |
|
|
1,982,373 |
|
|
638,036 |
|
Add or Deduct - vesting date fair value of equity awards granted and vested in current year |
|
— |
|
|
— |
|
|
— |
|
|
— |
|
|
— |
|
Deduct - fair value as of prior year end of equity awards granted in prior years that failed to vest in the current year |
|
— |
|
|
— |
|
|
— |
|
|
(16,800 |
) |
|
— |
|
Compensation Actually Paid to PEO (column (c)) |
$ |
2,270,835 |
|
$ |
13,729,433 |
|
$ |
7,093,048 |
|
$ |
2,431,858 |
|
$ |
844,299 |
|
Fiscal Year: |
2020 |
|
2021 |
|
2022 |
|
2023 |
|
2024 |
|
|||||
Average Summary Compensation Table Total for Non-PEO NEOs (column (d)) |
$ |
579,831 |
|
$ |
909,752 |
|
$ |
954,500 |
|
$ |
929,250 |
|
$ |
822,773 |
|
Deduct - SCT "Stock Award" value |
|
— |
|
|
(79,352 |
) |
|
(156,331 |
) |
|
(69,310 |
) |
|
(142,471 |
) |
Deduct - SCT "Option Award" value |
|
(53,009 |
) |
|
(44,496 |
) |
|
— |
|
|
— |
|
|
— |
|
Add or Deduct - year-over-year change in fair value of equity awards granted in prior year that vested in current year |
|
(44,540 |
) |
|
122,413 |
|
|
31,521 |
|
|
(158,089 |
) |
|
(43,328 |
) |
Add or Deduct - year-over-year change in fair value of equity awards granted in prior year that are outstanding and unvested as of the current year-end |
|
(14,636 |
) |
|
524,801 |
|
|
464,934 |
|
|
(302,611 |
) |
|
(49,931 |
) |
Add - year-end fair value of equity awards granted in the current year that are outstanding and unvested as of the current year-end |
|
96,338 |
|
|
445,124 |
|
|
187,905 |
|
|
65,679 |
|
|
124,986 |
|
Add or Deduct - vesting date fair value of equity awards granted and vested in current year |
|
— |
|
|
— |
|
|
— |
|
|
— |
|
|
— |
|
Deduct - fair value as of prior year end of equity awards granted in prior years that failed to vest in the current year |
|
— |
|
|
— |
|
|
— |
|
|
— |
|
|
— |
|
Average Compensation Actually Paid to Non-PEO NEOs (column (e)) |
$ |
563,984 |
|
$ |
1,878,242 |
|
$ |
1,482,529 |
|
$ |
464,918 |
|
$ |
712,029 |
|
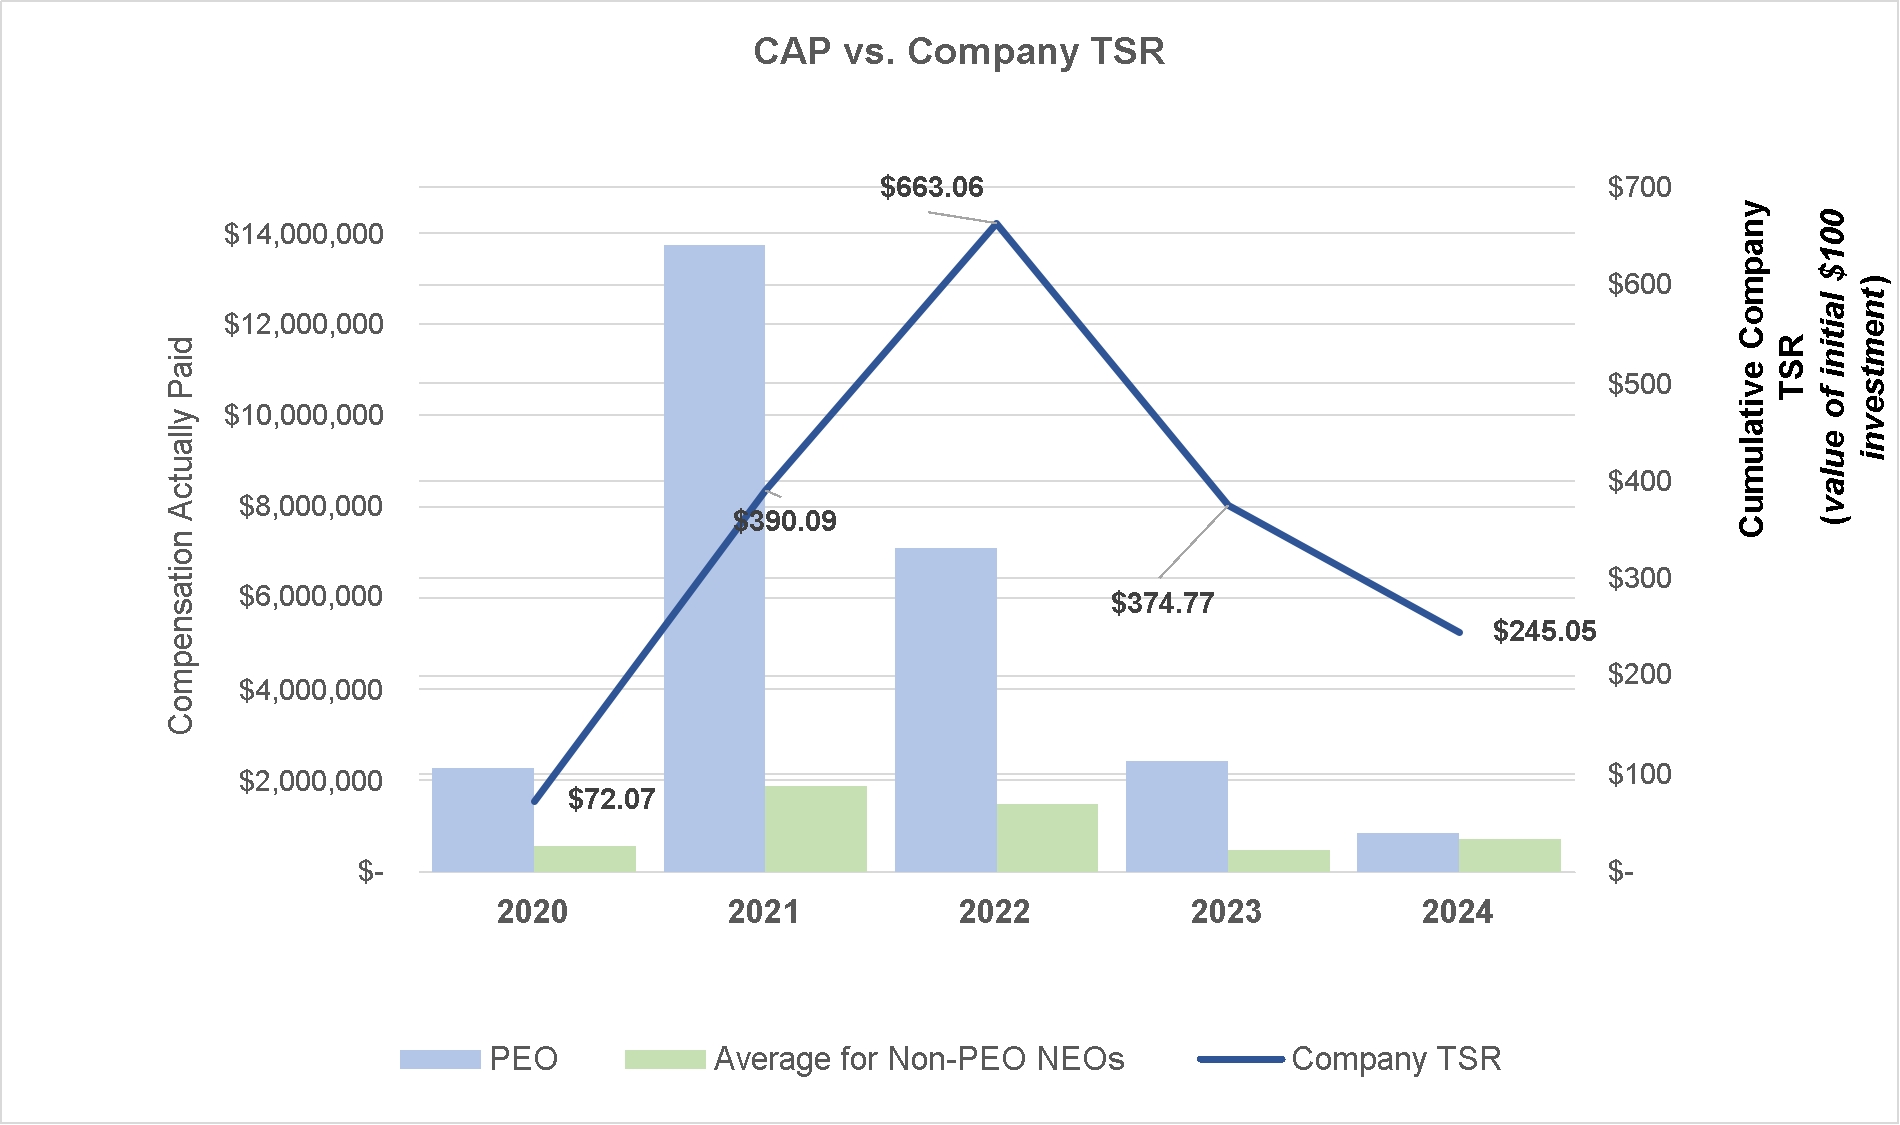
Description of Relationship Between PEO and Non-PEO CAP and Company's TSR
The following chart sets forth the relationship between CAP to our PEO, the average of CAP to our Non-PEO NEOs, and the Company’s cumulative TSR over the five most recently completed fiscal years.
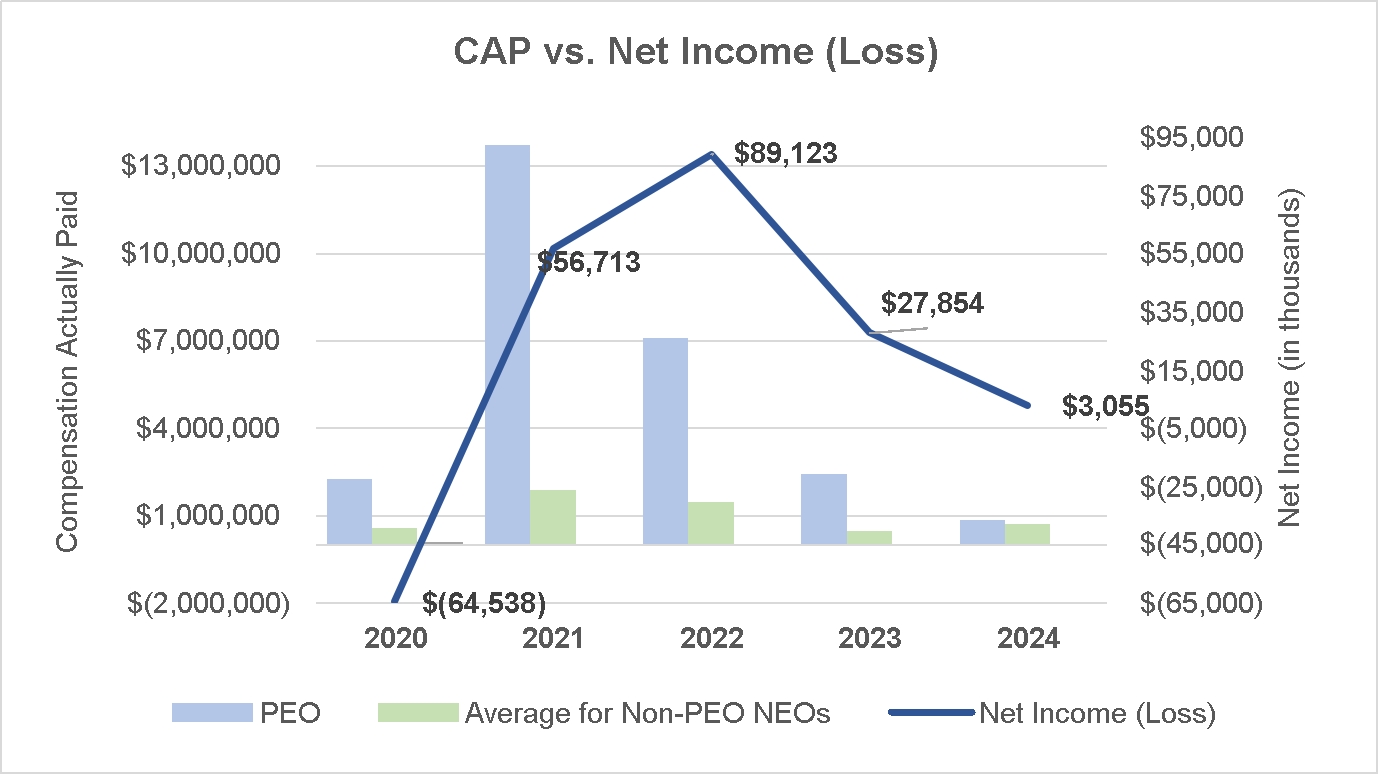
Description of Relationship Between PEO and Non-PEO NEO CAP and Net Income (Loss)
The following chart sets forth the relationship between CAP to our PEO, the average of CAP to our Non-PEO NEOs and net income (loss) during the five most recently completed fiscal years. Net income for fiscal 2022 included a non-recurring tax benefit related to the release of our tax valuation allowance of $31.6 million.
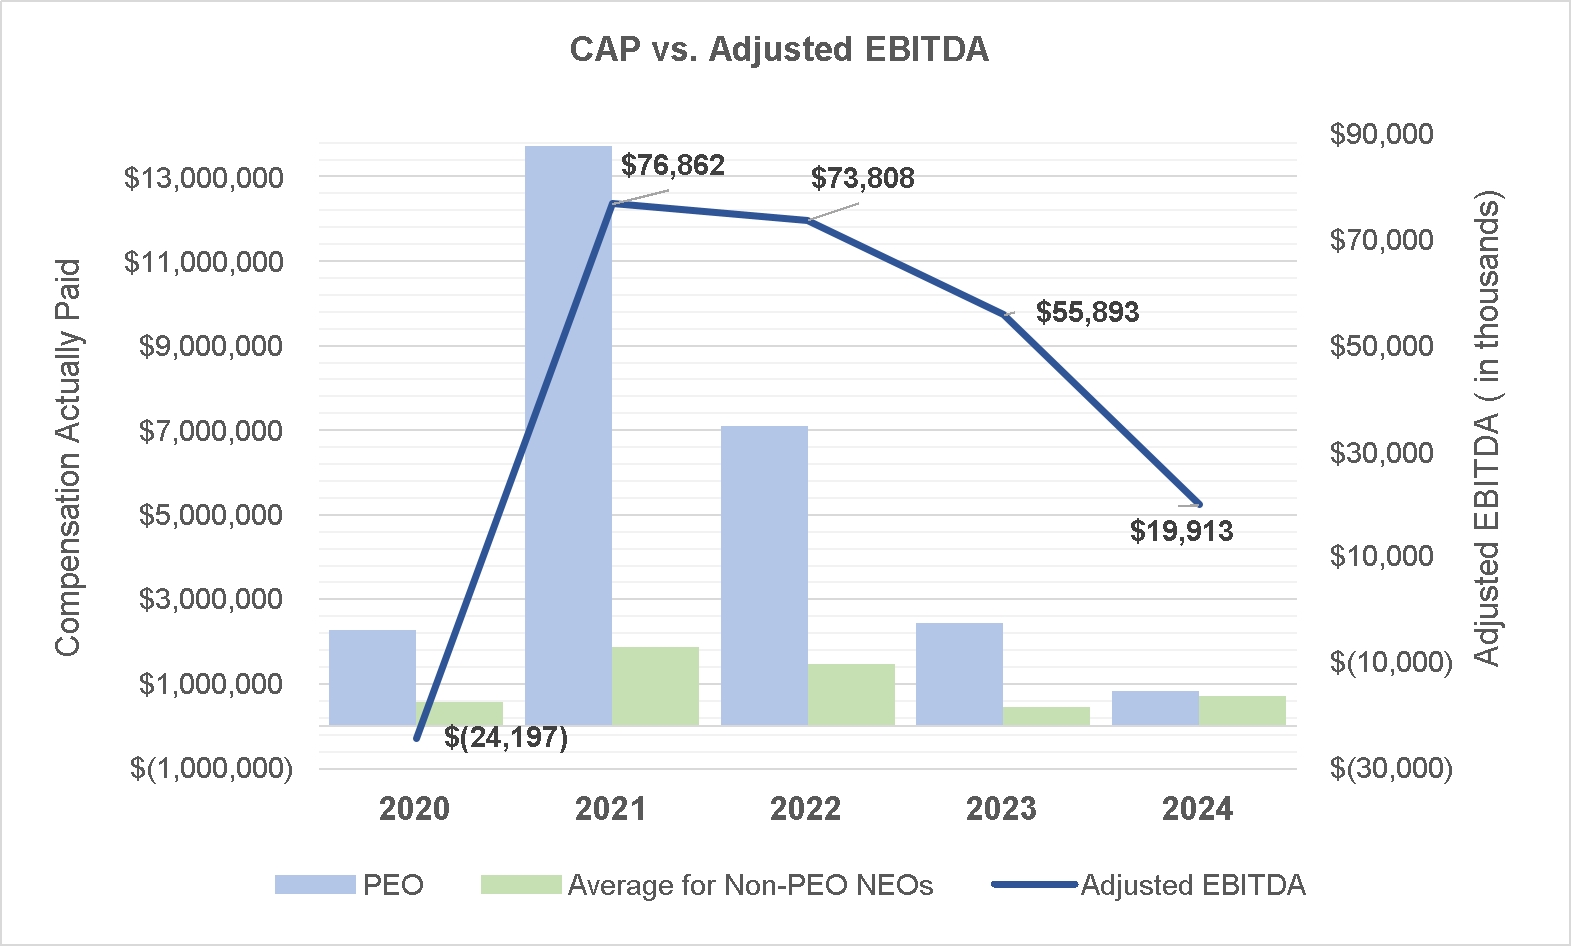
Description of Relationship Between PEO and Non-PEO NEO CAP and Company-Selected Measure
The following chart sets forth the relationship between CAP to our PEO, the average of CAP to our Non-PEO NEOs, and Adjusted EBITDA, a non-GAAP measure (our Company-Selected Measure) during the five most recently completed fiscal years.
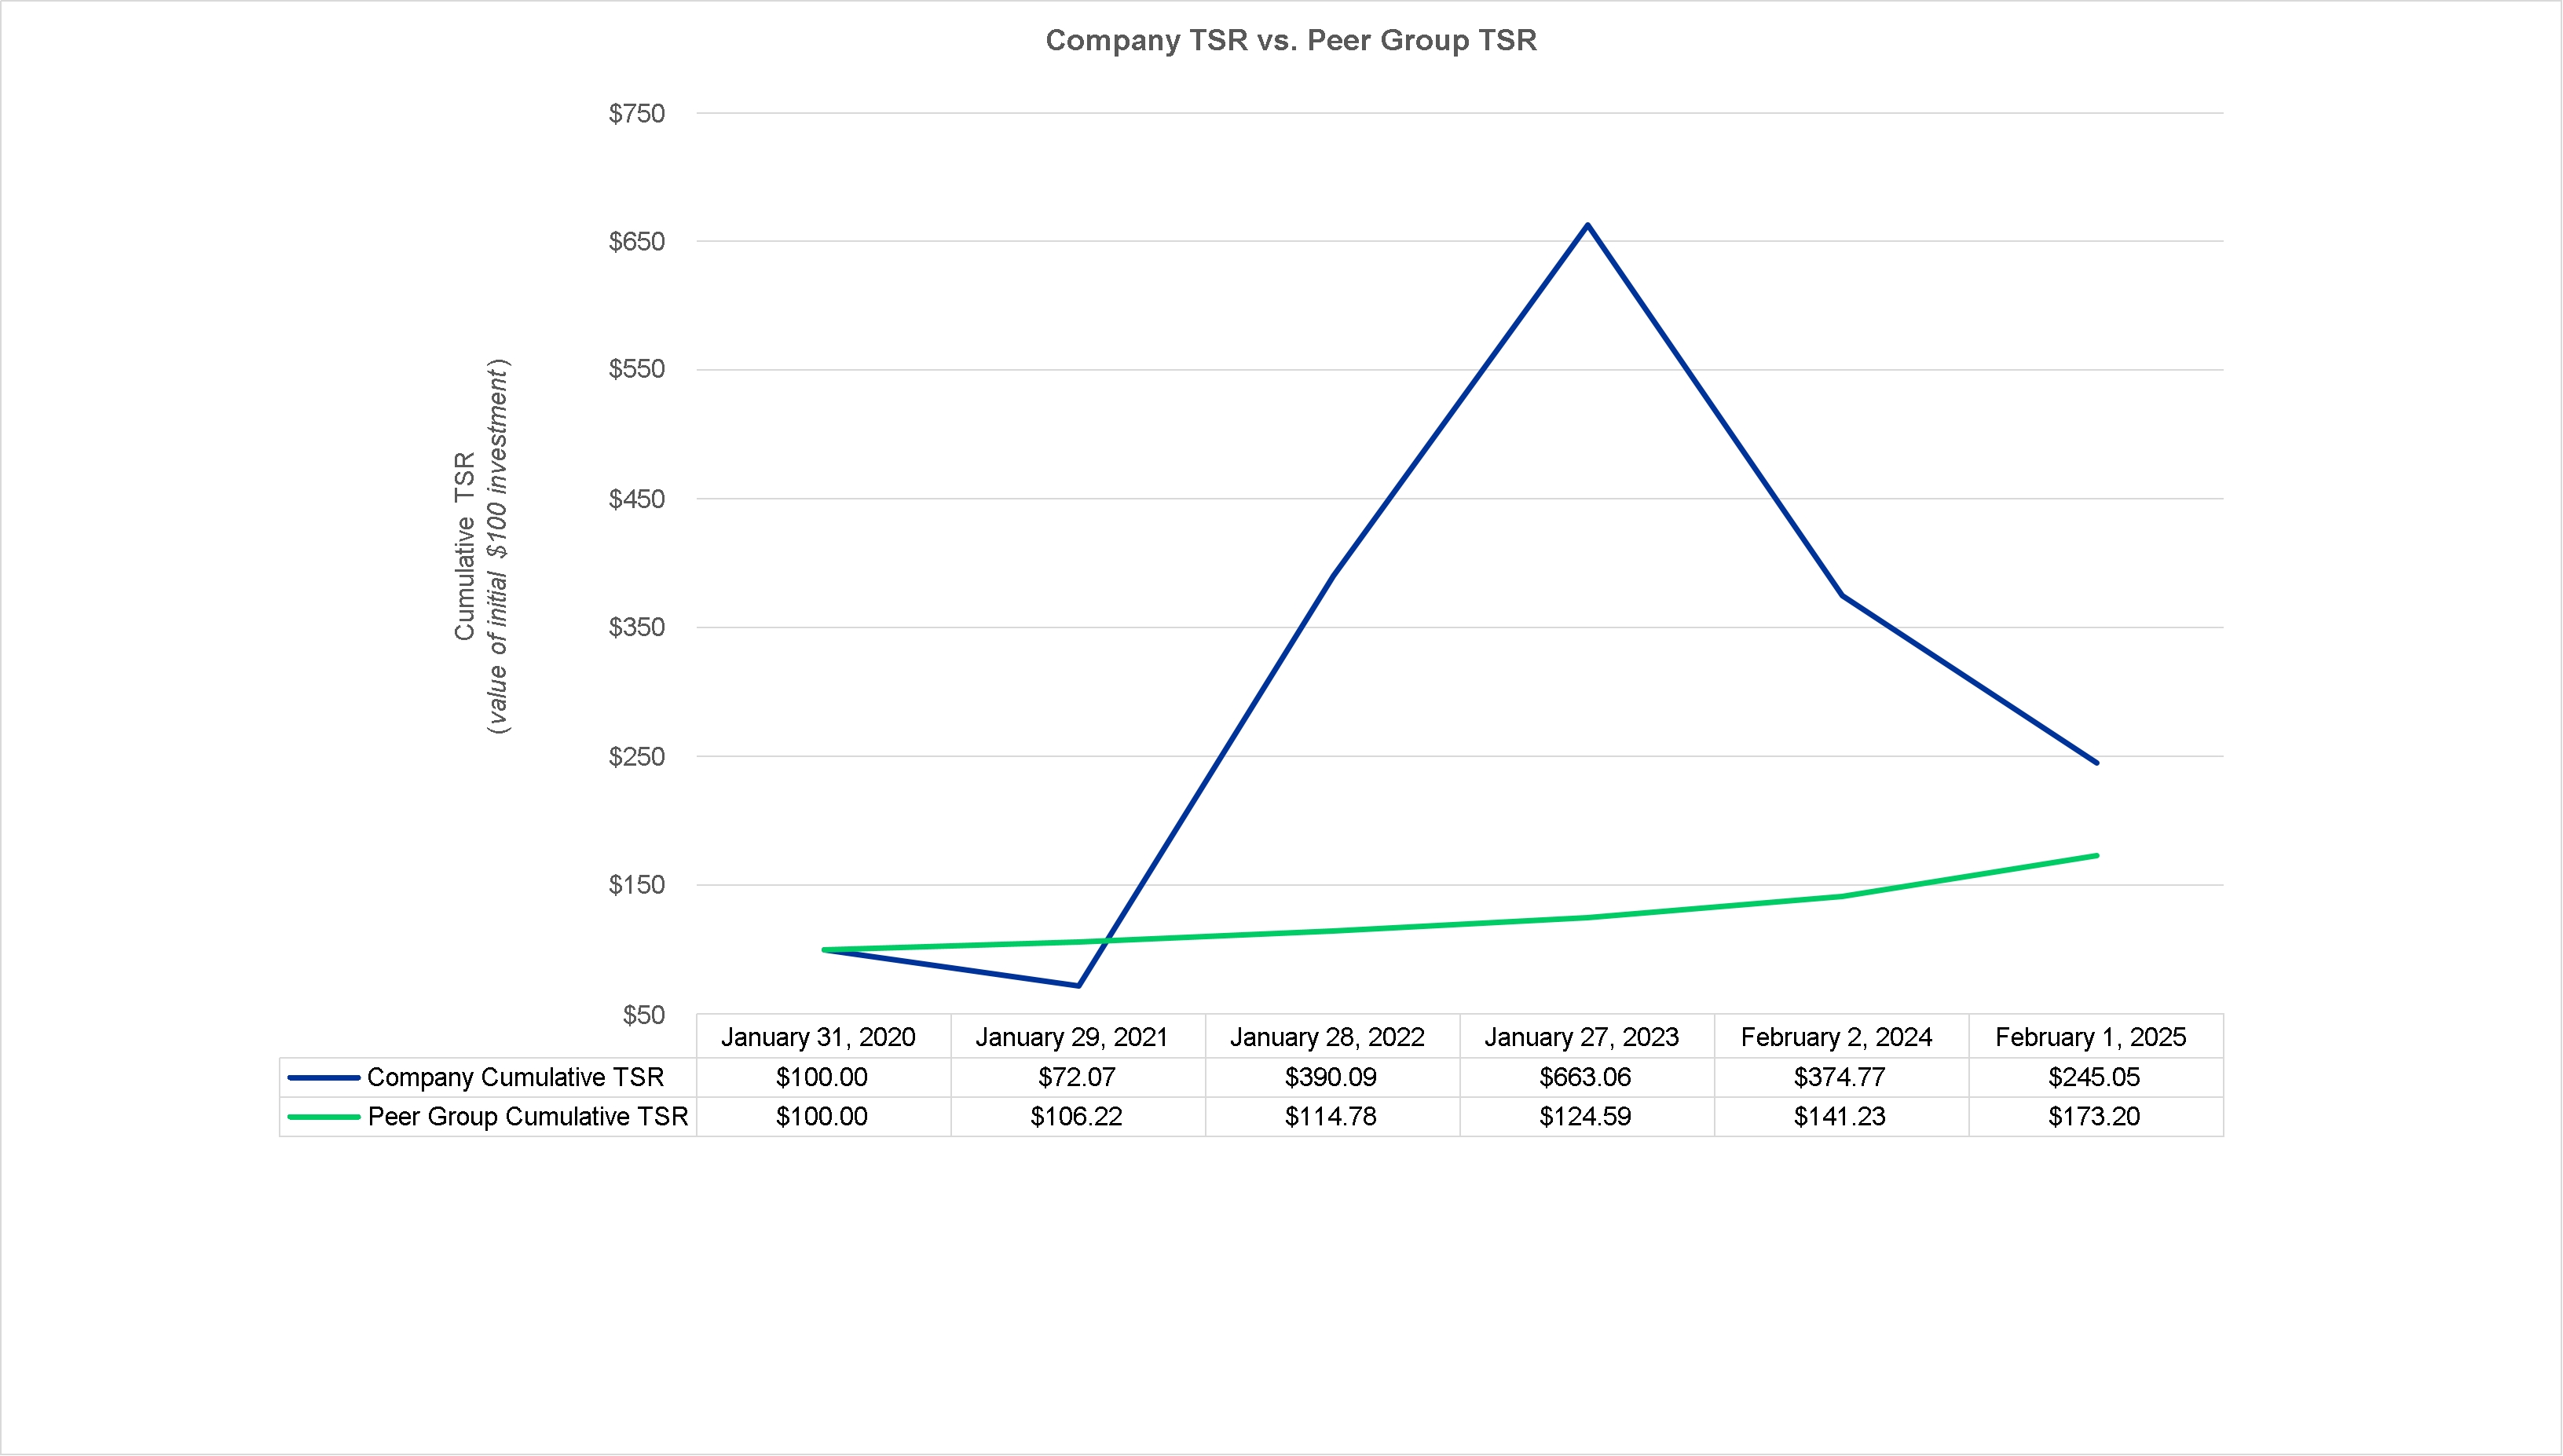
Description of Relationship Between the Company TSR and Peer Group Cumulative TSR
The following chart shows the cumulative TSR of the Company, assuming an initial fixed $100 investment and computed in accordance with the requirements of Item 402(v) of Regulation S-K, versus the Dow Jones U.S. Apparel Retailers, assuming an initial fixed $100 investment on January 30, 2020 (end of fiscal 2019) and computed in accordance with the requirements of Item 402(v) of Regulation S-K.
Tabular List of Most Important Performance Measures
As discussed above in more detail under "Compensation Discussion and Analysis - Compensation Components and Fiscal 2024 Compensation Decisions," the Compensation Committee uses several financial and operational performance measures in making its compensation decisions. The following list represents the most important financial performance measures used by the Company to link CAP to our PEO and other NEOs to Company performance for fiscal 2024.
• Adjusted EBITDA (a non-GAAP measure) |
• TSR |
• Sales Growth |