Shareholder Report
Apr. 30, 2025
USD ($)
$ / shares
This report describes changes
to the Fund that occurred during the reporting period.
WHAT
WERE THE FUND COSTS FOR THE LAST YEAR? (based
on a hypothetical $10,000 investment)
|
Class
Name |
Costs
of a $10,000 investment
|
Costs
paid as a percentage of a $10,000
investment*
|
|
Class
A |
$99
|
1.01%
|
HOW
DID THE FUND PERFORM LAST YEAR AND WHAT AFFECTED ITS PERFORMANCE?
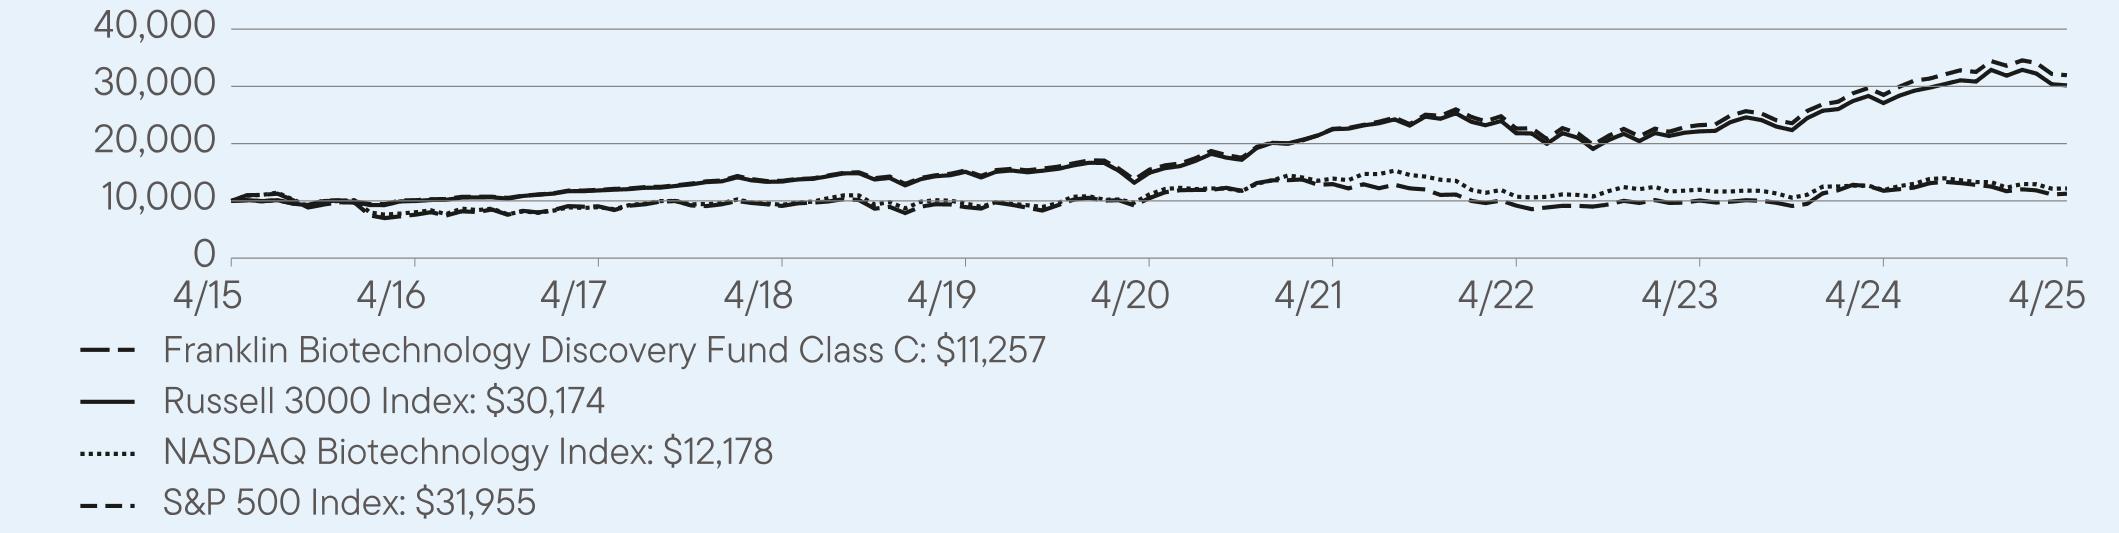
For the twelve months ended April
30, 2025, Class A shares of
Franklin Biotechnology Discovery Fund returned -3.64%.
The Fund compares its performance
to the NASDAQ Biotechnology Index and the S&P 500 Index, which returned 2.36% and 12.10%, respectively, for
the same period.
PERFORMANCE
HIGHLIGHTS
|
Top
contributors to performance: | |
|
↑
|
Overweighting
and stock selection in the health care services industry, where the shares of lead contributor Guardant Health more
than doubled in value. |
|
↑
|
Underweighting
and stock selection in the life sciences tools and services industry, where the Fund had no exposure to numerous
index component companies that sustained double-digit percentage losses. |
|
↑
|
Exceptionally
high one-year returns for several overweighted or off-benchmark holdings in the biotechnology and pharmaceuticals
industries, including key contributors Insmed, Benitec Biopharma, Arcutis Biotherapeutics, PTC Therapeutics, uniQure
(purchased during the period), ARS Pharmaceuticals and Argenx. Notably, the Fund’s lack of investment in poor-performing
index component company Moderna boosted relative returns more than any of these actively-held contributors. |
|
Top
detractors from performance: | |
|
↓
|
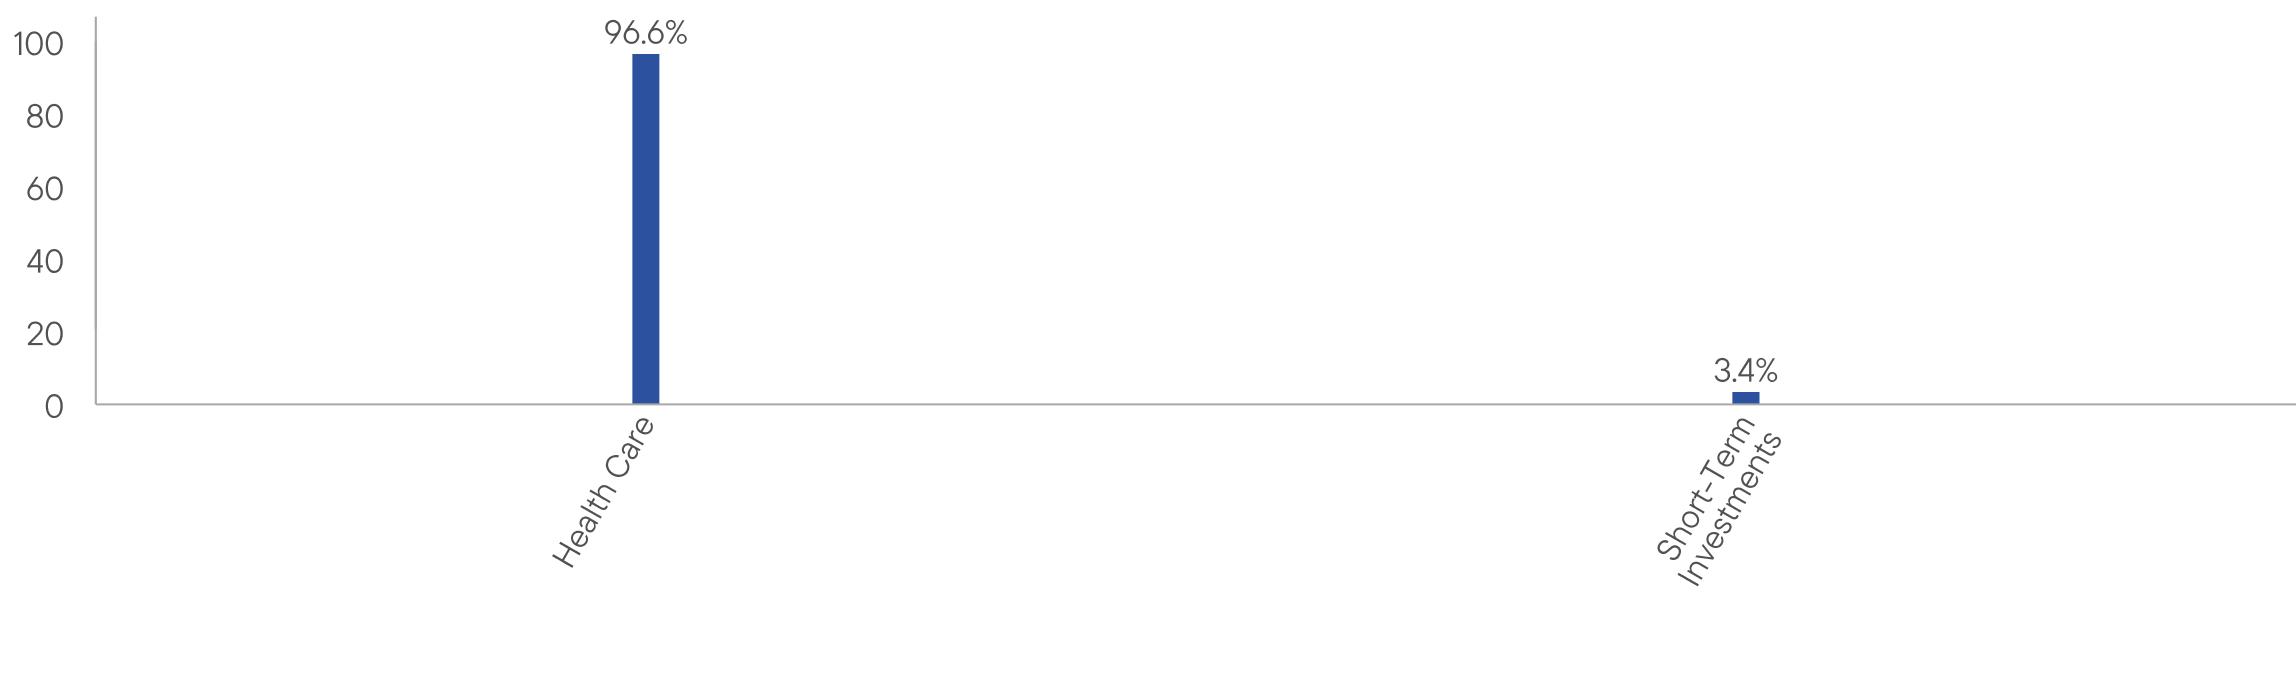
Stock
selection and overall declines in the biotechnology industry (averaging just over 79% of the portfolio), while biotech firms tracked
by the benchmark index appreciated; several overweight or off-benchmark holdings sustained double-digit percentage losses,
including Cullinan Therapeutics, Day One Biopharmaceuticals, HilleVax, and Spyre Therapeutics. |
|
↓
|
Underweighting
in Gilead Sciences, Alnylam Pharmaceuticals and other biotech stocks that posted exceptional gains, as well as the
Fund’s lack of investment in Summit Therapeutics, which saw a roughly sixfold increase on the benchmark index. |
|
↓
|
Stock
selection in the pharmaceuticals industry (averaging 13.4% of total net assets), where EyePoint Pharmaceuticals, Contineum Therapeutics
and Alto Neuroscience were among the key detractors. Elsewhere in the portfolio, a substantial loss for off-index bioprocessing
and laboratory supplies specialist Avantor was a key hindrance in the life sciences tools and services industry. |

AVERAGE
ANNUAL TOTAL RETURNS (%) Period
Ended April 30, 2025
|
|
1
Year |
5
Year |
10
Year |
|
Class
A |
-3.64
|
2.16
|
1.93
|
|
Class
A (with sales charge) |
-8.93
|
1.01
|
1.36
|
|
Russell
3000 Index |
11.40
|
15.12
|
11.68
|
|
NASDAQ
Biotechnology Index |
2.36
|
1.78
|
1.99
|
|
S&P
500 Index |
12.10
|
15.61
|
12.32
|
For current month-end performance,
please call Franklin Templeton at (800)
DIAL BEN/342-5236 or visit https://www.franklintempleton.com/investments/options/mutual-funds.
Important data provider notices
and terms available at www.franklintempletondatasources.com.
KEY
FUND STATISTICS (as
of April 30, 2025)
|
Total
Net Assets |
$707,416,266
|
|
Total
Number of Portfolio Holdings*
|
95
|
|
Total
Management Fee Paid |
$5,096,357
|
|
Portfolio
Turnover Rate |
21.87%
|

HOW
HAS THE FUND CHANGED?
Effective September
30, 2024, Wendy
Lam, Ph.D. stepped down as portfolio manager of the Fund.
This is a summary of a change
to the Fund since May 1, 2024.
For more complete information, you may review the Fund’s current prospectus
and any applicable supplements and the Fund’s next prospectus, which we expect to be available by September
1, 2025,
at https://www.franklintempleton.com/regulatory-fund-documents or upon request at (800) DIAL BEN/342-5236 or
prospectus.us.franklintempleton@fisglobal.com.
at https://www.franklintempleton.com/regulatory-fund-documents or upon request at (800) DIAL BEN/342-5236 or
prospectus.us.franklintempleton@fisglobal.com.
This report describes changes
to the Fund that occurred during the reporting period.
WHAT
WERE THE FUND COSTS FOR THE LAST YEAR? (based
on a hypothetical $10,000 investment)
|
Class
Name |
Costs
of a $10,000 investment
|
Costs
paid as a percentage of a $10,000
investment*
|
|
Class
C |
$172
|
1.76%
|
HOW
DID THE FUND PERFORM LAST YEAR AND WHAT AFFECTED ITS PERFORMANCE?
For the twelve months ended April
30, 2025, Class C shares of
Franklin Biotechnology Discovery Fund returned -4.36%.
The Fund compares its performance
to the NASDAQ Biotechnology Index and the S&P 500 Index, which returned 2.36% and 12.10%, respectively, for
the same period.
PERFORMANCE
HIGHLIGHTS
|
Top
contributors to performance: | |
|
↑
|
Overweighting
and stock selection in the health care services industry, where the shares of lead contributor Guardant Health more
than doubled in value. |
|
↑
|
Underweighting
and stock selection in the life sciences tools and services industry, where the Fund had no exposure to numerous
index component companies that sustained double-digit percentage losses. |
|
↑
|
Exceptionally
high one-year returns for several overweighted or off-benchmark holdings in the biotechnology and pharmaceuticals
industries, including key contributors Insmed, Benitec Biopharma, Arcutis Biotherapeutics, PTC Therapeutics, uniQure
(purchased during the period), ARS Pharmaceuticals and Argenx. Notably, the Fund’s lack of investment in poor-performing
index component company Moderna boosted relative returns more than any of these actively-held contributors. |
|
Top
detractors from performance: | |
|
↓
|
Stock
selection and overall declines in the biotechnology industry (averaging just over 79% of the portfolio), while biotech firms tracked
by the benchmark index appreciated; several overweight or off-benchmark holdings sustained double-digit percentage losses,
including Cullinan Therapeutics, Day One Biopharmaceuticals, HilleVax, and Spyre Therapeutics. |
|
↓
|
Underweighting
in Gilead Sciences, Alnylam Pharmaceuticals and other biotech stocks that posted exceptional gains, as well as the
Fund’s lack of investment in Summit Therapeutics, which saw a roughly sixfold increase on the benchmark index. |
|
↓
|
Stock
selection in the pharmaceuticals industry (averaging 13.4% of total net assets), where EyePoint Pharmaceuticals, Contineum Therapeutics
and Alto Neuroscience were among the key detractors. Elsewhere in the portfolio, a substantial loss for off-index bioprocessing
and laboratory supplies specialist Avantor was a key hindrance in the life sciences tools and services industry. |
AVERAGE
ANNUAL TOTAL RETURNS (%) Period
Ended April 30, 2025
|
|
1
Year |
5
Year |
10
Year |
|
Class
C |
-4.36
|
1.43
|
1.19
|
|
Class
C (with sales charge) |
-5.23
|
1.43
|
1.19
|
|
Russell
3000 Index |
11.40
|
15.12
|
11.68
|
|
NASDAQ
Biotechnology Index |
2.36
|
1.78
|
1.99
|
|
S&P
500 Index |
12.10
|
15.61
|
12.32
|
For current month-end performance,
please call Franklin Templeton at (800)
DIAL BEN/342-5236 or visit https://www.franklintempleton.com/investments/options/mutual-funds.
Important data provider notices
and terms available at www.franklintempletondatasources.com.
KEY
FUND STATISTICS (as
of April 30, 2025)
|
Total
Net Assets |
$707,416,266
|
|
Total
Number of Portfolio Holdings*
|
95
|
|
Total
Management Fee Paid |
$5,096,357
|
|
Portfolio
Turnover Rate |
21.87%
|
HOW
HAS THE FUND CHANGED?
Effective September
30, 2024, Wendy
Lam, Ph.D. stepped down as portfolio manager of the Fund.
This is a summary of a change
to the Fund since May 1, 2024.
For more complete information, you may review the Fund’s current prospectus
and any applicable supplements and the Fund’s next prospectus, which we expect to be available by September
1, 2025,
at https://www.franklintempleton.com/regulatory-fund-documents or upon request at (800) DIAL BEN/342-5236 or
prospectus.us.franklintempleton@fisglobal.com.
at https://www.franklintempleton.com/regulatory-fund-documents or upon request at (800) DIAL BEN/342-5236 or
prospectus.us.franklintempleton@fisglobal.com.
This report describes changes
to the Fund that occurred during the reporting period.
WHAT
WERE THE FUND COSTS FOR THE LAST YEAR? (based
on a hypothetical $10,000 investment)
|
Class
Name |
Costs
of a $10,000 investment
|
Costs
paid as a percentage of a $10,000
investment*
|
|
Class
R6 |
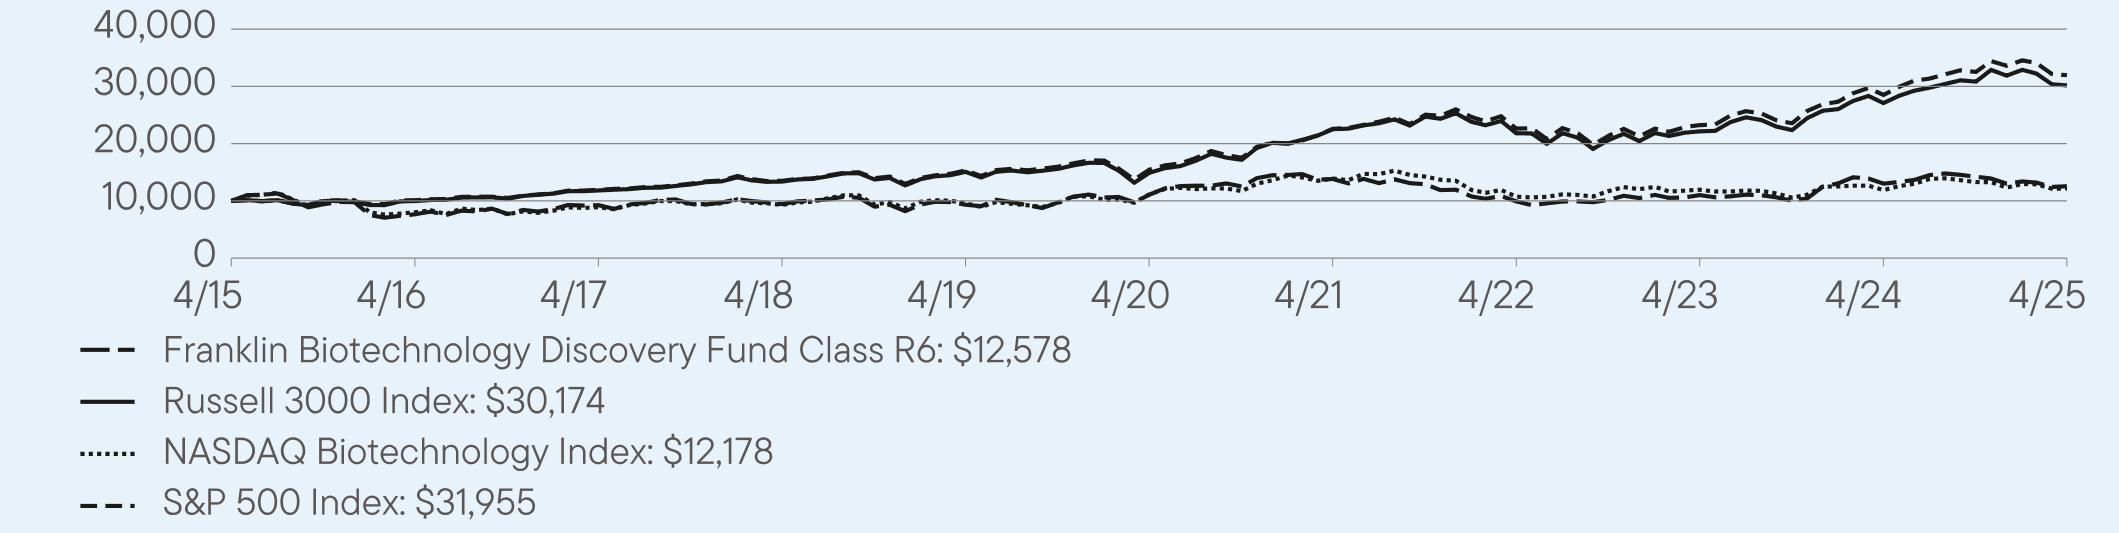
$65
|
0.66%
|
HOW
DID THE FUND PERFORM LAST YEAR AND WHAT AFFECTED ITS PERFORMANCE?
For the twelve months ended April
30, 2025, Class R6 shares of
Franklin Biotechnology Discovery Fund returned -3.31%.
The Fund compares its performance
to the NASDAQ Biotechnology Index and the S&P 500 Index, which returned 2.36% and 12.10%, respectively, for
the same period.
PERFORMANCE
HIGHLIGHTS
|
Top
contributors to performance: | |
|
↑
|
Overweighting
and stock selection in the health care services industry, where the shares of lead contributor Guardant Health more
than doubled in value. |
|
↑
|
Underweighting
and stock selection in the life sciences tools and services industry, where the Fund had no exposure to numerous
index component companies that sustained double-digit percentage losses. |
|
↑
|
Exceptionally
high one-year returns for several overweighted or off-benchmark holdings in the biotechnology and pharmaceuticals
industries, including key contributors Insmed, Benitec Biopharma, Arcutis Biotherapeutics, PTC Therapeutics, uniQure
(purchased during the period), ARS Pharmaceuticals and Argenx. Notably, the Fund’s lack of investment in poor-performing
index component company Moderna boosted relative returns more than any of these actively-held contributors. |
|
Top
detractors from performance: | |
|
↓
|
Stock
selection and overall declines in the biotechnology industry (averaging just over 79% of the portfolio), while biotech firms tracked
by the benchmark index appreciated; several overweight or off-benchmark holdings sustained double-digit percentage losses,
including Cullinan Therapeutics, Day One Biopharmaceuticals, HilleVax, and Spyre Therapeutics. |
|
↓
|
Underweighting
in Gilead Sciences, Alnylam Pharmaceuticals and other biotech stocks that posted exceptional gains, as well as the
Fund’s lack of investment in Summit Therapeutics, which saw a roughly sixfold increase on the benchmark index. |
|
↓
|
Stock
selection in the pharmaceuticals industry (averaging 13.4% of total net assets), where EyePoint Pharmaceuticals, Contineum Therapeutics
and Alto Neuroscience were among the key detractors. Elsewhere in the portfolio, a substantial loss for off-index bioprocessing
and laboratory supplies specialist Avantor was a key hindrance in the life sciences tools and services industry. |
AVERAGE
ANNUAL TOTAL RETURNS (%) Period
Ended April 30, 2025
|
|
1
Year |
5
Year |
10
Year |
|
Class
R6 |
-3.31
|
2.54
|
2.32
|
|
Russell
3000 Index |
11.40
|
15.12
|
11.68
|
|
NASDAQ
Biotechnology Index |
2.36
|
1.78
|
1.99
|
|
S&P
500 Index |
12.10
|
15.61
|
12.32
|
For current month-end performance,
please call Franklin Templeton at (800)
DIAL BEN/342-5236 or visit https://www.franklintempleton.com/investments/options/mutual-funds.
Important data provider notices
and terms available at www.franklintempletondatasources.com.
KEY
FUND STATISTICS (as
of April 30, 2025)
|
Total
Net Assets |
$707,416,266
|
|
Total
Number of Portfolio Holdings*
|
95
|
|
Total
Management Fee Paid |
$5,096,357
|
|
Portfolio
Turnover Rate |
21.87%
|

HOW
HAS THE FUND CHANGED?
Effective September
30, 2024, Wendy
Lam, Ph.D. stepped down as portfolio manager of the Fund.
This is a summary of a change
to the Fund since May 1, 2024.
For more complete information, you may review the Fund’s current prospectus
and any applicable supplements and the Fund’s next prospectus, which we expect to be available by September
1, 2025,
at https://www.franklintempleton.com/regulatory-fund-documents or upon request at (800) DIAL BEN/342-5236 or
prospectus.us.franklintempleton@fisglobal.com.
at https://www.franklintempleton.com/regulatory-fund-documents or upon request at (800) DIAL BEN/342-5236 or
prospectus.us.franklintempleton@fisglobal.com.
This report describes changes
to the Fund that occurred during the reporting period.
WHAT
WERE THE FUND COSTS FOR THE LAST YEAR? (based
on a hypothetical $10,000 investment)
|
Class
Name |
Costs
of a $10,000 investment
|
Costs
paid as a percentage of a $10,000
investment*
|
|
Advisor
Class |
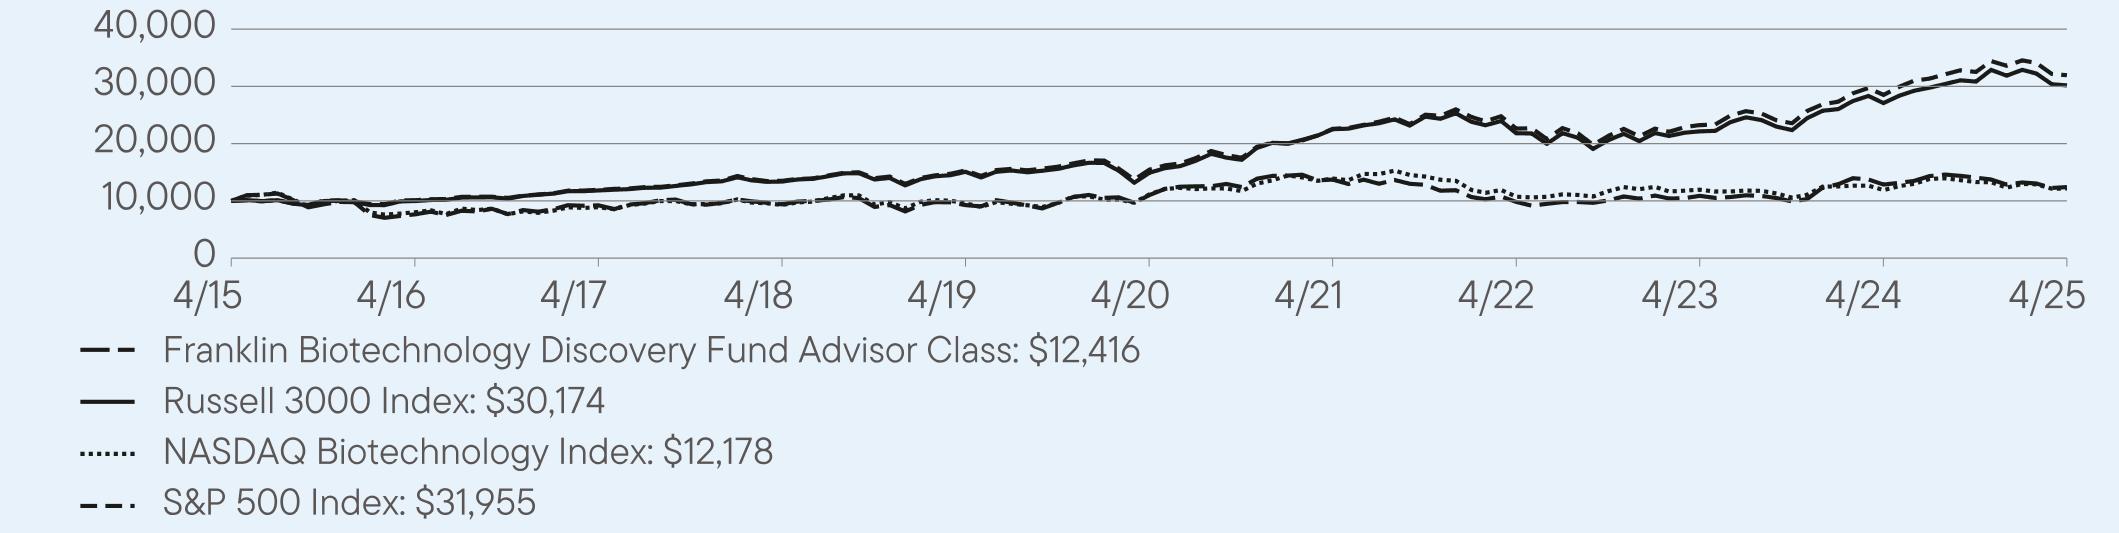
$75
|
0.76%
|
HOW
DID THE FUND PERFORM LAST YEAR AND WHAT AFFECTED ITS PERFORMANCE?
For the twelve months ended April
30, 2025, Advisor Class shares
of Franklin Biotechnology Discovery Fund returned -3.41%.
The Fund compares its performance
to the NASDAQ Biotechnology Index and the S&P 500 Index, which returned 2.36% and 12.10%, respectively,
for the same period.
PERFORMANCE
HIGHLIGHTS
|
Top
contributors to performance: | |
|
↑
|
Overweighting
and stock selection in the health care services industry, where the shares of lead contributor Guardant Health more
than doubled in value. |
|
↑
|
Underweighting
and stock selection in the life sciences tools and services industry, where the Fund had no exposure to numerous
index component companies that sustained double-digit percentage losses. |
|
↑
|
Exceptionally
high one-year returns for several overweighted or off-benchmark holdings in the biotechnology and pharmaceuticals
industries, including key contributors Insmed, Benitec Biopharma, Arcutis Biotherapeutics, PTC Therapeutics, uniQure
(purchased during the period), ARS Pharmaceuticals and Argenx. Notably, the Fund’s lack of investment in poor-performing
index component company Moderna boosted relative returns more than any of these actively-held contributors. |
|
Top
detractors from performance: | |
|
↓
|
Stock
selection and overall declines in the biotechnology industry (averaging just over 79% of the portfolio), while biotech firms tracked
by the benchmark index appreciated; several overweight or off-benchmark holdings sustained double-digit percentage losses,
including Cullinan Therapeutics, Day One Biopharmaceuticals, HilleVax, and Spyre Therapeutics. |
|
↓
|
Underweighting
in Gilead Sciences, Alnylam Pharmaceuticals and other biotech stocks that posted exceptional gains, as well as the
Fund’s lack of investment in Summit Therapeutics, which saw a roughly sixfold increase on the benchmark index. |
|
↓
|
Stock
selection in the pharmaceuticals industry (averaging 13.4% of total net assets), where EyePoint Pharmaceuticals, Contineum Therapeutics
and Alto Neuroscience were among the key detractors. Elsewhere in the portfolio, a substantial loss for off-index bioprocessing
and laboratory supplies specialist Avantor was a key hindrance in the life sciences tools and services industry. |
AVERAGE
ANNUAL TOTAL RETURNS (%) Period
Ended April 30, 2025
|
|
1
Year |
5
Year |
10
Year |
|
Advisor
Class |
-3.41
|
2.42
|
2.19
|
|
Russell
3000 Index |
11.40
|
15.12
|
11.68
|
|
NASDAQ
Biotechnology Index |
2.36
|
1.78
|
1.99
|
|
S&P
500 Index |
12.10
|
15.61
|
12.32
|
For current month-end performance,
please call Franklin Templeton at (800)
DIAL BEN/342-5236 or visit https://www.franklintempleton.com/investments/options/mutual-funds.
Important data provider notices
and terms available at www.franklintempletondatasources.com.
KEY
FUND STATISTICS (as
of April 30, 2025)
|
Total
Net Assets |
$707,416,266
|
|
Total
Number of Portfolio Holdings*
|
95
|
|
Total
Management Fee Paid |
$5,096,357
|
|
Portfolio
Turnover Rate |
21.87%
|

HOW
HAS THE FUND CHANGED?
Effective September
30, 2024, Wendy
Lam, Ph.D. stepped down as portfolio manager of the Fund.
This is a summary of a change
to the Fund since May 1, 2024.
For more complete information, you may review the Fund’s current prospectus
and any applicable supplements and the Fund’s next prospectus, which we expect to be available by September
1, 2025,
at https://www.franklintempleton.com/regulatory-fund-documents or upon request at (800) DIAL BEN/342-5236 or
prospectus.us.franklintempleton@fisglobal.com.
at https://www.franklintempleton.com/regulatory-fund-documents or upon request at (800) DIAL BEN/342-5236 or
prospectus.us.franklintempleton@fisglobal.com.
This report describes changes
to the Fund that occurred during the reporting period.
WHAT
WERE THE FUND COSTS FOR THE LAST YEAR? (based
on a hypothetical $10,000 investment)
|
Class
Name |
Costs
of a $10,000 investment
|
Costs
paid as a percentage of a $10,000
investment*
|
|
Class
A |
$88
|
0.85%
|
HOW
DID THE FUND PERFORM LAST YEAR AND WHAT AFFECTED ITS PERFORMANCE?
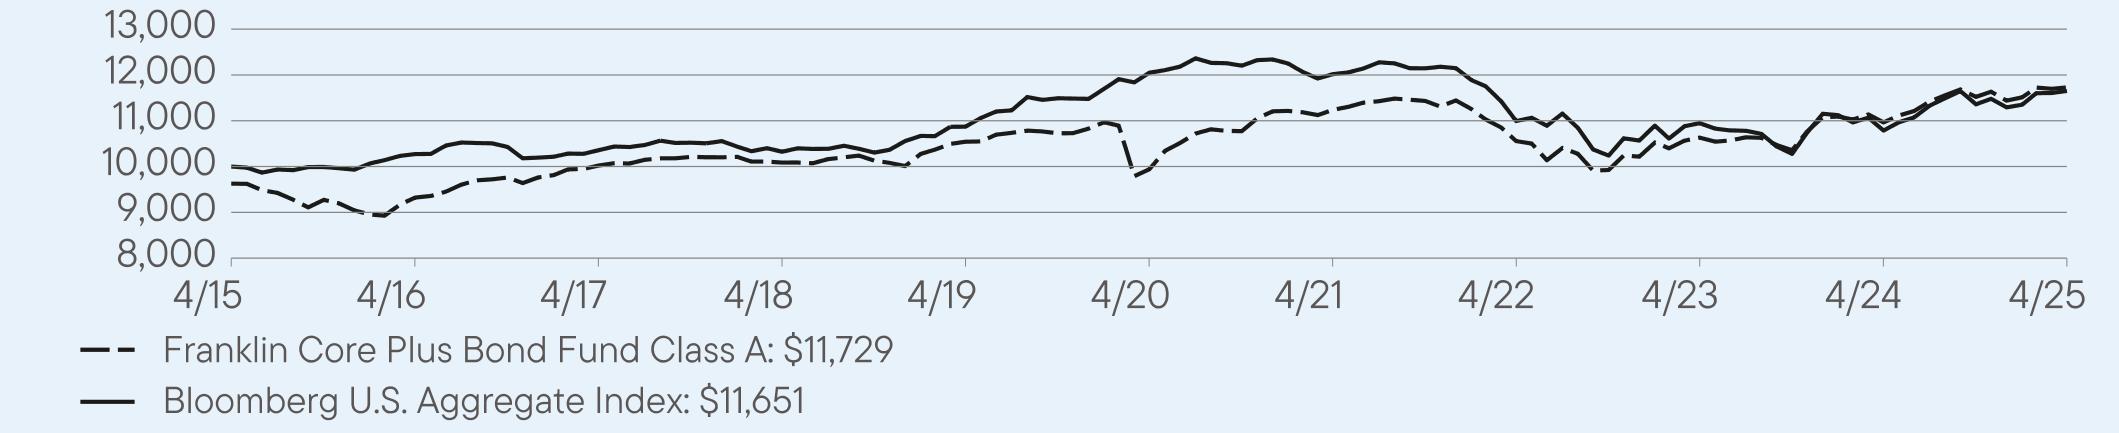
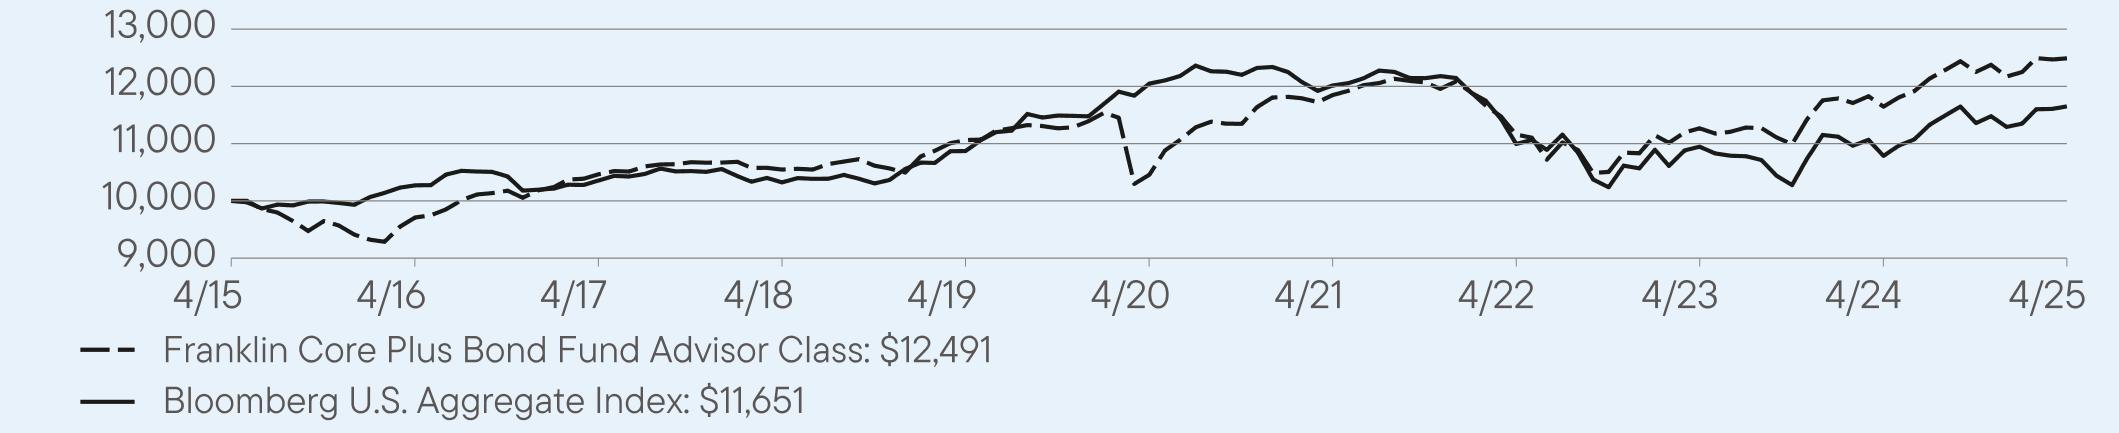
For the twelve months ended April
30, 2024, Class A shares of
Franklin Core Plus Bond Fund returned 6.98%.
The Fund compares its performance
to the Bloomberg U.S. Aggregate Index, which returned 8.02% for the same period.
PERFORMANCE
HIGHLIGHTS
|
Top
contributors to performance: | |
|
↑
|
Overweight
allocation to high-yield (HY) corporate bonds, senior secured floating-rate bank loans and collateralized loan obligations.
|
|
↑
|
Security
selection in investment-grade (IG) corporate bonds. |
|
↑
|
Exposure
to the two- and five-year portions of the yield curve. |
|
Top
detractors from performance: | |
|
↓
|
Exposure
to the 10-, 20- and 30-year portions of the yield curve. |
|
↓
|
Underweight
allocation to agency mortgage-backed securities (MBS). |
|
↓
|
Security
selection in HY corporate bonds. |
Use of derivatives and the
impact on performance:
The Fund utilized bond futures
to manage duration exposure and high-yield credit default swap (CDS) to manage the Fund’s credit exposure.
In aggregate, these instruments detracted slightly from performance.
AVERAGE
ANNUAL TOTAL RETURNS (%) Period
Ended April 30, 2025
|
|
1
Year |
5
Year |
10
Year |
|
Class
A |
6.98
|
3.37
|
2.00
|
|
Class
A (with sales charge) |
2.91
|
2.57
|
1.61
|
|
Bloomberg
U.S. Aggregate Index |
8.02
|
-0.67
|
1.54
|
For current month-end performance,
please call Franklin Templeton at (800)
DIAL BEN/342-5236 or visit https://www.franklintempleton.com/investments/options/mutual-funds.
Important data provider notices
and terms available at www.franklintempletondatasources.com.
KEY
FUND STATISTICS (as
of April 30, 2025)
|
Total
Net Assets |
$2,468,245,569
|
|
Total
Number of Portfolio Holdings*
|
719
|
|
Total
Management Fee Paid |
$10,452,494
|
|
Portfolio
Turnover Rate |
156.08%
|

HOW
HAS THE FUND CHANGED?
Effective December
11, 2024, the
Fund changed its name from the “Franklin Strategic Income Fund” to the “Franklin Core Plus Bond Fund”.
In addition, effective November
12, 2024, the Fund’s investment strategies were revised to reflect: (i) the Fund’s new core plus strategy, which
means that the Fund invests primarily in investment-grade securities, but also may invest up to 30% of its assets in below investment-grade
securities to potentially increase returns; and (ii) the Fund’s targeted average portfolio duration, which, under normal market
conditions, is estimated to be within one and a half years of the average portfolio duration of the Fund’s benchmark, the Bloomberg
U.S. Aggregate Index. Effective December 11, 2024, in connection with the Fund’s name change, the Fund added a principal investment
policy to reflect that, under normal market conditions, the Fund invests at least 80% of its net assets in bonds including derivative
instruments or other investments that have economic characteristics similar to bonds.
Also, effective September 30,
2024, Michael V. Salm was added as a portfolio manager of the Fund.
Finally, effective January 1,
2025, the investment manager agreed to waive fees and/or reimburse operating expenses (excluding the Rule
12b-1 fees, acquired fund fees and expenses, and certain non-routine expenses or costs, such as those relating to litigation, indemnification,
reorganizations and liquidations) for the Fund so that the ratio of total annual fund operating expenses will not exceed 0.58%
for each share class except Class R6 and 0.48% for Class R6.
This is a summary of certain
changes to the Fund since May
1, 2024. For more complete information, you may review the Fund’s current prospectus
and any applicable supplements and the Fund’s next prospectus, which we expect to be available by September
1, 2025, at https://www.franklintempleton.com/regulatory-fund-documents
or upon request at (800)
DIAL BEN/342-5236
or
prospectus.us.franklintempleton@fisglobal.com.
prospectus.us.franklintempleton@fisglobal.com.
This report describes changes
to the Fund that occurred during the reporting period.
WHAT
WERE THE FUND COSTS FOR THE LAST YEAR? (based
on a hypothetical $10,000 investment)
|
Class
Name |
Costs
of a $10,000 investment
|
Costs
paid as a percentage of a $10,000
investment*
|
|
Class
C |
$130
|
1.26%
|
HOW
DID THE FUND PERFORM LAST YEAR AND WHAT AFFECTED ITS PERFORMANCE?
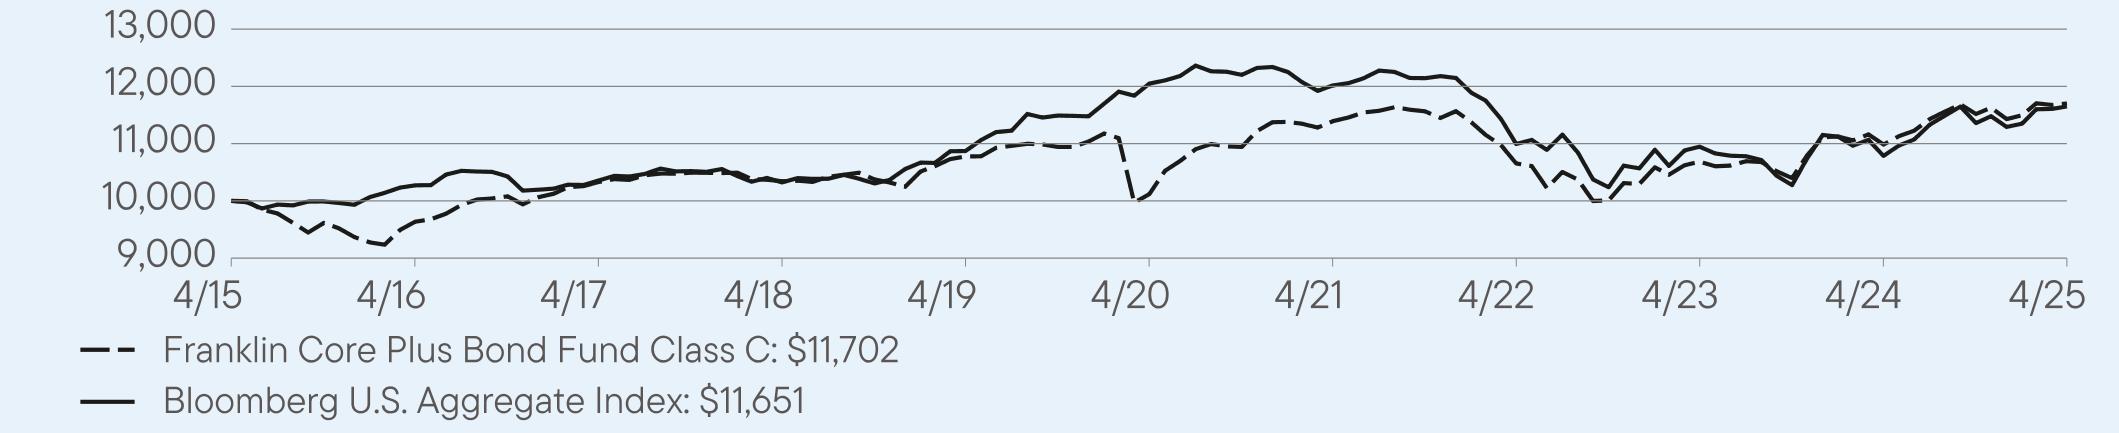
For the twelve months ended April
30, 2024, Class C shares of
Franklin Core Plus Bond Fund returned 6.53%.
The Fund compares its performance
to the Bloomberg U.S. Aggregate Index, which returned 8.02% for the same period.
PERFORMANCE
HIGHLIGHTS
|
Top
contributors to performance: | |
|
↑
|
Overweight
allocation to high-yield (HY) corporate bonds, senior secured floating-rate bank loans and collateralized loan obligations.
|
|
↑
|
Security
selection in investment-grade (IG) corporate bonds. |
|
↑
|
Exposure
to the two- and five-year portions of the yield curve. |
|
Top
detractors from performance: | |
|
↓
|
Exposure
to the 10-, 20- and 30-year portions of the yield curve. |
|
↓
|
Underweight
allocation to agency mortgage-backed securities (MBS). |
|
↓
|
Security
selection in HY corporate bonds. |
Use of derivatives and the
impact on performance:
The Fund utilized bond futures
to manage duration exposure and high-yield credit default swap (CDS) to manage the Fund’s credit exposure.
In aggregate, these instruments detracted slightly from performance.
AVERAGE
ANNUAL TOTAL RETURNS (%) Period
Ended April 30, 2025
|
|
1
Year |
5
Year |
10
Year |
|
Class
C |
6.53
|
2.95
|
1.58
|
|
Class
C (with sales charge) |
5.53
|
2.95
|
1.58
|
|
Bloomberg
U.S. Aggregate Index |
8.02
|
-0.67
|
1.54
|
For current month-end performance,
please call Franklin Templeton at (800)
DIAL BEN/342-5236 or visit https://www.franklintempleton.com/investments/options/mutual-funds.
Important data provider notices
and terms available at www.franklintempletondatasources.com.
KEY
FUND STATISTICS (as
of April 30, 2025)
|
Total
Net Assets |
$2,468,245,569
|
|
Total
Number of Portfolio Holdings*
|
719
|
|
Total
Management Fee Paid |
$10,452,494
|
|
Portfolio
Turnover Rate |
156.08%
|

HOW
HAS THE FUND CHANGED?
Effective December
11, 2024, the
Fund changed its name from the “Franklin Strategic Income Fund” to the “Franklin Core Plus Bond Fund”.
In addition, effective November
12, 2024, the Fund’s investment strategies were revised to reflect: (i) the Fund’s new core plus strategy, which
means that the Fund invests primarily in investment-grade securities, but also may invest up to 30% of its assets in below investment-grade
securities to potentially increase returns; and (ii) the Fund’s targeted average portfolio duration, which, under normal market
conditions, is estimated to be within one and a half years of the average portfolio duration of the Fund’s benchmark, the Bloomberg
U.S. Aggregate Index. Effective December 11, 2024, in connection with the Fund’s name change, the Fund added a principal investment
policy to reflect that, under normal market conditions, the Fund invests at least 80% of its net assets in bonds including derivative
instruments or other investments that have economic characteristics similar to bonds.
Also, effective September 30,
2024, Michael V. Salm was added as a portfolio manager of the Fund.
Finally, effective January 1,
2025, the investment manager agreed to waive fees and/or reimburse operating expenses (excluding the Rule
12b-1 fees, acquired fund fees and expenses, and certain non-routine expenses or costs, such as those relating to litigation, indemnification,
reorganizations and liquidations) for the Fund so that the ratio of total annual fund operating expenses will not exceed 0.58%
for each share class except Class R6 and 0.48% for Class R6.
This is a summary of certain
changes to the Fund since May
1, 2024. For more complete information, you may review the Fund’s current prospectus
and any applicable supplements and the Fund’s next prospectus, which we expect to be available by September
1, 2025, at https://www.franklintempleton.com/regulatory-fund-documents
or upon request at (800)
DIAL BEN/342-5236
or
prospectus.us.franklintempleton@fisglobal.com.
prospectus.us.franklintempleton@fisglobal.com.
This report describes changes
to the Fund that occurred during the reporting period.
WHAT
WERE THE FUND COSTS FOR THE LAST YEAR? (based
on a hypothetical $10,000 investment)
|
Class
Name |
Costs
of a $10,000 investment
|
Costs
paid as a percentage of a $10,000
investment*
|
|
Class
R |
$114
|
1.10%
|
HOW
DID THE FUND PERFORM LAST YEAR AND WHAT AFFECTED ITS PERFORMANCE?
For the twelve months ended April
30, 2024, Class R shares of
Franklin Core Plus Bond Fund returned 6.62%.
The Fund compares its performance
to the Bloomberg U.S. Aggregate Index, which returned 8.02% for the same period.
PERFORMANCE
HIGHLIGHTS
|
Top
contributors to performance: | |
|
↑
|
Overweight
allocation to high-yield (HY) corporate bonds, senior secured floating-rate bank loans and collateralized loan obligations.
|
|
↑
|
Security
selection in investment-grade (IG) corporate bonds. |
|
↑
|
Exposure
to the two- and five-year portions of the yield curve. |
|
Top
detractors from performance: | |
|
↓
|
Exposure
to the 10-, 20- and 30-year portions of the yield curve. |
|
↓
|
Underweight
allocation to agency mortgage-backed securities (MBS). |
|
↓
|
Security
selection in HY corporate bonds. |
Use of derivatives and the
impact on performance:
The Fund utilized bond futures
to manage duration exposure and high-yield credit default swap (CDS) to manage the Fund’s credit exposure.
In aggregate, these instruments detracted slightly from performance.

AVERAGE
ANNUAL TOTAL RETURNS (%) Period
Ended April 30, 2025
|
|
1
Year |
5
Year |
10
Year |
|
Class
R |
6.62
|
3.10
|
1.73
|
|
Bloomberg
U.S. Aggregate Index |
8.02
|
-0.67
|
1.54
|
For current month-end performance,
please call Franklin Templeton at (800)
DIAL BEN/342-5236 or visit https://www.franklintempleton.com/investments/options/mutual-funds.
Important data provider notices
and terms available at www.franklintempletondatasources.com.
KEY
FUND STATISTICS (as
of April 30, 2025)
|
Total
Net Assets |
$2,468,245,569
|
|
Total
Number of Portfolio Holdings*
|
719
|
|
Total
Management Fee Paid |
$10,452,494
|
|
Portfolio
Turnover Rate |
156.08%
|

HOW
HAS THE FUND CHANGED?
Effective December
11, 2024, the
Fund changed its name from the “Franklin Strategic Income Fund” to the “Franklin Core Plus Bond Fund”.
In addition, effective November
12, 2024, the Fund’s investment strategies were revised to reflect: (i) the Fund’s new core plus strategy, which
means that the Fund invests primarily in investment-grade securities, but also may invest up to 30% of its assets in below investment-grade
securities to potentially increase returns; and (ii) the Fund’s targeted average portfolio duration, which, under normal market
conditions, is estimated to be within one and a half years of the average portfolio duration of the Fund’s benchmark, the Bloomberg
U.S. Aggregate Index. Effective December 11, 2024, in connection with the Fund’s name change, the Fund added a principal investment
policy to reflect that, under normal market conditions, the Fund invests at least 80% of its net assets in bonds including derivative
instruments or other investments that have economic characteristics similar to bonds.
Also, effective September 30,
2024, Michael V. Salm was added as a portfolio manager of the Fund.
Finally, effective January 1,
2025, the investment manager agreed to waive fees and/or reimburse operating expenses (excluding the Rule
12b-1 fees, acquired fund fees and expenses, and certain non-routine expenses or costs, such as those relating to litigation, indemnification,
reorganizations and liquidations) for the Fund so that the ratio of total annual fund operating expenses will not exceed 0.58%
for each share class except Class R6 and 0.48% for Class R6.
This is a summary of certain
changes to the Fund since May
1, 2024. For more complete information, you may review the Fund’s current prospectus
and any applicable supplements and the Fund’s next prospectus, which we expect to be available by September
1, 2025, at https://www.franklintempleton.com/regulatory-fund-documents
or upon request at (800)
DIAL BEN/342-5236
or
prospectus.us.franklintempleton@fisglobal.com.
prospectus.us.franklintempleton@fisglobal.com.
This report describes changes
to the Fund that occurred during the reporting period.
WHAT
WERE THE FUND COSTS FOR THE LAST YEAR? (based
on a hypothetical $10,000 investment)
|
Class
Name |
Costs
of a $10,000 investment
|
Costs
paid as a percentage of a $10,000
investment*
|
|
Class
R6 |
$52
|
0.50%
|
HOW
DID THE FUND PERFORM LAST YEAR AND WHAT AFFECTED ITS PERFORMANCE?
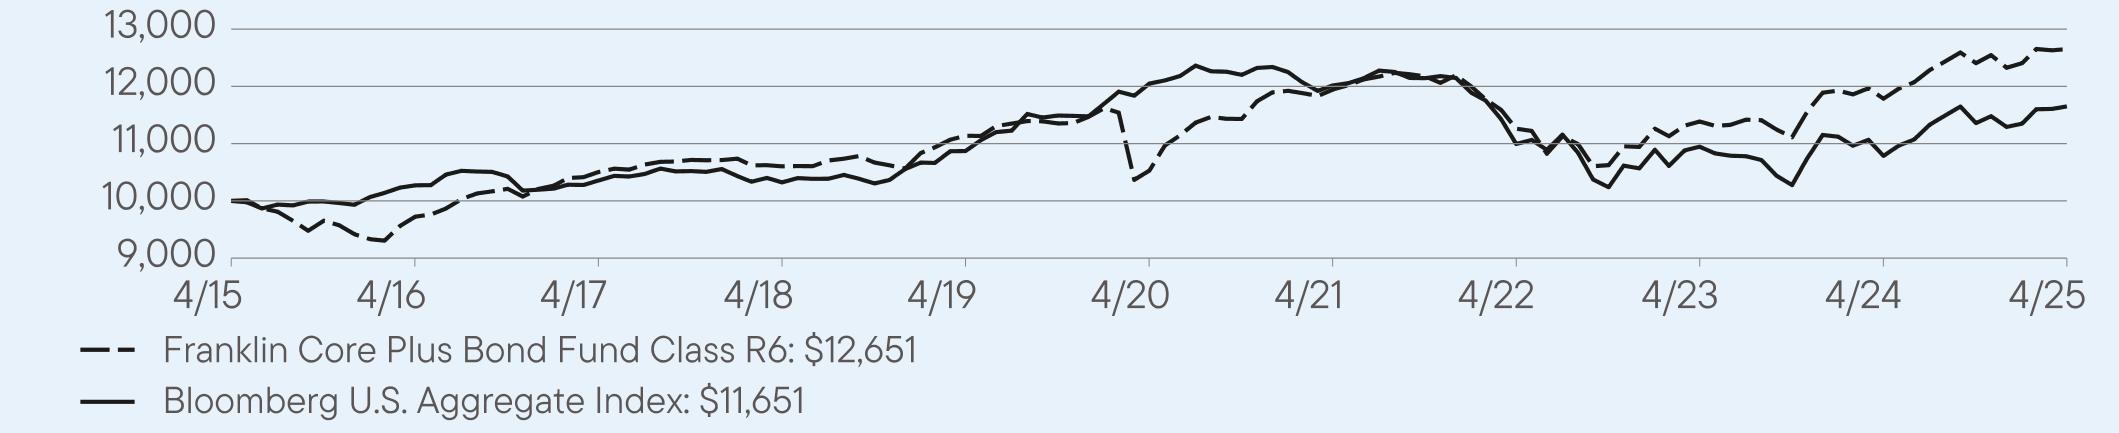
For the twelve months ended April
30, 2024, Class R6 shares of
Franklin Core Plus Bond Fund returned 7.35%.
The Fund compares its performance
to the Bloomberg U.S. Aggregate Index, which returned 8.02% for the same period.
PERFORMANCE
HIGHLIGHTS
|
Top
contributors to performance: | |
|
↑
|
Overweight
allocation to high-yield (HY) corporate bonds, senior secured floating-rate bank loans and collateralized loan obligations.
|
|
↑
|
Security
selection in investment-grade (IG) corporate bonds. |
|
↑
|
Exposure
to the two- and five-year portions of the yield curve. |
|
Top
detractors from performance: | |
|
↓
|
Exposure
to the 10-, 20- and 30-year portions of the yield curve. |
|
↓
|
Underweight
allocation to agency mortgage-backed securities (MBS). |
|
↓
|
Security
selection in HY corporate bonds. |
Use of derivatives and the
impact on performance:
The Fund utilized bond futures
to manage duration exposure and high-yield credit default swap (CDS) to manage the Fund’s credit exposure.
In aggregate, these instruments detracted slightly from performance.
AVERAGE
ANNUAL TOTAL RETURNS (%) Period
Ended April 30, 2025
|
|
1
Year |
5
Year |
10
Year |
|
Class
R6 |
7.35
|
3.74
|
2.38
|
|
Bloomberg
U.S. Aggregate Index |
8.02
|
-0.67
|
1.54
|
For current month-end performance,
please call Franklin Templeton at (800)
DIAL BEN/342-5236 or visit https://www.franklintempleton.com/investments/options/mutual-funds.
Important data provider notices
and terms available at www.franklintempletondatasources.com.
KEY
FUND STATISTICS (as
of April 30, 2025)
|
Total
Net Assets |
$2,468,245,569
|
|
Total
Number of Portfolio Holdings*
|
719
|
|
Total
Management Fee Paid |
$10,452,494
|
|
Portfolio
Turnover Rate |
156.08%
|
HOW
HAS THE FUND CHANGED?
Effective December
11, 2024, the
Fund changed its name from the “Franklin Strategic Income Fund” to the “Franklin Core Plus Bond Fund”.
In addition, effective November
12, 2024, the Fund’s investment strategies were revised to reflect: (i) the Fund’s new core plus strategy, which
means that the Fund invests primarily in investment-grade securities, but also may invest up to 30% of its assets in below investment-grade
securities to potentially increase returns; and (ii) the Fund’s targeted average portfolio duration, which, under normal market
conditions, is estimated to be within one and a half years of the average portfolio duration of the Fund’s benchmark, the Bloomberg
U.S. Aggregate Index. Effective December 11, 2024, in connection with the Fund’s name change, the Fund added a principal investment
policy to reflect that, under normal market conditions, the Fund invests at least 80% of its net assets in bonds including derivative
instruments or other investments that have economic characteristics similar to bonds.
Also, effective September 30,
2024, Michael V. Salm was added as a portfolio manager of the Fund.
Finally, effective January 1,
2025, the investment manager agreed to waive fees and/or reimburse operating expenses (excluding the Rule
12b-1 fees, acquired fund fees and expenses, and certain non-routine expenses or costs, such as those relating to litigation, indemnification,
reorganizations and liquidations) for the Fund so that the ratio of total annual fund operating expenses will not exceed 0.58%
for each share class except Class R6 and 0.48% for Class R6.
This is a summary of certain
changes to the Fund since May
1, 2024. For more complete information, you may review the Fund’s current prospectus
and any applicable supplements and the Fund’s next prospectus, which we expect to be available by September
1, 2025, at https://www.franklintempleton.com/regulatory-fund-documents
or upon request at (800)
DIAL BEN/342-5236
or
prospectus.us.franklintempleton@fisglobal.com.
prospectus.us.franklintempleton@fisglobal.com.
This report describes changes
to the Fund that occurred during the reporting period.
WHAT
WERE THE FUND COSTS FOR THE LAST YEAR? (based
on a hypothetical $10,000 investment)
|
Class
Name |
Costs
of a $10,000 investment
|
Costs
paid as a percentage of a $10,000
investment*
|
|
Advisor
Class |
$62
|
0.60%
|
HOW
DID THE FUND PERFORM LAST YEAR AND WHAT AFFECTED ITS PERFORMANCE?
For the twelve months ended April
30, 2024, Advisor Class shares
of Franklin Core Plus Bond Fund returned 7.24%.
The Fund compares its performance
to the Bloomberg U.S. Aggregate Index, which returned 8.02% for the same period.
PERFORMANCE
HIGHLIGHTS
|
Top
contributors to performance: | |
|
↑
|
Overweight
allocation to high-yield (HY) corporate bonds, senior secured floating-rate bank loans and collateralized loan obligations.
|
|
↑
|
Security
selection in investment-grade (IG) corporate bonds. |
|
↑
|
Exposure
to the two- and five-year portions of the yield curve. |
|
Top
detractors from performance: | |
|
↓
|
Exposure
to the 10-, 20- and 30-year portions of the yield curve. |
|
↓
|
Underweight
allocation to agency mortgage-backed securities (MBS). |
|
↓
|
Security
selection in HY corporate bonds. |
Use of derivatives and the
impact on performance:
The Fund utilized bond futures
to manage duration exposure and high-yield credit default swap (CDS) to manage the Fund’s credit exposure.
In aggregate, these instruments detracted slightly from performance.
AVERAGE
ANNUAL TOTAL RETURNS (%) Period
Ended April 30, 2025
|
|
1
Year |
5
Year |
10
Year |
|
Advisor
Class |
7.24
|
3.62
|
2.25
|
|
Bloomberg
U.S. Aggregate Index |
8.02
|
-0.67
|
1.54
|
For current month-end performance,
please call Franklin Templeton at (800)
DIAL BEN/342-5236 or visit https://www.franklintempleton.com/investments/options/mutual-funds.
Important data provider notices
and terms available at www.franklintempletondatasources.com.
KEY
FUND STATISTICS (as
of April 30, 2025)
|
Total
Net Assets |
$2,468,245,569
|
|
Total
Number of Portfolio Holdings*
|
719
|
|
Total
Management Fee Paid |
$10,452,494
|
|
Portfolio
Turnover Rate |
156.08%
|

HOW
HAS THE FUND CHANGED?
Effective December
11, 2024, the
Fund changed its name from the “Franklin Strategic Income Fund” to the “Franklin Core Plus Bond Fund”.
In addition, effective November
12, 2024, the Fund’s investment strategies were revised to reflect: (i) the Fund’s new core plus strategy, which
means that the Fund invests primarily in investment-grade securities, but also may invest up to 30% of its assets in below investment-grade
securities to potentially increase returns; and (ii) the Fund’s targeted average portfolio duration, which, under normal market
conditions, is estimated to be within one and a half years of the average portfolio duration of the Fund’s benchmark, the Bloomberg
U.S. Aggregate Index. Effective December 11, 2024, in connection with the Fund’s name change, the Fund added a principal investment
policy to reflect that, under normal market conditions, the Fund invests at least 80% of its net assets in bonds including derivative
instruments or other investments that have economic characteristics similar to bonds.
Also, effective September 30,
2024, Michael V. Salm was added as a portfolio manager of the Fund.
Finally, effective January 1,
2025, the investment manager agreed to waive fees and/or reimburse operating expenses (excluding the Rule
12b-1 fees, acquired fund fees and expenses, and certain non-routine expenses or costs, such as those relating to litigation, indemnification,
reorganizations and liquidations) for the Fund so that the ratio of total annual fund operating expenses will not exceed 0.58%
for each share class except Class R6 and 0.48% for Class R6.
This is a summary of certain
changes to the Fund since May
1, 2024. For more complete information, you may review the Fund’s current prospectus
and any applicable supplements and the Fund’s next prospectus, which we expect to be available by September
1, 2025, at https://www.franklintempleton.com/regulatory-fund-documents
or upon request at (800)
DIAL BEN/342-5236
or
prospectus.us.franklintempleton@fisglobal.com.
prospectus.us.franklintempleton@fisglobal.com.
This report describes changes
to the Fund that occurred during the reporting period.
WHAT
WERE THE FUND COSTS FOR THE LAST YEAR? (based
on a hypothetical $10,000 investment)
|
Class
Name |
Costs
of a $10,000 investment
|
Costs
paid as a percentage of a $10,000
investment*
|
|
Class
A |
$92
|
0.89%
|
HOW
DID THE FUND PERFORM LAST YEAR AND WHAT AFFECTED ITS PERFORMANCE?
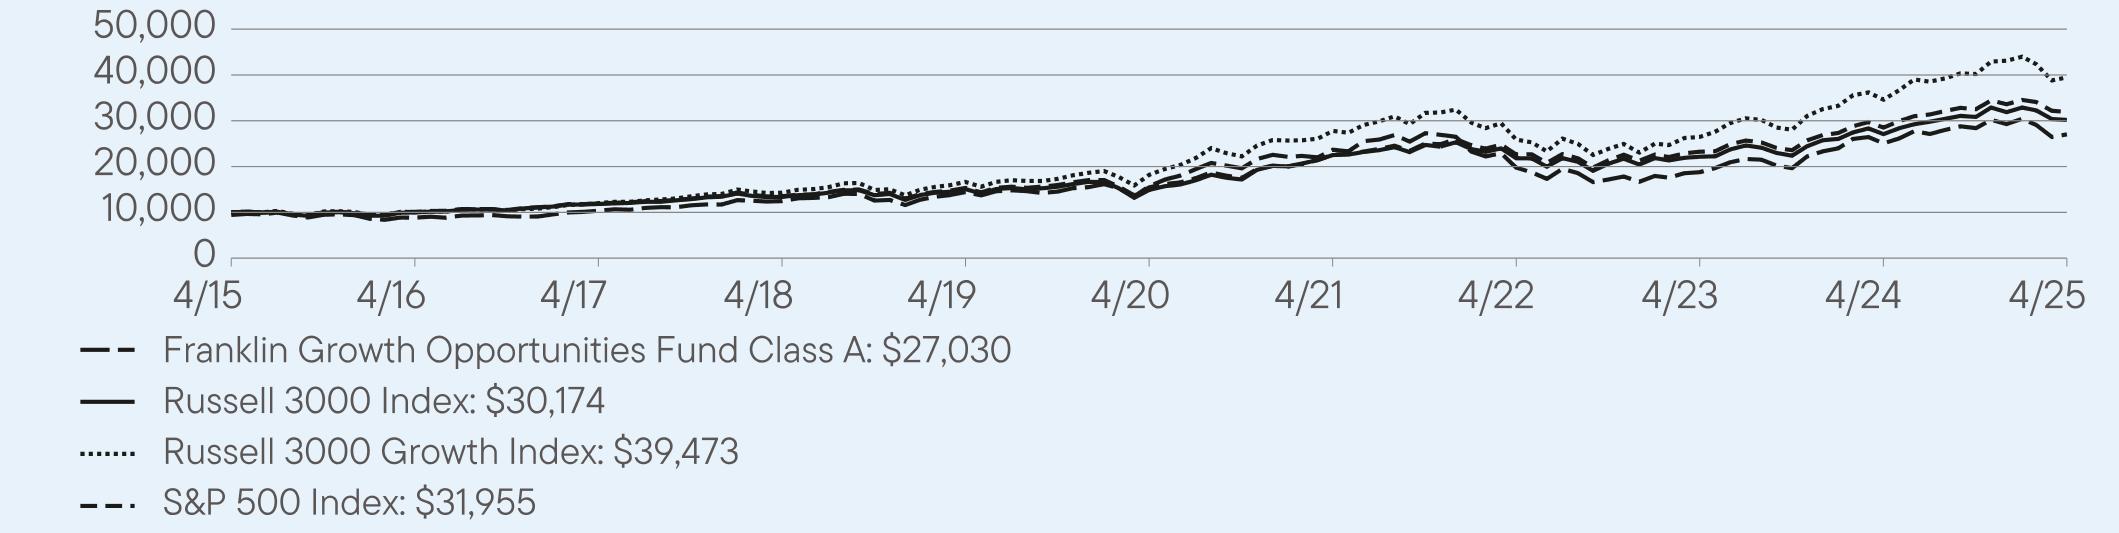
For the twelve months ended April
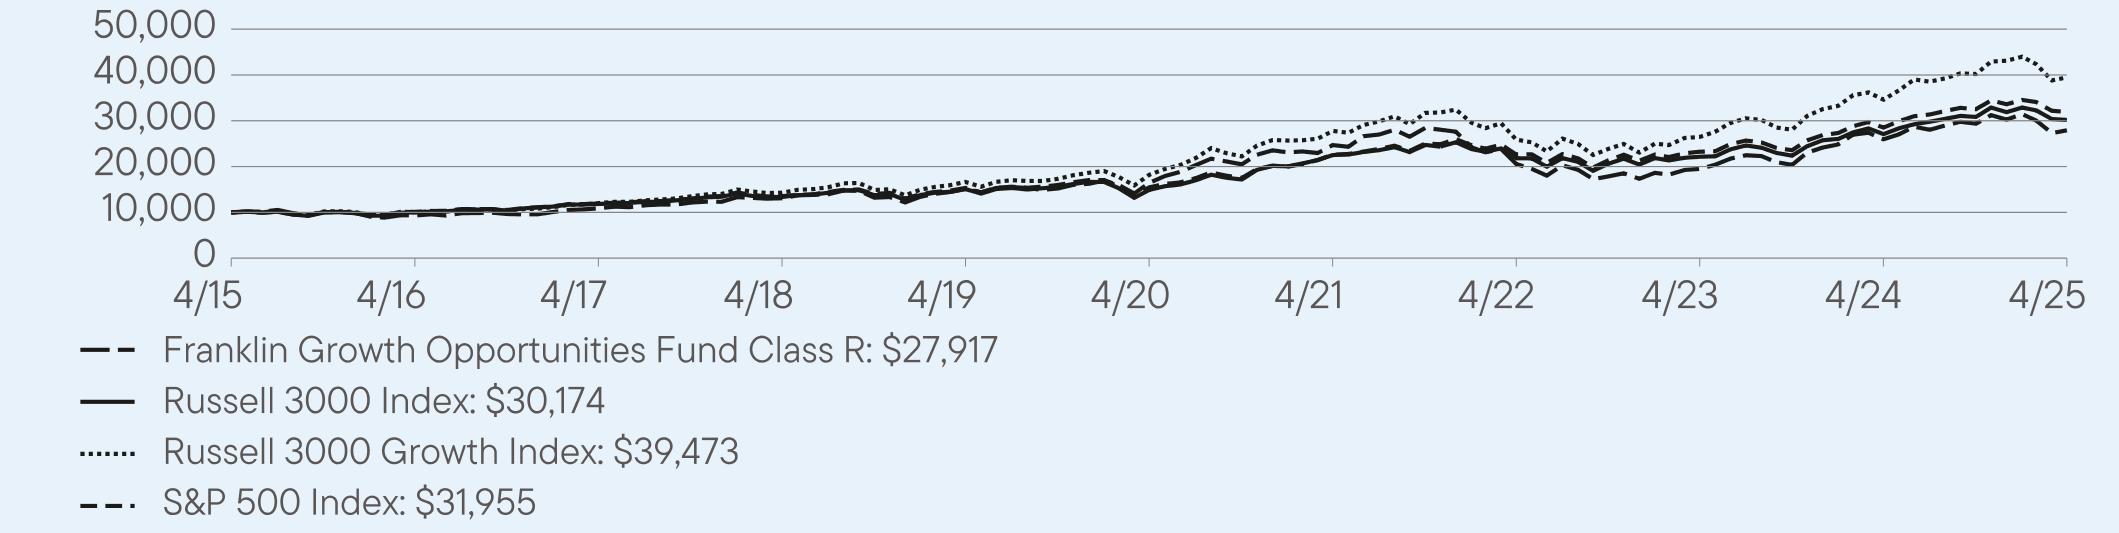
30, 2025, Class A shares of
Franklin Growth Opportunities Fund returned 7.85%.
The Fund compares its performance
to the Russell 3000 Growth Index and the S&P 500 Index, which returned 14.07% and 12.10%, respectively, for
the same period.
PERFORMANCE
HIGHLIGHTS
|
Top
contributors to performance: | |
|
↑
|
Stock
selection in the industrials and communication services sectors. Axon Enterprise, a law enforcement technology company, was
a leading relative contributor in the industrials sector. A focus on force enhancement, efficiency and artificial intelligence (AI) technology
from domestic and international police agencies have been growth drivers for Axon. In the communication services sector,
the Fund benefited from a lack of certain index component stocks that fared poorly over the period. |
|
↑
|
At
the stock level, a below-index weighting in Microsoft helped relative returns in the information technology (IT) sector. The software
giant’s cloud computing platform Azure continued to be profitable for the company but saw a moderation in growth.
|
|
↑
|
The
IT sector also benefited from an investment in Fair Isaac—a credit scoring and data analytics provider. Pricing power and strong
customer demand in its credit scoring business lifted the stock to a record high over the period. The company has a dominant
position in mortgage scoring and is a vital component of the credit scoring process. |
|
Top
detractors from performance: | |
|
↓
|
Stock
selection in the consumer discretionary sector was a driver of negative relative returns over the period, led lower by an underweight
in Tesla. Stock performance for the electric carmaker was driven, in part, by positive market sentiment and increased expectations
for growth following the 2024 presidential election and announcements on progress with their self-driving car, robotaxi
and humanoid robot strategies. |
|
↓
|
Stock
selection in the IT sector had an adverse effect on relative performance. Underweights in Broadcom and Apple accounted for
a large share of the Fund’s relative decline but added to absolute returns. Semiconductor company Broadcom saw significant growth
in AI revenue supported by strong demand for its AI chips. |
|
↓
|
Apple’s
stock reached an all-time high in mid-July 2024 following the company’s announcement of Apple Intelligence, a software update
that brings AI features across its products. The technology giant also announced a record US$110 billion share buyback program,
making it the largest buyback in U.S. corporate history. |
AVERAGE
ANNUAL TOTAL RETURNS (%) Period
Ended April 30, 2025
|
|
1
Year |
5
Year |
10
Year |
|
Class
A |
7.85
|
11.45
|
11.08
|
|
Class
A (with sales charge) |
1.91
|
10.20
|
10.45
|
|
Russell
3000 Index |
11.40
|
15.12
|
11.68
|
|
Russell
3000 Growth Index |
14.07
|
16.71
|
14.72
|
|
S&P
500 Index |
12.10
|
15.61
|
12.32
|
For current month-end performance,
please call Franklin Templeton at (800)
DIAL BEN/342-5236 or visit https://www.franklintempleton.com/investments/options/mutual-funds.
Important data provider notices
and terms available at www.franklintempletondatasources.com.
KEY
FUND STATISTICS (as
of April 30, 2025)
|
Total
Net Assets |
$4,160,453,860
|
|
Total
Number of Portfolio Holdings*
|
85
|
|
Total
Management Fee Paid |
$24,439,109
|
|
Portfolio
Turnover Rate |
27.59%
|
HOW
HAS THE FUND CHANGED?
Effective September
30, 2024, Anthony
Hardy was added as a portfolio manager of the Fund.
This is a summary of a change
to the Fund since May 1, 2024.
For more complete information, you may review the Fund’s current prospectus
and any applicable supplements and the Fund’s next prospectus, which we expect to be available by September
1, 2025,
at https://www.franklintempleton.com/regulatory-fund-documents or upon request at (800) DIAL BEN/342-5236 or
prospectus.us.franklintempleton@fisglobal.com.
at https://www.franklintempleton.com/regulatory-fund-documents or upon request at (800) DIAL BEN/342-5236 or
prospectus.us.franklintempleton@fisglobal.com.
This report describes changes
to the Fund that occurred during the reporting period.
WHAT
WERE THE FUND COSTS FOR THE LAST YEAR? (based
on a hypothetical $10,000 investment)
|
Class
Name |
Costs
of a $10,000 investment
|
Costs
paid as a percentage of a $10,000
investment*
|
|
Class
C |
$170
|
1.64%
|
HOW
DID THE FUND PERFORM LAST YEAR AND WHAT AFFECTED ITS PERFORMANCE?
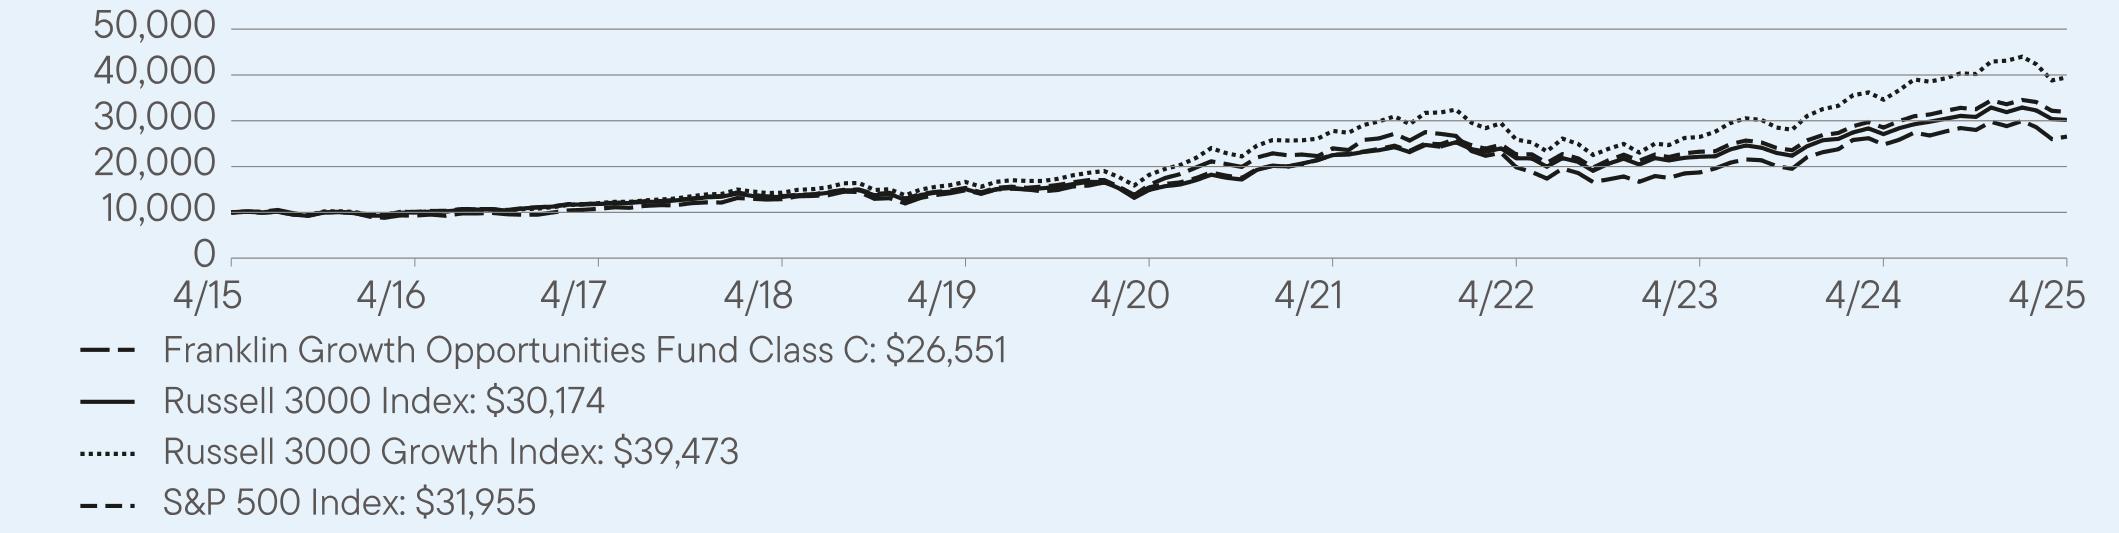
For the twelve months ended April
30, 2025, Class C shares of
Franklin Growth Opportunities Fund returned 7.03%.
The Fund compares its performance
to the Russell 3000 Growth Index and the S&P 500 Index, which returned 14.07% and 12.10%, respectively, for
the same period.
PERFORMANCE
HIGHLIGHTS
|
Top
contributors to performance: | |
|
↑
|
Stock
selection in the industrials and communication services sectors. Axon Enterprise, a law enforcement technology company, was
a leading relative contributor in the industrials sector. A focus on force enhancement, efficiency and artificial intelligence (AI) technology
from domestic and international police agencies have been growth drivers for Axon. In the communication services sector,
the Fund benefited from a lack of certain index component stocks that fared poorly over the period. |
|
↑
|
At
the stock level, a below-index weighting in Microsoft helped relative returns in the information technology (IT) sector. The software
giant’s cloud computing platform Azure continued to be profitable for the company but saw a moderation in growth.
|
|
↑
|
The
IT sector also benefited from an investment in Fair Isaac—a credit scoring and data analytics provider. Pricing power and strong
customer demand in its credit scoring business lifted the stock to a record high over the period. The company has a dominant
position in mortgage scoring and is a vital component of the credit scoring process. |
|
Top
detractors from performance: | |
|
↓
|
Stock
selection in the consumer discretionary sector was a driver of negative relative returns over the period, led lower by an underweight
in Tesla. Stock performance for the electric carmaker was driven, in part, by positive market sentiment and increased expectations
for growth following the 2024 presidential election and announcements on progress with their self-driving car, robotaxi
and humanoid robot strategies. |
|
↓
|
Stock
selection in the IT sector had an adverse effect on relative performance. Underweights in Broadcom and Apple accounted for
a large share of the Fund’s relative decline but added to absolute returns. Semiconductor company Broadcom saw significant growth
in AI revenue supported by strong demand for its AI chips. |
|
↓
|
Apple’s
stock reached an all-time high in mid-July 2024 following the company’s announcement of Apple Intelligence, a software update
that brings AI features across its products. The technology giant also announced a record US$110 billion share buyback program,
making it the largest buyback in U.S. corporate history. |
AVERAGE
ANNUAL TOTAL RETURNS (%) Period
Ended April 30, 2025
|
|
1
Year |
5
Year |
10
Year |
|
Class
C |
7.03
|
10.61
|
10.26
|
|
Class
C (with sales charge) |
6.11
|
10.61
|
10.26
|
|
Russell
3000 Index |
11.40
|
15.12
|
11.68
|
|
Russell
3000 Growth Index |
14.07
|
16.71
|
14.72
|
|
S&P
500 Index |
12.10
|
15.61
|
12.32
|
For current month-end performance,
please call Franklin Templeton at (800)
DIAL BEN/342-5236 or visit https://www.franklintempleton.com/investments/options/mutual-funds.
Important data provider notices
and terms available at www.franklintempletondatasources.com.
KEY
FUND STATISTICS (as
of April 30, 2025)
|
Total
Net Assets |
$4,160,453,860
|
|
Total
Number of Portfolio Holdings*
|
85
|
|
Total
Management Fee Paid |
$24,439,109
|
|
Portfolio
Turnover Rate |
27.59%
|

HOW
HAS THE FUND CHANGED?
Effective September
30, 2024, Anthony
Hardy was added as a portfolio manager of the Fund.
This is a summary of a change
to the Fund since May 1, 2024.
For more complete information, you may review the Fund’s current prospectus
and any applicable supplements and the Fund’s next prospectus, which we expect to be available by September
1, 2025,
at https://www.franklintempleton.com/regulatory-fund-documents or upon request at (800) DIAL BEN/342-5236 or
prospectus.us.franklintempleton@fisglobal.com.
at https://www.franklintempleton.com/regulatory-fund-documents or upon request at (800) DIAL BEN/342-5236 or
prospectus.us.franklintempleton@fisglobal.com.
This report describes changes
to the Fund that occurred during the reporting period.
WHAT
WERE THE FUND COSTS FOR THE LAST YEAR? (based
on a hypothetical $10,000 investment)
|
Class
Name |
Costs
of a $10,000 investment
|
Costs
paid as a percentage of a $10,000
investment*
|
|
Class
R |
$118
|
1.14%
|
HOW
DID THE FUND PERFORM LAST YEAR AND WHAT AFFECTED ITS PERFORMANCE?
For the twelve months ended April
30, 2025, Class R shares of
Franklin Growth Opportunities Fund returned 7.57%.
The Fund compares its performance
to the Russell 3000 Growth Index and the S&P 500 Index, which returned 14.07% and 12.10%, respectively, for
the same period.
PERFORMANCE
HIGHLIGHTS
|
Top
contributors to performance: | |
|
↑
|
Stock
selection in the industrials and communication services sectors. Axon Enterprise, a law enforcement technology company, was
a leading relative contributor in the industrials sector. A focus on force enhancement, efficiency and artificial intelligence (AI) technology
from domestic and international police agencies have been growth drivers for Axon. In the communication services sector,
the Fund benefited from a lack of certain index component stocks that fared poorly over the period. |
|
↑
|
At
the stock level, a below-index weighting in Microsoft helped relative returns in the information technology (IT) sector. The software
giant’s cloud computing platform Azure continued to be profitable for the company but saw a moderation in growth.
|
|
↑
|
The
IT sector also benefited from an investment in Fair Isaac—a credit scoring and data analytics provider. Pricing power and strong
customer demand in its credit scoring business lifted the stock to a record high over the period. The company has a dominant
position in mortgage scoring and is a vital component of the credit scoring process. |
|
Top
detractors from performance: | |
|
↓
|
Stock
selection in the consumer discretionary sector was a driver of negative relative returns over the period, led lower by an underweight
in Tesla. Stock performance for the electric carmaker was driven, in part, by positive market sentiment and increased expectations
for growth following the 2024 presidential election and announcements on progress with their self-driving car, robotaxi
and humanoid robot strategies. |
|
↓
|
Stock
selection in the IT sector had an adverse effect on relative performance. Underweights in Broadcom and Apple accounted for
a large share of the Fund’s relative decline but added to absolute returns. Semiconductor company Broadcom saw significant growth
in AI revenue supported by strong demand for its AI chips. |
|
↓
|
Apple’s
stock reached an all-time high in mid-July 2024 following the company’s announcement of Apple Intelligence, a software update
that brings AI features across its products. The technology giant also announced a record US$110 billion share buyback program,
making it the largest buyback in U.S. corporate history. |
AVERAGE
ANNUAL TOTAL RETURNS (%) Period
Ended April 30, 2025
|
|
1
Year |
5
Year |
10
Year |
|
Class
R |
7.57
|
11.17
|
10.81
|
|
Russell
3000 Index |
11.40
|
15.12
|
11.68
|
|
Russell
3000 Growth Index |
14.07
|
16.71
|
14.72
|
|
S&P
500 Index |
12.10
|
15.61
|
12.32
|
For current month-end performance,
please call Franklin Templeton at (800)
DIAL BEN/342-5236 or visit https://www.franklintempleton.com/investments/options/mutual-funds.
Important data provider notices
and terms available at www.franklintempletondatasources.com.
KEY
FUND STATISTICS (as
of April 30, 2025)
|
Total
Net Assets |
$4,160,453,860
|
|
Total
Number of Portfolio Holdings*
|
85
|
|
Total
Management Fee Paid |
$24,439,109
|
|
Portfolio
Turnover Rate |
27.59%
|

HOW
HAS THE FUND CHANGED?
Effective September
30, 2024, Anthony
Hardy was added as a portfolio manager of the Fund.
This is a summary of a change
to the Fund since May 1, 2024.
For more complete information, you may review the Fund’s current prospectus
and any applicable supplements and the Fund’s next prospectus, which we expect to be available by September
1, 2025,
at https://www.franklintempleton.com/regulatory-fund-documents or upon request at (800) DIAL BEN/342-5236 or
prospectus.us.franklintempleton@fisglobal.com.
at https://www.franklintempleton.com/regulatory-fund-documents or upon request at (800) DIAL BEN/342-5236 or
prospectus.us.franklintempleton@fisglobal.com.
This report describes changes
to the Fund that occurred during the reporting period.
WHAT
WERE THE FUND COSTS FOR THE LAST YEAR? (based
on a hypothetical $10,000 investment)
|
Class
Name |
Costs
of a $10,000 investment
|
Costs
paid as a percentage of a $10,000
investment*
|
|
Class
R6 |
$59
|
0.57%
|
HOW
DID THE FUND PERFORM LAST YEAR AND WHAT AFFECTED ITS PERFORMANCE?
For the twelve months ended April
30, 2025, Class R6 shares of
Franklin Growth Opportunities Fund returned 8.19%.
The Fund compares its performance
to the Russell 3000 Growth Index and the S&P 500 Index, which returned 14.07% and 12.10%, respectively, for
the same period.
PERFORMANCE
HIGHLIGHTS
|
Top
contributors to performance: | |
|
↑
|
Stock
selection in the industrials and communication services sectors. Axon Enterprise, a law enforcement technology company, was
a leading relative contributor in the industrials sector. A focus on force enhancement, efficiency and artificial intelligence (AI) technology
from domestic and international police agencies have been growth drivers for Axon. In the communication services sector,
the Fund benefited from a lack of certain index component stocks that fared poorly over the period. |
|
↑
|
At
the stock level, a below-index weighting in Microsoft helped relative returns in the information technology (IT) sector. The software
giant’s cloud computing platform Azure continued to be profitable for the company but saw a moderation in growth.
|
|
↑
|
The
IT sector also benefited from an investment in Fair Isaac—a credit scoring and data analytics provider. Pricing power and strong
customer demand in its credit scoring business lifted the stock to a record high over the period. The company has a dominant
position in mortgage scoring and is a vital component of the credit scoring process. |
|
Top
detractors from performance: | |
|
↓
|
Stock
selection in the consumer discretionary sector was a driver of negative relative returns over the period, led lower by an underweight
in Tesla. Stock performance for the electric carmaker was driven, in part, by positive market sentiment and increased expectations
for growth following the 2024 presidential election and announcements on progress with their self-driving car, robotaxi
and humanoid robot strategies. |
|
↓
|
Stock
selection in the IT sector had an adverse effect on relative performance. Underweights in Broadcom and Apple accounted for
a large share of the Fund’s relative decline but added to absolute returns. Semiconductor company Broadcom saw significant growth
in AI revenue supported by strong demand for its AI chips. |
|
↓
|
Apple’s
stock reached an all-time high in mid-July 2024 following the company’s announcement of Apple Intelligence, a software update
that brings AI features across its products. The technology giant also announced a record US$110 billion share buyback program,
making it the largest buyback in U.S. corporate history. |

AVERAGE
ANNUAL TOTAL RETURNS (%) Period
Ended April 30, 2025
|
|
1
Year |
5
Year |
10
Year |
|
Class
R6 |
8.19
|
11.82
|
11.50
|
|
Russell
3000 Index |
11.40
|
15.12
|
11.68
|
|
Russell
3000 Growth Index |
14.07
|
16.71
|
14.72
|
|
S&P
500 Index |
12.10
|
15.61
|
12.32
|
For current month-end performance,
please call Franklin Templeton at (800)
DIAL BEN/342-5236 or visit https://www.franklintempleton.com/investments/options/mutual-funds.
Important data provider notices
and terms available at www.franklintempletondatasources.com.
KEY
FUND STATISTICS (as
of April 30, 2025)
|
Total
Net Assets |
$4,160,453,860
|
|
Total
Number of Portfolio Holdings*
|
85
|
|
Total
Management Fee Paid |
$24,439,109
|
|
Portfolio
Turnover Rate |
27.59%
|

HOW
HAS THE FUND CHANGED?
Effective September
30, 2024, Anthony
Hardy was added as a portfolio manager of the Fund.
This is a summary of a change
to the Fund since May 1, 2024.
For more complete information, you may review the Fund’s current prospectus
and any applicable supplements and the Fund’s next prospectus, which we expect to be available by September
1, 2025,
at https://www.franklintempleton.com/regulatory-fund-documents or upon request at (800) DIAL BEN/342-5236 or
prospectus.us.franklintempleton@fisglobal.com.
at https://www.franklintempleton.com/regulatory-fund-documents or upon request at (800) DIAL BEN/342-5236 or
prospectus.us.franklintempleton@fisglobal.com.
This report describes changes
to the Fund that occurred during the reporting period.
WHAT
WERE THE FUND COSTS FOR THE LAST YEAR? (based
on a hypothetical $10,000 investment)
|
Class
Name |
Costs
of a $10,000 investment
|
Costs
paid as a percentage of a $10,000
investment*
|
|
Advisor
Class |
$67
|
0.64%
|
HOW
DID THE FUND PERFORM LAST YEAR AND WHAT AFFECTED ITS PERFORMANCE?
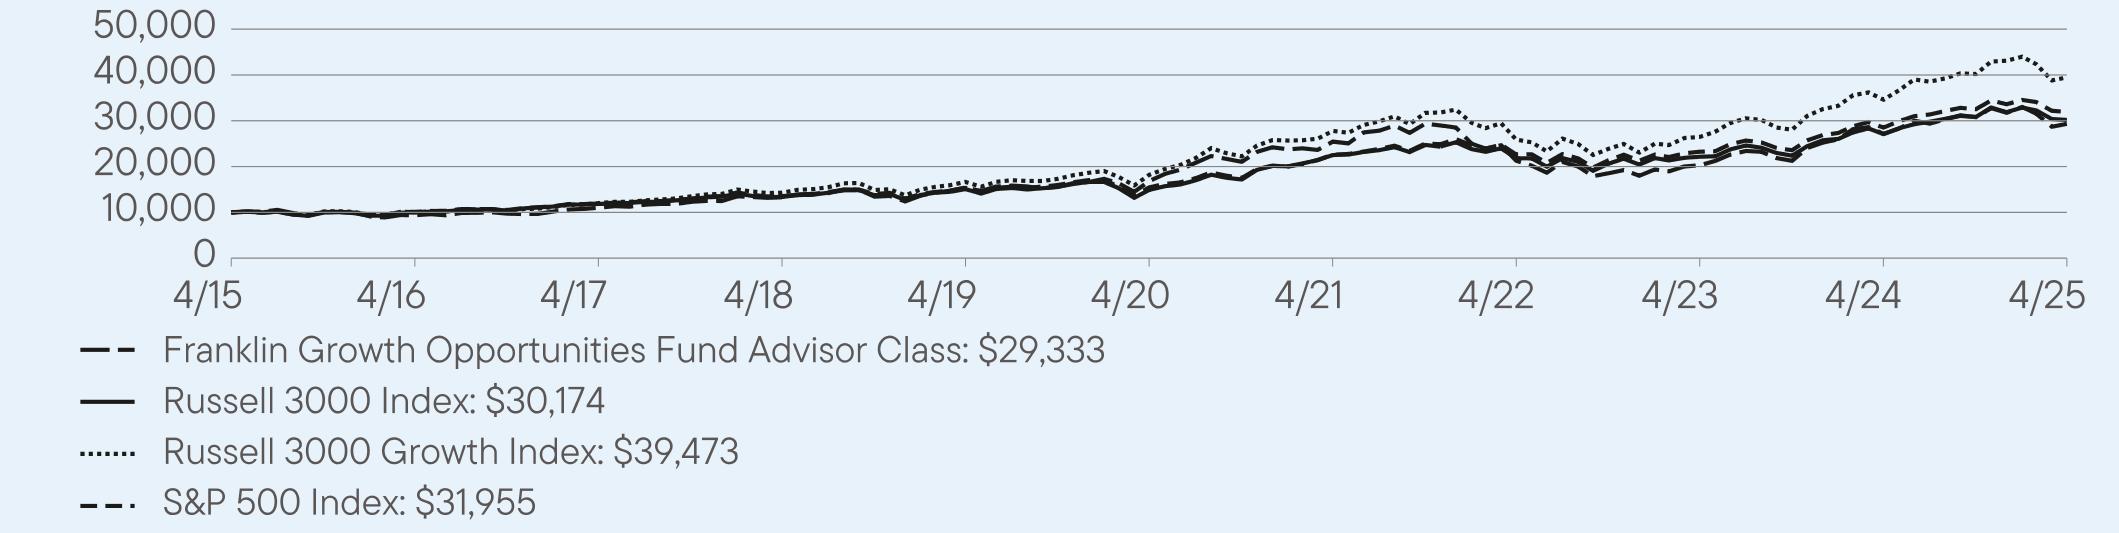
For the twelve months ended April
30, 2025, Advisor Class shares
of Franklin Growth Opportunities Fund returned 8.12%.
The Fund compares its performance
to the Russell 3000 Growth Index and the S&P 500 Index, which returned 14.07% and 12.10%, respectively, for
the same period.
PERFORMANCE
HIGHLIGHTS
|
Top
contributors to performance: | |
|
↑
|
Stock
selection in the industrials and communication services sectors. Axon Enterprise, a law enforcement technology company, was
a leading relative contributor in the industrials sector. A focus on force enhancement, efficiency and artificial intelligence (AI) technology
from domestic and international police agencies have been growth drivers for Axon. In the communication services sector,
the Fund benefited from a lack of certain index component stocks that fared poorly over the period. |
|
↑
|
At
the stock level, a below-index weighting in Microsoft helped relative returns in the information technology (IT) sector. The software
giant’s cloud computing platform Azure continued to be profitable for the company but saw a moderation in growth.
|
|
↑
|
The
IT sector also benefited from an investment in Fair Isaac—a credit scoring and data analytics provider. Pricing power and strong
customer demand in its credit scoring business lifted the stock to a record high over the period. The company has a dominant
position in mortgage scoring and is a vital component of the credit scoring process. |
|
Top
detractors from performance: | |
|
↓
|
Stock
selection in the consumer discretionary sector was a driver of negative relative returns over the period, led lower by an underweight
in Tesla. Stock performance for the electric carmaker was driven, in part, by positive market sentiment and increased expectations
for growth following the 2024 presidential election and announcements on progress with their self-driving car, robotaxi
and humanoid robot strategies. |
|
↓
|
Stock
selection in the IT sector had an adverse effect on relative performance. Underweights in Broadcom and Apple accounted for
a large share of the Fund’s relative decline but added to absolute returns. Semiconductor company Broadcom saw significant growth
in AI revenue supported by strong demand for its AI chips. |
|
↓
|
Apple’s
stock reached an all-time high in mid-July 2024 following the company’s announcement of Apple Intelligence, a software update
that brings AI features across its products. The technology giant also announced a record US$110 billion share buyback program,
making it the largest buyback in U.S. corporate history. |
AVERAGE
ANNUAL TOTAL RETURNS (%) Period
Ended April 30, 2025
|
|
1
Year |
5
Year |
10
Year |
|
Advisor
Class |
8.12
|
11.73
|
11.36
|
|
Russell
3000 Index |
11.40
|
15.12
|
11.68
|
|
Russell
3000 Growth Index |
14.07
|
16.71
|
14.72
|
|
S&P
500 Index |
12.10
|
15.61
|
12.32
|
For current month-end performance,
please call Franklin Templeton at (800)
DIAL BEN/342-5236 or visit https://www.franklintempleton.com/investments/options/mutual-funds.
Important data provider notices
and terms available at www.franklintempletondatasources.com.
KEY
FUND STATISTICS (as
of April 30, 2025)
|
Total
Net Assets |
$4,160,453,860
|
|
Total
Number of Portfolio Holdings*
|
85
|
|
Total
Management Fee Paid |
$24,439,109
|
|
Portfolio
Turnover Rate |
27.59%
|

HOW
HAS THE FUND CHANGED?
Effective September
30, 2024, Anthony
Hardy was added as a portfolio manager of the Fund.
This is a summary of a change
to the Fund since May 1, 2024.
For more complete information, you may review the Fund’s current prospectus
and any applicable supplements and the Fund’s next prospectus, which we expect to be available by September
1, 2025,
at https://www.franklintempleton.com/regulatory-fund-documents or upon request at (800) DIAL BEN/342-5236 or
prospectus.us.franklintempleton@fisglobal.com.
at https://www.franklintempleton.com/regulatory-fund-documents or upon request at (800) DIAL BEN/342-5236 or
prospectus.us.franklintempleton@fisglobal.com.
WHAT
WERE THE FUND COSTS FOR THE LAST YEAR? (based
on a hypothetical $10,000 investment)
|
Class
Name |
Costs
of a $10,000 investment
|
Costs
paid as a percentage of a $10,000
investment*
|
|
Class
A |
$96
|
0.99%
|
HOW
DID THE FUND PERFORM LAST YEAR AND WHAT AFFECTED ITS PERFORMANCE?
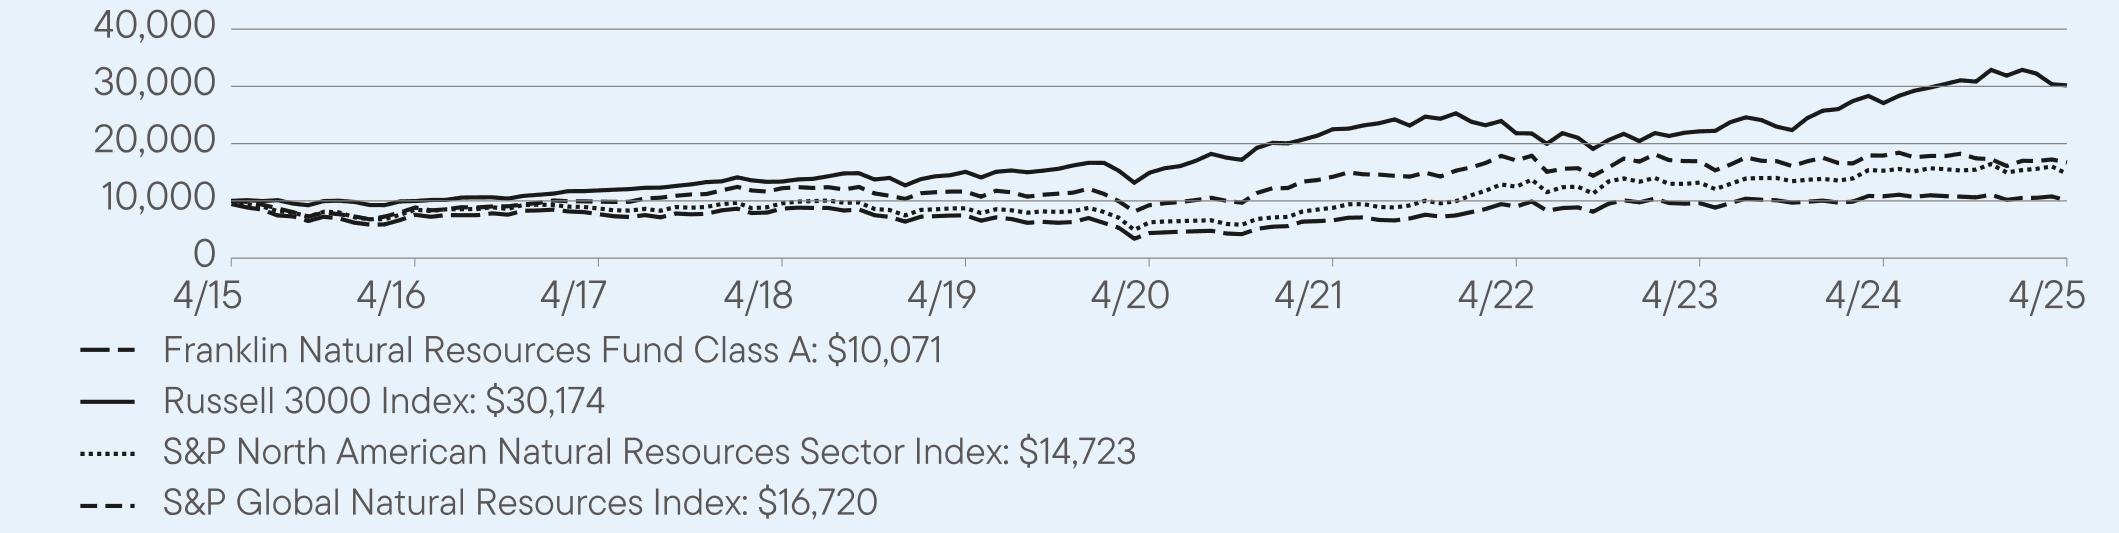
For the twelve months ended April
30, 2025, Class A shares of
Franklin Natural Resources Fund returned -6.87%.
The Fund compares its performance
to the S&P North American Natural Resources Sector Index and the S&P Global Natural Resources Index, which returned
-3.60% and -6.73%, respectively, for the same period.
PERFORMANCE
HIGHLIGHTS
|
Top
contributors to performance: | |
|
↑
|
Stock
selection in the oilfield services industry, where robust gains for off-benchmark positions in Technip Energies and Ranger Energy
Services were most beneficial. Portfolio underweighting in poor-performing integrated oil and gas companies such as Chevron
and Exxon Mobil further buoyed the Fund’s energy sector results. |
|
↑
|
Among
metals and mining companies, exceptionally strong one-year gains for the Fund’s overweighted stakes in gold producers such
as Alamos Gold and Newmont. Similarly elevated returns were seen with select contributors in the diversified metals and mining
industry, led by a heavily-overweighted position in rare earths mining and processing company MP Materials. |
|
↑
|
Off-benchmark
investments in the fertilizers and agricultural chemicals industry, where Corteva and Nutrien were standout contributors;
and in the industrial gases industry, where Air Products and Chemicals was the best of two holdings that added to both
relative and absolute returns. |
|
Top
detractors from performance: | |
|
↓
|
Allocation
in the oil and gas storage and transportation industry, where the Fund maintained much lighter-than-index exposures to
Enbridge, Cheniere Energy and other energy pipeline/infrastructure companies that saw their equity values appreciate significantly
on the back of expected natural gas demand to power artificial intelligence (AI) focused data centers. |
|
↓
|
Keeping
roughly seven times the benchmark’s modest exposure to underperforming diversified metals and mining companies, including
several that suffered double-digit percentage declines. Overweighting in copper-focused miners was also detrimental as
key detractor ERO Copper and all other related holdings shed considerable equity value despite long-term expectations for healthy
demand from electrification trends. |
|
↓
|
Off-benchmark
renewable energy plays had a tough year amid shifting supply/demand, geopolitical and policy-related dynamics. Key
detractors were Albemarle (battery-grade lithium mining), Fluence Energy (digital renewable energy storage solutions; sold by
period-end), and some of Fluence’s green energy-focused peers in the electrical components and equipment industry.
|
AVERAGE
ANNUAL TOTAL RETURNS (%) Period
Ended April 30, 2025
|
|
1
Year |
5
Year |
10
Year |
|
Class
A |
-6.87
|
18.07
|
0.64
|
|
Class
A (with sales charge) |
-11.99
|
16.74
|
0.07
|
|
Russell
3000 Index |
11.40
|
15.12
|
11.68
|
|
S&P
North American Natural Resources Sector Index |
-3.60
|
18.67
|
3.94
|
|
S&P
Global Natural Resources Index |
-6.73
|
12.53
|
5.27
|
For current month-end performance,
please call Franklin Templeton at (800)
DIAL BEN/342-5236 or visit https://www.franklintempleton.com/investments/options/mutual-funds.
Important data provider notices
and terms available at www.franklintempletondatasources.com.
KEY
FUND STATISTICS (as
of April 30, 2025)
|
Total
Net Assets |
$293,885,401
|
|
Total
Number of Portfolio Holdings*
|
91
|
|
Total
Management Fee Paid |
$1,743,418
|
|
Portfolio
Turnover Rate |
19.72%
|

WHAT
WERE THE FUND COSTS FOR THE LAST YEAR? (based
on a hypothetical $10,000 investment)
|
Class
Name |
Costs
of a $10,000 investment
|
Costs
paid as a percentage of a $10,000
investment*
|
|
Class
C |
$167
|
1.74%
|
HOW
DID THE FUND PERFORM LAST YEAR AND WHAT AFFECTED ITS PERFORMANCE?
For the twelve months ended April
30, 2025, Class C shares of
Franklin Natural Resources Fund returned -7.58%.
The Fund compares its performance
to the S&P North American Natural Resources Sector Index and the S&P Global Natural Resources Index, which returned
-3.60% and -6.73%, respectively, for the same period.
PERFORMANCE
HIGHLIGHTS
|
Top
contributors to performance: | |
|
↑
|
Stock
selection in the oilfield services industry, where robust gains for off-benchmark positions in Technip Energies and Ranger Energy
Services were most beneficial. Portfolio underweighting in poor-performing integrated oil and gas companies such as Chevron
and Exxon Mobil further buoyed the Fund’s energy sector results. |
|
↑
|
Among
metals and mining companies, exceptionally strong one-year gains for the Fund’s overweighted stakes in gold producers such
as Alamos Gold and Newmont. Similarly elevated returns were seen with select contributors in the diversified metals and mining
industry, led by a heavily-overweighted position in rare earths mining and processing company MP Materials. |
|
↑
|
Off-benchmark
investments in the fertilizers and agricultural chemicals industry, where Corteva and Nutrien were standout contributors;
and in the industrial gases industry, where Air Products and Chemicals was the best of two holdings that added to both
relative and absolute returns. |
|
Top
detractors from performance: | |
|
↓
|
Allocation
in the oil and gas storage and transportation industry, where the Fund maintained much lighter-than-index exposures to
Enbridge, Cheniere Energy and other energy pipeline/infrastructure companies that saw their equity values appreciate significantly
on the back of expected natural gas demand to power artificial intelligence (AI) focused data centers. |
|
↓
|
Keeping
roughly seven times the benchmark’s modest exposure to underperforming diversified metals and mining companies, including
several that suffered double-digit percentage declines. Overweighting in copper-focused miners was also detrimental as
key detractor ERO Copper and all other related holdings shed considerable equity value despite long-term expectations for healthy
demand from electrification trends. |
|
↓
|
Off-benchmark
renewable energy plays had a tough year amid shifting supply/demand, geopolitical and policy-related dynamics. Key
detractors were Albemarle (battery-grade lithium mining), Fluence Energy (digital renewable energy storage solutions; sold by
period-end), and some of Fluence’s green energy-focused peers in the electrical components and equipment industry.
|

AVERAGE
ANNUAL TOTAL RETURNS (%) Period
Ended April 30, 2025
|
|
1
Year |
5
Year |
10
Year |
|
Class
C |
-7.58
|
17.18
|
-0.11
|
|
Class
C (with sales charge) |
-8.49
|
17.18
|
-0.11
|
|
Russell
3000 Index |
11.40
|
15.12
|
11.68
|
|
S&P
North American Natural Resources Sector Index |
-3.60
|
18.67
|
3.94
|
|
S&P
Global Natural Resources Index |
-6.73
|
12.53
|
5.27
|
For current month-end performance,
please call Franklin Templeton at (800)
DIAL BEN/342-5236 or visit https://www.franklintempleton.com/investments/options/mutual-funds.
Important data provider notices
and terms available at www.franklintempletondatasources.com.
KEY
FUND STATISTICS (as
of April 30, 2025)
|
Total
Net Assets |
$293,885,401
|
|
Total
Number of Portfolio Holdings*
|
91
|
|
Total
Management Fee Paid |
$1,743,418
|
|
Portfolio
Turnover Rate |
19.72%
|

WHAT
WERE THE FUND COSTS FOR THE LAST YEAR? (based
on a hypothetical $10,000 investment)
|
Class
Name |
Costs
of a $10,000 investment
|
Costs
paid as a percentage of a $10,000
investment*
|
|
Class
R6 |
$60
|
0.62%
|
HOW
DID THE FUND PERFORM LAST YEAR AND WHAT AFFECTED ITS PERFORMANCE?
For the twelve months ended April
30, 2025, Class R6 shares of
Franklin Natural Resources Fund returned -6.56%.
The Fund compares its performance
to the S&P North American Natural Resources Sector Index and the S&P Global Natural Resources Index, which
returned -3.60% and -6.73%, respectively, for the same period.
PERFORMANCE
HIGHLIGHTS
|
Top
contributors to performance: | |
|
↑
|
Stock
selection in the oilfield services industry, where robust gains for off-benchmark positions in Technip Energies and Ranger Energy
Services were most beneficial. Portfolio underweighting in poor-performing integrated oil and gas companies such as Chevron
and Exxon Mobil further buoyed the Fund’s energy sector results. |
|
↑
|
Among
metals and mining companies, exceptionally strong one-year gains for the Fund’s overweighted stakes in gold producers such
as Alamos Gold and Newmont. Similarly elevated returns were seen with select contributors in the diversified metals and mining
industry, led by a heavily-overweighted position in rare earths mining and processing company MP Materials. |
|
↑
|
Off-benchmark
investments in the fertilizers and agricultural chemicals industry, where Corteva and Nutrien were standout contributors;
and in the industrial gases industry, where Air Products and Chemicals was the best of two holdings that added to both
relative and absolute returns. |
|
Top
detractors from performance: | |
|
↓
|
Allocation
in the oil and gas storage and transportation industry, where the Fund maintained much lighter-than-index exposures to
Enbridge, Cheniere Energy and other energy pipeline/infrastructure companies that saw their equity values appreciate significantly
on the back of expected natural gas demand to power artificial intelligence (AI) focused data centers. |
|
↓
|
Keeping
roughly seven times the benchmark’s modest exposure to underperforming diversified metals and mining companies, including
several that suffered double-digit percentage declines. Overweighting in copper-focused miners was also detrimental as
key detractor ERO Copper and all other related holdings shed considerable equity value despite long-term expectations for healthy
demand from electrification trends. |
|
↓
|
Off-benchmark
renewable energy plays had a tough year amid shifting supply/demand, geopolitical and policy-related dynamics. Key
detractors were Albemarle (battery-grade lithium mining), Fluence Energy (digital renewable energy storage solutions; sold by
period-end), and some of Fluence’s green energy-focused peers in the electrical components and equipment industry.
|
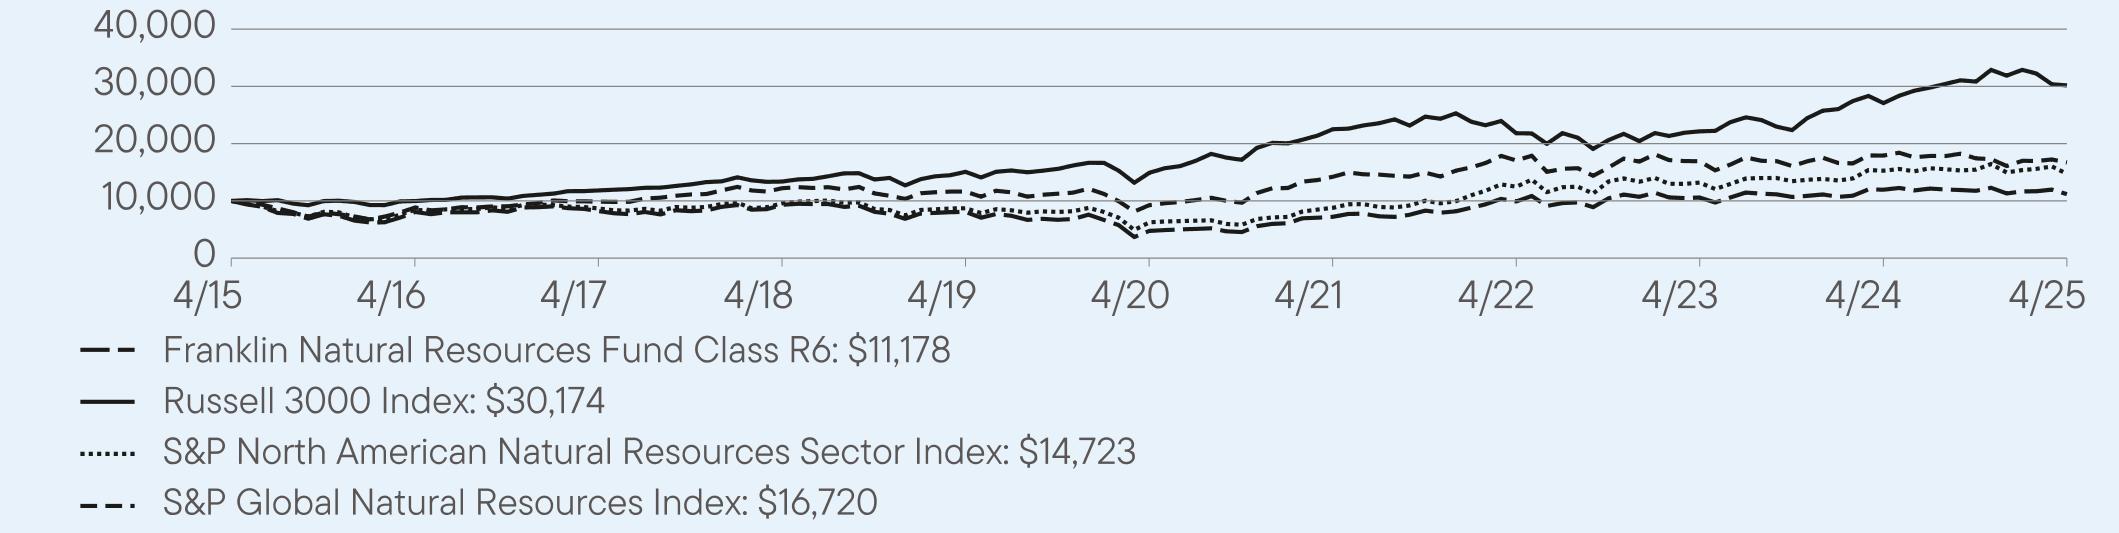
AVERAGE
ANNUAL TOTAL RETURNS (%) Period
Ended April 30, 2025
|
|
1
Year |
5
Year |
10
Year |
|
Class
R6 |
-6.56
|
18.59
|
1.12
|
|
Russell
3000 Index |
11.40
|
15.12
|
11.68
|
|
S&P
North American Natural Resources Sector Index |
-3.60
|
18.67
|
3.94
|
|
S&P
Global Natural Resources Index |
-6.73
|
12.53
|
5.27
|
For current month-end performance,
please call Franklin Templeton at (800)
DIAL BEN/342-5236 or visit https://www.franklintempleton.com/investments/options/mutual-funds.
Important data provider notices
and terms available at www.franklintempletondatasources.com.
KEY
FUND STATISTICS (as
of April 30, 2025)
|
Total
Net Assets |
$293,885,401
|
|
Total
Number of Portfolio Holdings*
|
91
|
|
Total
Management Fee Paid |
$1,743,418
|
|
Portfolio
Turnover Rate |
19.72%
|

WHAT
WERE THE FUND COSTS FOR THE LAST YEAR? (based
on a hypothetical $10,000 investment)
|
Class
Name |
Costs
of a $10,000 investment
|
Costs
paid as a percentage of a $10,000
investment*
|
|
Advisor
Class |
$72
|
0.74%
|
HOW
DID THE FUND PERFORM LAST YEAR AND WHAT AFFECTED ITS PERFORMANCE?
For the twelve months ended April
30, 2025, Advisor Class shares
of Franklin Natural Resources Fund returned -6.68%.
The Fund compares its performance
to the S&P North American Natural Resources Sector Index and the S&P Global Natural Resources Index, which
returned -3.60% and -6.73%, respectively, for the same period.
PERFORMANCE
HIGHLIGHTS
|
Top
contributors to performance: | |
|
↑
|
Stock
selection in the oilfield services industry, where robust gains for off-benchmark positions in Technip Energies and Ranger Energy
Services were most beneficial. Portfolio underweighting in poor-performing integrated oil and gas companies such as Chevron
and Exxon Mobil further buoyed the Fund’s energy sector results. |
|
↑
|
Among
metals and mining companies, exceptionally strong one-year gains for the Fund’s overweighted stakes in gold producers such
as Alamos Gold and Newmont. Similarly elevated returns were seen with select contributors in the diversified metals and mining
industry, led by a heavily-overweighted position in rare earths mining and processing company MP Materials. |
|
↑
|
Off-benchmark
investments in the fertilizers and agricultural chemicals industry, where Corteva and Nutrien were standout contributors;
and in the industrial gases industry, where Air Products and Chemicals was the best of two holdings that added to both
relative and absolute returns. |
|
Top
detractors from performance: | |
|
↓
|
Allocation
in the oil and gas storage and transportation industry, where the Fund maintained much lighter-than-index exposures to
Enbridge, Cheniere Energy and other energy pipeline/infrastructure companies that saw their equity values appreciate significantly
on the back of expected natural gas demand to power artificial intelligence (AI) focused data centers. |
|
↓
|
Keeping
roughly seven times the benchmark’s modest exposure to underperforming diversified metals and mining companies, including
several that suffered double-digit percentage declines. Overweighting in copper-focused miners was also detrimental as
key detractor ERO Copper and all other related holdings shed considerable equity value despite long-term expectations for healthy
demand from electrification trends. |
|
↓
|
Off-benchmark
renewable energy plays had a tough year amid shifting supply/demand, geopolitical and policy-related dynamics. Key
detractors were Albemarle (battery-grade lithium mining), Fluence Energy (digital renewable energy storage solutions; sold by
period-end), and some of Fluence’s green energy-focused peers in the electrical components and equipment industry.
|
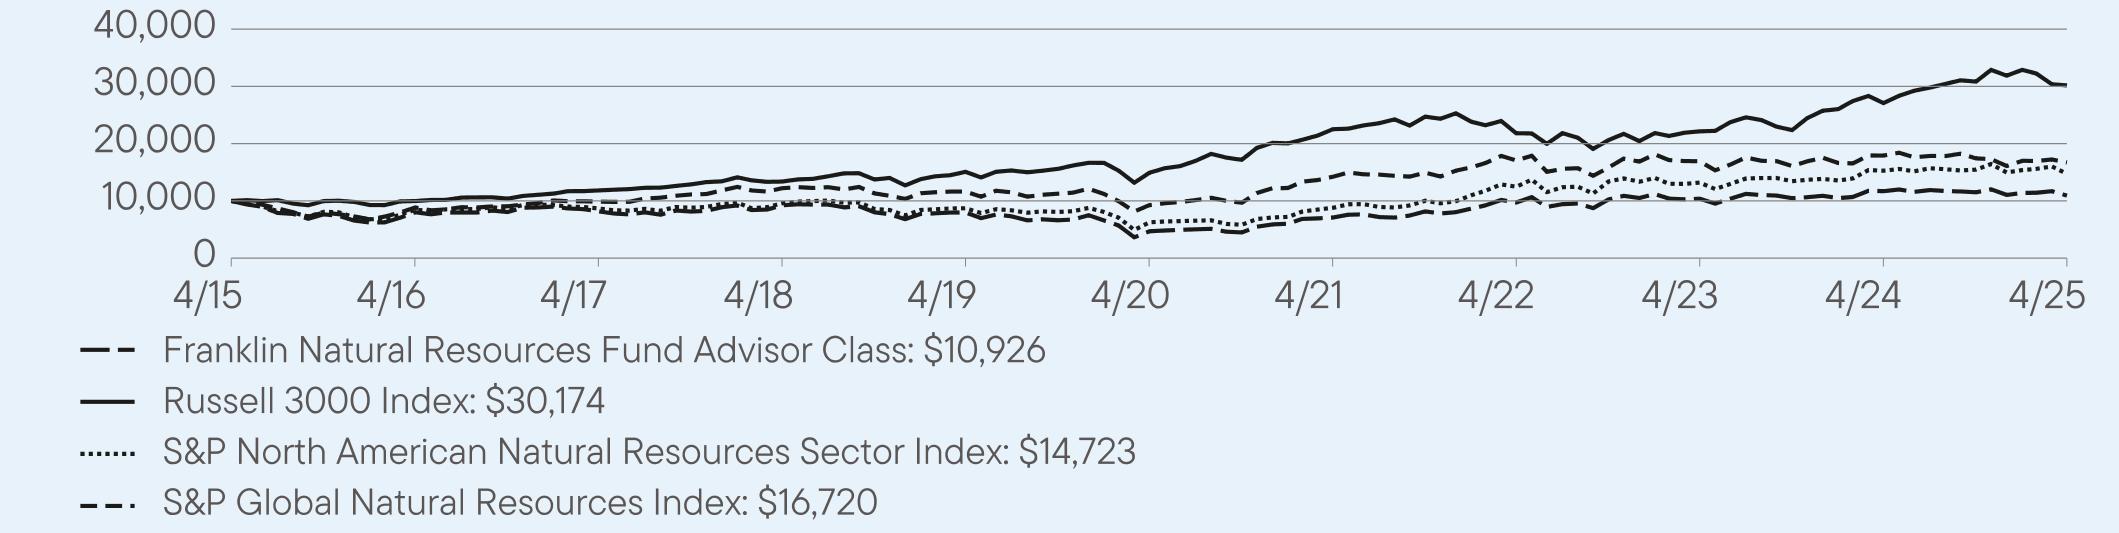
AVERAGE
ANNUAL TOTAL RETURNS (%) Period
Ended April 30, 2025
|
|
1
Year |
5
Year |
10
Year |
|
Advisor
Class |
-6.68
|
18.37
|
0.89
|
|
Russell
3000 Index |
11.40
|
15.12
|
11.68
|
|
S&P
North American Natural Resources Sector Index |
-3.60
|
18.67
|
3.94
|
|
S&P
Global Natural Resources Index |
-6.73
|
12.53
|
5.27
|
For current month-end performance,
please call Franklin Templeton at (800)
DIAL BEN/342-5236 or visit https://www.franklintempleton.com/investments/options/mutual-funds.
Important data provider notices
and terms available at www.franklintempletondatasources.com.
KEY
FUND STATISTICS (as
of April 30, 2025)
|
Total
Net Assets |
$293,885,401
|
|
Total
Number of Portfolio Holdings*
|
91
|
|
Total
Management Fee Paid |
$1,743,418
|
|
Portfolio
Turnover Rate |
19.72%
|
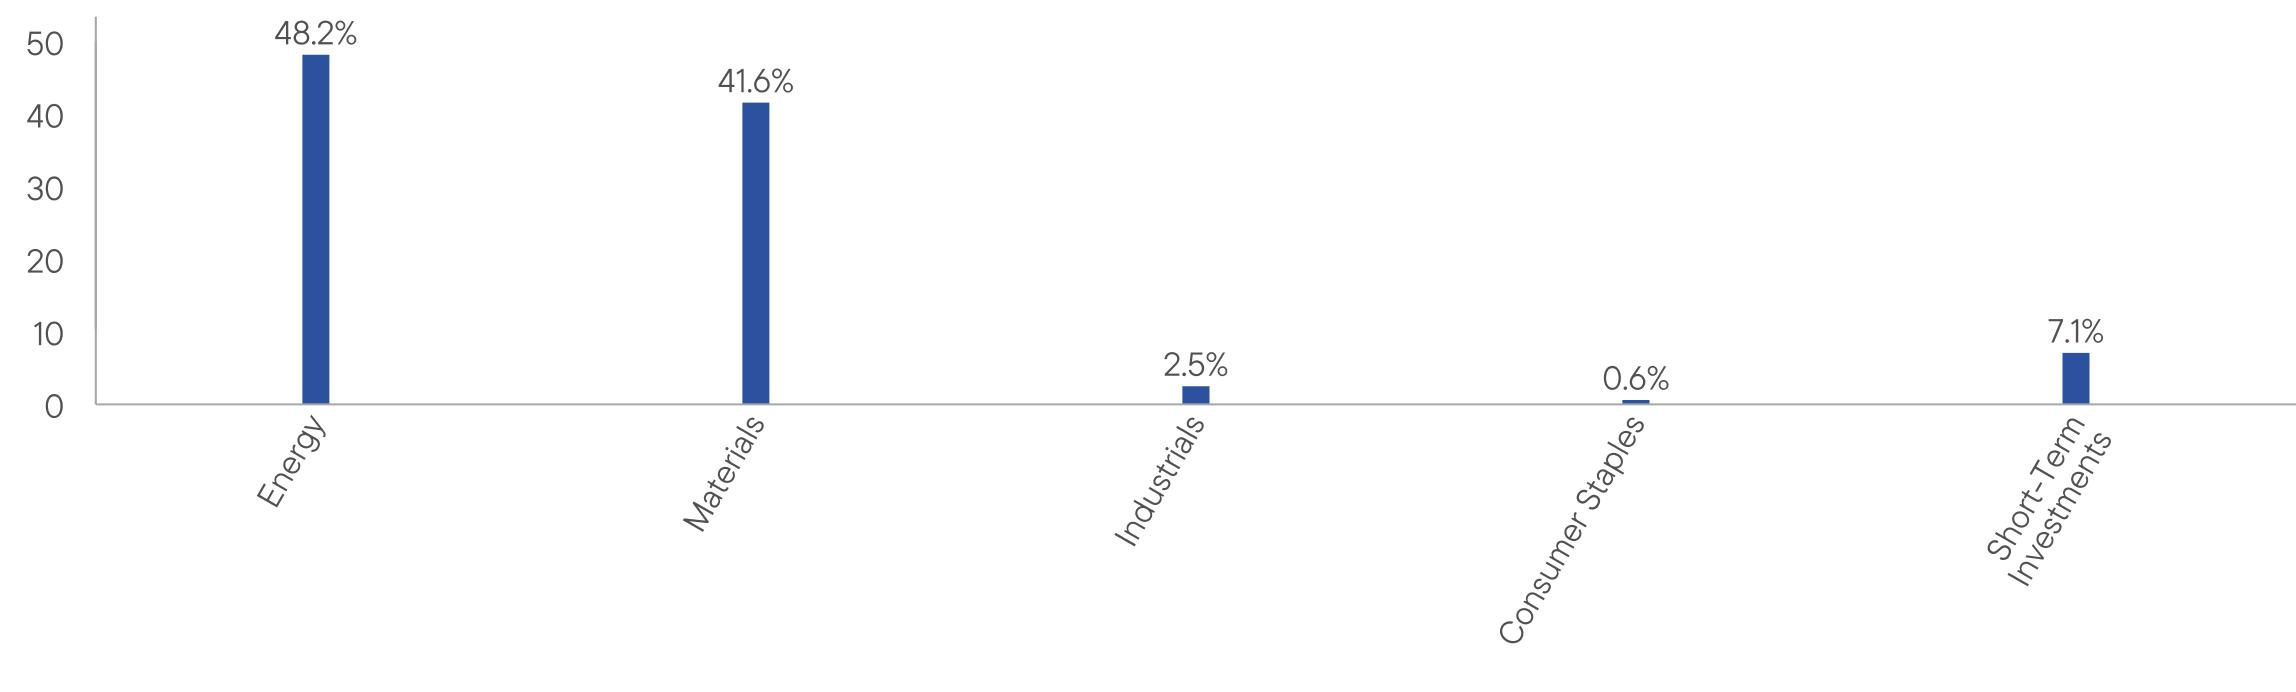
WHAT
WERE THE FUND COSTS FOR THE LAST YEAR? (based
on a hypothetical $10,000 investment)
|
Class
Name |
Costs
of a $10,000 investment
|
Costs
paid as a percentage of a $10,000
investment*
|
|
Class
A |
$102
|
1.04%
|
HOW
DID THE FUND PERFORM LAST YEAR AND WHAT AFFECTED ITS PERFORMANCE?
For the twelve months ended April
30, 2025, Class A shares of
Franklin Small Cap Growth Fund returned -3.25%.
The Fund compares its performance
to the Russell 2000 Growth Index and the S&P 500 Index, which returned 2.42% and 12.10%, respectively, for the same period.
PERFORMANCE
HIGHLIGHTS
|
Top
contributors to performance: | |
|
↑
|
Stock
selection in the industrials sector was a driver of positive relative performance led by a position in Kratos Defense & Security.
The defense contractor scored several lucrative contracts over the period, spotlighting the company’s continued growth
and innovation in defense and security solutions. |
|
↑
|
In
the financials sector, Paymentus Holdings is an out-of-benchmark position that significantly contributed to returns. The bill payment
services company has seen strong demand for its advanced payment platform and has onboarded several new, large enterprise
clients. |
|
↑
|
SiTime
was a leading contributor in the information technology (IT) sector. The semiconductor manufacturer commands a significant
portion of the precision timing industry and continued to see strong profit growth from its high-value applications and differentiated
product offerings. |
|
Top
detractors from performance: | |
|
↓
|
At
the sector level, relative returns were hurt most by stock selection in the health care sector, particularly in the biotechnology and
health care equipment and supplies industries. Stock selection and an overweight in the IT sector also meaningfully detracted
from relative results. Within IT, Onto innovation shares were hampered by a misalignment of supply-chain costs and inventory
levels over the period. |
|
↓
|
In
the financials sector, relative performance was hindered by a position in global payments software company Flywire, which faced
foreign exchange headwinds and student visa restrictions over the period. |
|
↓
|
In
the energy sector, Liberty Energy was a relative detractor as slower global economic growth and trade uncertainty curbed energy
demand. Notable leadership changes at the company also introduced some uncertainty that added to the stock’s decline.
|

AVERAGE
ANNUAL TOTAL RETURNS (%) Period
Ended April 30, 2025
|
|
1
Year |
5
Year |
10
Year |
|
Class
A |
-3.25
|
7.33
|
7.01
|
|
Class
A (with sales charge) |
-8.58
|
6.12
|
6.41
|
|
Russell
3000 Index |
11.40
|
15.12
|
11.68
|
|
Russell
2000 Growth Index |
2.42
|
7.60
|
6.39
|
|
S&P
500 Index |
12.10
|
15.61
|
12.32
|
For current month-end performance,
please call Franklin Templeton at (800)
DIAL BEN/342-5236 or visit https://www.franklintempleton.com/investments/options/mutual-funds.
Important data provider notices
and terms available at www.franklintempletondatasources.com.
KEY
FUND STATISTICS (as
of April 30, 2025)
|
Total
Net Assets |
$2,278,348,128
|
|
Total
Number of Portfolio Holdings*
|
124
|
|
Total
Management Fee Paid |
$16,586,955
|
|
Portfolio
Turnover Rate |
16.31%
|

WHAT
WERE THE FUND COSTS FOR THE LAST YEAR? (based
on a hypothetical $10,000 investment)
|
Class
Name |
Costs
of a $10,000 investment
|
Costs
paid as a percentage of a $10,000
investment*
|
|
Class
C |
$175
|
1.79%
|
HOW
DID THE FUND PERFORM LAST YEAR AND WHAT AFFECTED ITS PERFORMANCE?
For the twelve months ended April
30, 2025, Class C shares of
Franklin Small Cap Growth Fund returned -3.98%.
The Fund compares its performance
to the Russell 2000 Growth Index and the S&P 500 Index, which returned 2.42% and 12.10%, respectively, for the same period.
PERFORMANCE
HIGHLIGHTS
|
Top
contributors to performance: | |
|
↑
|
Stock
selection in the industrials sector was a driver of positive relative performance led by a position in Kratos Defense & Security.
The defense contractor scored several lucrative contracts over the period, spotlighting the company’s continued growth
and innovation in defense and security solutions. |
|
↑
|
In
the financials sector, Paymentus Holdings is an out-of-benchmark position that significantly contributed to returns. The bill payment
services company has seen strong demand for its advanced payment platform and has onboarded several new, large enterprise
clients. |
|
↑
|
SiTime
was a leading contributor in the information technology (IT) sector. The semiconductor manufacturer commands a significant
portion of the precision timing industry and continued to see strong profit growth from its high-value applications and differentiated
product offerings. |
|
Top
detractors from performance: | |
|
↓
|
At
the sector level, relative returns were hurt most by stock selection in the health care sector, particularly in the biotechnology and
health care equipment and supplies industries. Stock selection and an overweight in the IT sector also meaningfully detracted
from relative results. Within IT, Onto innovation shares were hampered by a misalignment of supply-chain costs and inventory
levels over the period. |
|
↓
|
In
the financials sector, relative performance was hindered by a position in global payments software company Flywire, which faced
foreign exchange headwinds and student visa restrictions over the period. |
|
↓
|
In
the energy sector, Liberty Energy was a relative detractor as slower global economic growth and trade uncertainty curbed energy
demand. Notable leadership changes at the company also introduced some uncertainty that added to the stock’s decline.
|

AVERAGE
ANNUAL TOTAL RETURNS (%) Period
Ended April 30, 2025
|
|
1
Year |
5
Year |
10
Year |
|
Class
C |
-3.98
|
6.55
|
6.23
|
|
Class
C (with sales charge) |
-4.94
|
6.55
|
6.23
|
|
Russell
3000 Index |
11.40
|
15.12
|
11.68
|
|
Russell
2000 Growth Index |
2.42
|
7.60
|
6.39
|
|
S&P
500 Index |
12.10
|
15.61
|
12.32
|
For current month-end performance,
please call Franklin Templeton at (800)
DIAL BEN/342-5236 or visit https://www.franklintempleton.com/investments/options/mutual-funds.
Important data provider notices
and terms available at www.franklintempletondatasources.com.
KEY
FUND STATISTICS (as
of April 30, 2025)
|
Total
Net Assets |
$2,278,348,128
|
|
Total
Number of Portfolio Holdings*
|
124
|
|
Total
Management Fee Paid |
$16,586,955
|
|
Portfolio
Turnover Rate |
16.31%
|

WHAT
WERE THE FUND COSTS FOR THE LAST YEAR? (based
on a hypothetical $10,000 investment)
|
Class
Name |
Costs
of a $10,000 investment
|
Costs
paid as a percentage of a $10,000
investment*
|
|
Class
R |
$127
|
1.29%
|
HOW
DID THE FUND PERFORM LAST YEAR AND WHAT AFFECTED ITS PERFORMANCE?
For the twelve months ended April
30, 2025, Class R shares of
Franklin Small Cap Growth Fund returned -3.50%.
The Fund compares its performance
to the Russell 2000 Growth Index and the S&P 500 Index, which returned 2.42% and 12.10%, respectively, for the same period.
PERFORMANCE
HIGHLIGHTS
|
Top
contributors to performance: | |
|
↑
|
Stock
selection in the industrials sector was a driver of positive relative performance led by a position in Kratos Defense & Security.
The defense contractor scored several lucrative contracts over the period, spotlighting the company’s continued growth
and innovation in defense and security solutions. |
|
↑
|
In
the financials sector, Paymentus Holdings is an out-of-benchmark position that significantly contributed to returns. The bill payment
services company has seen strong demand for its advanced payment platform and has onboarded several new, large enterprise
clients. |
|
↑
|
SiTime
was a leading contributor in the information technology (IT) sector. The semiconductor manufacturer commands a significant
portion of the precision timing industry and continued to see strong profit growth from its high-value applications and differentiated
product offerings. |
|
Top
detractors from performance: | |
|
↓
|
At
the sector level, relative returns were hurt most by stock selection in the health care sector, particularly in the biotechnology and
health care equipment and supplies industries. Stock selection and an overweight in the IT sector also meaningfully detracted
from relative results. Within IT, Onto innovation shares were hampered by a misalignment of supply-chain costs and inventory
levels over the period. |
|
↓
|
In
the financials sector, relative performance was hindered by a position in global payments software company Flywire, which faced
foreign exchange headwinds and student visa restrictions over the period. |
|
↓
|
In
the energy sector, Liberty Energy was a relative detractor as slower global economic growth and trade uncertainty curbed energy
demand. Notable leadership changes at the company also introduced some uncertainty that added to the stock’s decline.
|

AVERAGE
ANNUAL TOTAL RETURNS (%) Period
Ended April 30, 2025
|
|
1
Year |
5
Year |
10
Year |
|
Class
R |
-3.50
|
7.07
|
6.75
|
|
Russell
3000 Index |
11.40
|
15.12
|
11.68
|
|
Russell
2000 Growth Index |
2.42
|
7.60
|
6.39
|
|
S&P
500 Index |
12.10
|
15.61
|
12.32
|
For current month-end performance,
please call Franklin Templeton at (800)
DIAL BEN/342-5236 or visit https://www.franklintempleton.com/investments/options/mutual-funds.
Important data provider notices
and terms available at www.franklintempletondatasources.com.
KEY
FUND STATISTICS (as
of April 30, 2025)
|
Total
Net Assets |
$2,278,348,128
|
|
Total
Number of Portfolio Holdings*
|
124
|
|
Total
Management Fee Paid |
$16,586,955
|
|
Portfolio
Turnover Rate |
16.31%
|
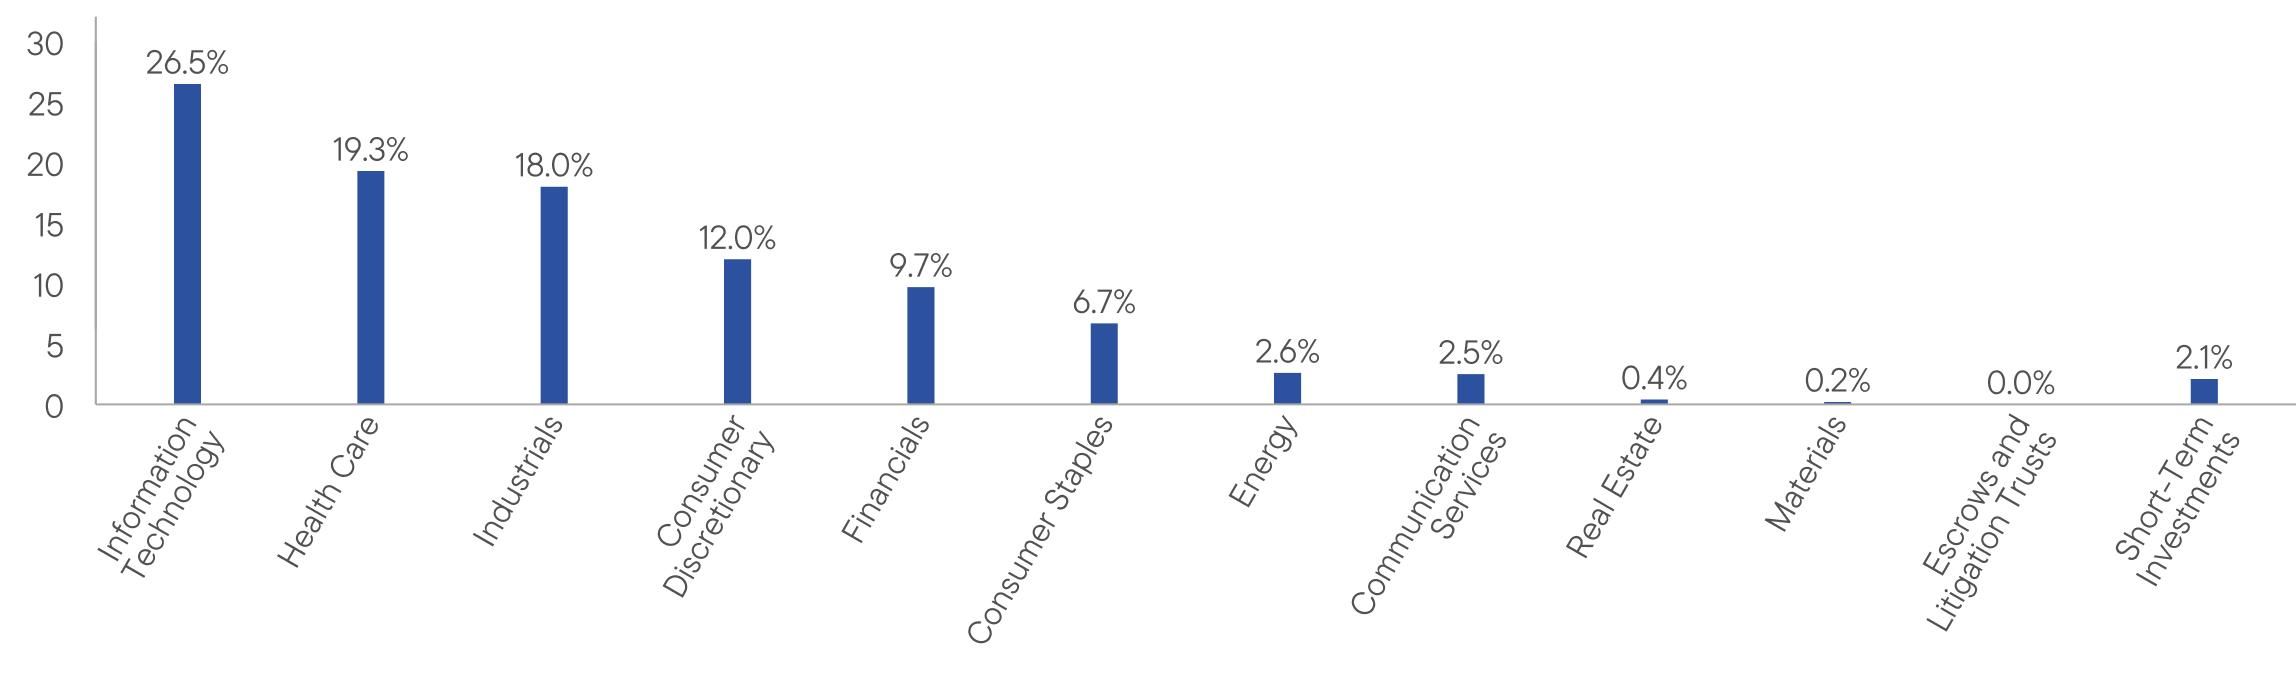
WHAT
WERE THE FUND COSTS FOR THE LAST YEAR? (based
on a hypothetical $10,000 investment)
|
Class
Name |
Costs
of a $10,000 investment
|
Costs
paid as a percentage of a $10,000
investment*
|
|
Class
R6 |
$64
|
0.65%
|
HOW
DID THE FUND PERFORM LAST YEAR AND WHAT AFFECTED ITS PERFORMANCE?
For the twelve months ended April
30, 2025, Class R6 shares of
Franklin Small Cap Growth Fund returned -2.88%.
The Fund compares its performance
to the Russell 2000 Growth Index and the S&P 500 Index, which returned 2.42% and 12.10%, respectively, for the same period.
PERFORMANCE
HIGHLIGHTS
|
Top
contributors to performance: | |
|
↑
|
Stock
selection in the industrials sector was a driver of positive relative performance led by a position in Kratos Defense & Security.
The defense contractor scored several lucrative contracts over the period, spotlighting the company’s continued growth
and innovation in defense and security solutions. |
|
↑
|
In
the financials sector, Paymentus Holdings is an out-of-benchmark position that significantly contributed to returns. The bill payment
services company has seen strong demand for its advanced payment platform and has onboarded several new, large enterprise
clients. |
|
↑
|
SiTime
was a leading contributor in the information technology (IT) sector. The semiconductor manufacturer commands a significant
portion of the precision timing industry and continued to see strong profit growth from its high-value applications and differentiated
product offerings. |
|
Top
detractors from performance: | |
|
↓
|
At
the sector level, relative returns were hurt most by stock selection in the health care sector, particularly in the biotechnology and
health care equipment and supplies industries. Stock selection and an overweight in the IT sector also meaningfully detracted
from relative results. Within IT, Onto innovation shares were hampered by a misalignment of supply-chain costs and inventory
levels over the period. |
|
↓
|
In
the financials sector, relative performance was hindered by a position in global payments software company Flywire, which faced
foreign exchange headwinds and student visa restrictions over the period. |
|
↓
|
In
the energy sector, Liberty Energy was a relative detractor as slower global economic growth and trade uncertainty curbed energy
demand. Notable leadership changes at the company also introduced some uncertainty that added to the stock’s decline.
|
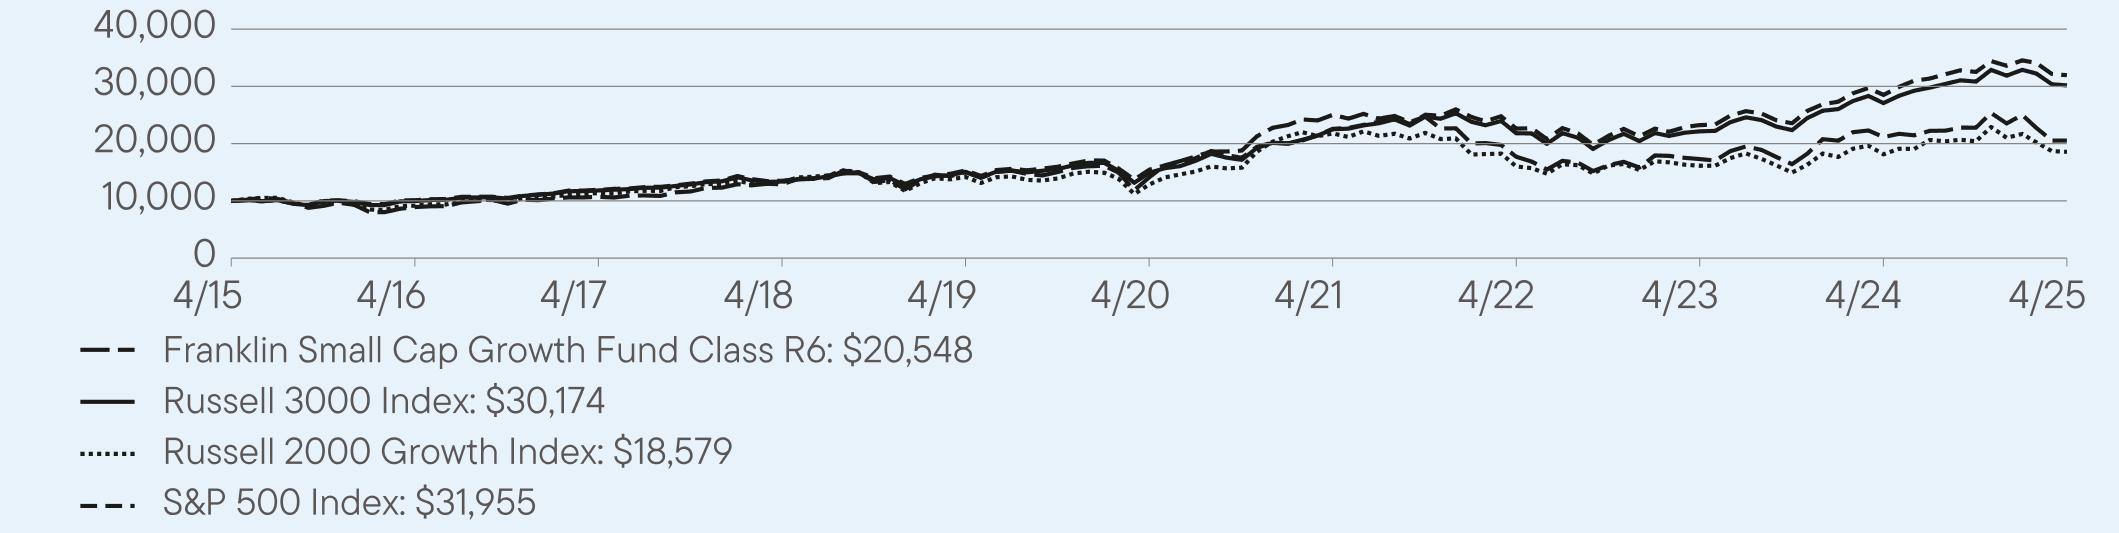
AVERAGE
ANNUAL TOTAL RETURNS (%) Period
Ended April 30, 2025
|
|
1
Year |
5
Year |
10
Year |
|
Class
R6 |
-2.88
|
7.77
|
7.47
|
|
Russell
3000 Index |
11.40
|
15.12
|
11.68
|
|
Russell
2000 Growth Index |
2.42
|
7.60
|
6.39
|
|
S&P
500 Index |
12.10
|
15.61
|
12.32
|
For current month-end performance,
please call Franklin Templeton at (800)
DIAL BEN/342-5236 or visit https://www.franklintempleton.com/investments/options/mutual-funds.
Important data provider notices
and terms available at www.franklintempletondatasources.com.
KEY
FUND STATISTICS (as
of April 30, 2025)
|
Total
Net Assets |
$2,278,348,128
|
|
Total
Number of Portfolio Holdings*
|
124
|
|
Total
Management Fee Paid |
$16,586,955
|
|
Portfolio
Turnover Rate |
16.31%
|

WHAT
WERE THE FUND COSTS FOR THE LAST YEAR? (based
on a hypothetical $10,000 investment)
|
Class
Name |
Costs
of a $10,000 investment
|
Costs
paid as a percentage of a $10,000
investment*
|
|
Advisor
Class |
$78
|
0.79%
|
HOW
DID THE FUND PERFORM LAST YEAR AND WHAT AFFECTED ITS PERFORMANCE?
For the twelve months ended April
30, 2025, Advisor Class shares
of Franklin Small Cap Growth Fund returned -3.05%.
The Fund compares its performance
to the Russell 2000 Growth Index and the S&P 500 Index, which returned 2.42% and 12.10%, respectively, for the
same period.
PERFORMANCE
HIGHLIGHTS
|
Top
contributors to performance: | |
|
↑
|
Stock
selection in the industrials sector was a driver of positive relative performance led by a position in Kratos Defense & Security.
The defense contractor scored several lucrative contracts over the period, spotlighting the company’s continued growth
and innovation in defense and security solutions. |
|
↑
|
In
the financials sector, Paymentus Holdings is an out-of-benchmark position that significantly contributed to returns. The bill payment
services company has seen strong demand for its advanced payment platform and has onboarded several new, large enterprise
clients. |
|
↑
|
SiTime
was a leading contributor in the information technology (IT) sector. The semiconductor manufacturer commands a significant
portion of the precision timing industry and continued to see strong profit growth from its high-value applications and differentiated
product offerings. |
|
Top
detractors from performance: | |
|
↓
|
At
the sector level, relative returns were hurt most by stock selection in the health care sector, particularly in the biotechnology and
health care equipment and supplies industries. Stock selection and an overweight in the IT sector also meaningfully detracted
from relative results. Within IT, Onto innovation shares were hampered by a misalignment of supply-chain costs and inventory
levels over the period. |
|
↓
|
In
the financials sector, relative performance was hindered by a position in global payments software company Flywire, which faced
foreign exchange headwinds and student visa restrictions over the period. |
|
↓
|
In
the energy sector, Liberty Energy was a relative detractor as slower global economic growth and trade uncertainty curbed energy
demand. Notable leadership changes at the company also introduced some uncertainty that added to the stock’s decline.
|
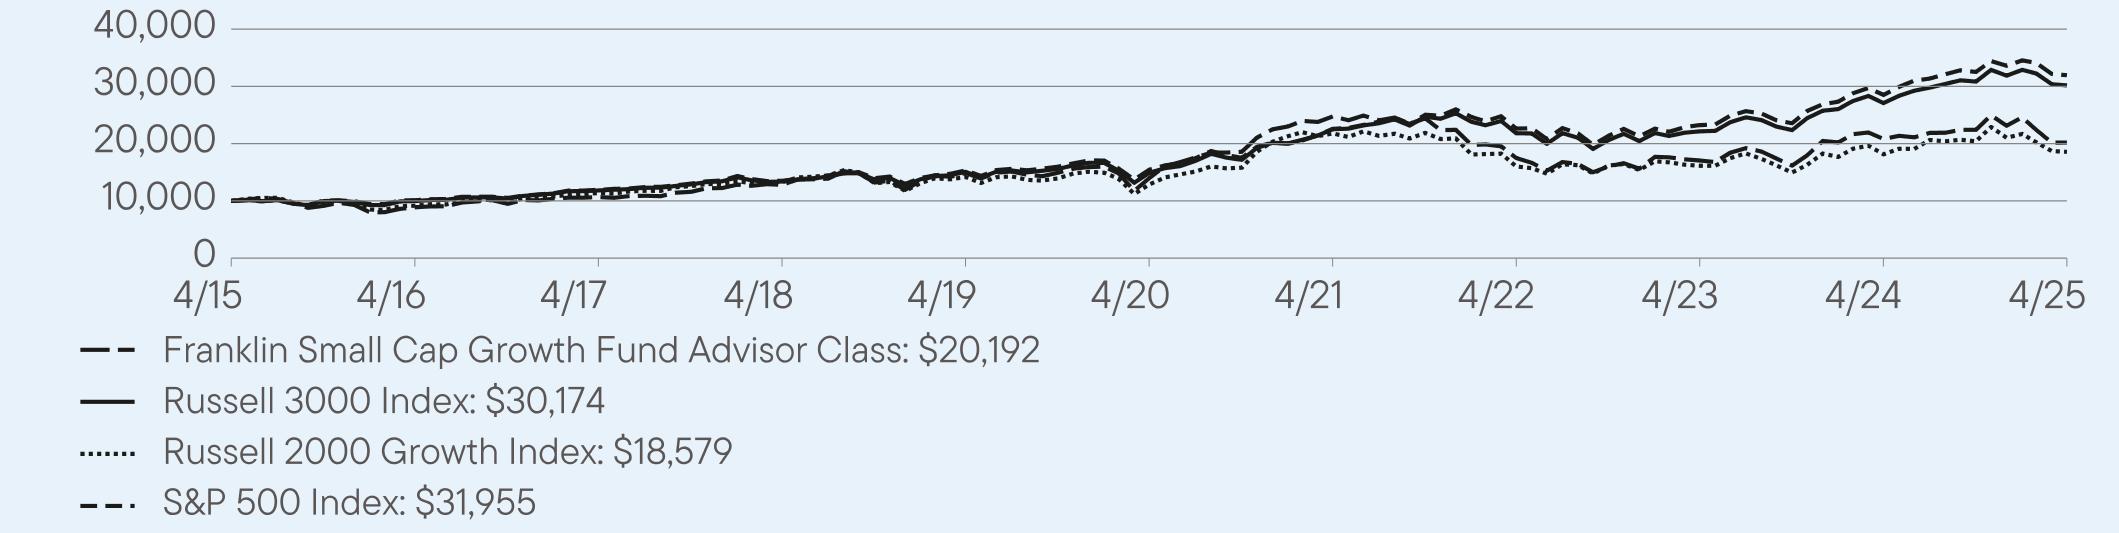
AVERAGE
ANNUAL TOTAL RETURNS (%) Period
Ended April 30, 2025
|
|
1
Year |
5
Year |
10
Year |
|
Advisor
Class |
-3.05
|
7.60
|
7.28
|
|
Russell
3000 Index |
11.40
|
15.12
|
11.68
|
|
Russell
2000 Growth Index |
2.42
|
7.60
|
6.39
|
|
S&P
500 Index |
12.10
|
15.61
|
12.32
|
For current month-end performance,
please call Franklin Templeton at (800)
DIAL BEN/342-5236 or visit https://www.franklintempleton.com/investments/options/mutual-funds.
Important data provider notices
and terms available at www.franklintempletondatasources.com.
KEY
FUND STATISTICS (as
of April 30, 2025)
|
Total
Net Assets |
$2,278,348,128
|
|
Total
Number of Portfolio Holdings*
|
124
|
|
Total
Management Fee Paid |
$16,586,955
|
|
Portfolio
Turnover Rate |
16.31%
|

This report describes changes
to the Fund that occurred during the reporting period.
WHAT
WERE THE FUND COSTS FOR THE LAST YEAR? (based
on a hypothetical $10,000 investment)
|
Class
Name |
Costs
of a $10,000 investment
|
Costs
paid as a percentage of a $10,000
investment*
|
|
Class
A |
$85
|
0.84%
|
HOW
DID THE FUND PERFORM LAST YEAR AND WHAT AFFECTED ITS PERFORMANCE?
For the twelve months ended April
30, 2025, Class A shares of
Franklin Small-Mid Cap Growth Fund returned 2.27%.
The Fund compares its performance
to the Russell Midcap Growth Index and the S&P 500 Index, which returned 13.65% and 12.10%, respectively, for
the same period.
PERFORMANCE
HIGHLIGHTS
|
Top
contributors to performance: | |
|
↑
|
Stock
selection and an overweight in the industrials sector where Axon Enterprise was a leading relative contributor. A focus on supporting
police budgets, lack of significant competition and minimal tariff exposure have been tailwinds for the law enforcement
technology company. |
|
↑
|
In
the consumer discretionary sector, DoorDash was a leading individual contributor at the stock level. The food delivery company
has dramatically improved its profitability year-over-year helped by DashPass subscriber growth and repeat orders. |
|
↑
|
In
the communication services sector, Roblox, a developer of an online game platform and game creation system, reported business
improvements that included stronger bookings and continued cost discipline. Management also stated that artificial intelligence
(AI) was being deployed across its platform for more efficient content creation and enhanced user experience. |
|
Top
detractors from performance: | |
|
↓
|
Stock
selection in the information technology (IT) sector meaningfully detracted from relative returns over the period. This was due
to stock selection and an underweight in the software industry, where an underweight in strong-performing shares of Applovin
detracted from relative returns. Company revenue grew substantially following the introduction of an AI-powered software
update that improves marketing and monetization of content. |
|
↓
|
In
the IT services industry, database specialist MongoDB faced several challenges that included a one-time revenue headwind that
impacted the company’s overall financial performance. Worsening economic conditions led the company to downgrade its guidance
for fiscal full-year 2025, which further pressured the stock. |
|
↓
|
A
challenging market environment also weighed on the shares of Blaize Holdings, which was another relative detractor in the IT sector.
The company specializes in AI-enabled edge computing solutions and went public in January 2025. |

AVERAGE
ANNUAL TOTAL RETURNS (%) Period
Ended April 30, 2025
|
|
1
Year |
5
Year |
10
Year |
|
Class
A |
2.27
|
8.58
|
8.11
|
|
Class
A (with sales charge) |
-3.35
|
7.36
|
7.51
|
|
Russell
3000 Index |
11.40
|
15.12
|
11.68
|
|
Russell
Midcap Growth Index |
13.65
|
12.31
|
10.58
|
|
S&P
500 Index |
12.10
|
15.61
|
12.32
|
For current month-end performance,
please call Franklin Templeton at (800)
DIAL BEN/342-5236 or visit https://www.franklintempleton.com/investments/options/mutual-funds.
Important data provider notices
and terms available at www.franklintempletondatasources.com.
KEY
FUND STATISTICS (as
of April 30, 2025)
|
Total
Net Assets |
$3,531,973,205
|
|
Total
Number of Portfolio Holdings*
|
99
|
|
Total
Management Fee Paid |
$17,655,085
|
|
Portfolio
Turnover Rate |
33.86%
|

HOW
HAS THE FUND CHANGED?
Effective September
30, 2024, Jennifer
Chen was added as a portfolio manager of the Fund.
This is a summary of a change
to the Fund since May 1, 2024.
For more complete information, you may review the Fund’s current prospectus
and any applicable supplements and the Fund’s next prospectus, which we expect to be available by September
1, 2025,
at https://www.franklintempleton.com/regulatory-fund-documents or upon request at (800) DIAL BEN/342-5236 or
prospectus.us.franklintempleton@fisglobal.com.
at https://www.franklintempleton.com/regulatory-fund-documents or upon request at (800) DIAL BEN/342-5236 or
prospectus.us.franklintempleton@fisglobal.com.
This report describes changes
to the Fund that occurred during the reporting period.
WHAT
WERE THE FUND COSTS FOR THE LAST YEAR? (based
on a hypothetical $10,000 investment)
|
Class
Name |
Costs
of a $10,000 investment
|
Costs
paid as a percentage of a $10,000
investment*
|
|
Class
C |
$160
|
1.59%
|
HOW
DID THE FUND PERFORM LAST YEAR AND WHAT AFFECTED ITS PERFORMANCE?
For the twelve months ended April
30, 2025, Class C shares of
Franklin Small-Mid Cap Growth Fund returned 1.52%.
The Fund compares its performance
to the Russell Midcap Growth Index and the S&P 500 Index, which returned 13.65% and 12.10%, respectively, for
the same period.
PERFORMANCE
HIGHLIGHTS
|
Top
contributors to performance: | |
|
↑
|
Stock
selection and an overweight in the industrials sector where Axon Enterprise was a leading relative contributor. A focus on supporting
police budgets, lack of significant competition and minimal tariff exposure have been tailwinds for the law enforcement
technology company. |
|
↑
|
In
the consumer discretionary sector, DoorDash was a leading individual contributor at the stock level. The food delivery company
has dramatically improved its profitability year-over-year helped by DashPass subscriber growth and repeat orders. |
|
↑
|
In
the communication services sector, Roblox, a developer of an online game platform and game creation system, reported business
improvements that included stronger bookings and continued cost discipline. Management also stated that artificial intelligence
(AI) was being deployed across its platform for more efficient content creation and enhanced user experience. |
|
Top
detractors from performance: | |
|
↓
|
Stock
selection in the information technology (IT) sector meaningfully detracted from relative returns over the period. This was due
to stock selection and an underweight in the software industry, where an underweight in strong-performing shares of Applovin
detracted from relative returns. Company revenue grew substantially following the introduction of an AI-powered software
update that improves marketing and monetization of content. |
|
↓
|
In
the IT services industry, database specialist MongoDB faced several challenges that included a one-time revenue headwind that
impacted the company’s overall financial performance. Worsening economic conditions led the company to downgrade its guidance
for fiscal full-year 2025, which further pressured the stock. |
|
↓
|
A
challenging market environment also weighed on the shares of Blaize Holdings, which was another relative detractor in the IT sector.
The company specializes in AI-enabled edge computing solutions and went public in January 2025. |

AVERAGE
ANNUAL TOTAL RETURNS (%) Period
Ended April 30, 2025
|
|
1
Year |
5
Year |
10
Year |
|
Class
C |
1.52
|
7.76
|
7.30
|
|
Class
C (with sales charge) |
0.52
|
7.76
|
7.30
|
|
Russell
3000 Index |
11.40
|
15.12
|
11.68
|
|
Russell
Midcap Growth Index |
13.65
|
12.31
|
10.58
|
|
S&P
500 Index |
12.10
|
15.61
|
12.32
|
For current month-end performance,
please call Franklin Templeton at (800)
DIAL BEN/342-5236 or visit https://www.franklintempleton.com/investments/options/mutual-funds.
Important data provider notices
and terms available at www.franklintempletondatasources.com.
KEY
FUND STATISTICS (as
of April 30, 2025)
|
Total
Net Assets |
$3,531,973,205
|
|
Total
Number of Portfolio Holdings*
|
99
|
|
Total
Management Fee Paid |
$17,655,085
|
|
Portfolio
Turnover Rate |
33.86%
|

HOW
HAS THE FUND CHANGED?
Effective September
30, 2024, Jennifer
Chen was added as a portfolio manager of the Fund.
This is a summary of a change
to the Fund since May 1, 2024.
For more complete information, you may review the Fund’s current prospectus
and any applicable supplements and the Fund’s next prospectus, which we expect to be available by September
1, 2025,
at https://www.franklintempleton.com/regulatory-fund-documents or upon request at (800) DIAL BEN/342-5236 or
prospectus.us.franklintempleton@fisglobal.com.
at https://www.franklintempleton.com/regulatory-fund-documents or upon request at (800) DIAL BEN/342-5236 or
prospectus.us.franklintempleton@fisglobal.com.
This report describes changes
to the Fund that occurred during the reporting period.
WHAT
WERE THE FUND COSTS FOR THE LAST YEAR? (based
on a hypothetical $10,000 investment)
|
Class
Name |
Costs
of a $10,000 investment
|
Costs
paid as a percentage of a $10,000
investment*
|
|
Class
R |
$110
|
1.09%
|
HOW
DID THE FUND PERFORM LAST YEAR AND WHAT AFFECTED ITS PERFORMANCE?
For the twelve months ended April
30, 2025, Class R shares of
Franklin Small-Mid Cap Growth Fund returned 2.04%.
The Fund compares its performance
to the Russell Midcap Growth Index and the S&P 500 Index, which returned 13.65% and 12.10%, respectively, for
the same period.
PERFORMANCE
HIGHLIGHTS
|
Top
contributors to performance: | |
|
↑
|
Stock
selection and an overweight in the industrials sector where Axon Enterprise was a leading relative contributor. A focus on supporting
police budgets, lack of significant competition and minimal tariff exposure have been tailwinds for the law enforcement
technology company. |
|
↑
|
In
the consumer discretionary sector, DoorDash was a leading individual contributor at the stock level. The food delivery company
has dramatically improved its profitability year-over-year helped by DashPass subscriber growth and repeat orders. |
|
↑
|
In
the communication services sector, Roblox, a developer of an online game platform and game creation system, reported business
improvements that included stronger bookings and continued cost discipline. Management also stated that artificial intelligence
(AI) was being deployed across its platform for more efficient content creation and enhanced user experience. |
|
Top
detractors from performance: | |
|
↓
|
Stock
selection in the information technology (IT) sector meaningfully detracted from relative returns over the period. This was due
to stock selection and an underweight in the software industry, where an underweight in strong-performing shares of Applovin
detracted from relative returns. Company revenue grew substantially following the introduction of an AI-powered software
update that improves marketing and monetization of content. |
|
↓
|
In
the IT services industry, database specialist MongoDB faced several challenges that included a one-time revenue headwind that
impacted the company’s overall financial performance. Worsening economic conditions led the company to downgrade its guidance
for fiscal full-year 2025, which further pressured the stock. |
|
↓
|
A
challenging market environment also weighed on the shares of Blaize Holdings, which was another relative detractor in the IT sector.
The company specializes in AI-enabled edge computing solutions and went public in January 2025. |

AVERAGE
ANNUAL TOTAL RETURNS (%) Period
Ended April 30, 2025
|
|
1
Year |
5
Year |
10
Year |
|
Class
R |
2.04
|
8.32
|
7.85
|
|
Russell
3000 Index |
11.40
|
15.12
|
11.68
|
|
Russell
Midcap Growth Index |
13.65
|
12.31
|
10.58
|
|
S&P
500 Index |
12.10
|
15.61
|
12.32
|
For current month-end performance,
please call Franklin Templeton at (800)
DIAL BEN/342-5236 or visit https://www.franklintempleton.com/investments/options/mutual-funds.
Important data provider notices
and terms available at www.franklintempletondatasources.com.
KEY
FUND STATISTICS (as
of April 30, 2025)
|
Total
Net Assets |
$3,531,973,205
|
|
Total
Number of Portfolio Holdings*
|
99
|
|
Total
Management Fee Paid |
$17,655,085
|
|
Portfolio
Turnover Rate |
33.86%
|
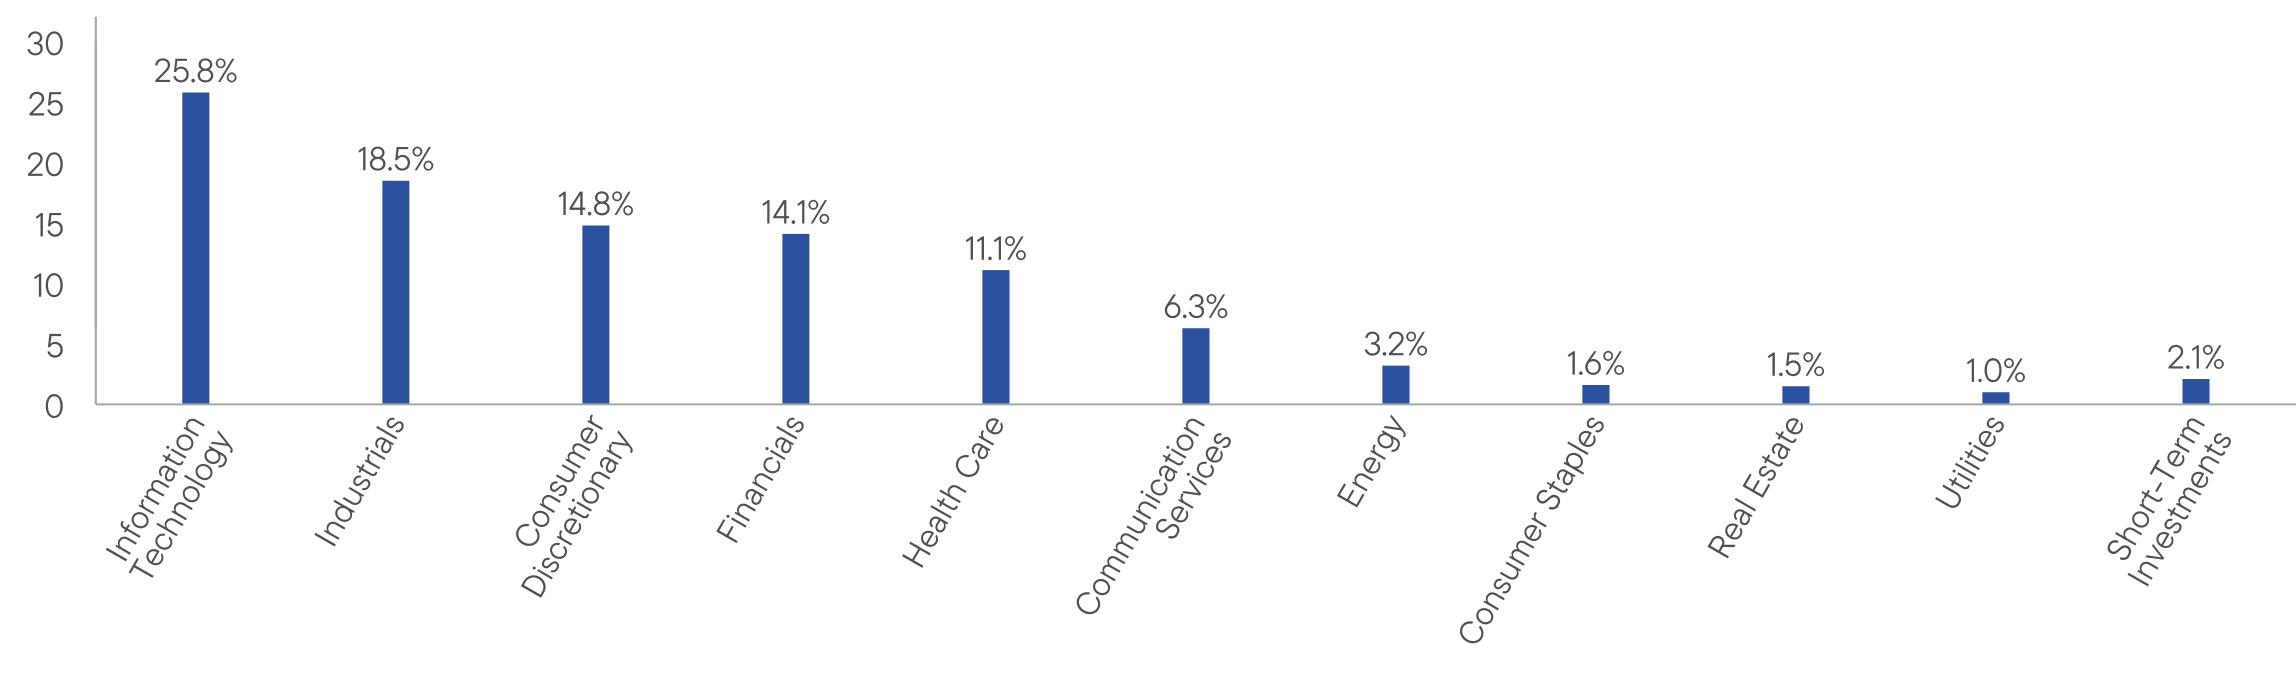
HOW
HAS THE FUND CHANGED?
Effective September
30, 2024, Jennifer
Chen was added as a portfolio manager of the Fund.
This is a summary of a change
to the Fund since May 1, 2024.
For more complete information, you may review the Fund’s current prospectus
and any applicable supplements and the Fund’s next prospectus, which we expect to be available by September
1, 2025,
at https://www.franklintempleton.com/regulatory-fund-documents or upon request at (800) DIAL BEN/342-5236 or
prospectus.us.franklintempleton@fisglobal.com.
at https://www.franklintempleton.com/regulatory-fund-documents or upon request at (800) DIAL BEN/342-5236 or
prospectus.us.franklintempleton@fisglobal.com.
This report describes changes
to the Fund that occurred during the reporting period.
WHAT
WERE THE FUND COSTS FOR THE LAST YEAR? (based
on a hypothetical $10,000 investment)
|
Class
Name |
Costs
of a $10,000 investment
|
Costs
paid as a percentage of a $10,000
investment*
|
|
Class
R6 |
$51
|
0.50%
|
HOW
DID THE FUND PERFORM LAST YEAR AND WHAT AFFECTED ITS PERFORMANCE?
For the twelve months ended April
30, 2025, Class R6 shares of
Franklin Small-Mid Cap Growth Fund returned 2.61%.
The Fund compares its performance
to the Russell Midcap Growth Index and the S&P 500 Index, which returned 13.65% and 12.10%, respectively, for
the same period.
PERFORMANCE
HIGHLIGHTS
|
Top
contributors to performance: | |
|
↑
|
Stock
selection and an overweight in the industrials sector where Axon Enterprise was a leading relative contributor. A focus on supporting
police budgets, lack of significant competition and minimal tariff exposure have been tailwinds for the law enforcement
technology company. |
|
↑
|
In
the consumer discretionary sector, DoorDash was a leading individual contributor at the stock level. The food delivery company
has dramatically improved its profitability year-over-year helped by DashPass subscriber growth and repeat orders. |
|
↑
|
In
the communication services sector, Roblox, a developer of an online game platform and game creation system, reported business
improvements that included stronger bookings and continued cost discipline. Management also stated that artificial intelligence
(AI) was being deployed across its platform for more efficient content creation and enhanced user experience. |
|
Top
detractors from performance: | |
|
↓
|
Stock
selection in the information technology (IT) sector meaningfully detracted from relative returns over the period. This was due
to stock selection and an underweight in the software industry, where an underweight in strong-performing shares of Applovin
detracted from relative returns. Company revenue grew substantially following the introduction of an AI-powered software
update that improves marketing and monetization of content. |
|
↓
|
In
the IT services industry, database specialist MongoDB faced several challenges that included a one-time revenue headwind that
impacted the company’s overall financial performance. Worsening economic conditions led the company to downgrade its guidance
for fiscal full-year 2025, which further pressured the stock. |
|
↓
|
A
challenging market environment also weighed on the shares of Blaize Holdings, which was another relative detractor in the IT sector.
The company specializes in AI-enabled edge computing solutions and went public in January 2025. |

AVERAGE
ANNUAL TOTAL RETURNS (%) Period
Ended April 30, 2025
|
|
1
Year |
5
Year |
10
Year |
|
Class
R6 |
2.61
|
8.96
|
8.55
|
|
Russell
3000 Index |
11.40
|
15.12
|
11.68
|
|
Russell
Midcap Growth Index |
13.65
|
12.31
|
10.58
|
|
S&P
500 Index |
12.10
|
15.61
|
12.32
|
For current month-end performance,
please call Franklin Templeton at (800)
DIAL BEN/342-5236 or visit https://www.franklintempleton.com/investments/options/mutual-funds.
Important data provider notices
and terms available at www.franklintempletondatasources.com.
KEY
FUND STATISTICS (as
of April 30, 2025)
|
Total
Net Assets |
$3,531,973,205
|
|
Total
Number of Portfolio Holdings*
|
99
|
|
Total
Management Fee Paid |
$17,655,085
|
|
Portfolio
Turnover Rate |
33.86%
|

HOW
HAS THE FUND CHANGED?
Effective September
30, 2024, Jennifer
Chen was added as a portfolio manager of the Fund.
This is a summary of a change
to the Fund since May 1, 2024.
For more complete information, you may review the Fund’s current prospectus
and any applicable supplements and the Fund’s next prospectus, which we expect to be available by September
1, 2025,
at https://www.franklintempleton.com/regulatory-fund-documents or upon request at (800) DIAL BEN/342-5236 or
prospectus.us.franklintempleton@fisglobal.com.
at https://www.franklintempleton.com/regulatory-fund-documents or upon request at (800) DIAL BEN/342-5236 or
prospectus.us.franklintempleton@fisglobal.com.
This report describes changes
to the Fund that occurred during the reporting period.
WHAT
WERE THE FUND COSTS FOR THE LAST YEAR? (based
on a hypothetical $10,000 investment)
|
Class
Name |
Costs
of a $10,000 investment
|
Costs
paid as a percentage of a $10,000
investment*
|
|
Advisor
Class |
$60
|
0.59%
|
HOW
DID THE FUND PERFORM LAST YEAR AND WHAT AFFECTED ITS PERFORMANCE?
For the twelve months ended April
30, 2025, Advisor Class shares
of Franklin Small-Mid Cap Growth Fund returned 2.52%.
The Fund compares its performance
to the Russell Midcap Growth Index and the S&P 500 Index, which returned 13.65% and 12.10%, respectively, for
the same period.
PERFORMANCE
HIGHLIGHTS
|
Top
contributors to performance: | |
|
↑
|
Stock
selection and an overweight in the industrials sector where Axon Enterprise was a leading relative contributor. A focus on supporting
police budgets, lack of significant competition and minimal tariff exposure have been tailwinds for the law enforcement
technology company. |
|
↑
|
In
the consumer discretionary sector, DoorDash was a leading individual contributor at the stock level. The food delivery company
has dramatically improved its profitability year-over-year helped by DashPass subscriber growth and repeat orders. |
|
↑
|
In
the communication services sector, Roblox, a developer of an online game platform and game creation system, reported business
improvements that included stronger bookings and continued cost discipline. Management also stated that artificial intelligence
(AI) was being deployed across its platform for more efficient content creation and enhanced user experience. |
|
Top
detractors from performance: | |
|
↓
|
Stock
selection in the information technology (IT) sector meaningfully detracted from relative returns over the period. This was due
to stock selection and an underweight in the software industry, where an underweight in strong-performing shares of Applovin
detracted from relative returns. Company revenue grew substantially following the introduction of an AI-powered software
update that improves marketing and monetization of content. |
|
↓
|
In
the IT services industry, database specialist MongoDB faced several challenges that included a one-time revenue headwind that
impacted the company’s overall financial performance. Worsening economic conditions led the company to downgrade its guidance
for fiscal full-year 2025, which further pressured the stock. |
|
↓
|
A
challenging market environment also weighed on the shares of Blaize Holdings, which was another relative detractor in the IT sector.
The company specializes in AI-enabled edge computing solutions and went public in January 2025. |
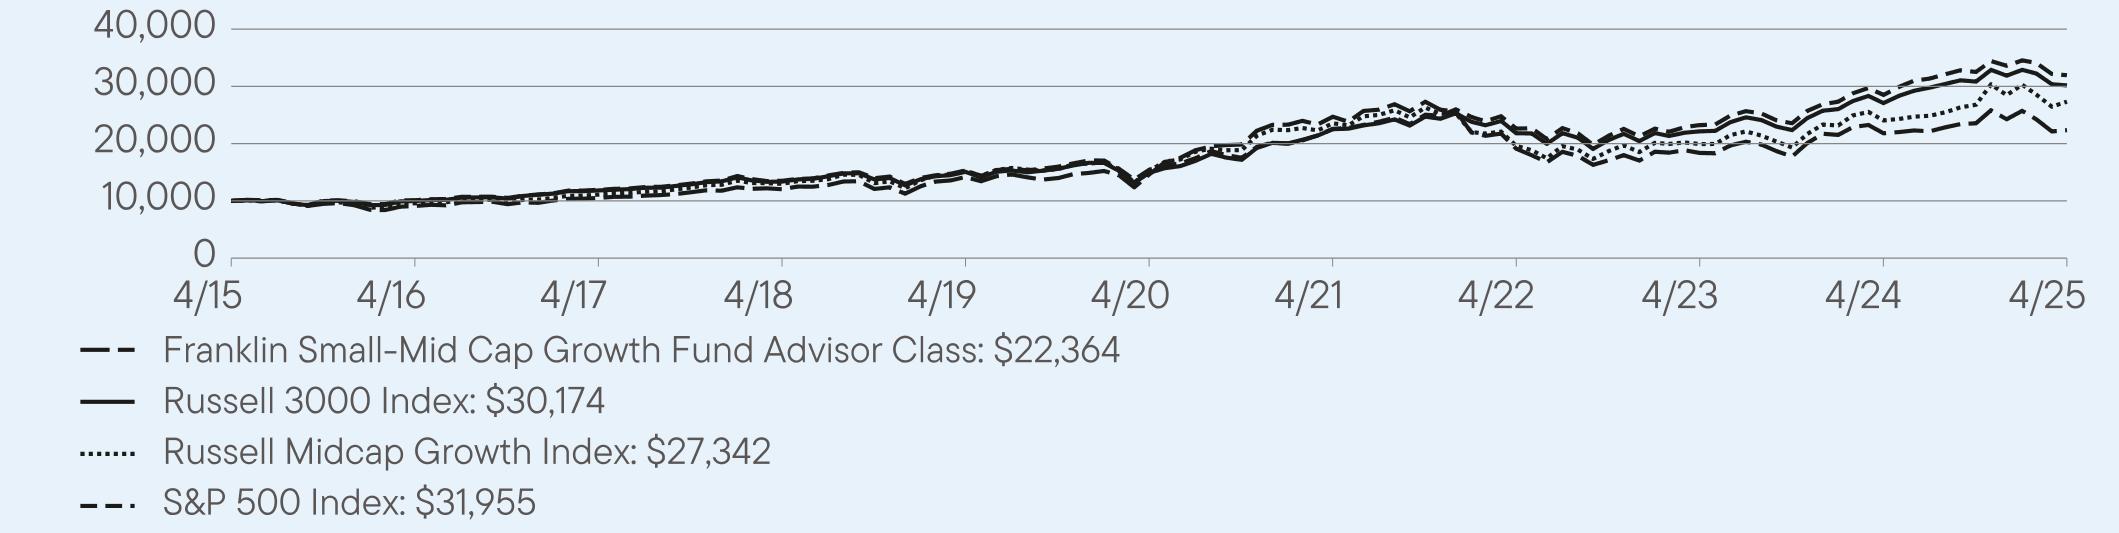
AVERAGE
ANNUAL TOTAL RETURNS (%) Period
Ended April 30, 2025
|
|
1
Year |
5
Year |
10
Year |
|
Advisor
Class |
2.52
|
8.85
|
8.38
|
|
Russell
3000 Index |
11.40
|
15.12
|
11.68
|
|
Russell
Midcap Growth Index |
13.65
|
12.31
|
10.58
|
|
S&P
500 Index |
12.10
|
15.61
|
12.32
|
For current month-end performance,
please call Franklin Templeton at (800)
DIAL BEN/342-5236 or visit https://www.franklintempleton.com/investments/options/mutual-funds.
Important data provider notices
and terms available at www.franklintempletondatasources.com.
KEY
FUND STATISTICS (as
of April 30, 2025)
|
Total
Net Assets |
$3,531,973,205
|
|
Total
Number of Portfolio Holdings*
|
99
|
|
Total
Management Fee Paid |
$17,655,085
|
|
Portfolio
Turnover Rate |
33.86%
|

HOW
HAS THE FUND CHANGED?
Effective September
30, 2024, Jennifer
Chen was added as a portfolio manager of the Fund.
This is a summary of a change
to the Fund since May 1, 2024.
For more complete information, you may review the Fund’s current prospectus
and any applicable supplements and the Fund’s next prospectus, which we expect to be available by September
1, 2025,
at https://www.franklintempleton.com/regulatory-fund-documents or upon request at (800) DIAL BEN/342-5236 or
prospectus.us.franklintempleton@fisglobal.com.
at https://www.franklintempleton.com/regulatory-fund-documents or upon request at (800) DIAL BEN/342-5236 or
prospectus.us.franklintempleton@fisglobal.com.
| [1] |
|
||
| [2] |
|
||
| [3] |
|
||
| [4] |
|
||
| [5] |
|
||
| [6] |
|
||
| [7] |
|
||
| [8] |
|
||
| [9] |
|
||
| [10] |
|
||
| [11] |
|
||
| [12] |
|
||
| [13] |
|
||
| [14] |
|
||
| [15] |
|
||
| [16] |
|
||
| [17] |
|
||
| [18] |
|
||
| [19] |
|
||
| [20] |
|
||
| [21] |
|
||
| [22] |
|
||
| [23] |
|
||
| [24] |
|
||
| [25] |
|
||
| [26] |
|
||
| [27] |
|
||
| [28] |
|
||
| [29] |
|
||
| [30] |
|
||
| [31] |
|
||
| [32] |
|
||
| [33] |
|
||
| [34] |
|
||
| [35] |
|
||
| [36] |
|
||
| [37] |
|
||
| [38] |
|
||
| [39] |
|
||
| [40] |
|
||
| [41] |
|
||
| [42] |
|
||
| [43] |
|
||
| [44] |
|
||
| [45] |
|
||
| [46] |
|
||
| [47] |
|
||
| [48] |
|
||
| [49] |
|
||
| [50] |
|
||
| [51] |
|
||
| [52] |
|
||
| [53] |
|
||
| [54] |
|
||
| [55] |
|
||
| [56] |
|