| IMPACT Phase 2b MASH Trial - Topline Results Pemvidutide: Designed to be the Treatment of Choice for Liver and Cardiometabolic Diseases J u n e 2 6 , 2 0 2 5 Company Confidential |
| Forward-looking statements Safe-Harbor Statement This presentation has been prepared by Altimmune, Inc. ("we," "us," "our," "Altimmune" or the "Company") and includes certain “forward-looking statements” within the meaning of the Private Securities Litigation Reform Act of 1995, including, but not limited to, statements relating to future financial or business performance, conditions, plans, prospects, trends, or strategies and other financial and business matters, including without limitation, the timing of key milestones for our clinical assets, the results of the IMPACT Phase 2b clinical trial evaluating pemvidutide in subjects with MASH, the performance of our drug candidates in ongoing and future clinical trials and the prospects for regulatory approval, commercializing or selling any product or drug candidates. In addition, when or if used in this press release, the words “may,” “could,” “should,” “anticipate,” “believe,” “estimate,” “expect,” “intend,” “plan,” “predict,” “suggest” and similar expressions and their variants, as they relate to the Company may identify forward-looking statements. The Company cautions that these forward-looking statements are subject to numerous assumptions, risks, and uncertainties, which change over time. Important factors that may cause actual results to differ materially from the results discussed in the forward looking statements or historical experience include risks and uncertainties, including risks such as delays in regulatory review, manufacturing and supply chain interruptions, access to clinical sites, enrollment, adverse effects on healthcare systems and disruption of the global economy; the impact subject baseline characteristics, including body weight, on the success of future trials; the reliability of the results of studies relating to human safety and possible adverse effects resulting from the administration of the Company’s product candidates; the Company’s ability to manufacture clinical trial materials on the timelines anticipated; and the success of future product advancements, including the success of future clinical trials. Further information on the factors and risks that could affect the Company's business, financial conditions and results of operations are contained in the Company’s filings with the U.S. Securities and Exchange Commission, including under the heading “Risk Factors” in the Company’s latest annual report on Form 10-K, quarterly report on Form 10-Q and our other filings with the SEC, which are available at www.sec.gov. 2 |
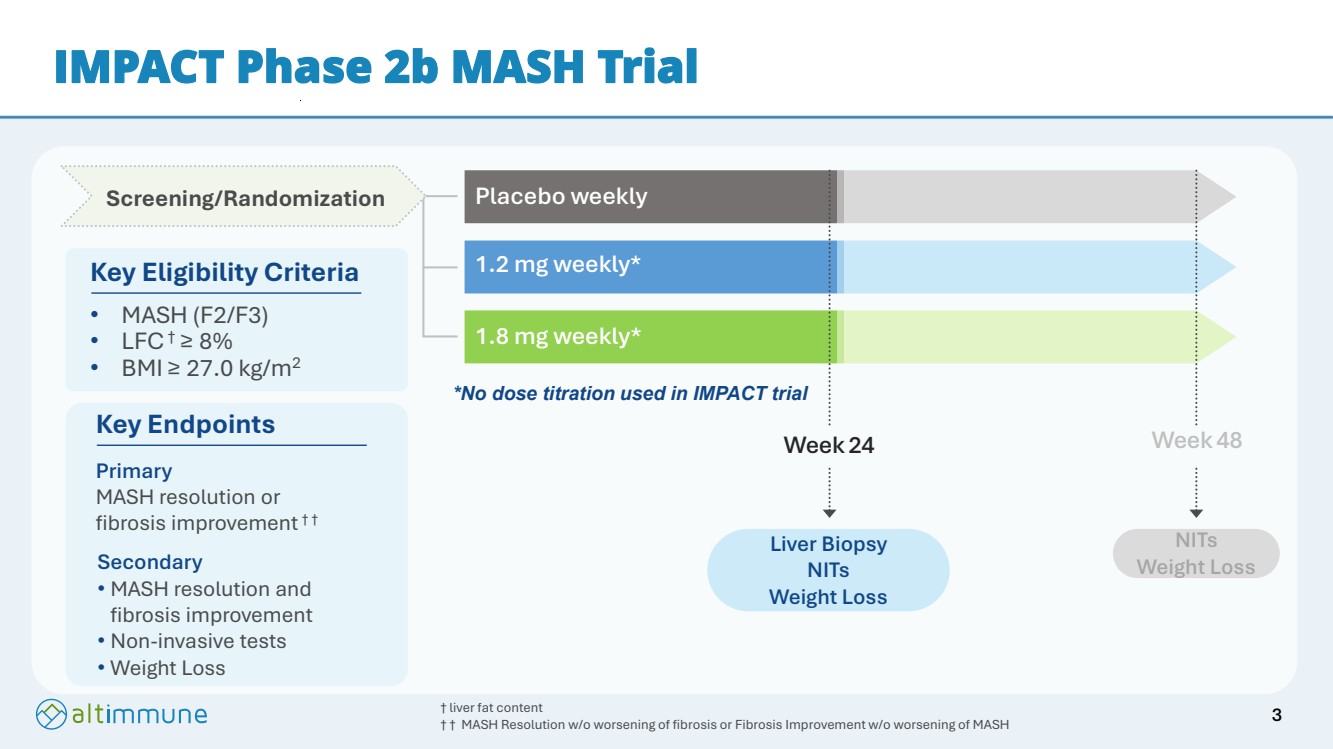
| 1.2 mg weekly* 1.8 mg weekly* Placebo weekly Week 48 NITs Weight Loss Week 24 Liver Biopsy NITs Weight Loss Screening/Randomization IMPACT Phase 2b MASH Trial Key Eligibility Criteria • MASH (F2/F3) • LFC† ≥ 8% • BMI ≥ 27.0 kg/m2 † liver fat content † † MASH Resolution w/o worsening of fibrosis or Fibrosis Improvement w/o worsening of MASH Key Endpoints Primary MASH resolution or fibrosis improvement † † Secondary • MASH resolution and fibrosis improvement • Non-invasive tests • Weight Loss *No dose titration used in IMPACT trial 3 |
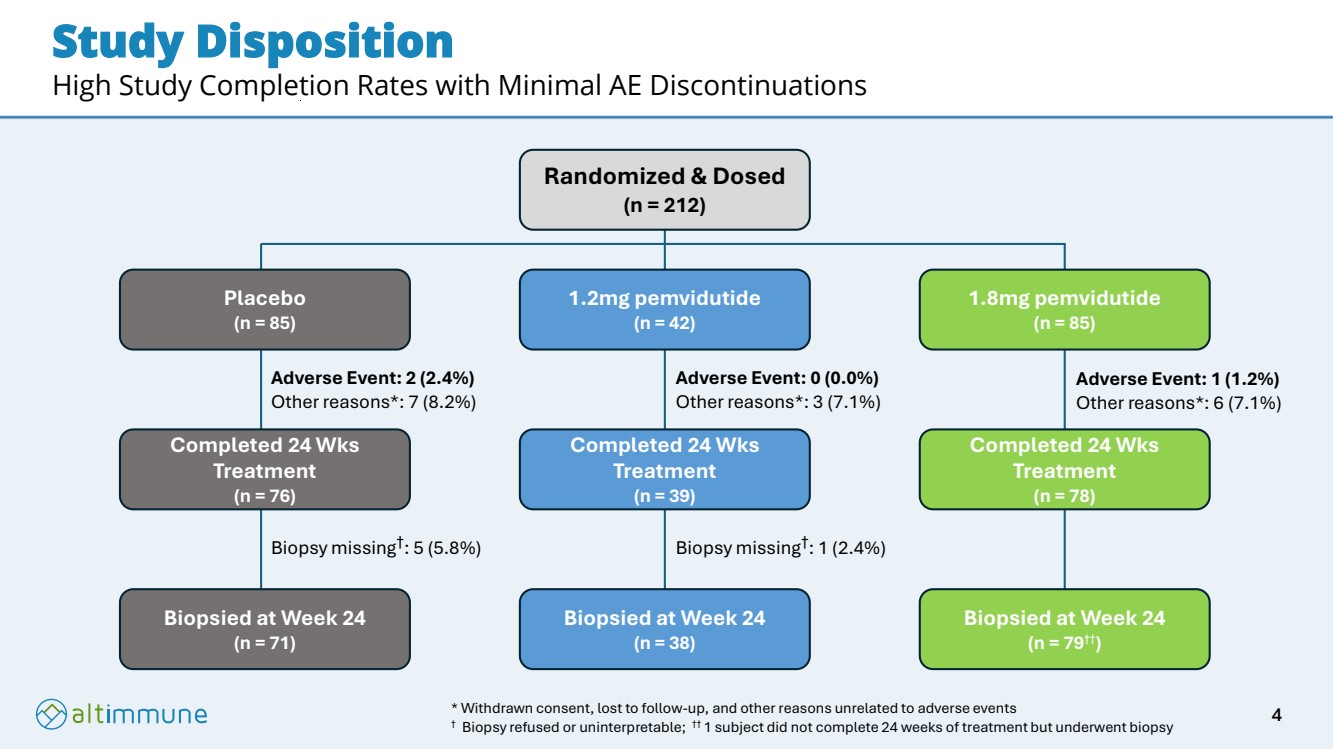
| Study Disposition High Study Completion Rates with Minimal AE Discontinuations Randomized & Dosed (n = 212) Placebo (n = 85) 1.2mg pemvidutide (n = 42) 1.8mg pemvidutide (n = 85) Completed 24 Wks Treatment (n = 76) Completed 24 Wks Treatment (n = 39) Completed 24 Wks Treatment (n = 78) Biopsied at Week 24 (n = 71) Biopsied at Week 24 (n = 38) Biopsied at Week 24 (n = 79††) Adverse Event: 2 (2.4%) Other reasons*: 7 (8.2%) Biopsy missing† : 5 (5.8%) Biopsy missing† : 1 (2.4%) Adverse Event: 0 (0.0%) Other reasons*: 3 (7.1%) Adverse Event: 1 (1.2%) Other reasons*: 6 (7.1%) * Withdrawn consent, lost to follow-up, and other reasons unrelated to adverse events † Biopsy refused or uninterpretable; †† 1 subject did not complete 24 weeks of treatment but underwent biopsy 4 |
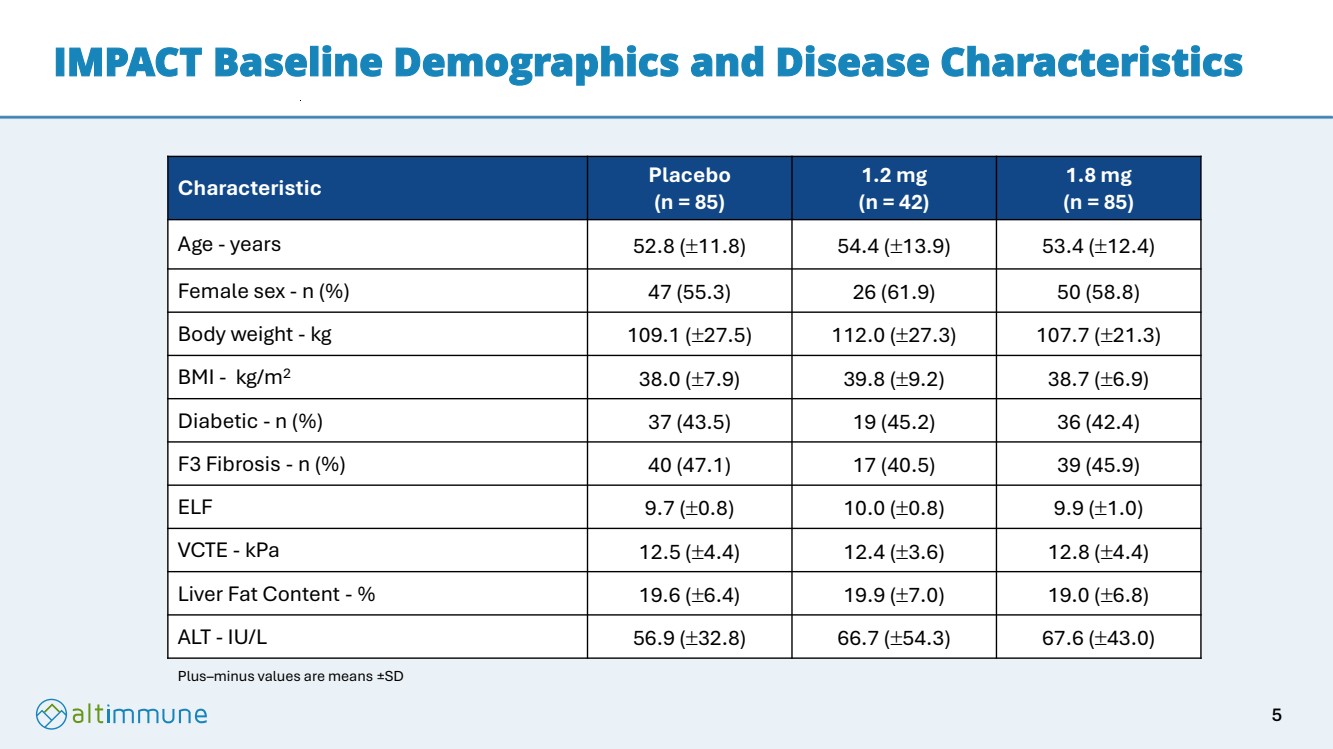
| IMPACT Baseline Demographics and Disease Characteristics Characteristic Placebo (n = 85) 1.2 mg (n = 42) 1.8 mg (n = 85) Age - years 52.8 (11.8) 54.4 (13.9) 53.4 (12.4) Female sex - n (%) 47 (55.3) 26 (61.9) 50 (58.8) Body weight - kg 109.1 (27.5) 112.0 (27.3) 107.7 (21.3) BMI - kg/m2 38.0 (7.9) 39.8 (9.2) 38.7 (6.9) Diabetic - n (%) 37 (43.5) 19 (45.2) 36 (42.4) F3 Fibrosis - n (%) 40 (47.1) 17 (40.5) 39 (45.9) ELF 9.7 (0.8) 10.0 (0.8) 9.9 (1.0) VCTE - kPa 12.5 (4.4) 12.4 (3.6) 12.8 (4.4) Liver Fat Content - % 19.6 (6.4) 19.9 (7.0) 19.0 (6.8) ALT - IU/L 56.9 (32.8) 66.7 (54.3) 67.6 (43.0) Plus–minus values are means ±SD 5 |
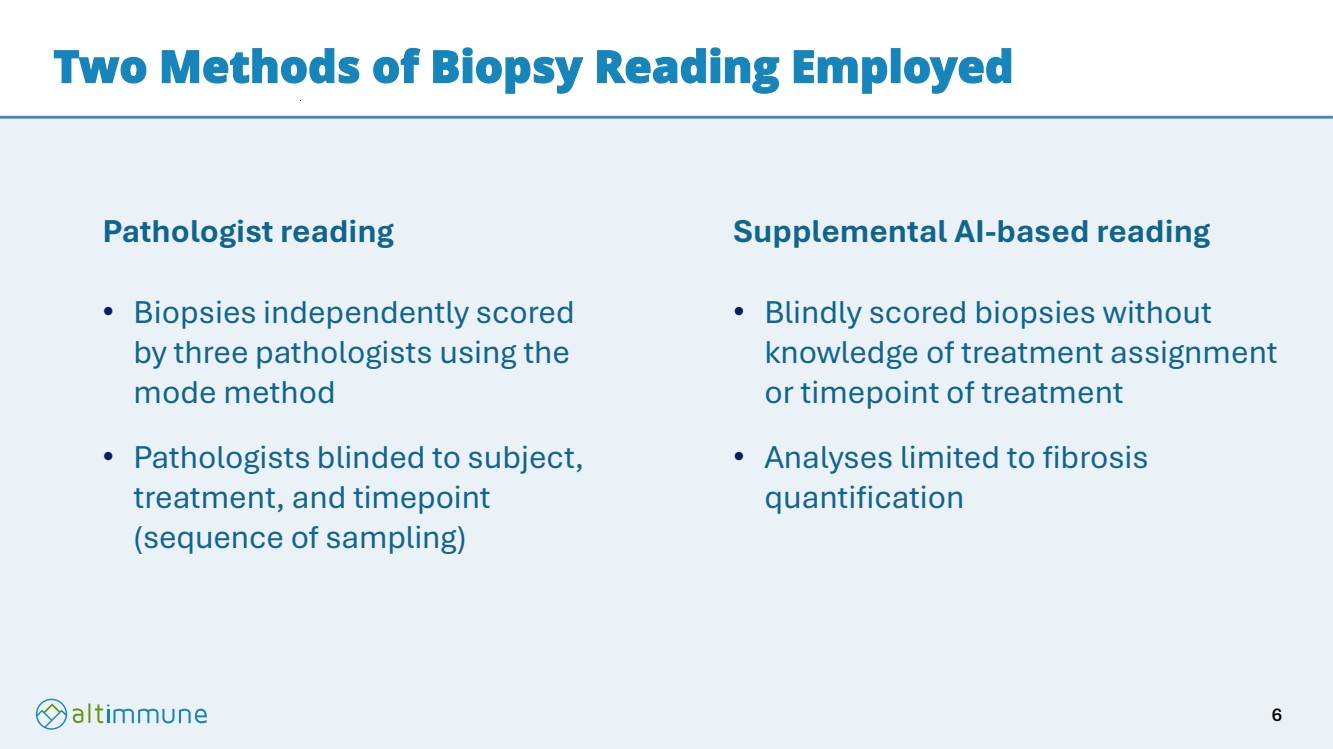
| Two Methods of Biopsy Reading Employed Pathologist reading • Biopsies independently scored by three pathologists using the mode method • Pathologists blinded to subject, treatment, and timepoint (sequence of sampling) Supplemental AI-based reading • Blindly scored biopsies without knowledge of treatment assignment or timepoint of treatment • Analyses limited to fibrosis quantification 6 |
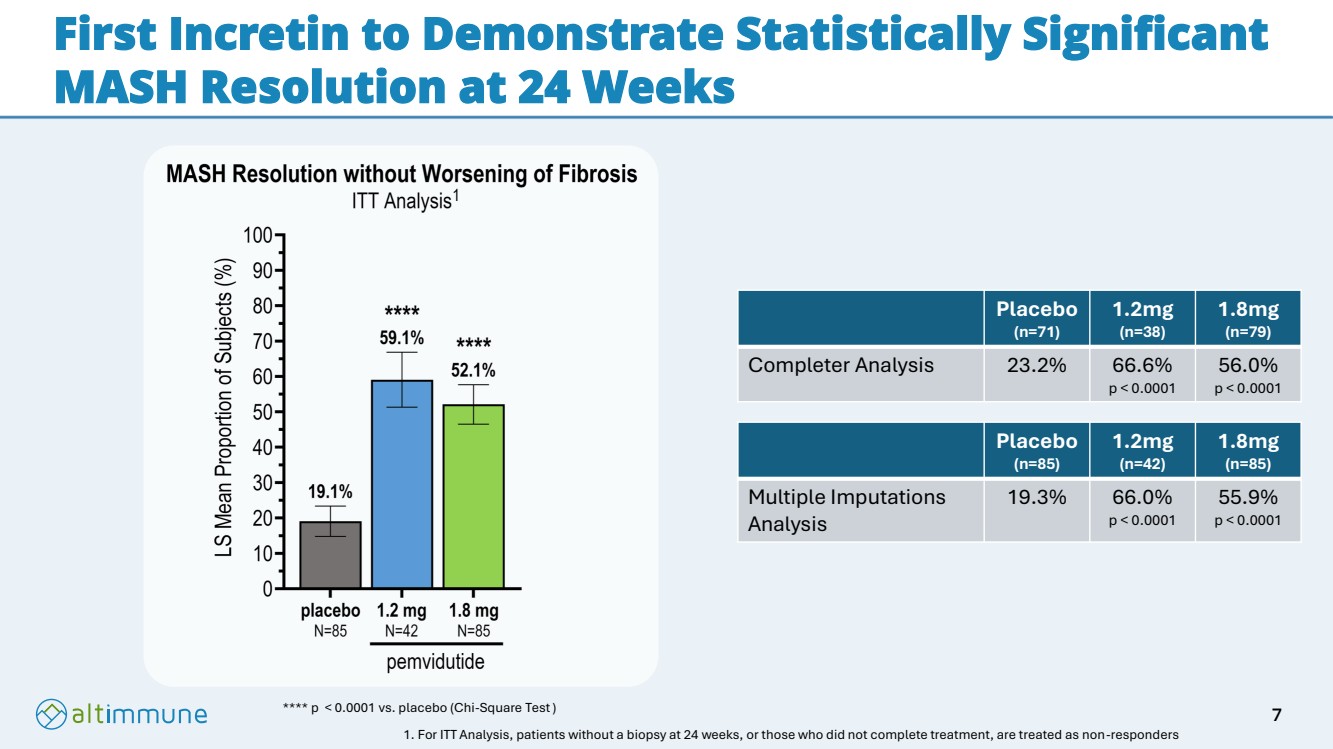
| First Incretin to Demonstrate Statistically Significant MASH Resolution at 24 Weeks **** p < 0.0001 vs. placebo (Chi-Square Test) Placebo (n=71) 1.2mg (n=38) 1.8mg (n=79) Completer Analysis 23.2% 66.6% p < 0.0001 56.0% p < 0.0001 Placebo (n=85) 1.2mg (n=42) 1.8mg (n=85) Multiple Imputations Analysis 19.3% 66.0% p < 0.0001 55.9% p < 0.0001 1. For ITT Analysis, patients without a biopsy at 24 weeks, or those who did not complete treatment, are treated as non-responders 1 7 |
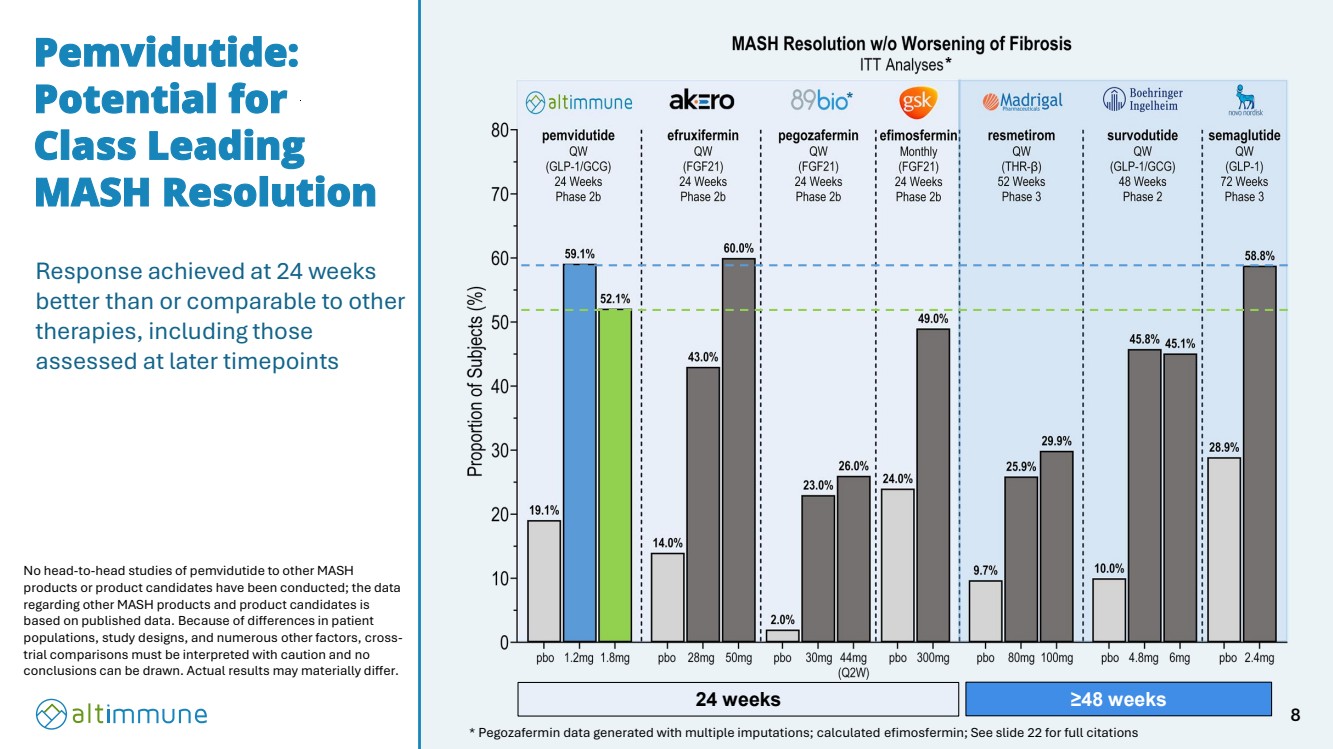
| Response achieved at 24 weeks better than or comparable to other therapies, including those assessed at later timepoints Pemvidutide: Potential for Class Leading MASH Resolution * Pegozafermin data generated with multiple imputations; calculated efimosfermin; See slide 22 for full citations * No head-to-head studies of pemvidutide to other MASH products or product candidates have been conducted; the data regarding other MASH products and product candidates is based on published data. Because of differences in patient populations, study designs, and numerous other factors, cross-trial comparisons must be interpreted with caution and no conclusions can be drawn. Actual results may materially differ. 24 weeks ≥48 weeks * 8 |
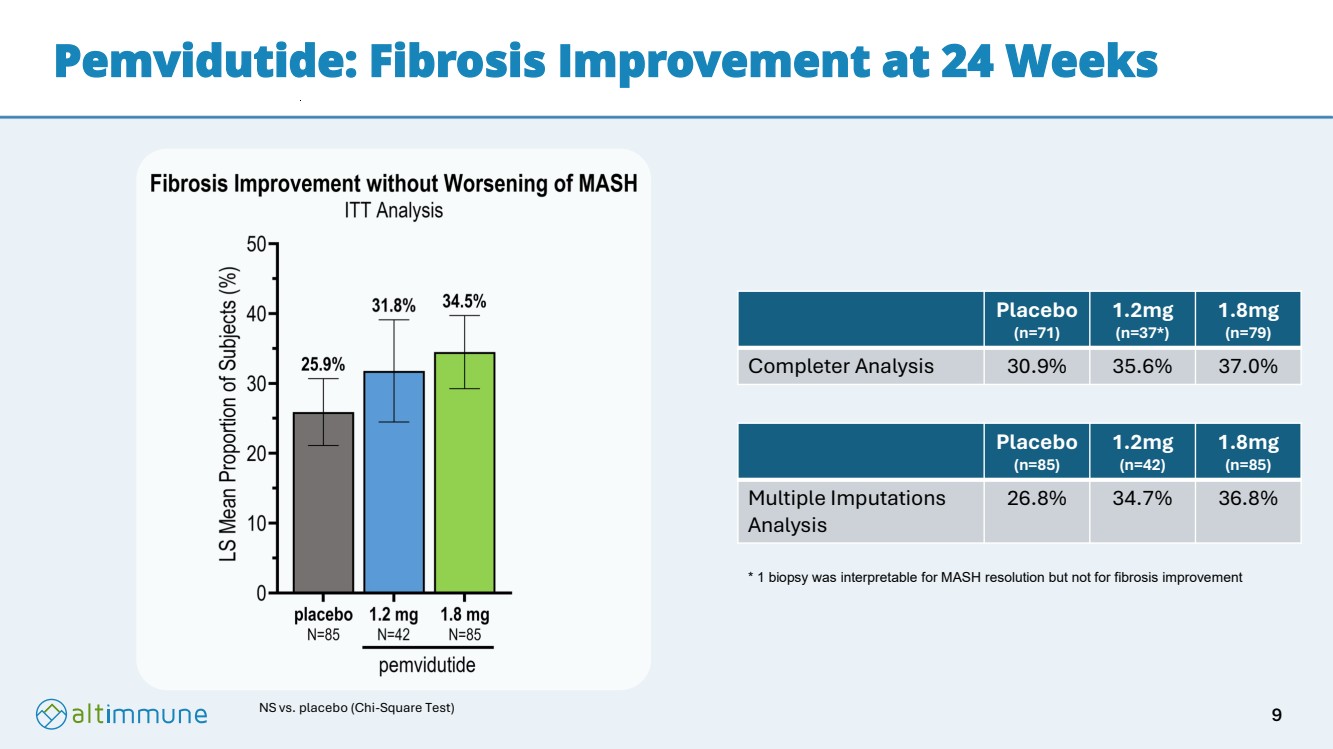
| Pemvidutide: Fibrosis Improvement at 24 Weeks NS vs. placebo (Chi-Square Test) Placebo (n=71) 1.2mg (n=37*) 1.8mg (n=79) Completer Analysis 30.9% 35.6% 37.0% Placebo (n=85) 1.2mg (n=42) 1.8mg (n=85) Multiple Imputations Analysis 26.8% 34.7% 36.8% * 1 biopsy was interpretable for MASH resolution but not for fibrosis improvement 9 |
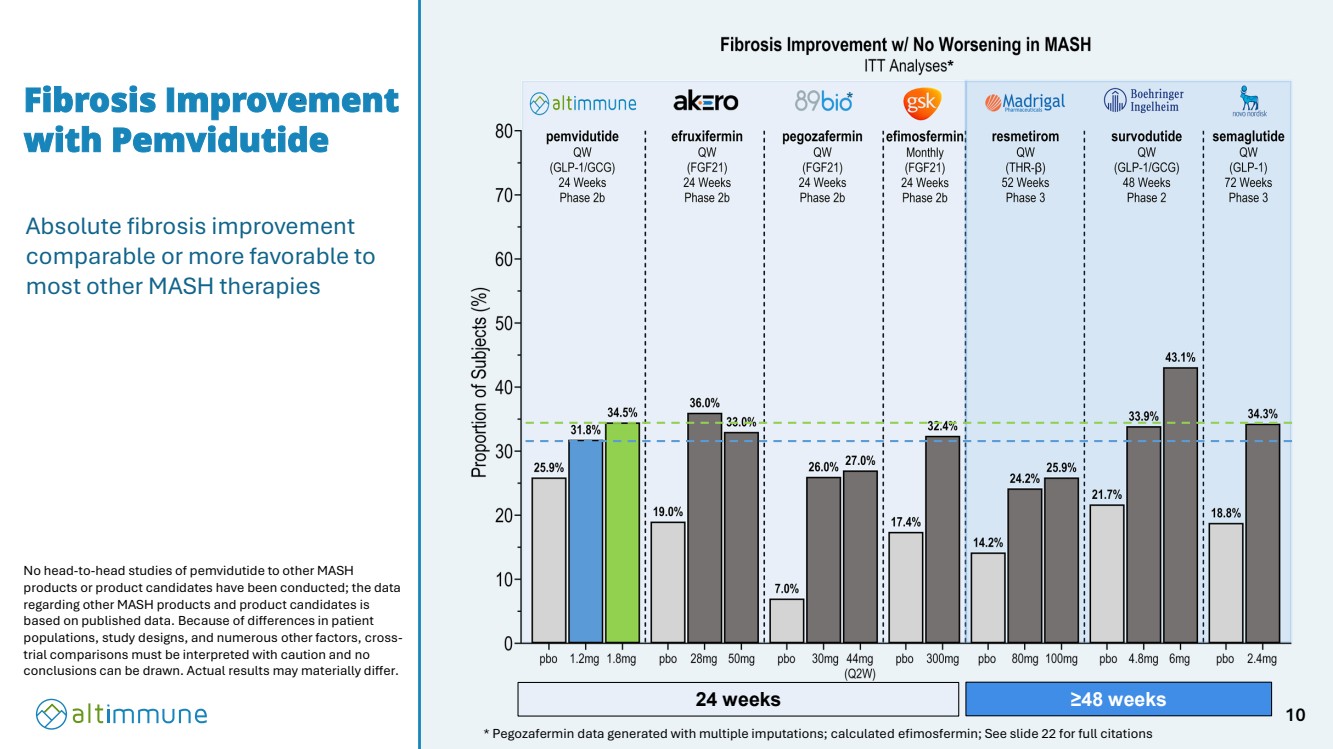
| Fibrosis Improvement with Pemvidutide * * Pegozafermin data generated with multiple imputations; calculated efimosfermin; See slide 22 for full citations No head-to-head studies of pemvidutide to other MASH products or product candidates have been conducted; the data regarding other MASH products and product candidates is based on published data. Because of differences in patient populations, study designs, and numerous other factors, cross-trial comparisons must be interpreted with caution and no conclusions can be drawn. Actual results may materially differ. 24 weeks ≥48 weeks Absolute fibrosis improvement comparable or more favorable to most other MASH therapies * 10 |
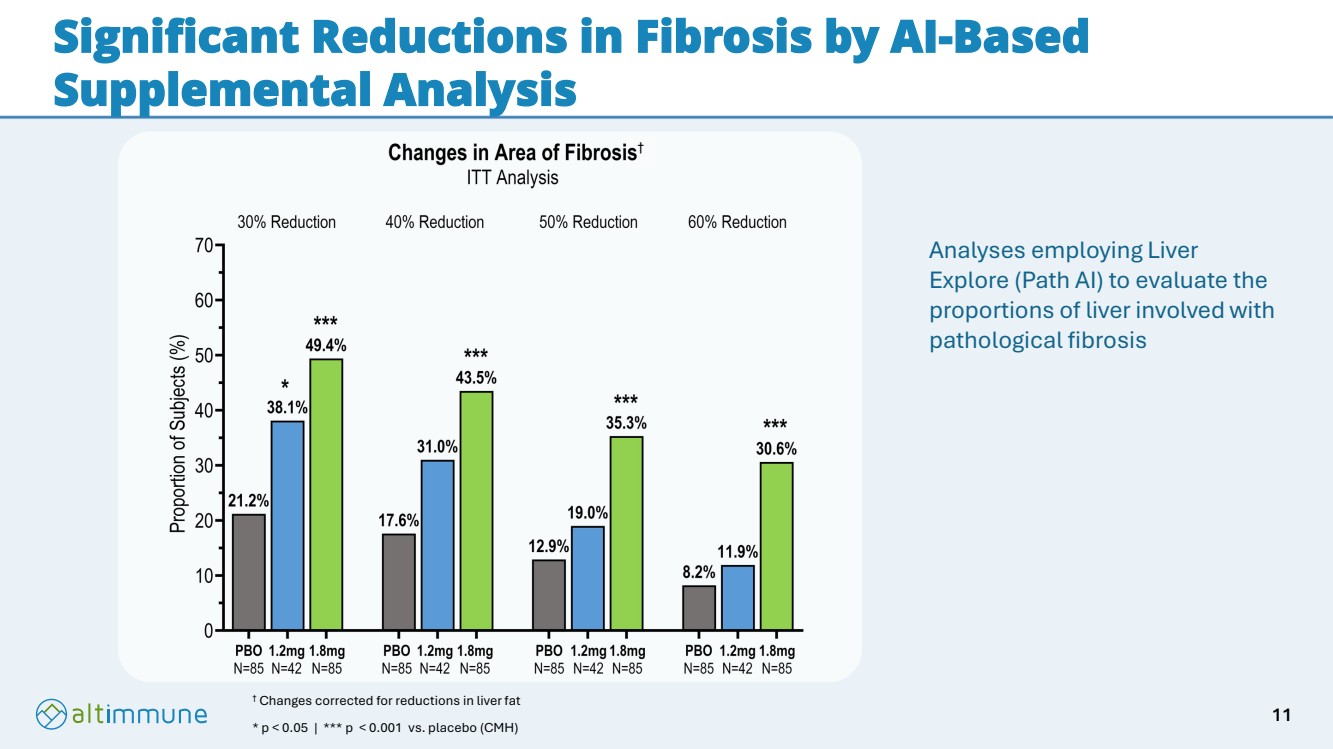
| Significant Reductions in Fibrosis by AI-Based Supplemental Analysis † Changes corrected for reductions in liver fat * p < 0.05 | *** p < 0.001 vs. placebo (CMH) † Analyses employing Liver Explore (Path AI) to evaluate the proportions of liver involved with pathological fibrosis 11 |
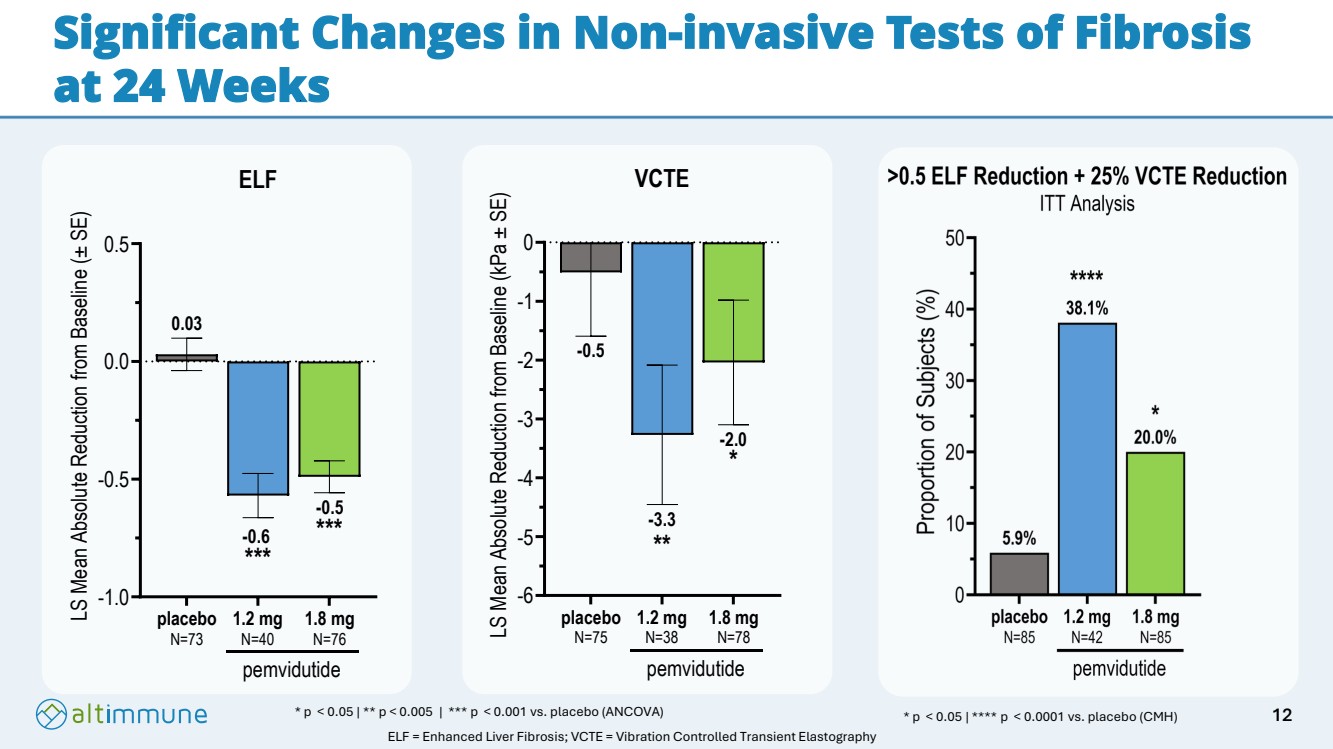
| Significant Changes in Non-invasive Tests of Fibrosis at 24 Weeks * p < 0.05 | ** p < 0.005 | *** p < 0.001 vs. placebo (ANCOVA) -1.0 -0.5 0.0 0.5 ELF LS Mean Absolute Reduction from Baseline (± SE) placebo N=73 1.2 mg N=40 1.8 mg N=76 pemvidutide *** *** 0.03 -0.6 -0.5 -6 -5 -4 -3 -2 -1 0 -2.0 -3.3 -0.5 VCTE LS Mean Absolute Reduction from Baseline (kPa ± SE) placebo N=75 1.2 mg N=38 1.8 mg N=78 pemvidutide * ** * p < 0.05 | **** p < 0.0001 vs. placebo (CMH) ELF = Enhanced Liver Fibrosis; VCTE = Vibration Controlled Transient Elastography 12 |
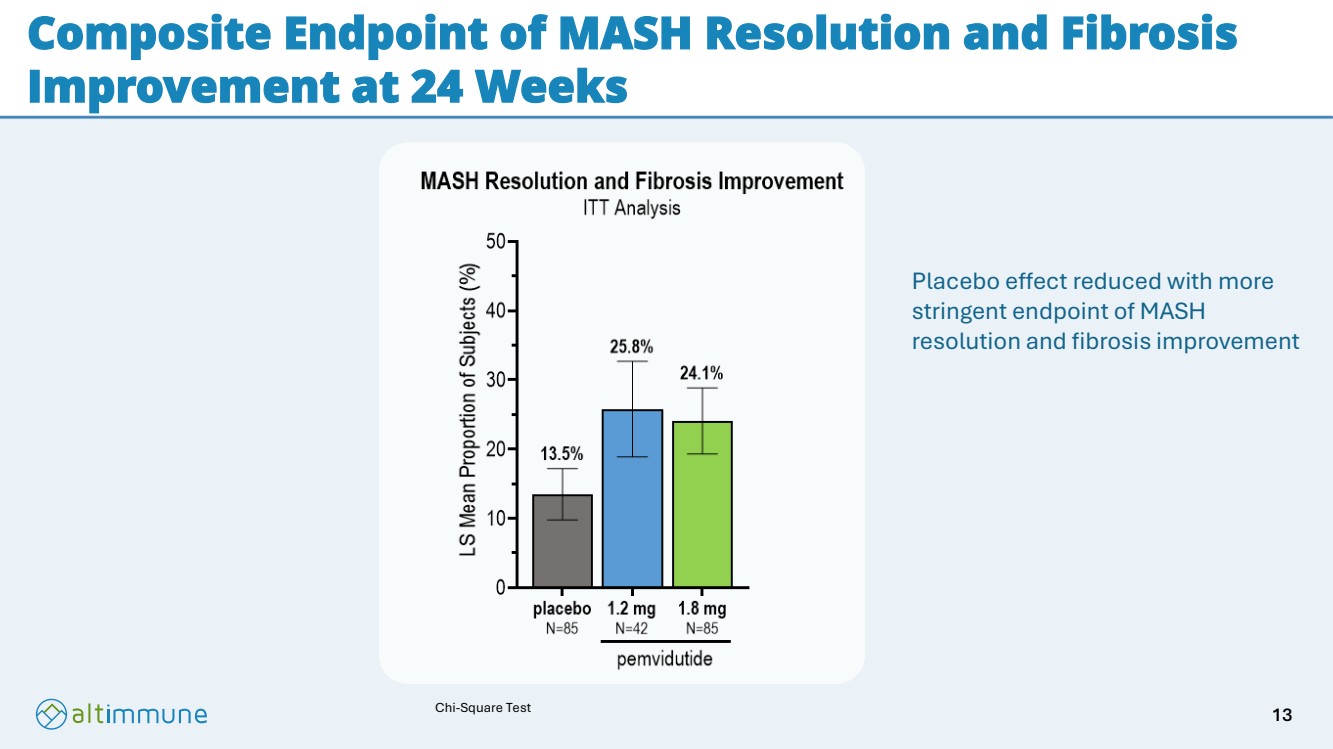
| Composite Endpoint of MASH Resolution and Fibrosis Improvement at 24 Weeks Chi-Square Test Placebo effect reduced with more stringent endpoint of MASH resolution and fibrosis improvement 13 |
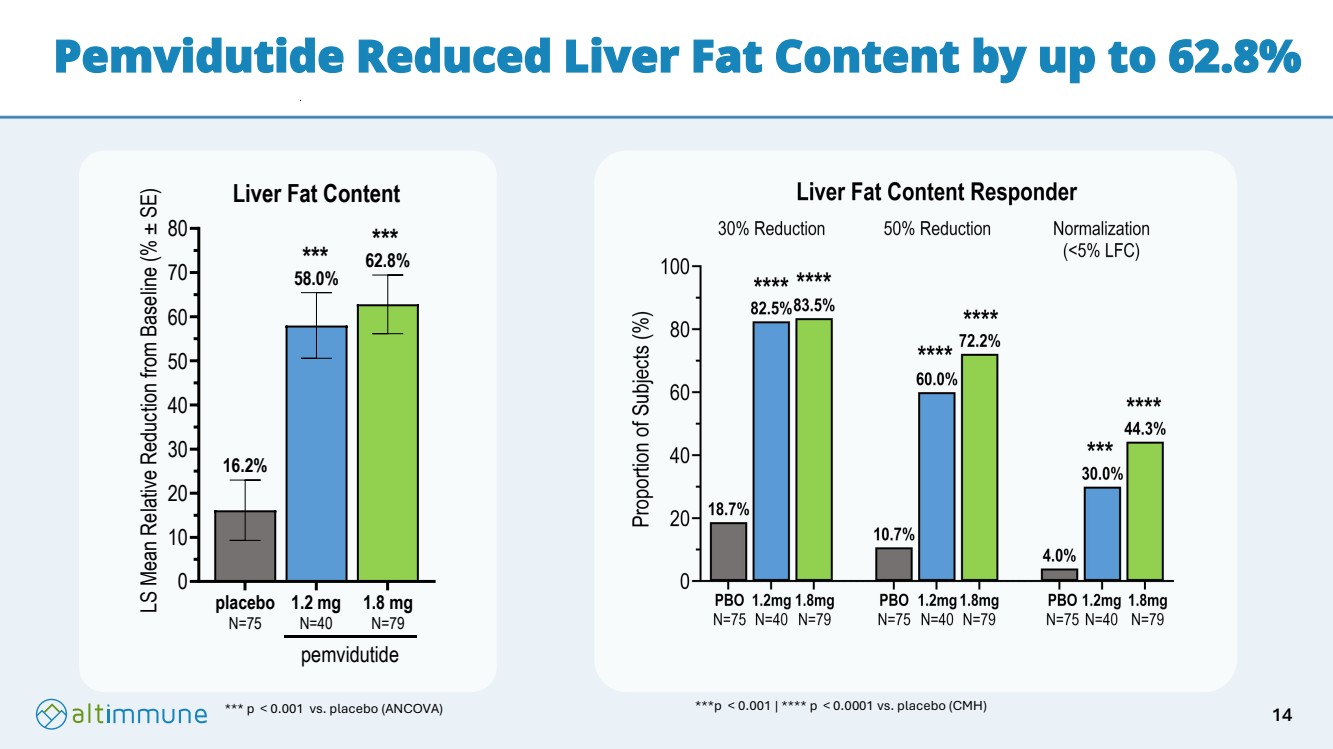
| Pemvidutide Reduced Liver Fat Content by up to 62.8% *** p < 0.001 vs. placebo (ANCOVA) 0 10 20 30 40 50 60 70 80 62.8% 58.0% 16.2% Liver Fat Content LS Mean Relative Reduction from Baseline (% ± SE) placebo N=75 1.2 mg N=40 1.8 mg N=79 pemvidutide *** *** ***p < 0.001 | **** p < 0.0001 vs. placebo (CMH) 14 |
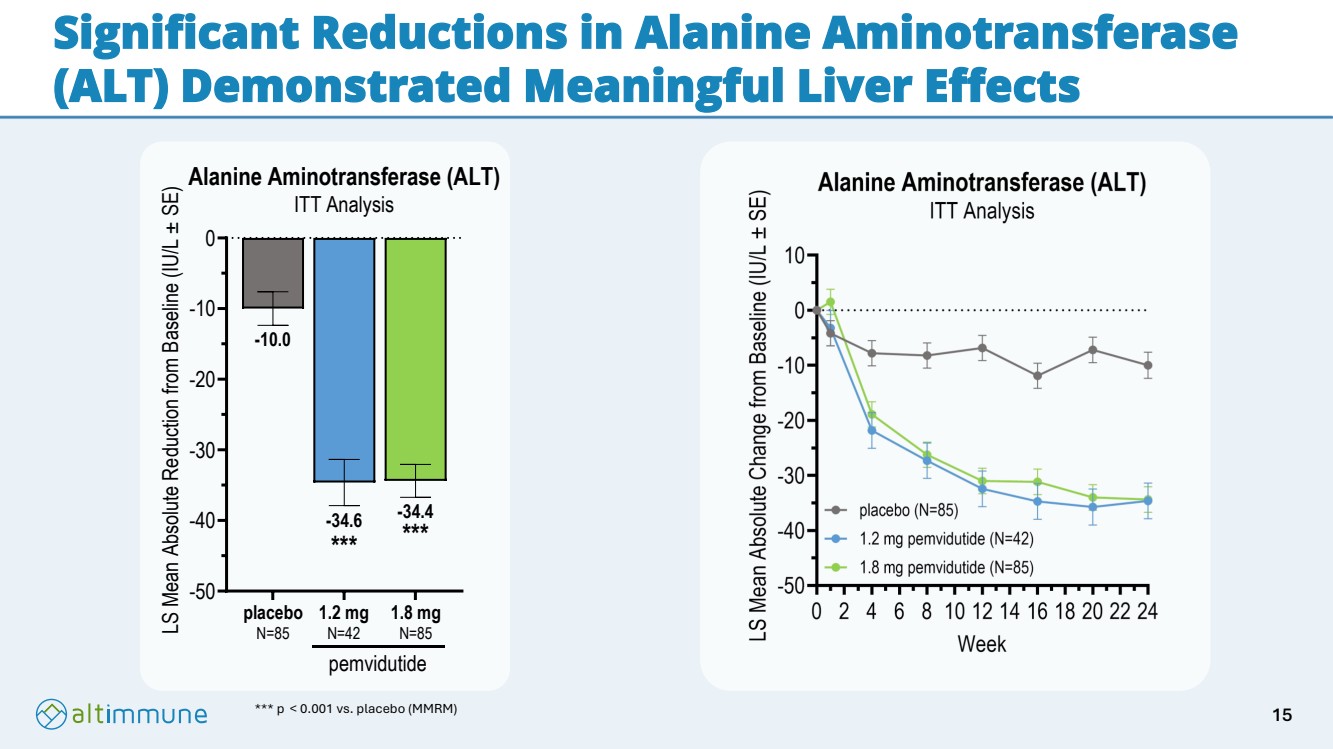
| Significant Reductions in Alanine Aminotransferase (ALT) Demonstrated Meaningful Liver Effects *** p < 0.001 vs. placebo (MMRM) -50 -40 -30 -20 -10 0 -34.4 -34.6 -10.0 Alanine Aminotransferase (ALT) ITT Analysis LS Mean Absolute Reduction from Baseline (IU/L ± SE) placebo N=85 1.2 mg N=42 1.8 mg N=85 pemvidutide *** *** 15 |
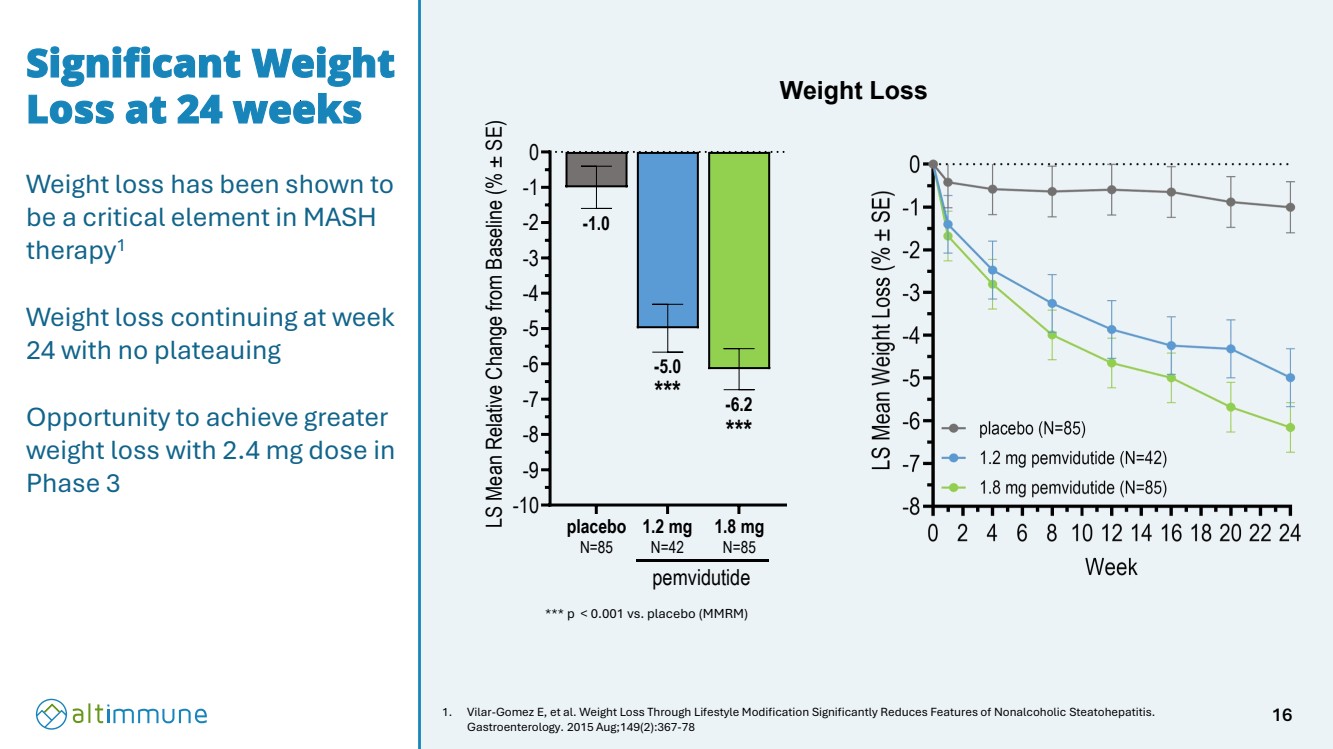
| Significant Weight Loss at 24 weeks Weight loss has been shown to be a critical element in MASH therapy1 Weight loss continuing at week 24 with no plateauing Opportunity to achieve greater weight loss with 2.4 mg dose in Phase 3 1. Vilar-Gomez E, et al. Weight Loss Through Lifestyle Modification Significantly Reduces Features of Nonalcoholic Steatohepatitis. Gastroenterology. 2015 Aug;149(2):367-78 *** p < 0.001 vs. placebo (MMRM) Weight Loss -10 -9 -8 -7 -6 -5 -4 -3 -2 -1 0 -6.2 -5.0 -1.0 LS Mean Relative Change from Baseline (% ± SE) placebo N=85 1.2 mg N=42 1.8 mg N=85 pemvidutide *** *** 16 |
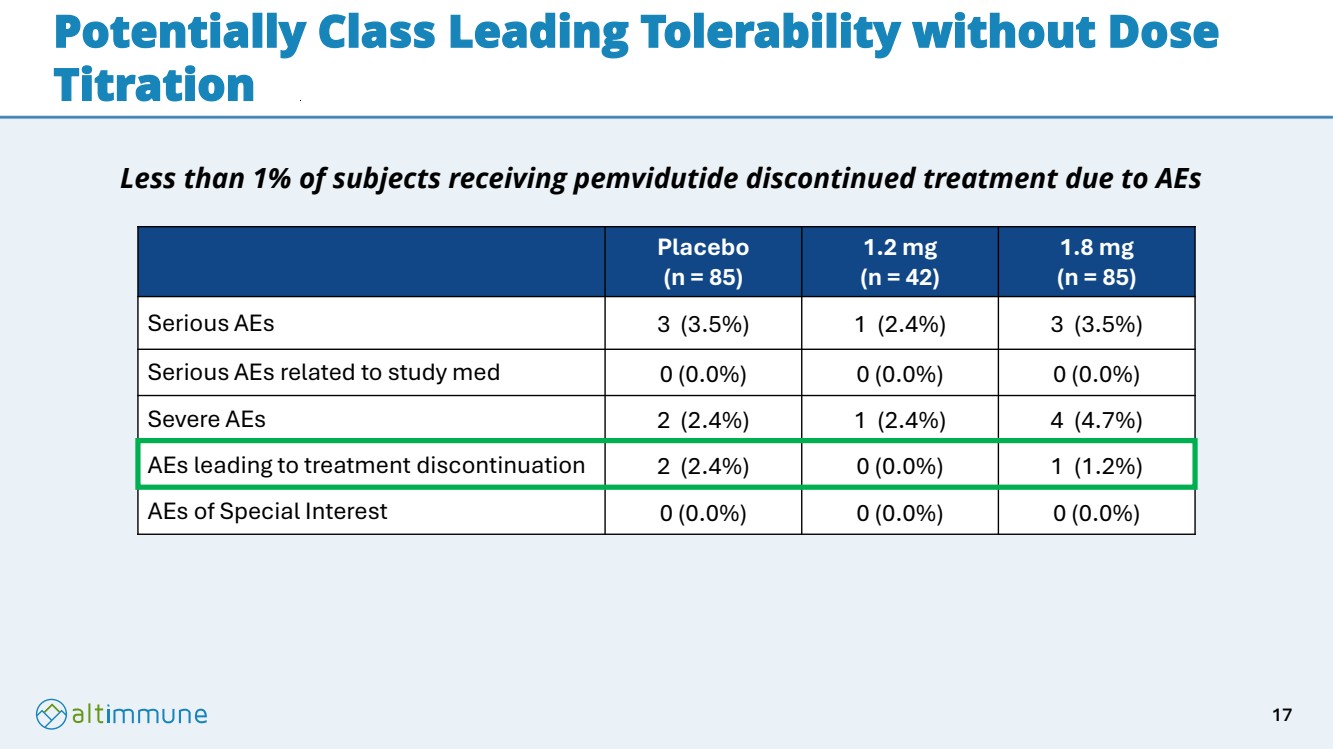
| Potentially Class Leading Tolerability without Dose Titration Placebo (n = 85) 1.2 mg (n = 42) 1.8 mg (n = 85) Serious AEs 3 (3.5%) 1 (2.4%) 3 (3.5%) Serious AEs related to study med 0 (0.0%) 0 (0.0%) 0 (0.0%) Severe AEs 2 (2.4%) 1 (2.4%) 4 (4.7%) AEs leading to treatment discontinuation 2 (2.4%) 0 (0.0%) 1 (1.2%) AEs of Special Interest 0 (0.0%) 0 (0.0%) 0 (0.0%) Less than 1% of subjects receiving pemvidutide discontinued treatment due to AEs 17 |
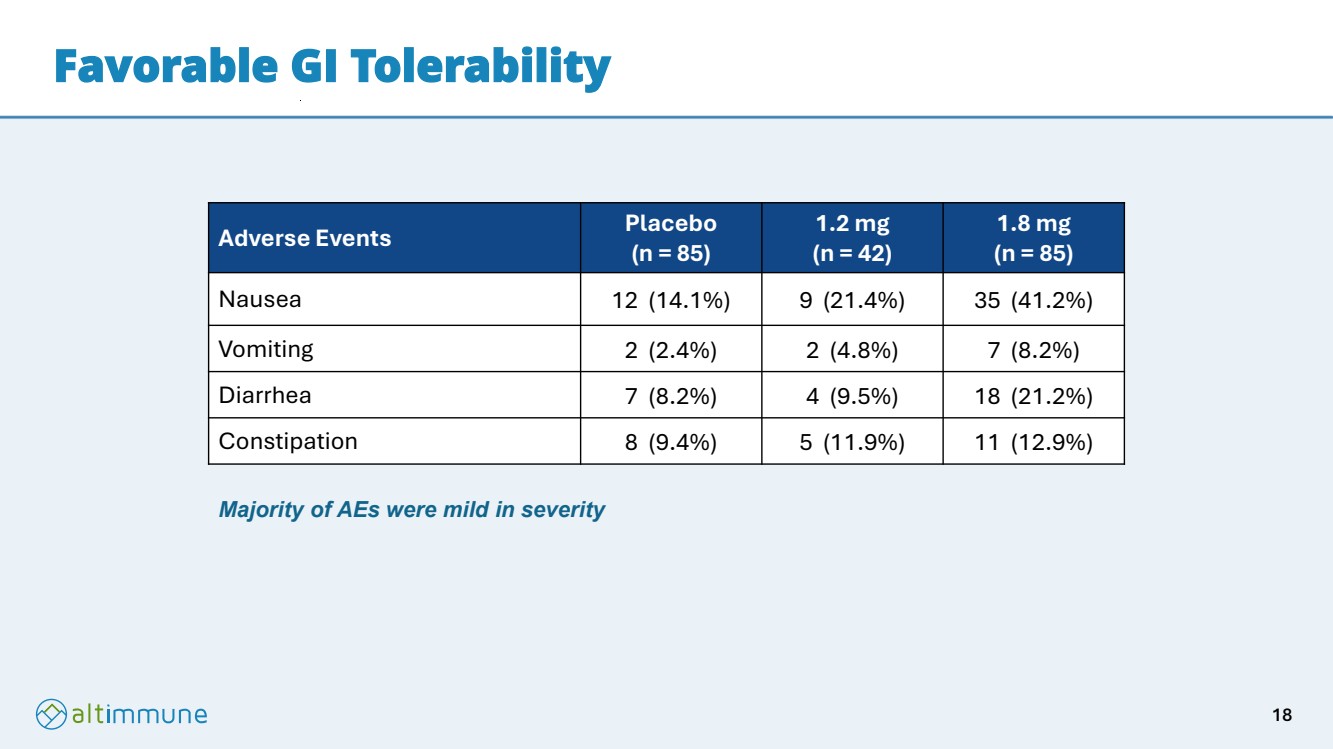
| Favorable GI Tolerability Adverse Events Placebo (n = 85) 1.2 mg (n = 42) 1.8 mg (n = 85) Nausea 12 (14.1%) 9 (21.4%) 35 (41.2%) Vomiting 2 (2.4%) 2 (4.8%) 7 (8.2%) Diarrhea 7 (8.2%) 4 (9.5%) 18 (21.2%) Constipation 8 (9.4%) 5 (11.9%) 11 (12.9%) Majority of AEs were mild in severity 18 |
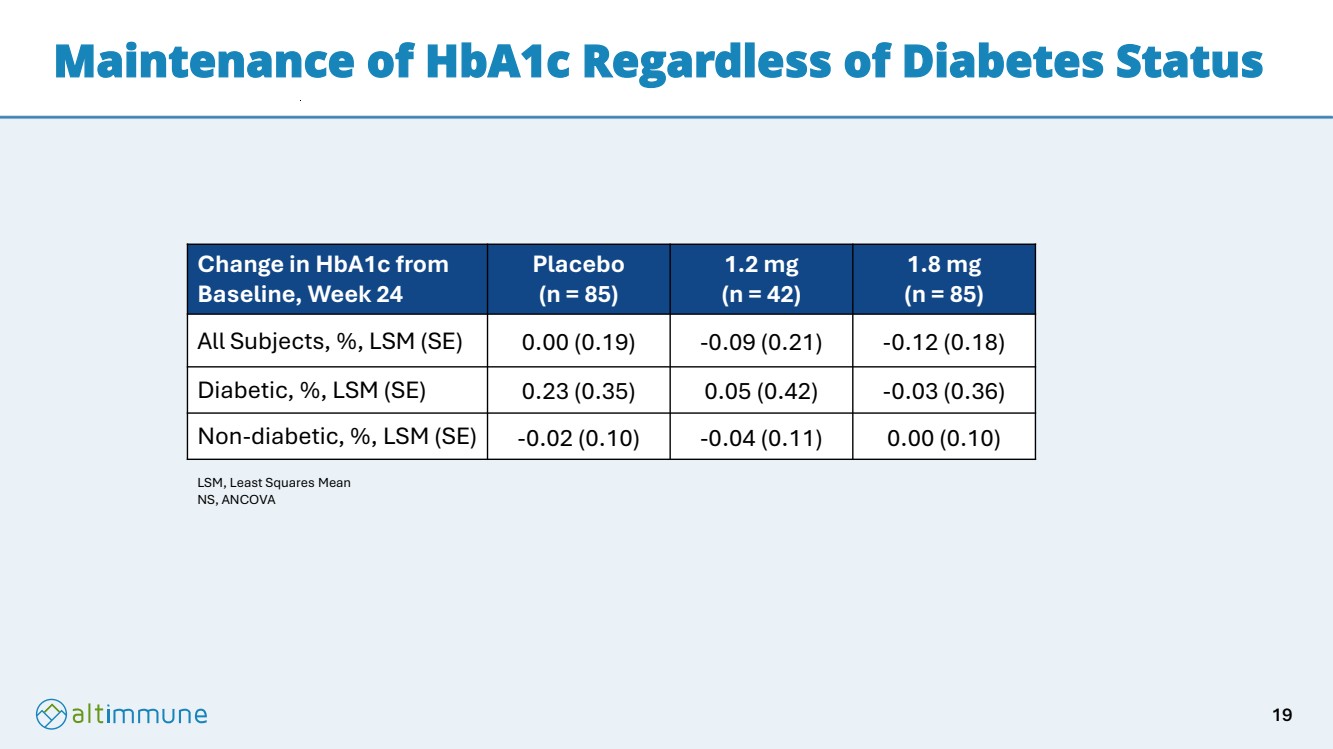
| Maintenance of HbA1c Regardless of Diabetes Status Change in HbA1c from Baseline, Week 24 Placebo (n = 85) 1.2 mg (n = 42) 1.8 mg (n = 85) All Subjects, %, LSM (SE) 0.00 (0.19) -0.09 (0.21) -0.12 (0.18) Diabetic, %, LSM (SE) 0.23 (0.35) 0.05 (0.42) -0.03 (0.36) Non-diabetic, %, LSM (SE) -0.02 (0.10) -0.04 (0.11) 0.00 (0.10) LSM, Least Squares Mean NS, ANCOVA 19 |
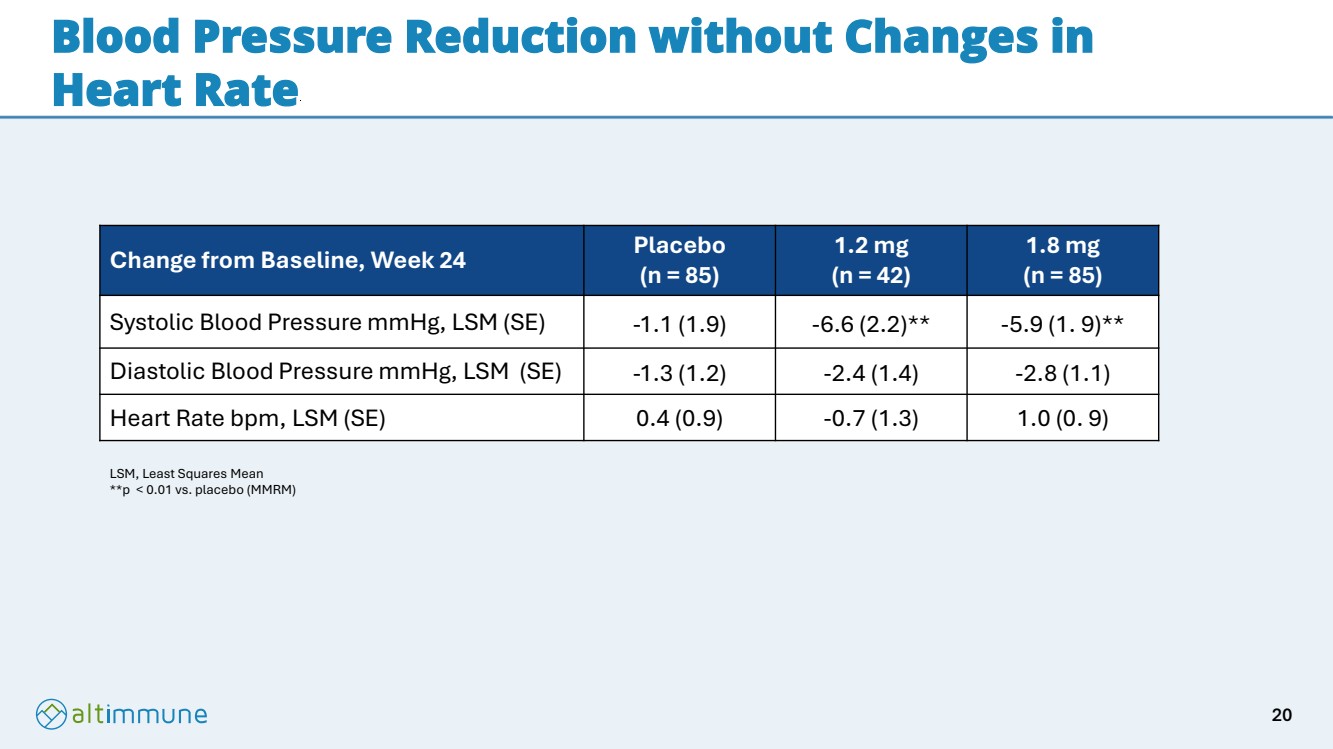
| Blood Pressure Reduction without Changes in Heart Rate Change from Baseline, Week 24 Placebo (n = 85) 1.2 mg (n = 42) 1.8 mg (n = 85) Systolic Blood Pressure mmHg, LSM (SE) -1.1 (1.9) -6.6 (2.2)** -5.9 (1. 9)** Diastolic Blood Pressure mmHg, LSM (SE) -1.3 (1.2) -2.4 (1.4) -2.8 (1.1) Heart Rate bpm, LSM (SE) 0.4 (0.9) -0.7 (1.3) 1.0 (0. 9) LSM, Least Squares Mean **p < 0.01 vs. placebo (MMRM) 20 |
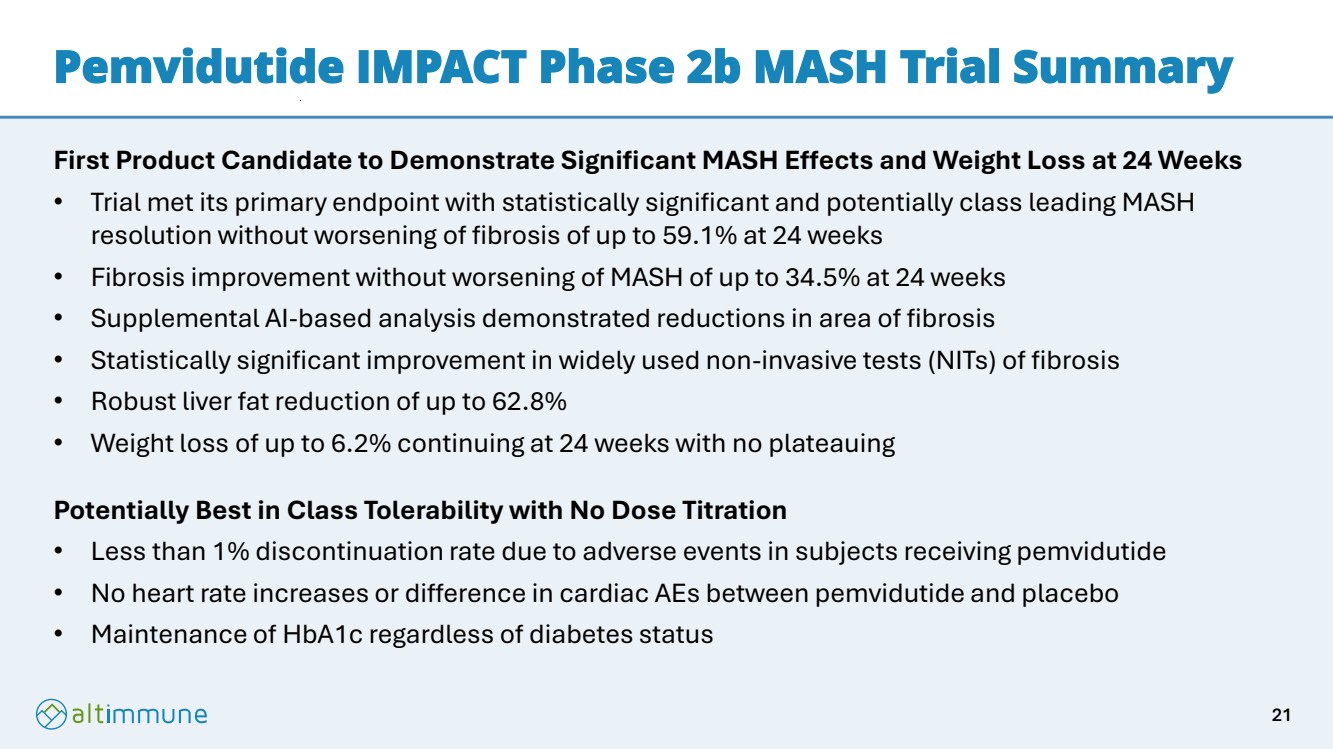
| Pemvidutide IMPACT Phase 2b MASH Trial Summary First Product Candidate to Demonstrate Significant MASH Effects and Weight Loss at 24 Weeks • Trial met its primary endpoint with statistically significant and potentially class leading MASH resolution without worsening of fibrosis of up to 59.1% at 24 weeks • Fibrosis improvement without worsening of MASH of up to 34.5% at 24 weeks • Supplemental AI-based analysis demonstrated reductions in area of fibrosis • Statistically significant improvement in widely used non-invasive tests (NITs) of fibrosis • Robust liver fat reduction of up to 62.8% • Weight loss of up to 6.2% continuing at 24 weeks with no plateauing Potentially Best in Class Tolerability with No Dose Titration • Less than 1% discontinuation rate due to adverse events in subjects receiving pemvidutide • No heart rate increases or difference in cardiac AEs between pemvidutide and placebo • Maintenance of HbA1c regardless of diabetes status 21 |
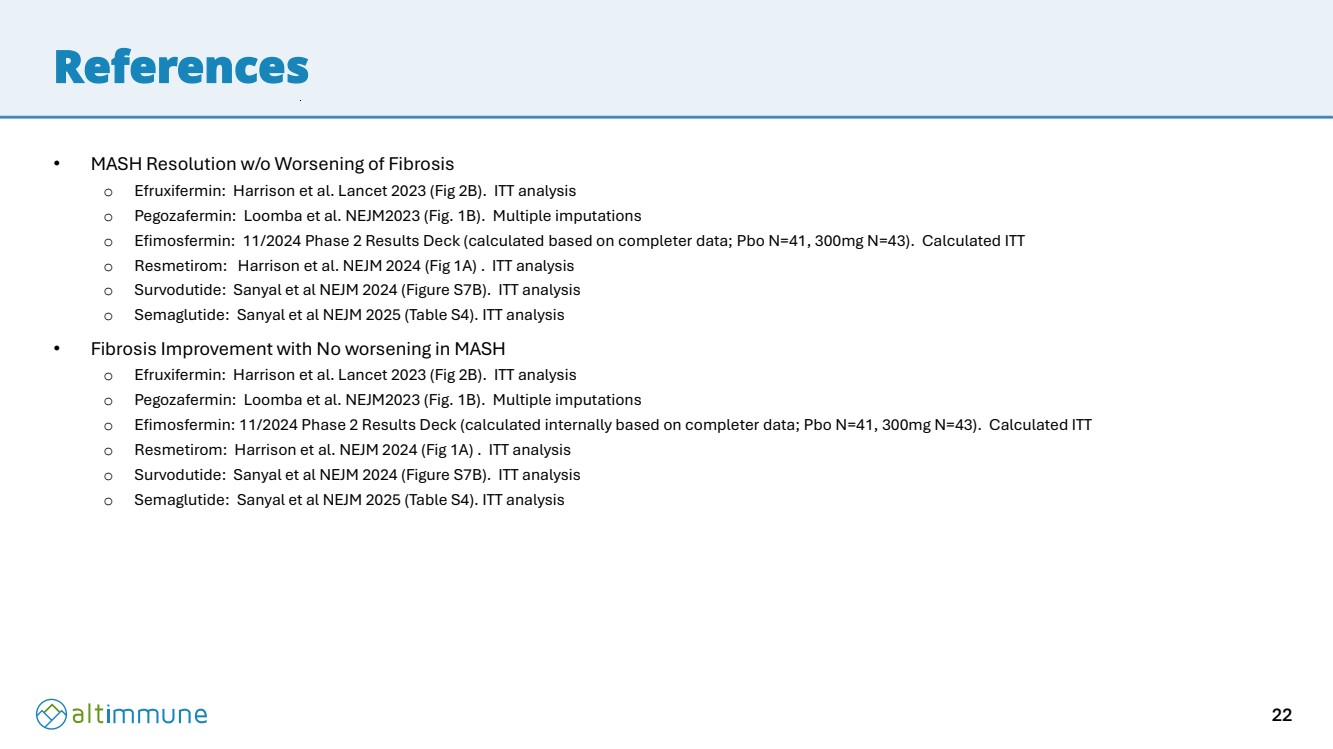
| References • MASH Resolution w/o Worsening of Fibrosis o Efruxifermin: Harrison et al. Lancet 2023 (Fig 2B). ITT analysis o Pegozafermin: Loomba et al. NEJM2023 (Fig. 1B). Multiple imputations o Efimosfermin: 11/2024 Phase 2 Results Deck (calculated based on completer data; Pbo N=41, 300mg N=43). Calculated ITT o Resmetirom: Harrison et al. NEJM 2024 (Fig 1A) . ITT analysis o Survodutide: Sanyal et al NEJM 2024 (Figure S7B). ITT analysis o Semaglutide: Sanyal et al NEJM 2025 (Table S4). ITT analysis • Fibrosis Improvement with No worsening in MASH o Efruxifermin: Harrison et al. Lancet 2023 (Fig 2B). ITT analysis o Pegozafermin: Loomba et al. NEJM2023 (Fig. 1B). Multiple imputations o Efimosfermin: 11/2024 Phase 2 Results Deck (calculated internally based on completer data; Pbo N=41, 300mg N=43). Calculated ITT o Resmetirom: Harrison et al. NEJM 2024 (Fig 1A) . ITT analysis o Survodutide: Sanyal et al NEJM 2024 (Figure S7B). ITT analysis o Semaglutide: Sanyal et al NEJM 2025 (Table S4). ITT analysis 22 |
| Thank you 23 |