On May 7, 2025, the shareholders of the Predecessor Fund, approved an Agreement and Plan of Reorganization (the “Plan”) by and between Managed Portfolio Series, on behalf of the Predecessor Fund, and Tortoise Capital Series Trust (the “Trust”), on behalf of the Fund, pursuant to which the Predecessor Fund would be reorganized by transferring all of the assets of the Predecessor Fund to the Fund, a newly formed actively-managed exchange-traded fund organized as a separate series of the Trust. As a result of the Reorganization, the Fund has assumed the performance history of the Predecessor Fund. The Predecessor Fund is the accounting successor to the Advisory Research MLP & Energy Income Fund (the “Energy Infrastructure and Income Predecessor Fund”). Accordingly, the performance shown in the bar chart and performance table for periods prior to November 15, 2019, represents the performance of the Energy Infrastructure and Income Predecessor Fund.
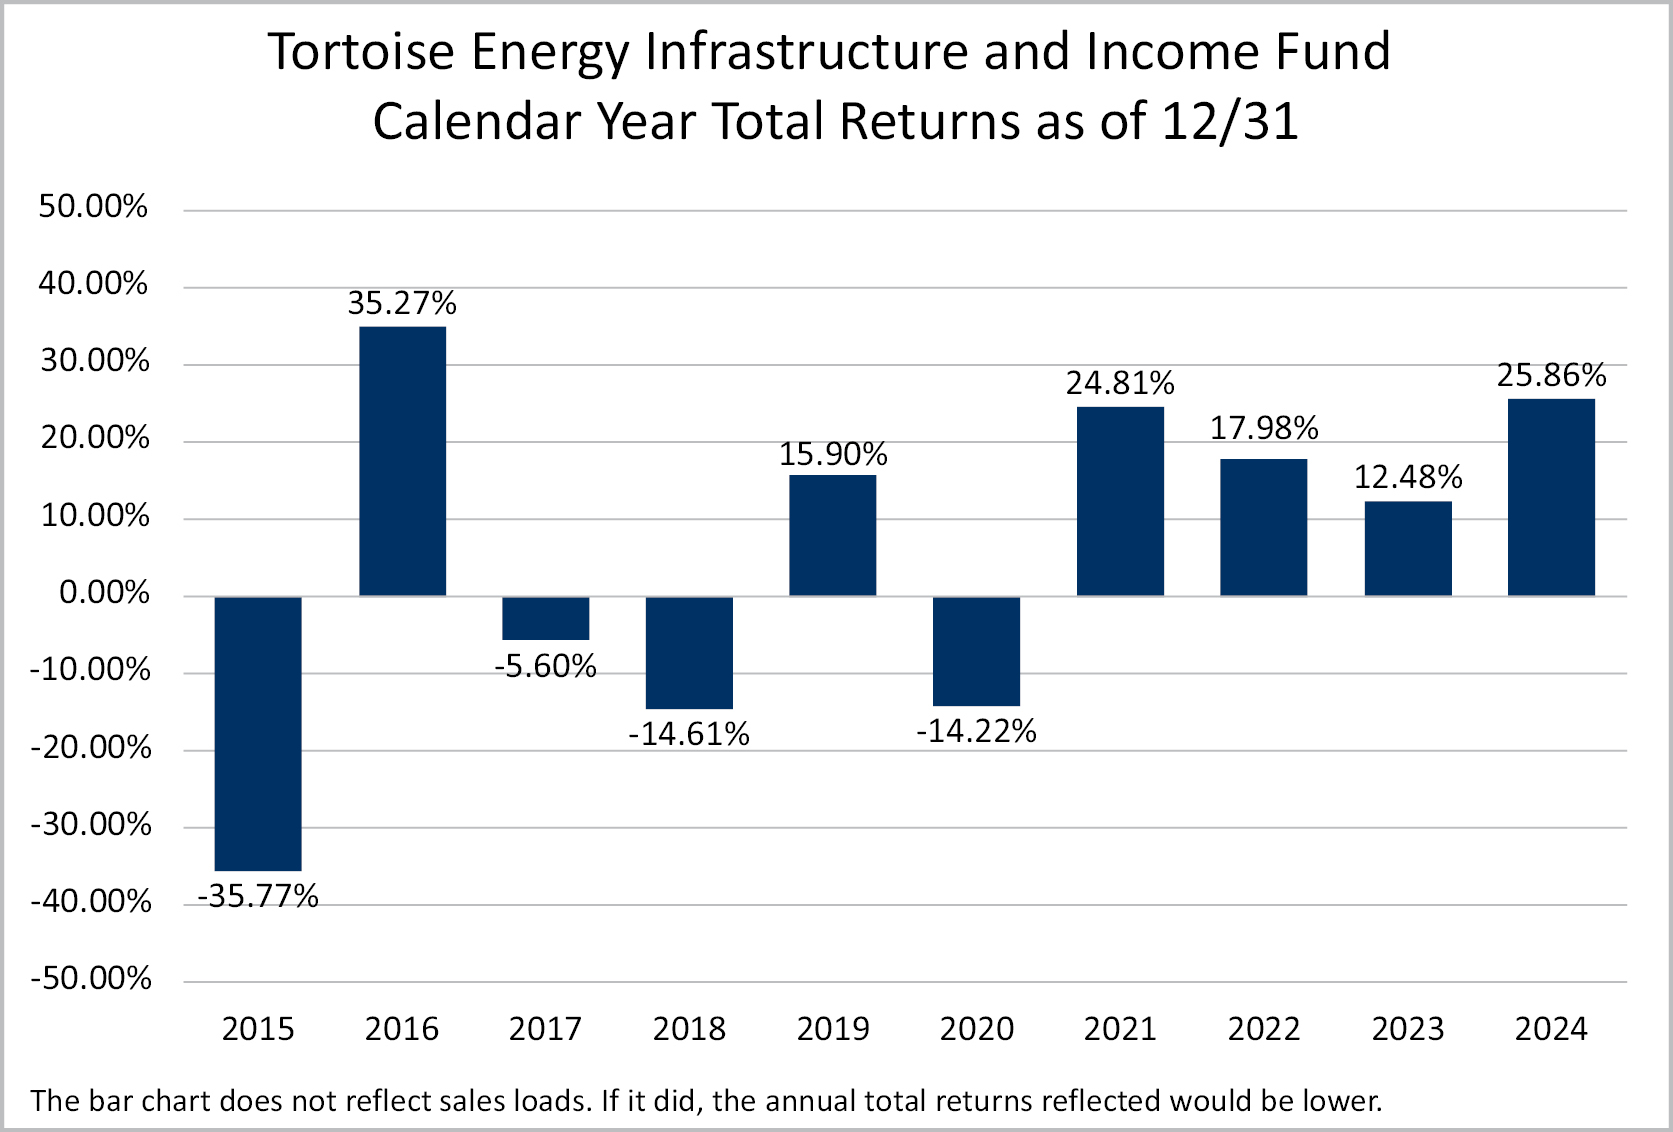
The accompanying bar chart and table provide some indication of the risks of investing in the Predecessor Fund. The bar chart shows the changes in the Predecessor Fund’s annual total returns from year to year. Following the bar chart is the Predecessor Fund’s highest and lowest quarterly returns during the periods shown in the bar chart. The table illustrates how the Predecessor Fund’s average annual returns for the 1-year, 5-year, 10-year and since-inception periods compare with those of a broad measure of market performance. The Predecessor Fund’s past performance, before and after taxes, does not necessarily indicate how the Fund will perform in the future. The Fund adopted the financial statements and the performance history of the Predecessor Fund.
Updated information on the Fund’s results can be obtained by visiting www.tortoisecapital.com or by calling toll-free at (855) 822-3863.
(1) Predecessor Fund’s calendar year-to-date total return based on net asset value for the period 1/1/25 to 3/31/25 was 5.59%.
During the periods shown in the chart above:
| Best Quarter | Worst Quarter | |||||
| 34.09% | June 30, 2020 | -43.64% | March 31, 2020 | |||
| Average Annual Total Returns for the Periods | 1 Year | 5 Years | 10 Years | ||||||
| Return Before Taxes (No Load) | 25.86 | % | 12.33 | % | 3.80 | % | |||
| Return After Taxes on Distributions (No Load) | 25.28 | % | 11.84 | % | 3.16 | % | |||
| Return After Taxes on Distributions and Sale of Fund Shares (No Load) | 15.63 | % | 9.71 | % | 2.71 | % | |||
| Index Performance |
|
|
| ||||||
| Alerian MLP Index (reflects no deduction for fees, expenses or taxes)(2) | 24.41 | % | 15.56 | % | 3.67 | % | |||
| S&P 500® Index (reflects no deduction for fees, expenses or taxes) | 25.02 | % | 14.53 | % | 13.10 | % | |||
(1) Institutional Class shares of the Predecessor Fund commenced operations on December 27, 2010.
(2) The Alerian MLP Index is a composite of energy Master Limited Partnerships.
After-tax returns in the above table are calculated using the historical highest individual federal marginal income tax rates and do not reflect the impact of state and local taxes. Actual after-tax returns depend on an investor’s tax situation and may differ from those shown, and after-tax returns shown are not relevant to investors who hold Shares through tax-advantaged arrangements, such as 401(k) plans or individual retirement accounts.