Performance Management - BNY Mellon Research Growth Fund, Inc.
|
Feb. 28, 2025 |
| Prospectus [Line Items] |
|
|
| Bar Chart and Performance Table [Heading] |
Performance
|
|
| Performance Narrative [Text Block] |
The
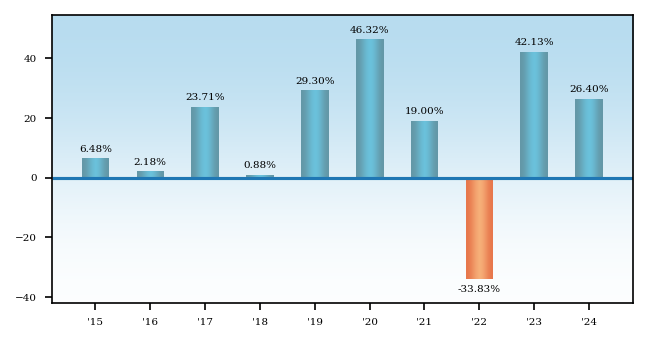
following bar chart and table provide some indication of the risks of investing in the fund. The bar
chart shows changes in the performance of the fund's Class Z shares from year to year. Sales charges,
if any, are not reflected in the bar chart, and, if those charges were included, returns would have been
less than those shown. The table compares the average annual total returns of the fund's shares to those
of the Russell 1000® Index, a broad measure
of relevant market performance, and the Russell 1000®
Growth Index. The fund's past performance (before and after taxes) is not necessarily an indication
of how the fund will perform in the future. Performance for each share class will vary due to differences
in expenses. More recent performance information may be available at www.bny.com/investments.
|
|
| Performance Past Does Not Indicate Future [Text] |
The fund's past performance (before and after taxes) is not necessarily an indication
of how the fund will perform in the future.
|
|
| Bar Chart Does Not Reflect Sales Loads [Text] |
Sales charges,
if any, are not reflected in the bar chart, and, if those charges were included, returns would have been
less than those shown.
|
|
| Bar Chart [Heading] |
Year-by-Year
Total Returns as of 12/31 each year (%)
|
|
| Bar Chart [Table] |
|
|
| Bar Chart Closing [Text Block] |
During the periods shown in the chart:
Best Quarter
2020,
Q2: 31.36
Worst Quarter
2022, Q2: (26.90) The
year-to-date total return of the fund's Class Z shares as of March 31, 2025 was -13.28%.
|
|
| Performance Table Narrative |
After-tax performance is shown only for Class Z shares. After-tax performance
of the fund's other share classes will vary. After-tax returns are calculated using the historical highest
individual federal marginal income tax rates, and do not reflect the impact of state and local taxes.
Actual after-tax returns depend on the investor's tax situation and may differ from those shown, and
the after-tax returns shown are not relevant to investors who hold their shares through U.S. tax-deferred
arrangements such as 401(k) plans or individual retirement accounts.
|
|
| Performance Table Uses Highest Federal Rate |
After-tax returns are calculated using the historical highest
individual federal marginal income tax rates, and do not reflect the impact of state and local taxes.
|
|
| Performance Table Not Relevant to Tax Deferred |
Actual after-tax returns depend on the investor's tax situation and may differ from those shown, and
the after-tax returns shown are not relevant to investors who hold their shares through U.S. tax-deferred
arrangements such as 401(k) plans or individual retirement accounts.
|
|
| Performance [Table] |
Average Annual Total Returns - BNY Mellon Research Growth Fund, Inc.
|
|
12 Months Ended |
60 Months Ended |
120 Months Ended |
Feb. 28, 2025 |
Dec. 31, 2024 |
Dec. 31, 2024 |
Dec. 31, 2024 |
| Russell 1000® Index* reflects no deductions for fees, expenses or taxes | Average Annual Return, Label [Optional Text] |
[1] |
Russell 1000®
Index*
|
|
|
|
| Russell 1000® Index* reflects no deductions for fees, expenses or taxes | Average Annual Return, Percent |
[1] |
|
24.51%
|
14.28%
|
12.87%
|
| Russell 1000® Growth Index reflects no deductions for fees, expenses or taxes | Average Annual Return, Label [Optional Text] |
|
Russell 1000®
Growth Index
|
|
|
|
| Russell 1000® Growth Index reflects no deductions for fees, expenses or taxes | Average Annual Return, Percent |
|
|
33.36%
|
18.96%
|
16.78%
|
| A | Average Annual Return, Label [Optional Text] |
|
returns before taxes
|
|
|
|
| A | Average Annual Return, Percent |
|
|
18.88%
|
14.06%
|
12.88%
|
| C | Average Annual Return, Label [Optional Text] |
|
returns before taxes
|
|
|
|
| C | Average Annual Return, Percent |
|
|
24.21%
|
14.56%
|
12.70%
|
| I | Average Annual Return, Label [Optional Text] |
|
returns before taxes
|
|
|
|
| I | Average Annual Return, Percent |
|
|
26.45%
|
15.72%
|
13.83%
|
| Y | Average Annual Return, Label [Optional Text] |
|
returns before taxes
|
|
|
|
| Y | Average Annual Return, Percent |
|
|
26.49%
|
15.72%
|
13.86%
|
| Z | Average Annual Return, Label [Optional Text] |
|
returns before taxes
|
|
|
|
| Z | Average Annual Return, Percent |
|
|
26.40%
|
15.66%
|
13.77%
|
| Z | After Taxes on Distributions | Average Annual Return, Label [Optional Text] |
|
returns after taxes
on distributions
|
|
|
|
| Z | After Taxes on Distributions | Average Annual Return, Percent |
|
|
25.38%
|
13.32%
|
11.37%
|
| Z | After Taxes on Distributions and Sales | Average Annual Return, Label [Optional Text] |
|
returns after taxes on distributions and
sale of fund shares
|
|
|
|
| Z | After Taxes on Distributions and Sales | Average Annual Return, Percent |
|
|
16.41%
|
12.07%
|
10.64%
|
|
|
| Average Annual Return, Caption [Optional Text] |
Average Annual Total Returns (as of
12/31/24)
|
|
| Performance Table One Class of after Tax Shown [Text] |
After-tax performance is shown only for Class Z shares. After-tax performance
of the fund's other share classes will vary.
|
|
| Index No Deduction for Fees, Expenses, or Taxes [Text] |
reflects no deductions for fees, expenses or taxes
|
[1] |
| Performance Availability Website Address [Text] |
www.bny.com/investments
|
|
| Z |
|
|
| Prospectus [Line Items] |
|
|
| Year to Date Return, Label [Optional Text] |
The
year-to-date total return of the fund's Class Z shares as of
|
|
| Bar Chart, Year to Date Return |
(13.28%)
|
|
| Bar Chart, Year to Date Return, Date |
Mar. 31, 2025
|
|
| Highest Quarterly Return, Label [Optional Text] |
Best Quarter
|
|
| Highest Quarterly Return |
31.36%
|
|
| Highest Quarterly Return, Date |
Jun. 30, 2020
|
|
| Lowest Quarterly Return, Label [Optional Text] |
Worst Quarter
|
|
| Lowest Quarterly Return |
(26.90%)
|
|
| Lowest Quarterly Return, Date |
Jun. 30, 2022
|
|
|
|