Shareholder Report
Apr. 30, 2025
USD ($)
Holding
Shareholder Report |
6 Months Ended |
|---|---|
|
Apr. 30, 2025
USD ($)
Holding
| |
| Shareholder Report [Line Items] | |
| Document Type | N-CSRS |
| Amendment Flag | false |
| Registrant Name | Harbor ETF Trust |
| Entity Central Index Key | 0001860434 |
| Entity Investment Company Type | N-1A |
| Document Period End Date | Apr. 30, 2025 |
| C000252180 | |
| Shareholder Report [Line Items] | |
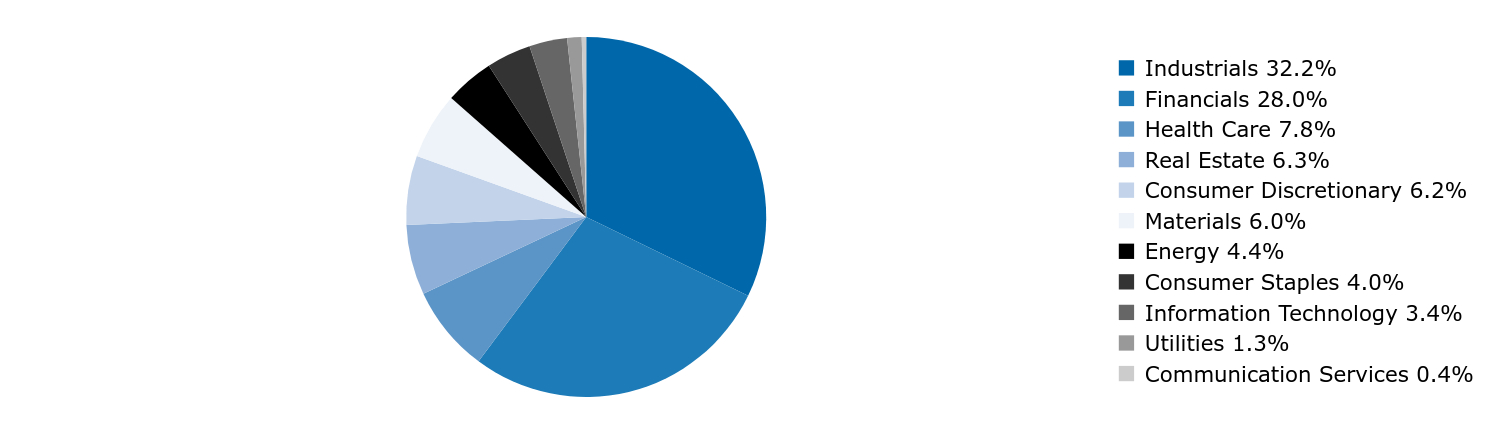
| Fund Name | Harbor Active Small Cap ETF |
| Trading Symbol | Ticker: SMLL |
| Security Exchange Name | NYSEArca |
| Annual or Semi-Annual Statement [Text Block] | This semi-annual shareholder report contains important information about Harbor Active Small Cap ETF ("Fund") for the period of November 1, 2024 to April 30, 2025. |
| Shareholder Report Annual or Semi-Annual | Semi-Annual Shareholder Report |
| Additional Information [Text Block] | You can find additional information about the Fund at www.harborcapital.com/documents/fund. You can also request this information by contacting us at 800-422-1050. |
| Additional Information Phone Number | 800-422-1050 |
| Additional Information Website | <span style="box-sizing: border-box; color: rgb(0, 0, 0); display: inline; flex-wrap: nowrap; font-size: 10.6667px; font-weight: 400; grid-area: auto; line-height: 12.8px; margin: 0px; overflow: visible; text-align: left; white-space-collapse: preserve-breaks;">www.harborcapital.com/documents/fund</span> |
| Expenses [Text Block] | |
| Expenses Paid, Amount | $ 39 |
| Expense Ratio, Percent | 0.80% |
| AssetsNet | $ 14,716,000 |
| Holdings Count | Holding | 49 |
| Advisory Fees Paid, Amount | $ 49,000 |
| InvestmentCompanyPortfolioTurnover | 19.00% |
| Additional Fund Statistics [Text Block] | |
| Holdings [Text Block] | |
| C000252171 | |
| Shareholder Report [Line Items] | |
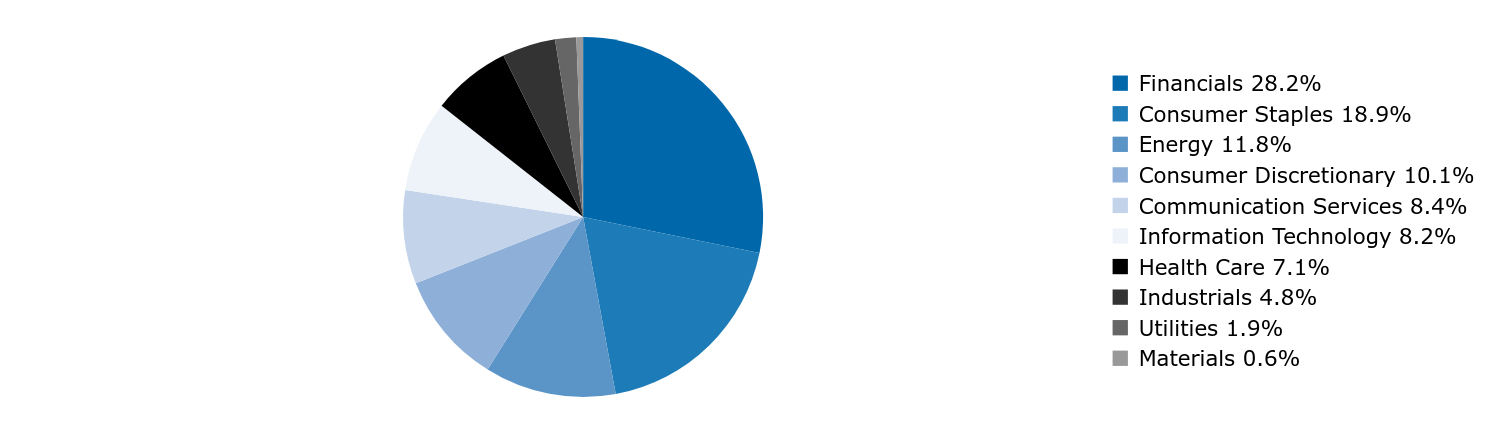
| Fund Name | Harbor AlphaEdge™ Large Cap Value ETF |
| Trading Symbol | Ticker: VLLU |
| Security Exchange Name | NYSEArca |
| Annual or Semi-Annual Statement [Text Block] | This semi-annual shareholder report contains important information about Harbor AlphaEdge™ Large Cap Value ETF ("Fund") for the period of November 1, 2024 to April 30, 2025. |
| Shareholder Report Annual or Semi-Annual | Semi-Annual Shareholder Report |
| Additional Information [Text Block] | You can find additional information about the Fund at www.harborcapital.com/documents/fund. You can also request this information by contacting us at 800-422-1050. |
| Additional Information Phone Number | 800-422-1050 |
| Additional Information Website | <span style="box-sizing: border-box; color: rgb(0, 0, 0); display: inline; flex-wrap: nowrap; font-size: 10.6667px; font-weight: 400; grid-area: auto; line-height: 12.8px; margin: 0px; overflow: visible; text-align: left; white-space-collapse: preserve-breaks;">www.harborcapital.com/documents/fund</span> |
| Expenses [Text Block] | |
| Expenses Paid, Amount | $ 12 |
| Expense Ratio, Percent | 0.25% |
| AssetsNet | $ 2,014,000 |
| Holdings Count | Holding | 73 |
| Advisory Fees Paid, Amount | $ 3,000 |
| InvestmentCompanyPortfolioTurnover | 46.00% |
| Additional Fund Statistics [Text Block] | |
| Holdings [Text Block] | |
| C000252172 | |
| Shareholder Report [Line Items] | |
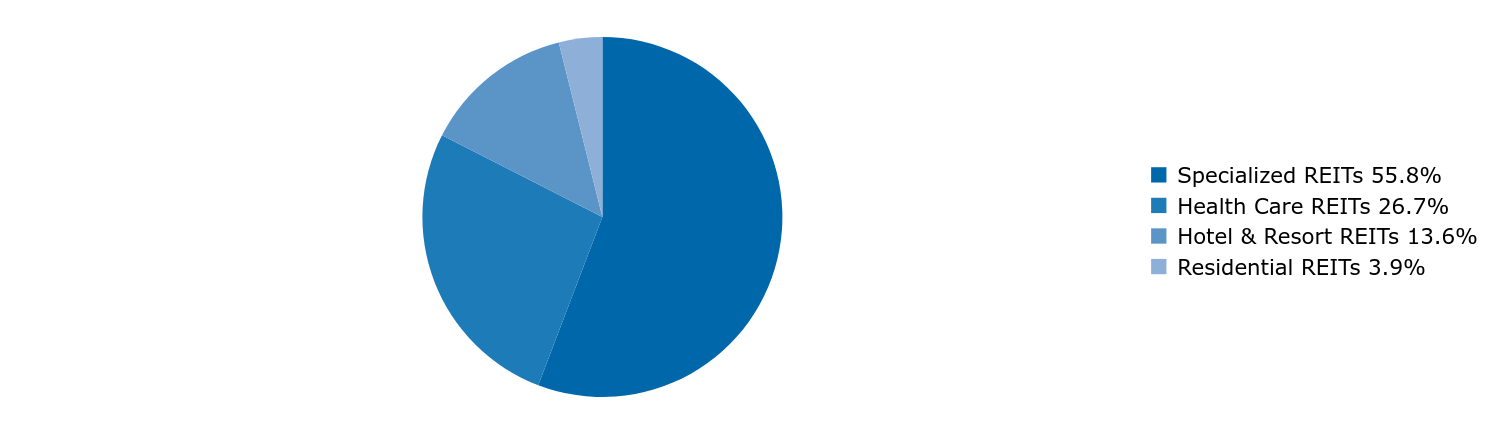
| Fund Name | Harbor AlphaEdge™ Next Generation REITs ETF |
| Trading Symbol | Ticker: AREA |
| Security Exchange Name | NYSEArca |
| Annual or Semi-Annual Statement [Text Block] | This semi-annual shareholder report contains important information about Harbor AlphaEdge™ Next Generation REITs ETF ("Fund") for the period of November 1, 2024 to April 30, 2025. |
| Shareholder Report Annual or Semi-Annual | Semi-Annual Shareholder Report |
| Additional Information [Text Block] | You can find additional information about the Fund at www.harborcapital.com/documents/fund. You can also request this information by contacting us at 800-422-1050. |
| Additional Information Phone Number | 800-422-1050 |
| Additional Information Website | <span style="box-sizing: border-box; color: rgb(0, 0, 0); display: inline; flex-wrap: nowrap; font-size: 10.6667px; font-weight: 400; grid-area: auto; line-height: 12.8px; margin: 0px; overflow: visible; text-align: left; white-space-collapse: preserve-breaks;">www.harborcapital.com/documents/fund</span> |
| Expenses [Text Block] | |
| Expenses Paid, Amount | $ 24 |
| Expense Ratio, Percent | 0.50% |
| AssetsNet | $ 1,806,000 |
| Holdings Count | Holding | 41 |
| Advisory Fees Paid, Amount | $ 5,000 |
| InvestmentCompanyPortfolioTurnover | 30.00% |
| Additional Fund Statistics [Text Block] | |
| Holdings [Text Block] | |
| C000250794 | |
| Shareholder Report [Line Items] | |
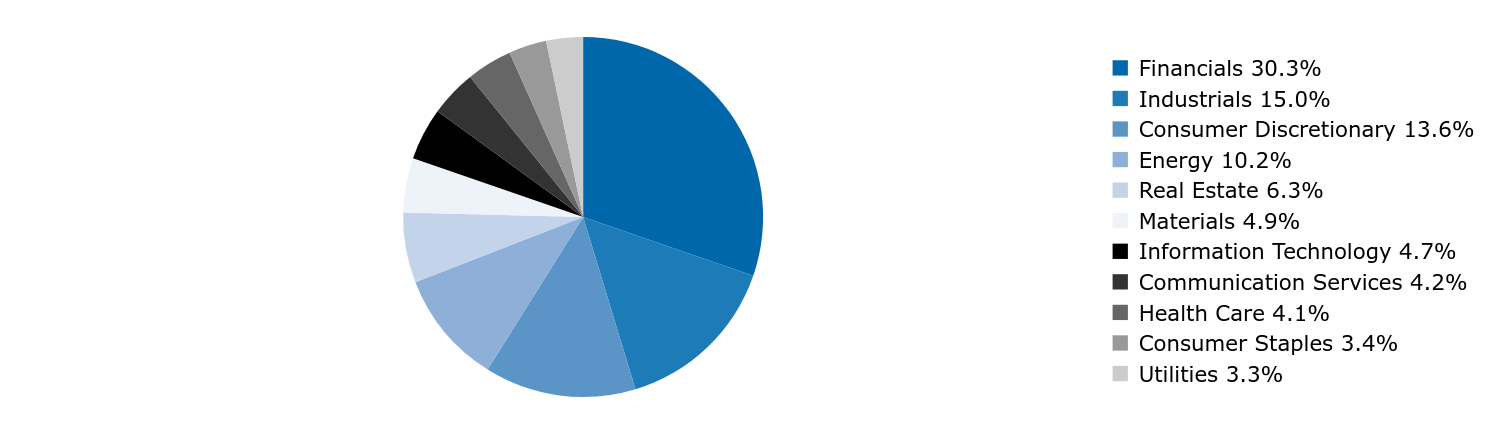
| Fund Name | Harbor AlphaEdge™ Small Cap Earners ETF |
| Trading Symbol | Ticker: EBIT |
| Security Exchange Name | NYSEArca |
| Annual or Semi-Annual Statement [Text Block] | This semi-annual shareholder report contains important information about Harbor AlphaEdge™ Small Cap Earners ETF ("Fund") for the period of November 1, 2024 to April 30, 2025. |
| Shareholder Report Annual or Semi-Annual | Semi-Annual Shareholder Report |
| Additional Information [Text Block] | You can find additional information about the Fund at www.harborcapital.com/documents/fund. You can also request this information by contacting us at 800-422-1050. |
| Additional Information Phone Number | 800-422-1050 |
| Additional Information Website | <span style="box-sizing: border-box; color: rgb(0, 0, 0); display: inline; flex-wrap: nowrap; font-size: 10.6667px; font-weight: 400; grid-area: auto; line-height: 12.8px; margin: 0px; overflow: visible; text-align: left; white-space-collapse: preserve-breaks;">www.harborcapital.com/documents/fund</span> |
| Expenses [Text Block] | |
| Expenses Paid, Amount | $ 14 |
| Expense Ratio, Percent | 0.29% |
| AssetsNet | $ 9,297,000 |
| Holdings Count | Holding | 837 |
| Advisory Fees Paid, Amount | $ 12,000 |
| InvestmentCompanyPortfolioTurnover | 22.00% |
| Additional Fund Statistics [Text Block] | |
| Holdings [Text Block] | |
| C000234046 | |
| Shareholder Report [Line Items] | |
| Fund Name | Harbor Commodity All-Weather Strategy ETF (Consolidated) |
| Trading Symbol | Ticker: HGER |
| Security Exchange Name | NYSE |
| Annual or Semi-Annual Statement [Text Block] | This semi-annual shareholder report contains important information about Harbor Commodity All-Weather Strategy ETF (Consolidated) ("Fund") for the period of November 1, 2024 to April 30, 2025. |
| Shareholder Report Annual or Semi-Annual | Semi-Annual Shareholder Report |
| Additional Information [Text Block] | You can find additional information about the Fund at www.harborcapital.com/documents/fund. You can also request this information by contacting us at 800-422-1050. |
| Additional Information Phone Number | 800-422-1050 |
| Additional Information Website | <span style="box-sizing: border-box; color: rgb(0, 0, 0); display: inline; flex-wrap: nowrap; font-size: 10.6667px; font-weight: 400; grid-area: auto; line-height: 12.8px; margin: 0px; overflow: visible; text-align: left; text-align-last: auto; white-space-collapse: preserve-breaks;">www.harborcapital.com/documents/fund</span> |
| Expenses [Text Block] | |
| Expenses Paid, Amount | $ 35 |
| Expense Ratio, Percent | 0.68% |
| AssetsNet | $ 302,273,000 |
| Holdings Count | Holding | 8 |
| Advisory Fees Paid, Amount | $ 938,000 |
| InvestmentCompanyPortfolioTurnover | 0.00% |
| Additional Fund Statistics [Text Block] | |
| Holdings [Text Block] | |
| C000249125 | |
| Shareholder Report [Line Items] | |
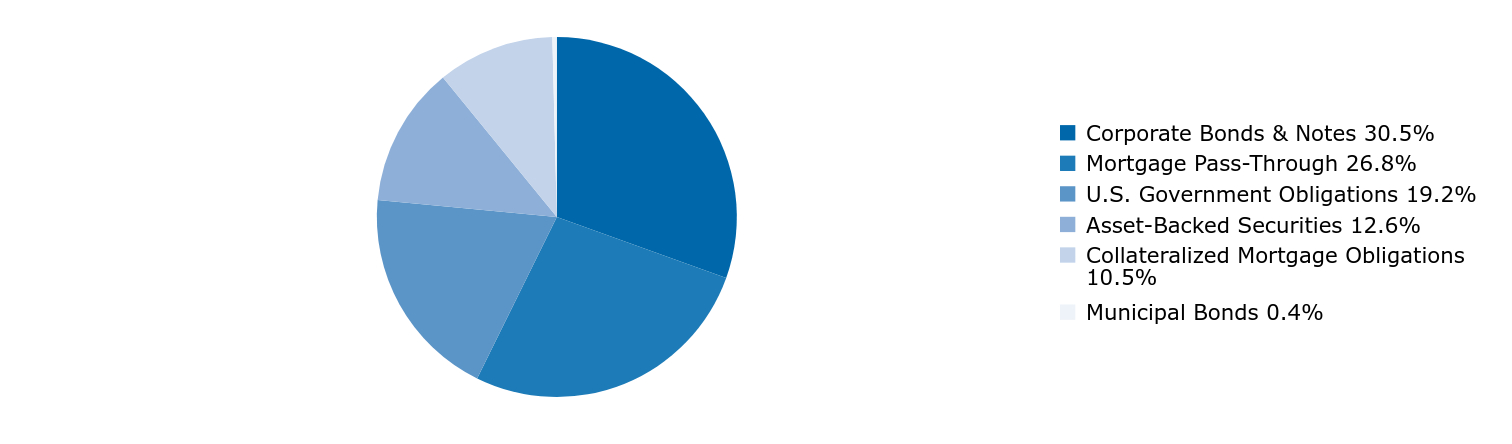
| Fund Name | Harbor Disciplined Bond ETF |
| Trading Symbol | Ticker: AGGS |
| Security Exchange Name | NYSEArca |
| Annual or Semi-Annual Statement [Text Block] | This semi-annual shareholder report contains important information about Harbor Disciplined Bond ETF ("Fund") for the period of November 1, 2024 to April 30, 2025. |
| Shareholder Report Annual or Semi-Annual | Semi-Annual Shareholder Report |
| Additional Information [Text Block] | You can find additional information about the Fund at www.harborcapital.com/documents/fund. You can also request this information by contacting us at 800-422-1050. |
| Additional Information Phone Number | 800-422-1050 |
| Additional Information Website | <span style="box-sizing: border-box; color: rgb(0, 0, 0); display: inline; flex-wrap: nowrap; font-size: 10.6667px; font-weight: 400; grid-area: auto; line-height: 12.8px; margin: 0px; overflow: visible; text-align: left; white-space-collapse: preserve-breaks;">www.harborcapital.com/documents/fund</span> |
| Expenses [Text Block] | |
| Expenses Paid, Amount | $ 18 |
| Expense Ratio, Percent | 0.35% |
| AssetsNet | $ 27,736,000 |
| Holdings Count | Holding | 203 |
| Advisory Fees Paid, Amount | $ 48,000 |
| InvestmentCompanyPortfolioTurnover | 13.00% |
| Additional Fund Statistics [Text Block] | |
| Holdings [Text Block] | |
| C000235263 | |
| Shareholder Report [Line Items] | |
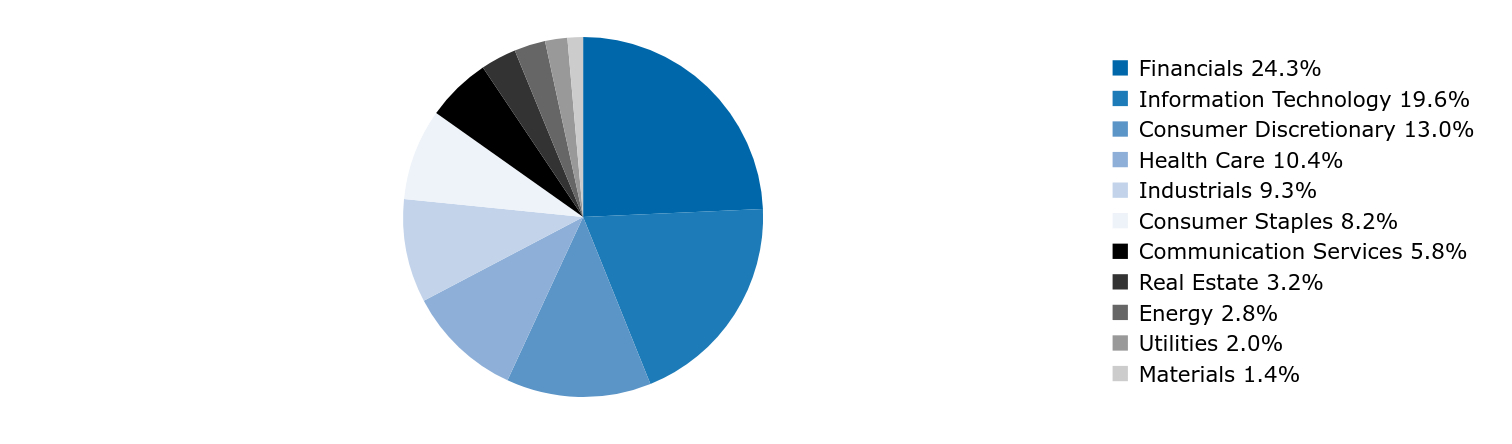
| Fund Name | Harbor Dividend Growth Leaders ETF |
| Trading Symbol | Ticker: GDIV |
| Security Exchange Name | NYSE |
| Annual or Semi-Annual Statement [Text Block] | This semi-annual shareholder report contains important information about Harbor Dividend Growth Leaders ETF ("Fund") for the period of November 1, 2024 to April 30, 2025. |
| Shareholder Report Annual or Semi-Annual | Semi-Annual Shareholder Report |
| Additional Information [Text Block] | You can find additional information about the Fund at www.harborcapital.com/documents/fund. You can also request this information by contacting us at 800-422-1050. |
| Additional Information Phone Number | 800-422-1050 |
| Additional Information Website | <span style="box-sizing: border-box; color: rgb(0, 0, 0); display: inline; flex-wrap: nowrap; font-size: 10.6667px; font-weight: 400; grid-area: auto; line-height: 12.8px; margin: 0px; overflow: visible; text-align: left; white-space-collapse: preserve-breaks;">www.harborcapital.com/documents/fund</span> |
| Expenses [Text Block] | |
| Expenses Paid, Amount | $ 24 |
| Expense Ratio, Percent | 0.50% |
| AssetsNet | $ 233,945,000 |
| Holdings Count | Holding | 43 |
| Advisory Fees Paid, Amount | $ 668,000 |
| InvestmentCompanyPortfolioTurnover | 40.00% |
| Additional Fund Statistics [Text Block] | |
| Holdings [Text Block] | |
| C000238718 | |
| Shareholder Report [Line Items] | |
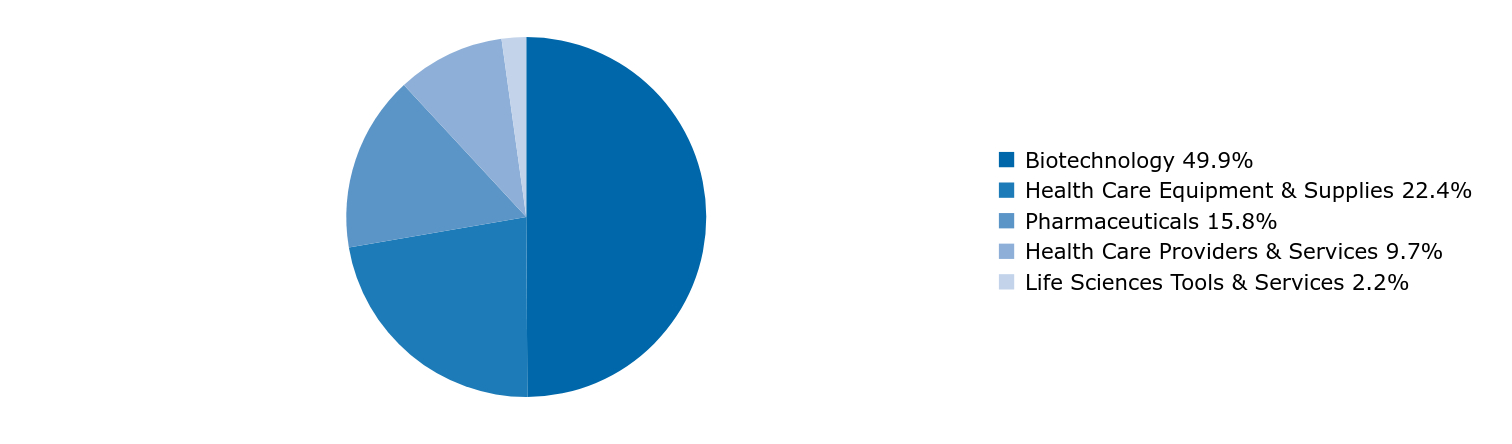
| Fund Name | Harbor Health Care ETF |
| Trading Symbol | Ticker: MEDI |
| Security Exchange Name | NYSEArca |
| Annual or Semi-Annual Statement [Text Block] | This semi-annual shareholder report contains important information about Harbor Health Care ETF ("Fund") for the period of November 1, 2024 to April 30, 2025. |
| Shareholder Report Annual or Semi-Annual | Semi-Annual Shareholder Report |
| Additional Information [Text Block] | You can find additional information about the Fund at www.harborcapital.com/documents/fund. You can also request this information by contacting us at 800-422-1050. |
| Additional Information Phone Number | 800-422-1050 |
| Additional Information Website | <span style="box-sizing: border-box; color: rgb(0, 0, 0); display: inline; flex-wrap: nowrap; font-size: 10.6667px; font-weight: 400; grid-area: auto; line-height: 12.8px; margin: 0px; overflow: visible; text-align: left; white-space-collapse: preserve-breaks;">www.harborcapital.com/documents/fund</span> |
| Expenses [Text Block] | |
| Expenses Paid, Amount | $ 39 |
| Expense Ratio, Percent | 0.80% |
| AssetsNet | $ 15,679,000 |
| Holdings Count | Holding | 35 |
| Advisory Fees Paid, Amount | $ 65,000 |
| InvestmentCompanyPortfolioTurnover | 92.00% |
| Additional Fund Statistics [Text Block] | |
| Holdings [Text Block] | |
| C000234331 | |
| Shareholder Report [Line Items] | |
| Fund Name | Harbor Human Capital Factor Unconstrained ETF |
| Trading Symbol | Ticker: HAPY |
| Security Exchange Name | NYSEArca |
| Annual or Semi-Annual Statement [Text Block] | This semi-annual shareholder report contains important information about Harbor Human Capital Factor Unconstrained ETF ("Fund") for the period of November 1, 2024 to April 30, 2025. |
| Shareholder Report Annual or Semi-Annual | Semi-Annual Shareholder Report |
| Additional Information [Text Block] | You can find additional information about the Fund at www.harborcapital.com/documents/fund. You can also request this information by contacting us at 800-422-1050. |
| Additional Information Phone Number | 800-422-1050 |
| Additional Information Website | <span style="box-sizing: border-box; color: rgb(0, 0, 0); display: inline; flex-wrap: nowrap; font-size: 10.6667px; font-weight: 400; grid-area: auto; line-height: 12.8px; margin: 0px; overflow: visible; text-align: left; white-space-collapse: preserve-breaks;">www.harborcapital.com/documents/fund</span> |
| Expenses [Text Block] | |
| Expenses Paid, Amount | $ 24 |
| Expense Ratio, Percent | 0.50% |
| AssetsNet | $ 3,320,000 |
| Holdings Count | Holding | 74 |
| Advisory Fees Paid, Amount | $ 19,000 |
| InvestmentCompanyPortfolioTurnover | 30.00% |
| Additional Fund Statistics [Text Block] | |
| Holdings [Text Block] | |
| C000238211 | |
| Shareholder Report [Line Items] | |
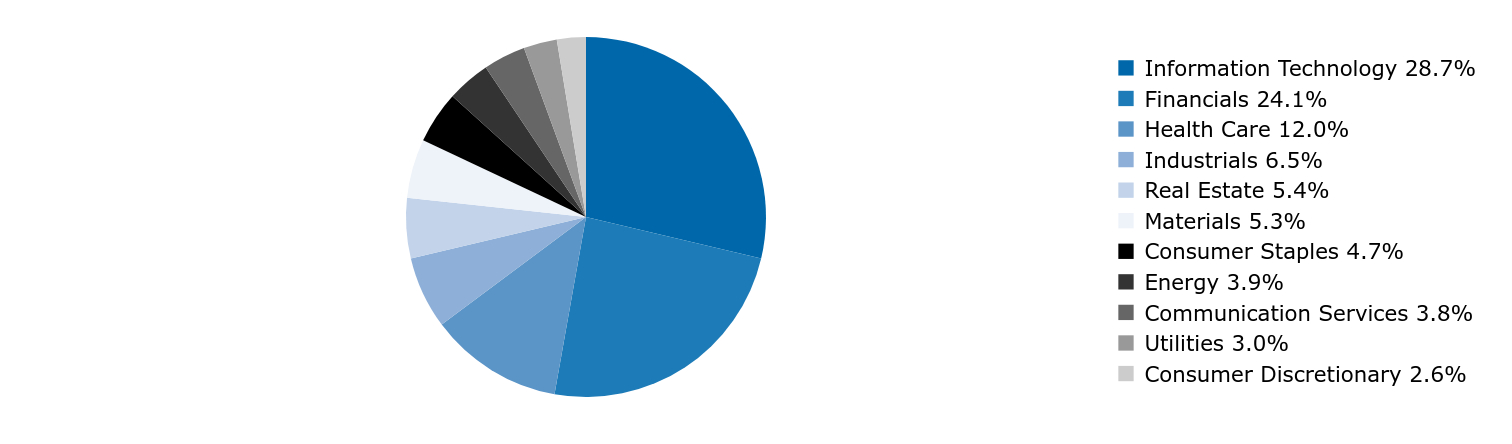
| Fund Name | Harbor Human Capital Factor US Large Cap ETF |
| Trading Symbol | Ticker: HAPI |
| Security Exchange Name | NYSEArca |
| Annual or Semi-Annual Statement [Text Block] | This semi-annual shareholder report contains important information about Harbor Human Capital Factor US Large Cap ETF ("Fund") for the period of November 1, 2024 to April 30, 2025. |
| Shareholder Report Annual or Semi-Annual | Semi-Annual Shareholder Report |
| Additional Information [Text Block] | You can find additional information about the Fund at www.harborcapital.com/documents/fund. You can also request this information by contacting us at 800-422-1050. |
| Additional Information Phone Number | 800-422-1050 |
| Additional Information Website | <span style="box-sizing: border-box; color: rgb(0, 0, 0); display: inline; flex-wrap: nowrap; font-size: 10.6667px; font-weight: 400; grid-area: auto; line-height: 12.8px; margin: 0px; overflow: visible; text-align: left; white-space-collapse: preserve-breaks;">www.harborcapital.com/documents/fund</span> |
| Expenses [Text Block] | |
| Expenses Paid, Amount | $ 17 |
| Expense Ratio, Percent | 0.35% |
| AssetsNet | $ 356,048,000 |
| Holdings Count | Holding | 151 |
| Advisory Fees Paid, Amount | $ 646,000 |
| InvestmentCompanyPortfolioTurnover | 28.00% |
| Additional Fund Statistics [Text Block] | |
| Holdings [Text Block] | |
| C000241449 | |
| Shareholder Report [Line Items] | |
| Fund Name | Harbor Human Capital Factor US Small Cap ETF |
| Trading Symbol | Ticker: HAPS |
| Security Exchange Name | NYSEArca |
| Annual or Semi-Annual Statement [Text Block] | This semi-annual shareholder report contains important information about Harbor Human Capital Factor US Small Cap ETF ("Fund") for the period of November 1, 2024 to April 30, 2025. |
| Shareholder Report Annual or Semi-Annual | Semi-Annual Shareholder Report |
| Additional Information [Text Block] | You can find additional information about the Fund at www.harborcapital.com/documents/fund. You can also request this information by contacting us at 800-422-1050. |
| Additional Information Phone Number | 800-422-1050 |
| Additional Information Website | <span style="box-sizing: border-box; color: rgb(0, 0, 0); display: inline; flex-wrap: nowrap; font-size: 10.6667px; font-weight: 400; grid-area: auto; line-height: 12.8px; margin: 0px; overflow: visible; text-align: left; white-space-collapse: preserve-breaks;">www.harborcapital.com/documents/fund</span> |
| Expenses [Text Block] | |
| Expenses Paid, Amount | $ 28 |
| Expense Ratio, Percent | 0.60% |
| AssetsNet | $ 117,928,000 |
| Holdings Count | Holding | 197 |
| Advisory Fees Paid, Amount | $ 395,000 |
| InvestmentCompanyPortfolioTurnover | 63.00% |
| Additional Fund Statistics [Text Block] | |
| Holdings [Text Block] | |
| C000237253 | |
| Shareholder Report [Line Items] | |
| Fund Name | Harbor International Compounders ETF |
| Trading Symbol | Ticker: OSEA |
| Security Exchange Name | NYSEArca |
| Annual or Semi-Annual Statement [Text Block] | This semi-annual shareholder report contains important information about Harbor International Compounders ETF ("Fund") for the period of November 1, 2024 to April 30, 2025. |
| Shareholder Report Annual or Semi-Annual | Semi-Annual Shareholder Report |
| Additional Information [Text Block] | You can find additional information about the Fund at www.harborcapital.com/documents/fund. You can also request this information by contacting us at 800-422-1050. |
| Additional Information Phone Number | 800-422-1050 |
| Additional Information Website | <span style="box-sizing: border-box; color: rgb(0, 0, 0); display: inline; flex-wrap: nowrap; font-size: 10.6667px; font-weight: 400; grid-area: auto; line-height: 12.8px; margin: 0px; overflow: visible; text-align: left; text-align-last: auto; white-space-collapse: preserve-breaks;">www.harborcapital.com/documents/fund</span> |
| Expenses [Text Block] | |
| Expenses Paid, Amount | $ 27 |
| Expense Ratio, Percent | 0.55% |
| AssetsNet | $ 428,089,000 |
| Holdings Count | Holding | 29 |
| Advisory Fees Paid, Amount | $ 839,000 |
| InvestmentCompanyPortfolioTurnover | 1.00% |
| Additional Fund Statistics [Text Block] | |
| Holdings [Text Block] | |
| C000244492 | |
| Shareholder Report [Line Items] | |
| Fund Name | Harbor Long-Short Equity ETF |
| Trading Symbol | Ticker: LSEQ |
| Security Exchange Name | NYSEArca |
| Annual or Semi-Annual Statement [Text Block] | This semi-annual shareholder report contains important information about Harbor Long-Short Equity ETF ("Fund") for the period of November 1, 2024 to April 30, 2025. |
| Shareholder Report Annual or Semi-Annual | Semi-Annual Shareholder Report |
| Additional Information [Text Block] | You can find additional information about the Fund at www.harborcapital.com/documents/fund. You can also request this information by contacting us at 800-422-1050. |
| Additional Information Phone Number | 800-422-1050 |
| Additional Information Website | <span style="box-sizing: border-box; color: rgb(0, 0, 0); display: inline; flex-wrap: nowrap; font-size: 10.6667px; font-weight: 400; grid-area: auto; line-height: 12.8px; margin: 0px; overflow: visible; text-align: left; white-space-collapse: preserve-breaks;">www.harborcapital.com/documents/fund</span> |
| Expenses [Text Block] | |
| Expenses Paid, Amount | $ 128 |
| Expense Ratio, Percent | 2.53% |
| AssetsNet | $ 20,221,000 |
| Holdings Count | Holding | 147 |
| Advisory Fees Paid, Amount | $ 121,000 |
| InvestmentCompanyPortfolioTurnover | 149.00% |
| Additional Fund Statistics [Text Block] | |
| Holdings [Text Block] | |
| C000233998 | |
| Shareholder Report [Line Items] | |
| Fund Name | Harbor Long-Term Growers ETF |
| Trading Symbol | Ticker: WINN |
| Security Exchange Name | NYSE |
| Annual or Semi-Annual Statement [Text Block] | This semi-annual shareholder report contains important information about Harbor Long-Term Growers ETF ("Fund") for the period of November 1, 2024 to April 30, 2025. |
| Shareholder Report Annual or Semi-Annual | Semi-Annual Shareholder Report |
| Additional Information [Text Block] | You can find additional information about the Fund at www.harborcapital.com/documents/fund. You can also request this information by contacting us at 800-422-1050. |
| Additional Information Phone Number | 800-422-1050 |
| Additional Information Website | <span style="box-sizing: border-box; color: rgb(0, 0, 0); display: inline; flex-wrap: nowrap; font-size: 10.6667px; font-weight: 400; grid-area: auto; line-height: 12.8px; margin: 0px; overflow: visible; text-align: left; white-space-collapse: preserve-breaks;">www.harborcapital.com/documents/fund</span> |
| Expenses [Text Block] | |
| Expenses Paid, Amount | $ 28 |
| Expense Ratio, Percent | 0.57% |
| AssetsNet | $ 749,073,000 |
| Holdings Count | Holding | 72 |
| Advisory Fees Paid, Amount | $ 1,937,000 |
| InvestmentCompanyPortfolioTurnover | 28.00% |
| Additional Fund Statistics [Text Block] | |
| Holdings [Text Block] | |
| C000243340 | |
| Shareholder Report [Line Items] | |
| Fund Name | Harbor Multi-Asset Explorer ETF (Consolidated) |
| Trading Symbol | Ticker: MAPP |
| Security Exchange Name | NYSEArca |
| Annual or Semi-Annual Statement [Text Block] | This semi-annual shareholder report contains important information about Harbor Multi-Asset Explorer ETF (Consolidated) ("Fund") for the period of November 1, 2024 to April 30, 2025. |
| Shareholder Report Annual or Semi-Annual | Semi-Annual Shareholder Report |
| Additional Information [Text Block] | You can find additional information about the Fund at www.harborcapital.com/documents/fund. You can also request this information by contacting us at 800-422-1050. |
| Additional Information Phone Number | 800-422-1050 |
| Additional Information Website | <span style="box-sizing: border-box; color: rgb(0, 0, 0); display: inline; flex-wrap: nowrap; font-size: 10.6667px; font-weight: 400; grid-area: auto; line-height: 12.8px; margin: 0px; overflow: visible; text-align: left; white-space-collapse: preserve-breaks;">www.harborcapital.com/documents/fund</span> |
| Expenses [Text Block] | |
| Expenses Paid, Amount | $ 35 |
| Expense Ratio, Percent | 0.70% |
| AssetsNet | $ 5,177,000 |
| Holdings Count | Holding | 19 |
| Advisory Fees Paid, Amount | $ 16,000 |
| InvestmentCompanyPortfolioTurnover | 62.00% |
| Additional Fund Statistics [Text Block] | |
| Holdings [Text Block] | |
| C000255316 | |
| Shareholder Report [Line Items] | |
| Fund Name | Harbor Osmosis Emerging Markets Resource Efficient ETF |
| Trading Symbol | Ticker: EFFE |
| Security Exchange Name | NYSEArca |
| Annual or Semi-Annual Statement [Text Block] | This semi-annual shareholder report contains important information about Harbor Osmosis Emerging Markets Resource Efficient ETF ("Fund") for the period of December 18, 2024 (commencement of operations) to April 30, 2025. |
| Shareholder Report Annual or Semi-Annual | Semi-Annual Shareholder Report |
| Additional Information [Text Block] | You can find additional information about the Fund at www.harborcapital.com/documents/fund. You can also request this information by contacting us at 800-422-1050. |
| Additional Information Phone Number | 800-422-1050 |
| Additional Information Website | <span style="box-sizing: border-box; color: rgb(0, 0, 0); display: inline; flex-wrap: nowrap; font-size: 10.6667px; font-weight: 400; grid-area: auto; line-height: 12.8px; margin: 0px; overflow: visible; text-align: left; text-align-last: auto; white-space-collapse: preserve-breaks;">www.harborcapital.com/documents/fund</span> |
| Expenses [Text Block] | |
| Expenses Paid, Amount | $ 26 |
| Expense Ratio, Percent | 0.69% |
| AssetsNet | $ 107,192,000 |
| Holdings Count | Holding | 81 |
| Advisory Fees Paid, Amount | $ 166,000 |
| InvestmentCompanyPortfolioTurnover | 67.00% |
| Additional Fund Statistics [Text Block] | |
| Holdings [Text Block] | |
| C000255317 | |
| Shareholder Report [Line Items] | |
| Fund Name | Harbor Osmosis International Resource Efficient ETF |
| Trading Symbol | Ticker: EFFI |
| Security Exchange Name | NYSEArca |
| Annual or Semi-Annual Statement [Text Block] | This semi-annual shareholder report contains important information about Harbor Osmosis International Resource Efficient ETF ("Fund") for the period of December 11, 2024 (commencement of operations) to April 30, 2025. |
| Shareholder Report Annual or Semi-Annual | Semi-Annual Shareholder Report |
| Additional Information [Text Block] | You can find additional information about the Fund at www.harborcapital.com/documents/fund. You can also request this information by contacting us at 800-422-1050. |
| Additional Information Phone Number | 800-422-1050 |
| Additional Information Website | <span style="box-sizing: border-box; color: rgb(0, 0, 0); display: inline; flex-wrap: nowrap; font-size: 10.6667px; font-weight: 400; grid-area: auto; line-height: 12.8px; margin: 0px; overflow: visible; text-align: left; text-align-last: auto; white-space-collapse: preserve-breaks;">www.harborcapital.com/documents/fund</span> |
| Expenses [Text Block] | |
| Expenses Paid, Amount | $ 22 |
| Expense Ratio, Percent | 0.55% |
| AssetsNet | $ 117,448,000 |
| Holdings Count | Holding | 77 |
| Advisory Fees Paid, Amount | $ 202,000 |
| InvestmentCompanyPortfolioTurnover | 31.00% |
| Additional Fund Statistics [Text Block] | |
| Holdings [Text Block] | |
| C000254050 | |
| Shareholder Report [Line Items] | |
| Fund Name | Harbor PanAgora Dynamic Large Cap Core ETF |
| Trading Symbol | Ticker: INFO |
| Security Exchange Name | NYSEArca |
| Annual or Semi-Annual Statement [Text Block] | This semi-annual shareholder report contains important information about Harbor PanAgora Dynamic Large Cap Core ETF ("Fund") for the period of November 1, 2024 to April 30, 2025. |
| Shareholder Report Annual or Semi-Annual | Semi-Annual Shareholder Report |
| Additional Information [Text Block] | You can find additional information about the Fund at www.harborcapital.com/documents/fund. You can also request this information by contacting us at 800-422-1050. |
| Additional Information Phone Number | 800-422-1050 |
| Additional Information Website | <span style="box-sizing: border-box; color: rgb(0, 0, 0); display: inline; flex-wrap: nowrap; font-size: 10.6667px; font-weight: 400; grid-area: auto; line-height: 12.8px; margin: 0px; overflow: visible; text-align: left; white-space-collapse: preserve-breaks;">www.harborcapital.com/documents/fund</span> |
| Expenses [Text Block] | |
| Expenses Paid, Amount | $ 17 |
| Expense Ratio, Percent | 0.35% |
| AssetsNet | $ 63,712,000 |
| Holdings Count | Holding | 118 |
| Advisory Fees Paid, Amount | $ 79,000 |
| InvestmentCompanyPortfolioTurnover | 22.00% |
| Additional Fund Statistics [Text Block] | |
| Holdings [Text Block] | |
| C000228888 | |
| Shareholder Report [Line Items] | |
| Fund Name | Harbor Scientific Alpha High-Yield ETF |
| Trading Symbol | Ticker: SIHY |
| Security Exchange Name | NYSEArca |
| Annual or Semi-Annual Statement [Text Block] | This semi-annual shareholder report contains important information about Harbor Scientific Alpha High-Yield ETF ("Fund") for the period of November 1, 2024 to April 30, 2025. |
| Shareholder Report Annual or Semi-Annual | Semi-Annual Shareholder Report |
| Additional Information [Text Block] | You can find additional information about the Fund at www.harborcapital.com/documents/fund. You can also request this information by contacting us at 800-422-1050. |
| Additional Information Phone Number | 800-422-1050 |
| Additional Information Website | <span style="box-sizing: border-box; color: rgb(0, 0, 0); display: inline; flex-wrap: nowrap; font-size: 10.6667px; font-weight: 400; grid-area: auto; line-height: 12.8px; margin: 0px; overflow: visible; text-align: left; white-space-collapse: preserve-breaks;">www.harborcapital.com/documents/fund</span> |
| Expenses [Text Block] | |
| Expenses Paid, Amount | $ 24 |
| Expense Ratio, Percent | 0.48% |
| AssetsNet | $ 172,926,000 |
| Holdings Count | Holding | 291 |
| Advisory Fees Paid, Amount | $ 393,000 |
| InvestmentCompanyPortfolioTurnover | 19.00% |
| Additional Fund Statistics [Text Block] | |
| Holdings [Text Block] | |
| C000228889 | |
| Shareholder Report [Line Items] | |
| Fund Name | Harbor Scientific Alpha Income ETF |
| Trading Symbol | Ticker: SIFI |
| Security Exchange Name | NYSEArca |
| Annual or Semi-Annual Statement [Text Block] | This semi-annual shareholder report contains important information about Harbor Scientific Alpha Income ETF ("Fund") for the period of November 1, 2024 to April 30, 2025. |
| Shareholder Report Annual or Semi-Annual | Semi-Annual Shareholder Report |
| Additional Information [Text Block] | You can find additional information about the Fund at www.harborcapital.com/documents/fund. You can also request this information by contacting us at 800-422-1050. |
| Additional Information Phone Number | 800-422-1050 |
| Additional Information Website | <span style="box-sizing: border-box; color: rgb(0, 0, 0); display: inline; flex-wrap: nowrap; font-size: 10.6667px; font-weight: 400; grid-area: auto; line-height: 12.8px; margin: 0px; overflow: visible; text-align: left; white-space-collapse: preserve-breaks;">www.harborcapital.com/documents/fund</span> |
| Expenses [Text Block] | |
| Expenses Paid, Amount | $ 25 |
| Expense Ratio, Percent | 0.50% |
| AssetsNet | $ 33,528,000 |
| Holdings Count | Holding | 177 |
| Advisory Fees Paid, Amount | $ 83,000 |
| InvestmentCompanyPortfolioTurnover | 26.00% |
| Additional Fund Statistics [Text Block] | |
| Holdings [Text Block] | |
| C000259354 | |
| Shareholder Report [Line Items] | |
| Fund Name | Harbor Transformative Technologies ETF |
| Trading Symbol | Ticker: TEC |
| Security Exchange Name | NYSEArca |
| Annual or Semi-Annual Statement [Text Block] | This semi-annual shareholder report contains important information about Harbor Transformative Technologies ETF ("Fund") for the period of April 16, 2025 (commencement of operations) to April 30, 2025. |
| Shareholder Report Annual or Semi-Annual | Semi-Annual Shareholder Report |
| Additional Information [Text Block] | You can find additional information about the Fund at www.harborcapital.com/documents/fund. You can also request this information by contacting us at 800-422-1050. |
| Additional Information Phone Number | 800-422-1050 |
| Additional Information Website | <span style="box-sizing: border-box; color: rgb(0, 0, 0); display: inline; flex-wrap: nowrap; font-size: 10.6667px; font-weight: 400; grid-area: auto; line-height: 12.8px; margin: 0px; overflow: visible; text-align: left; text-align-last: auto; white-space-collapse: preserve-breaks;">www.harborcapital.com/documents/fund</span> |
| Expenses [Text Block] | |
| Expenses Paid, Amount | $ 3 |
| Expense Ratio, Percent | 0.69% |
| AssetsNet | $ 3,727,000 |
| Holdings Count | Holding | 43 |
| Advisory Fees Paid, Amount | $ 1,000 |
| InvestmentCompanyPortfolioTurnover | 1.00% |
| Additional Fund Statistics [Text Block] | |
| Holdings [Text Block] |