Exhibit 99.1
| Investor Day 2025 June 24, 2025 NYSE: CF |
| Welcome Martin Jarosick VP, Treasury and Investor Relations 2 |

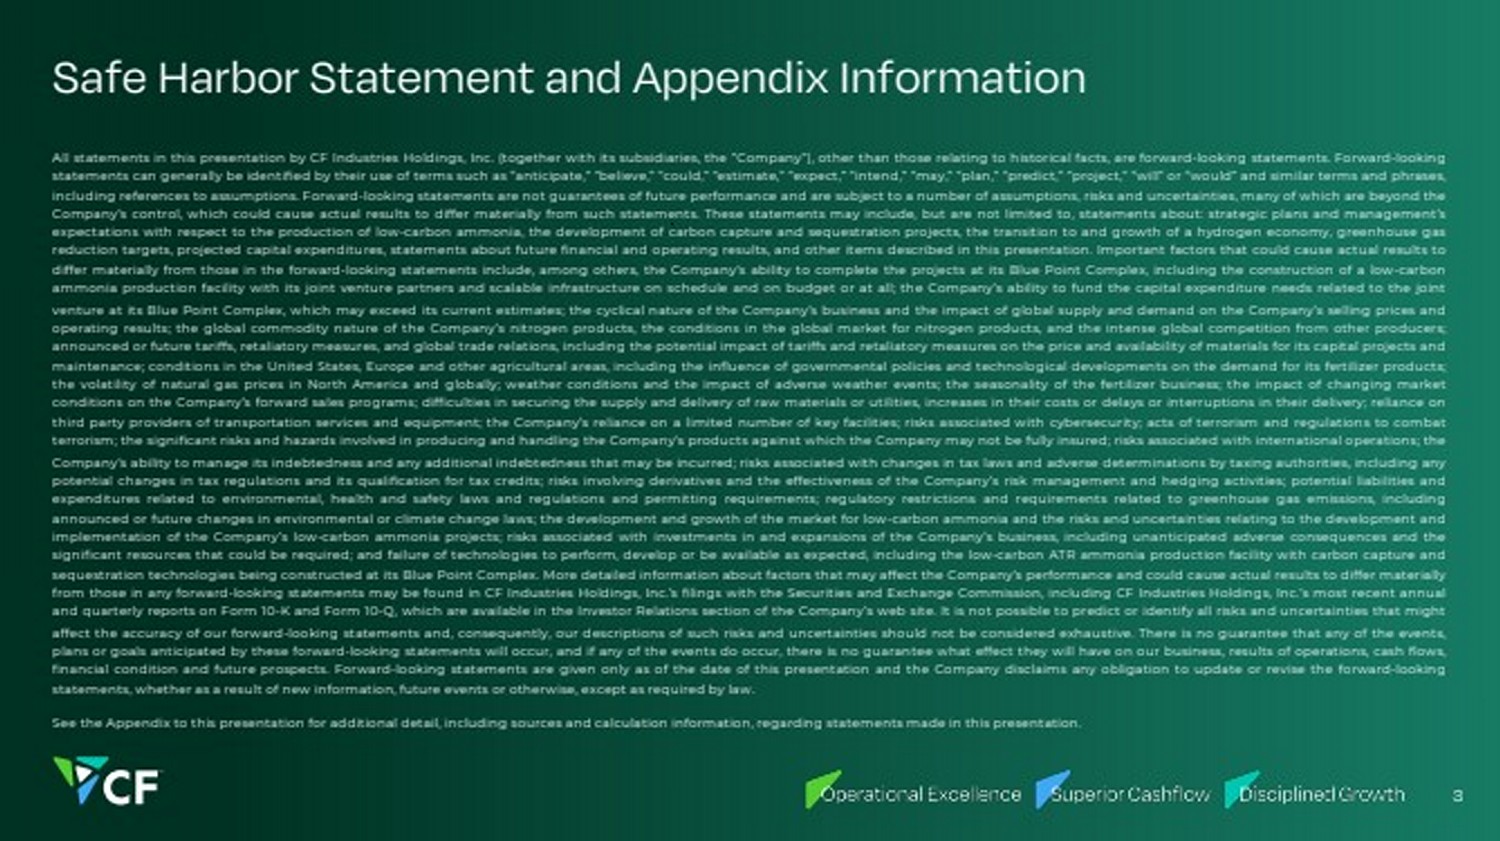
| Safe Harbor Statement and Appendix Information All statements in this presentation by CF Industries Holdings, Inc. (together with its subsidiaries, the “Company”), other than those relating to historical facts, are forward-looking statements. Forward-looking statements can generally be identified by their use of terms such as “anticipate,” “believe,” “could,” “estimate,” “expect,” “intend,” “may,” “plan,” “predict,” “project,” “will” or “would” and similar terms and phrases, including references to assumptions. Forward-looking statements are not guarantees of future performance and are subject to a number of assumptions, risks and uncertainties, many of which are beyond the Company’s control, which could cause actual results to differ materially from such statements. These statements may include, but are not limited to, statements about: strategic plans and management’s expectations with respect to the production of low-carbon ammonia, the development of carbon capture and sequestration projects, the transition to and growth of a hydrogen economy, greenhouse gas reduction targets, projected capital expenditures, statements about future financial and operating results, and other items described in this presentation. Important factors that could cause actual results to differ materially from those in the forward-looking statements include, among others, the Company’s ability to complete the projects at its Blue Point Complex, including the construction of a low-carbon ammonia production facility with its joint venture partners and scalable infrastructure on schedule and on budget or at all; the Company’s ability to fund the capital expenditure needs related to the joint venture at its Blue Point Complex, which may exceed its current estimates; the cyclical nature of the Company’s business and the impact of global supply and demand on the Company’s selling prices and operating results; the global commodity nature of the Company’s nitrogen products, the conditions in the global market for nitrogen products, and the intense global competition from other producers; announced or future tariffs, retaliatory measures, and global trade relations, including the potential impact of tariffs and retaliatory measures on the price and availability of materials for its capital projects and maintenance; conditions in the United States, Europe and other agricultural areas, including the influence of governmental policies and technological developments on the demand for its fertilizer products; the volatility of natural gas prices in North America and globally; weather conditions and the impact of adverse weather events; the seasonality of the fertilizer business; the impact of changing market conditions on the Company’s forward sales programs; difficulties in securing the supply and delivery of raw materials or utilities, increases in their costs or delays or interruptions in their delivery; reliance on third party providers of transportation services and equipment; the Company’s reliance on a limited number of key facilities; risks associated with cybersecurity; acts of terrorism and regulations to combat terrorism; the significant risks and hazards involved in producing and handling the Company’s products against which the Company may not be fully insured; risks associated with international operations; the Company’s ability to manage its indebtedness and any additional indebtedness that may be incurred; risks associated with changes in tax laws and adverse determinations by taxing authorities, including any potential changes in tax regulations and its qualification for tax credits; risks involving derivatives and the effectiveness of the Company’s risk management and hedging activities; potential liabilities and expenditures related to environmental, health and safety laws and regulations and permitting requirements; regulatory restrictions and requirements related to greenhouse gas emissions, including announced or future changes in environmental or climate change laws; the development and growth of the market for low-carbon ammonia and the risks and uncertainties relating to the development and implementation of the Company’s low-carbon ammonia projects; risks associated with investments in and expansions of the Company’s business, including unanticipated adverse consequences and the significant resources that could be required; and failure of technologies to perform, develop or be available as expected, including the low-carbon ATR ammonia production facility with carbon capture and sequestration technologies being constructed at its Blue Point Complex. More detailed information about factors that may affect the Company’s performance and could cause actual results to differ materially from those in any forward-looking statements may be found in CF Industries Holdings, Inc.’s filings with the Securities and Exchange Commission, including CF Industries Holdings, Inc.’s most recent annual and quarterly reports on Form 10-K and Form 10-Q, which are available in the Investor Relations section of the Company’s web site. It is not possible to predict or identify all risks and uncertainties that might affect the accuracy of our forward-looking statements and, consequently, our descriptions of such risks and uncertainties should not be considered exhaustive. There is no guarantee that any of the events, plans or goals anticipated by these forward-looking statements will occur, and if any of the events do occur, there is no guarantee what effect they will have on our business, results of operations, cash flows, financial condition and future prospects. Forward-looking statements are given only as of the date of this presentation and the Company disclaims any obligation to update or revise the forward-looking statements, whether as a result of new information, future events or otherwise, except as required by law. See the Appendix to this presentation for additional detail, including sources and calculation information, regarding statements made in this presentation. 3 |
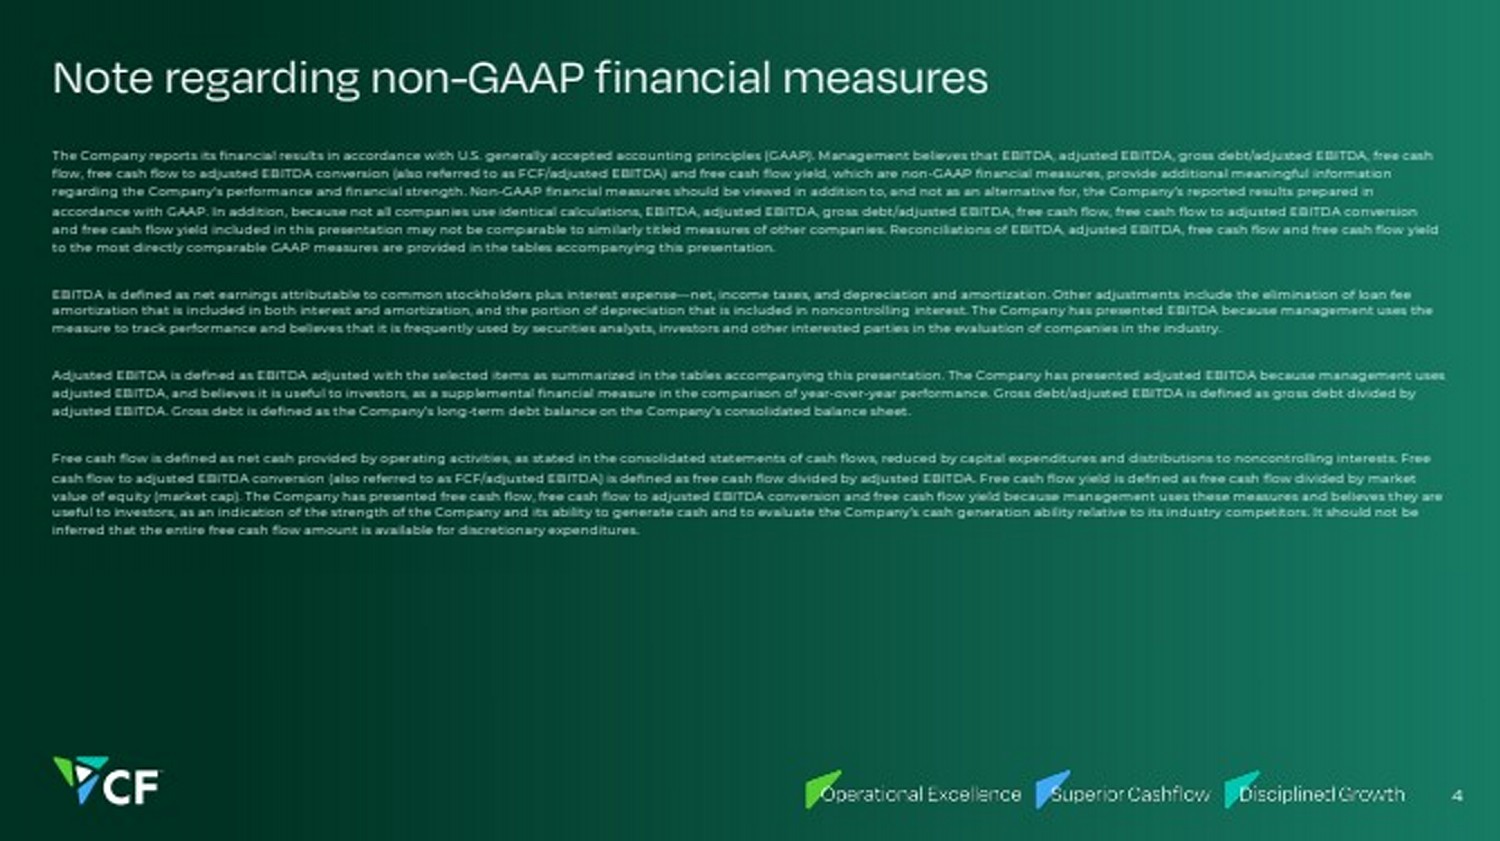
| Note regarding non-GAAP financial measures The Company reports its financial results in accordance with U.S. generally accepted accounting principles (GAAP). Management believes that EBITDA, adjusted EBITDA, gross debt/adjusted EBITDA, free cash flow, free cash flow to adjusted EBITDA conversion (also referred to as FCF/adjusted EBITDA) and free cash flow yield, which are non-GAAP financial measures, provide additional meaningful information regarding the Company's performance and financial strength. Non-GAAP financial measures should be viewed in addition to, and not as an alternative for, the Company’s reported results prepared in accordance with GAAP. In addition, because not all companies use identical calculations, EBITDA, adjusted EBITDA, gross debt/adjusted EBITDA, free cash flow, free cash flow to adjusted EBITDA conversion and free cash flow yield included in this presentation may not be comparable to similarly titled measures of other companies. Reconciliations of EBITDA, adjusted EBITDA, free cash flow and free cash flow yield to the most directly comparable GAAP measures are provided in the tables accompanying this presentation. EBITDA is defined as net earnings attributable to common stockholders plus interest expense—net, income taxes, and depreciation and amortization. Other adjustments include the elimination of loan fee amortization that is included in both interest and amortization, and the portion of depreciation that is included in noncontrolling interest. The Company has presented EBITDA because management uses the measure to track performance and believes that it is frequently used by securities analysts, investors and other interested parties in the evaluation of companies in the industry. Adjusted EBITDA is defined as EBITDA adjusted with the selected items as summarized in the tables accompanying this presentation. The Company has presented adjusted EBITDA because management uses adjusted EBITDA, and believes it is useful to investors, as a supplemental financial measure in the comparison of year-over-year performance. Gross debt/adjusted EBITDA is defined as gross debt divided by adjusted EBITDA. Gross debt is defined as the Company’s long-term debt balance on the Company’s consolidated balance sheet. Free cash flow is defined as net cash provided by operating activities, as stated in the consolidated statements of cash flows, reduced by capital expenditures and distributions to noncontrolling interests. Free cash flow to adjusted EBITDA conversion (also referred to as FCF/adjusted EBITDA) is defined as free cash flow divided by adjusted EBITDA. Free cash flow yield is defined as free cash flow divided by market value of equity (market cap). The Company has presented free cash flow, free cash flow to adjusted EBITDA conversion and free cash flow yield because management uses these measures and believes they are useful to investors, as an indication of the strength of the Company and its ability to generate cash and to evaluate the Company’s cash generation ability relative to its industry competitors. It should not be inferred that the entire free cash flow amount is available for discretionary expenditures. 4 |
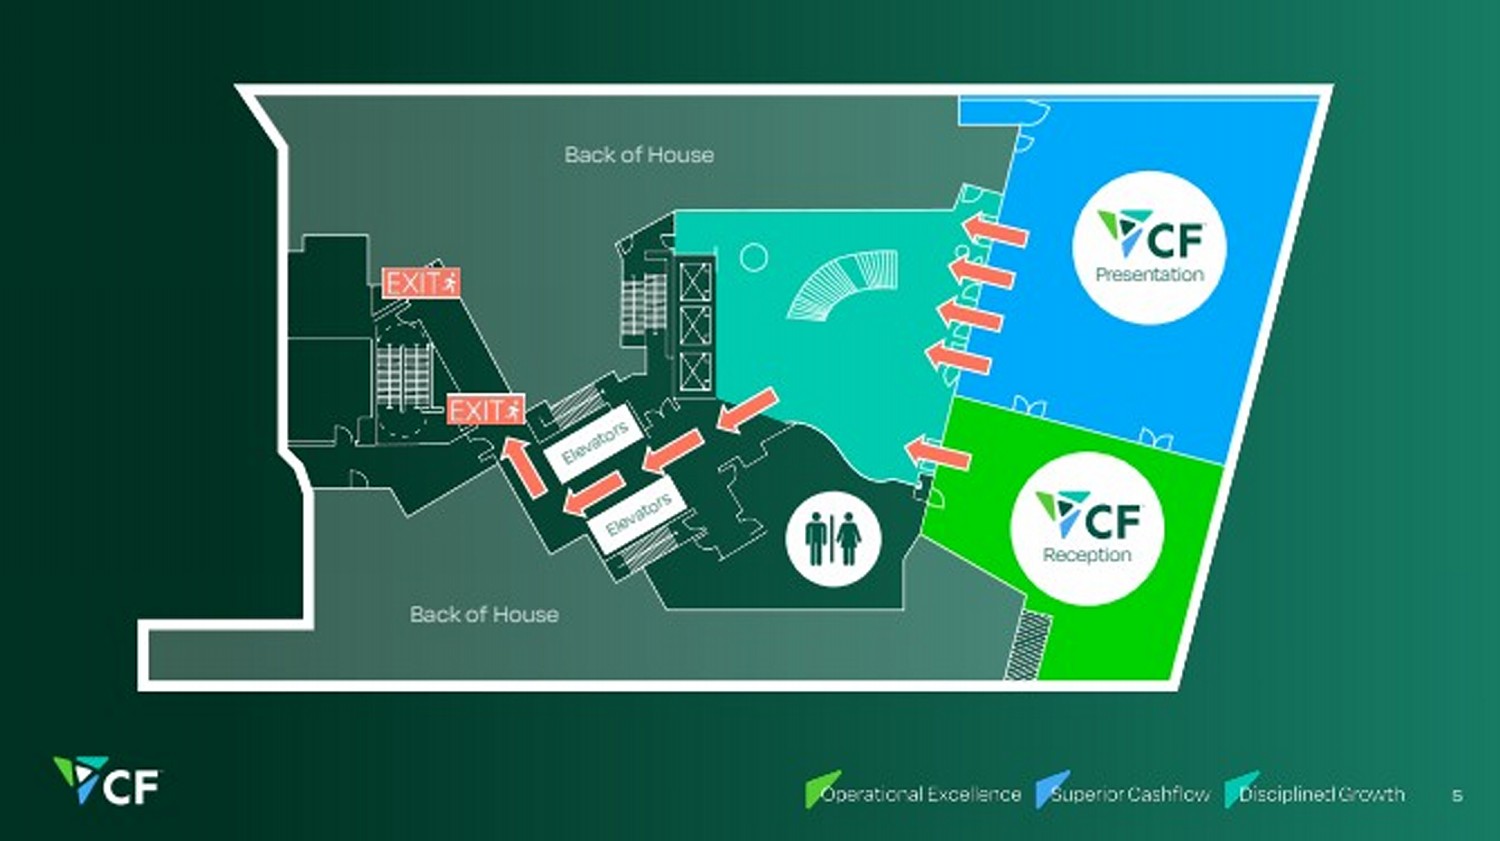
| 5 Back of House Back of House Elevators Elevators Presentation Reception |
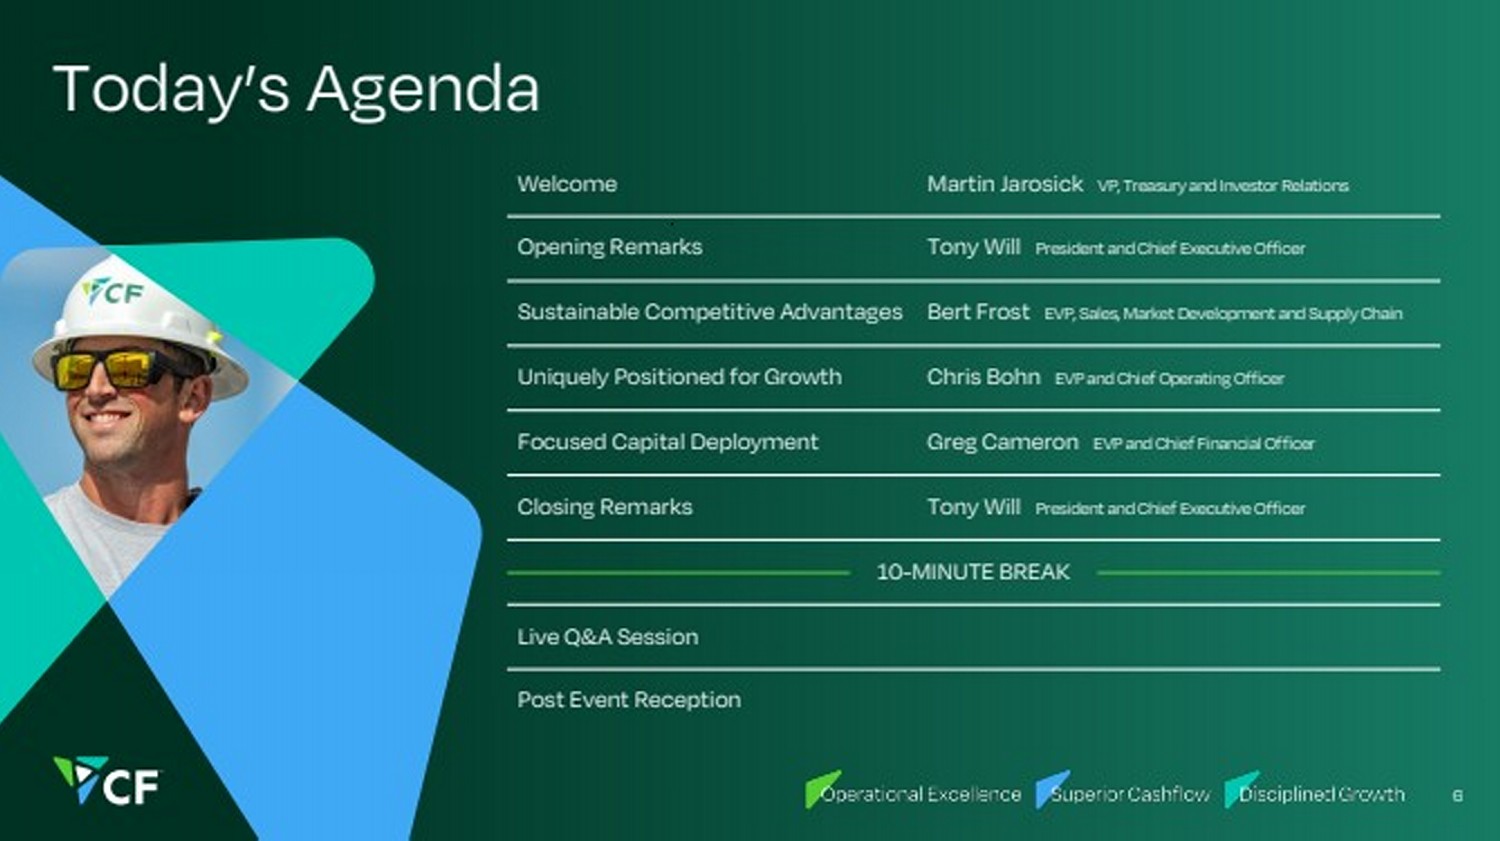
| Today’s Agenda Welcome Martin Jarosick VP, Treasury and Investor Relations Opening Remarks Tony Will President and Chief Executive Officer Sustainable Competitive Advantages Bert Frost EVP, Sales, Market Development and Supply Chain Uniquely Positioned for Growth Chris Bohn EVP and Chief Operating Officer Focused Capital Deployment Greg Cameron EVP and Chief Financial Officer Closing Remarks Tony Will President and Chief Executive Officer 10-MINUTE BREAK Live Q&A Session Post Event Reception 6 |
| Opening Remarks Tony Will President and Chief Executive Officer 7 |
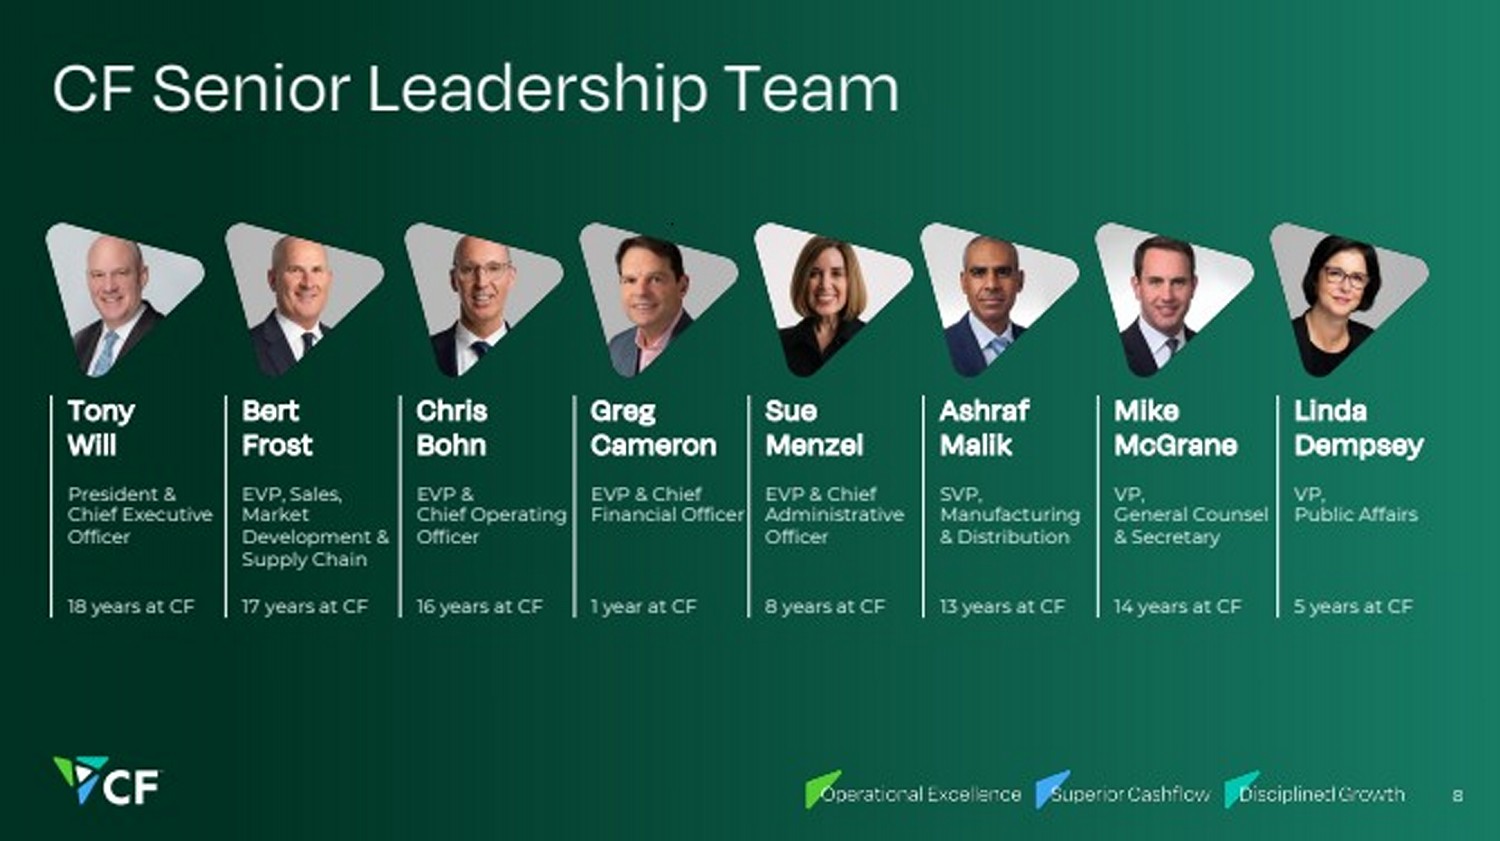
| Tony Will Bert Frost Chris Bohn Greg Cameron Sue Menzel Ashraf Malik Mike McGrane Linda Dempsey President & Chief Executive Officer EVP, Sales, Market Development & Supply Chain EVP & Chief Operating Officer EVP & Chief Financial Officer EVP & Chief Administrative Officer SVP, Manufacturing & Distribution VP, General Counsel & Secretary VP, Public Affairs 18 years at CF 17 years at CF 16 years at CF 1 year at CF 8 years at CF 13 years at CF 14 years at CF 5 years at CF CF Senior Leadership Team 8 |
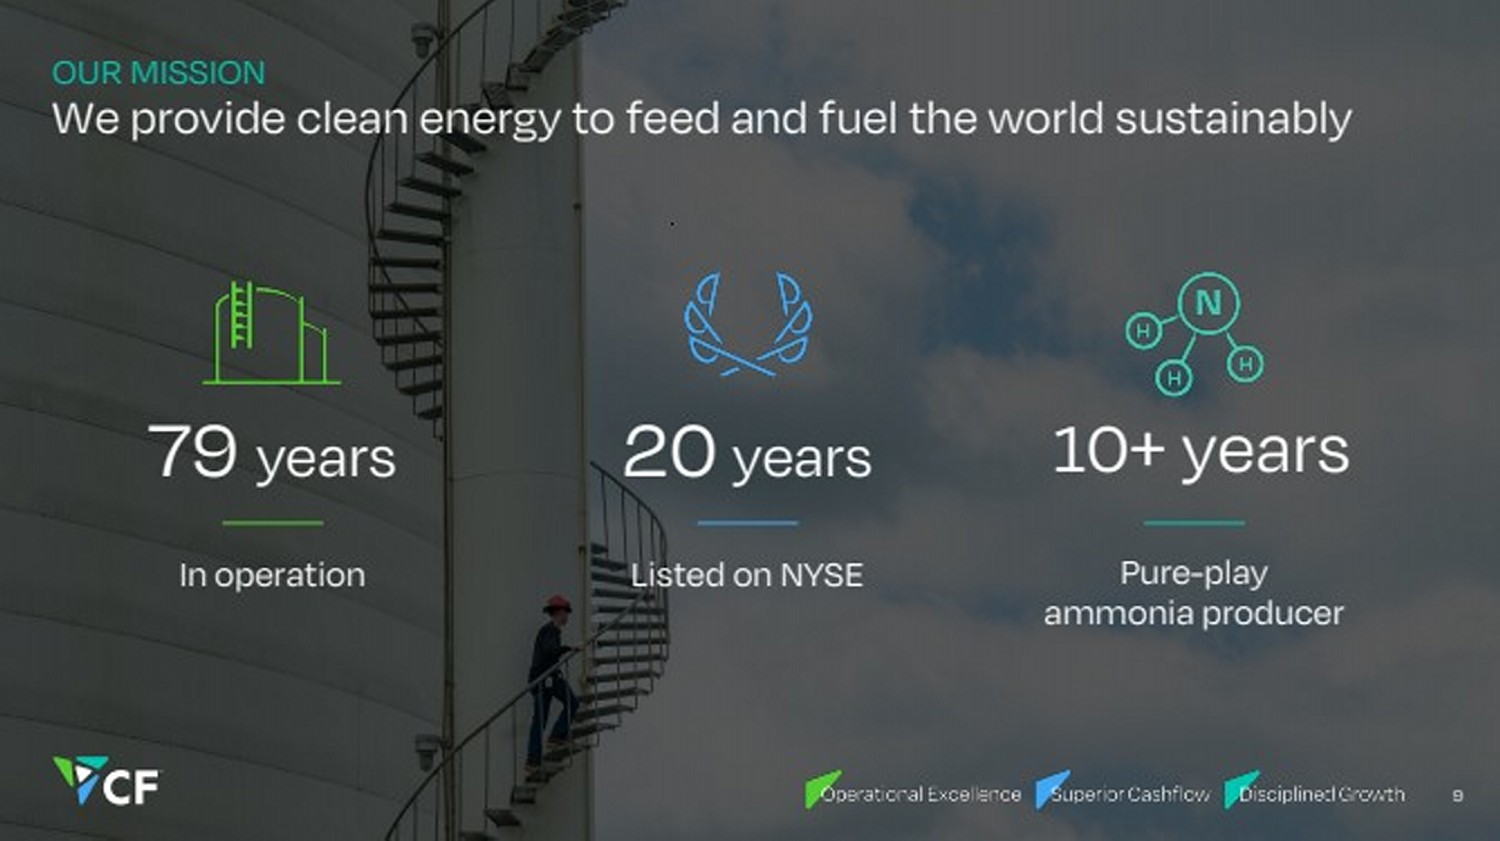
| OUR MISSION We provide clean energy to feed and fuel the world sustainably 9 In operation Pure-play ammonia producer 79 years 10+ years Listed on NYSE 20 years |
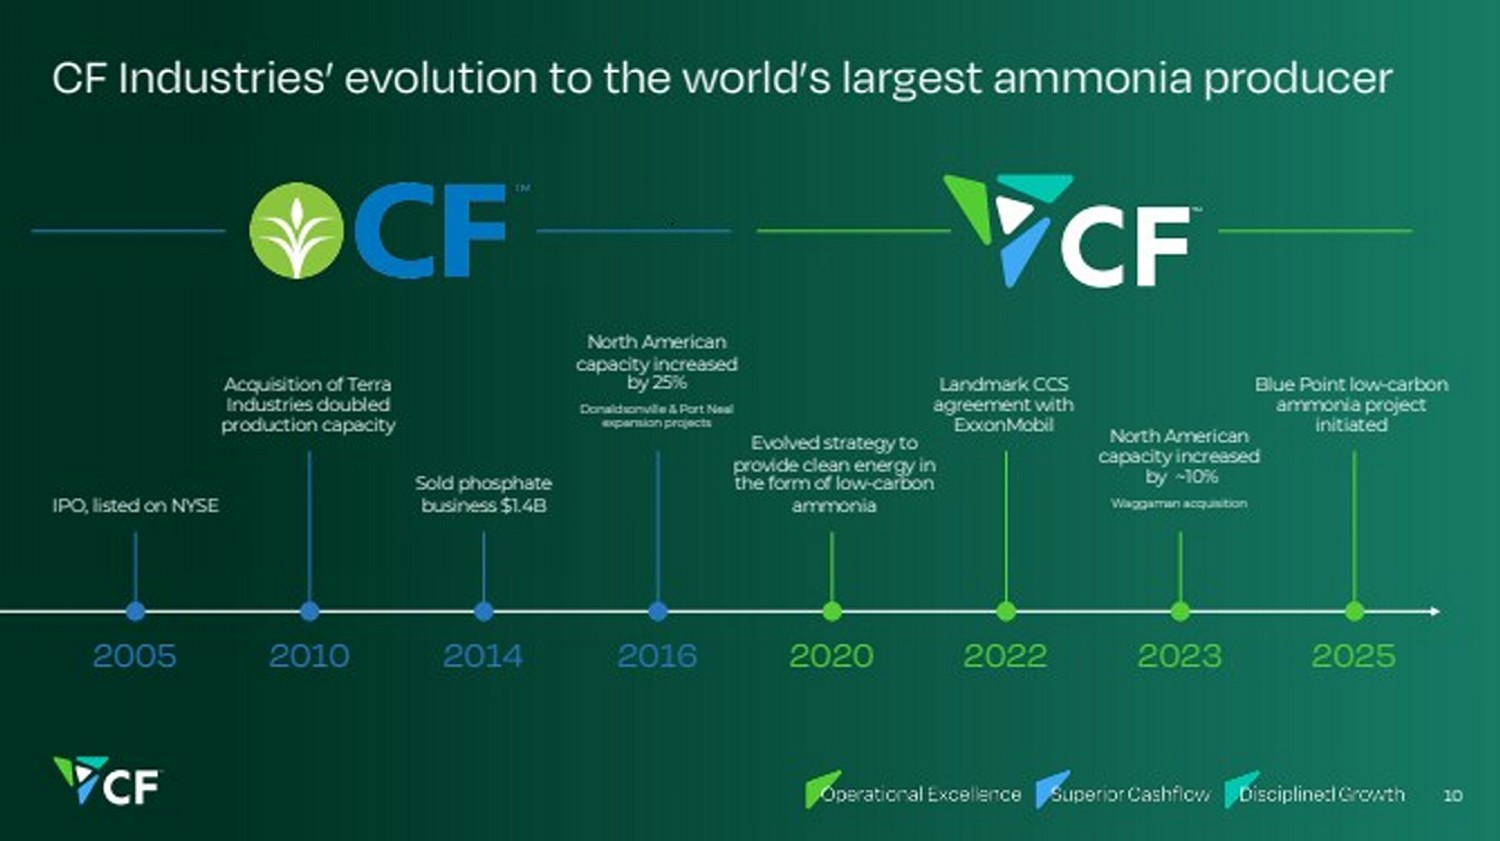
| Acquisition of Terra Industries doubled production capacity CF Industries’ evolution to the world’s largest ammonia producer 2005 2010 2014 2016 2020 2022 2023 IPO, listed on NYSE Sold phosphate business $1.4B North American capacity increased by 25% Donaldsonville & Port Neal expansion projects Evolved strategy to provide clean energy in the form of low-carbon ammonia Landmark CCS agreement with ExxonMobil North American capacity increased by ~10% Waggaman acquisition 10 2025 Blue Point low-carbon ammonia project initiated |
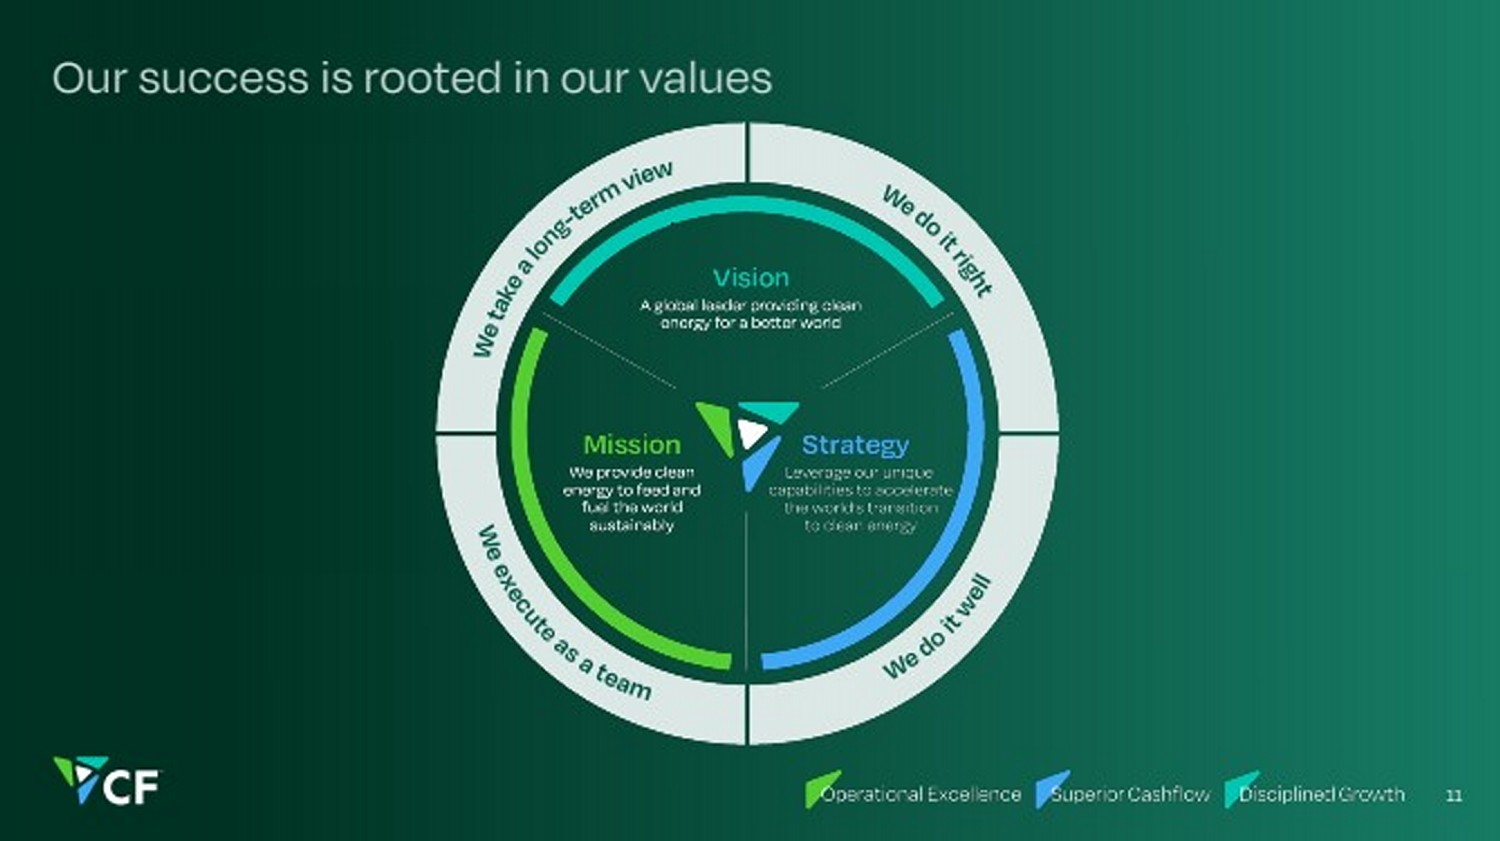
| Our success is rooted in our values 11 |
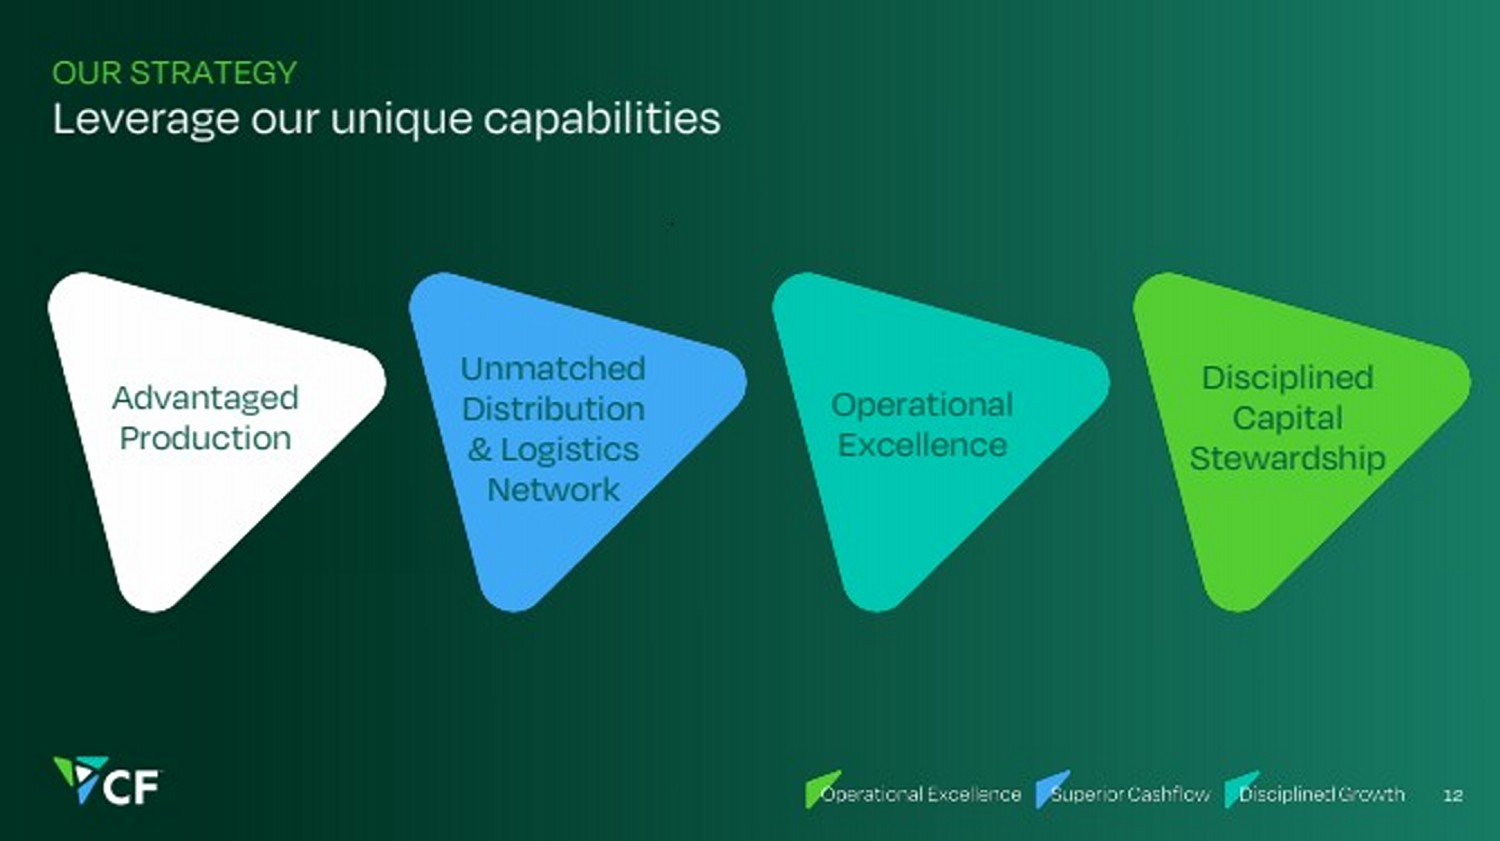
| Advantaged Production Unmatched Distribution & Logistics Network Operational Excellence Disciplined Capital Stewardship 12 OUR STRATEGY Leverage our unique capabilities |
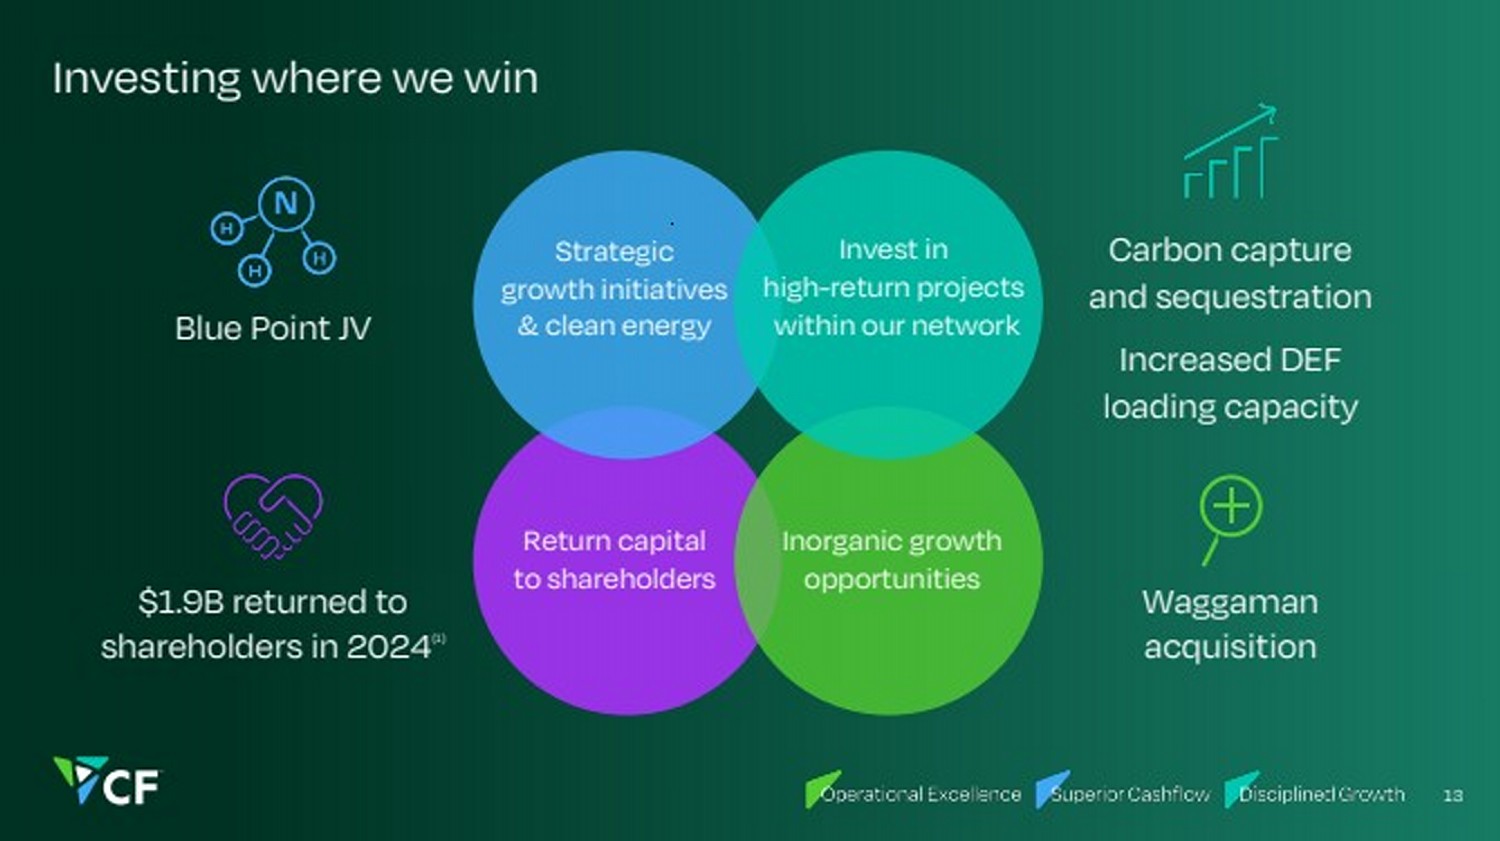
| $1.9B returned to shareholders in 2024(1) Return capital to shareholders Inorganic growth opportunities Investing where we win 13 Strategic growth initiatives Blue Point JV & clean energy Invest in high-return projects within our network Increased DEF loading capacity Carbon capture and sequestration Waggaman acquisition |
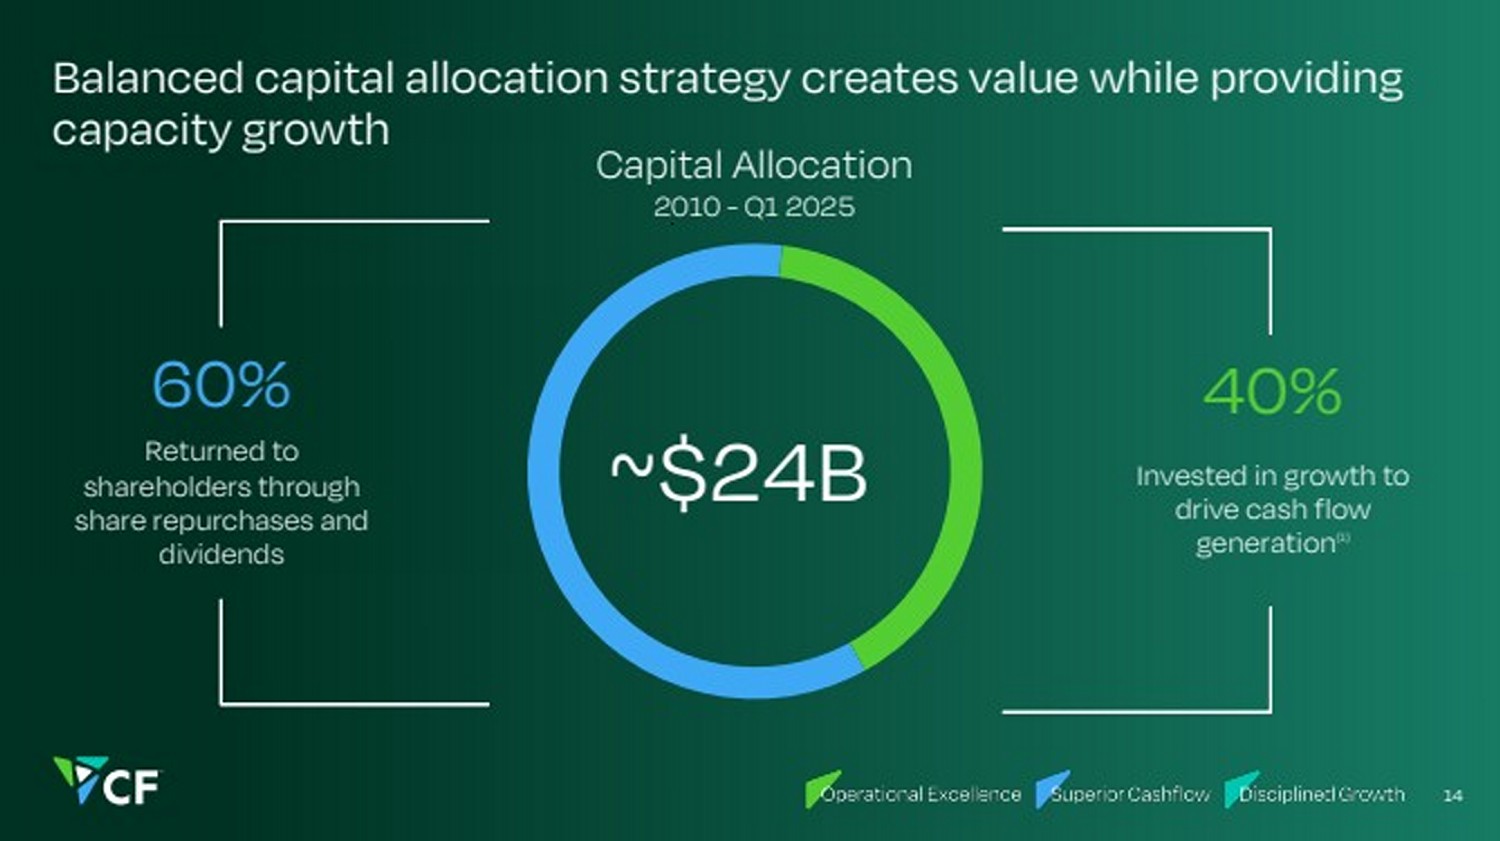
| Balanced capital allocation strategy creates value while providing capacity growth 14 Returned to shareholders through share repurchases and dividends 60% Invested in growth to drive cash flow generation(1) 40% Capital Allocation 2010 - Q1 2025 ~$24B |
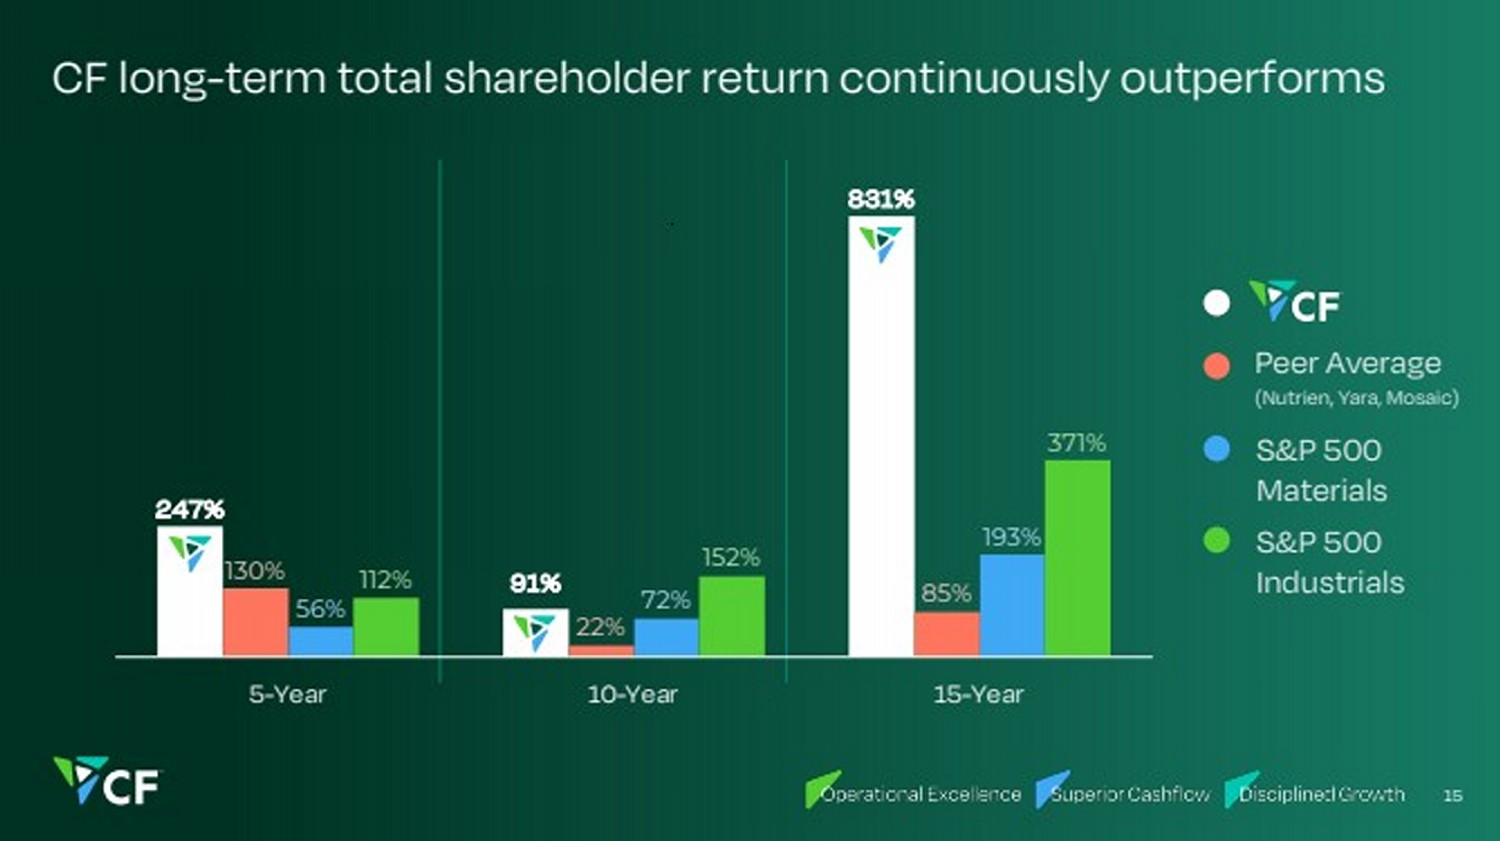
| CF long-term total shareholder return continuously outperforms 247% 91% 831% 130% 22% 85% 56% 72% 193% 112% 152% 371% 5-Year 10-Year 15-Year S&P 500 Materials S&P 500 Industrials 15 Peer Average (Nutrien, Yara, Mosaic) |
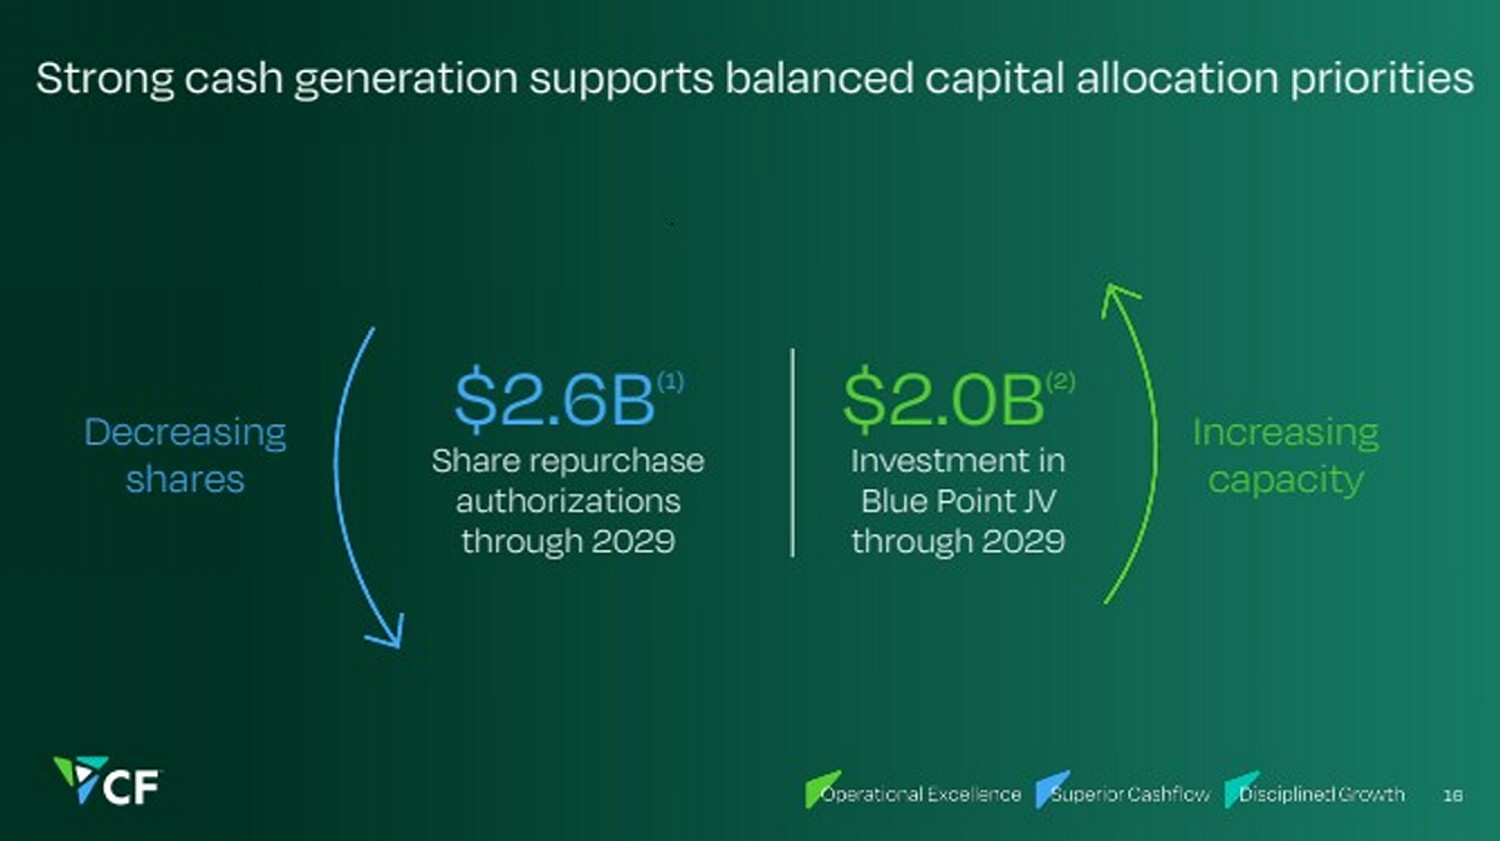
| Strong cash generation supports balanced capital allocation priorities Investment in Blue Point JV through 2029 $2.0B(2) Share repurchase authorizations through 2029 $2.6B(1) Increasing capacity Decreasing shares 16 |
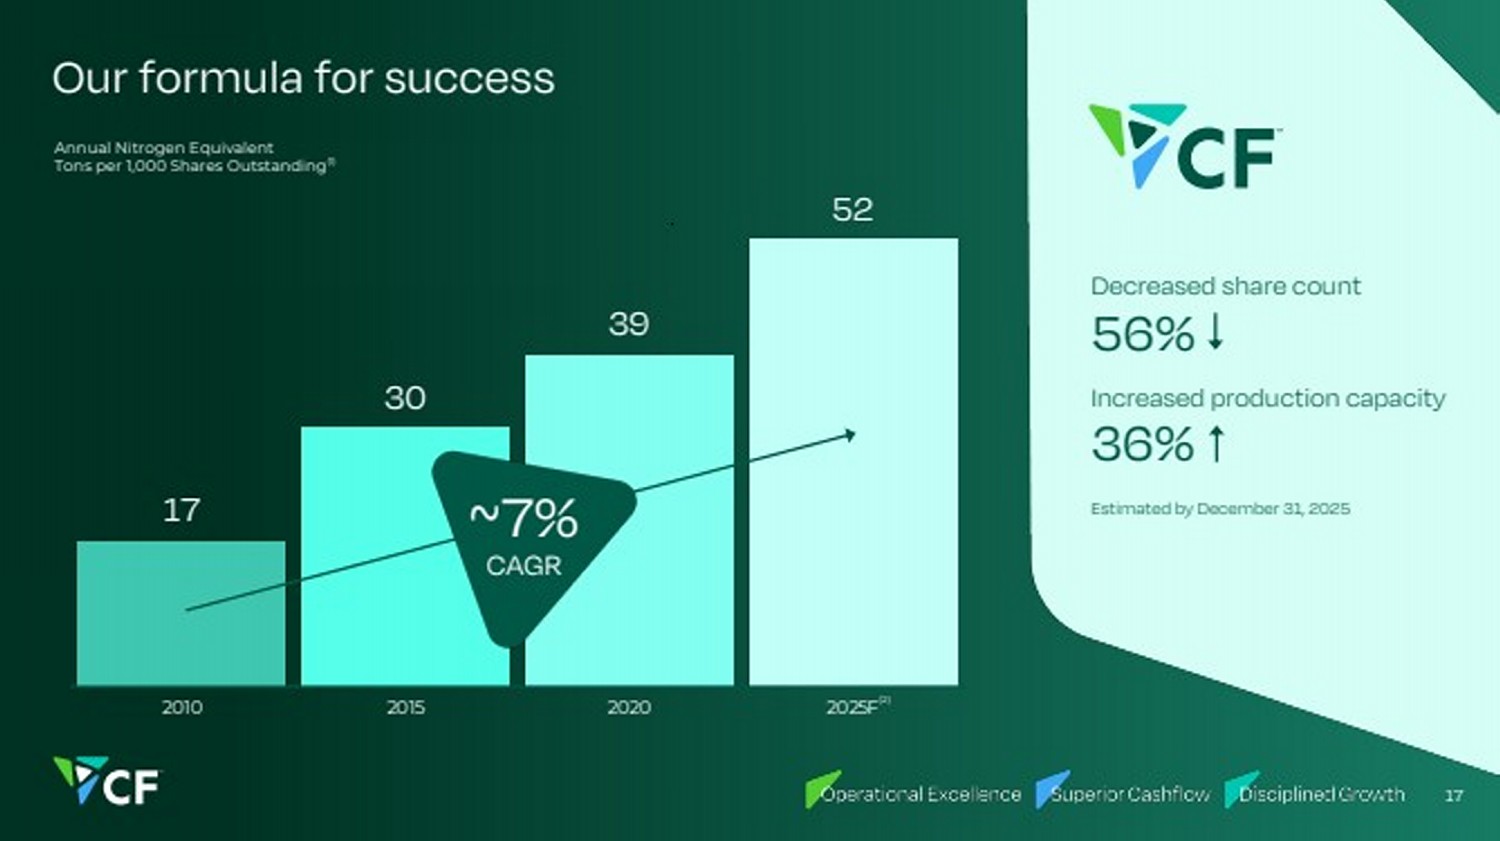
| 17 30 39 52 2010 2015 2020 2025F CAGR ~7% 17 Decreased share count 56% Increased production capacity 36% Estimated by December 31, 2025 Our formula for success Annual Nitrogen Equivalent Tons per 1,000 Shares Outstanding(1) (2) |
| Sustainable Competitive Advantages Bert Frost EVP, Sales, Market Development and Supply Chain 18 |
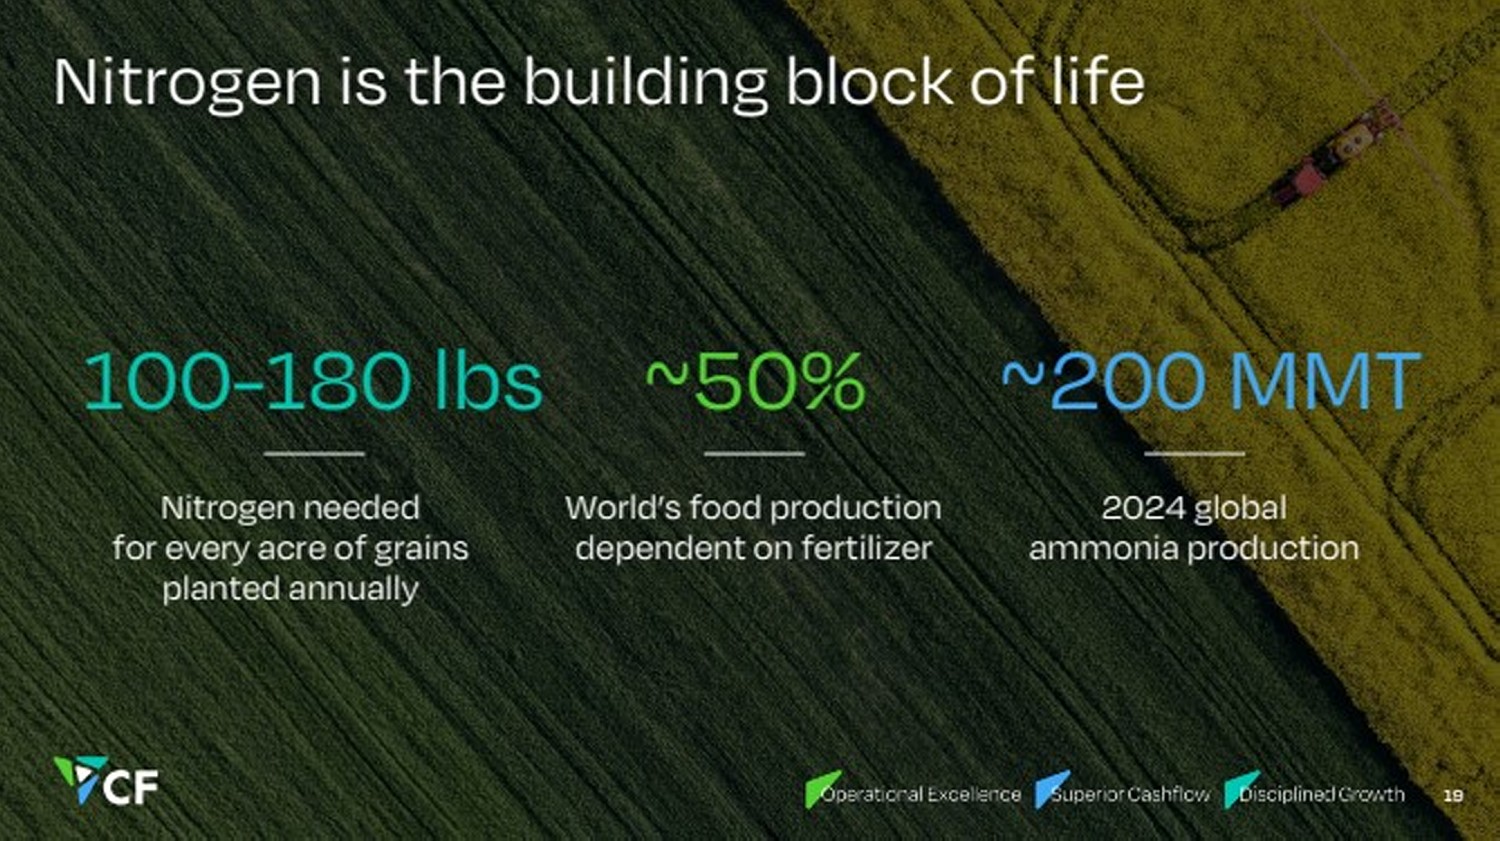
| Nitrogen is the building block of life Nitrogen needed for every acre of grains planted annually World’s food production dependent on fertilizer 2024 global ammonia production 100-180 lbs ~50% ~200 MMT 19 |
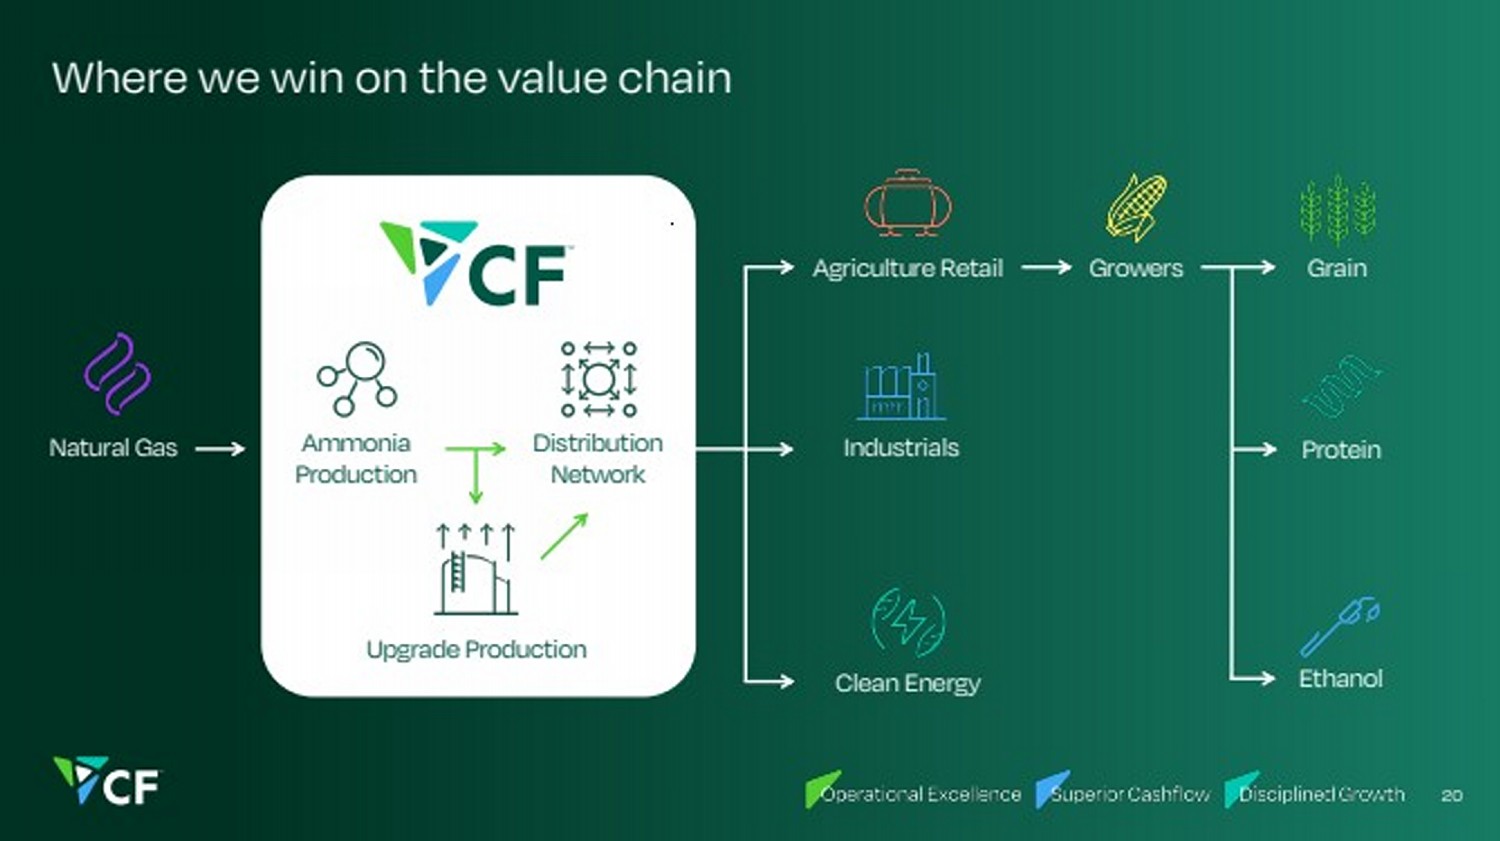
| Where we win on the value chain 20 Ammonia Production Natural Gas Distribution Network Industrials Agriculture Retail Clean Energy Growers Upgrade Production Grain Protein Ethanol |
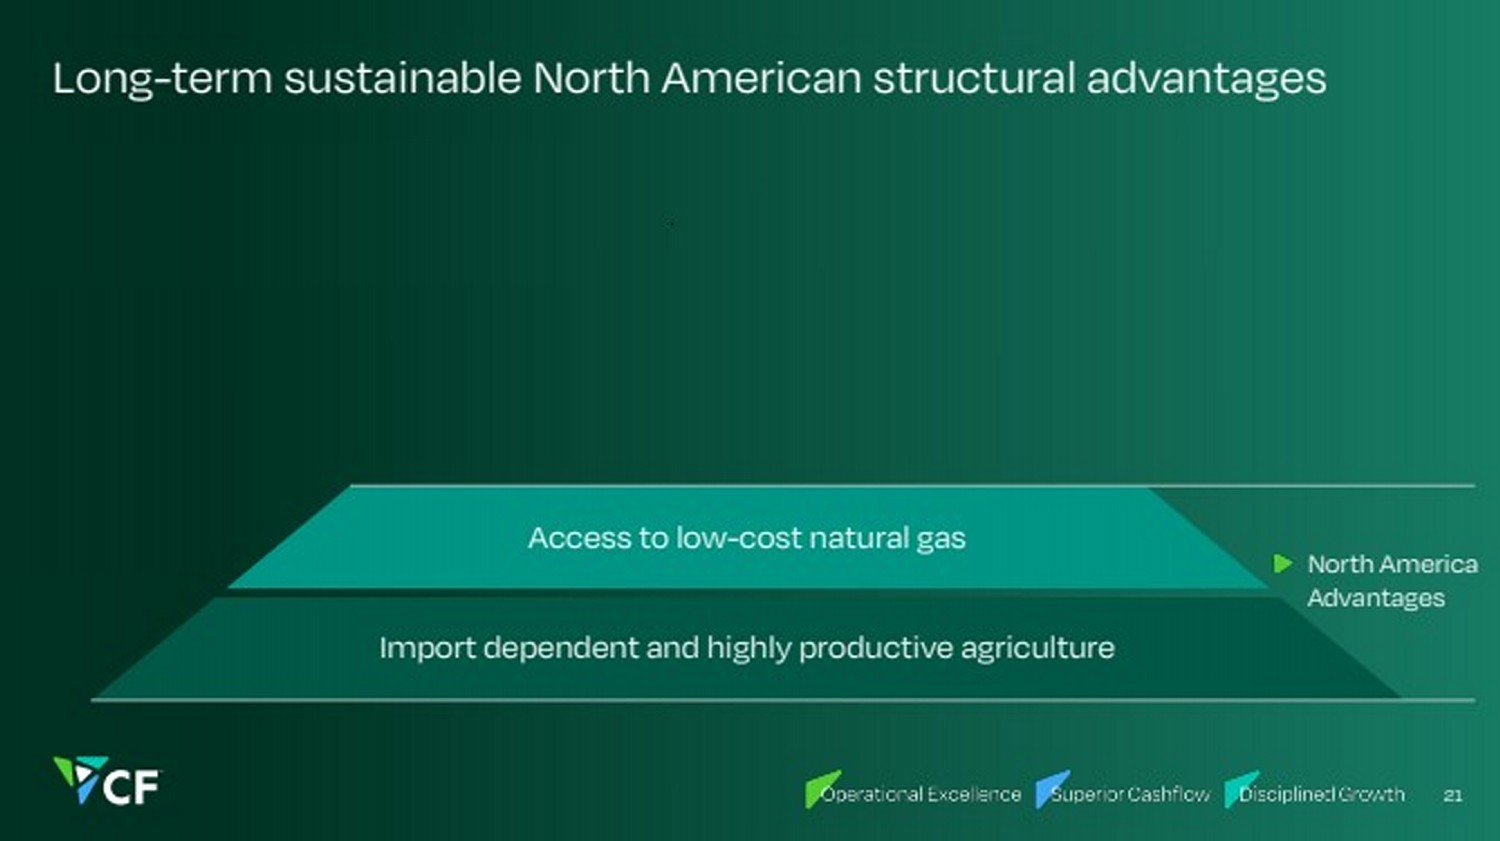
| Long-term sustainable North American structural advantages Import dependent and highly productive agriculture Access to low-cost natural gas 21 North America Advantages |
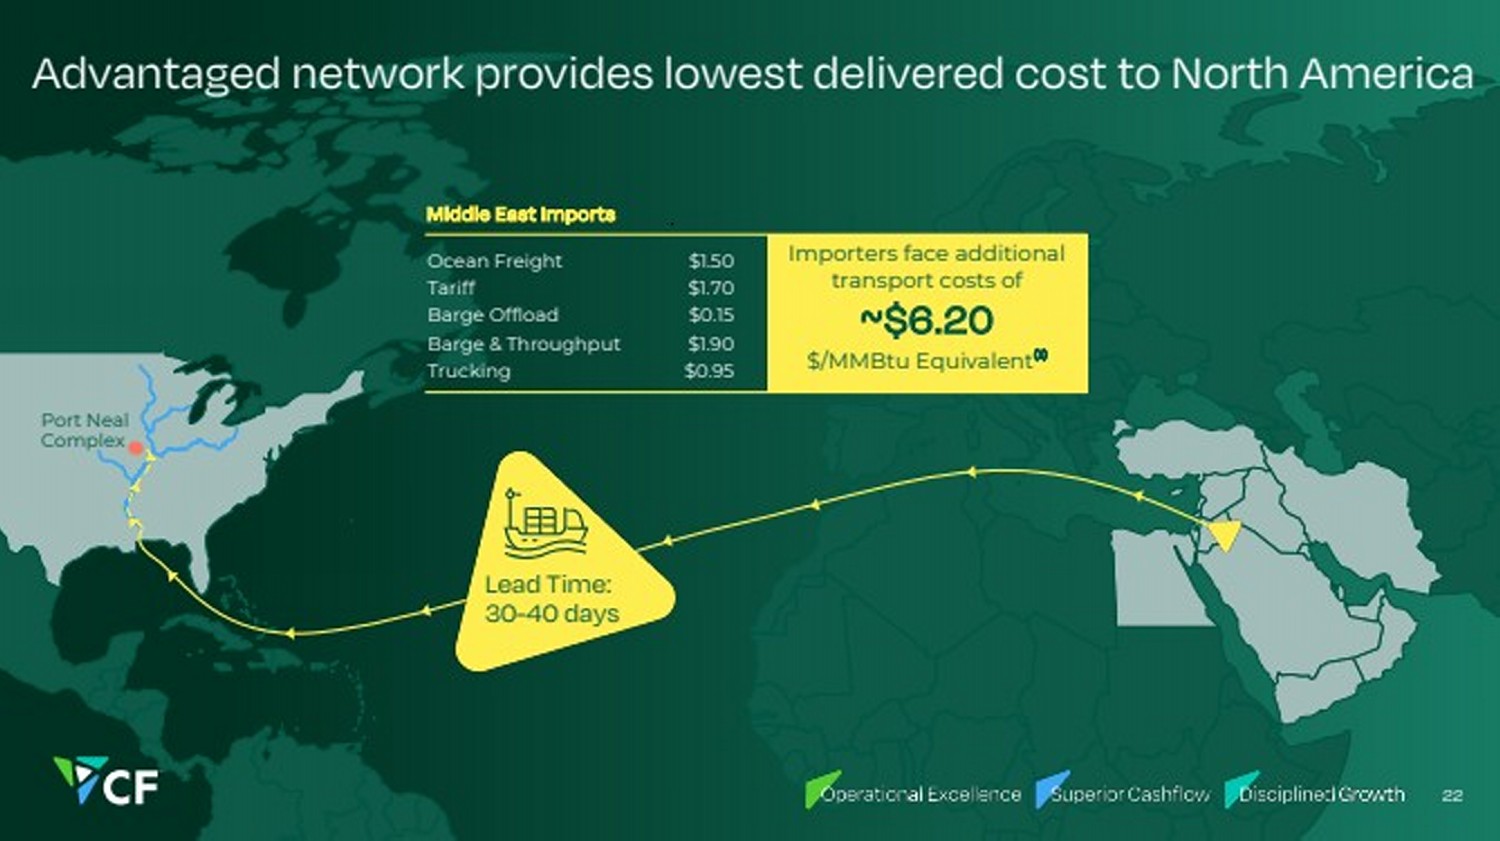
| Advantaged network provides lowest delivered cost to North America 22 Middle East Imports Ocean Freight $1.50 Tariff $1.70 Barge Offload $0.15 Barge & Throughput $1.90 Trucking $0.95 Importers face additional transport costs of ~$6.20 $/MMBtu Equivalent(1) Lead Time: 30-40 days Port Neal Complex |
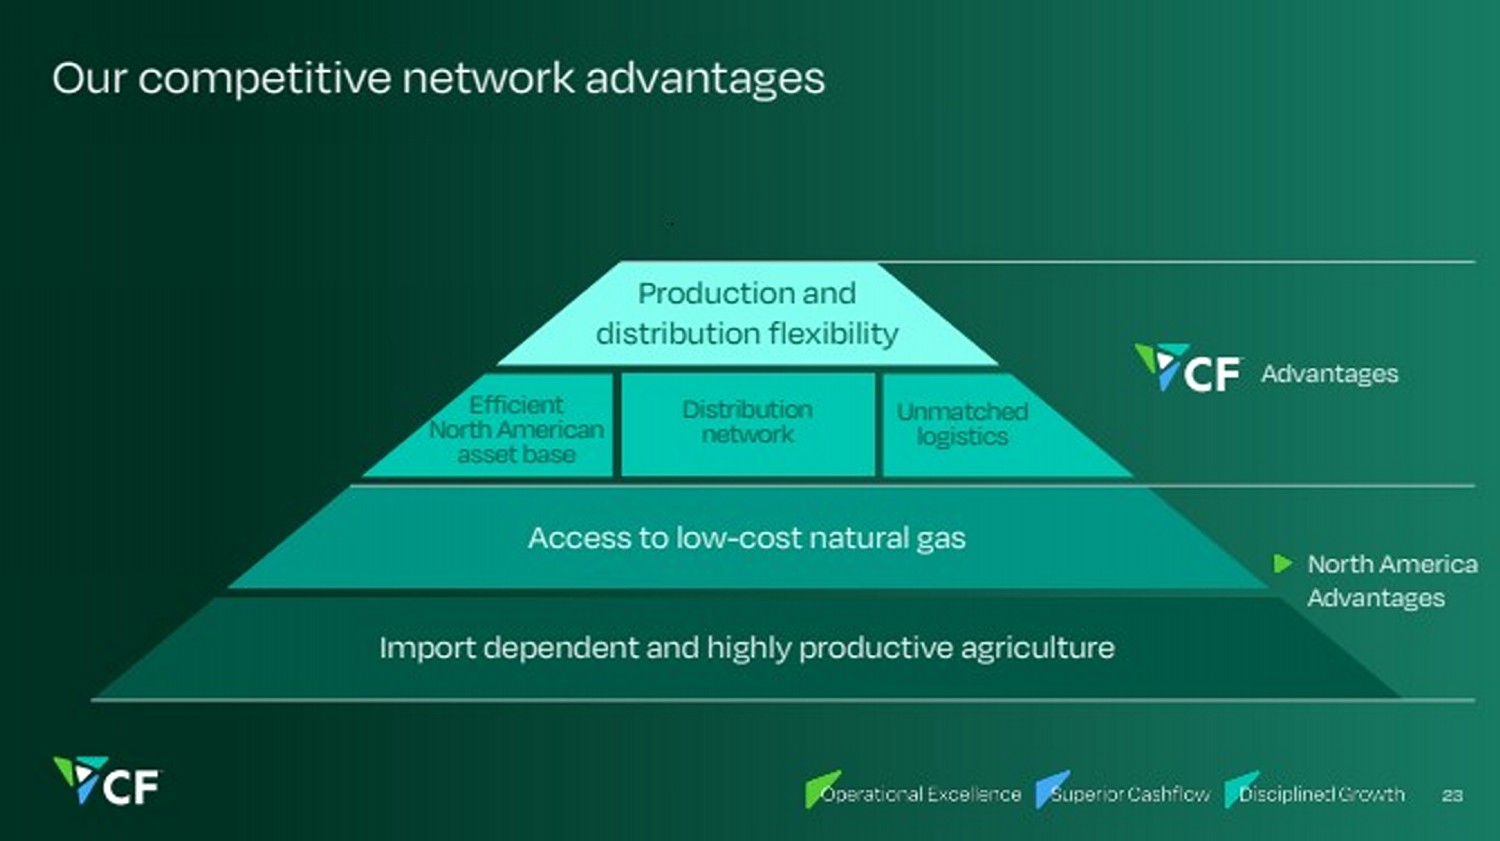
| Our competitive network advantages Import dependent and highly productive agriculture Access to low-cost natural gas Production and distribution flexibility Distribution network 23 Unmatched logistics Advantages North America Advantages Efficient North American asset base |
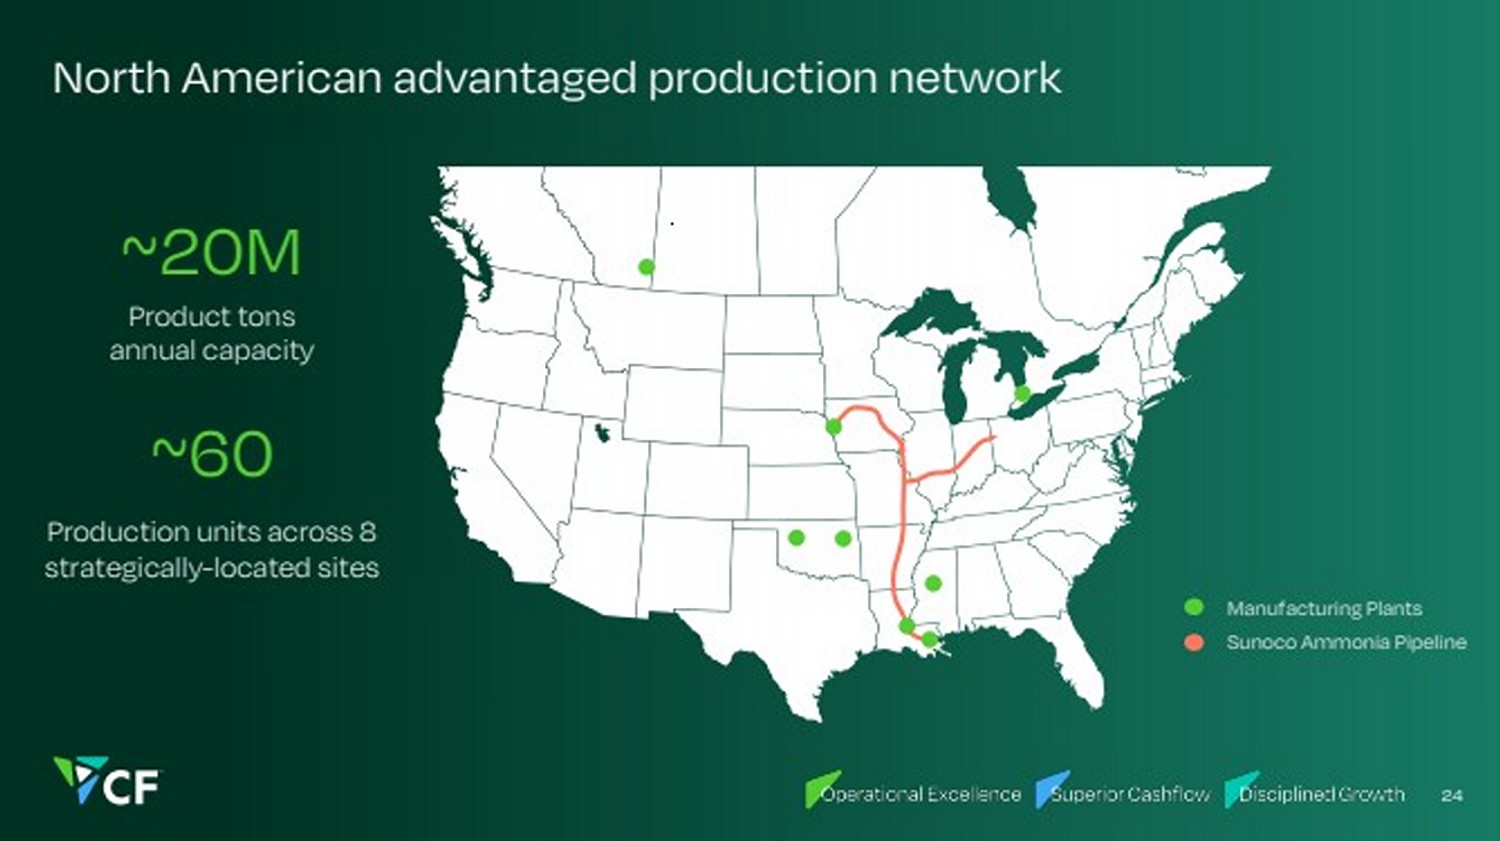
| Product tons annual capacity ~20M Production units across 8 strategically-located sites ~60 24 North American advantaged production network Manufacturing Plants Sunoco Ammonia Pipeline |
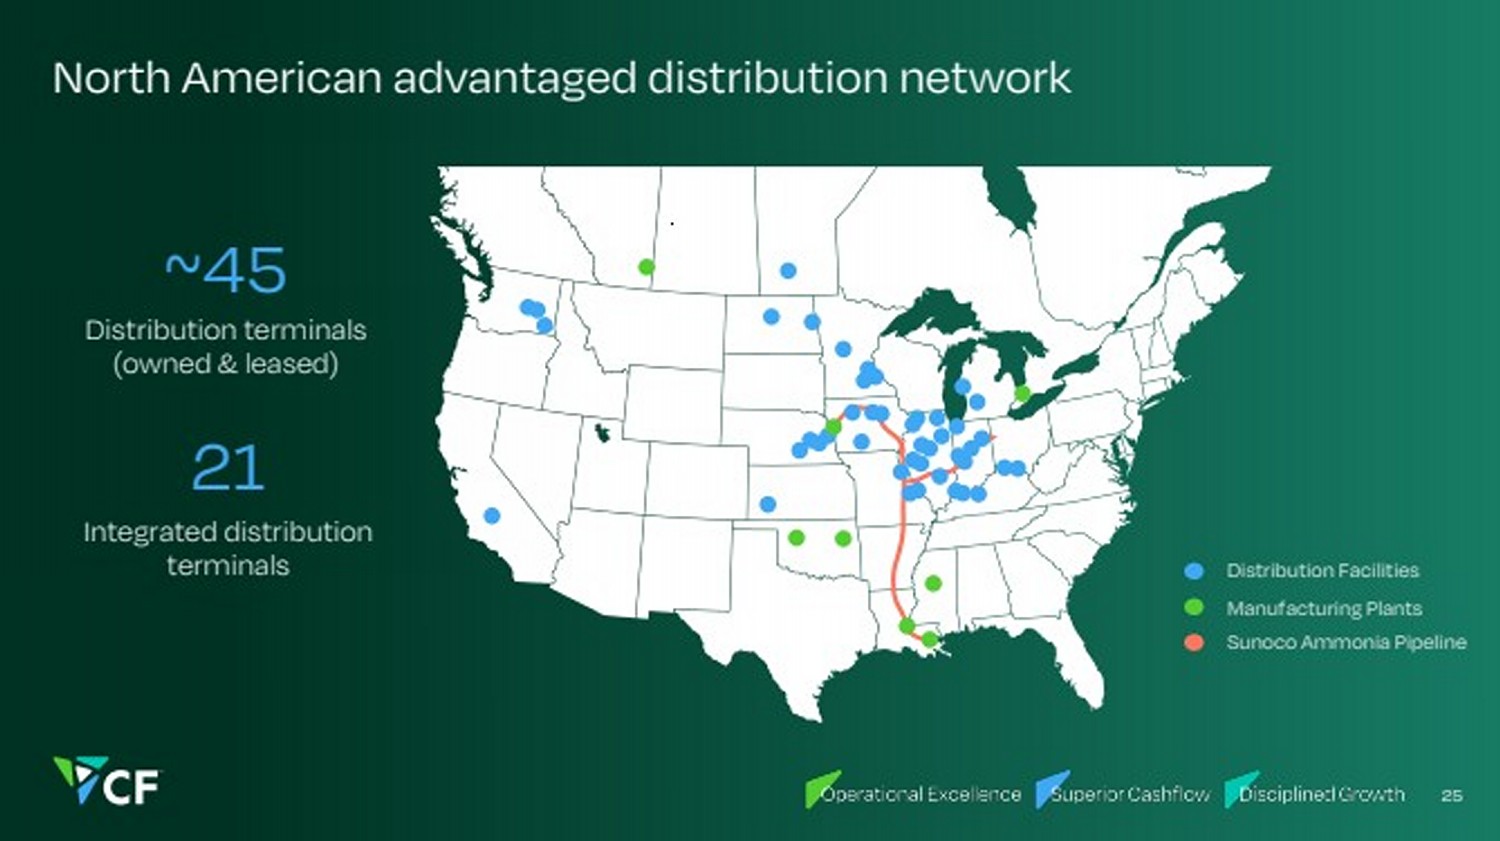
| North American advantaged distribution network 25 Distribution Facilities Manufacturing Plants Sunoco Ammonia Pipeline Integrated distribution terminals 21 Distribution terminals (owned & leased) ~45 |
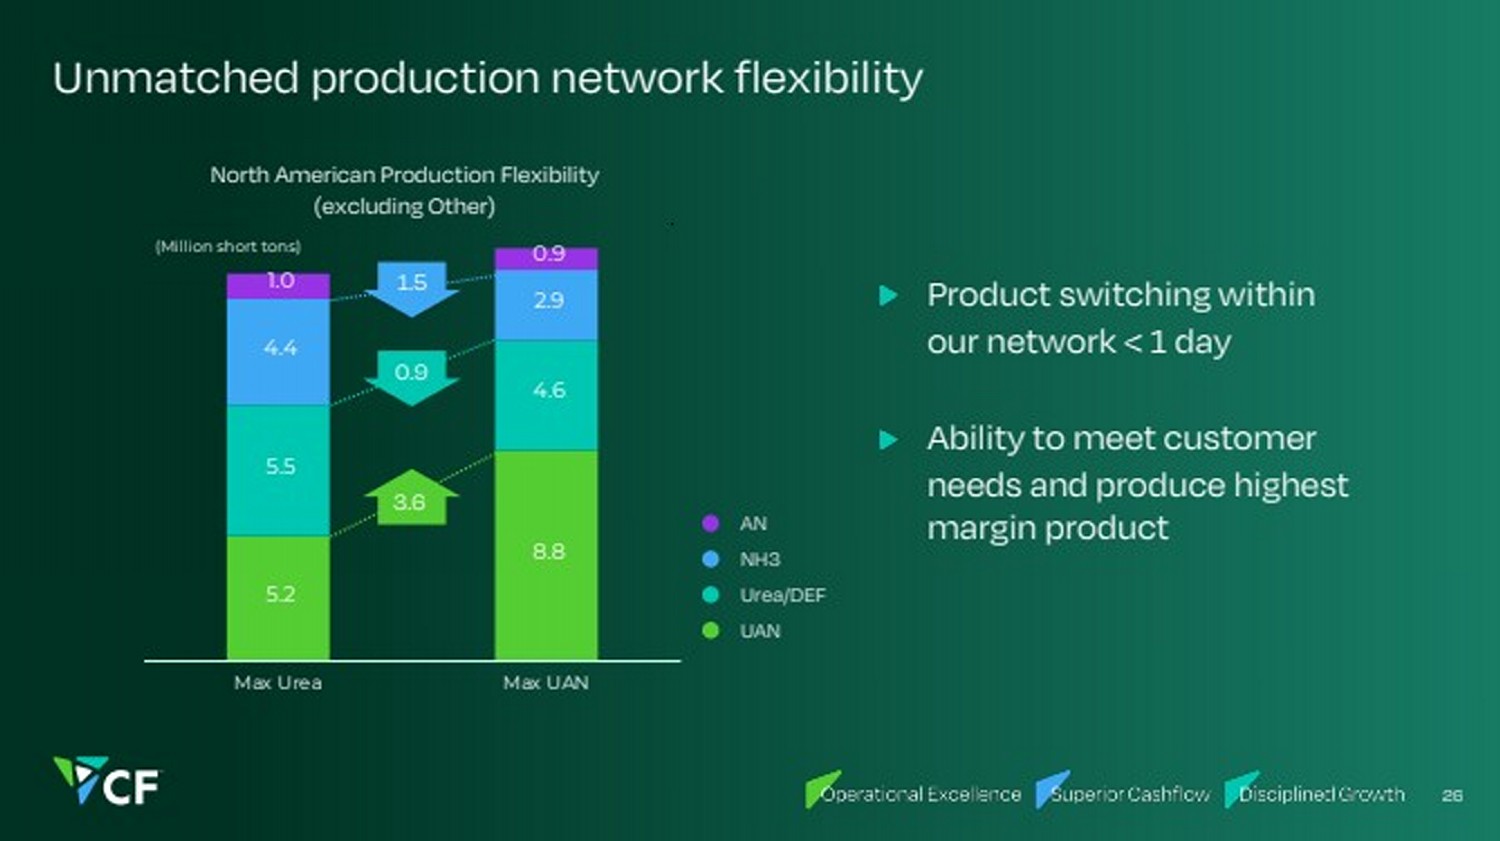
| 5.2 8.8 5.5 4.6 4.4 2.9 1.0 0.9 Max Urea Max UAN Unmatched production network flexibility Product switching within our network < 1 day Ability to meet customer needs and produce highest margin product North American Production Flexibility (excluding Other) AN NH3 Urea/DEF UAN 26 (Million short tons) 1.5 0.9 3.6 |
| Unmatched distribution network flexibility Pipe Barge Rail Truck Export Ammonia Urea UAN AN DEF CF Logistic Capabilities 27 Global Capabilities Export capabilities from: Donaldsonville, Verdigris, Yazoo City Exported to over 20 countries in 2024 |

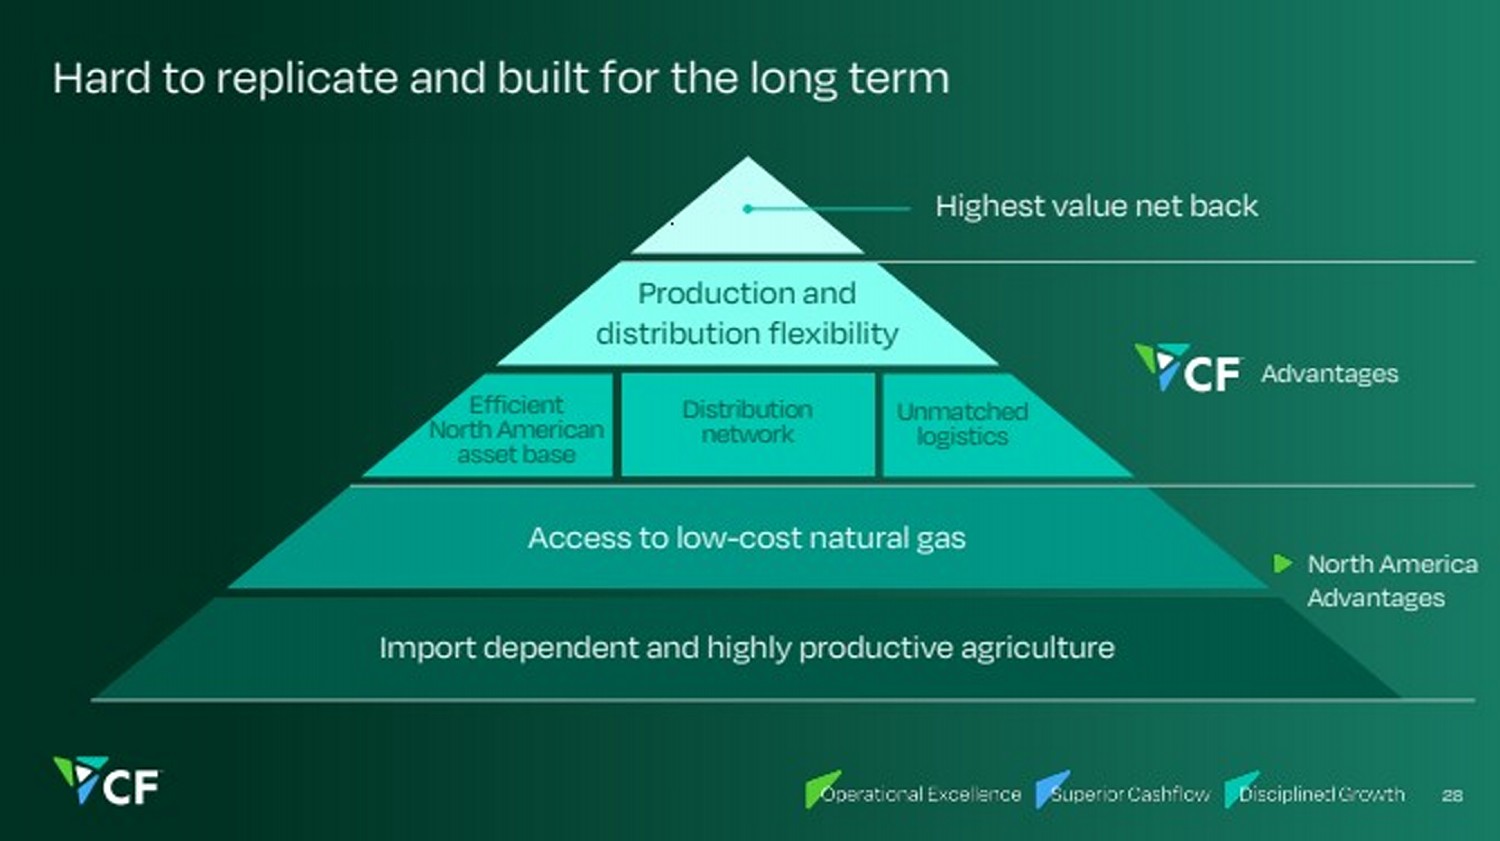
| Hard to replicate and built for the long term Import dependent and highly productive agriculture Access to low-cost natural gas Production and distribution flexibility Distribution network Highest value net back 28 Advantages North America Advantages Unmatched logistics Efficient North American asset base |
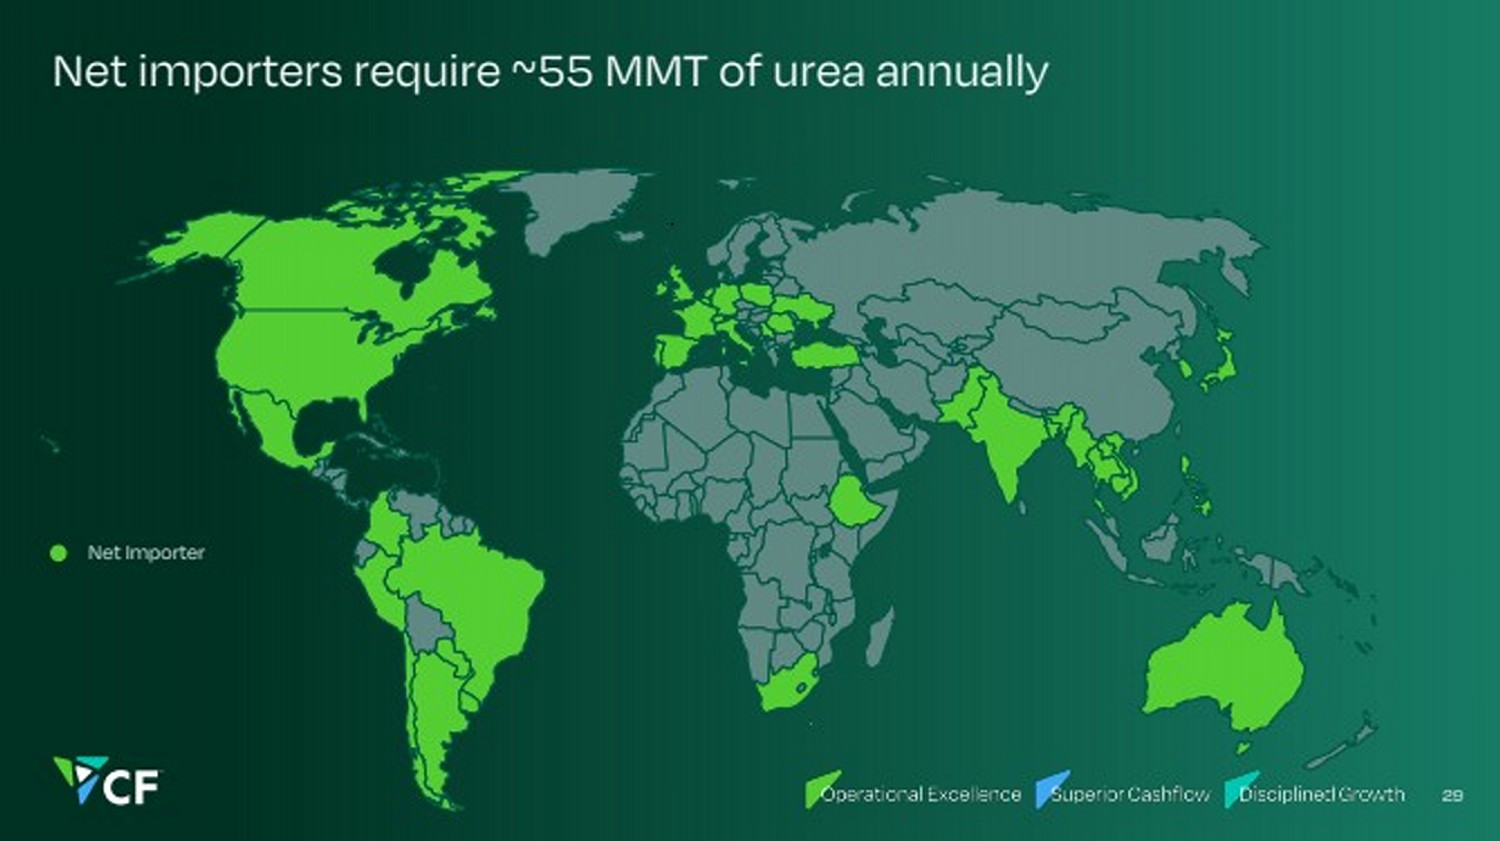
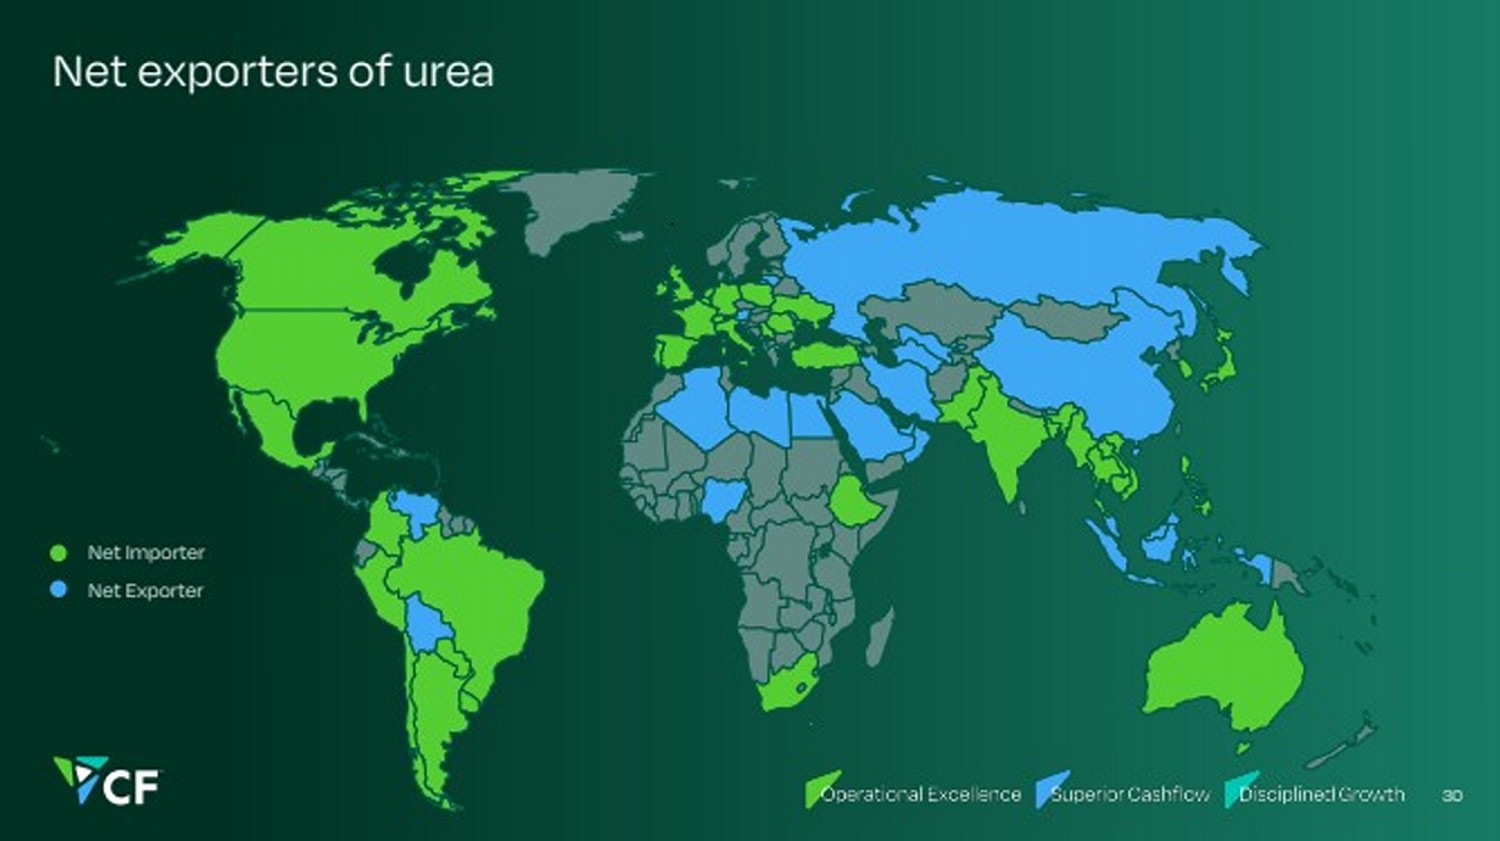
| Net importers require ~55 MMT of urea annually 29 Net Importer |
| Net exporters of urea 30 Net Importer Net Exporter |
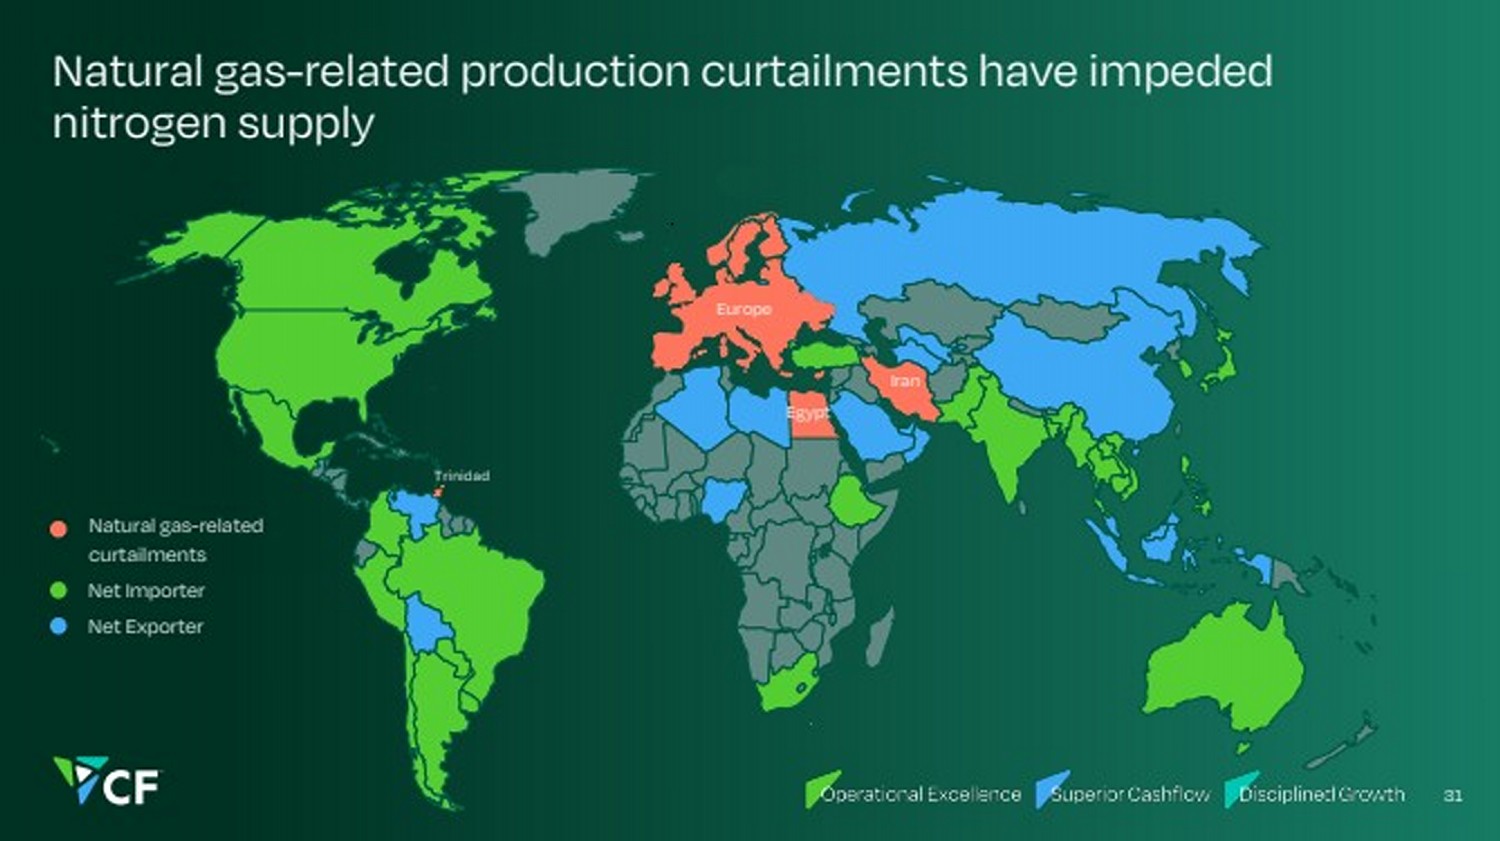
| Natural gas-related production curtailments have impeded nitrogen supply 31 Net Importer Net Exporter Trinidad Egypt Iran Europe Natural gas-related curtailments |
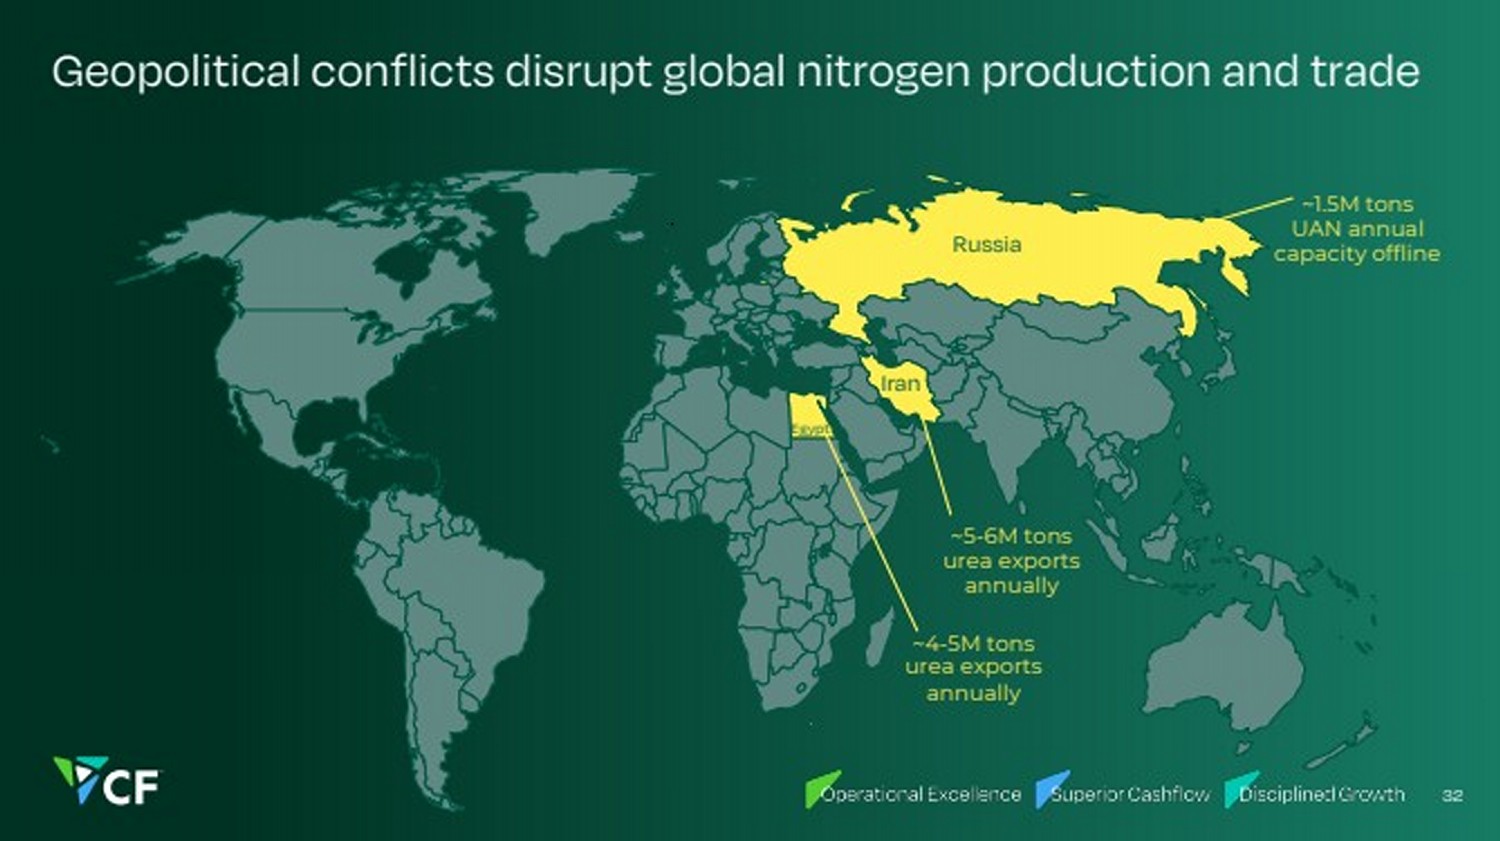
| Geopolitical conflicts disrupt global nitrogen production and trade 32 Egypt Iran Russia ~5-6M tons urea exports annually ~1.5M tons UAN annual capacity offline ~4-5M tons urea exports annually |
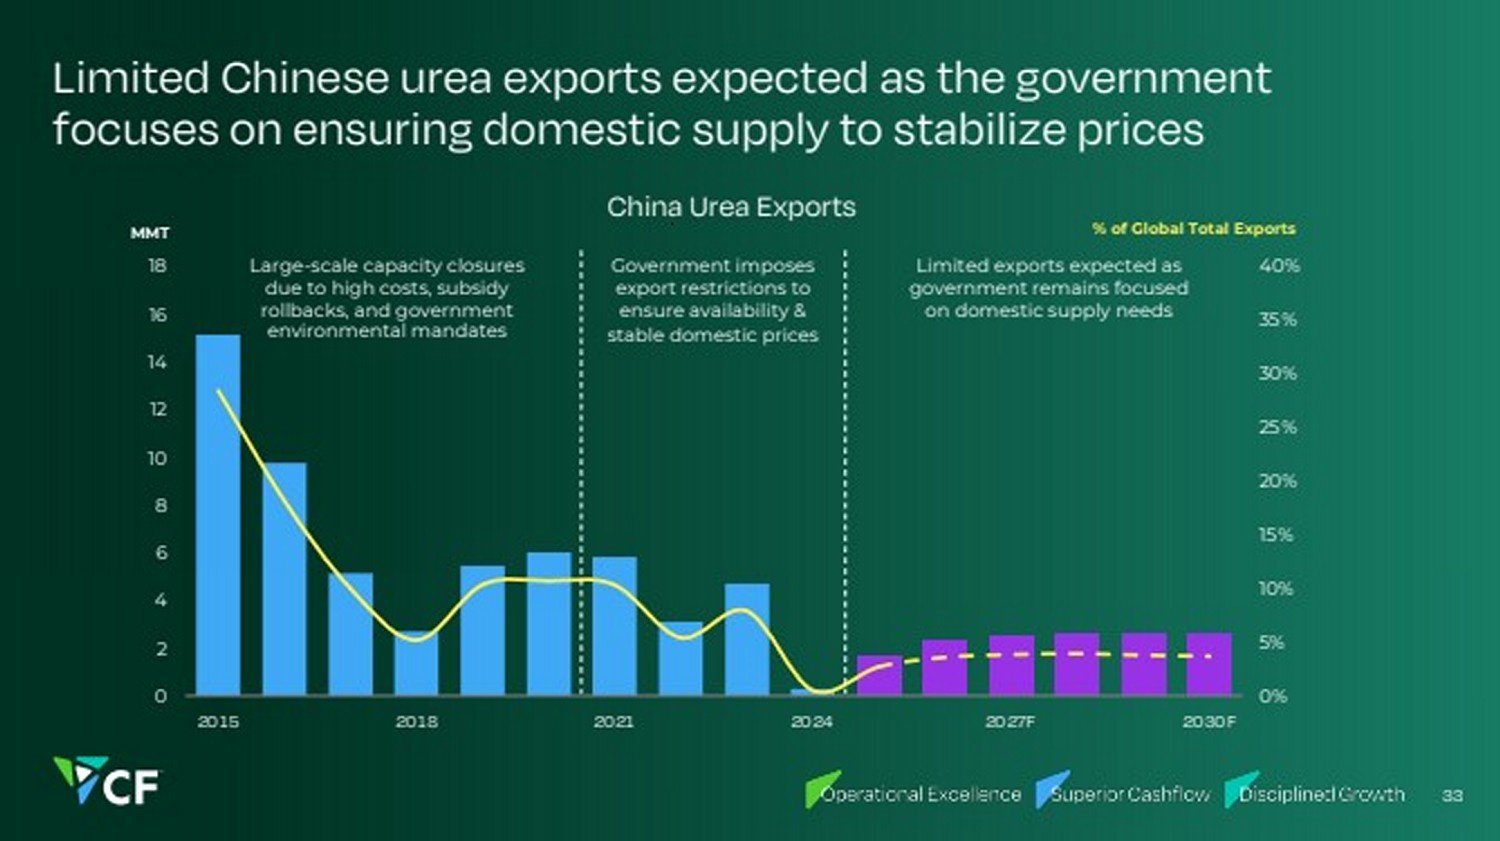
| Limited Chinese urea exports expected as the government focuses on ensuring domestic supply to stabilize prices China Urea Exports 0% 5% 10% 15% 20% 25% 30% 35% 40% 0 2 4 6 8 10 12 14 16 18 20 15 20 18 20 21 20 24 20 27F 20 30 F MMT % of Global Total Exports Large-scale capacity closures due to high costs, subsidy rollbacks, and government environmental mandates Limited exports expected as government remains focused on domestic supply needs Government imposes export restrictions to ensure availability & stable domestic prices 33 |
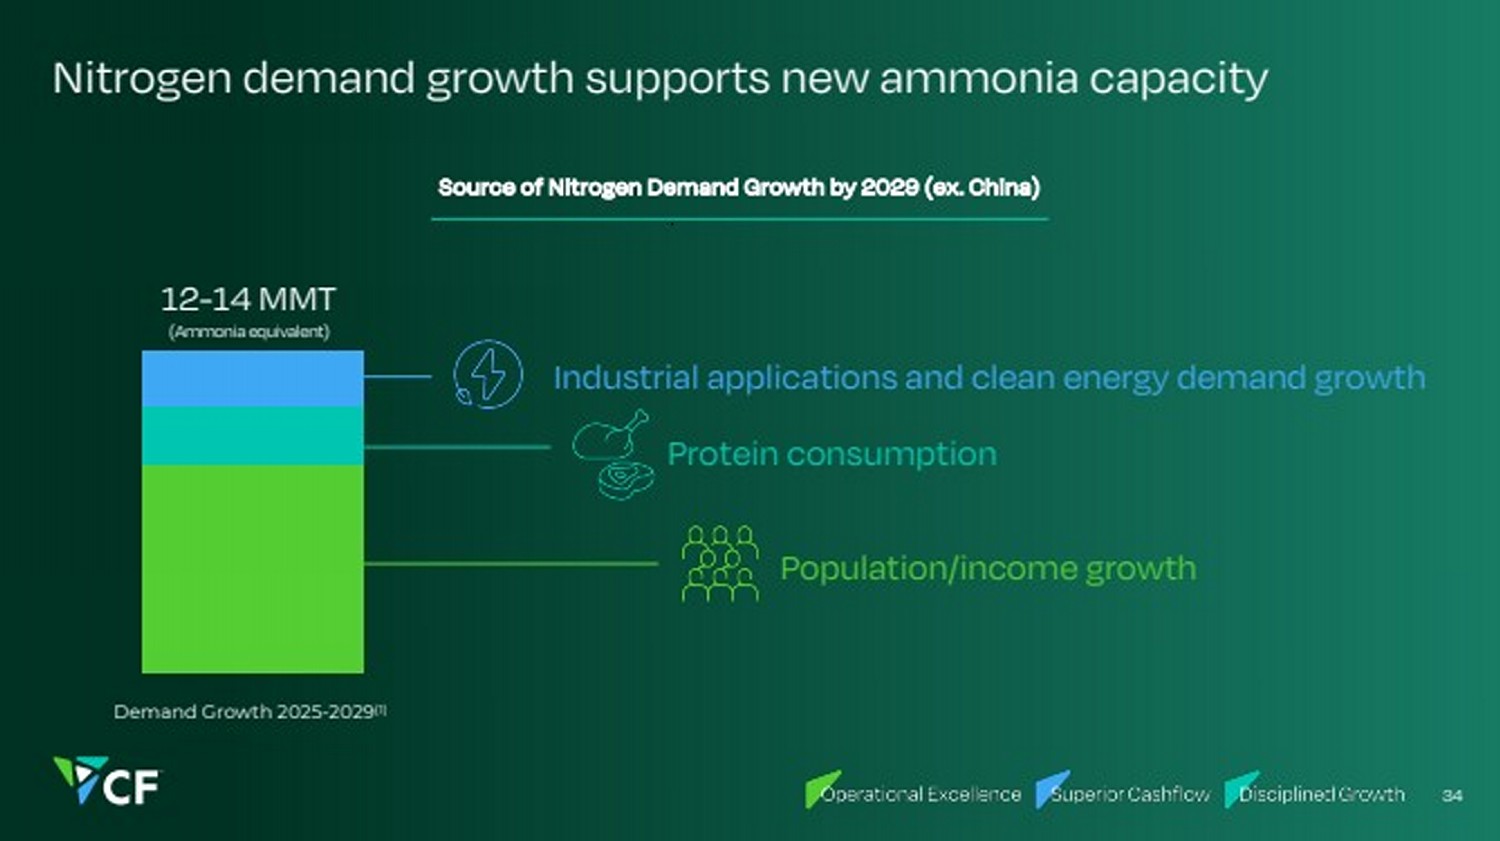
| Nitrogen demand growth supports new ammonia capacity Source of Nitrogen Demand Growth by 2029 (ex. China) Demand Growth 2025-2029(1) 12-14 MMT Industrial applications and clean energy demand growth Population/income growth Protein consumption 34 (Ammonia equivalent) |
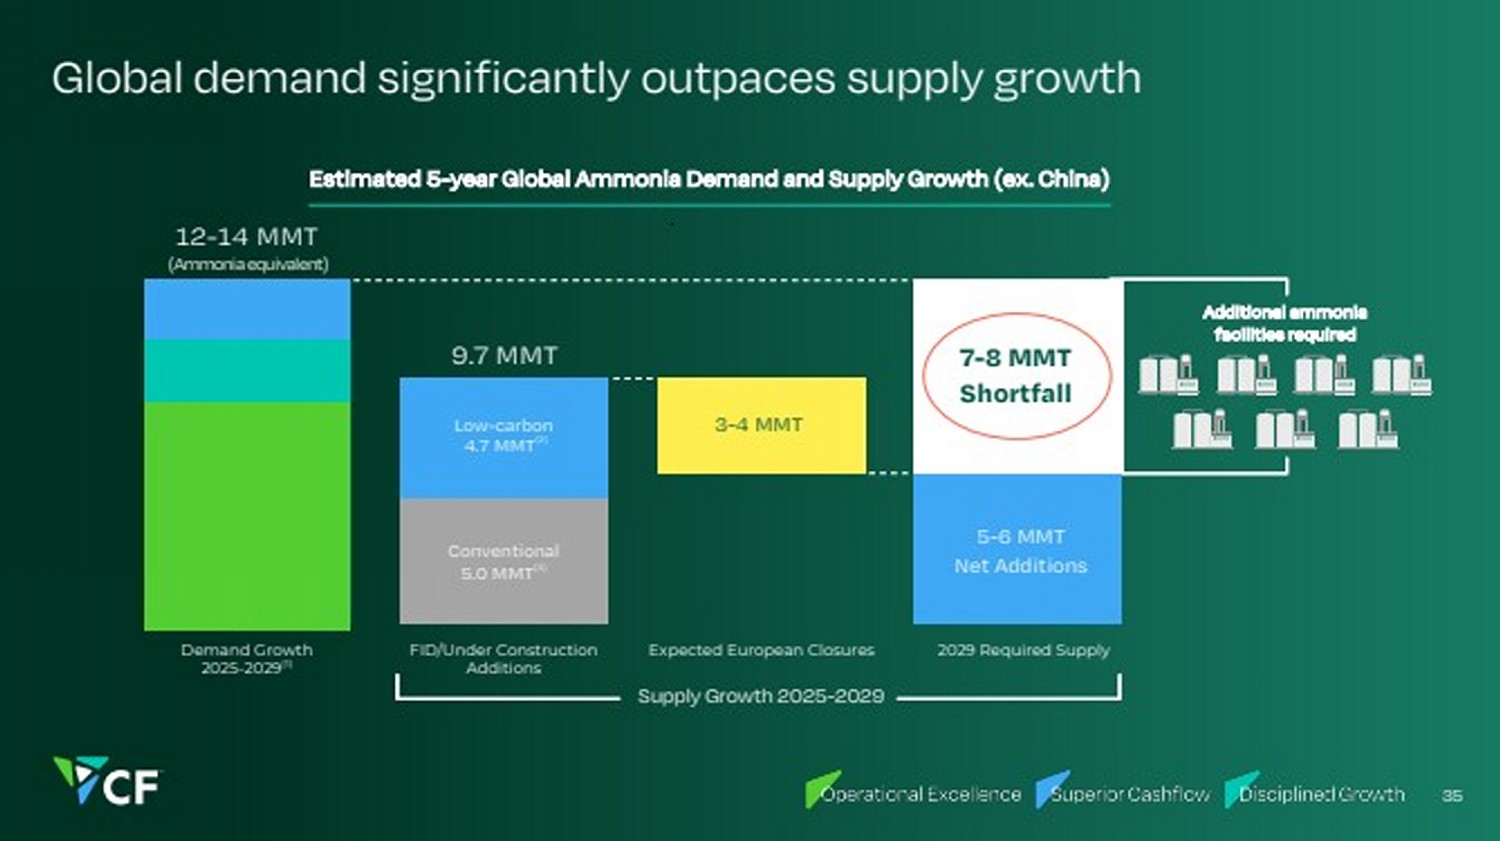
| Global demand significantly outpaces supply growth 35 Estimated 5-year Global Ammonia Demand and Supply Growth (ex. China) 3-4 MMT 5-6 MMT Net Additions 12-14 MMT Supply Growth 2025-2029 Expected European Closures 7-8 MMT Shortfall Additional ammonia facilities required FID/Under Construction Additions 2029 Required Supply 9.7 MMT Low-carbon 4.7 MMT(2) Conventional 5.0 MMT(3) Demand Growth 2025-2029(1) (Ammonia equivalent) |
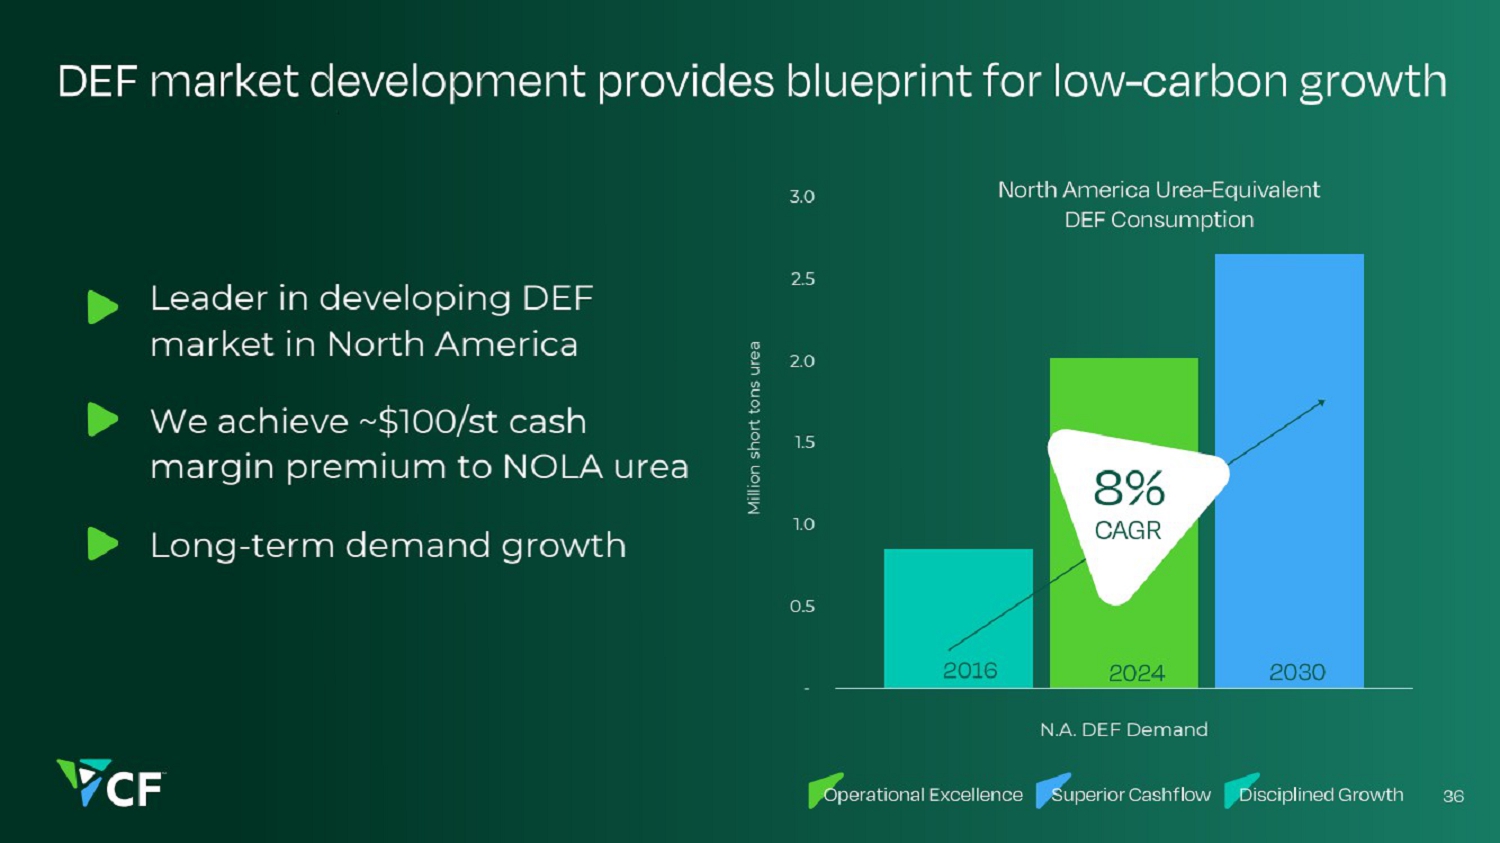
| DEF market development provides blueprint for low-carbon growth 36 Leader in developing DEF market in North America We achieve ~$100/st cash margin premium to NOLA urea Long-term demand growth North America Urea-Equivalent DEF Consumption Million short tons urea - 500 1,000 1,500 2,000 2,500 3,000 N.A. DEF Demand 2016 2024 2030 8% CAGR |
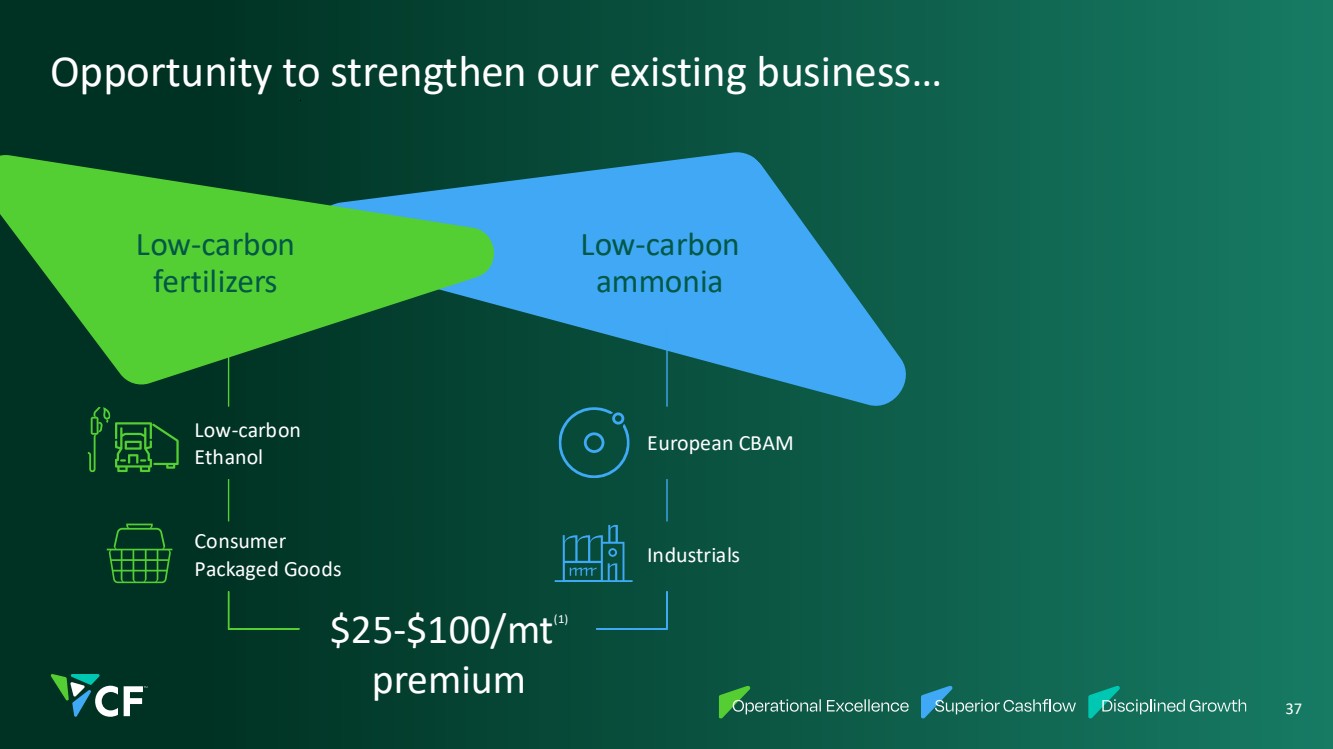
| Opportunity to strengthen our existing business… Low-carbon fertilizers Low-carbon ammonia 37 $25-$100/mt(1) Low-carbon Ethanol Consumer Packaged Goods European CBAM Industrials |
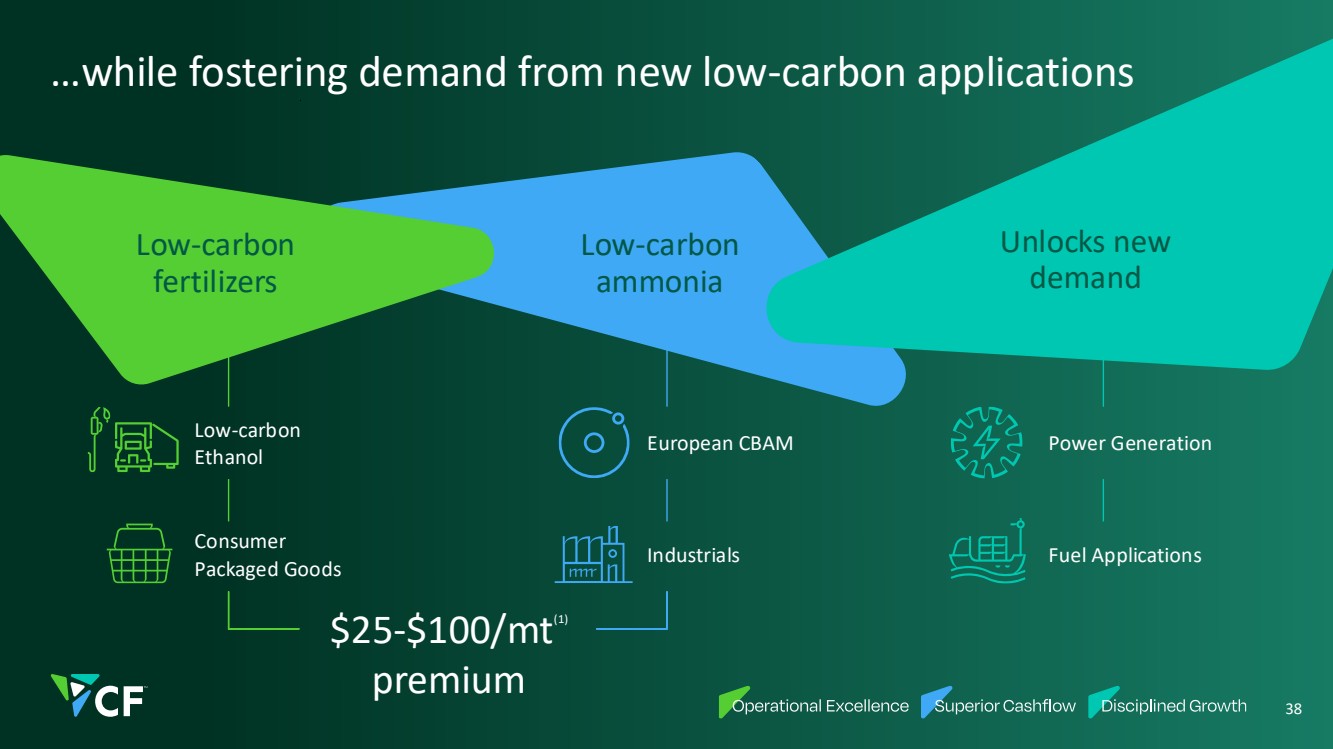
| …while fostering demand from new low-carbon applications $25-$100/mt(1) Low-carbon fertilizers Low-carbon ammonia Power Generation Fuel Applications 38 Unlocks new demand Low-carbon Ethanol Consumer Packaged Goods European CBAM Industrials |
| Uniquely Positioned for Growth Chris Bohn EVP and Chief Operating Officer 39 |

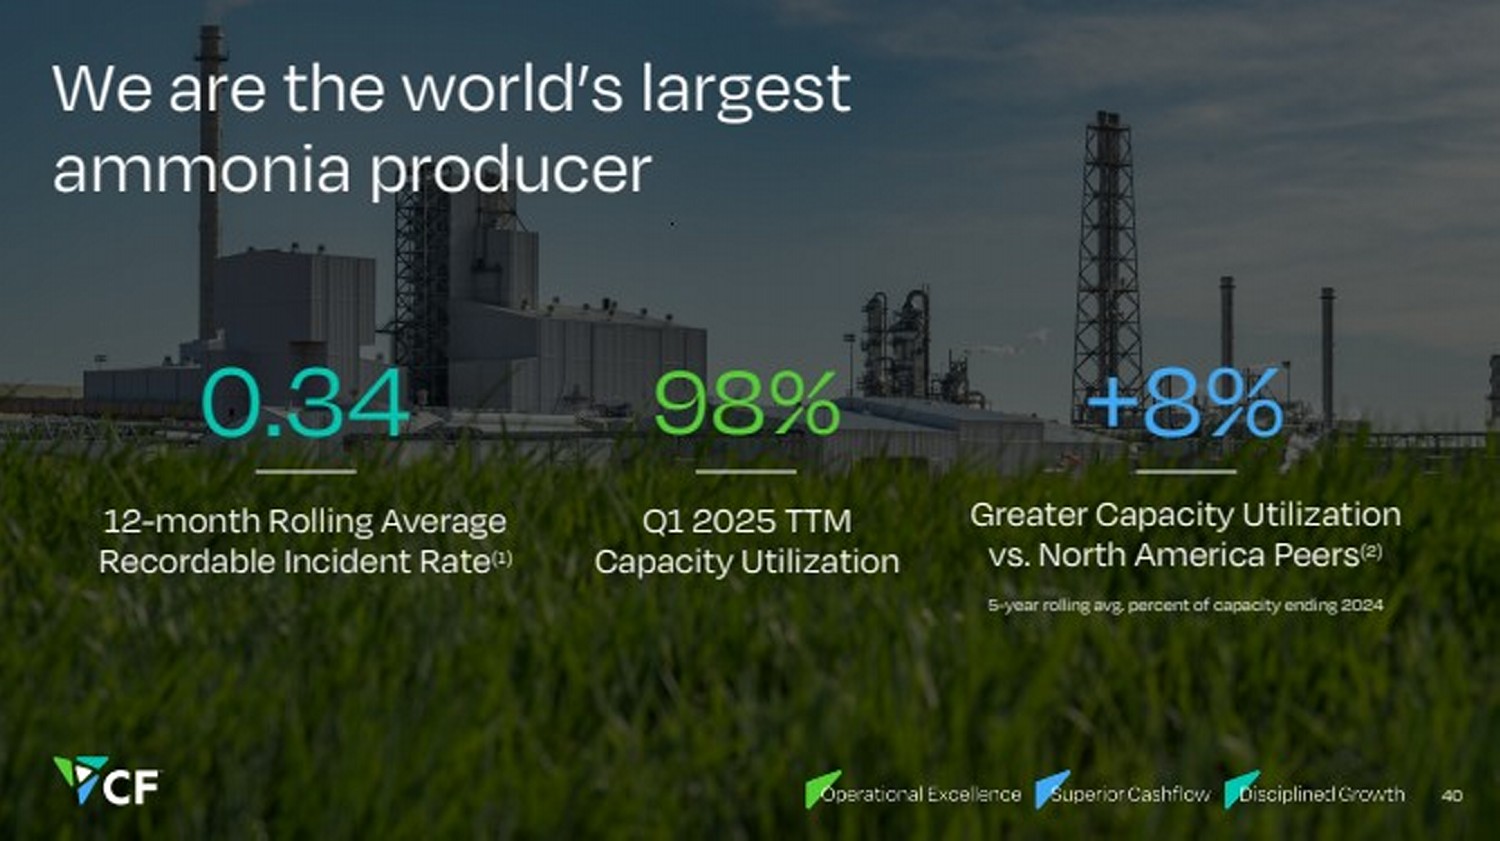
| We are the world’s largest ammonia producer 12-month Rolling Average Recordable Incident Rate(1) Q1 2025 TTM Capacity Utilization Greater Capacity Utilization vs. North America Peers(2) 5-year rolling avg. percent of capacity ending 2024 0.34 98% +8% 40 |
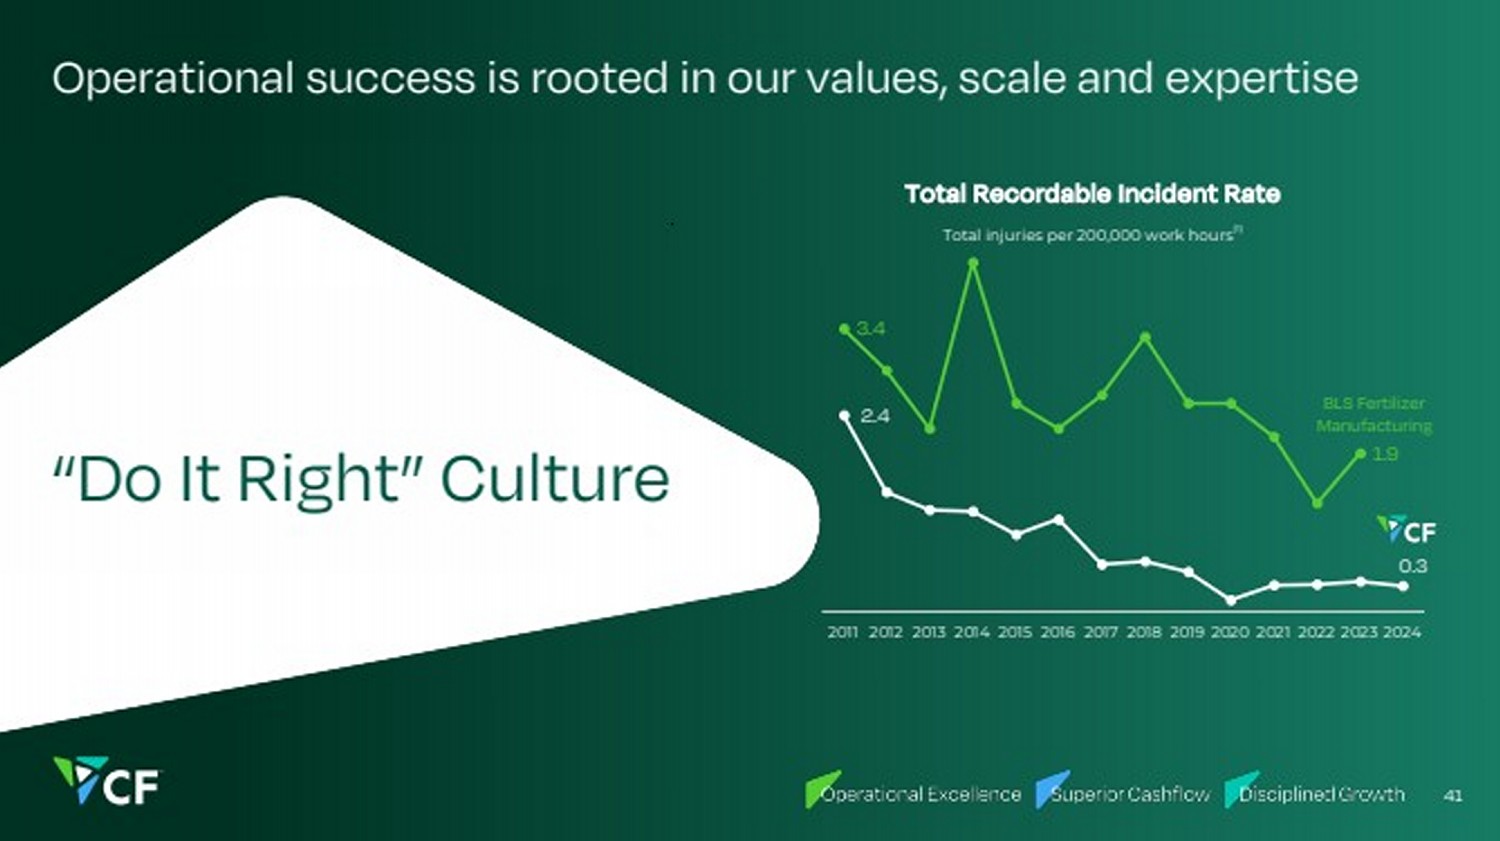
| Operational success is rooted in our values, scale and expertise 41 “Do It Right” Culture 2.4 0.3 3.4 1.9 2011 2012 2013 2014 2015 2016 2017 2018 2019 2020 2021 2022 2023 2024 Total injuries per 200,000 work hours(1) Total Recordable Incident Rate BLS Fertilizer Manufacturing |
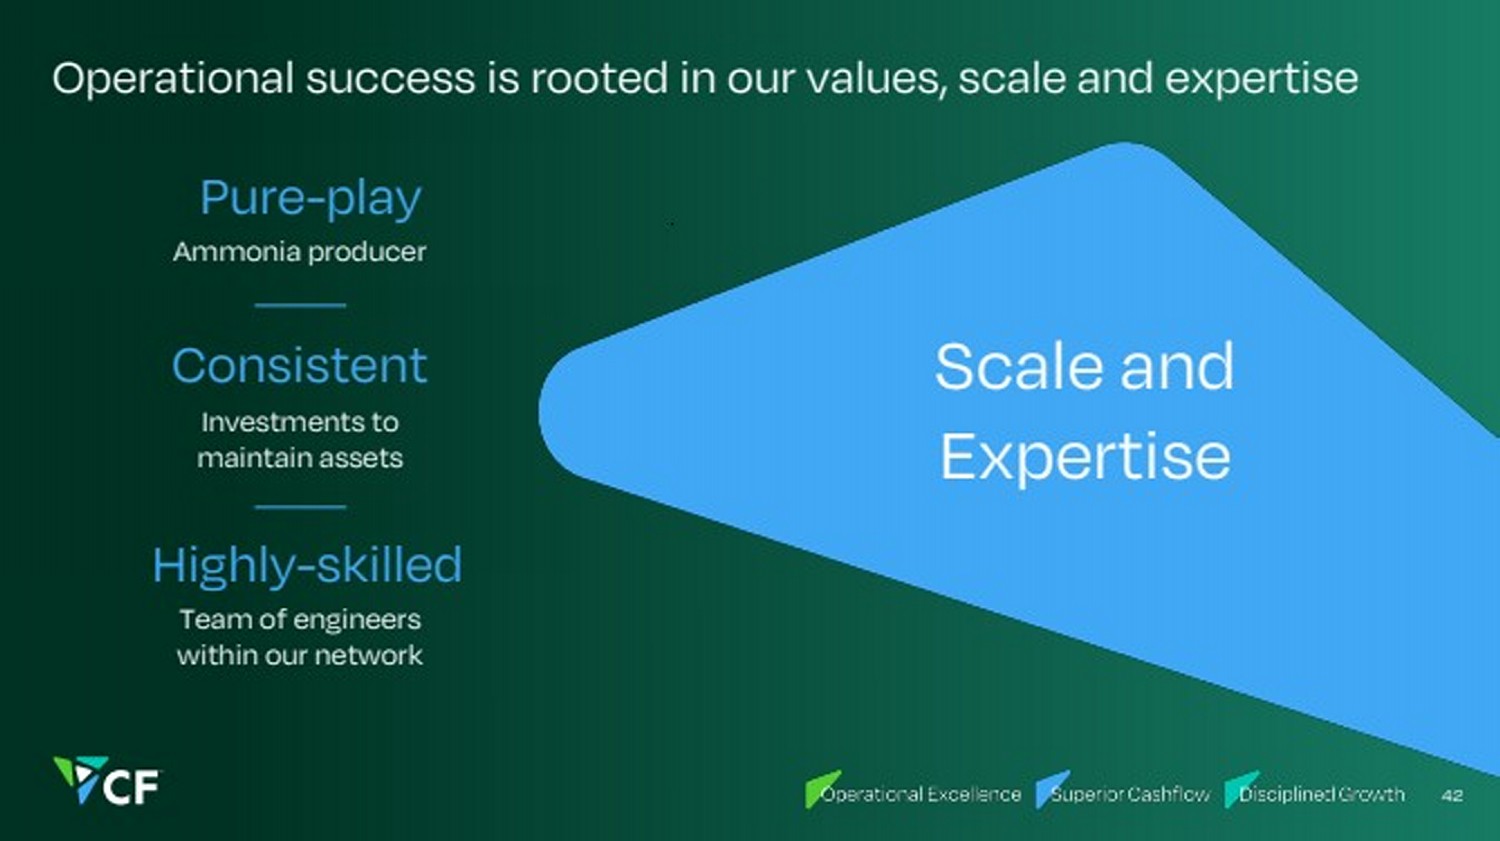
| 42 Scale and Expertise Team of engineers within our network Pure-play Ammonia producer Consistent Investments to maintain assets Highly-skilled Operational success is rooted in our values, scale and expertise |
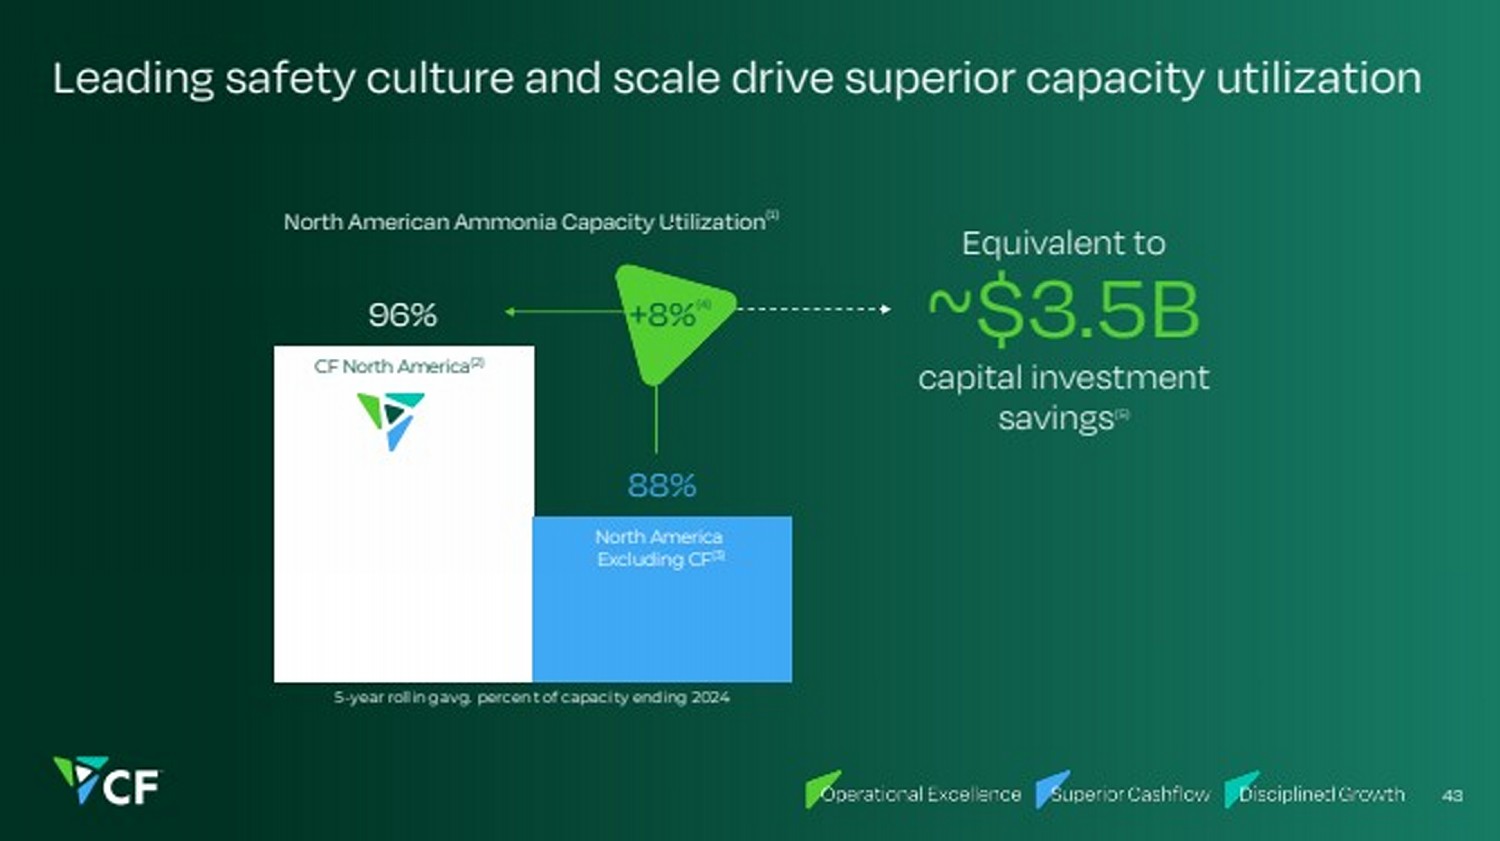
| Leading safety culture and scale drive superior capacity utilization 96% 88% 5-year rolling avg. percent of capacity ending 2024 CF North America(2) North America Excluding CF(3) +8%(4) North American Ammonia Capacity Utilization(1) Equivalent to ~$3.5B capital investment savings(5) 43 |
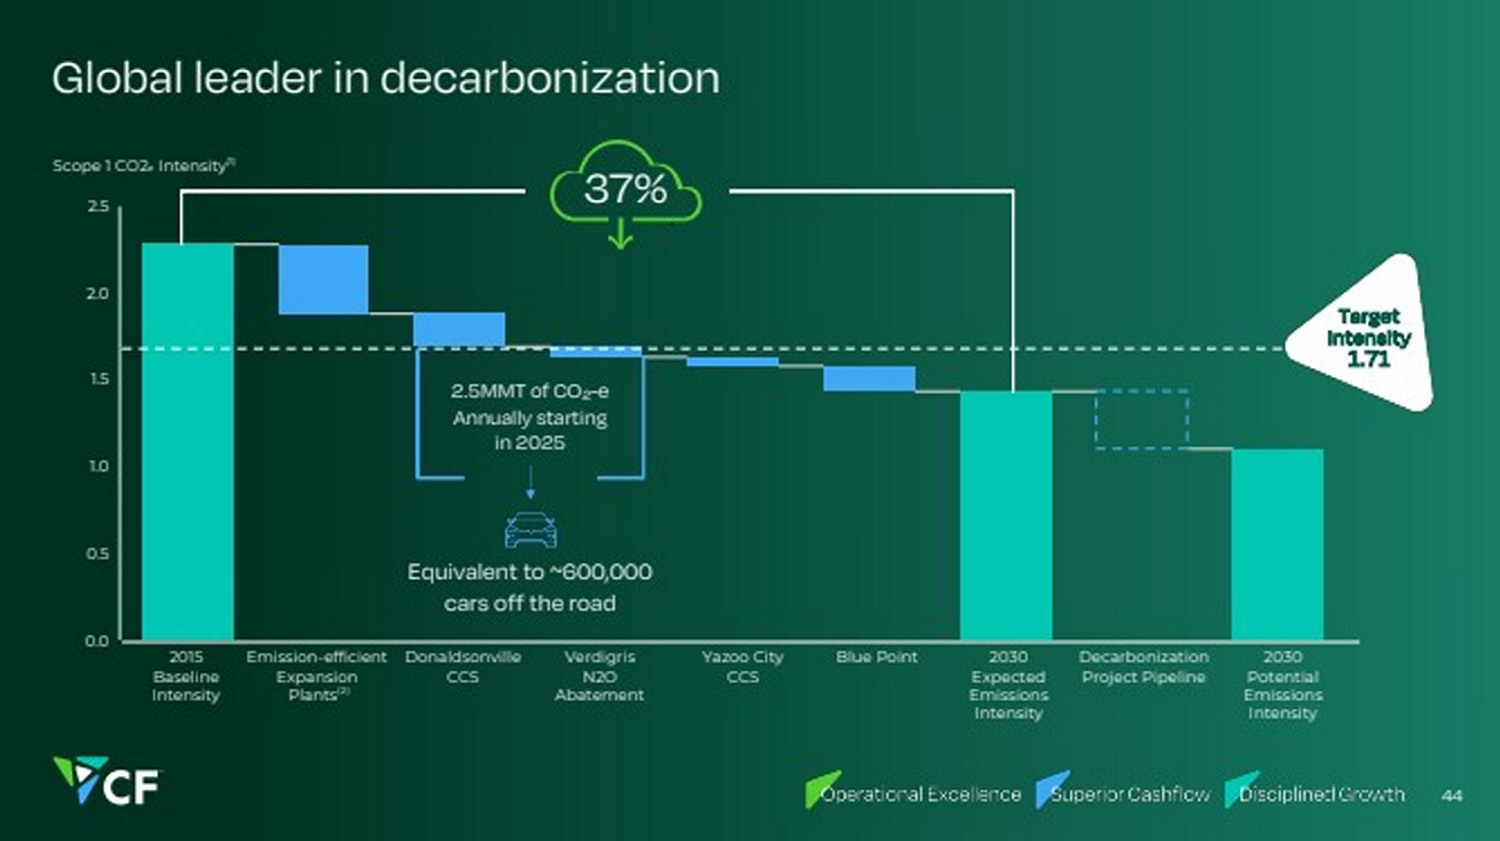
| 0.0 0.5 1.0 1.5 2.0 2.5 Global leader in decarbonization 44 Scope 1 CO2e Intensity(1) 37% Target Intensity 1.71 2015 Baseline Intensity 2030 Expected Emissions Intensity 2030 Potential Emissions Intensity Decarbonization Project Pipeline Emission-efficient Expansion Plants(2) Donaldsonville CCS Verdigris N2O Abatement Yazoo City CCS Blue Point 2.5MMT of CO2-e Annually starting in 2025 Equivalent to ~600,000 cars off the road |
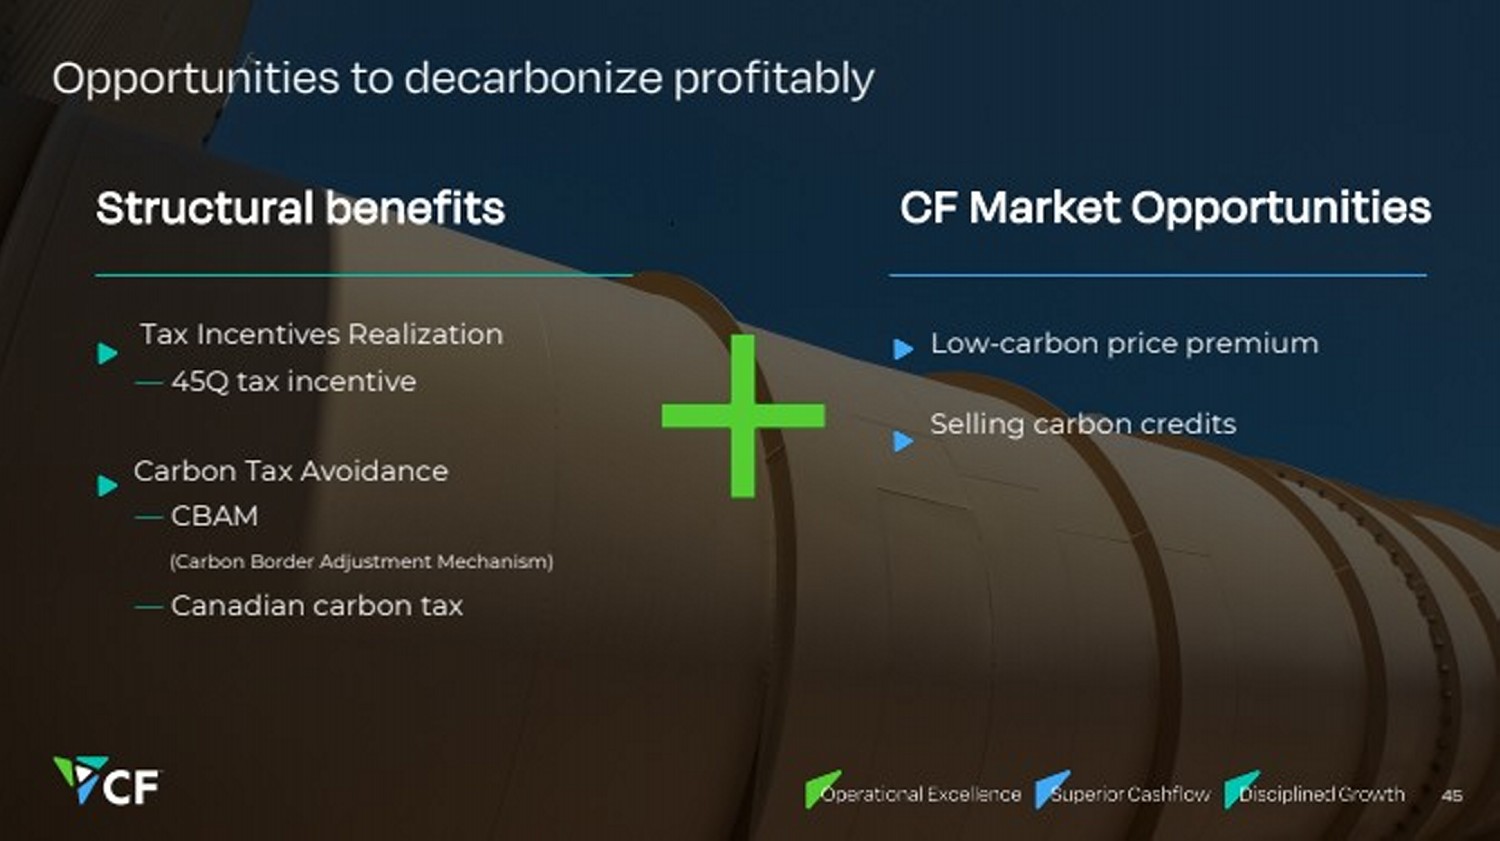
| 45 Opportunities to decarbonize profitably Structural benefits Tax Incentives Realization — 45Q tax incentive Carbon Tax Avoidance — CBAM (Carbon Border Adjustment Mechanism) — Canadian carbon tax CF Market Opportunities Low-carbon price premium Selling carbon credits |
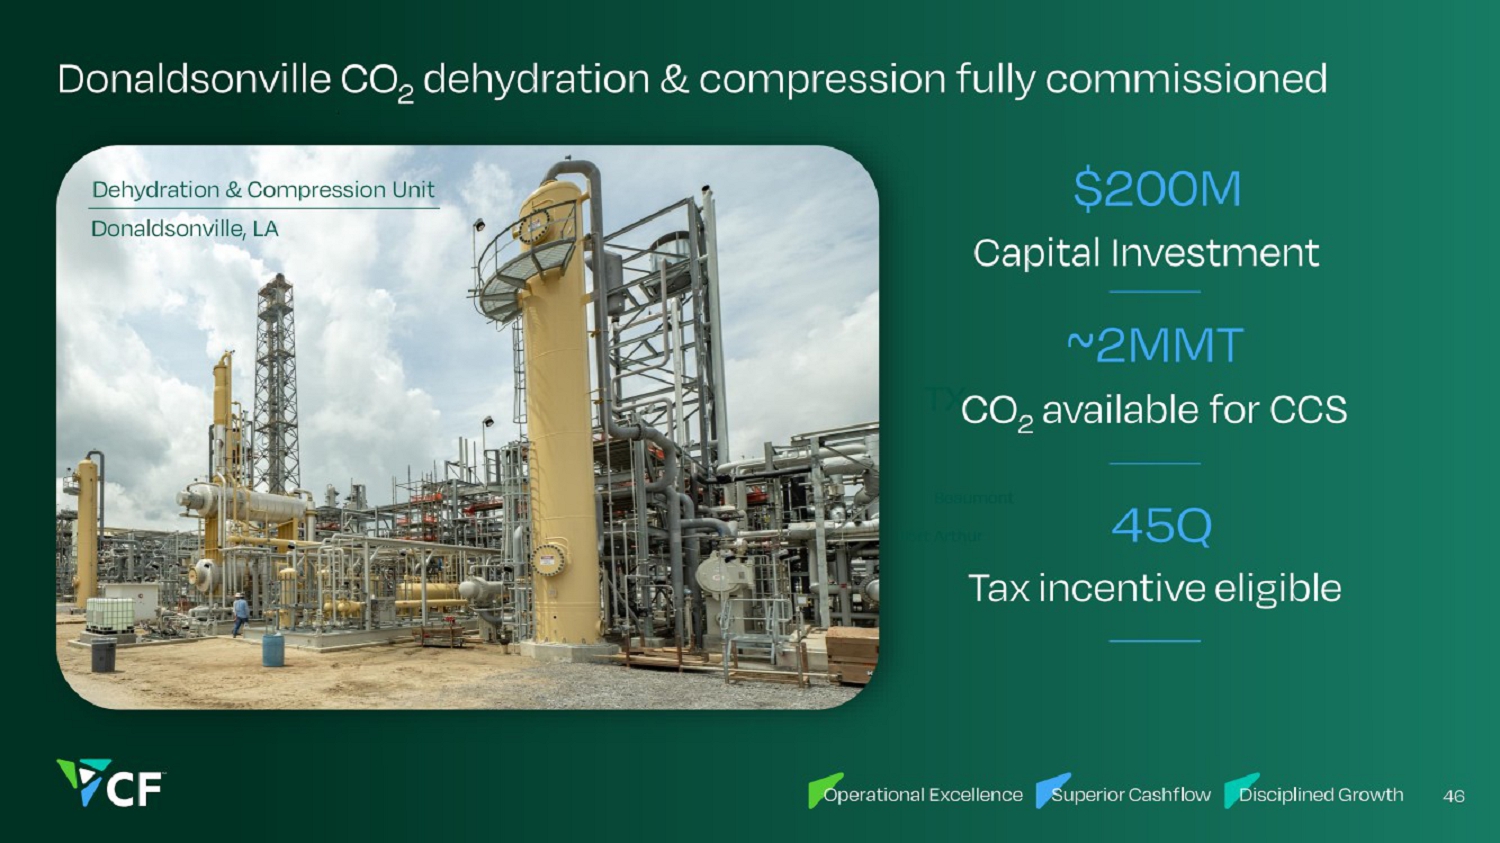
| Donaldsonville CO2 dehydration & compression fully commissioned 46 Sequestration CO2 storage sites – class VI permit in queue CO2 pipelines Enhanced oil recovery Dehydration & Compression Unit Donaldsonville, LA Donaldsonville Baton Rouge Lake Charles Beaumont LA MS Port Arthur TX |
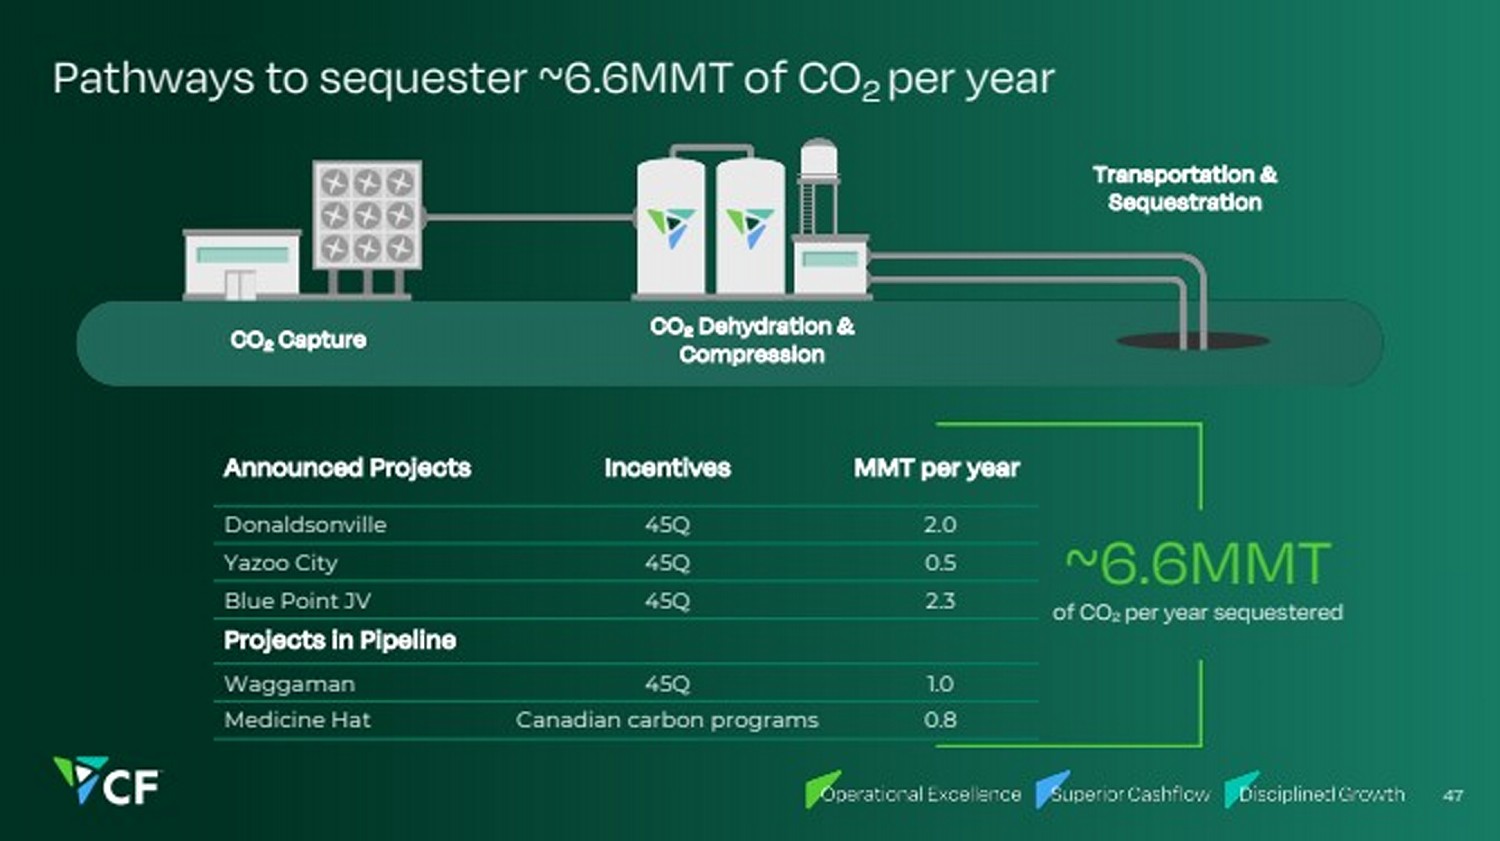
| Pathways to sequester ~6.6MMT of CO2 per year 47 Announced Projects Incentives MMT per year Donaldsonville 45Q 2.0 Yazoo City 45Q 0.5 Blue Point JV 45Q 2.3 Projects in Pipeline Waggaman 45Q 1.0 Medicine Hat Canadian carbon programs 0.8 of CO2 per year sequestered ~6.6MMT CO2 Capture CO2 Dehydration & Compression Transportation & Sequestration |
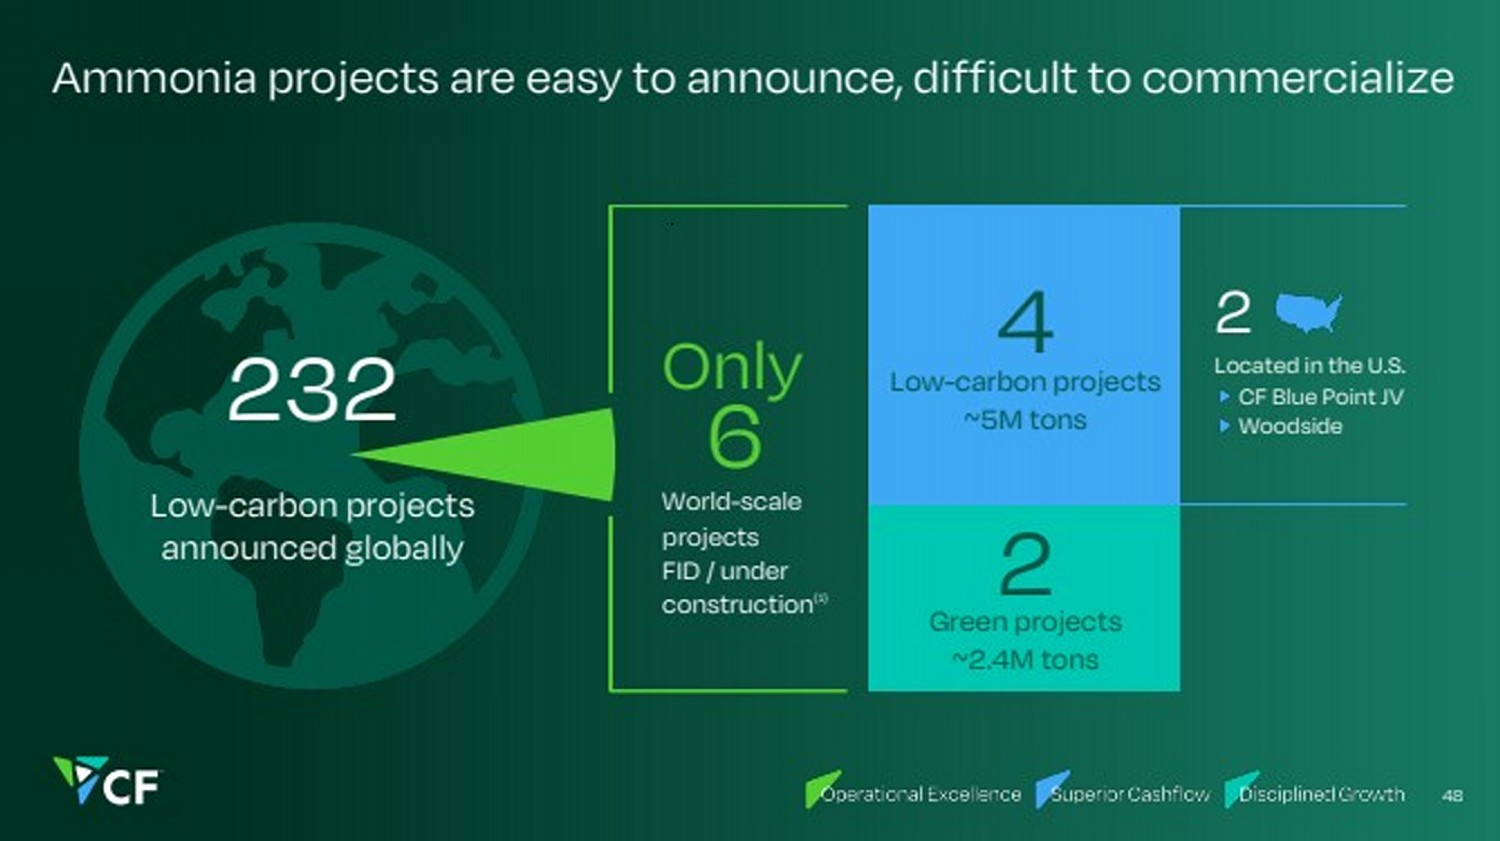
| Ammonia projects are easy to announce, difficult to commercialize 48 232 Low-carbon projects announced globally Only 6 World-scale projects FID / under construction(1) 2 Green projects ~2.4M tons 4 Low-carbon projects ~5M tons 2 Located in the U.S. CF Blue Point JV Woodside |
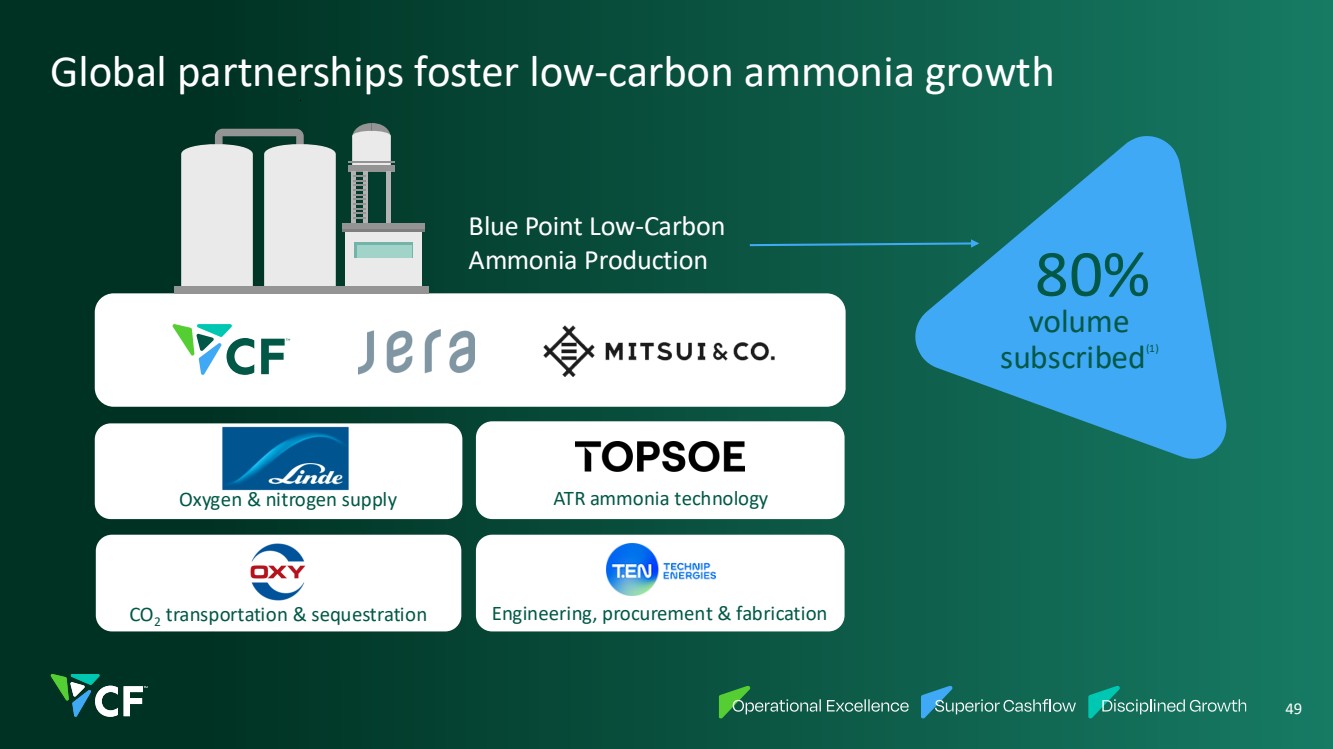
| Global partnerships foster low-carbon ammonia growth 49 Oxygen & nitrogen supply CO2 transportation & sequestration ATR ammonia technology volume subscribed(1) 80% Engineering, procurement & fabrication Blue Point Low-Carbon Ammonia Production |
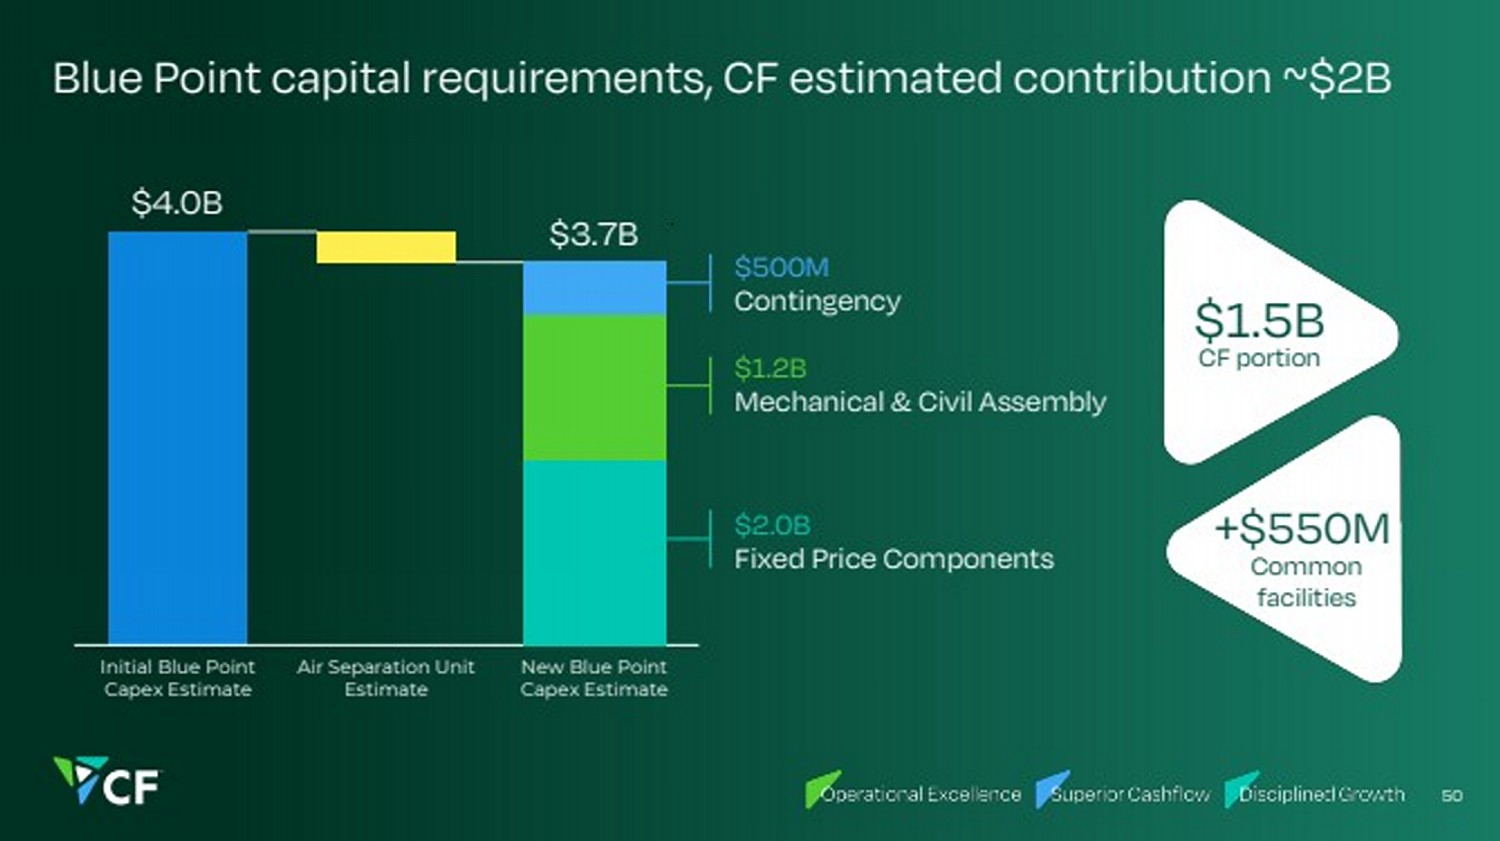
| Blue Point capital requirements, CF estimated contribution ~$2B $500M Contingency Initial Blue Point Capex Estimate Air Separation Unit Estimate New Blue Point Capex Estimate $2.0B Fixed Price Components $4.0B $3.7B $1.2B Mechanical & Civil Assembly 50 CF portion $1.5B Common facilities +$550M |
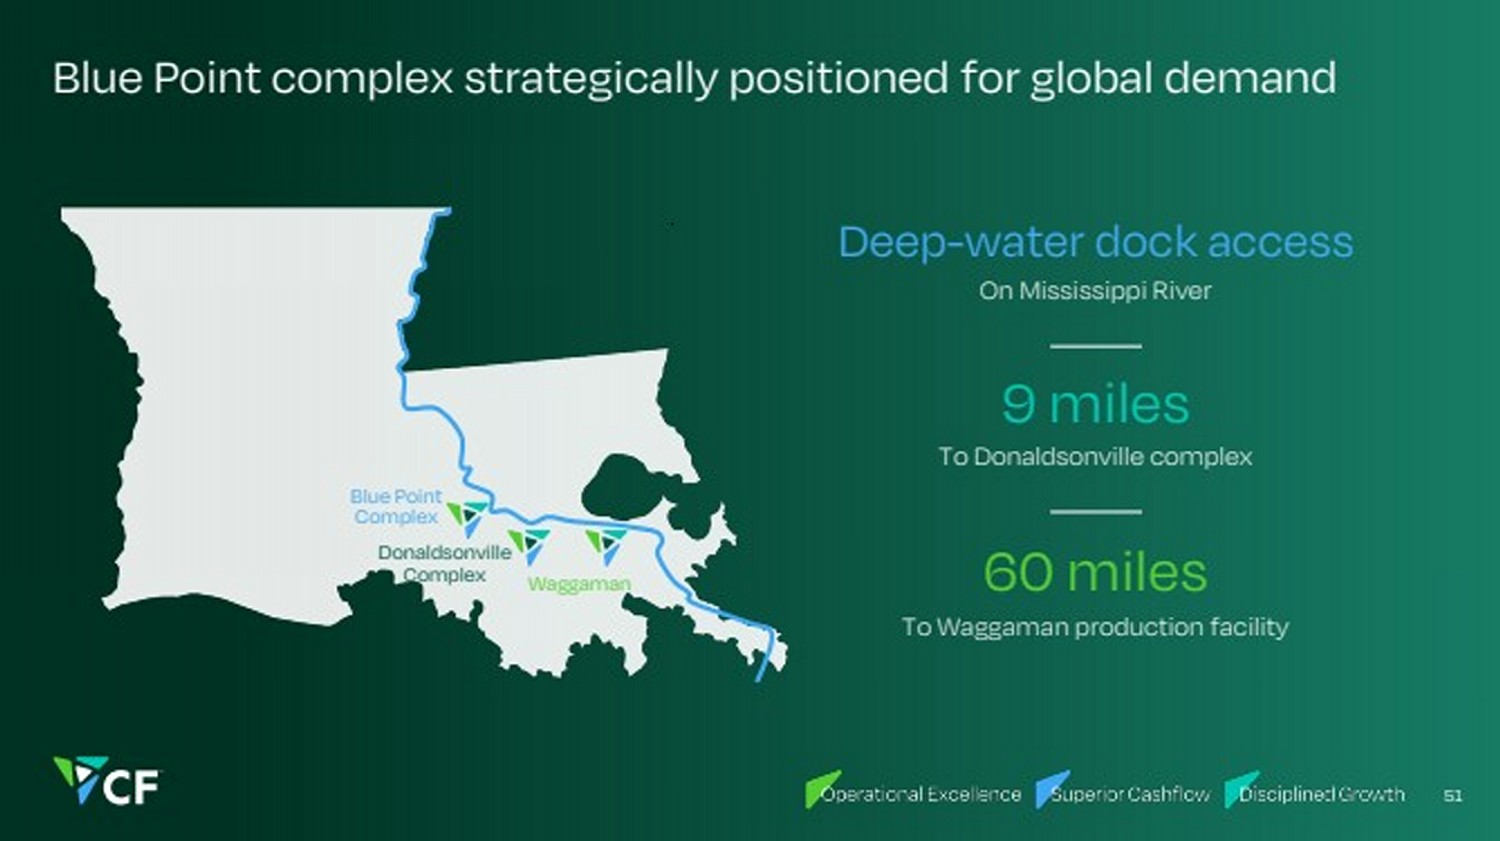
| Blue Point complex strategically positioned for global demand On Mississippi River Deep-water dock access To Donaldsonville complex 9 miles To Waggaman production facility 60 miles Donaldsonville Complex Blue Point Complex Waggaman 51 |
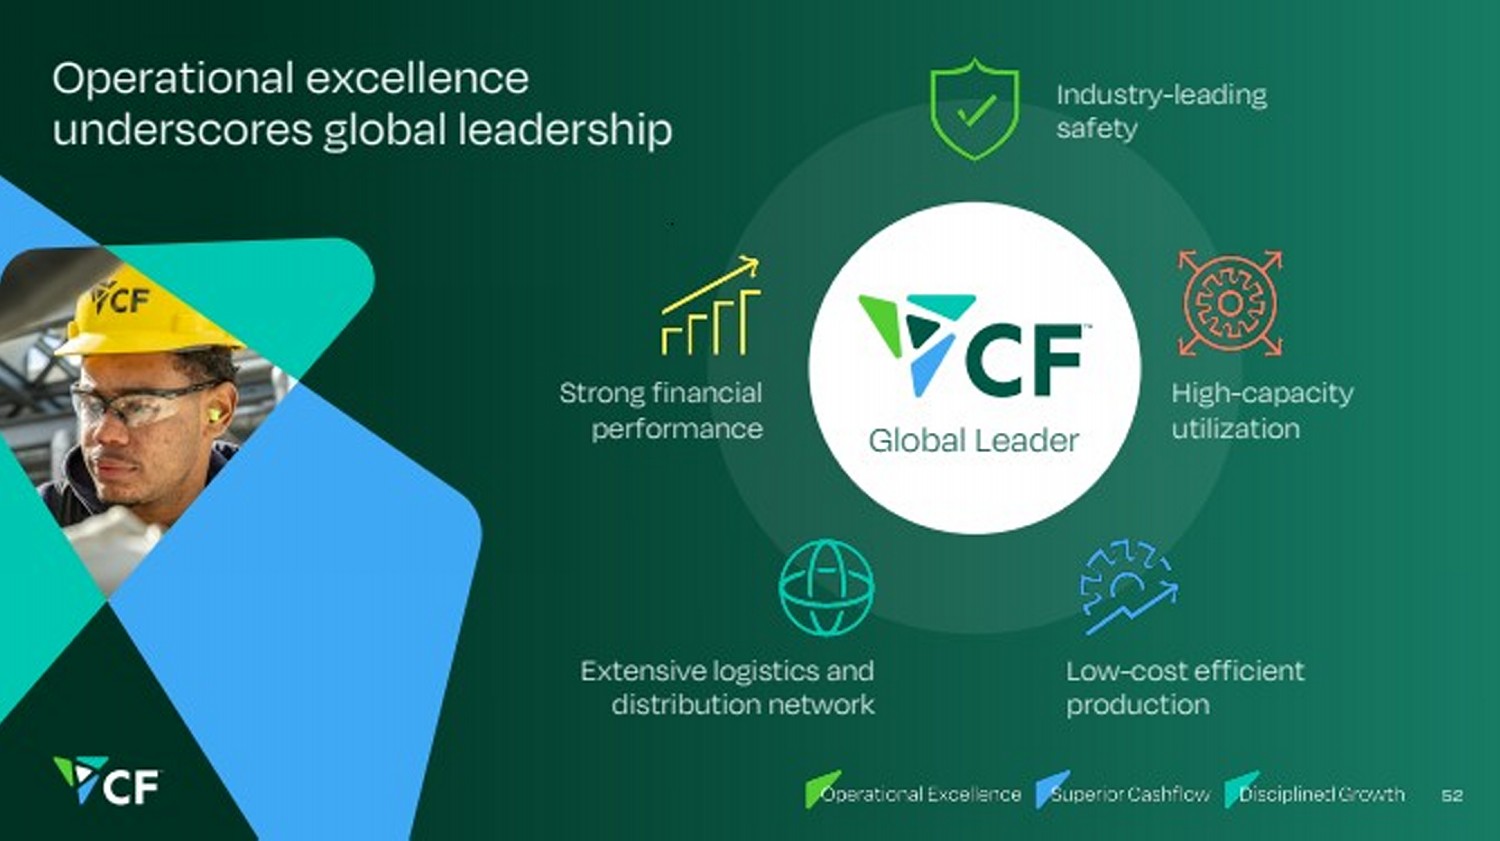
| Operational excellence underscores global leadership 52 Global Leader High-capacity utilization Low-cost efficient production Extensive logistics and distribution network Strong financial performance Industry-leading safety |
| Focused Capital Deployment 53 Greg Cameron EVP and Chief Financial Officer |
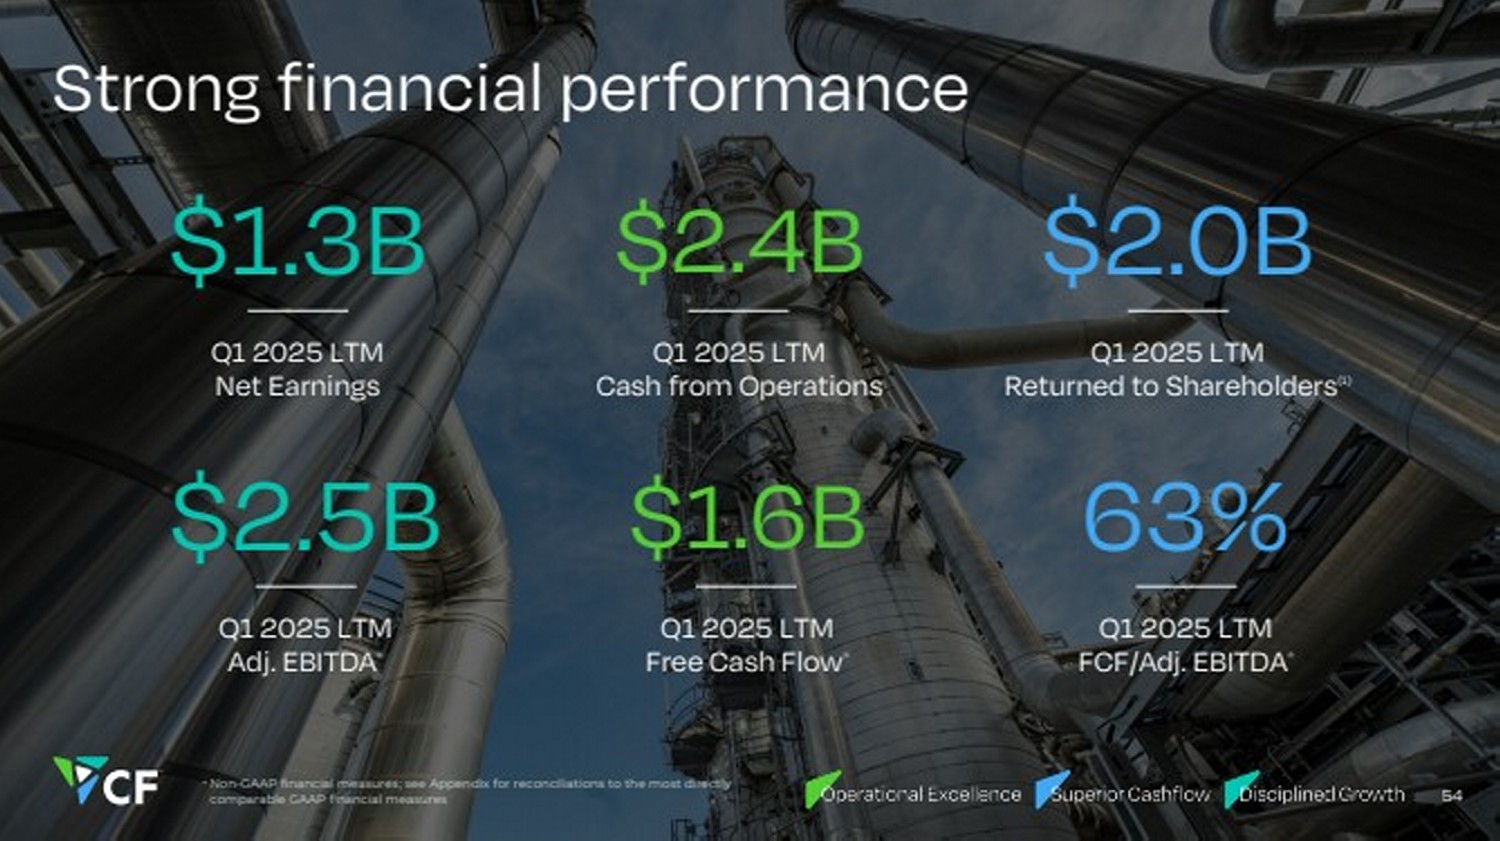
| Strong financial performance Q1 2025 LTM Adj. EBITDA* Q1 2025 LTM Free Cash Flow* Q1 2025 LTM FCF/Adj. EBITDA* $2.5B $1.6B 63% 54 Q1 2025 LTM Net Earnings Q1 2025 LTM Cash from Operations $1.3B $2.4B Q1 2025 LTM Returned to Shareholders(1) $2.0B * Non-GAAP financial measures; see Appendix for reconciliations to the most directly comparable GAAP financial measures |
| $969 $1,403 $1,610 $1,350 $2,743 $5,880 $2,760 $2,284 $2,469 $1,027 $936 $915 $748 $2,165 $2,783 $1,799 $1,445 $1,567 2017 2018 2019 2020 2021 2022 2023 2024 Q1 2025 LTM Consistently high free cash flow generation $ millions 2017-Q1 2025 Capital Allocation Adj. EBITDA Free cash flow Returned to shareholders(1) $7.8B Inorganic capacity growth(2) $1.6B Debt reduction ~$3.0B 55 FCF/ Adj. EBITDA conversion over 8 years 62% |

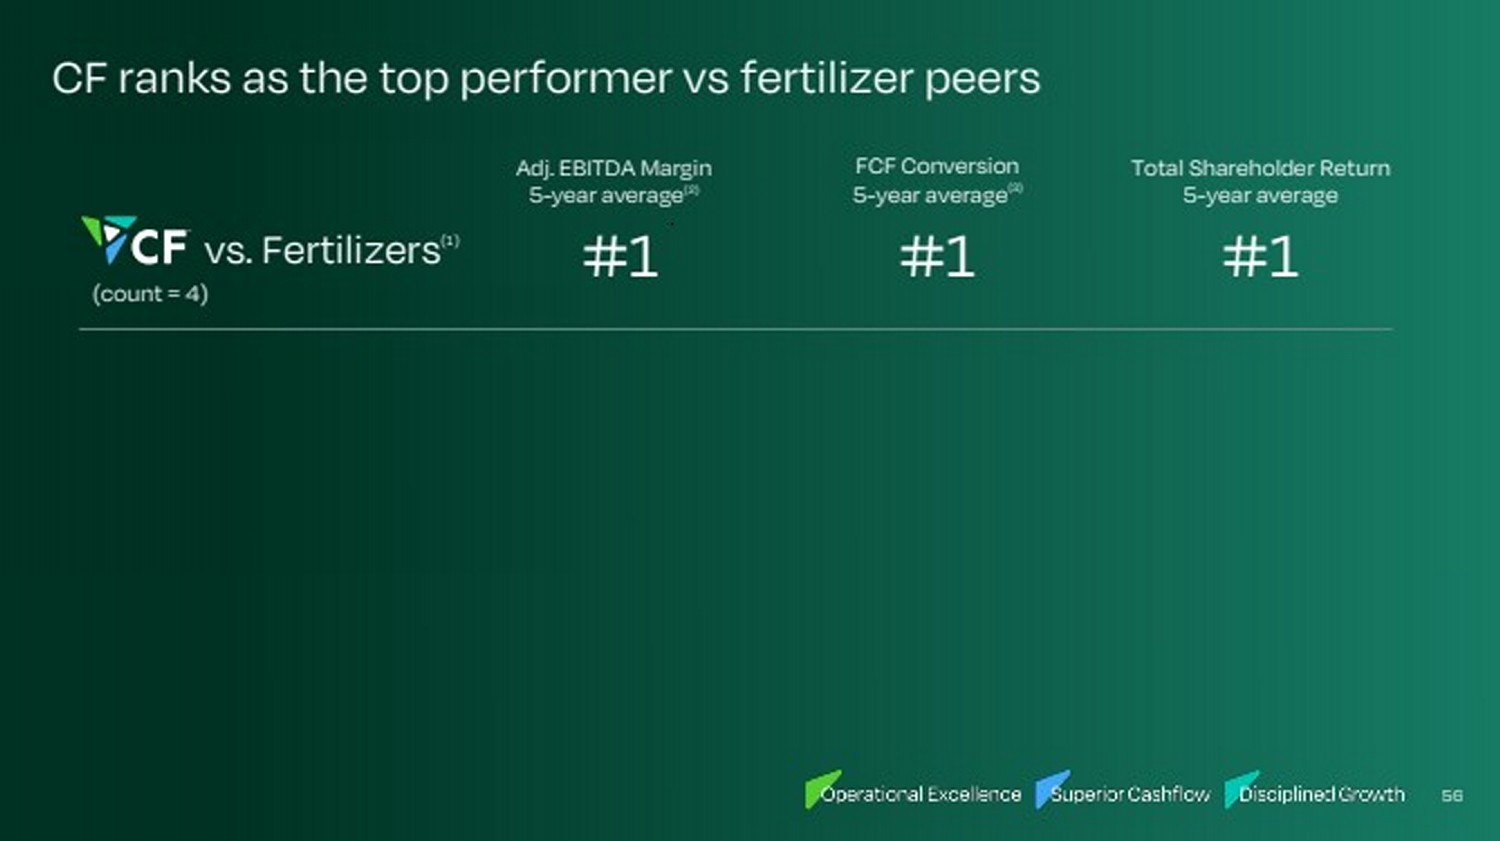
| CF ranks as the top performer vs fertilizer peers 56 Adj. EBITDA Margin 5-year average(2) FCF Conversion 5-year average(3) Total Shareholder Return 5-year average vs. Fertilizers #1 #1 #1 (1) (count = 4) |
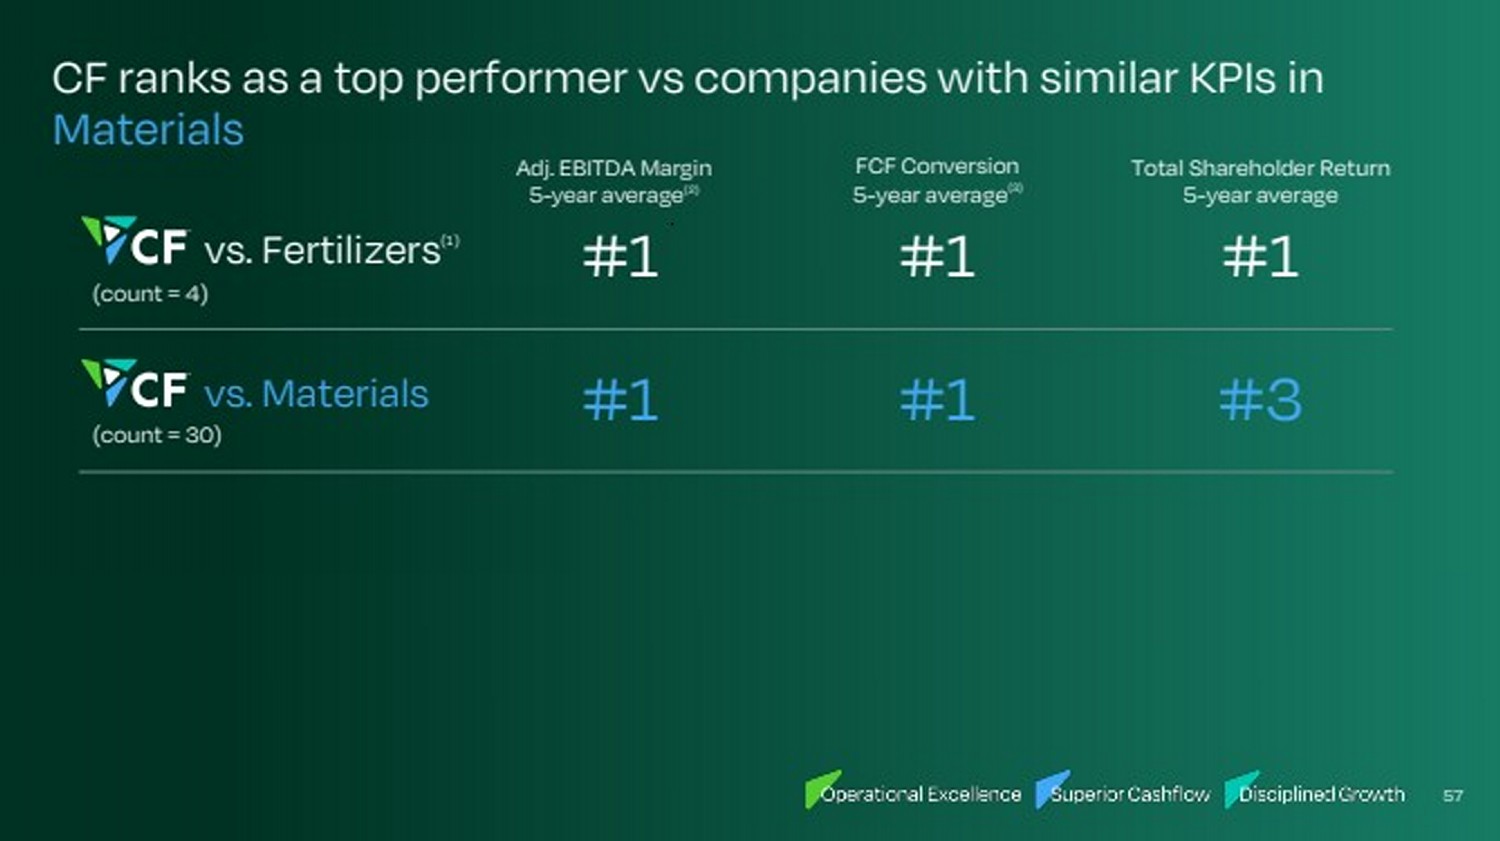
| 57 Adj. EBITDA Margin 5-year average(2) FCF Conversion 5-year average(3) Total Shareholder Return 5-year average vs. Fertilizers #1 #1 #1 (1) (count = 4) vs. Materials #1 #1 #3 (count = 30) CF ranks as a top performer vs companies with similar KPIs in Materials |
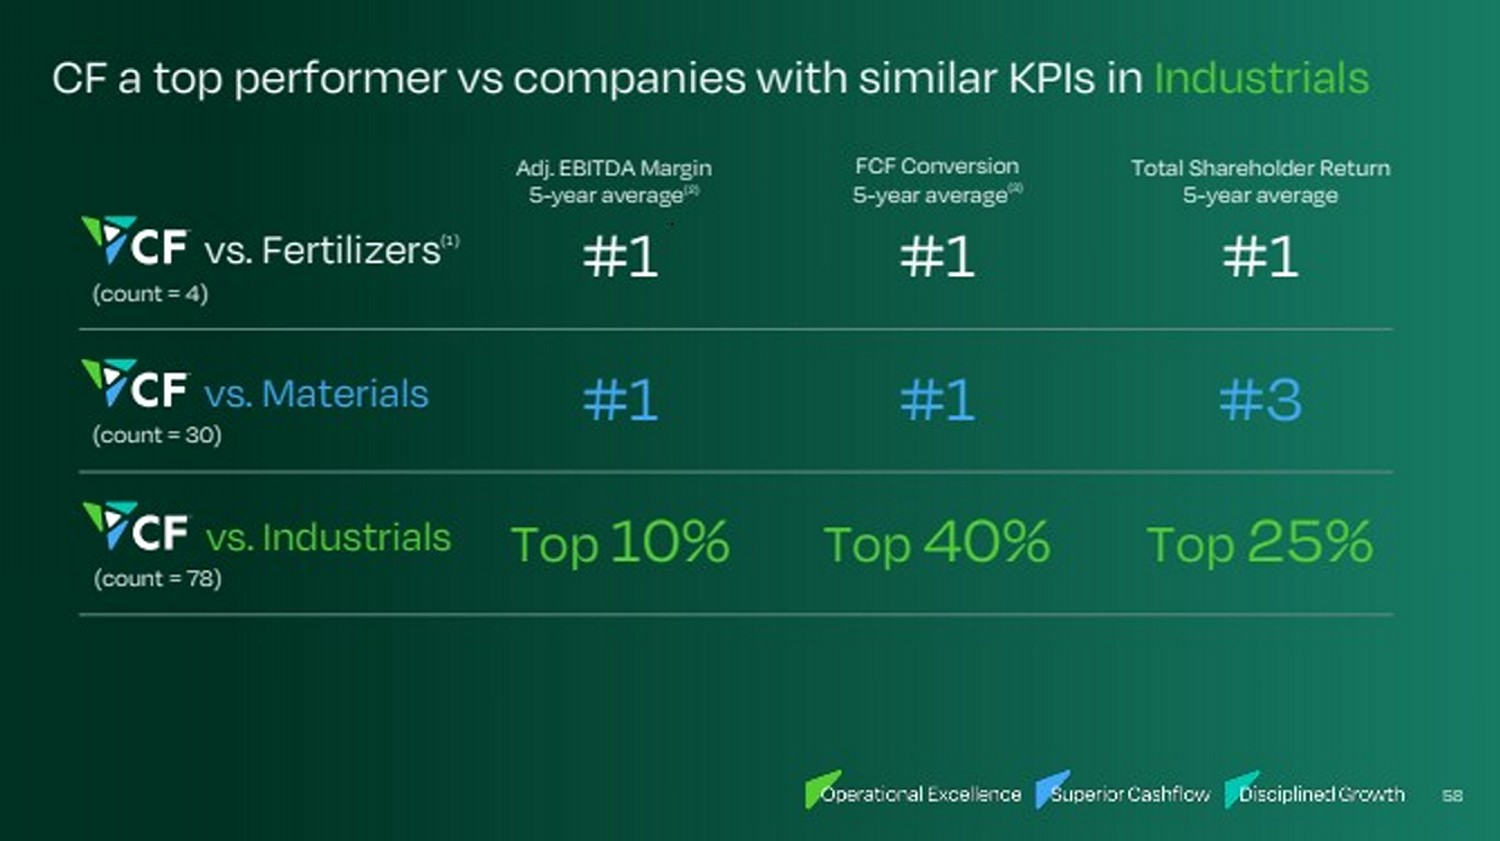
| 58 Adj. EBITDA Margin 5-year average(2) FCF Conversion 5-year average(3) Total Shareholder Return 5-year average vs. Fertilizers #1 #1 #1 (1) (count = 4) vs. Materials #1 #1 #3 (count = 30) (count = 78) vs. Industrials Top 10% Top 40% Top 25% CF a top performer vs companies with similar KPIs in Industrials |
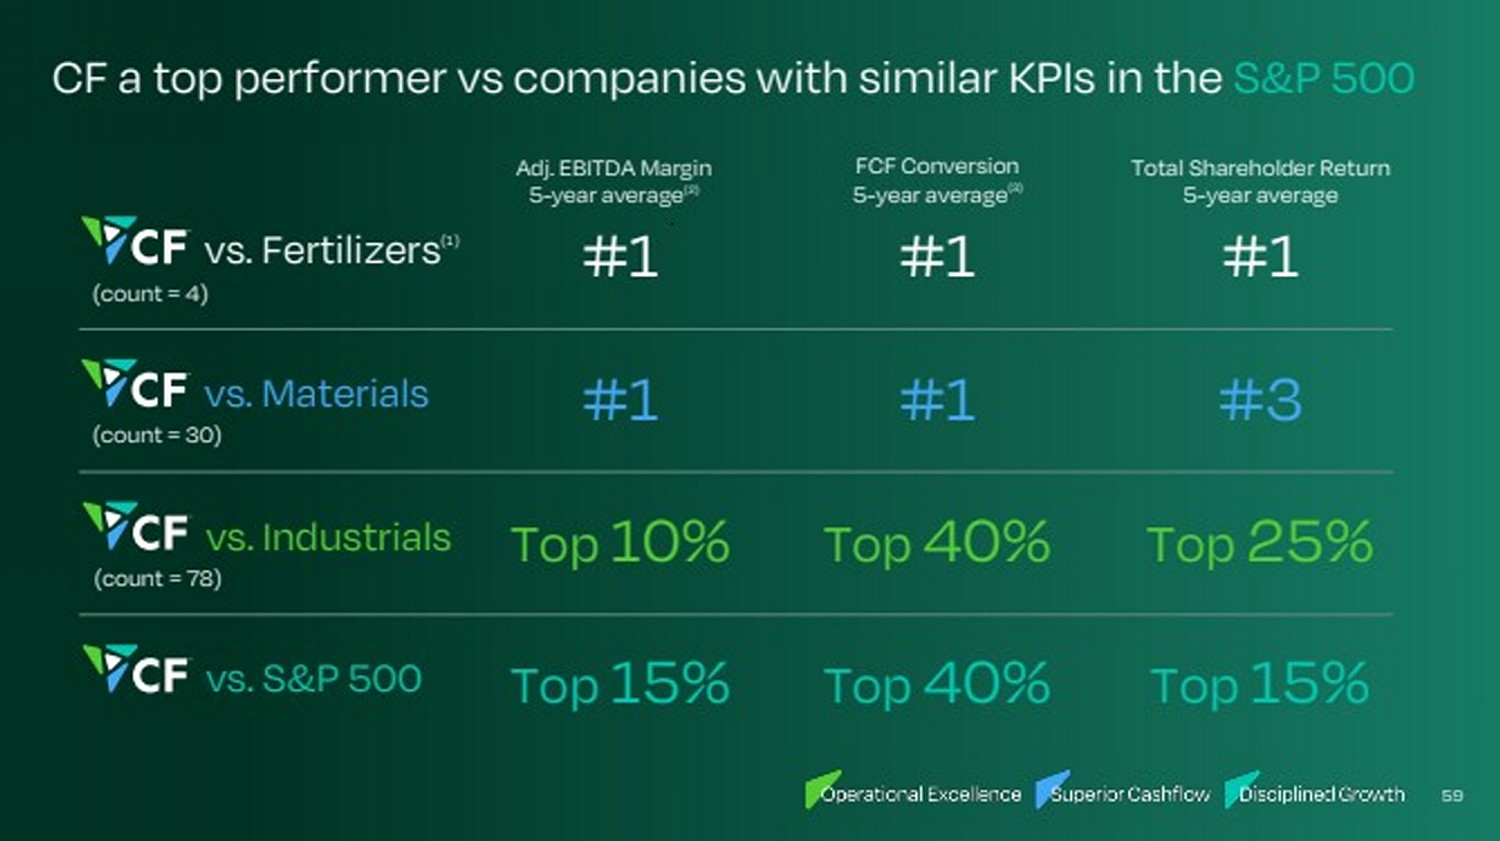
| 59 Adj. EBITDA Margin 5-year average(2) FCF Conversion 5-year average(3) Total Shareholder Return 5-year average vs. Fertilizers #1 #1 #1 (1) (count = 4) vs. Materials #1 #1 #3 (count = 30) (count = 78) vs. Industrials Top 10% Top 40% Top 25% vs. S&P 500 Top 15% Top 40% Top 15% CF a top performer vs companies with similar KPIs in the S&P 500 |
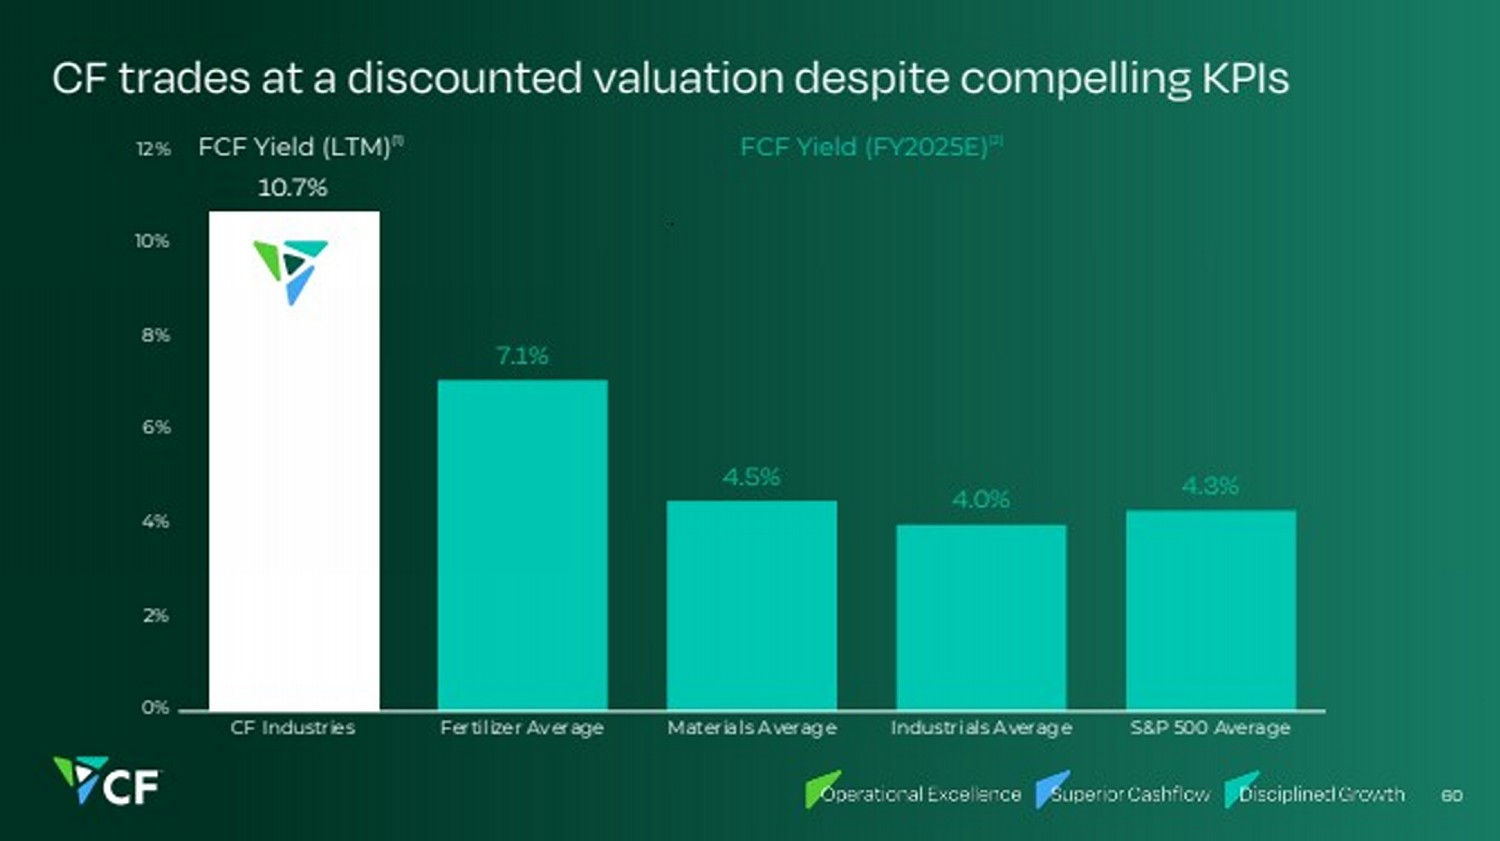
| CF trades at a discounted valuation despite compelling KPIs 10.7% 7.1% 4.5% 4.0% 4.3% 0% 2% 4% 6% 8% 10% 12% CF Industries Fertilizer Average Materials Averag e Industrials Averag e S&P 500 Average 60 FCF Yield (LTM)(1) FCF Yield (FY2025E)(2) |
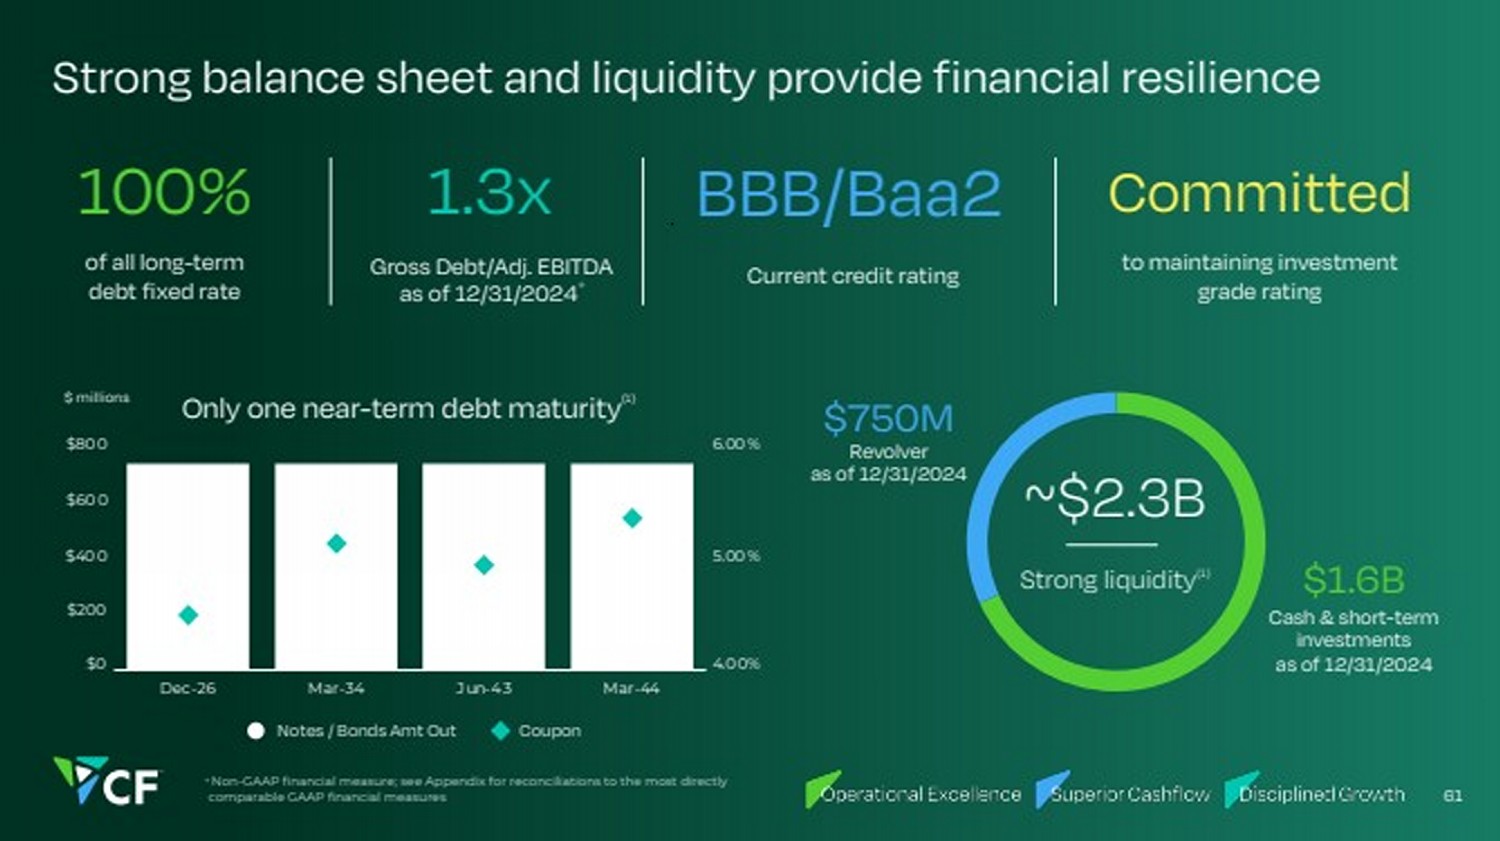
| Strong balance sheet and liquidity provide financial resilience 61 Notes / Bonds Amt Out Coupon 4.0 0% 5.00 % 6.00 % $0 $200 $40 0 $60 0 $80 0 Dec-26 Mar-34 Jun-4 3 Mar-44 Only one near-term debt maturity(1) of all long-term debt fixed rate 100% Gross Debt/Adj. EBITDA as of 12/31/2024* 1.3x to maintaining investment grade rating Committed Cash & short-term investments as of 12/31/2024 $1.6B Revolver as of 12/31/2024 $750M ~$2.3B Strong liquidity(1) Current credit rating BBB/Baa2 $ millions * Non-GAAP financial measure; see Appendix for reconciliations to the most directly comparable GAAP financial measures |
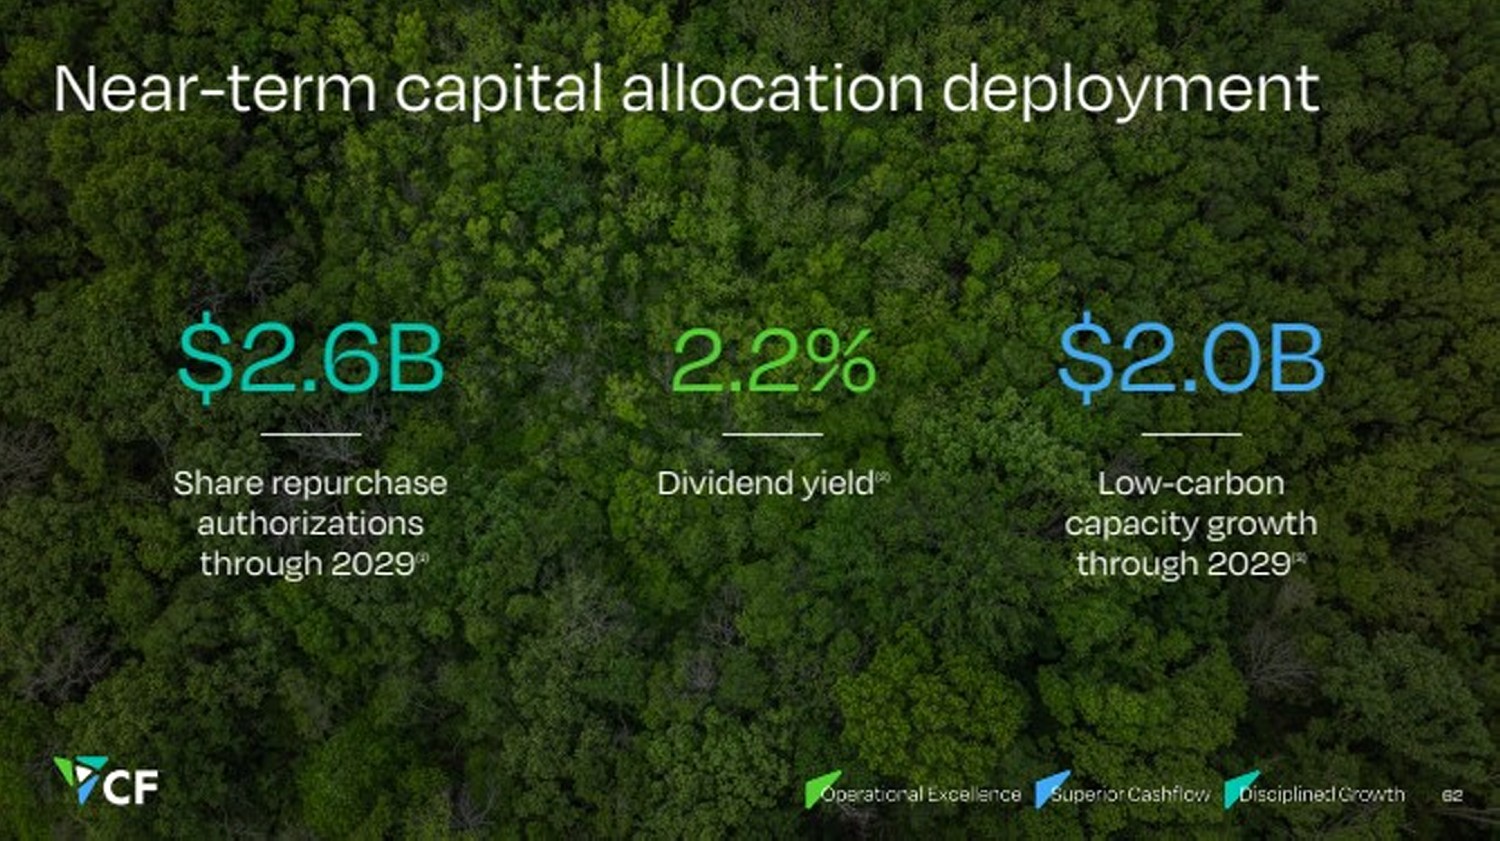
| Near-term capital allocation deployment Share repurchase authorizations through 2029(1) Dividend yield(2) Low-carbon capacity growth through 2029(3) $2.6B 2.2% $2.0B 62 |
| $3.40 $3.16 $2.74 $2.24 $4.21 $7.18 $3.67 $2.40 $223 $270 $277 $242 $438 $633 $399 $354 0 100 200 300 400 500 600 700 0 2 4 6 8 10 12 14 201 7 201 8 201 9 2020 2021 2022 2023 2024 CF through-the-cycle metrics as reported 63 CF urea realized average sales price $/ST CF realized gas cost $/MMBtu |

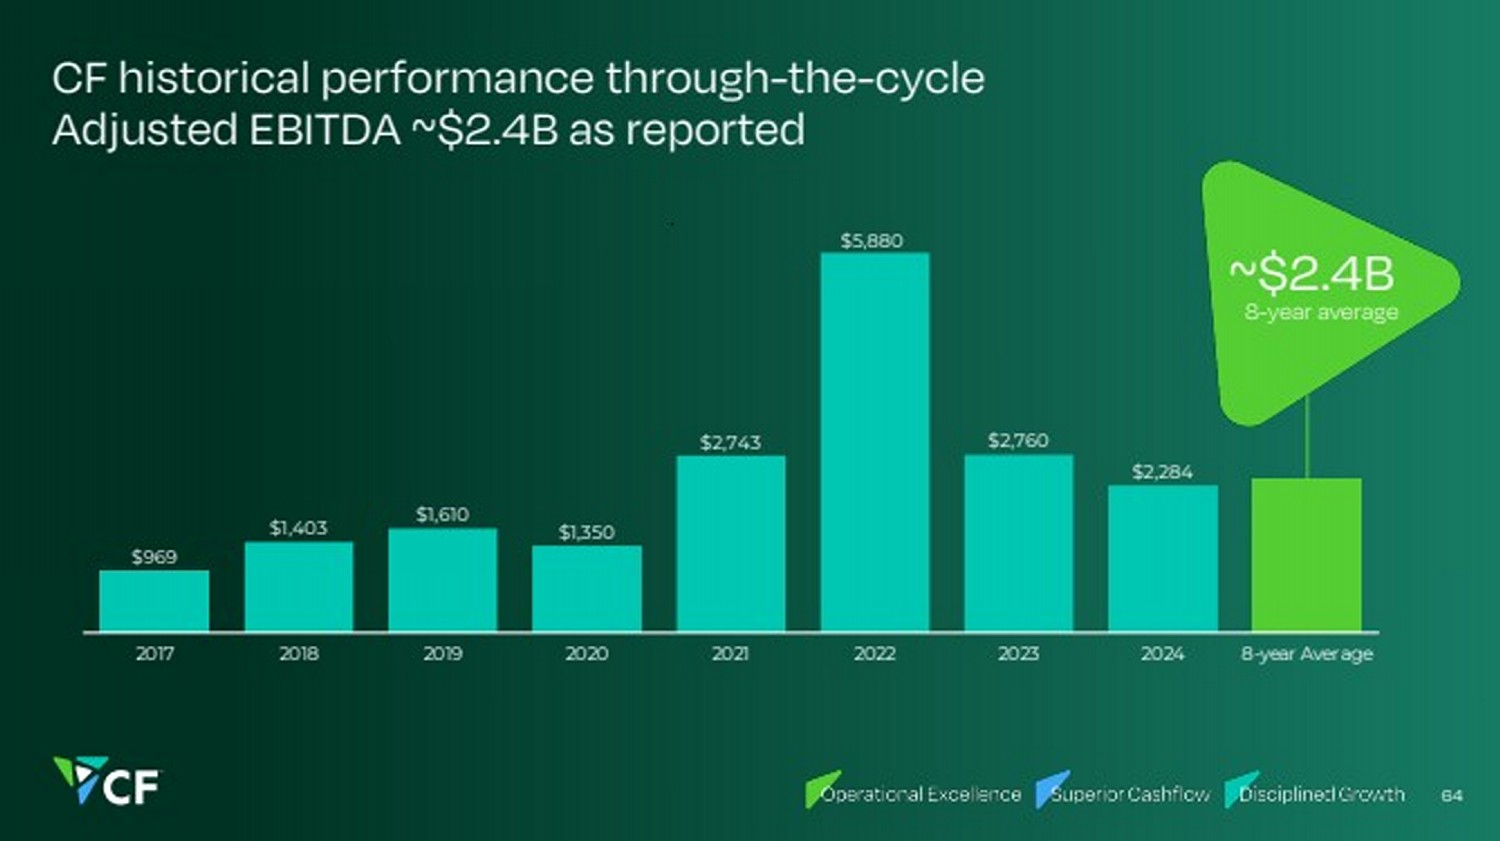
| $969 $1,403 $1,610 $1,350 $2,743 $5,880 $2,760 $2,284 2017 2018 2019 2020 2021 2022 2023 2024 8-year Average 8-year average ~$2.4B CF historical performance through-the-cycle Adjusted EBITDA ~$2.4B as reported 64 |
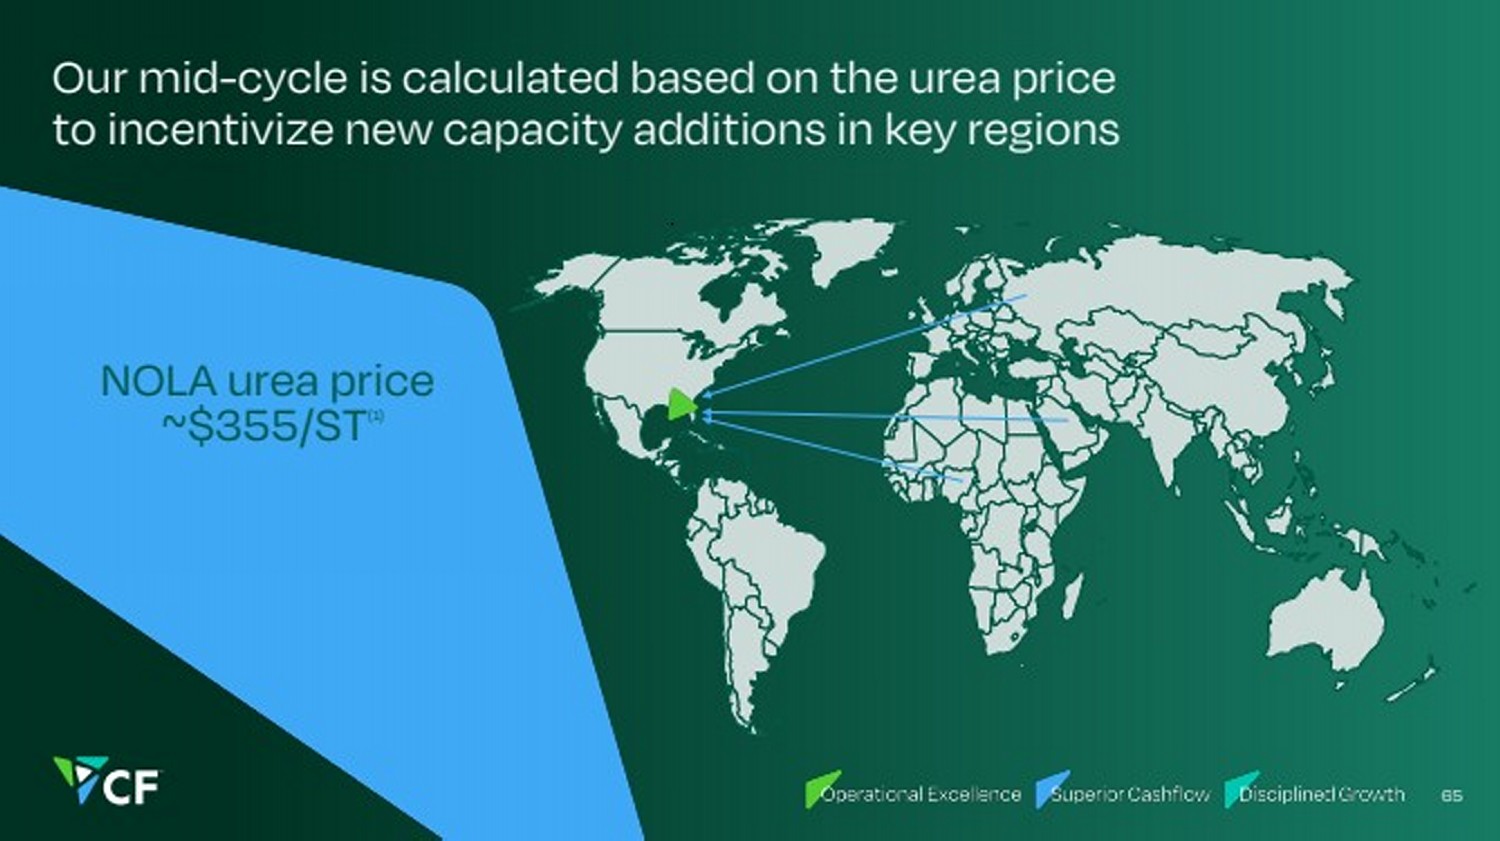
| Our mid-cycle is calculated based on the urea price to incentivize new capacity additions in key regions 65 NOLA urea price ~$355/ST(1) |
| We achieve ~$25/ton premium in realized urea price vs NOLA 66 $223 $270 $277 $242 $438 $633 $399 $354 $207 $259 $245 $227 $493 $599 $354 $320 $- $100 $200 $300 $400 $500 $600 $700 201 7 201 8 201 9 2020 2021 2022 2023 2024 CF realized urea price Urea benchmark (NOLA barge)(1) Average premium vs NOLA (excluding 2021) ~$25/ton |

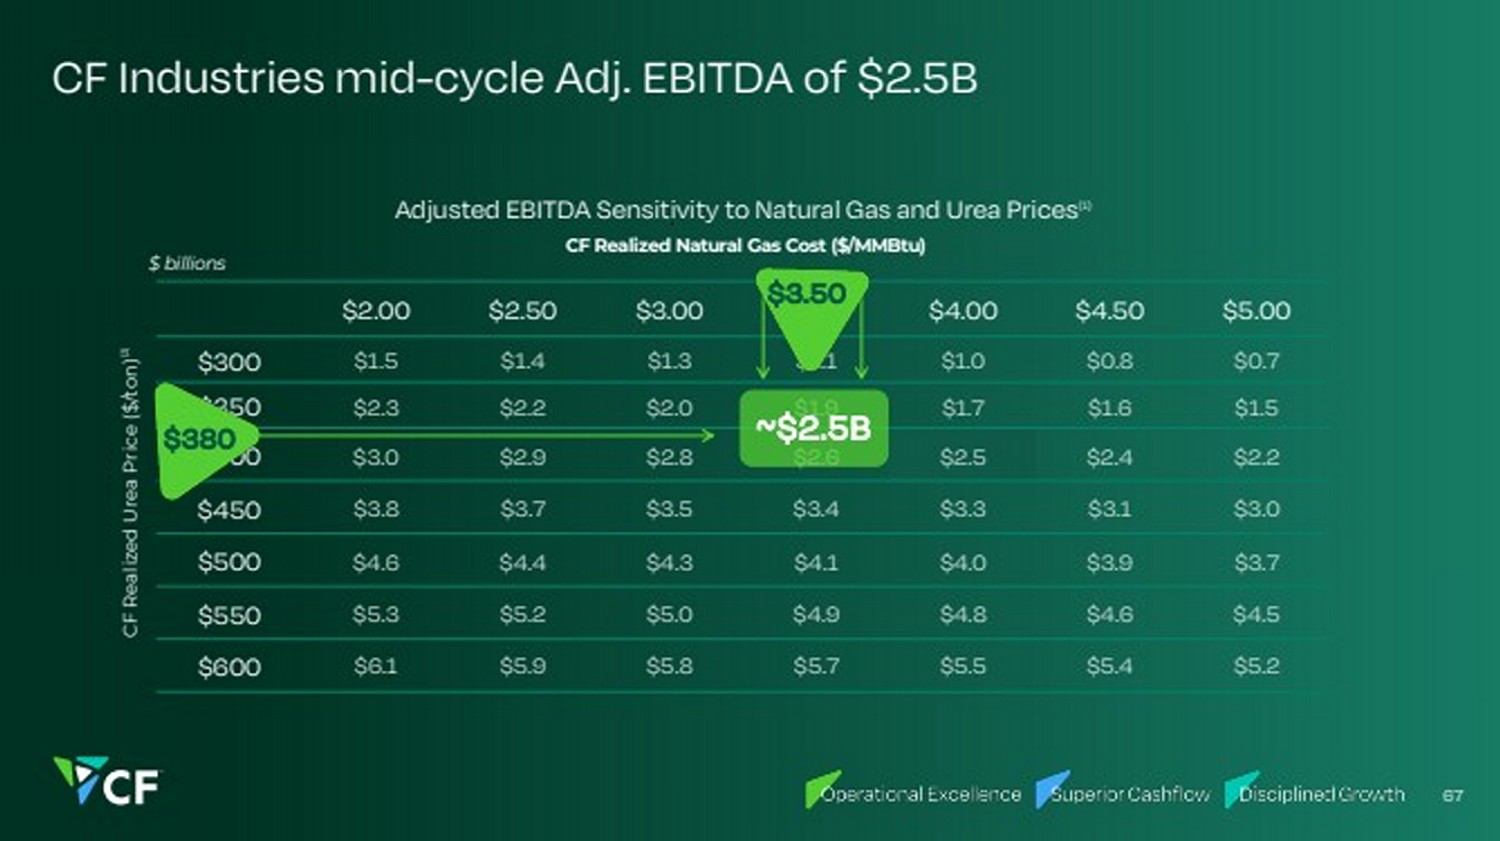
| $2.00 $2.50 $3.00 $3.50 $4.00 $4.50 $5.00 $300 $1.5 $1.4 $1.3 $1.1 $1.0 $0.8 $0.7 $350 $2.3 $2.2 $2.0 $1.9 $1.7 $1.6 $1.5 $400 $3.0 $2.9 $2.8 $2.6 $2.5 $2.4 $2.2 $450 $3.8 $3.7 $3.5 $3.4 $3.3 $3.1 $3.0 $500 $4.6 $4.4 $4.3 $4.1 $4.0 $3.9 $3.7 $550 $5.3 $5.2 $5.0 $4.9 $4.8 $4.6 $4.5 $600 $6.1 $5.9 $5.8 $5.7 $5.5 $5.4 $5.2 CF Industries mid-cycle Adj. EBITDA of $2.5B 67 Adjusted EBITDA Sensitivity to Natural Gas and Urea Prices(1) $ billions CF Realized Natural Gas Cost ($/MMBtu) CF Realized Urea Price ($/ton)(2) $380 ~$2.5B $3.50 |
| Both approaches support ~$2.5B mid-cycle Adj. EBITDA 68 Through-the-cycle Adj. EBITDA (ex. Inflation) Price to incentivize new capacity $ $2.5B |
| Decarbonization provides ~$200M EBITDA annually ~$115M projected EBITDA per year(1)(2) United States 45Q tax incentives for CCS Low-carbon Premium $25-$50/ton $50 - $100M projected EBITDA per year(1) Decarbonization CO2 Donaldsonville, LA 69 |

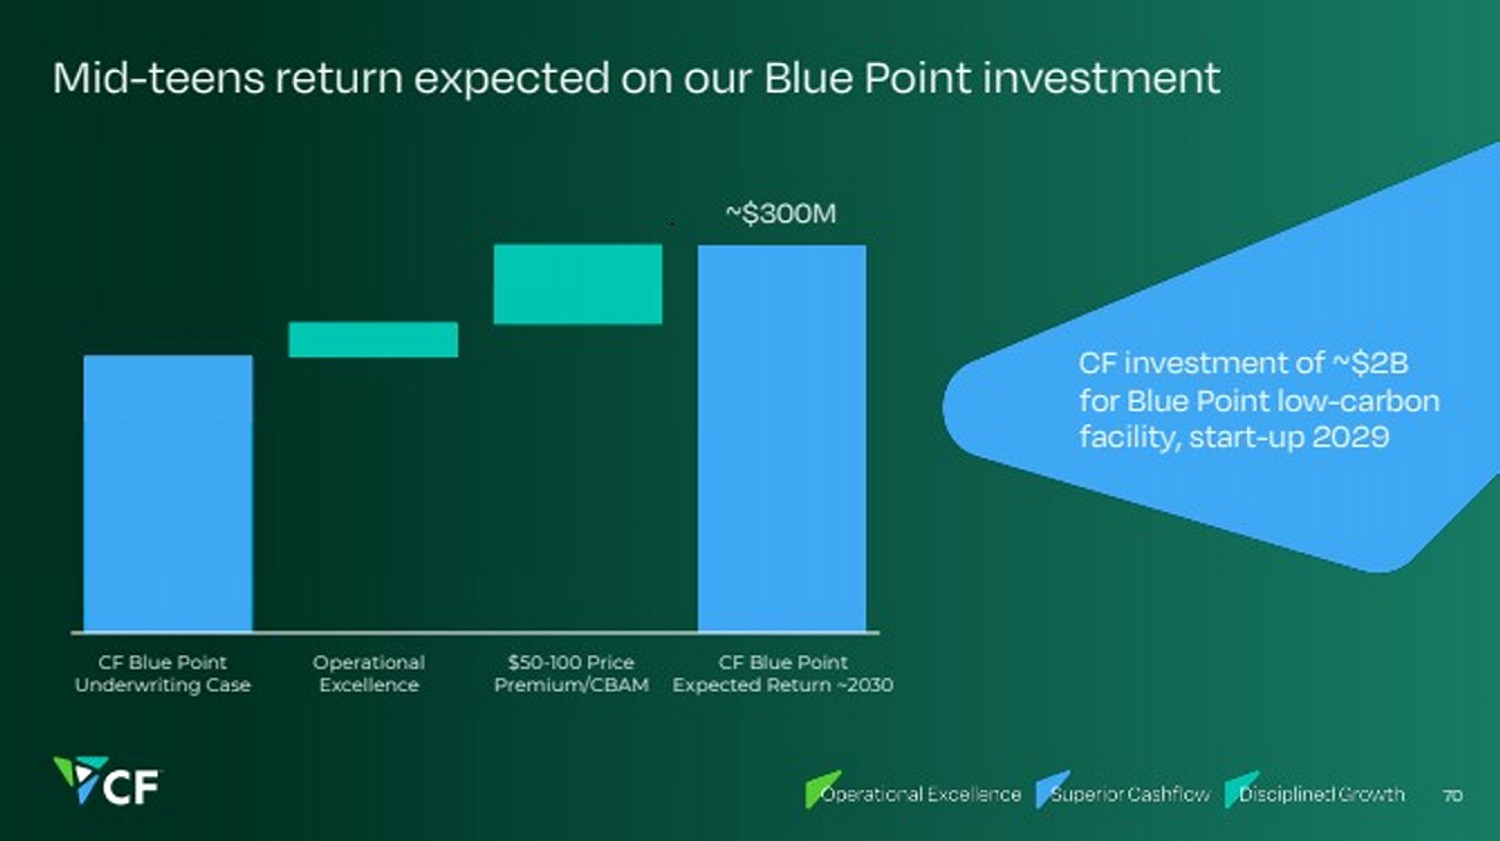
| Mid-teens return expected on our Blue Point investment 70 CF investment of ~$2B for Blue Point low-carbon facility, start-up 2029 ~$300M CF Blue Point Underwriting Case Operational Excellence $50-100 Price Premium/CBAM CF Blue Point Expected Return ~2030 |
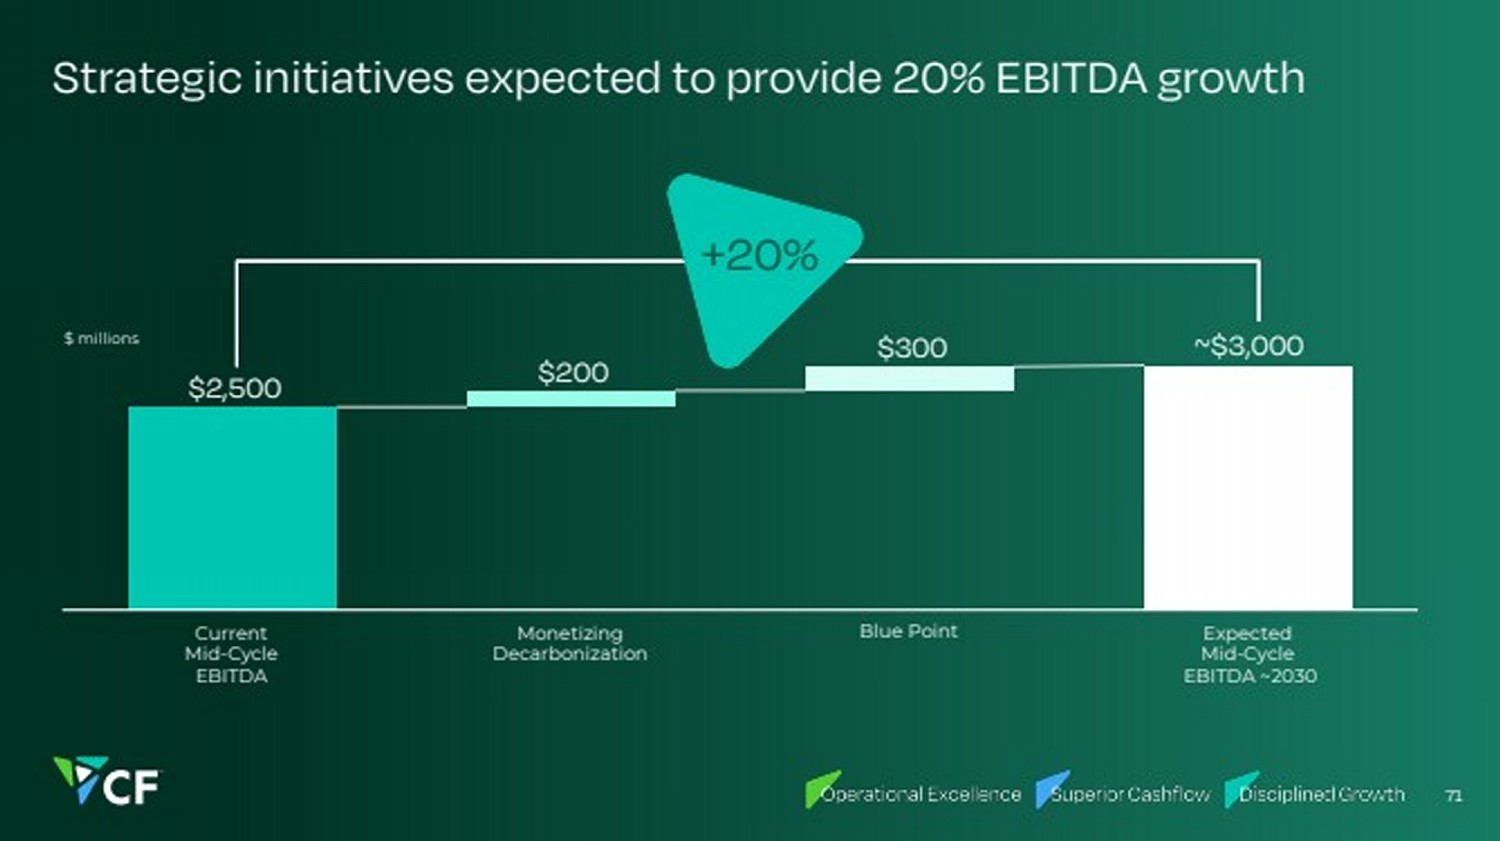
| Strategic initiatives expected to provide 20% EBITDA growth $2,500 $200 $300 Current Mid-Cycle EBITDA Monetizing Decarbonization Blue Point Expected Mid-Cycle EBITDA ~2030 $ millions ~$3,000 +20% 71 |
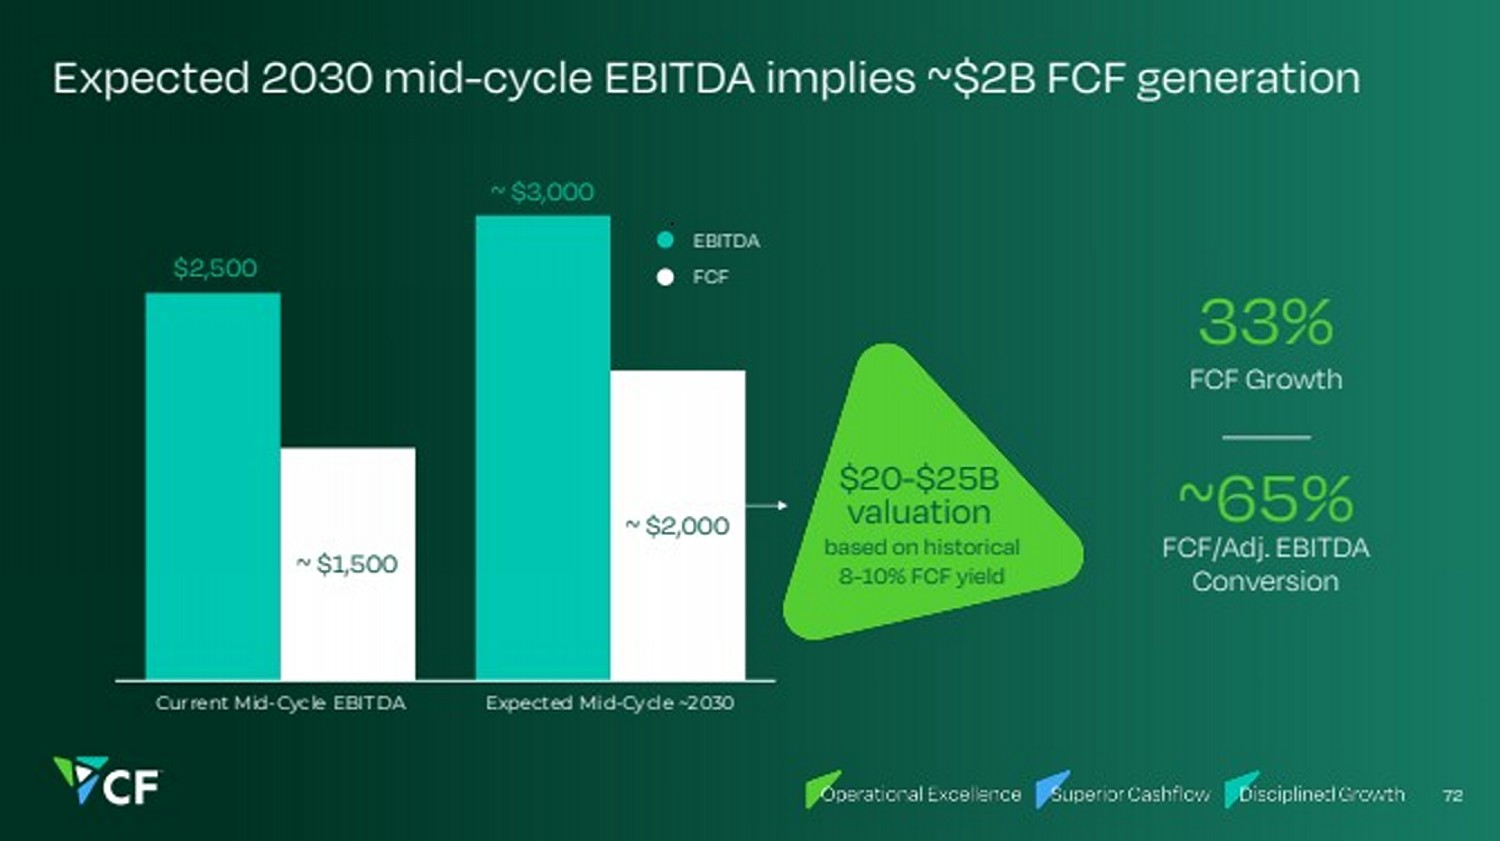
| Expected 2030 mid-cycle EBITDA implies ~$2B FCF generation $2,500 ~ $3,000 ~ $1,500 ~ $2,000 Current Mid-Cycle EBITDA Expected Mid-Cycle ~2030 EBITDA FCF FCF Growth 33% FCF/Adj. EBITDA Conversion ~65% based on historical 8-10% FCF yield $20-$25B valuation 72 |
| Closing Remarks Tony Will President and Chief Executive Officer 73 |
| Advantaged Production Unmatched Distribution & Logistics Network Operational Excellence Disciplined Capital Stewardship 74 OUR STRATEGY Leverage our unique capabilities |

| Our formula for success 17 30 39 52 2010 2015 2020 2025F(2) CAGR ~7% 75 Decreased share count 56% Increased production capacity 36% Estimated by December 31, 2025 Annual Nitrogen Equivalent Tons per 1,000 Shares Outstanding(1) |

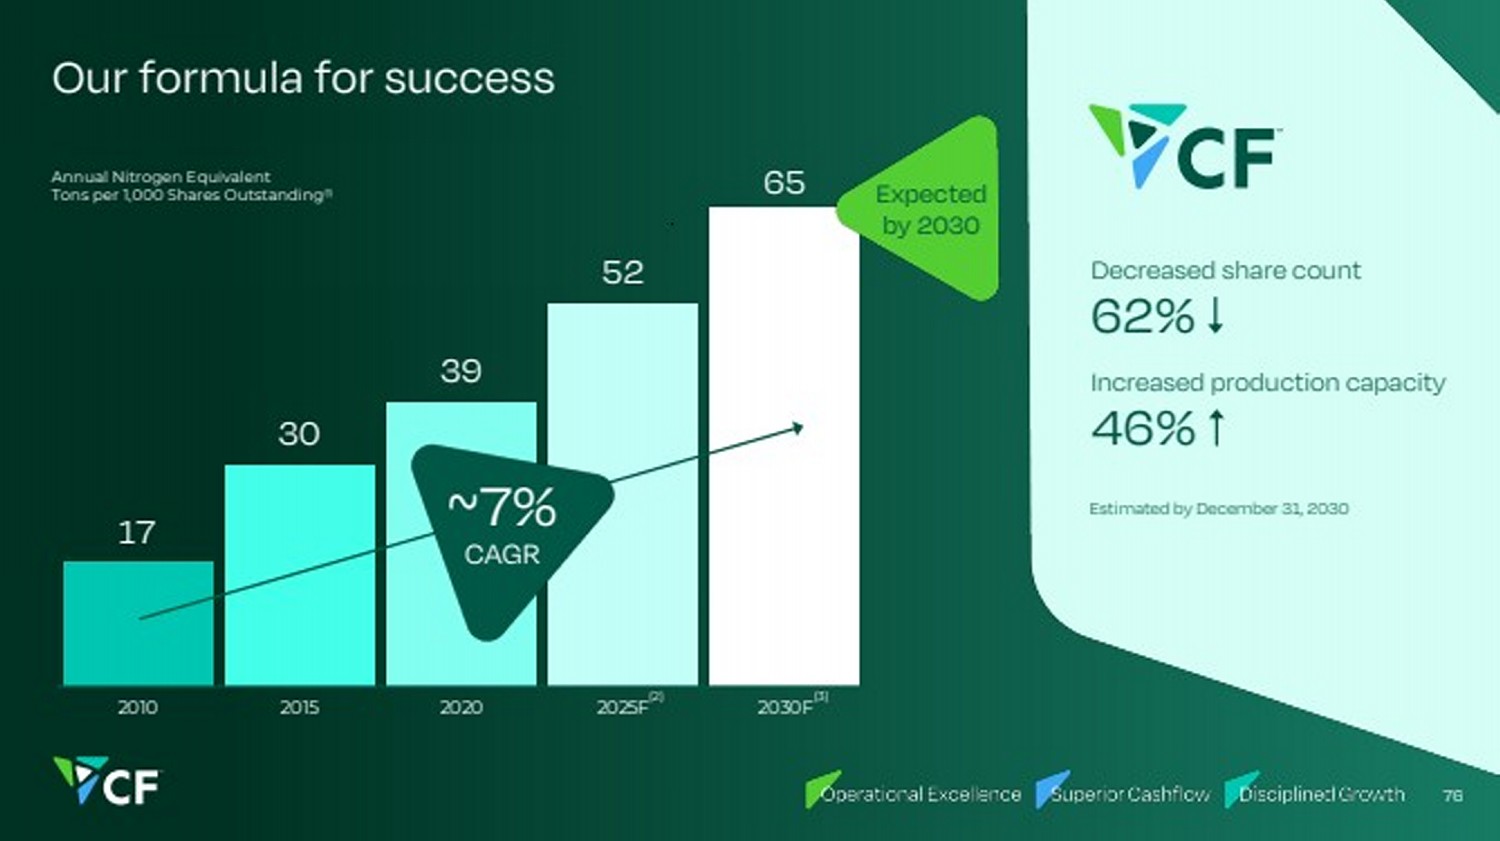
| Our formula for success 17 30 39 52 65 2010 2015 2020 2025F 2030F (2) (3) CAGR ~7% 76 Expected by 2030 Decreased share count 62% Increased production capacity 46% Annual Nitrogen Equivalent Tons per 1,000 Shares Outstanding(1) Estimated by December 31, 2030 |
| Q&A Moderator: Martin Jarosick 77 |

| Thank you! |
| Appendix |
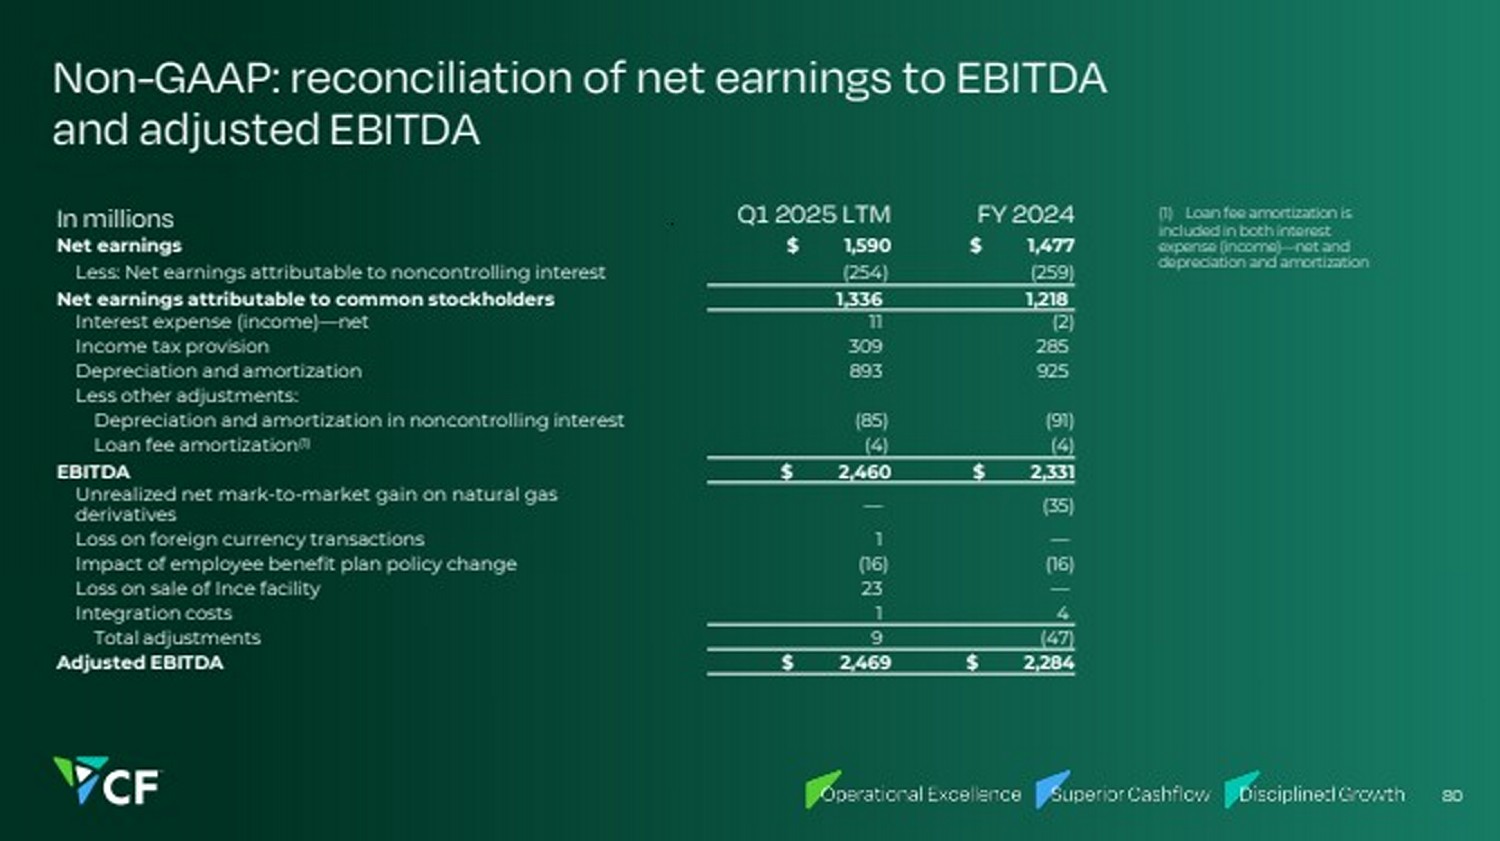
| Non-GAAP: reconciliation of net earnings to EBITDA and adjusted EBITDA (1) Loanfee amortizationis includedinbothinterest expense(income)—net and depreciationandamortization In millions Q1 2025 LTM FY 2024 Net earnings $ 1,590 $ 1,477 Less: Net earnings attributable to noncontrolling interest (254) (259) Net earnings attributable to common stockholders 1,336 1,218 Interest expense (income)—net 11 (2) Income tax provision 309 285 Depreciation and amortization 893 925 Less other adjustments: Depreciation and amortization in noncontrolling interest (85) (91) Loan fee amortization(1) (4) (4) EBITDA $ 2,460 $ 2,331 Unrealized net mark-to-market gain on natural gas derivatives — (35) Loss on foreign currency transactions 1 — Impact of employee benefit plan policy change (16) (16) Loss on sale of Ince facility 23 — Integration costs 1 4 Total adjustments 9 (47) Adjusted EBITDA $ 2,469 $ 2,284 80 |
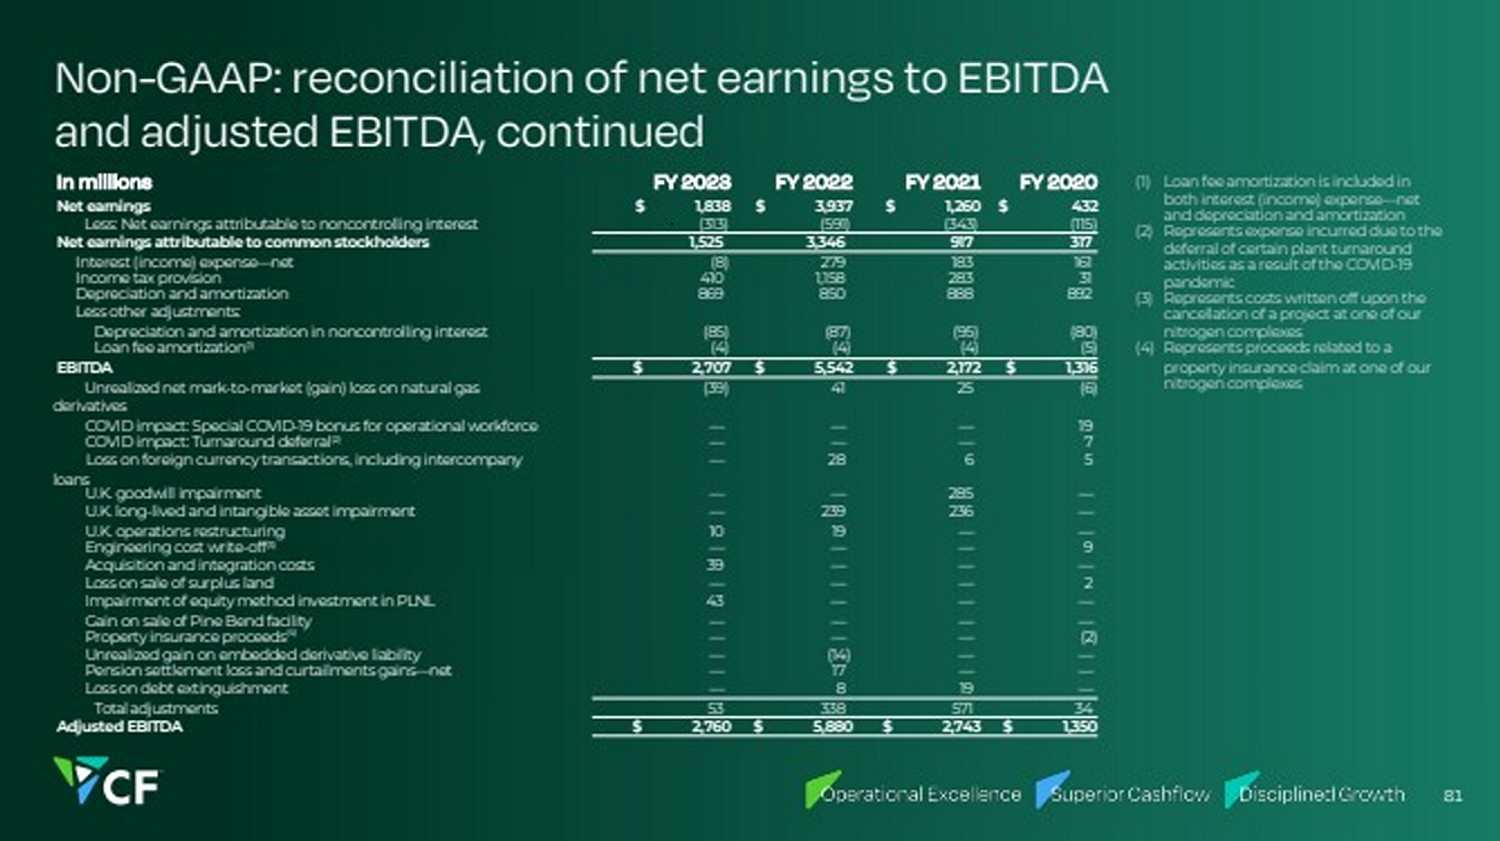
| Non-GAAP: reconciliation of net earnings to EBITDA and adjusted EBITDA, continued In millions FY 2023 FY 2022 FY 2021 FY 2020 Net earnings $ 1,838 $ 3,937 $ 1,260 $ 432 Less: Net earnings attributable to noncontrollinginterest (313) (591) (343) (115) Net earnings attributabletocommonstockholders 1,525 3,346 917 317 Interest (income) expense—net (8) 279 183 161 Income taxprovision 410 1,158 283 31 Depreciationand amortization 869 850 888 892 Less other adjustments: Depreciation and amortization in noncontrollinginterest (85) (87) (95) (80) Loanfee amortization(1) (4) (4) (4) (5) EBITDA $ 2,707 $ 5,542 $ 2,172 $ 1,316 Unrealizednet mark-to-market (gain) loss onnatural gas derivatives (39) 41 25 (6) COVIDimpact: Special COVID-19 bonus for operational workforce — — — 19 COVIDimpact: Turnarounddeferral(2) — — — 7 Loss onforeigncurrency transactions, includingintercompany loans — 28 6 5 U.K. goodwill impairment — — 285 — U.K. long-livedandintangible asset impairment — 239 236 — U.K. operations restructuring 10 19 — — Engineering cost write-off(3) — — — 9 Acquisitionandintegrationcosts 39 — — — Loss onsaleof surplus land — — — 2 Impairment of equitymethodinvestment inPLNL 43 — — — Gainonsaleof Pine Bendfacility — — — — Property insuranceproceeds(4) — — — (2) Unrealizedgainonembeddedderivative liability — (14) — — Pensionsettlement loss andcurtailmentsgains—net — 17 — — Loss ondebt extinguishment — 8 19 — Totaladjustments 53 338 571 34 AdjustedEBITDA $ 2,760 $ 5,880 $ 2,743 $ 1,350 (1) Loanfee amortizationis includedin bothinterest (income) expense—net anddepreciationandamortization (2) Represents expenseincurredduetothe deferral of certainplant turnaround activities as a result of the COVID-19 pandemic (3) Represents costs writtenoff uponthe cancellationof aproject at oneof our nitrogencomplexes (4) Represents proceeds relatedto a property insurance claimat one of our nitrogen complexes 81 |
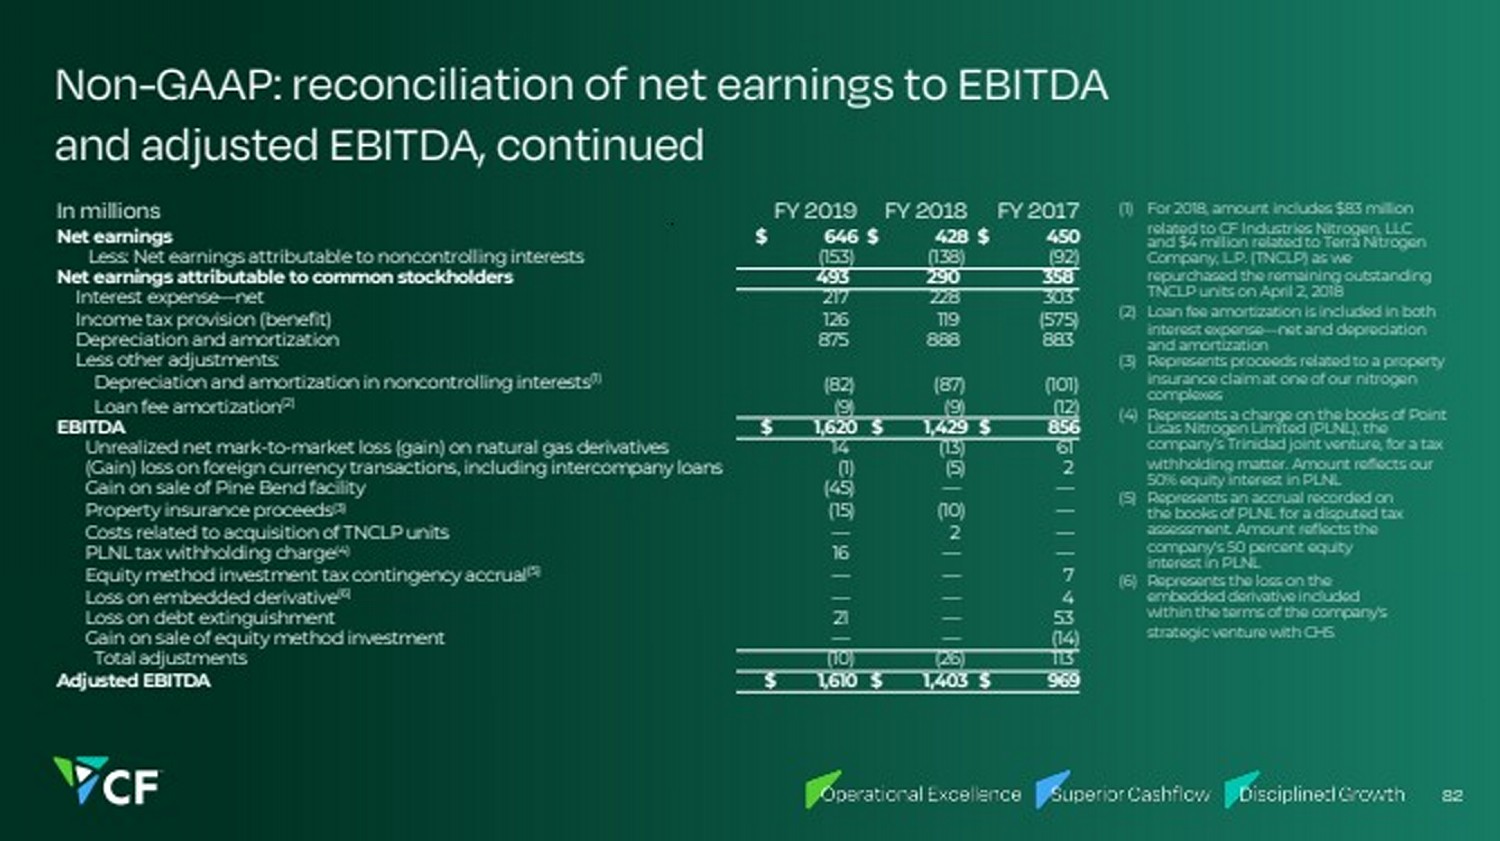
| Non-GAAP: reconciliation of net earnings to EBITDA and adjusted EBITDA, continued In millions FY 2019 FY 2018 FY 2017 Net earnings $ 646 $ 428 $ 450 Less: Net earnings attributable tononcontrollinginterests (153) (138) (92) Net earnings attributable to common stockholders 493 290 358 Interest expense—net 217 228 303 Income tax provision (benefit) 126 119 (575) Depreciation andamortization 875 888 883 Less other adjustments: Depreciationandamortization innoncontrollinginterests(1) (82) (87) (101) Loan fee amortization(2) (9) (9) (12) EBITDA $ 1,620 $ 1,429 $ 856 Unrealized net mark-to-market loss (gain) on natural gas derivatives 14 (13) 61 (Gain) loss on foreign currency transactions, includingintercompany loans (1) (5) 2 Gain on sale of Pine Bend facility (45) — — Property insurance proceeds(3) (15) (10) — Costs related to acquisition of TNCLP units — 2 — PLNLtax withholdingcharge(4) 16 — — Equity methodinvestment tax contingency accrual(5) — — 7 Loss on embedded derivative(6) — — 4 Loss on debt extinguishment 21 — 53 Gain on sale of equity method investment — — (14) Total adjustments (10) (26) 113 AdjustedEBITDA $ 1,610 $ 1,403 $ 969 (1) For 2018, amount includes $83 million related to CF Industries Nitrogen, LLC and $4 million related to Terra Nitrogen Company, L.P. (TNCLP) as we repurchased the remaining outstanding TNCLP units on April 2, 2018 (2) Loan fee amortization is included in both interest expense—net and depreciation and amortization (3) Represents proceeds related to a property insurance claimat one of our nitrogen complexes (4) Represents a charge on the books of Point Lisas Nitrogen Limited (PLNL), the company’s Trinidad joint venture, for a tax withholding matter. Amount reflects our 50% equity interest in PLNL (5) Represents an accrual recorded on the books of PLNL for a disputed tax assessment. Amount reflects the company's 50 percent equity interest in PLNL (6) Represents the loss onthe embeddedderivative included withinthe terms of the company's strategic venture with CHS 82 |
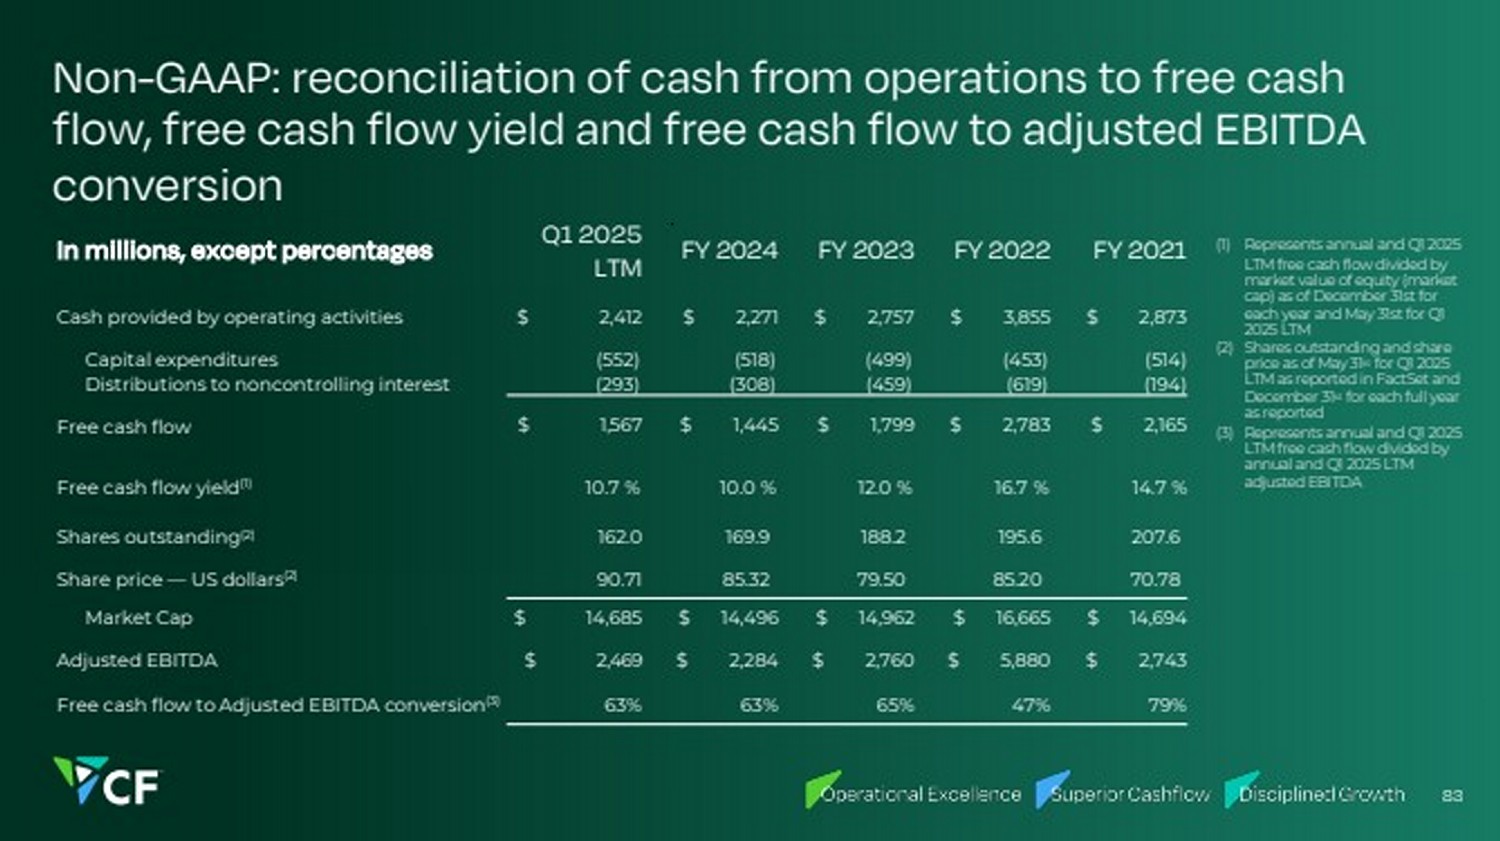
| Non-GAAP: reconciliation of cash from operations to free cash flow, free cash flow yield and free cash flow to adjusted EBITDA conversion In millions, except percentages Q1 2025 LTM FY 2024 FY 2023 FY 2022 FY 2021 Cash provided by operating activities $ 2,412 $ 2,271 $ 2,757 $ 3,855 $ 2,873 Capital expenditures (552) (518) (499) (453) (514) Distributions to noncontrolling interest (293) (308) (459) (619) (194) Free cash flow $ 1,567 $ 1,445 $ 1,799 $ 2,783 $ 2,165 Free cash flow yield(1) 10.7 % 10.0 % 12.0 % 16.7 % 14.7 % Shares outstanding(2) 162.0 169.9 188.2 195.6 207.6 Share price — US dollars(2) 90.71 85.32 79.50 85.20 70.78 Market Cap $ 14,685 $ 14,496 $ 14,962 $ 16,665 $ 14,694 Adjusted EBITDA $ 2,469 $ 2,284 $ 2,760 $ 5,880 $ 2,743 Free cash flow to Adjusted EBITDA conversion(3) 63% 63% 65% 47% 79% (1) Represents annual and Q1 2025 LTM free cash flow dividedby market value of equity (market cap) as of December 31st for each year and May 31st for Q1 2025 LTM (2) Shares outstanding and share price as of May 31st for Q1 2025 LTM as reported in FactSet and December 31st for each full year as reported (3) Represents annual and Q1 2025 LTMfree cashflowdividedby annual and Q1 2025 LTM adjustedEBITDA 83 |
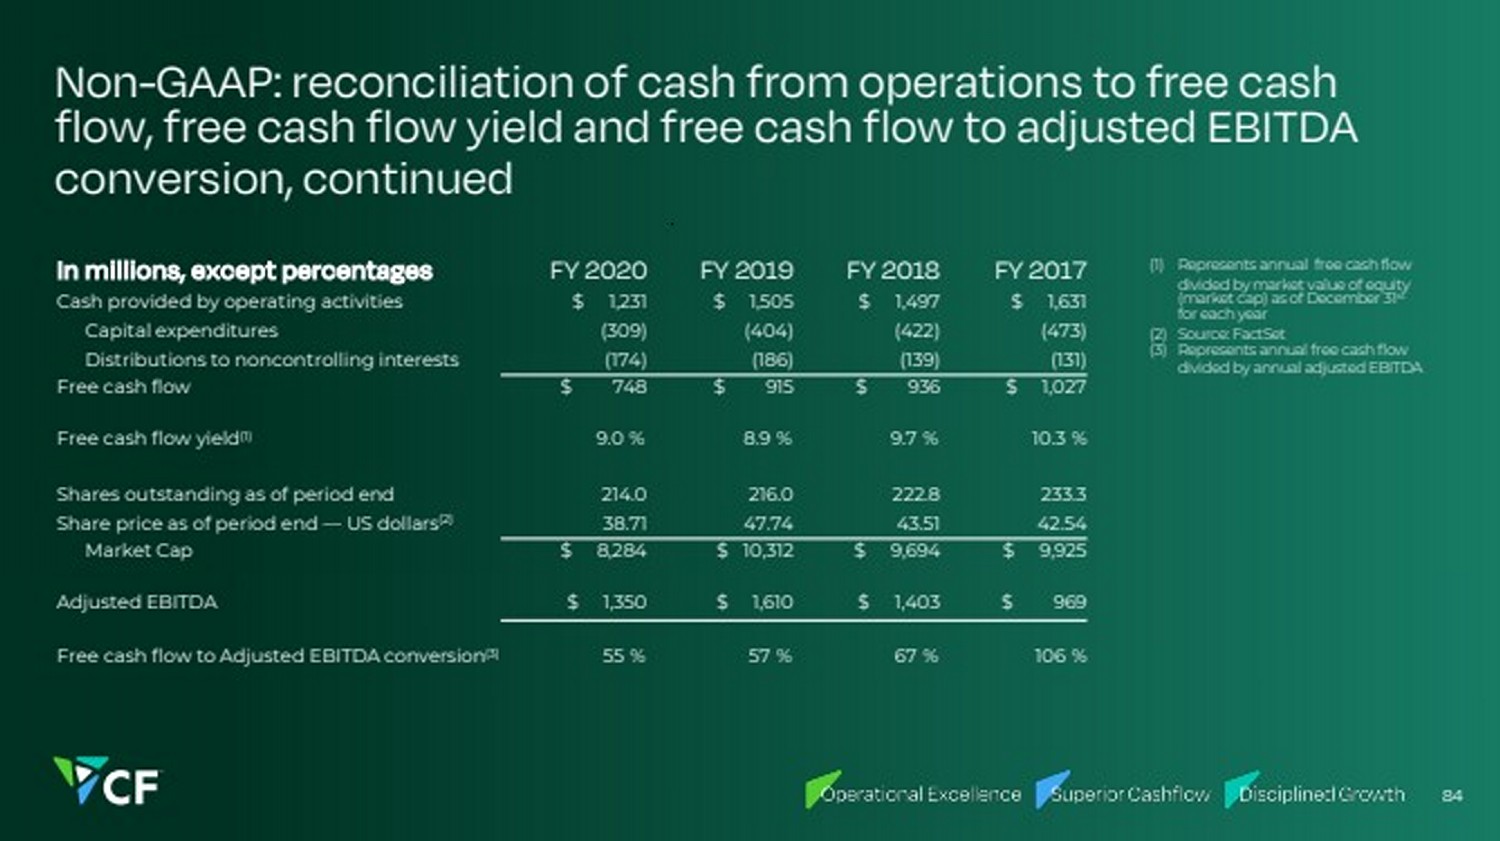
| Non-GAAP: reconciliation of cash from operations to free cash flow, free cash flow yield and free cash flow to adjusted EBITDA conversion, continued In millions, except percentages FY 2020 FY 2019 FY 2018 FY 2017 Cash provided by operating activities $ 1,231 $ 1,505 $ 1,497 $ 1,631 Capital expenditures (309) (404) (422) (473) Distributions to noncontrolling interests (174) (186) (139) (131) Free cash flow $ 748 $ 915 $ 936 $ 1,027 Free cash flow yield(1) 9.0 % 8.9 % 9.7 % 10.3 % Shares outstanding as of period end 214.0 216.0 222.8 233.3 Share price as of period end — US dollars(2) 38.71 47.74 43.51 42.54 Market Cap $ 8,284 $ 10,312 $ 9,694 $ 9,925 Adjusted EBITDA $ 1,350 $ 1,610 $ 1,403 $ 969 Free cash flow to Adjusted EBITDA conversion(3) 55 % 57 % 67 % 106 % (1) Represents annual free cashflow dividedbymarket valueof equity (market cap) as of December 31st for eachyear (2) Source: FactSet (3) Represents annual free cashflow divided by annual adjusted EBITDA 84 |
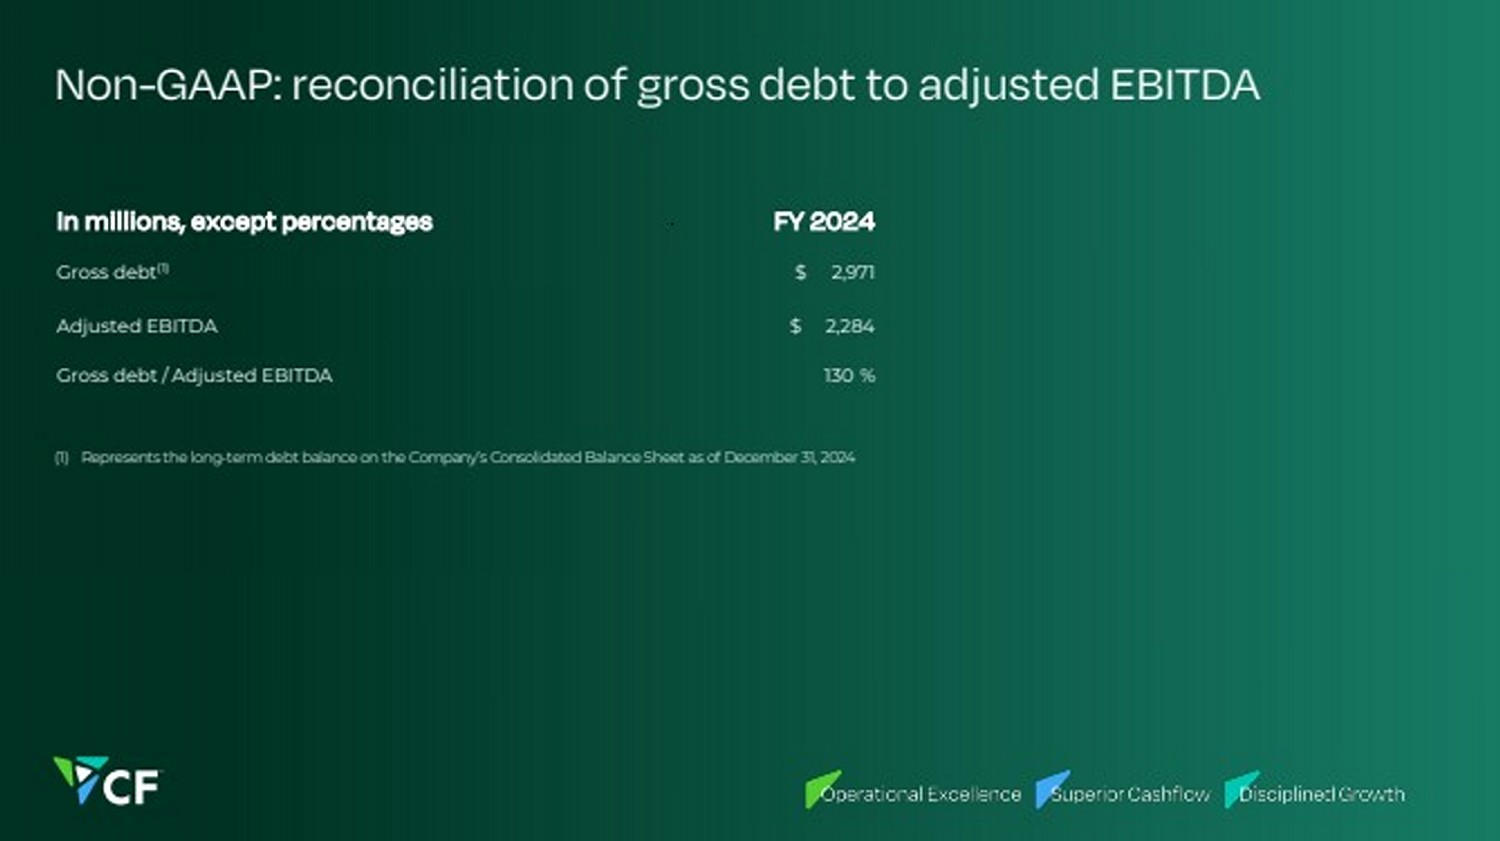
| Non-GAAP: reconciliation of gross debt to adjusted EBITDA In millions, except percentages FY 2024 Gross debt(1) $ 2,971 Adjusted EBITDA $ 2,284 Gross debt / Adjusted EBITDA 130 % (1) Represents the long-termdebt balanceonthe Company’s Consolidated BalanceSheet as of December 31, 2024 |
| Presentation Notes • MT refers to metric tons • Tons refers to short tons 86 |
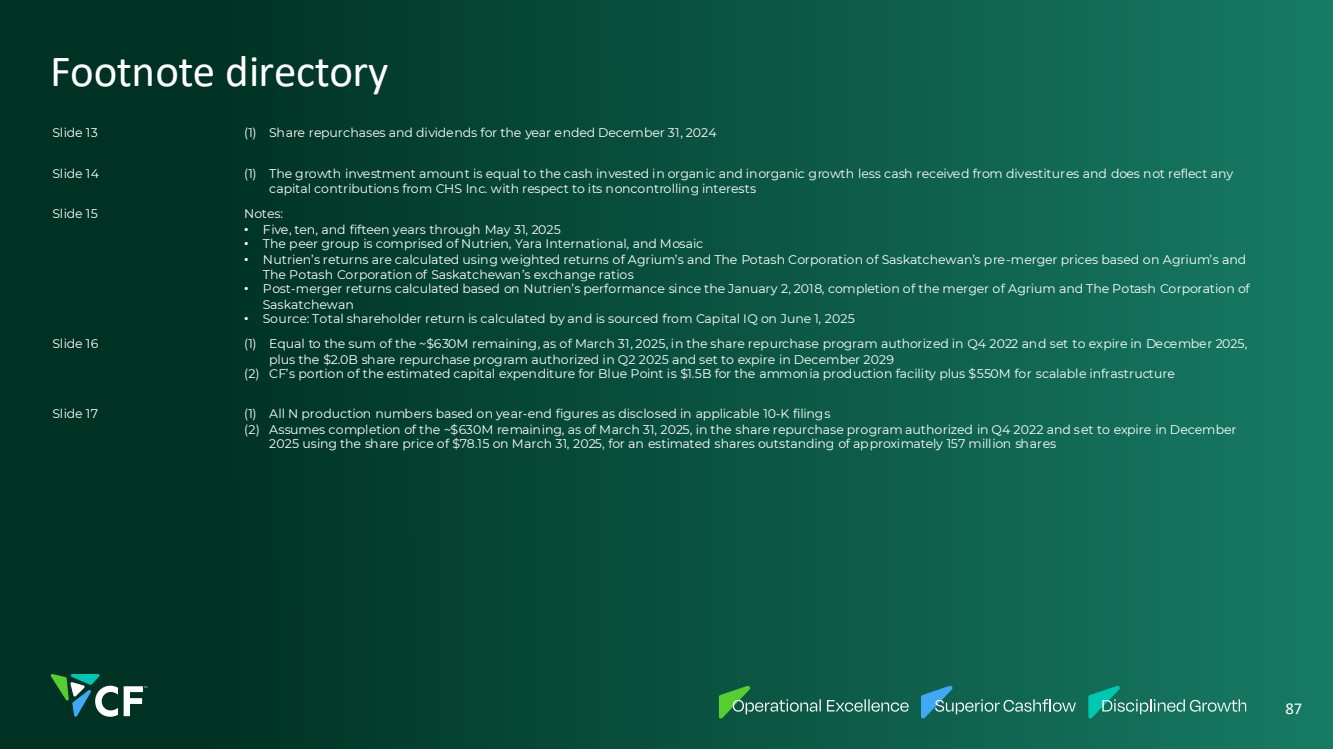
| Footnote directory Slide 19 (1) Share repurchases and dividends for the year ended December 31, 2024 Slide 20 (1) The growth investment amount is equal to the cash invested in organic and inorganic growth less cash received from divestitures and does not reflect any capital contributions from CHS Inc. with respect to its noncontrolling interests Slides 21, 22, 23, 24 Notes: • Five, ten, and fifteen years through May 31, 2025 • The peer group is comprised of Nutrien, Yara International, and Mosaic • Nutrien’s returns are calculated using weighted returns of Agrium’s and The Potash Corporation of Saskatchewan’s pre-merger prices based on Agrium’s and The Potash Corporation of Saskatchewan’s exchange ratios • Post-merger returns calculated based on Nutrien’s performance since the January 2, 2018, completion of the merger of Agrium and The Potash Corporation of Saskatchewan • Source: Total shareholder return is calculated by and is sourced from Capital IQ on June 1, 2025 Slide 25 (1) Equal to the sum of the ~$630M remaining, as of March 31, 2025, in the share repurchase program authorized in Q4 2022 and set to expire in December 2025, plus the $2.0B share repurchase program authorized in Q2 2025 and set to expire in December 2029 (2) CF’s portion of the estimated capital expenditure for Blue Point is $1.5B for the ammonia production facility plus $550M for scalable infrastructure Slide 26 (1) All N production numbers based on year-end figures as disclosed in applicable 10-K filings (2) Assumes completion of the ~$630M remaining, as of March 31, 2025, in the share repurchase program authorized in Q4 2022 and set to expire in December 2025 using the share price of $78.15 on March 31, 2025, for an estimated shares outstanding of approximately 157 million shares 87 |
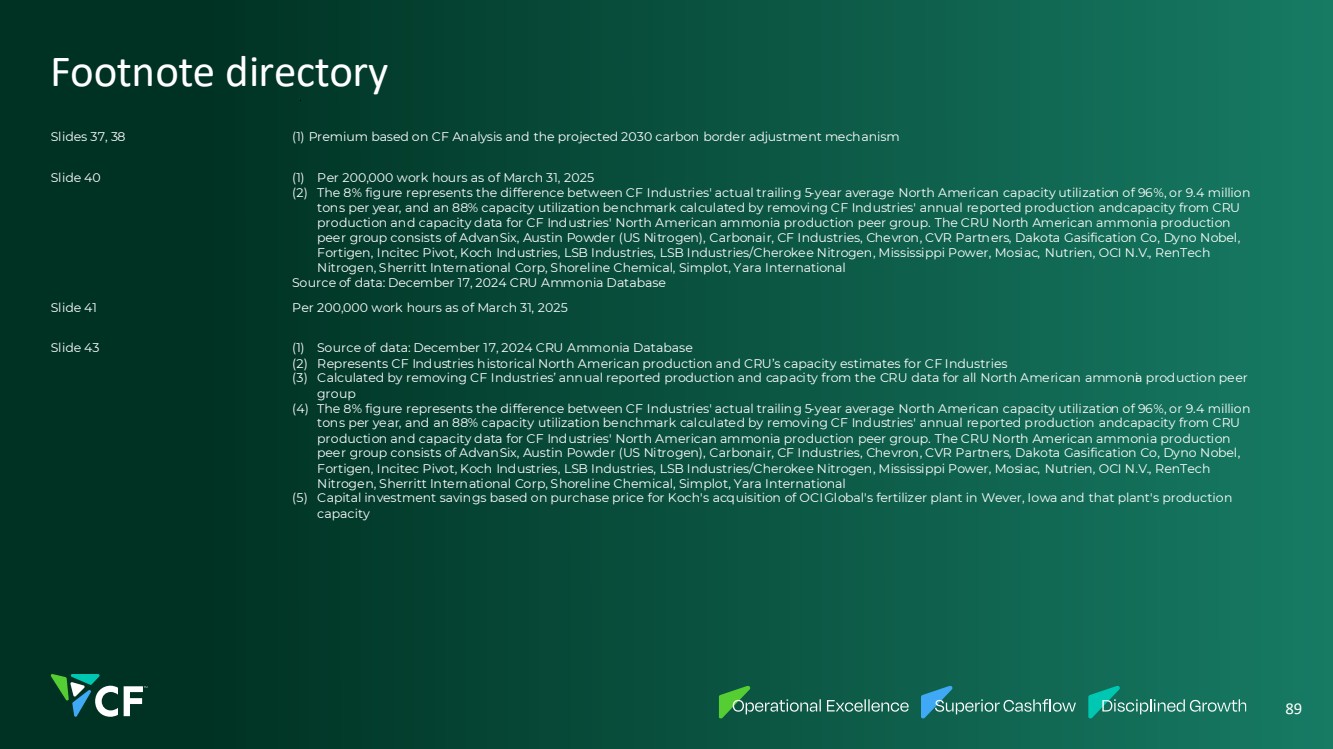
| Footnote directory Slide 31 (1) $/MMBtu equivalent is calculated using transport costs per ton of urea divided by 23 MMBtu per ton Source: Industry Publications, CF Analysis Slide 38, 39, 40, 41 Source: Industry Publications, CF Analysis Slide 42 Source: Industry Publications, CF Analysis Slide 43 (1) CRU demand growth includes traditional and clean energy growth at ~1.5% total CAGR Notes: • Protein consumption growth measured by nitrogen consumption associated with feed grains and hay/grassland • Population/income growth measured by nitrogen consumption associated with rice, food use for corn and wheat, fruits and vegetables, oilseeds, fibers, cash crops, and non-feed use of grains Source: IFA FUBC, FAO, USDA, Industry Publications, CF Analysis Slide 44 (1) CRU demand growth includes traditional and clean energy growth at ~1.5% total CAGR (2) Includes Blue Point (U.S.), Woodside (U.S), Qatar Energy (Qatar), TA’ZIZ (UAE) (3) Includes capacity additions in the U.S., India, Russia, Australia, Nigeria and Mexico Sources: Industry Publications, IFA, CF Analysis; capacity additions include CF-assessed firm projects Slide 45 Source: Argus and CF Analysis 88 |

| Footnote directory Slide 46, 47, 48 (1) Premium based on CF Analysis and the projected 2030 carbon border adjustment mechanism Slide 50 (1) Per 200,000 work hours as of March 31, 2025 (2) The 8% figure represents the difference between CF Industries' actual trailing 5-year average North American capacity utilization of 96%, or 9.4 million tons per year, and an 88% capacity utilization benchmark calculated by removing CF Industries' annual reported production and capacity from CRU production and capacity data for CF Industries' North American ammonia production peer group. The CRU North American ammonia production peer group consists of AdvanSix, Austin Powder (US Nitrogen), Carbonair, CF Industries, Chevron, CVR Partners, Dakota Gasification Co, Dyno Nobel, Fortigen, Incitec Pivot, Koch Industries, LSB Industries, LSB Industries/Cherokee Nitrogen, Mississippi Power, Mosiac, Nutrien, OCI N.V., RenTech Nitrogen, Sherritt International Corp, Shoreline Chemical, Simplot, Yara International Source of data: December 17, 2024 CRU Ammonia Database Slide 51 Per 200,000 work hours as of March 31, 2025 Slide 53 (1) Source of data: December 17, 2024 CRU Ammonia Database (2) Represents CF Industries historical North American production and CRU’s capacity estimates for CF Industries (3) Calculated by removing CF Industries’ annual reported production and capacity from the CRU data for all North American ammonia production peer group (4) The 8% figure represents the difference between CF Industries' actual trailing 5-year average North American capacity utilization of 96%, or 9.4 million tons per year, and an 88% capacity utilization benchmark calculated by removing CF Industries' annual reported production and capacity from CRU production and capacity data for CF Industries' North American ammonia production peer group. The CRU North American ammonia production peer group consists of AdvanSix, Austin Powder (US Nitrogen), Carbonair, CF Industries, Chevron, CVR Partners, Dakota Gasification Co, Dyno Nobel, Fortigen, Incitec Pivot, Koch Industries, LSB Industries, LSB Industries/Cherokee Nitrogen, Mississippi Power, Mosiac, Nutrien, OCI N.V., RenTech Nitrogen, Sherritt International Corp, Shoreline Chemical, Simplot, Yara International (5) Capital investment savings based on purchase price for Koch's acquisition of OCI Global's fertilizer plant in Wever, Iowa and that plant's production capacity 89 |
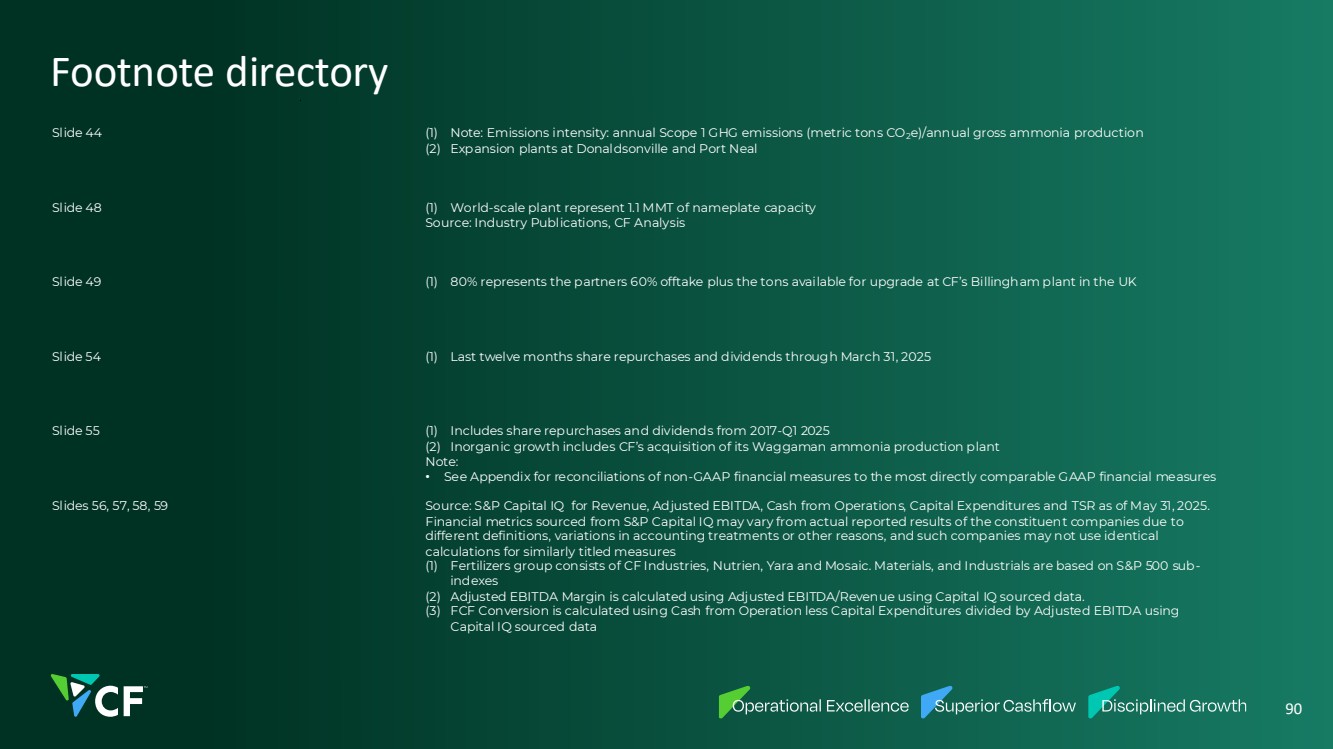
| Footnote directory Slide 54 (1) Note: Emissions intensity: annual Scope 1 GHG emissions (metric tons CO2e)/annual gross ammonia production (2) Expansion plants at Donaldsonville and Port Neal Slide 58 (1) World-scale plant represent 1.1 MMT of nameplate capacity Source: Industry Publications, CF Analysis Slide 59 (1) 80% represents the partners 60% offtake plus the tons available for upgrade at CF’s Billingham plant in the UK Slide 64 (1) Last twelve months share repurchases and dividends through March 31, 2025 Slide 65 (1) Includes share repurchases and dividends from 2017-Q1 2025 (2) Inorganic growth includes CF’s acquisition of its Waggaman ammonia production plant Note: • See Appendix for reconciliations of non-GAAP financial measures to the most directly comparable GAAP financial measures Slides 66, 67, 68, 69 Source: S&P Capital IQ for Revenue, Adjusted EBITDA, Cash from Operations, Capital Expenditures and TSR as of May 31, 2025. Financial metrics sourced from S&P Capital IQ may vary from actual reported results of the constituent companies due to different definitions, variations in accounting treatments or other reasons, and such companies may not use identical calculations for similarly titled measures (1) Fertilizers group consists of CF Industries, Nutrien, Yara and Mosaic. Materials, and Industrials are based on S&P 500 sub-indexes (2) Adjusted EBITDA Margin is calculated using Adjusted EBITDA/Revenue using Capital IQ sourced data. (3) FCF Conversion is calculated using Cash from Operation less Capital Expenditures divided by Adjusted EBITDA using Capital IQ sourced data 90 |
| Footnote directory 91 Slide 70 Source: Capital IQ as of May 31, 2025 (1) CF's FCF Yield calculated as using Q1 LTM FCF divided by a market cap of $14.7M as of May 31, 2025 (2) FCF Yield 2025E uses consensus analyst estimates as of May 31, 2025 as reported in Capital IQ. Fertilizers group consists of CF Industries, Nutrien, Yara and Mosaic. Materials and Industrials are based on S&P 500 sub-indexes. Financial estimates sourced from Capital IQ may vary from any estimates of the constituent companies due to different definitions, variations in accounting treatments or other reasons, and such companies may not use identical calculations for similarly titled estimates Slide 71 (1) As of December 31, 2024 Slide 72 (1) Equal to the sum of the ~$630M remaining, as of March 31, 2025, in the share repurchase program authorized in Q4 2022 and set to expire in December 2025, plus the $2.0B share repurchase program authorized in Q2 2025 and set to expire in December 2029. (2) As of May 30, 2025 (3) CF portion of Blue Point Capex of $1.5B plus common facilities of $550M for a total estimated capital of $2B Slide 74 Note: • See Appendix for reconciliations of non-GAAP financial measures to the most directly comparable GAAP financial measures Slide 75 (1) Source: CF Analysis Slide 76 (1) Sourced from FertWk base Slide 77 (1)Based on 2024 sales volumes of approximately 18.9 million product tons, 2024 gas consumption of 346 million MMBtus and 2024 nitrogen product sales price relationships. Changes in product prices and gas costs are not applied to the CHS minority interest or industrial contracts where CF Industries is naturally hedged against changes in product prices and gas costs. Excludes EBITDA benefit of UK carbon credit sales (2)Assumes that a $50 per ton change in urea prices is also applied proportionally to all nitrogen products and is equivalent to a $34.78 per ton change in UAN price, $36.96 per ton change in AN price, $89.14 per ton change in ammonia price, and $21.20 per ton change in the price of the Other segment Slide 79 (1) Based on successful implementation of announced CCS projects within the CF network (2) Includes Donaldsonville CCS & Yazoo City CCS projects |
| Footnote directory 92 Slide 85, 86 (1) All N production numbers based on year-end figures per applicable 10-K filings (2) Assumes completion of the ~$630M remaining. as of March 31, 2025, in the current share repurchase authorization authorized in Q4 2022 and set to expire in December 2025, using the share price of $78.15 on March 31, 2025, for an estimated shares outstanding of approximately 157 million shares (3) Assumes completing the new $2 billion dollar share repurchase program authorized in Q2 2025 by December 31, 2029, reflecting an estimated shares outstanding of ~135 million |