| Fourth Quarter and Full Fiscal Year 2025 Earnings Conference Call JUNE 24, 2025 |

| [2] © 2025 AEROVIRONMENT, INC. This presentation contains "forward-looking statements" as that term is defined in the Private Securities Litigation Reform Act of 1995. Forward-looking statements include, without limitation, any statement that may predict, forecast, indicate or imply future results, performance or achievements, and may contain words such as “will,” “believe,” “anticipate,” “expect,” “estimate,” “intend,” “project,” “plan,” or words or phrases with similar meaning. Forward-looking statements are based on current expectations, forecasts and assumptions that involve risks and uncertainties, including, but not limited to, economic, competitive, governmental and technological factors outside of our control, that may cause our business, strategy or actual results to differ materially from the forward-looking statements. Factors that could cause actual results to differ materially from the forward-looking statements include, but are not limited to, the impact of our ability to successfully close and integrate acquisitions into our operations and avoid disruptions from acquisition transactions that will harm our business; the recording of goodwill and other intangible assets as part of acquisitions that are subject to potential impairments in the future and any realization of such impairments; any actual or threatened disruptions to our relationships with our distributors, suppliers, customers and employees, including shortages in components for our products, including due to restrictions and sanctions imposed by foreign governments; the ability to timely and sufficiently integrate international operations into our ongoing business and compliance programs; reliance on sales to the U.S. government, including uncertainties in classification, pricing or potentially burdensome imposed terms for certain types of government contracts; availability of U.S. government funding for defense procurement and R&D programs; our ability to win U.S. and international government R&D and procurement programs, including foreign military financing aid; changes in the timing and/or amount of government spending, including due to continuing resolutions; adverse impacts of a U.S. government shutdown; our ability to realize the anticipated benefits of the BlueHalo transaction; our reliance on limited relationships to fund our development of HAPS UAS; our ability to execute contracts for anticipated sales, perform under such contracts and other existing contracts and obtain new contracts; risks related to our international business, including compliance with export control laws; the extensive and increasing regulatory requirements governing our contracts with the U.S. government and international customers; the consequences to our financial position, business and reputation that could result from failing to comply with such regulatory requirements; unexpected technical and marketing difficulties inherent in major research and product development efforts; the impact of potential security and cyber threats or the risk of unauthorized access to and resulting misuse of our, our customers’ and/or our suppliers’ information and systems; failure to remain a market innovator, to create new market opportunities or to expand into new markets; our ability to increase production capacity to support anticipated growth; unexpected changes in significant operating expenses, including components and raw materials; failure to develop new products or integrate new technology into current products; any increase in litigation activity or unfavorable results in legal proceedings, including pending class actions; or litigation that may arise from our recent acquisition of BlueHalo; our ability to respond and adapt to legal, regulatory and government budgetary changes; our ability to comply with the covenants in our loan documents; and our merger agreement with BlueHalo; our ability to attract and retain skilled employees, including retention of BlueHalo employees; the impact of inflation; and general economic and business conditions in the United States and elsewhere in the world; and the failure to establish and maintain effective internal control over financial reporting. For a further list and description of such risks and uncertainties, see the reports we file with the Securities and Exchange Commission. We do not intend, and undertake no obligation, to update any forward-looking statements, whether as a result of new information, future events or otherwise. Safe Harbor Statement |
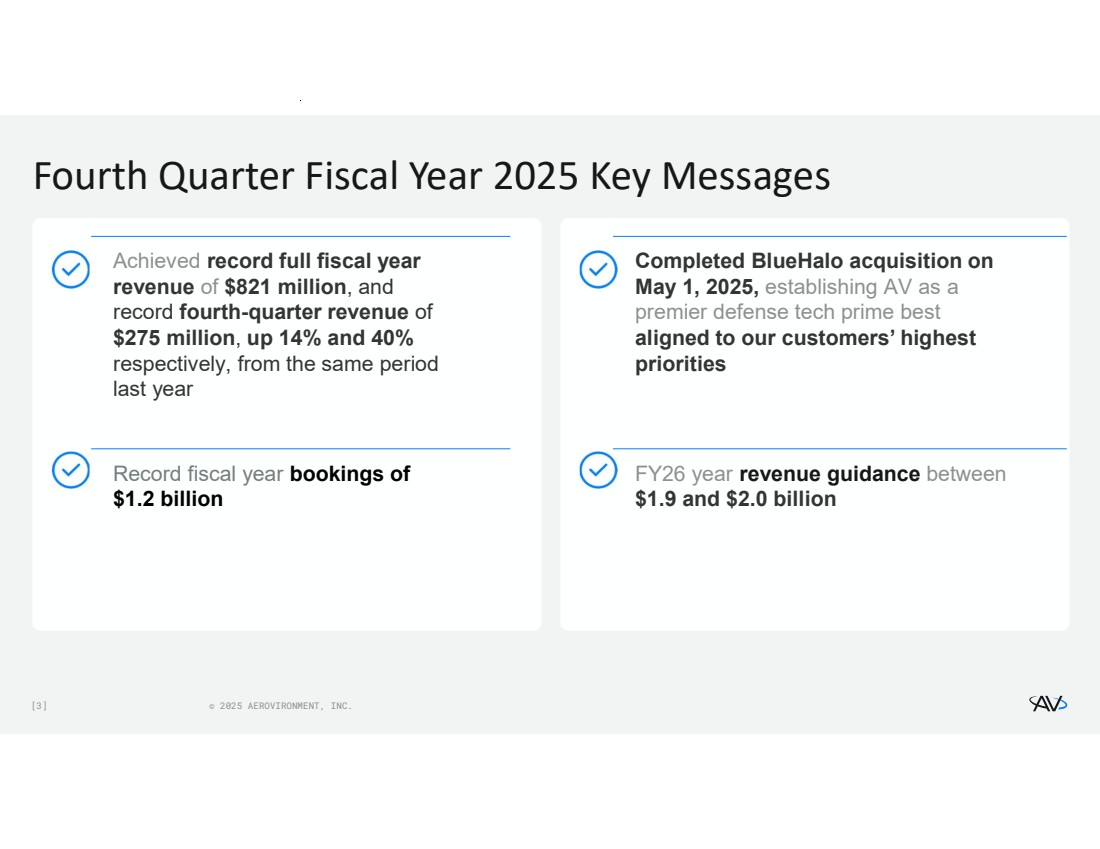
| [3] © 2025 AEROVIRONMENT, INC. Completed BlueHalo acquisition on May 1, 2025, establishing AV as a premier defense tech prime best aligned to our customers’ highest priorities Achieved record full fiscal year revenue of $821 million, and record fourth-quarter revenue of $275 million, up 14% and 40% respectively, from the same period last year FY26 year revenue guidance between $1.9 and $2.0 billion Record fiscal year bookings of $1.2 billion Fourth Quarter Fiscal Year 2025 Key Messages |
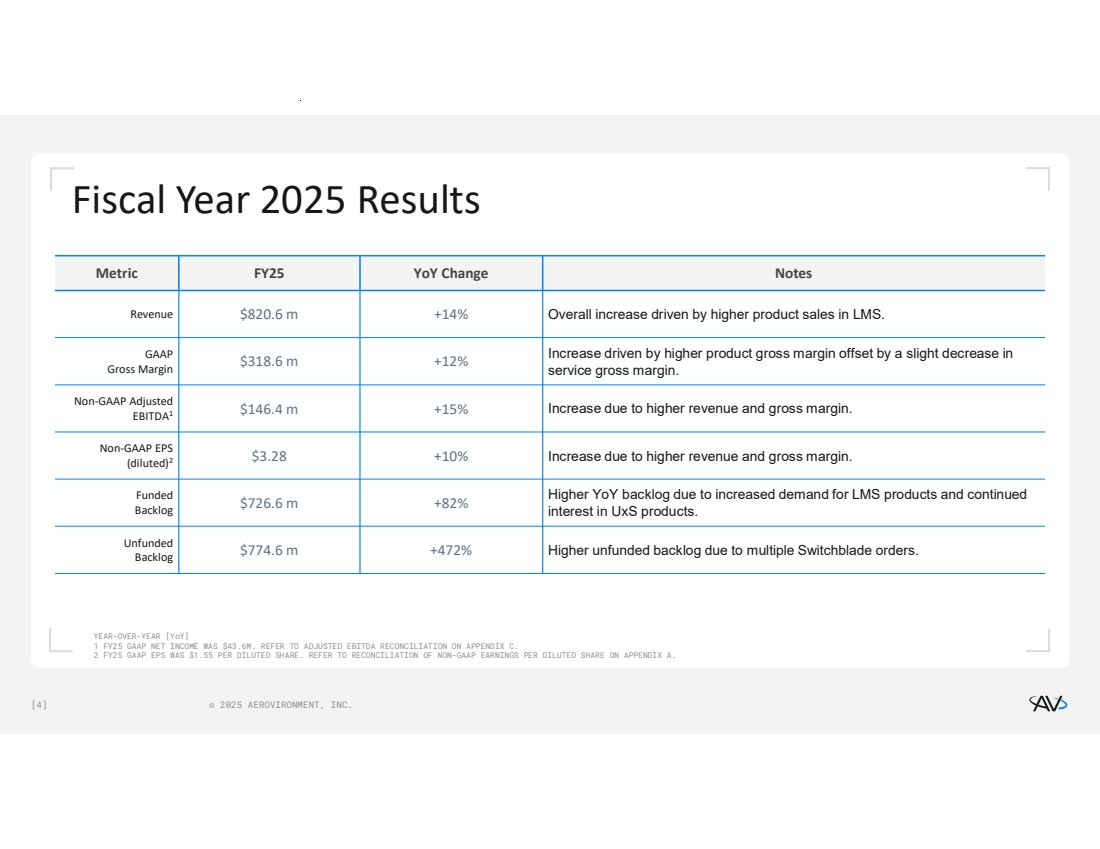
| [4] © 2025 AEROVIRONMENT, INC. Fiscal Year 2025 Results YEAR-OVER-YEAR [YoY] 1 FY25 GAAP NET INCOME WAS $43.6M. REFER TO ADJUSTED EBITDA RECONCILIATION ON APPENDIX C. 2 FY25 GAAP EPS WAS $1.55 PER DILUTED SHARE. REFER TO RECONCILIATION OF NON-GAAP EARNINGS PER DILUTED SHARE ON APPENDIX A. Metric FY25 YoY Change Notes Revenue $820.6 m +14% Overall increase driven by higher product sales in LMS. Increase driven by higher product gross margin offset by a slight decrease in service gross margin. $318.6 m +12% GAAP Gross Margin $146.4 m +15% Increase due to higher revenue and gross margin. Non-GAAP Adjusted EBITDA1 $3.28 +10% Increase due to higher revenue and gross margin. Non-GAAP EPS (diluted)2 Higher YoY backlog due to increased demand for LMS products and continued interest in UxS products. $726.6 m +82% Funded Backlog $774.6 m +472% Higher unfunded backlog due to multiple Switchblade orders. Unfunded Backlog |
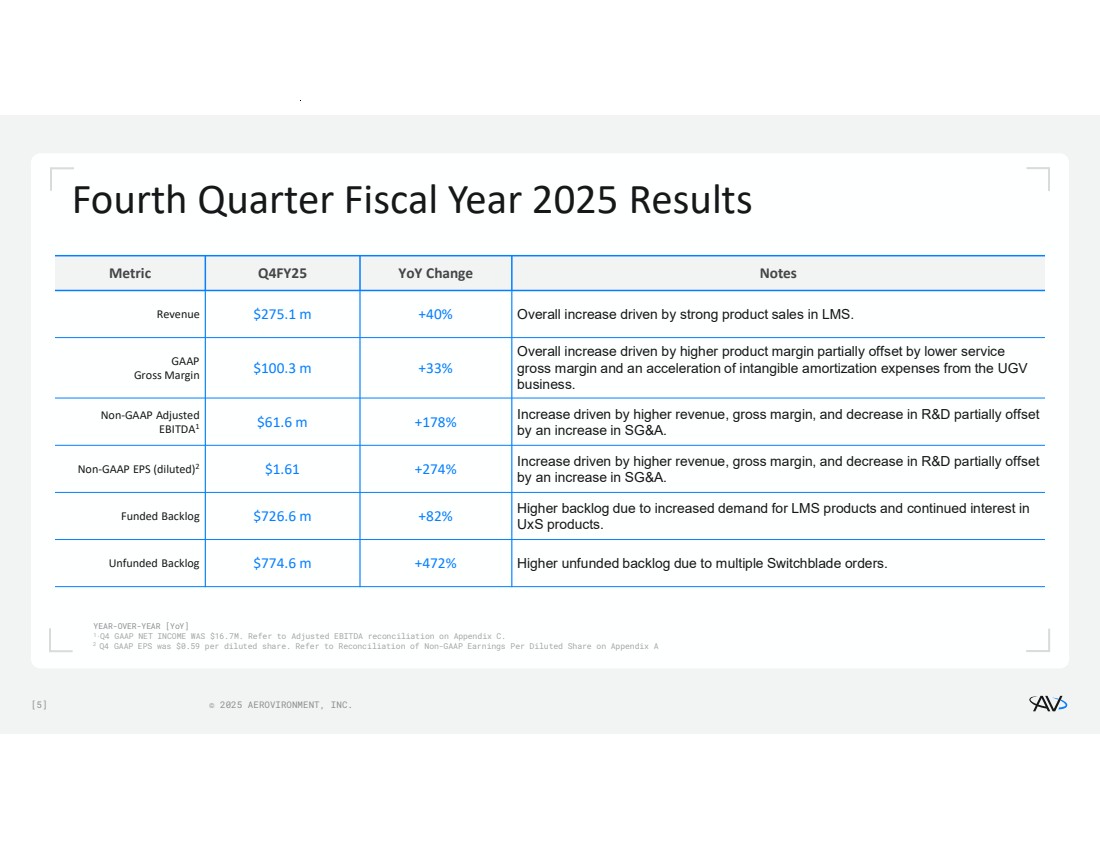
| [5] © 2025 AEROVIRONMENT, INC. Fourth Quarter Fiscal Year 2025 Results YEAR-OVER-YEAR [YoY] 1.Q4 GAAP NET INCOME WAS $16.7M. Refer to Adjusted EBITDA reconciliation on Appendix C. 2 Q4 GAAP EPS was $0.59 per diluted share. Refer to Reconciliation of Non-GAAP Earnings Per Diluted Share on Appendix A Metric Q4FY25 YoY Change Notes Revenue $275.1 m +40% Overall increase driven by strong product sales in LMS. Overall increase driven by higher product margin partially offset by lower service gross margin and an acceleration of intangible amortization expenses from the UGV business. $100.3 m +33% GAAP Gross Margin Increase driven by higher revenue, gross margin, and decrease in R&D partially offset by an increase in SG&A. $61.6 m +178% Non-GAAP Adjusted EBITDA1 Increase driven by higher revenue, gross margin, and decrease in R&D partially offset by an increase in SG&A. Non-GAAP EPS (diluted)2 $1.61 +274% Higher backlog due to increased demand for LMS products and continued interest in UxS products. Funded Backlog $726.6 m +82% Unfunded Backlog $774.6 m +472% Higher unfunded backlog due to multiple Switchblade orders. |
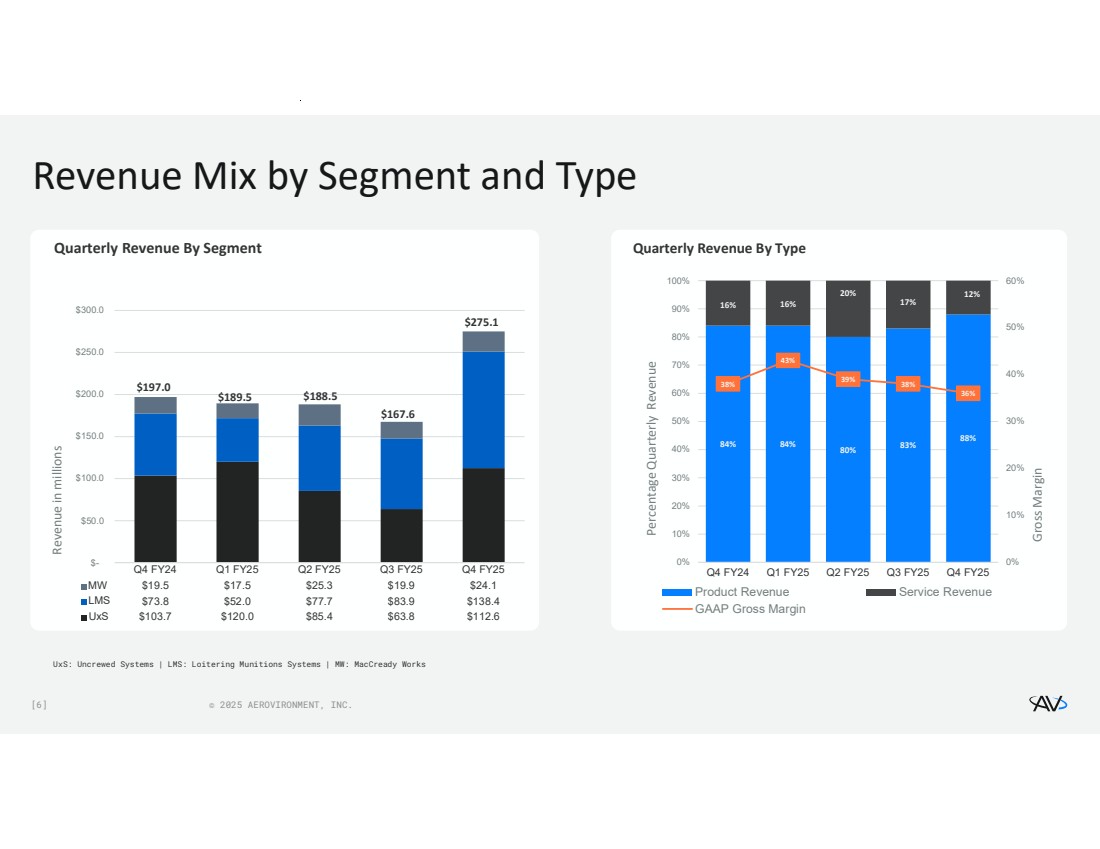
| [6] © 2025 AEROVIRONMENT, INC. $- $50.0 $100.0 $150.0 $200.0 $250.0 $300.0 Q4 FY24 Q1 FY25 Q2 FY25 Q3 FY25 Q4 FY25 MW $19.5 $17.5 $25.3 $19.9 $24.1 LMS $73.8 $52.0 $77.7 $83.9 $138.4 UxS $103.7 $120.0 $85.4 $63.8 $112.6 Revenue in millions $167.6 $189.5 $197.0 $188.5 $275.1 Revenue Mix by Segment and Type 84% 84% 80% 83% 88% 16% 16% 20% 17% 12% 38% 43% 39% 38% 36% 0% 10% 20% 30% 40% 50% 60% 0% 10% 20% 30% 40% 50% 60% 70% 80% 90% 100% Q4 FY24 Q1 FY25 Q2 FY25 Q3 FY25 Q4 FY25 Gross Margin Percentage Quarterly Revenue Product Revenue Service Revenue GAAP Gross Margin UxS: Uncrewed Systems | LMS: Loitering Munitions Systems | MW: MacCready Works Quarterly Revenue By Segment Quarterly Revenue By Type |
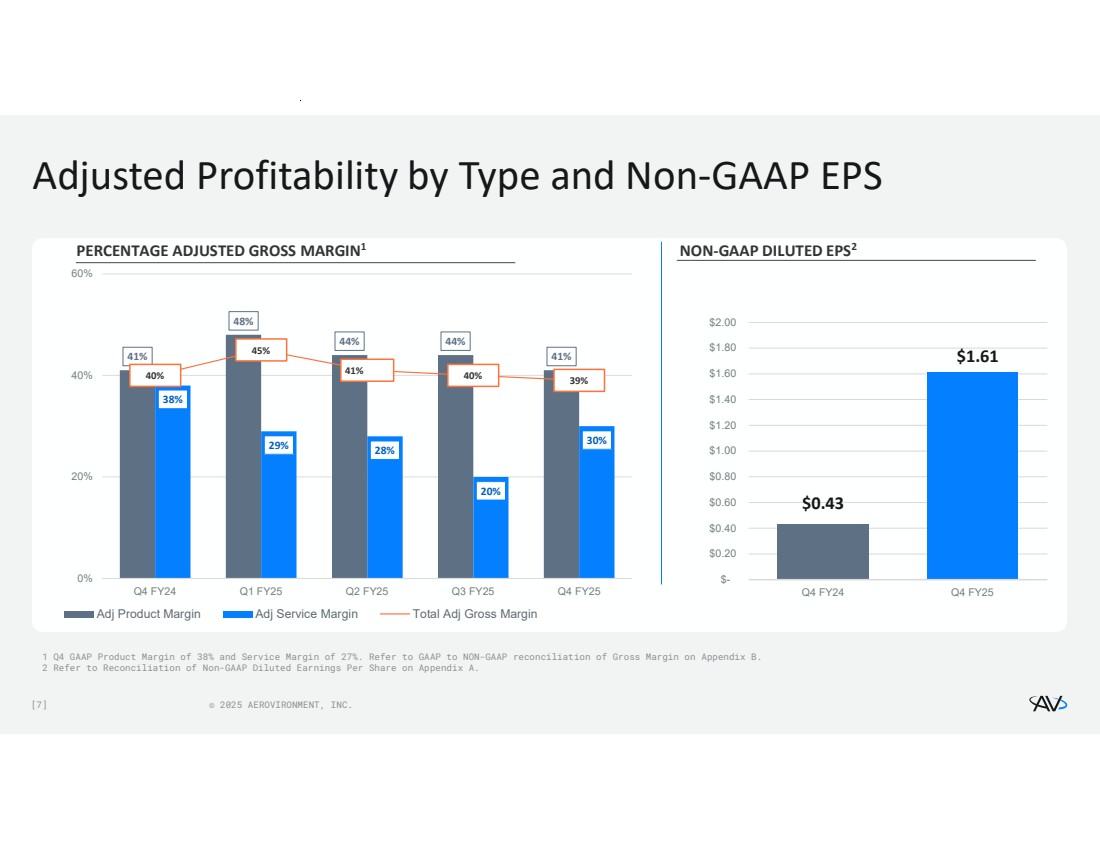
| [7] © 2025 AEROVIRONMENT, INC. Adjusted Profitability by Type and Non-GAAP EPS 1 Q4 GAAP Product Margin of 38% and Service Margin of 27%. Refer to GAAP to NON-GAAP reconciliation of Gross Margin on Appendix B. 2 Refer to Reconciliation of Non-GAAP Diluted Earnings Per Share on Appendix A. 41% 48% 44% 44% 41% 38% 29% 28% 20% 30% 40% 45% 41% 40% 39% 0% 20% 40% 60% Q4 FY24 Q1 FY25 Q2 FY25 Q3 FY25 Q4 FY25 Adj Product Margin Adj Service Margin Total Adj Gross Margin $0.43 $1.61 $- $0.20 $0.40 $0.60 $0.80 $1.00 $1.20 $1.40 $1.60 $1.80 $2.00 Q4 FY24 Q4 FY25 Slide 7 NON-GAAP DILUTED EPS2 PERCENTAGE ADJUSTED GROSS MARGIN1 |
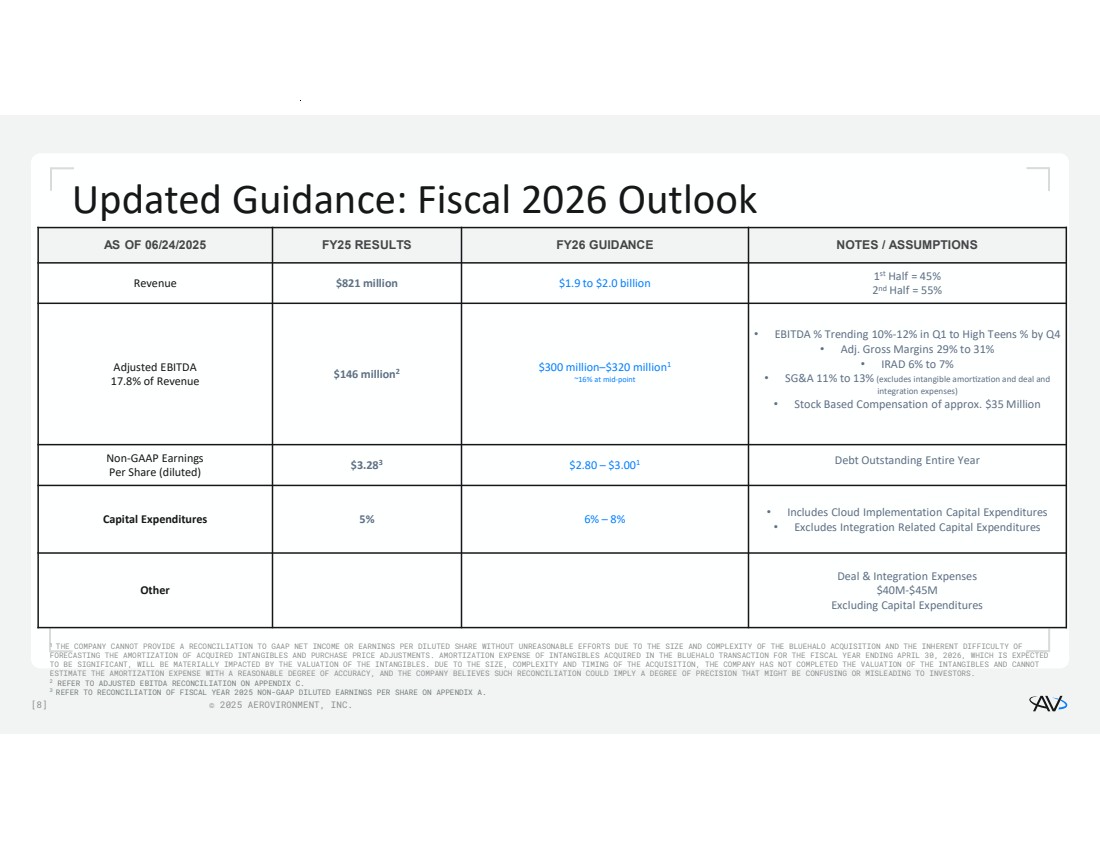
| [8] © 2025 AEROVIRONMENT, INC. Updated Guidance: Fiscal 2026 Outlook 1 THE COMPANY CANNOT PROVIDE A RECONCILIATION TO GAAP NET INCOME OR EARNINGS PER DILUTED SHARE WITHOUT UNREASONABLE EFFORTS DUE TO THE SIZE AND COMPLEXITY OF THE BLUEHALO ACQUISITION AND THE INHERENT DIFFICULTY OF FORECASTING THE AMORTIZATION OF ACQUIRED INTANGIBLES AND PURCHASE PRICE ADJUSTMENTS. AMORTIZATION EXPENSE OF INTANGIBLES ACQUIRED IN THE BLUEHALO TRANSACTION FOR THE FISCAL YEAR ENDING APRIL 30, 2026, WHICH IS EXPECTED TO BE SIGNIFICANT, WILL BE MATERIALLY IMPACTED BY THE VALUATION OF THE INTANGIBLES. DUE TO THE SIZE, COMPLEXITY AND TIMING OF THE ACQUISITION, THE COMPANY HAS NOT COMPLETED THE VALUATION OF THE INTANGIBLES AND CANNOT ESTIMATE THE AMORTIZATION EXPENSE WITH A REASONABLE DEGREE OF ACCURACY, AND THE COMPANY BELIEVES SUCH RECONCILIATION COULD IMPLY A DEGREE OF PRECISION THAT MIGHT BE CONFUSING OR MISLEADING TO INVESTORS. 2 REFER TO ADJUSTED EBITDA RECONCILIATION ON APPENDIX C. 3 REFER TO RECONCILIATION OF FISCAL YEAR 2025 NON-GAAP DILUTED EARNINGS PER SHARE ON APPENDIX A. AS OF 06/24/2025 FY25 RESULTS FY26 GUIDANCE NOTES / ASSUMPTIONS 1 st Half = 45% 2nd Half = 55% Revenue $821 million $1.9 to $2.0 billion • EBITDA % Trending 10%-12% in Q1 to High Teens % by Q4 • Adj. Gross Margins 29% to 31% • IRAD 6% to 7% • SG&A 11% to 13% (excludes intangible amorƟzaƟon and deal and integration expenses) • Stock Based Compensation of approx. $35 Million $300 million–$320 million1 ~16% at mid-point $146 million2 Adjusted EBITDA 17.8% of Revenue Debt Outstanding Entire Year $2.80 – $3.001 $3.28 Non-GAAP Earnings 3 Per Share (diluted) • Includes Cloud Implementation Capital Expenditures • Excludes Integration Related Capital Expenditures Capital Expenditures 5% 6% – 8% Deal & Integration Expenses $40M-$45M Excluding Capital Expenditures Other |
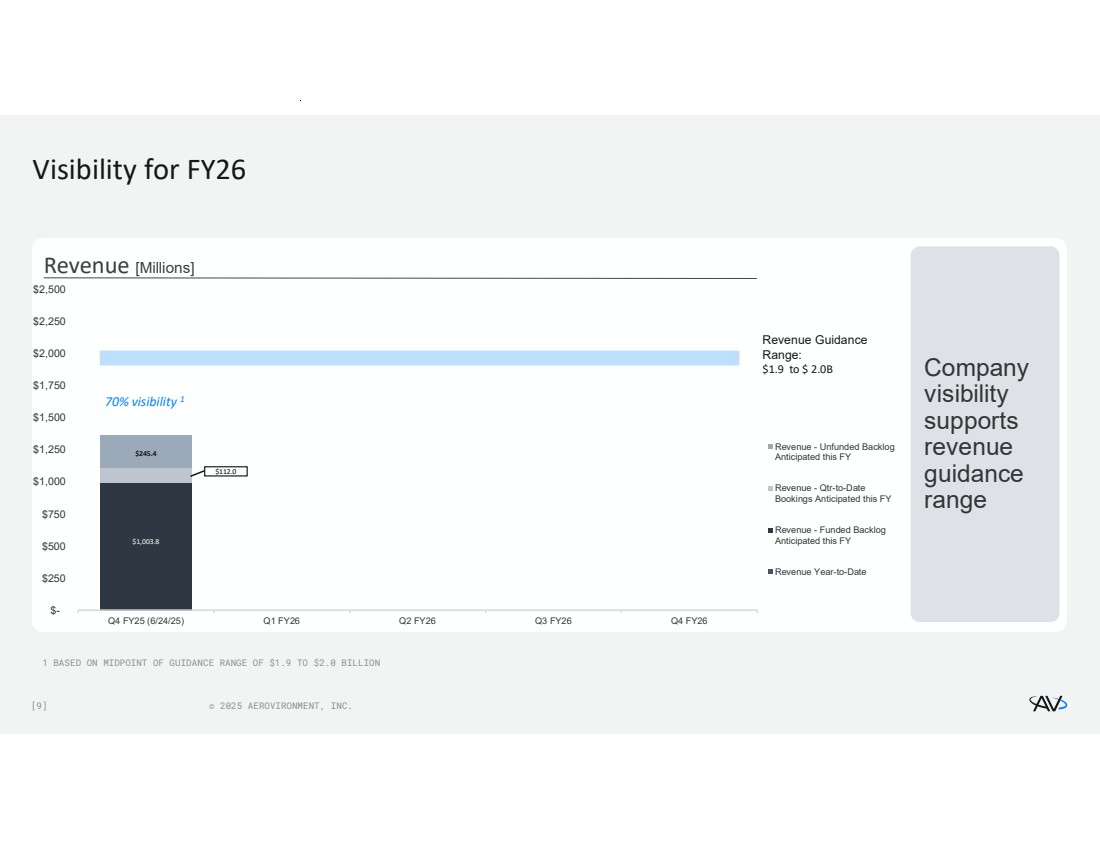
| [9] © 2025 AEROVIRONMENT, INC. Revenue [Millions] Visibility for FY26 1 BASED ON MIDPOINT OF GUIDANCE RANGE OF $1.9 TO $2.0 BILLION $1,003.8 $245.4 $- $250 $500 $750 $1,000 $1,250 $1,500 $1,750 $2,000 $2,250 $2,500 Q4 FY25 (6/24/25) Q1 FY26 Q2 FY26 Q3 FY26 Q4 FY26 Revenue - Unfunded Backlog Anticipated this FY Revenue - Qtr-to-Date Bookings Anticipated this FY Revenue - Funded Backlog Anticipated this FY Revenue Year-to-Date $112.0 Company visibility supports revenue guidance range 70% visibility 1 Revenue Guidance Range: $1.9 to $ 2.0B |
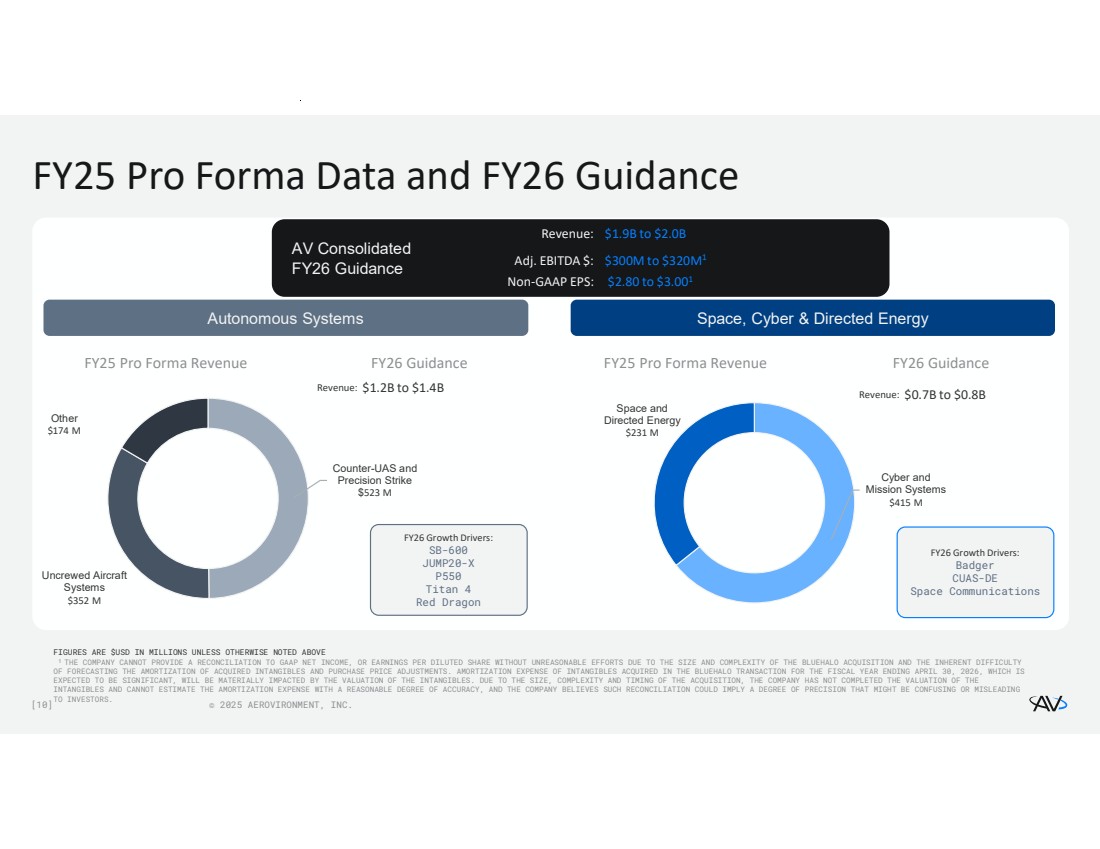
| [10] © 2025 AEROVIRONMENT, INC. FY25 Pro Forma Data and FY26 Guidance FIGURES ARE $USD IN MILLIONS UNLESS OTHERWISE NOTED ABOVE 1 THE COMPANY CANNOT PROVIDE A RECONCILIATION TO GAAP NET INCOME, OR EARNINGS PER DILUTED SHARE WITHOUT UNREASONABLE EFFORTS DUE TO THE SIZE AND COMPLEXITY OF THE BLUEHALO ACQUISITION AND THE INHERENT DIFFICULTY OF FORECASTING THE AMORTIZATION OF ACQUIRED INTANGIBLES AND PURCHASE PRICE ADJUSTMENTS. AMORTIZATION EXPENSE OF INTANGIBLES ACQUIRED IN THE BLUEHALO TRANSACTION FOR THE FISCAL YEAR ENDING APRIL 30, 2026, WHICH IS EXPECTED TO BE SIGNIFICANT, WILL BE MATERIALLY IMPACTED BY THE VALUATION OF THE INTANGIBLES. DUE TO THE SIZE, COMPLEXITY AND TIMING OF THE ACQUISITION, THE COMPANY HAS NOT COMPLETED THE VALUATION OF THE INTANGIBLES AND CANNOT ESTIMATE THE AMORTIZATION EXPENSE WITH A REASONABLE DEGREE OF ACCURACY, AND THE COMPANY BELIEVES SUCH RECONCILIATION COULD IMPLY A DEGREE OF PRECISION THAT MIGHT BE CONFUSING OR MISLEADING TO INVESTORS. Counter-UAS and Precision Strike $523 M Uncrewed Aircraft Systems $352 M Other $174 M FY25 Pro Forma Revenue FY26 Guidance FY26 Growth Drivers: SB-600 JUMP20-X P550 Titan 4 Red Dragon FY25 Pro Forma Revenue FY26 Guidance Revenue: $1.2B to $1.4B FY26 Growth Drivers: Badger CUAS-DE Space Communications AV Consolidated FY26 Guidance Revenue: $1.9B to $2.0B $300M to $320M1 Adj. EBITDA $: $2.80 to $3.00 Non-GAAP EPS: 1 Autonomous Systems Space, Cyber & Directed Energy Cyber and Mission Systems $415 M Space and Directed Energy $231 M Revenue: $0.7B to $0.8B |
| Financial Tables |

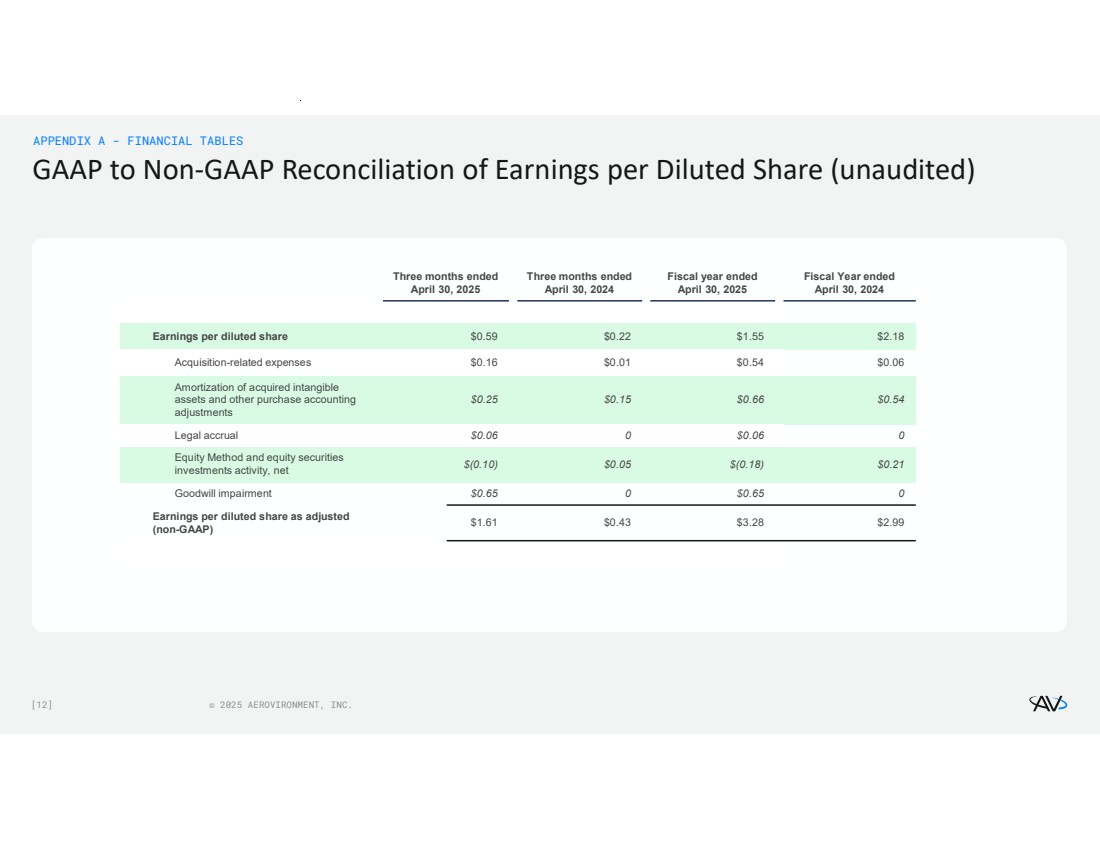
| [12] © 2025 AEROVIRONMENT, INC. GAAP to Non-GAAP Reconciliation of Earnings per Diluted Share (unaudited) APPENDIX A - FINANCIAL TABLES Fiscal Year ended April 30, 2024 Fiscal year ended April 30, 2025 Three months ended April 30, 2024 Three months ended April 30, 2025 Earnings per diluted share $0.59 $0.22 $1.55 $2.18 Acquisition-related expenses $0.16 $0.01 $0.54 $0.06 $0.25 $0.15 $0.66 $0.54 Amortization of acquired intangible assets and other purchase accounting adjustments Legal accrual $0.06 0 $0.06 0 $(0.10) $0.05 $(0.18) $0.21 Equity Method and equity securities investments activity, net Goodwill impairment $0.65 0 $0.65 0 $1.61 $0.43 $3.28 $2.99 Earnings per diluted share as adjusted (non-GAAP) |
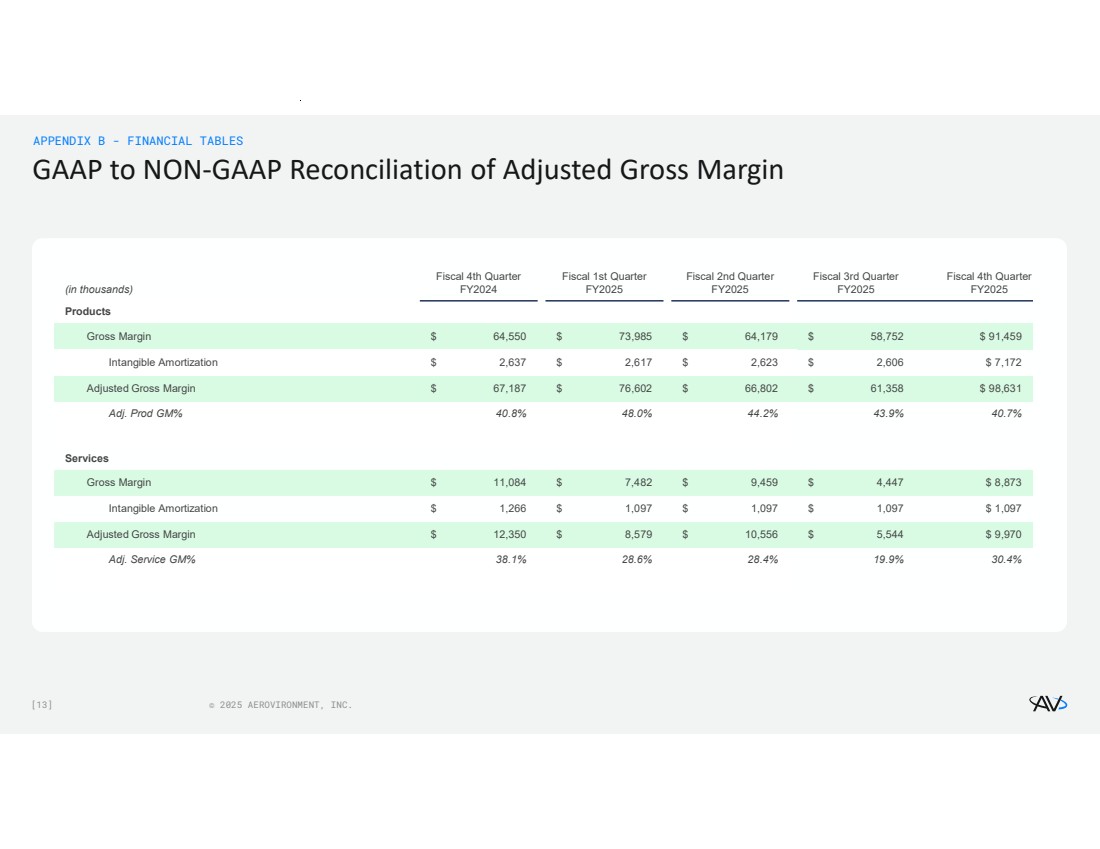
| [13] © 2025 AEROVIRONMENT, INC. GAAP to NON-GAAP Reconciliation of Adjusted Gross Margin APPENDIX B - FINANCIAL TABLES Fiscal 4th Quarter FY2025 Fiscal 3rd Quarter FY2025 Fiscal 2nd Quarter FY2025 Fiscal 1st Quarter FY2025 Fiscal 4th Quarter (in thousands) FY2024 Products Gross Margin $ 64,550 $ 73,985 $ 64,179 $ 58,752 $ 91,459 Intangible Amortization $ 2,637 $ 2,617 $ 2,623 $ 2,606 $ 7,172 Adjusted Gross Margin $ 67,187 $ 76,602 $ 66,802 $ 61,358 $ 98,631 Adj. Prod GM% 40.8% 48.0% 44.2% 43.9% 40.7% Services Gross Margin $ 11,084 $ 7,482 $ 9,459 $ 4,447 $ 8,873 Intangible Amortization $ 1,266 $ 1,097 $ 1,097 $ 1,097 $ 1,097 Adjusted Gross Margin $ 12,350 $ 8,579 $ 10,556 $ 5,544 $ 9,970 Adj. Service GM% 38.1% 28.6% 28.4% 19.9% 30.4% |
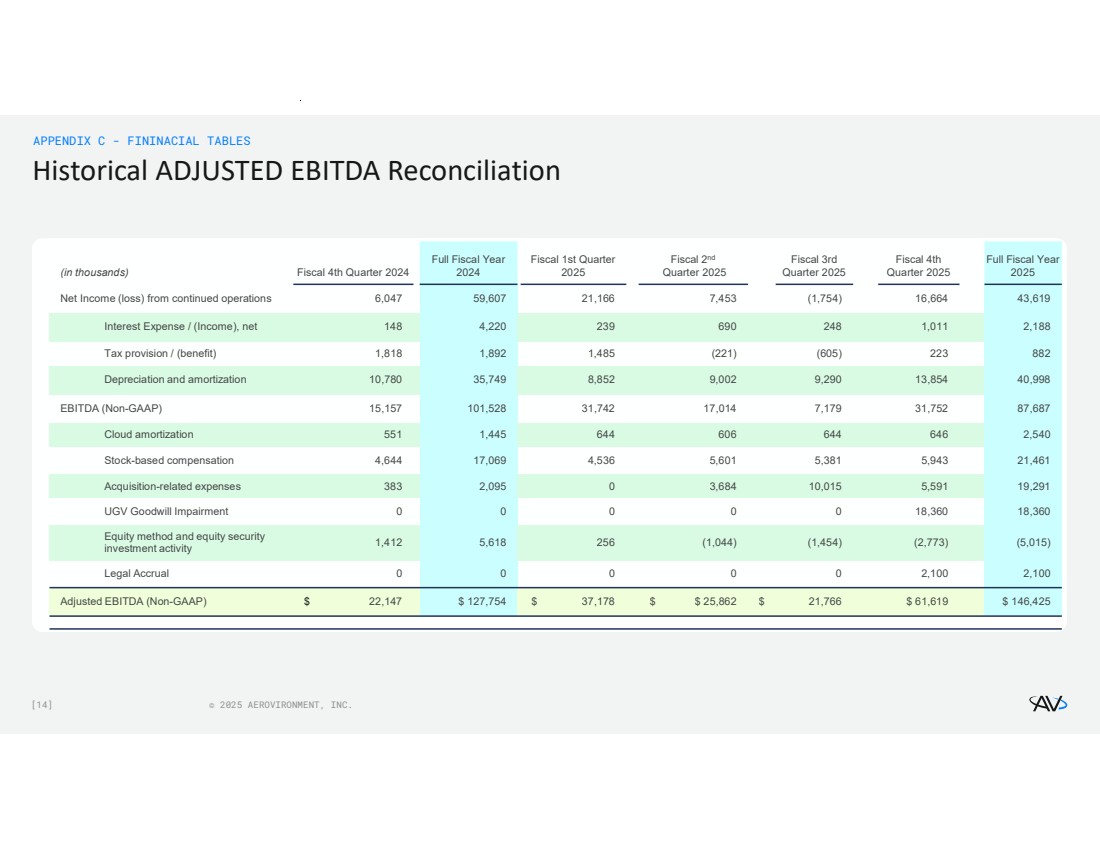
| [14] © 2025 AEROVIRONMENT, INC. Historical ADJUSTED EBITDA Reconciliation APPENDIX C - FININACIAL TABLES Full Fiscal Year 2025 Fiscal 4th Quarter 2025 Fiscal 3rd Quarter 2025 Fiscal 2nd Quarter 2025 Fiscal 1st Quarter 2025 Full Fiscal Year (in thousands) Fiscal 4th Quarter 2024 2024 Net Income (loss) from continued operations 6,047 59,607 21,166 7,453 (1,754) 16,664 43,619 Interest Expense / (Income), net 148 4,220 239 690 248 1,011 2,188 Tax provision / (benefit) 1,818 1,892 1,485 (221) (605) 223 882 Depreciation and amortization 10,780 35,749 8,852 9,002 9,290 13,854 40,998 EBITDA (Non-GAAP) 15,157 101,528 31,742 17,014 7,179 31,752 87,687 Cloud amortization 551 1,445 644 606 644 646 2,540 Stock-based compensation 4,644 17,069 4,536 5,601 5,381 5,943 21,461 Acquisition-related expenses 383 2,095 0 3,684 10,015 5,591 19,291 UGV Goodwill Impairment 0 0 0 0 0 18,360 18,360 1,412 5,618 256 (1,044) (1,454) (2,773) (5,015) Equity method and equity security investment activity Legal Accrual 0 0 0 0 0 2,100 2,100 Adjusted EBITDA (Non-GAAP) $ 22,147 $ 127,754 $ 37,178 $ $ 25,862 $ 21,766 $ 61,619 $ 146,425 |