The accompanying bar chart and table provide some indication of the risks of investing in the fund. The bar chart shows changes in the fund’s performance from year to year for Class A shares. The table shows the average annual total returns of each class of the fund that has been in operation for at least one full calendar year and also compares the fund’s performance with the average annual total returns of a broad measure of market performance and an additional index with characteristics relevant to the fund. Performance for classes other than those shown may vary from the performance shown to the extent the expenses for those classes differ. The fund makes updated performance information, including its current net asset value per share, available at www.franklintempleton.com.
The fund’s past performance (before and after taxes) is not necessarily an indication of how the fund will perform in the future.
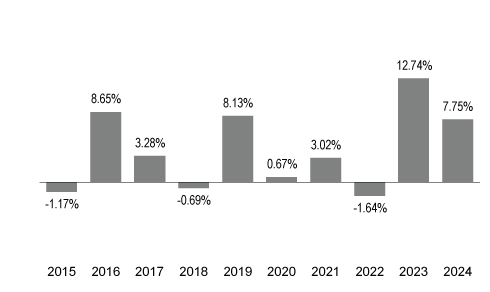
Sales charges are not reflected in the accompanying bar chart, and if those charges were included, returns would be less than those shown.
Annual total returns for class A shares before sales charges
|
| Best Quarter: | 6/30/2020 | 7.47% |
| Worst Quarter: | 3/31/2020 | -11.70% |
| As of March 31, 2025, the year-to-date return was -0.09%. | ||
| Share class | 1 year | 5 years | 10 years |
| Class A before taxes | 5.32% | 3.91% | 3.73% |
| Class A after taxes on distributions | 2.28% | 1.69% | 1.74% |
| Class A after taxes on distributions and sale of fund shares | 3.09% | 2.00% | 1.95% |
| Class C before taxes | 6.08% | 3.63% | 3.34% |
| Class R before taxes* | 7.62% | 4.15% | 3.71% |
| Class R6 before taxes | 8.23% | 4.75% | 4.28% |
| Class Y before taxes | 8.16% | 4.65% | 4.23% |
| Bloomberg U.S. Aggregate Index (no deduction for fees, expenses or taxes) | 1.25% | -0.33% | 1.35% |
| Morningstar LSTA U.S. Leveraged Loan Index (no deduction for fees, expenses or taxes) | 9.01% | 5.86% | 5.15% |
| * | Performance for class R6 shares prior to their inception (5/22/18) is derived from the historical performance of class Y and has not been adjusted for the lower investor servicing fees applicable to class R6 shares; had it been adjusted, returns would have been higher. |
After-tax returns reflect the historical highest individual federal marginal income tax rates and do not reflect state and local taxes. Actual after-tax returns depend on an investor’s tax situation and may differ from those shown. After-tax returns are shown for class A shares only and will vary for other classes. These after-tax returns do not apply if you hold your fund shares through a 401(k) plan, an IRA, or another tax-advantaged arrangement.
Class C share performance reflects conversion to class A shares after eight years.
Important data provider notices and terms are available at www.franklintempletondatasources.com. All data is subject to change.