Pay vs Performance Disclosure - USD ($)
Mar. 31, 2025
Mar. 31, 2024
Mar. 31, 2023
Mar. 31, 2022
Mar. 31, 2021
Pay-Versus-Performance
Table The following table provides information regarding “compensation actually paid” to our Chief Executive Officer and President, who is our principal executive officer (“”), and our other
PEO
non-PEO
NEOs for each of our fiscal years ended March 31, 2025, 2024, 2023, 2022 and 2021 and our financial performance for each such fiscal year: Value of Initial $100 Investment Based on: |
||||||||||||||||||||||||||||||||
Fiscal Year |
Summary Compensation Table Total for PEO (1) ($) |
Compensation Actually Paid to PEO (1)(2) ($) |
Average Summary Compensation Table Total for Non-PEO NEOs (1) ($) |
Average Compensation Actually Paid to Non-PEO NEOs (1)(2) ($) |
Total Stockholder Return ($) |
Peer Group Total Stockholder Return (3) ($) |
Net Income (in thousands) ($) |
Diluted Earnings per Share ($) |
||||||||||||||||||||||||
2025 |
1,191,679 | 2,140,427 | 464,106 | 2,247,009 | 200 | 96 | 95,165 | 1.83 | ||||||||||||||||||||||||
2024 |
966,969 | 1,901,252 | 485,139 | 1,937,349 | 256 | 85 | 76,252 | 1.47 | ||||||||||||||||||||||||
2023 |
2,090,066 | 3,389,141 | 413,594 | 2,313,754 | 349 | 116 | 66,365 | 1.26 | ||||||||||||||||||||||||
2022 |
1,420,744 | 4,464,818 | 482,747 | 5,014,662 | 309 | 124 | 66,410 | 1.22 | ||||||||||||||||||||||||
2021 |
1,510,130 | 3,728,177 | 467,858 | 3,419,311 | 188 | 149 | 46,356 | 0.85 | ||||||||||||||||||||||||
| (1) | The table below includes the name of each individual serving as an NEO during our last five fiscal years, including our PEO: |
Fiscal Year |
PEO |
Non-PEO NEOs | ||
2025 |
Michael G. Combs | Mark E. Bertels, Maxim Shishin, Brandon T. O’Brien, Jennifer L. Yoss | ||
2024 |
Michael G. Combs | V. Gordon Clemons, Mark E. Bertels, Maxim Shishin, Brandon T. O’Brien, Jennifer L. Yoss | ||
2023 |
Michael G. Combs | V. Gordon Clemons, Mark E. Bertels , Maxim Shishin, Brandon T. O’Brien, Jennifer L. Yoss | ||
2022 |
Michael G. Combs | V. Gordon Clemons, Diane J. Blaha, Maxim Shishin, Brandon T. O’Brien, Jennifer L. Yoss | ||
2021 |
Michael G. Combs | V. Gordon Clemons, Diane J. Blaha, Maxim Shishin, Brandon T. O’Brien, Jennifer L. Yoss |
| (2) | The table below provides the adjustments to the Summary Compensation Table total compensation made to arrive at the compensation actually paid to the PEO and the aver a ge compensation actually paid to the non-PEO NEOs: |
Fiscal Year |
Executives |
Summary Compensation Table Total ($) |
Minus – Amount Reported in the “Option Awards” Column in the Summary Compensation Table ($) |
Plus – Fair Value of Awards Granted During Covered Fiscal Year that Remain Outstanding and Unvested as of Covered Fiscal Year End ($) (a) |
Plus/Minus – Change in Fair Value of Outstanding and Unvested Awards Granted in Prior Fiscal Years ($) (b) |
Plus/Minus – Change in Fair Value of Awards Granted During Prior Fiscal Years that Vested During the Covered Fiscal Year ($) (c) |
Minus Fair Value of Awards Granted During Prior Fiscal Years that were Forfeited During the Covered Fiscal Year ($) |
Compensation Actually Paid ($) |
||||||||||||||||||||||
2025 |
PEO | 1,191,679 | 95,669 | 53,113 | 343,505 | 647,799 | — | 2,140,427 | ||||||||||||||||||||||
| Average for Non- PEO NEOs |
464,106 | 95,046 | 428,028 | 187,966 | 1,261,955 | — | 2,247,009 | |||||||||||||||||||||||
2024 |
PEO | 966,969 | — | — | 701,539 | 232,744 | — | 1,901,252 | ||||||||||||||||||||||
| Average for Non- PEO NEOs |
485,139 | 178,369 | 676,067 | 565,128 | 389,384 | — | 1,937,349 | |||||||||||||||||||||||
2023 |
PEO | 2,090,066 | 1,176,522 | — | 2,387,906 | 90,528 | (2,836 | ) | 3,389,141 | |||||||||||||||||||||
| Average for Non- PEO NEOs |
413,594 | 148,254 | — | 1,917,315 | 138,017 | (6,918 | ) | 2,313,754 | ||||||||||||||||||||||
2022 |
PEO | 1,420,744 | 309,939 | — | 1,780,517 | 1,573,496 | — | 4,464,818 | ||||||||||||||||||||||
| Average for Non- PEO NEOs |
482,747 | 150,374 | — | 2,759,634 | 1,922,655 | — | 5,014,662 | |||||||||||||||||||||||
2021 |
PEO | 1,510,130 | 543,248 | 77,425 | 1,802,464 | 912,931 | (31,525 | ) | 3,728,177 | |||||||||||||||||||||
| Average for Non- PEO NEOs |
467,858 | 174,865 | — | 2,286,279 | 878,058 | (38,019 | ) | 3,419,311 | ||||||||||||||||||||||
| (a) | The fair value amounts are calculated in accordance with ASC Topic 718 Compensation – Stock Compensation ASC 718 |
| (b) | The fair value amounts are determined based on the change in fair value from the prior fiscal year end to the covered fiscal year end calculated in accordance with ASC 718. |
| (c) | The fair value amounts are determined based on the change in fair value from the prior fiscal year end to the vesting date calculated in accordance with ASC 718. |
| (3) | The peer group used for this purpose is the Nasdaq Healthcare Services Index. |
| (1) | The table below includes the name of each individual serving as an NEO during our last five fiscal years, including our PEO: |
Fiscal Year |
PEO |
Non-PEO NEOs | ||
2025 |
Michael G. Combs | Mark E. Bertels, Maxim Shishin, Brandon T. O’Brien, Jennifer L. Yoss | ||
2024 |
Michael G. Combs | V. Gordon Clemons, Mark E. Bertels, Maxim Shishin, Brandon T. O’Brien, Jennifer L. Yoss | ||
2023 |
Michael G. Combs | V. Gordon Clemons, Mark E. Bertels , Maxim Shishin, Brandon T. O’Brien, Jennifer L. Yoss | ||
2022 |
Michael G. Combs | V. Gordon Clemons, Diane J. Blaha, Maxim Shishin, Brandon T. O’Brien, Jennifer L. Yoss | ||
2021 |
Michael G. Combs | V. Gordon Clemons, Diane J. Blaha, Maxim Shishin, Brandon T. O’Brien, Jennifer L. Yoss |
| (2) | The table below provides the adjustments to the Summary Compensation Table total compensation made to arrive at the compensation actually paid to the PEO and the aver a ge compensation actually paid to the non-PEO NEOs: |
Fiscal Year |
Executives |
Summary Compensation Table Total ($) |
Minus – Amount Reported in the “Option Awards” Column in the Summary Compensation Table ($) |
Plus – Fair Value of Awards Granted During Covered Fiscal Year that Remain Outstanding and Unvested as of Covered Fiscal Year End ($) (a) |
Plus/Minus – Change in Fair Value of Outstanding and Unvested Awards Granted in Prior Fiscal Years ($) (b) |
Plus/Minus – Change in Fair Value of Awards Granted During Prior Fiscal Years that Vested During the Covered Fiscal Year ($) (c) |
Minus Fair Value of Awards Granted During Prior Fiscal Years that were Forfeited During the Covered Fiscal Year ($) |
Compensation Actually Paid ($) |
||||||||||||||||||||||
2025 |
PEO | 1,191,679 | 95,669 | 53,113 | 343,505 | 647,799 | — | 2,140,427 | ||||||||||||||||||||||
| Average for Non- PEO NEOs |
464,106 | 95,046 | 428,028 | 187,966 | 1,261,955 | — | 2,247,009 | |||||||||||||||||||||||
2024 |
PEO | 966,969 | — | — | 701,539 | 232,744 | — | 1,901,252 | ||||||||||||||||||||||
| Average for Non- PEO NEOs |
485,139 | 178,369 | 676,067 | 565,128 | 389,384 | — | 1,937,349 | |||||||||||||||||||||||
2023 |
PEO | 2,090,066 | 1,176,522 | — | 2,387,906 | 90,528 | (2,836 | ) | 3,389,141 | |||||||||||||||||||||
| Average for Non- PEO NEOs |
413,594 | 148,254 | — | 1,917,315 | 138,017 | (6,918 | ) | 2,313,754 | ||||||||||||||||||||||
2022 |
PEO | 1,420,744 | 309,939 | — | 1,780,517 | 1,573,496 | — | 4,464,818 | ||||||||||||||||||||||
| Average for Non- PEO NEOs |
482,747 | 150,374 | — | 2,759,634 | 1,922,655 | — | 5,014,662 | |||||||||||||||||||||||
2021 |
PEO | 1,510,130 | 543,248 | 77,425 | 1,802,464 | 912,931 | (31,525 | ) | 3,728,177 | |||||||||||||||||||||
| Average for Non- PEO NEOs |
467,858 | 174,865 | — | 2,286,279 | 878,058 | (38,019 | ) | 3,419,311 | ||||||||||||||||||||||
| (a) | The fair value amounts are calculated in accordance with ASC Topic 718 Compensation – Stock Compensation ASC 718 |
| (b) | The fair value amounts are determined based on the change in fair value from the prior fiscal year end to the covered fiscal year end calculated in accordance with ASC 718. |
| (c) | The fair value amounts are determined based on the change in fair value from the prior fiscal year end to the vesting date calculated in accordance with ASC 718. |
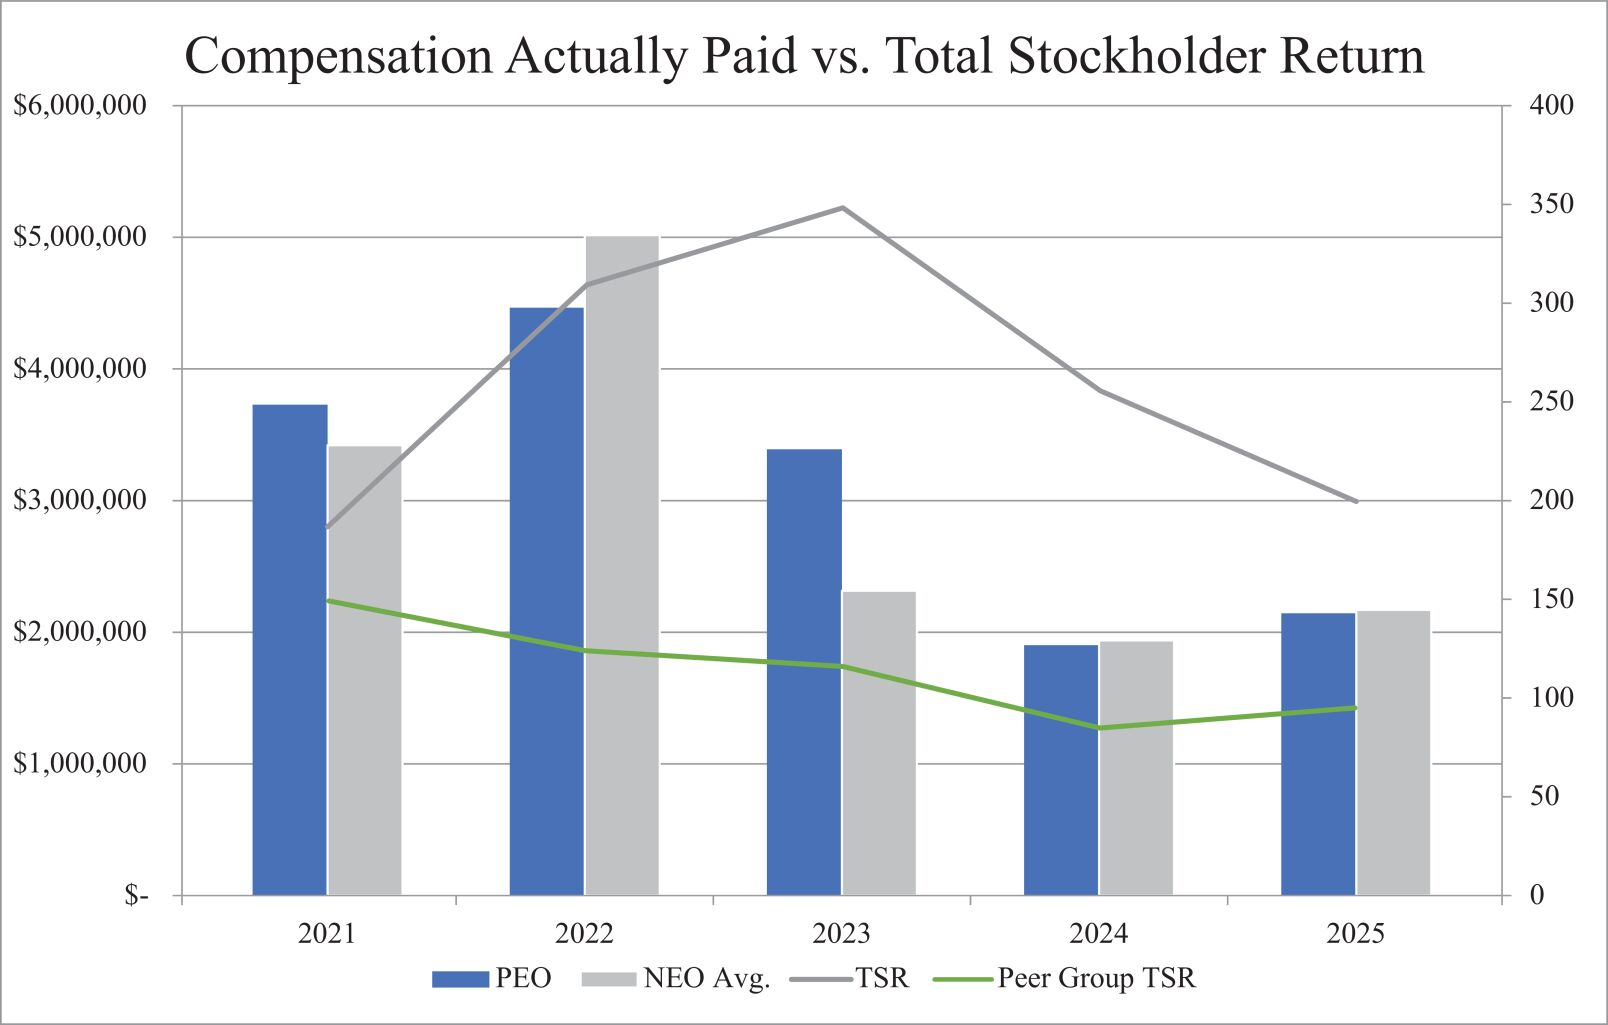
Compensation Actually Paid Compared to Total Stockholder Return
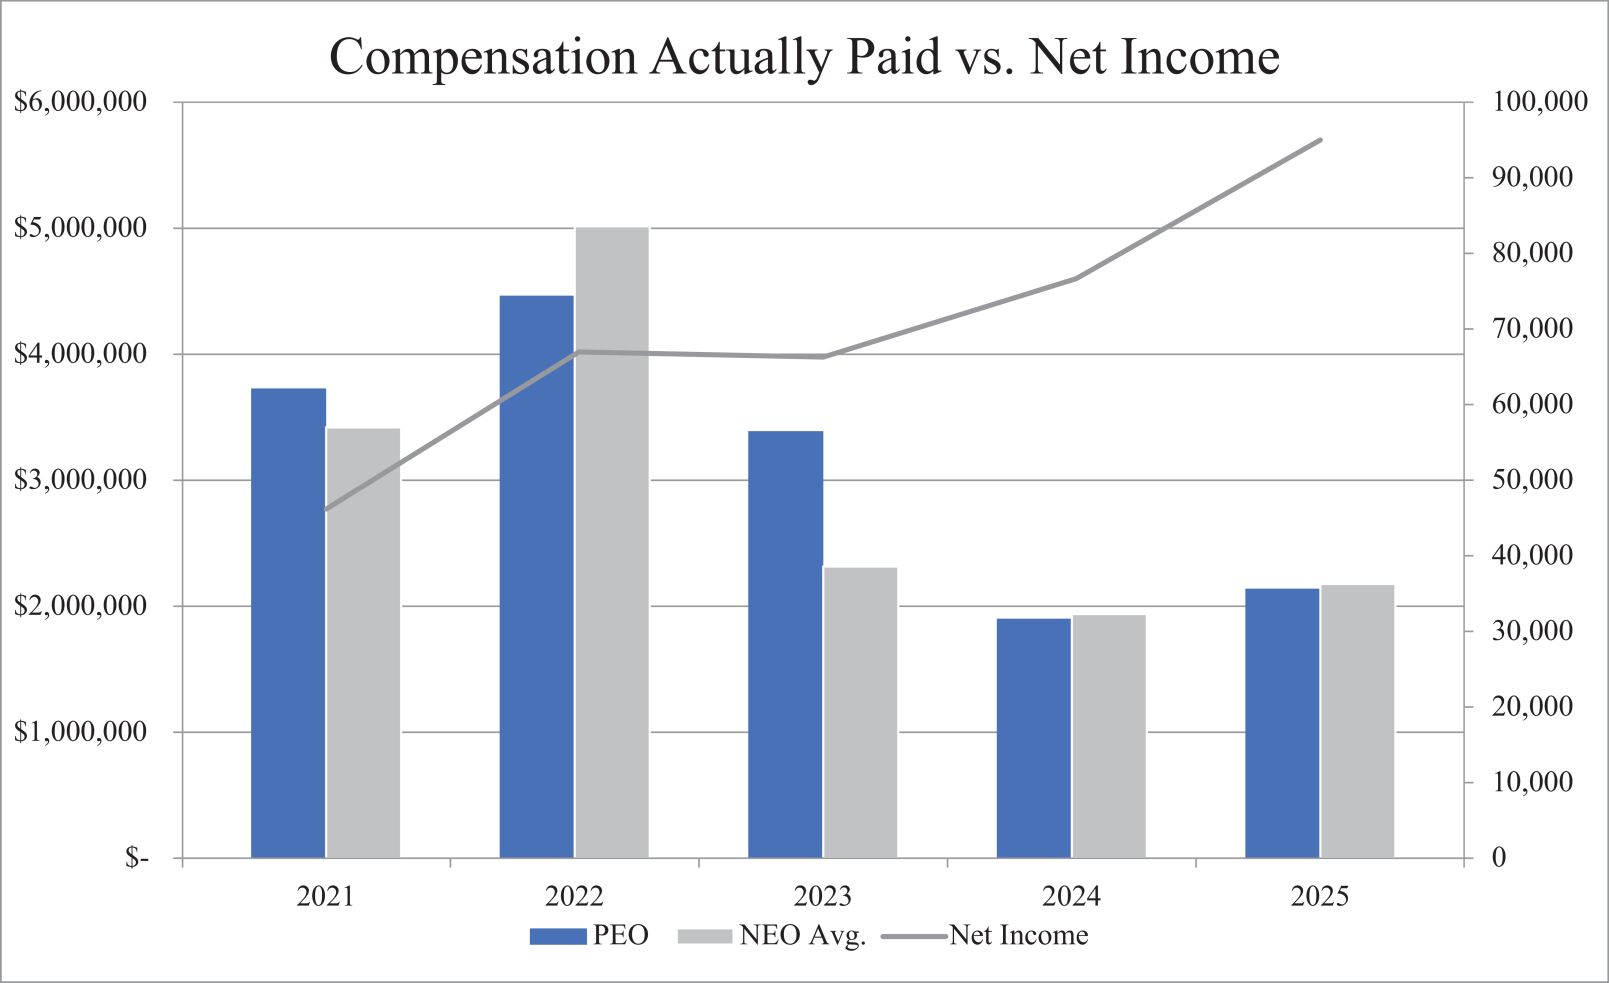
Compensation Actually Paid Compared to Net Income
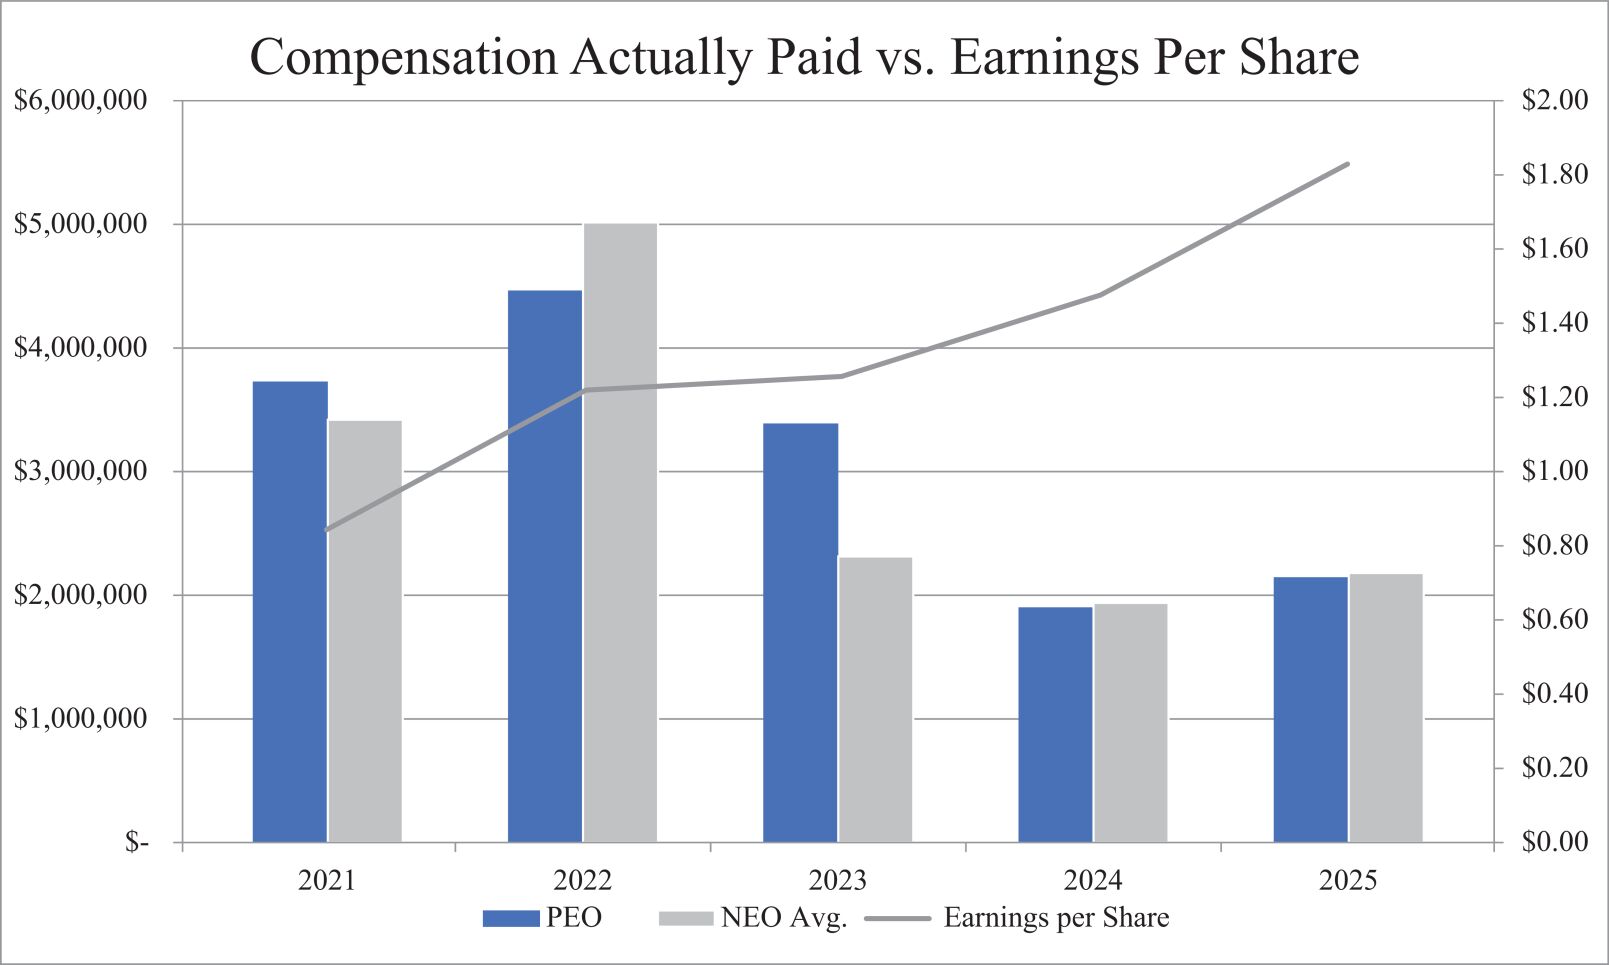
Compensation Actually Paid Compared to Earnings Per Share
Compensation Actually Paid Compared to Total Stockholder Return
Tabular List of Company Financial Performance Measures
As described in greater detail in the section entitled “,” our executive compensation program reflects a variable compensation philosophy. The metrics that we use for both our annual cash incentive awards and long-term, equity-based incentive awards are selected based on an objective of incentivizing our NEOs to increase the value of our enterprise for our stockholders. The most important financial
Compensation Discussion and Analysis
performance measures used by the Company to link “compensation actually paid” to the Company’s NEOs, for the most recently completed fiscal year, to the Company’s performance are as follows:
Most Important Financial Performance Measures |
| Earnings per Share |
| Revenue |
| Income Before Income Taxes |