| company presentation LEAP THERAPEUTICS June 23, 2025 |

| Forward looking statements 2 This presentation contains forward-looking statements that involve substantial risks and uncertainties. All statements, other than statements of historical facts, contained in this presentation, including statements regarding our strategy, future operations, clinical trials, collaborations and partnerships, future financial position, future revenues, projected costs, prospects, plans and objectives of management, are forward-looking statements within the meaning of U.S. securities laws. The words “anticipate,” “believe,” “estimate,” “expect,” “intend,” “may,” “plan,” “predict,” “project,” “target,” “potential,” “will,” “would,” “could,” “should,” “continue,” and similar expressions are intended to identify forward-looking statements, although not all forward-looking statements contain these identifying words. Forward-looking statements are neither historical facts nor assurances of future performance. Instead, they are based only on our current beliefs, expectations and assumptions regarding the future of our business, future plans and strategies, projections, anticipated events and trends, the economy and other future conditions. Because forward-looking statements relate to the future, they are subject to inherent uncertainties, risks and changes in circumstances that are difficult to predict and many of which are outside of our control. We may not actually achieve the plans, intentions or expectations disclosed in our forward-looking statements, and you should not place undue reliance on our forward-looking statements. Actual results or events could differ materially from the plans, intentions and expectations disclosed in the forward-looking statements we make. These and other risk factors are listed from time to time in reports filed with the Securities and Exchange Commission, including, but not limited to, our Annual Reports on Form 10-K and our Quarterly Reports on Form 10-Q. We assume no obligation to update any forward-looking statements, except as required by applicable law. This presentation does not constitute an offer to sell, or the solicitation of an offer to buy, any securities. |
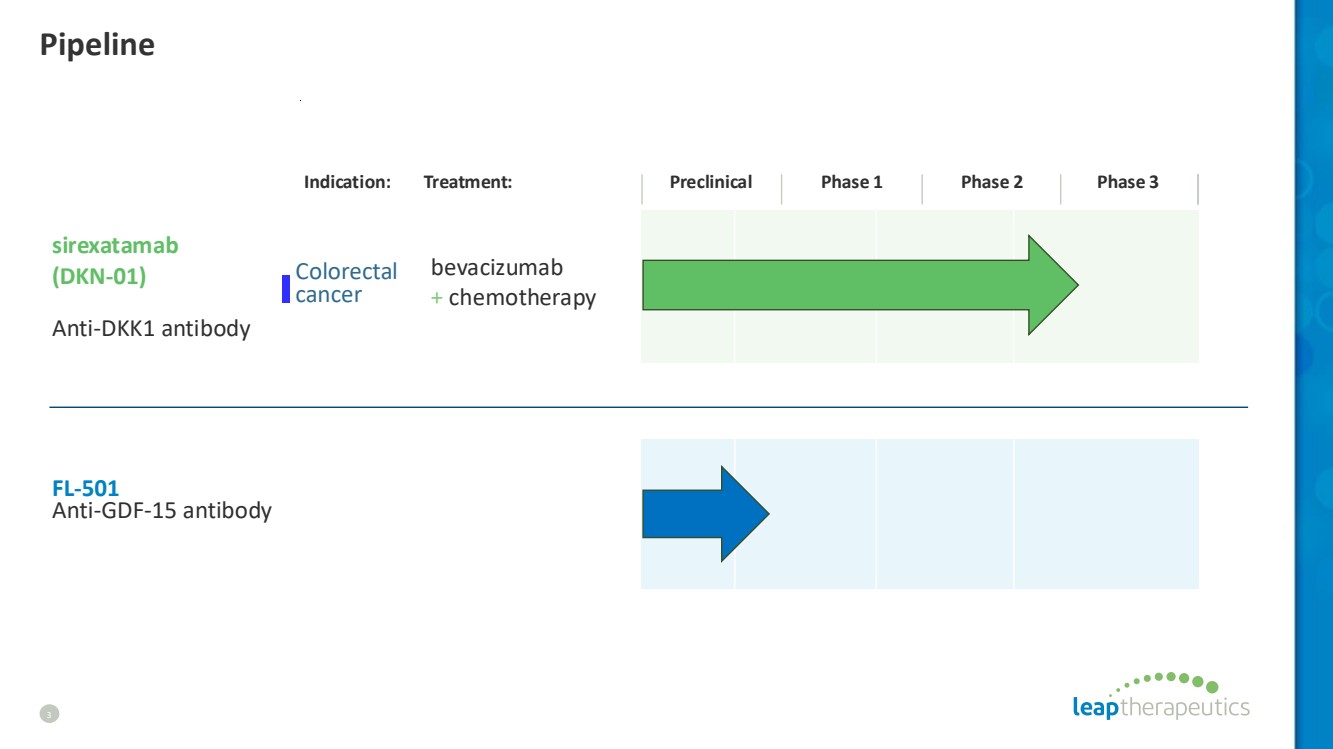
| Pipeline 3 Indication: Treatment: Preclinical Phase 1 Phase 2 Phase 3 sirexatamab (DKN-01) Anti-DKK1 antibody bevacizumab + chemotherapy Colorectal cancer FL-501 Anti-GDF-15 antibody |
| SIREXATAMAB (DKN-01) Anti-DKK1 monoclonal antibody |
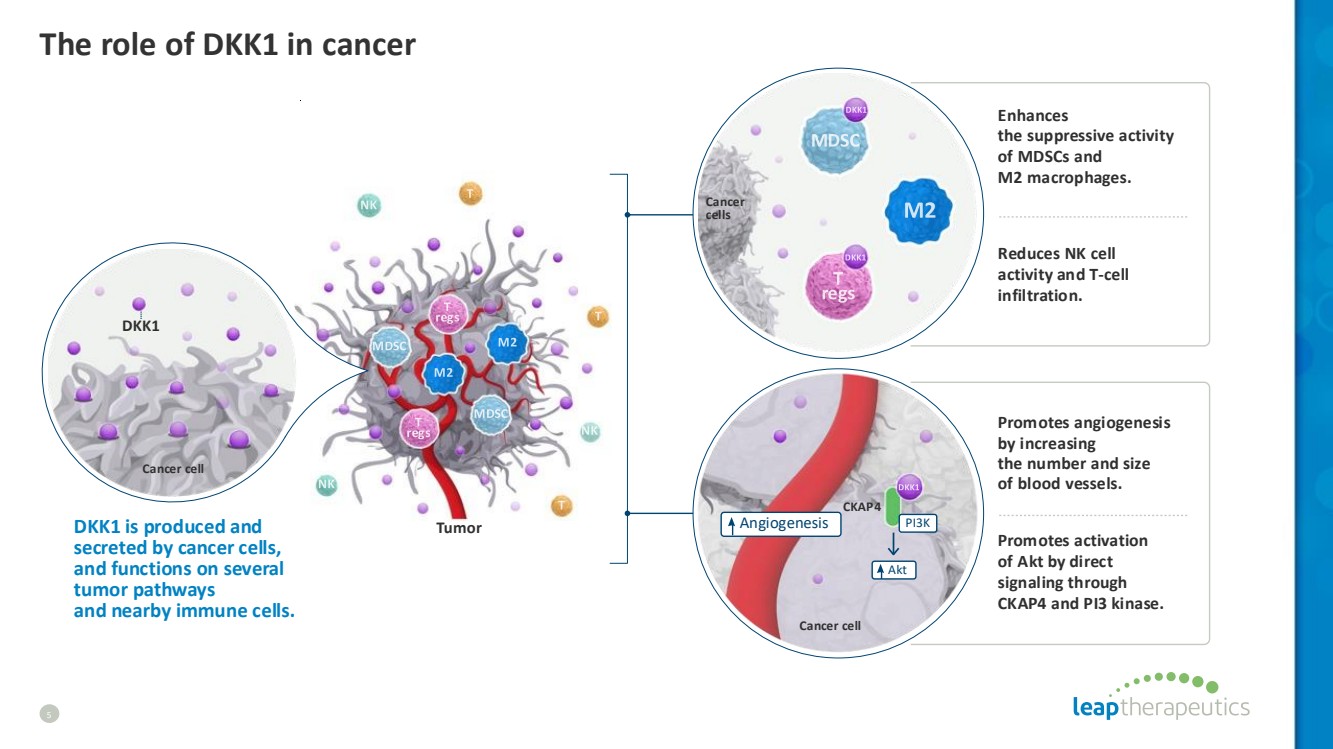
| The role of DKK1 in cancer 5 Tumor CKAP4 Angiogenesis Akt PI3K Cancer cell Cancer cells DKK1 is produced and secreted by cancer cells, and functions on several tumor pathways and nearby immune cells. Enhances the suppressive activity of MDSCs and M2 macrophages. Reduces NK cell activity and T-cell infiltration. Promotes angiogenesis by increasing the number and size of blood vessels. Promotes activation of Akt by direct signaling through CKAP4 and PI3 kinase. Cancer cell DKK1 |
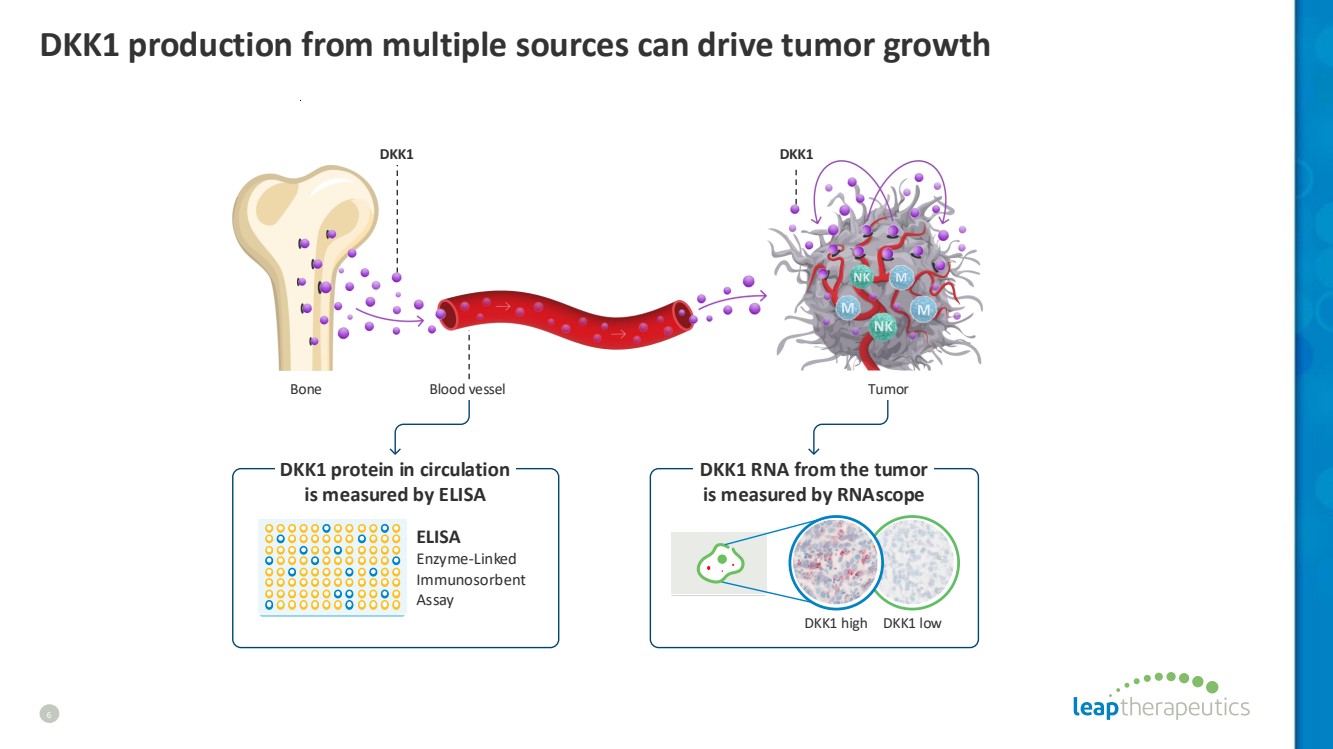
| DKK1 production from multiple sources can drive tumor growth 6 Tumor DKK1 DKK1 Bone DKK1 high DKK1 low Blood vessel ELISA Enzyme-Linked Immunosorbent Assay DKK1 RNA from the tumor is measured by RNAscope DKK1 protein in circulation is measured by ELISA |
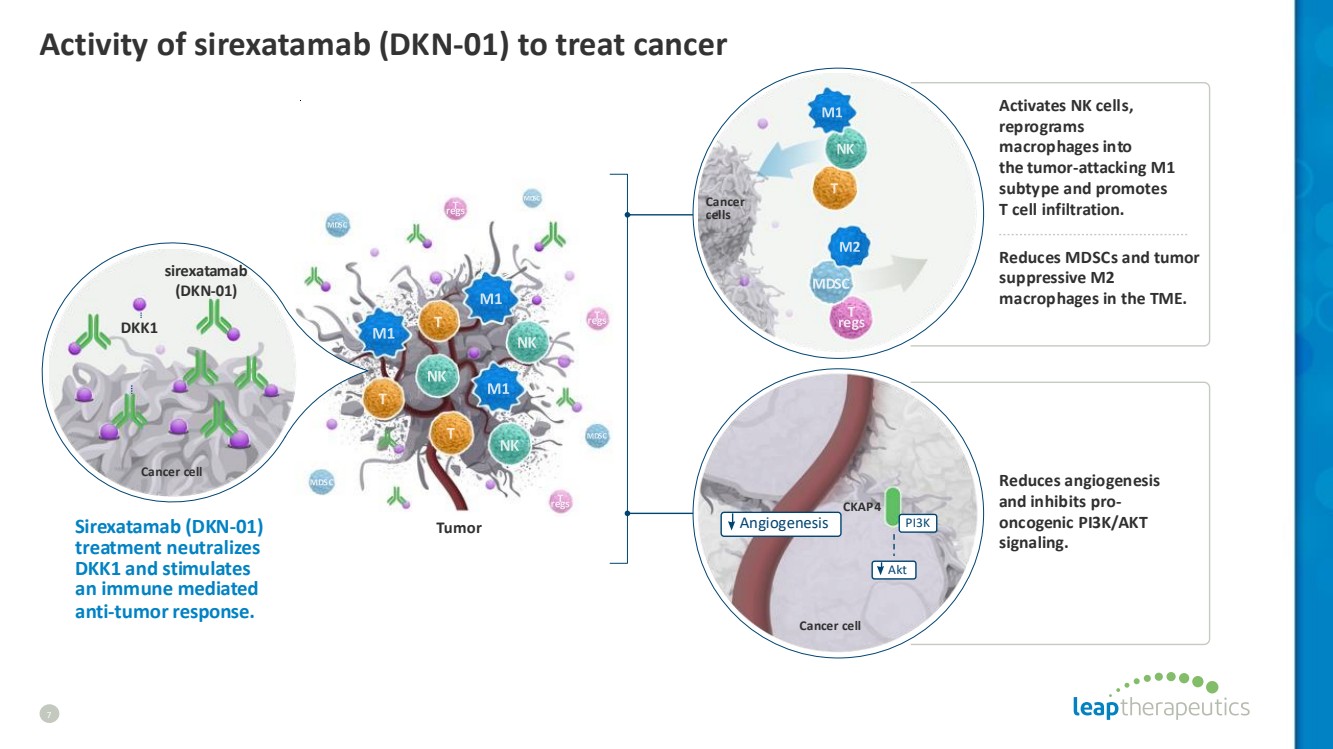
| Activity of sirexatamab (DKN-01) to treat cancer 7 CKAP4 Angiogenesis Akt PI3K Cancer cell Cancer cells Tumor Cancer cell DKK1 Sirexatamab (DKN-01) treatment neutralizes DKK1 and stimulates an immune mediated anti-tumor response. sirexatamab (DKN-01) Activates NK cells, reprograms macrophagesinto the tumor-attacking M1 subtype and promotes T cell infiltration. Reduces MDSCs and tumor suppressive M2 macrophages in the TME. Reduces angiogenesis and inhibits pro-oncogenic PI3K/AKT signaling. |
| SIREXATAMAB (DKN-01) Colorectal cancer |

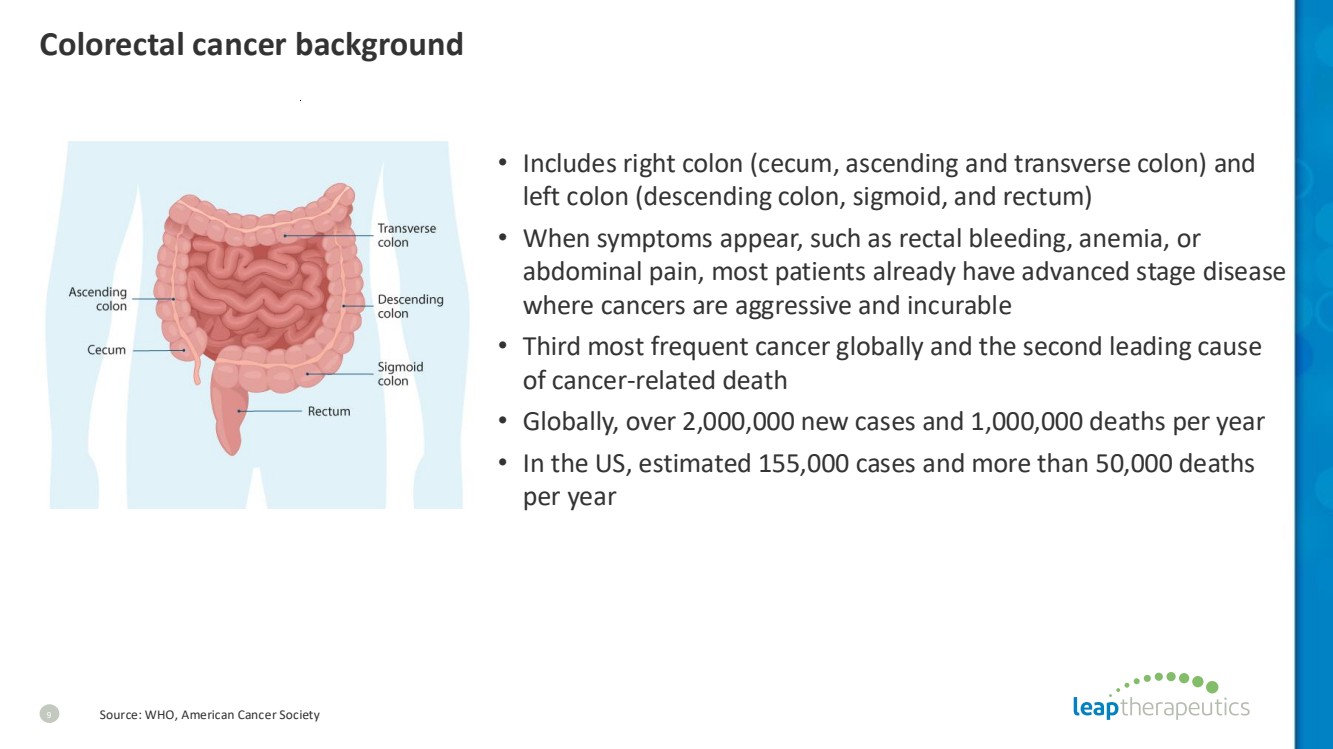
| Colorectal cancer background • Includes right colon (cecum, ascending and transverse colon) and left colon (descending colon, sigmoid, and rectum) • When symptoms appear, such as rectal bleeding, anemia, or abdominal pain, most patients already have advanced stage disease where cancers are aggressive and incurable • Third most frequent cancer globally and the second leading cause of cancer-related death • Globally, over 2,000,000 new cases and 1,000,000 deaths per year • In the US, estimated 155,000 cases and more than 50,000 deaths per year 9 Source: WHO, American Cancer Society |
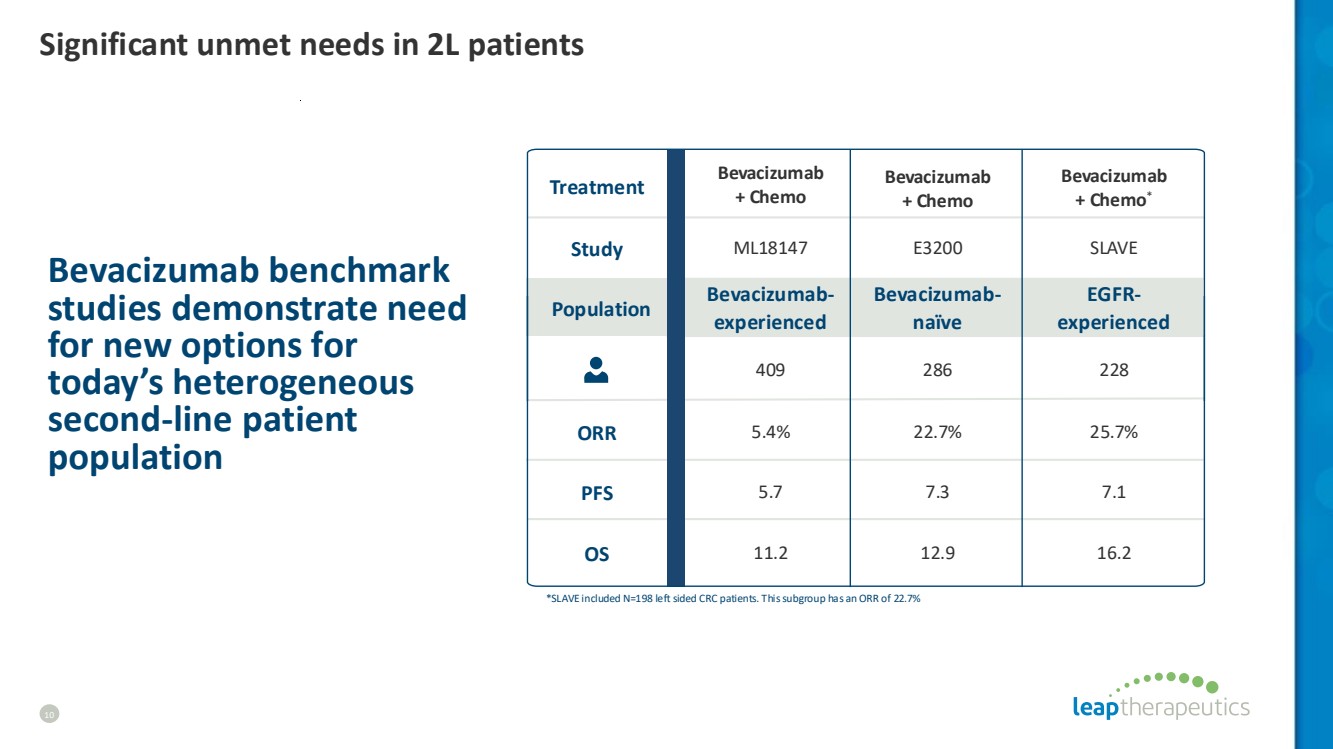
| Bevacizumab benchmark studies demonstrate need for new options for today’s heterogeneous second-line patient population ML18147 409 5.4% E3200 286 22.7% SLAVE 228 25.7% Bevacizumab + Chemo Bevacizumab + Chemo Bevacizumab + Chemo* *SLAVE included N=198 left sided CRC patients. This subgroup has an ORR of 22.7% Bevacizumab-experienced Bevacizumab-naïve EGFR-experienced Treatment Study ORR Population PFS OS 11.2 5.7 7.3 7.1 12.9 16.2 Significant unmet needs in 2L patients 10 |
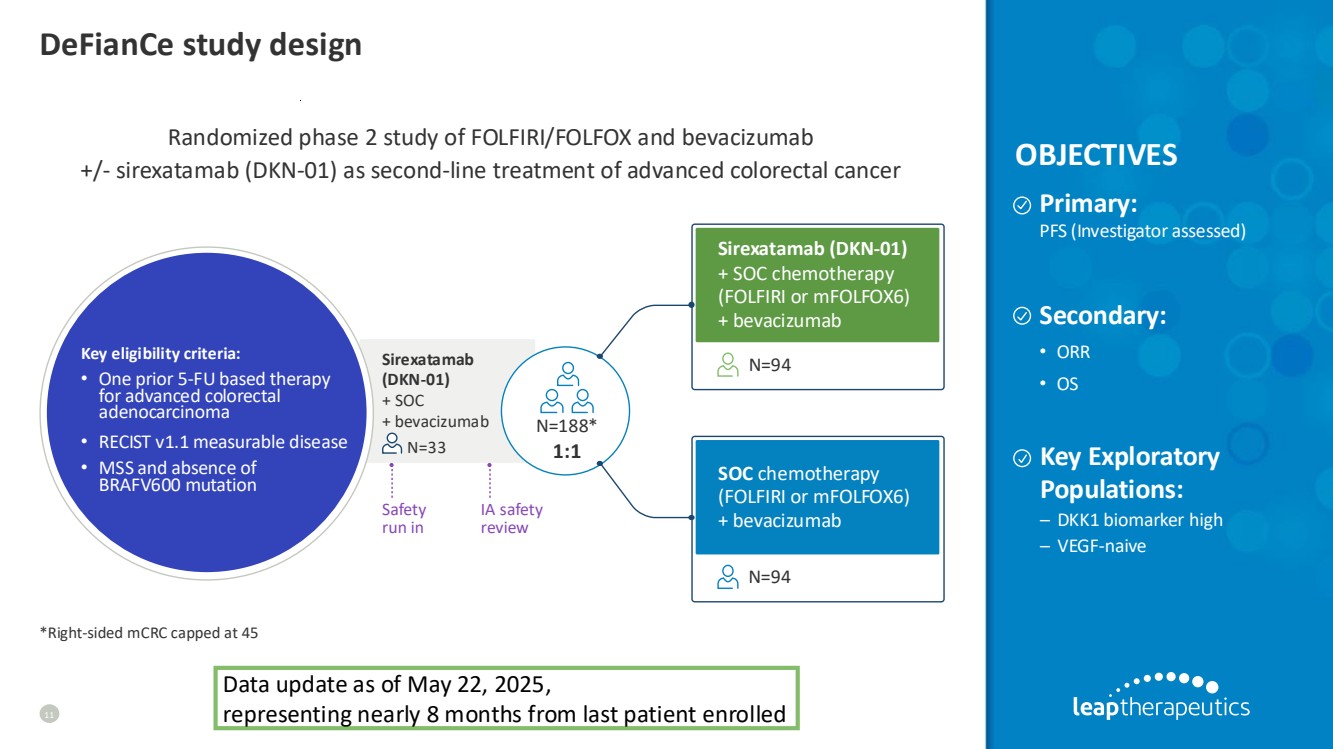
| DeFianCe study design 11 Randomized phase 2 study of FOLFIRI/FOLFOX and bevacizumab +/- sirexatamab (DKN-01) as second-line treatment of advanced colorectal cancer Primary: PFS (Investigator assessed) Secondary: • ORR • OS Sirexatamab (DKN-01) + SOC chemotherapy (FOLFIRI or mFOLFOX6) + bevacizumab SOC chemotherapy (FOLFIRI or mFOLFOX6) + bevacizumab N=94 N=94 Key eligibility criteria: • One prior 5-FU based therapy for advanced colorectal adenocarcinoma • RECIST v1.1 measurable disease • MSS and absence of BRAFV600 mutation N=188* 1:1 Safety run in IA safety review Sirexatamab (DKN-01) + SOC + bevacizumab N=33 OBJECTIVES *Right-sided mCRC capped at 45 Key Exploratory Populations: – DKK1 biomarker high – VEGF-naive Data update as of May 22, 2025, representing nearly 8 months from last patient enrolled |
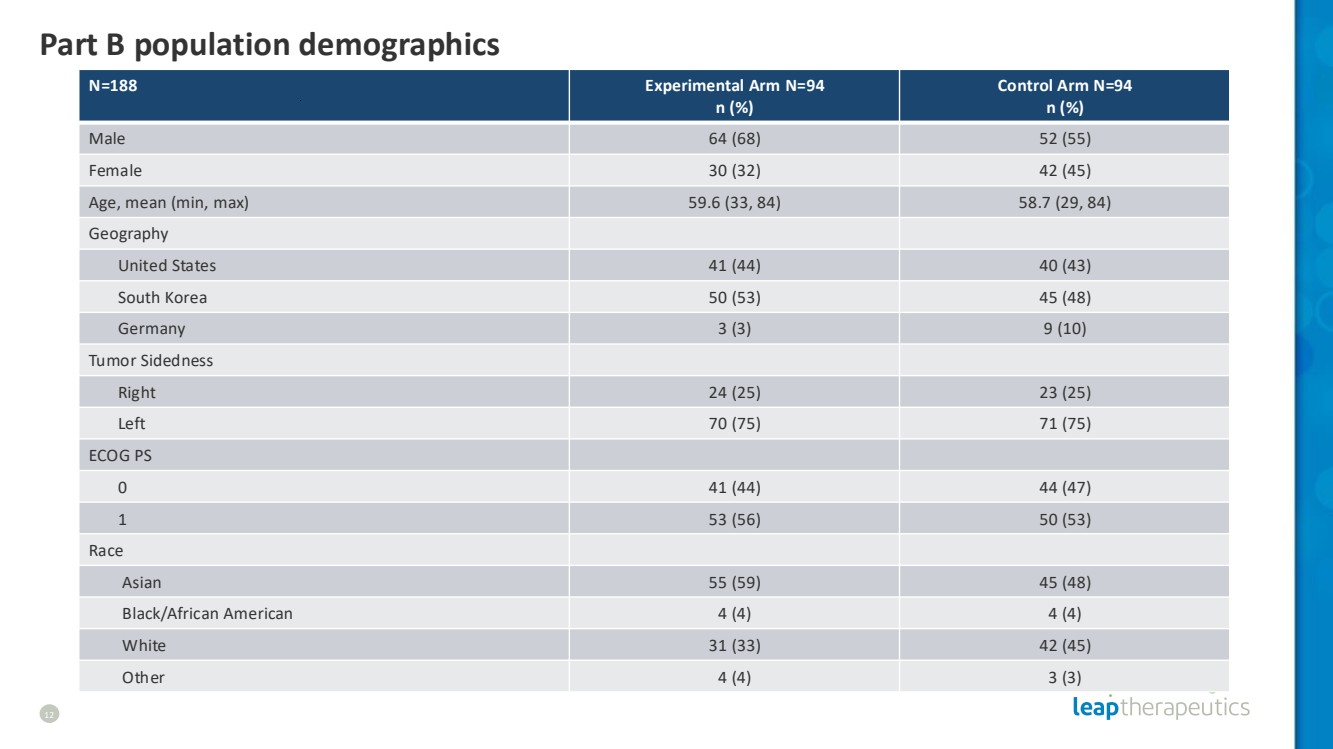
| Part B population demographics 12 N=188 Experimental Arm N=94 n (%) Control Arm N=94 n (%) Male 64 (68) 52 (55) Female 30 (32) 42 (45) Age, mean (min, max) 59.6 (33, 84) 58.7 (29, 84) Geography United States 41 (44) 40 (43) South Korea 50 (53) 45 (48) Germany 3 (3) 9 (10) Tumor Sidedness Right 24 (25) 23 (25) Left 70 (75) 71 (75) ECOG PS 0 41 (44) 44 (47) 1 53 (56) 50 (53) Race Asian 55 (59) 45 (48) Black/African American 4 (4) 4 (4) White 31 (33) 42 (45) Other 4 (4) 3 (3) |
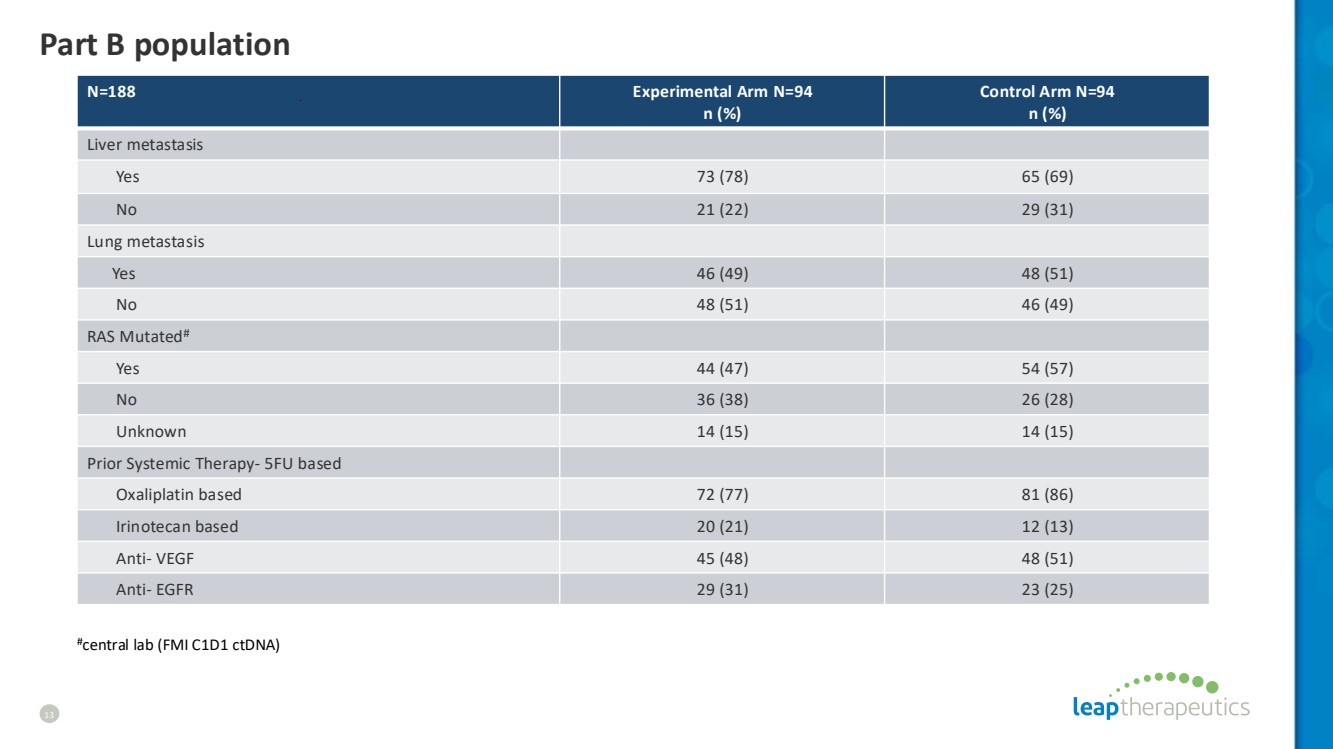
| Part B population 13 N=188 Experimental Arm N=94 n (%) Control Arm N=94 n (%) Liver metastasis Yes 73 (78) 65 (69) No 21 (22) 29 (31) Lung metastasis Yes 46 (49) 48 (51) No 48 (51) 46 (49) RAS Mutated# Yes 44 (47) 54 (57) No 36 (38) 26 (28) Unknown 14 (15) 14 (15) Prior Systemic Therapy- 5FU based Oxaliplatin based 72 (77) 81 (86) Irinotecan based 20 (21) 12 (13) Anti- VEGF 45 (48) 48 (51) Anti- EGFR 29 (31) 23 (25) #central lab (FMI C1D1 ctDNA) |
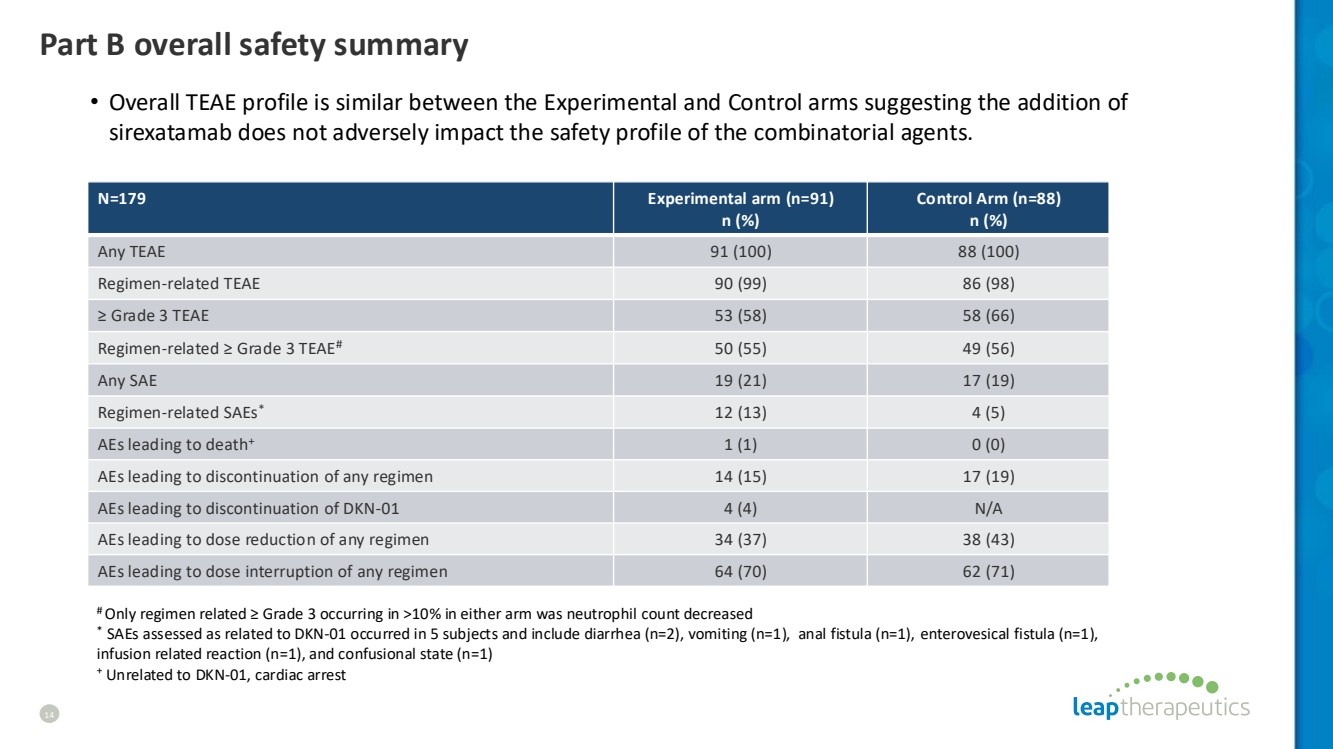
| Part B overall safety summary 14 N=179 Experimental arm (n=91) n (%) Control Arm (n=88) n (%) Any TEAE 91 (100) 88 (100) Regimen-related TEAE 90 (99) 86 (98) ≥ Grade 3 TEAE 53 (58) 58 (66) Regimen-related ≥ Grade 3 TEAE# 50 (55) 49 (56) Any SAE 19 (21) 17 (19) Regimen-related SAEs* 12 (13) 4 (5) AEs leading to death+ 1 (1) 0 (0) AEs leading to discontinuation of any regimen 14 (15) 17 (19) AEs leading to discontinuation of DKN-01 4 (4) N/A AEs leading to dose reduction of any regimen 34 (37) 38 (43) AEs leading to dose interruption of any regimen 64 (70) 62 (71) # Only regimen related ≥ Grade 3 occurring in >10% in either arm was neutrophil count decreased * SAEs assessed as related to DKN-01 occurred in 5 subjects and include diarrhea (n=2), vomiting (n=1), anal fistula (n=1), enterovesical fistula (n=1), infusion related reaction (n=1), and confusional state (n=1) + Unrelated to DKN-01, cardiac arrest • Overall TEAE profile is similar between the Experimental and Control arms suggesting the addition of sirexatamab does not adversely impact the safety profile of the combinatorial agents. |
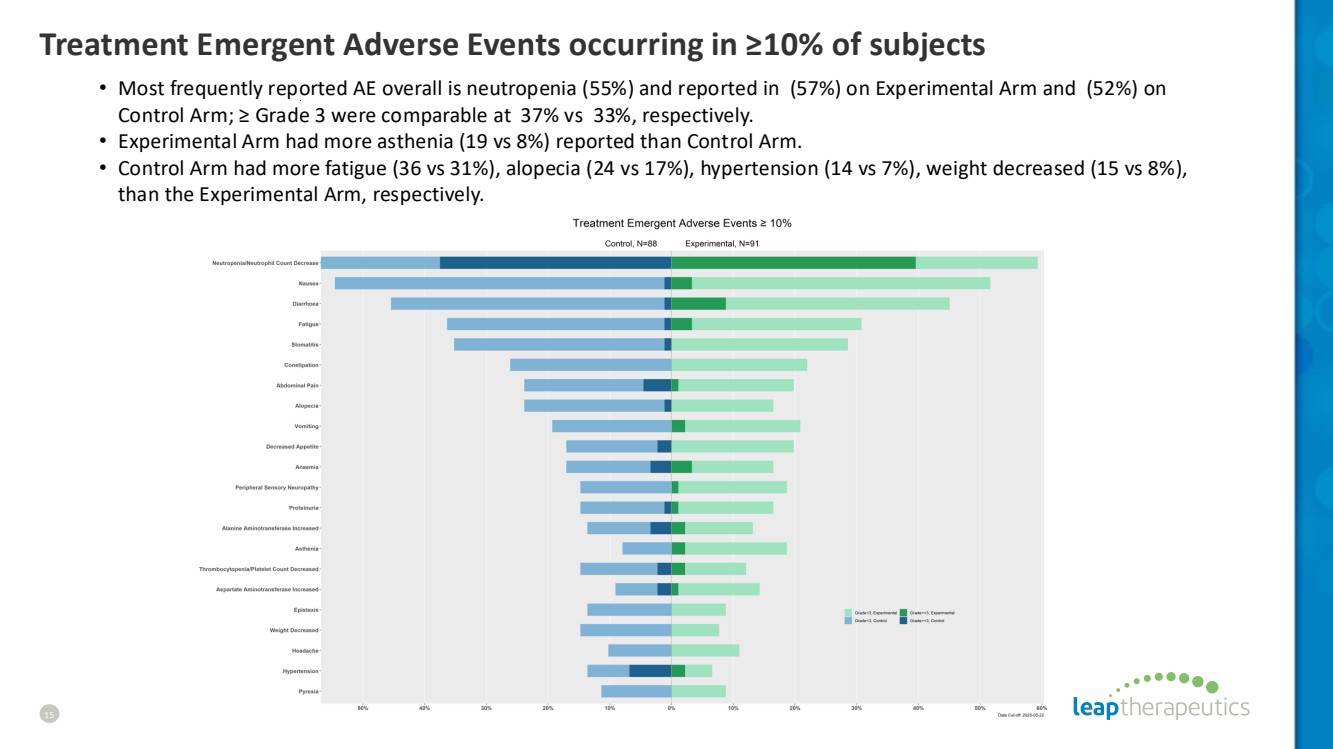
| Treatment Emergent Adverse Events occurring in ≥10% of subjects 15 • Most frequently reported AE overall is neutropenia (55%) and reported in (57%) on Experimental Arm and (52%) on Control Arm; ≥ Grade 3 were comparable at 37% vs 33%, respectively. • Experimental Arm had more asthenia (19 vs 8%) reported than Control Arm. • Control Arm had more fatigue (36 vs 31%), alopecia (24 vs 17%), hypertension (14 vs 7%), weight decreased (15 vs 8%), than the Experimental Arm, respectively. |
| INTENT-TO-TREAT POPULATION |

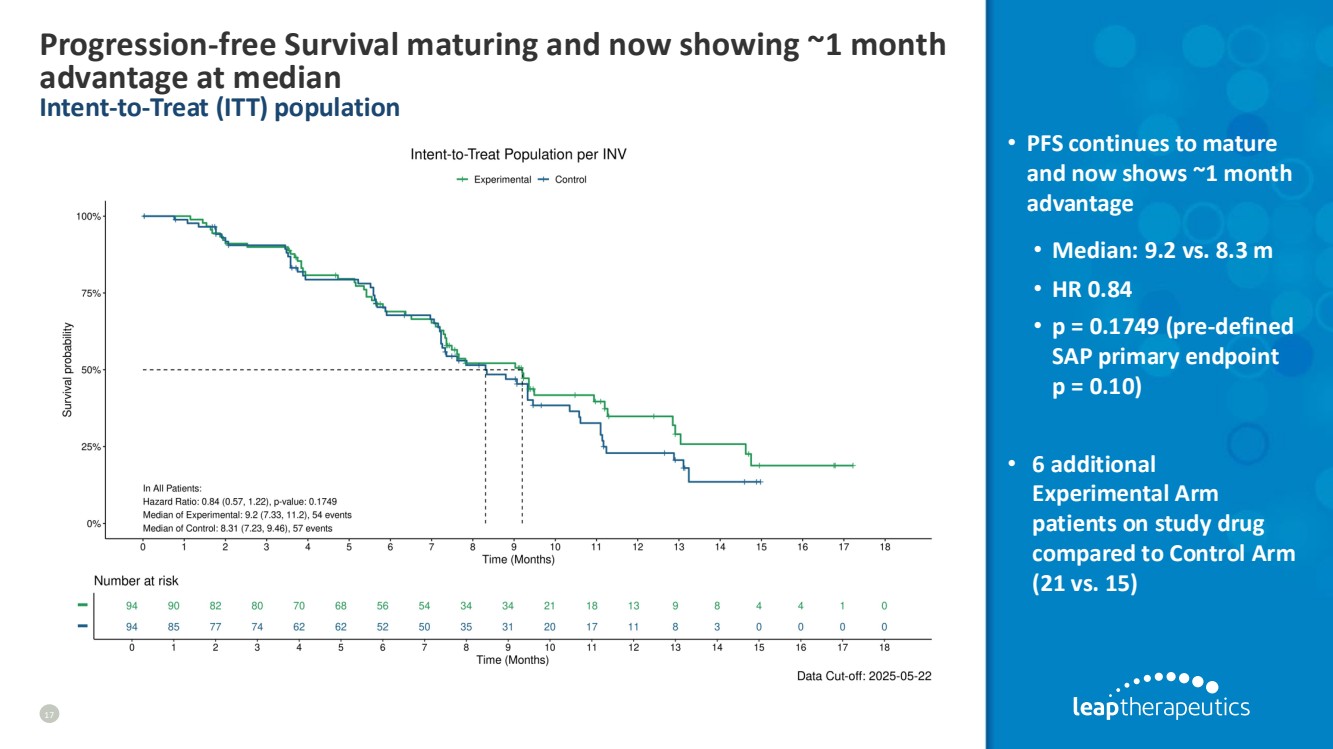
| Progression-free Survival maturing and now showing ~1 month advantage at median Intent-to-Treat (ITT) population 17 • PFS continues to mature and now shows ~1 month advantage • Median: 9.2 vs. 8.3 m • HR 0.84 • p = 0.1749 (pre-defined SAP primary endpoint p = 0.10) • 6 additional Experimental Arm patients on study drug compared to Control Arm (21 vs. 15) |
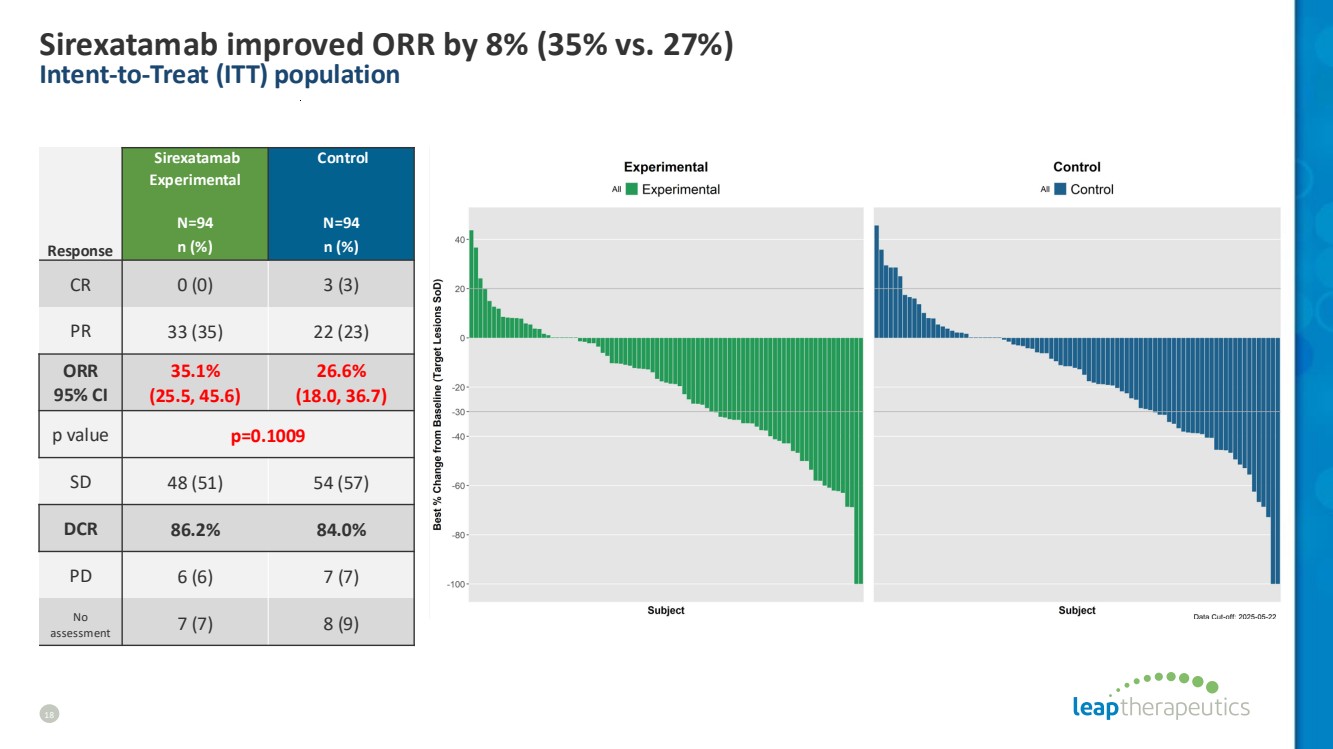
| Sirexatamab improved ORR by 8% (35% vs. 27%) Intent-to-Treat (ITT) population 18 Sirexatamab Experimental N=94 Control N=94 Response n (%) n (%) CR 0 (0) 3 (3) PR 33 (35) 22 (23) ORR 95% CI 35.1% (25.5, 45.6) 26.6% (18.0, 36.7) p value p=0.1009 SD 48 (51) 54 (57) DCR 86.2% 84.0% PD 6 (6) 7 (7) No assessment 7 (7) 8 (9) |
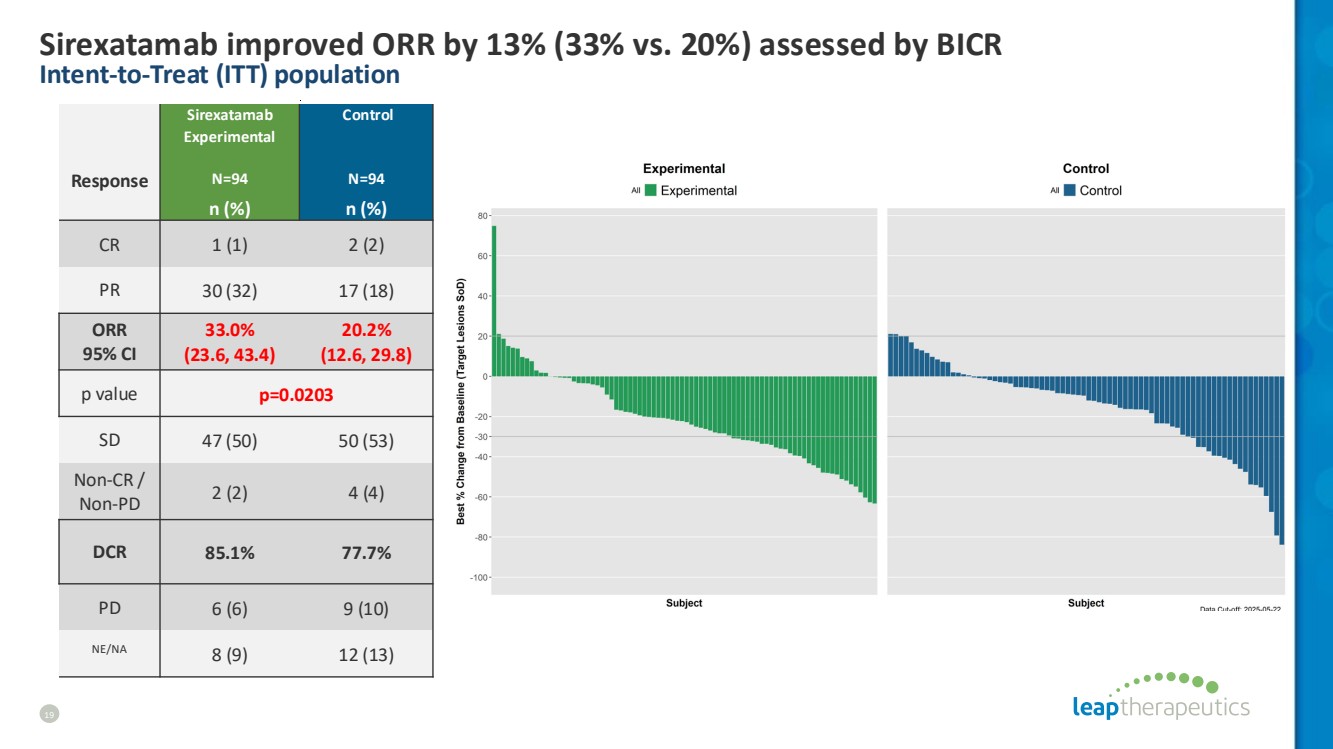
| Sirexatamab improved ORR by 13% (33% vs. 20%) assessed by BICR Intent-to-Treat (ITT) population 19 Response Sirexatamab Experimental N=94 Control N=94 n (%) n (%) CR 1 (1) 2 (2) PR 30 (32) 17 (18) ORR 95% CI 33.0% (23.6, 43.4) 20.2% (12.6, 29.8) p value p=0.0203 SD 47 (50) 50 (53) Non-CR / Non-PD 2 (2) 4 (4) DCR 85.1% 77.7% PD 6 (6) 9 (10) NE/NA 8 (9) 12 (13) |
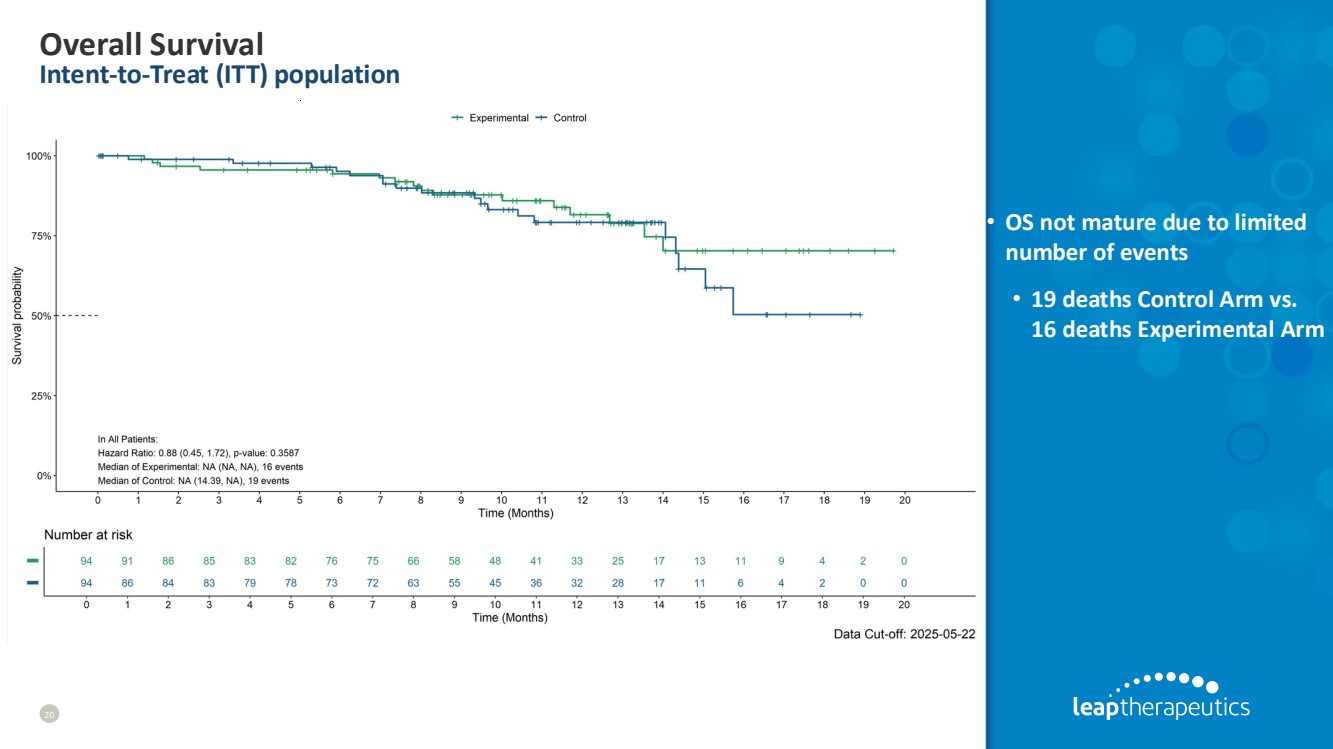
| Overall Survival Intent-to-Treat (ITT) population 20 • OS not mature due to limited number of events • 19 deaths Control Arm vs. 16 deaths Experimental Arm |
| DKK1 BIOMARKER POPULATION |
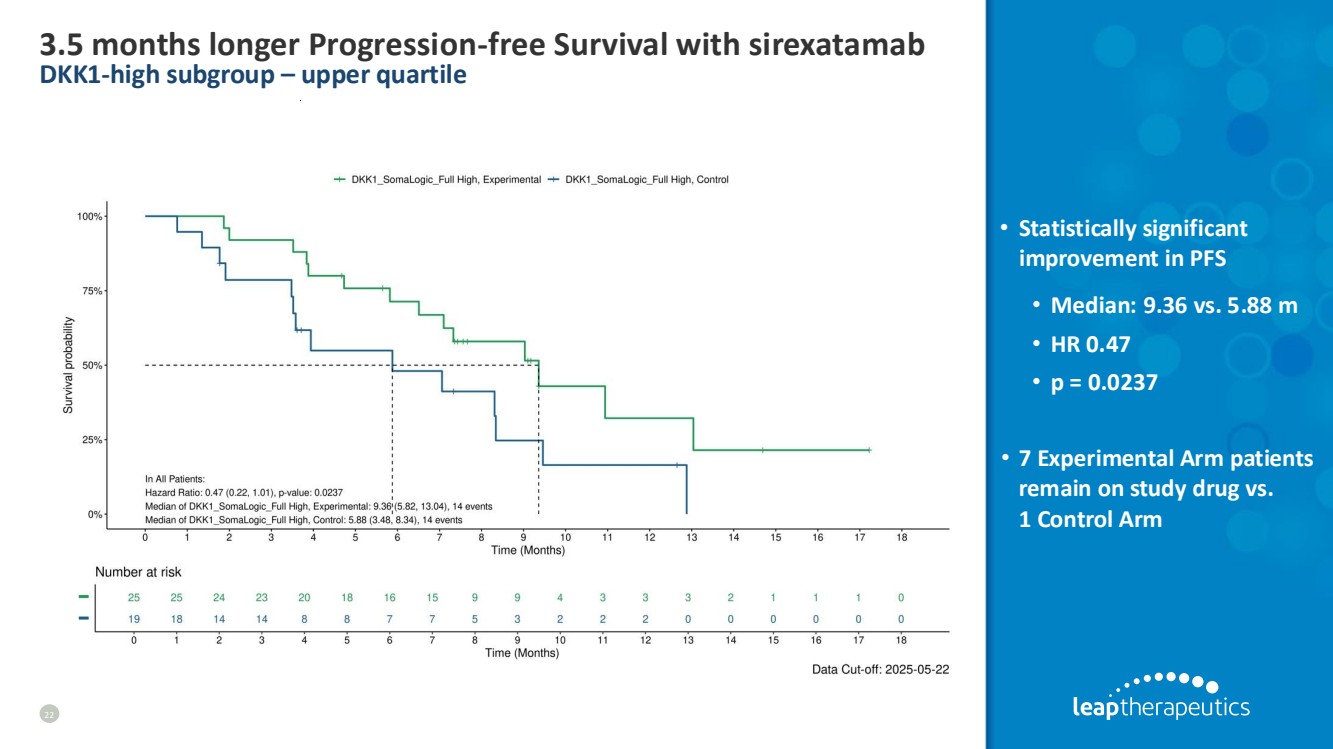
| 3.5 months longer Progression-free Survival with sirexatamab DKK1-high subgroup – upper quartile 22 • Statistically significant improvement in PFS • Median: 9.36 vs. 5.88 m • HR 0.47 • p = 0.0237 • 7 Experimental Arm patients remain on study drug vs. 1 Control Arm |
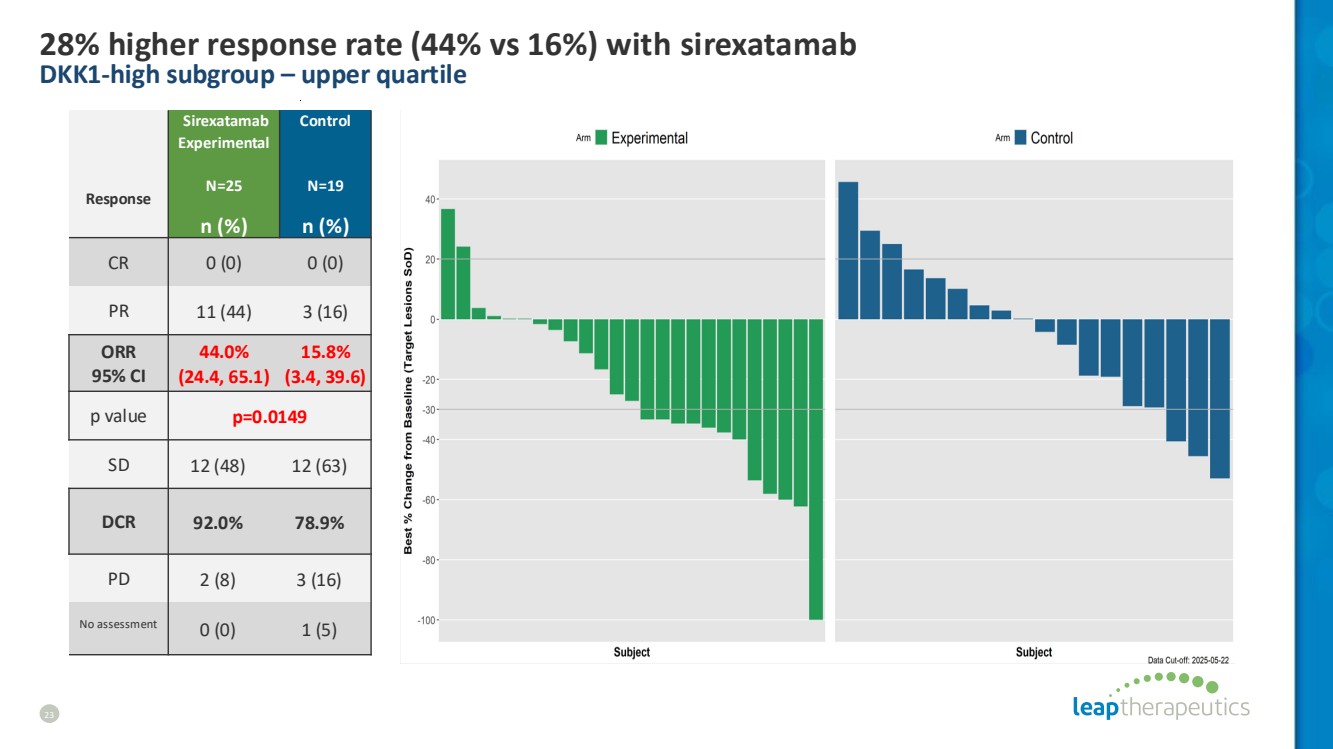
| 28% higher response rate (44% vs 16%) with sirexatamab DKK1-high subgroup – upper quartile 23 Response Sirexatamab Experimental N=25 Control N=19 n (%) n (%) CR 0 (0) 0 (0) PR 11 (44) 3 (16) ORR 95% CI 44.0% (24.4, 65.1) 15.8% (3.4, 39.6) p value p=0.0149 SD 12 (48) 12 (63) DCR 92.0% 78.9% PD 2 (8) 3 (16) No assessment 0 (0) 1 (5) |
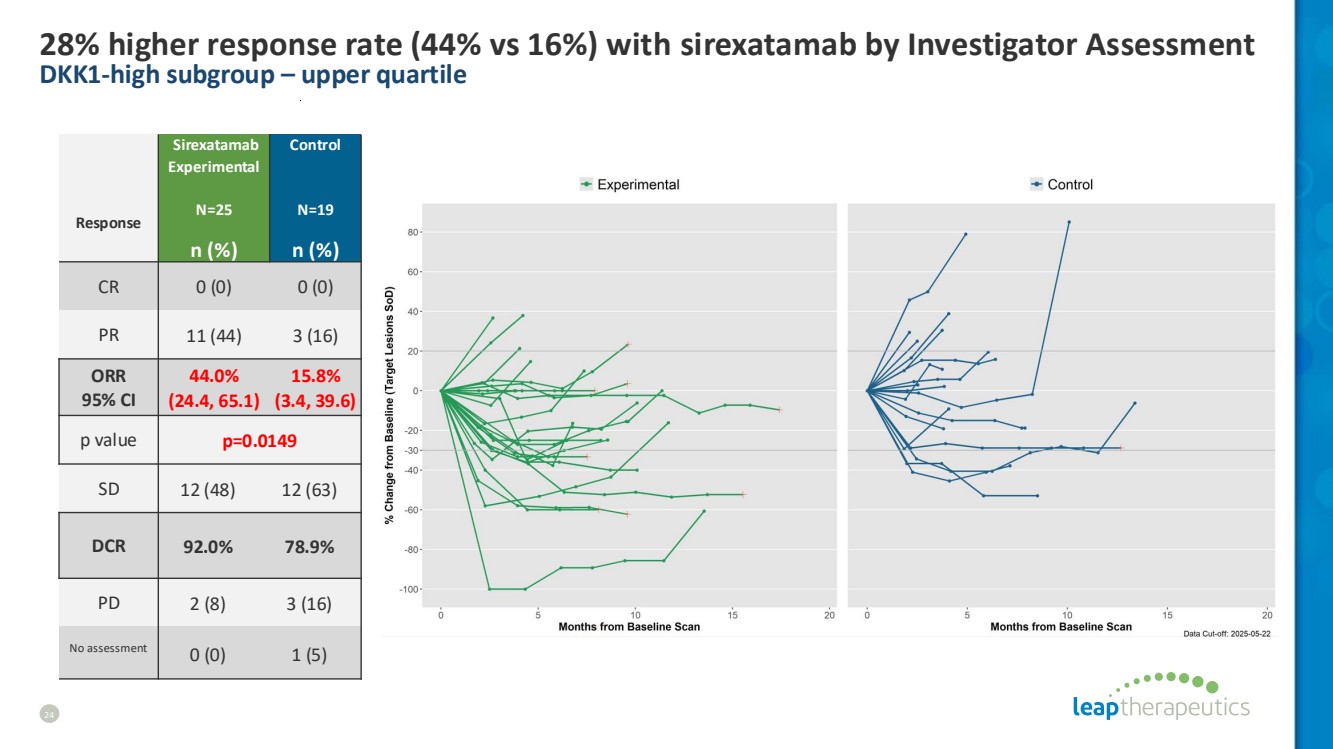
| 28% higher response rate (44% vs 16%) with sirexatamab by Investigator Assessment DKK1-high subgroup – upper quartile 24 Response Sirexatamab Experimental N=25 Control N=19 n (%) n (%) CR 0 (0) 0 (0) PR 11 (44) 3 (16) ORR 95% CI 44.0% (24.4, 65.1) 15.8% (3.4, 39.6) p value p=0.0149 SD 12 (48) 12 (63) DCR 92.0% 78.9% PD 2 (8) 3 (16) No assessment 0 (0) 1 (5) |
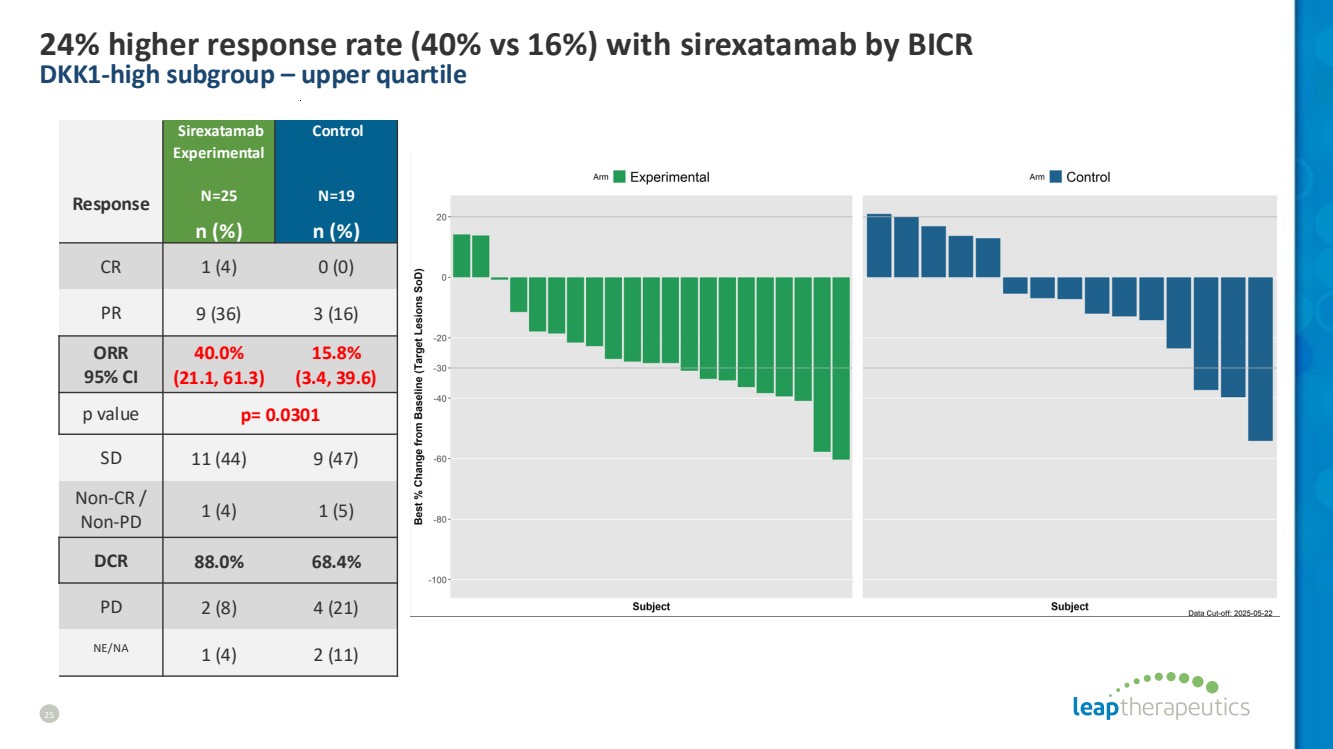
| 24% higher response rate (40% vs 16%) with sirexatamab by BICR DKK1-high subgroup – upper quartile 25 Response Sirexatamab Experimental N=25 Control N=19 n (%) n (%) CR 1 (4) 0 (0) PR 9 (36) 3 (16) ORR 95% CI 40.0% (21.1, 61.3) 15.8% (3.4, 39.6) p value p= 0.0301 SD 11 (44) 9 (47) Non-CR / Non-PD 1 (4) 1 (5) DCR 88.0% 68.4% PD 2 (8) 4 (21) NE/NA 1 (4) 2 (11) |
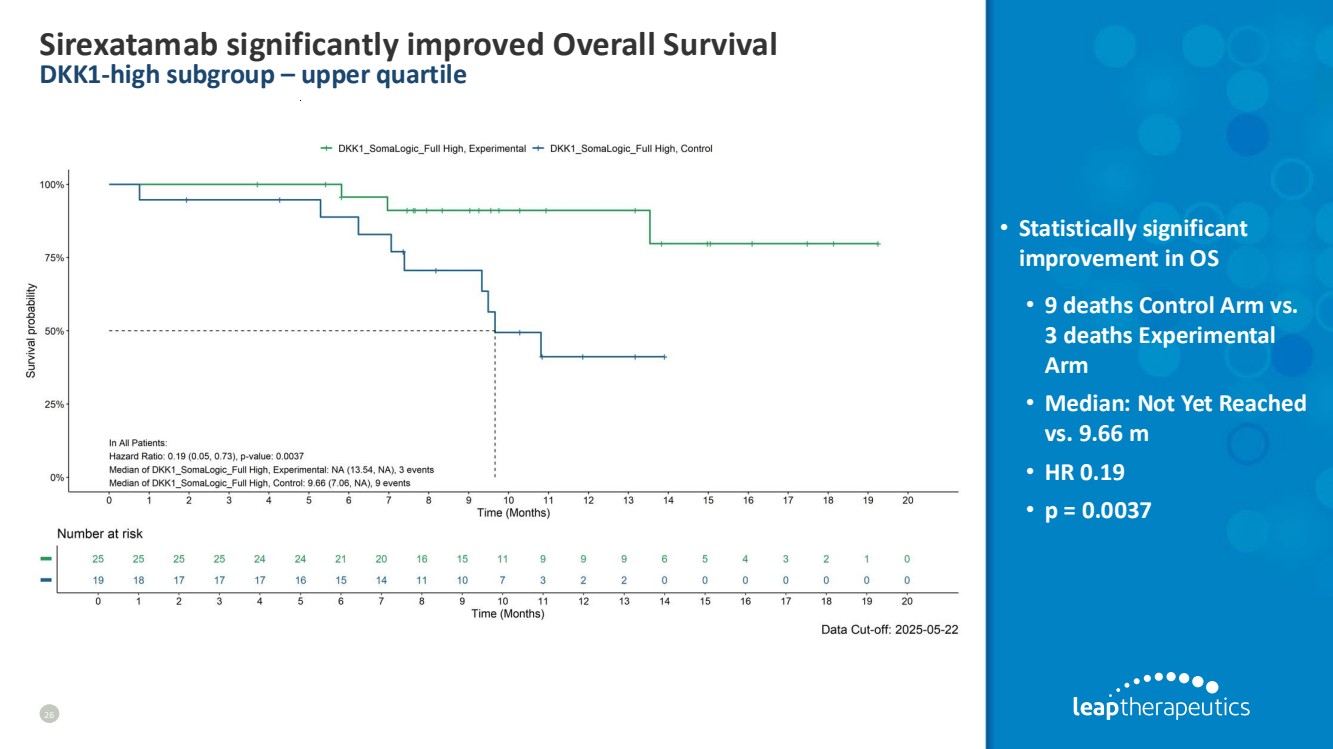
| Sirexatamab significantly improved Overall Survival DKK1-high subgroup – upper quartile 26 • Statistically significant improvement in OS • 9 deaths Control Arm vs. 3 deaths Experimental Arm • Median: Not Yet Reached vs. 9.66 m • HR 0.19 • p = 0.0037 |
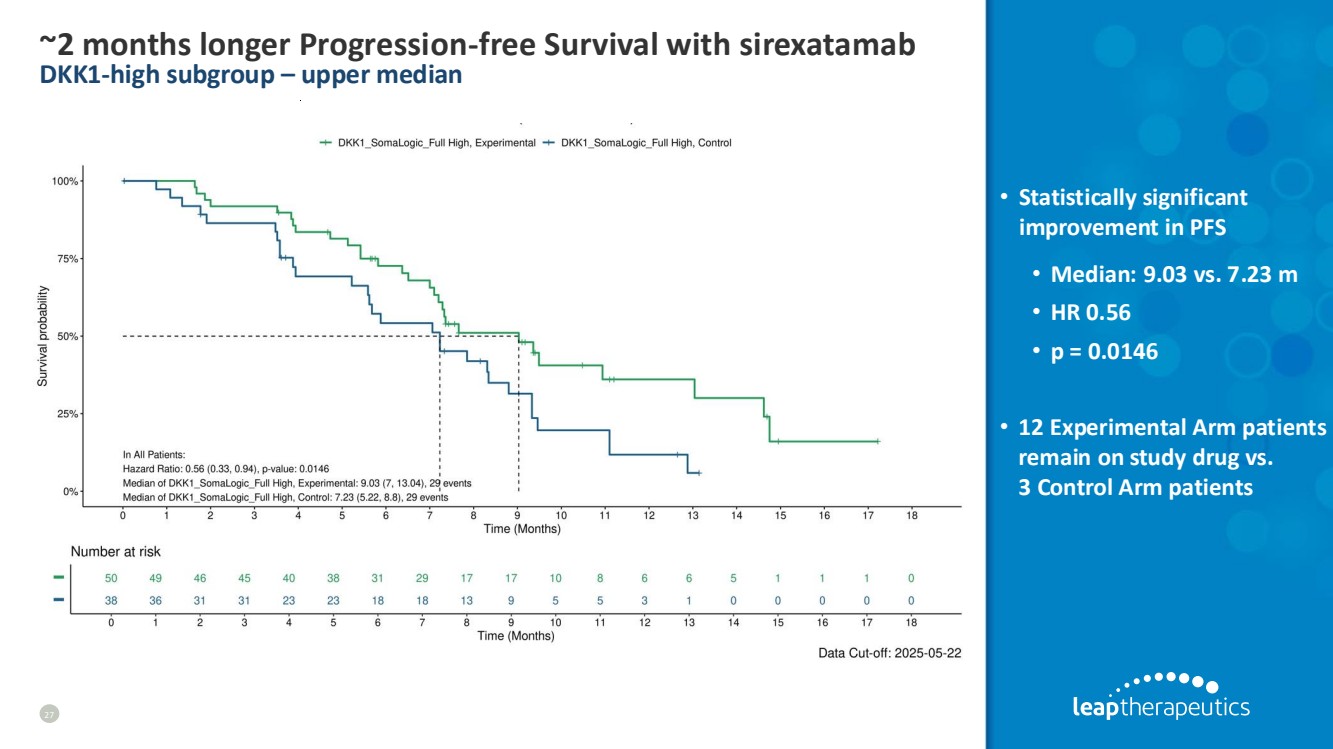
| ~2 months longer Progression-free Survival with sirexatamab DKK1-high subgroup – upper median 27 • Statistically significant improvement in PFS • Median: 9.03 vs. 7.23 m • HR 0.56 • p = 0.0146 • 12 Experimental Arm patients remain on study drug vs. 3 Control Arm patients |
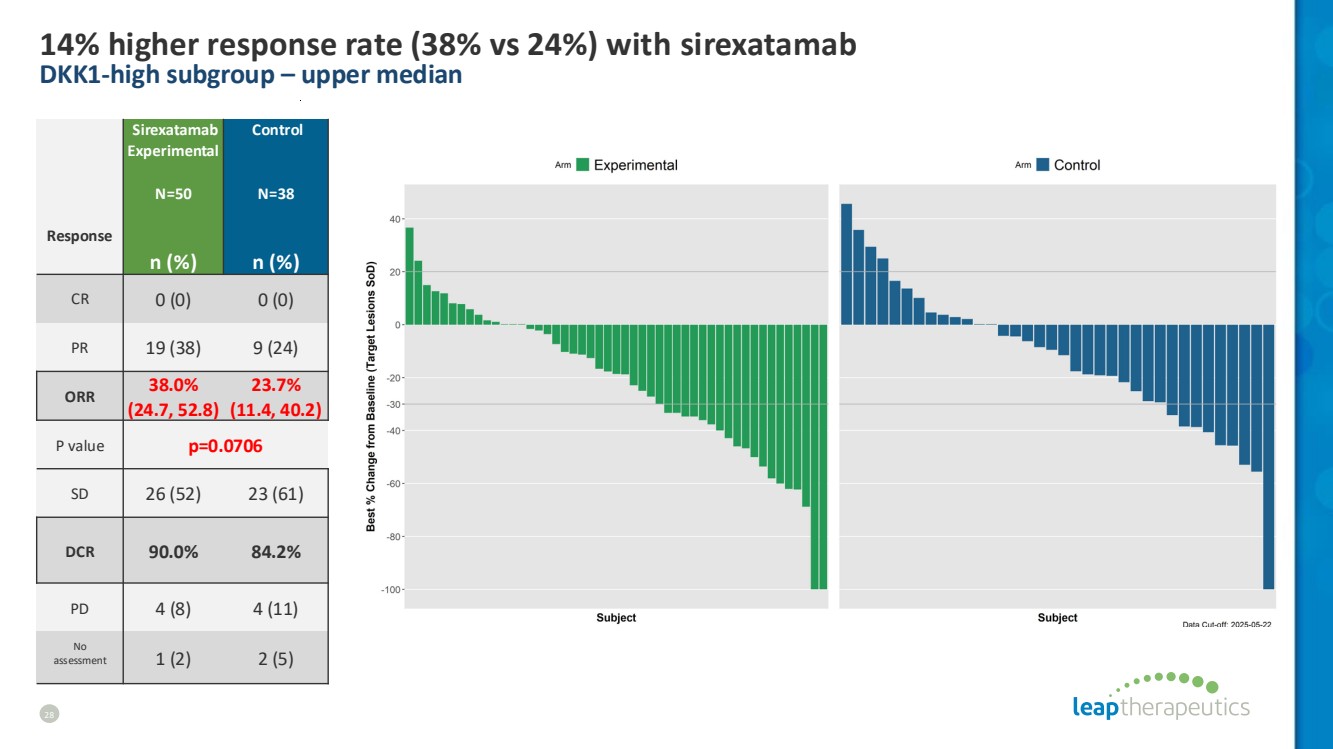
| 14% higher response rate (38% vs 24%) with sirexatamab DKK1-high subgroup – upper median 28 Response Sirexatamab Experimental N=50 Control N=38 n (%) n (%) CR 0 (0) 0 (0) PR 19 (38) 9 (24) ORR 38.0% (24.7, 52.8) 23.7% (11.4, 40.2) P value p=0.0706 SD 26 (52) 23 (61) DCR 90.0% 84.2% PD 4 (8) 4 (11) No assessment 1 (2) 2 (5) |
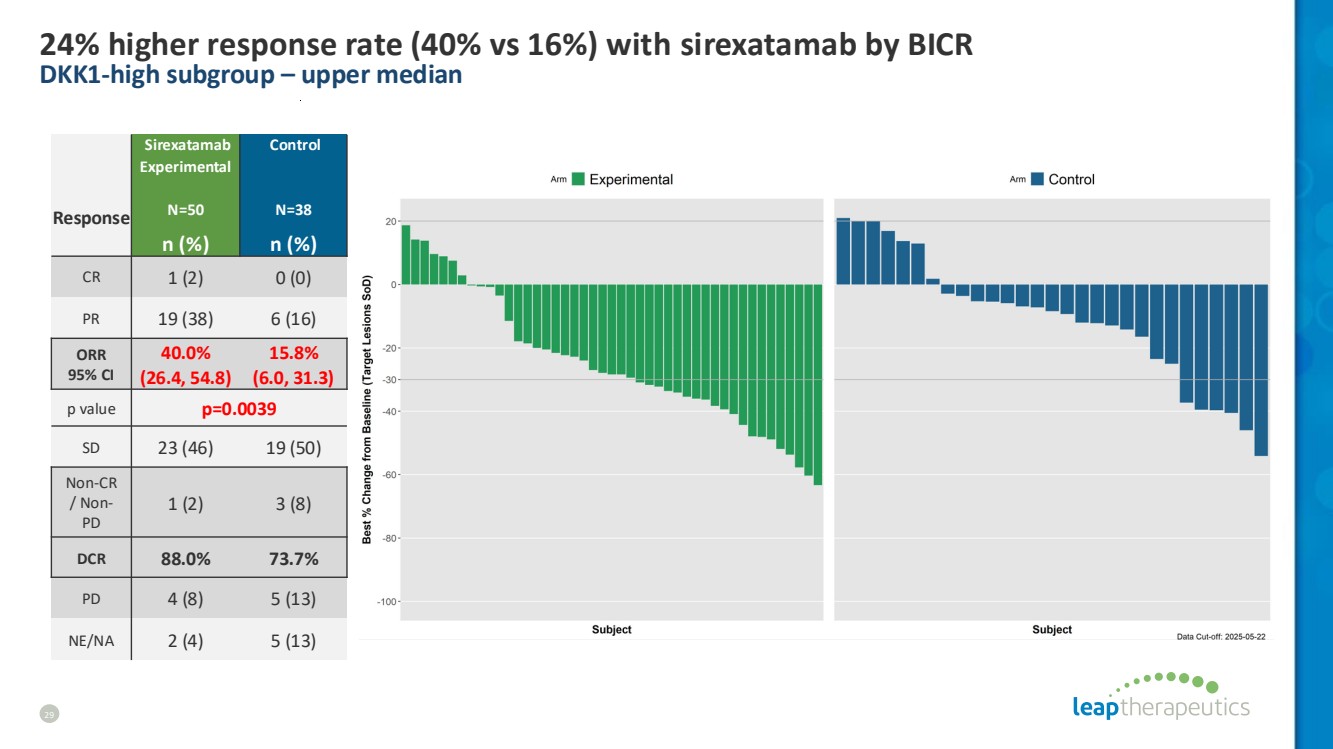
| 24% higher response rate (40% vs 16%) with sirexatamab by BICR DKK1-high subgroup – upper median 29 Response Sirexatamab Experimental N=50 Control N=38 n (%) n (%) CR 1 (2) 0 (0) PR 19 (38) 6 (16) ORR 95% CI 40.0% (26.4, 54.8) 15.8% (6.0, 31.3) p value p=0.0039 SD 23 (46) 19 (50) Non-CR / Non-PD 1 (2) 3 (8) DCR 88.0% 73.7% PD 4 (8) 5 (13) NE/NA 2 (4) 5 (13) |
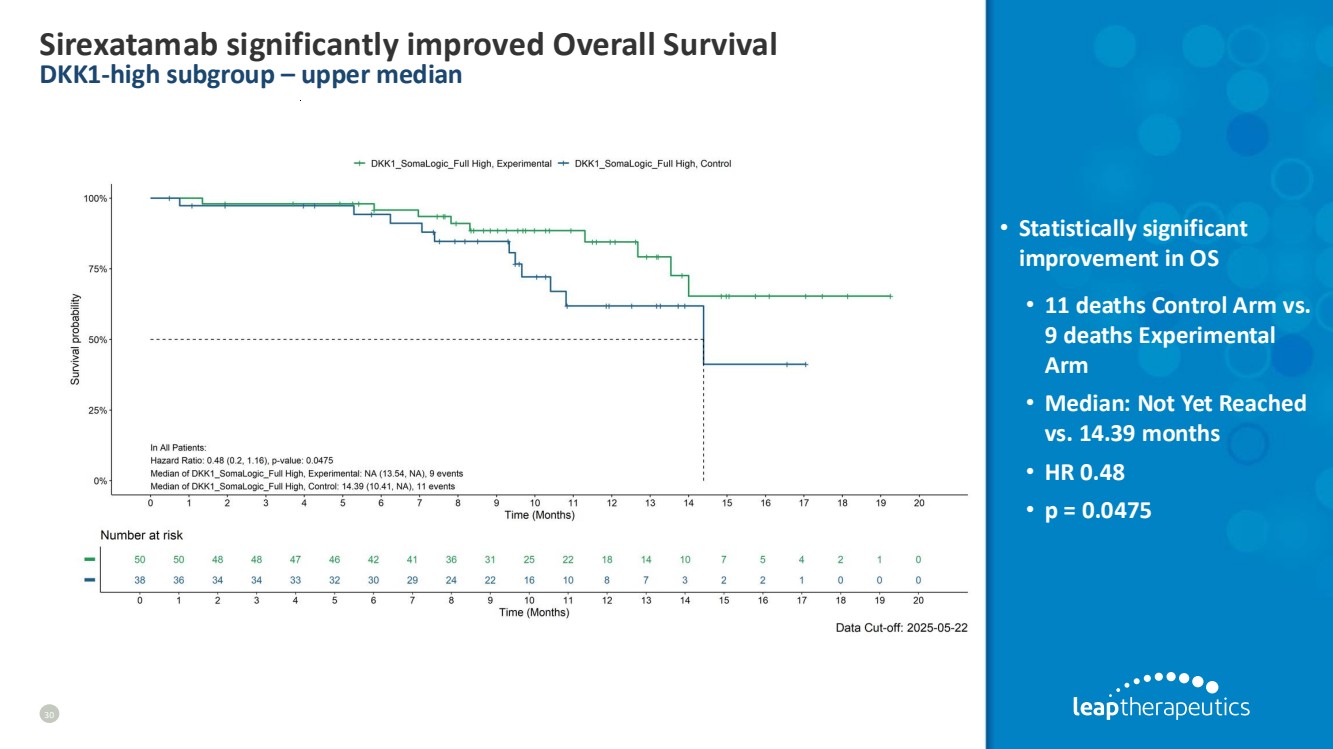
| Sirexatamab significantly improved Overall Survival DKK1-high subgroup – upper median 30 • Statistically significant improvement in OS • 11 deaths Control Arm vs. 9 deaths Experimental Arm • Median: Not Yet Reached vs. 14.39 months • HR 0.48 • p = 0.0475 |
| NO PRIOR ANTI-VEGF POPULATION |

| 2.9 months longer Progression-free Survival with sirexatamab No prior anti-VEGF subgroup 32 • Statistically significant improvement in PFS • Median: 11.2 vs. 8.34 m • HR 0.61 • p = 0.0383 • 15 Experimental Arm patients remain on study drug vs. 5 Control Arm |

| Sirexatamab improved ORR by 22% (55% vs. 33%) No prior anti-VEGF subgroup 33 Sirexatamab Experimental N=49 Control N=46 Response n (%) n (%) CR 0 (0) 3 (7) PR 27 (55) 12 (26) ORR 95% CI 55.1% (40.2, 69.3) 32.6% (19.5, 48.0) p value p=0.0116 SD 19 (39) 24 (52) DCR 93.9% 84.8% PD 0 (0) 4 (9) No assessment 3 (6) 3 (7) |

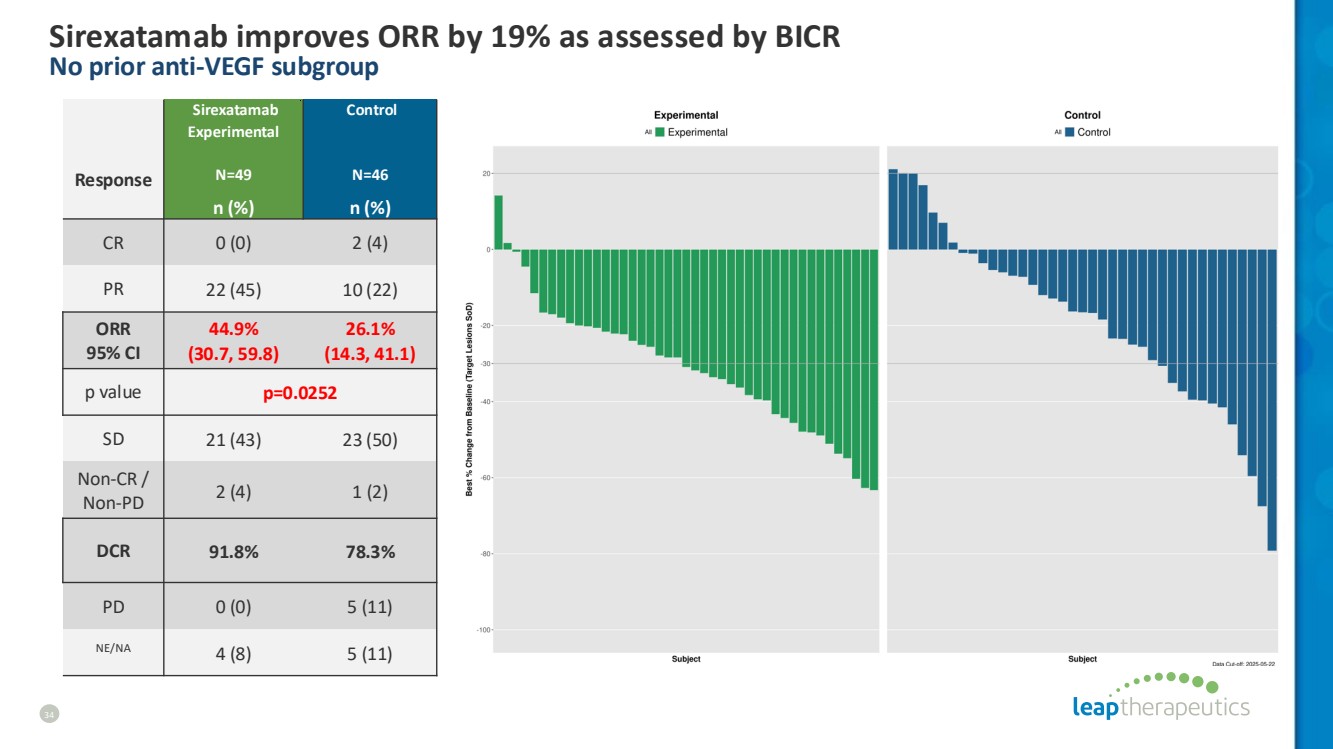
| Sirexatamab improves ORR by 19% as assessed by BICR No prior anti-VEGF subgroup 34 Response Sirexatamab Experimental N=49 Control N=46 n (%) n (%) CR 0 (0) 2 (4) PR 22 (45) 10 (22) ORR 95% CI 44.9% (30.7, 59.8) 26.1% (14.3, 41.1) p value p=0.0252 SD 21 (43) 23 (50) Non-CR / Non-PD 2 (4) 1 (2) DCR 91.8% 78.3% PD 0 (0) 5 (11) NE/NA 4 (8) 5 (11) |
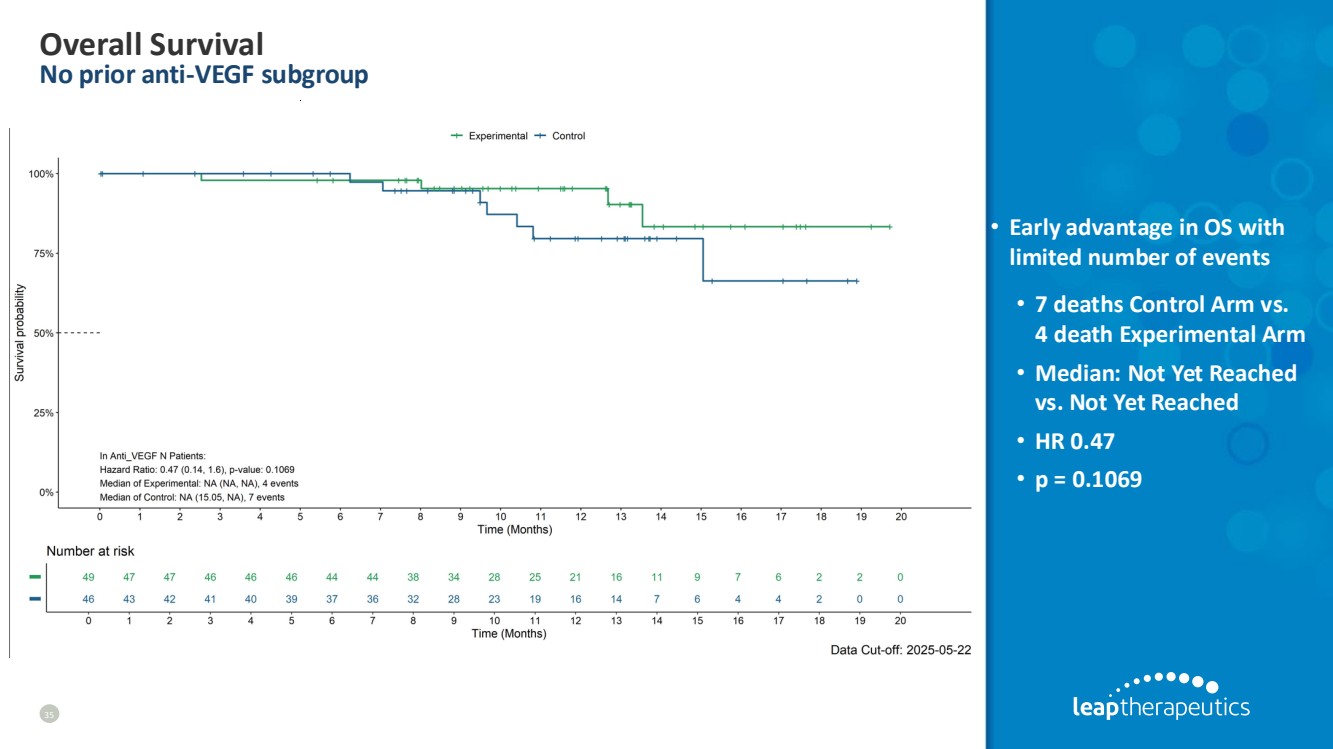
| Overall Survival No prior anti-VEGF subgroup 35 • Early advantage in OS with limited number of events • 7 deaths Control Arm vs. 4 death Experimental Arm • Median: Not Yet Reached vs. Not Yet Reached • HR 0.47 • p = 0.1069 |
| LIVER METS POPULATION |

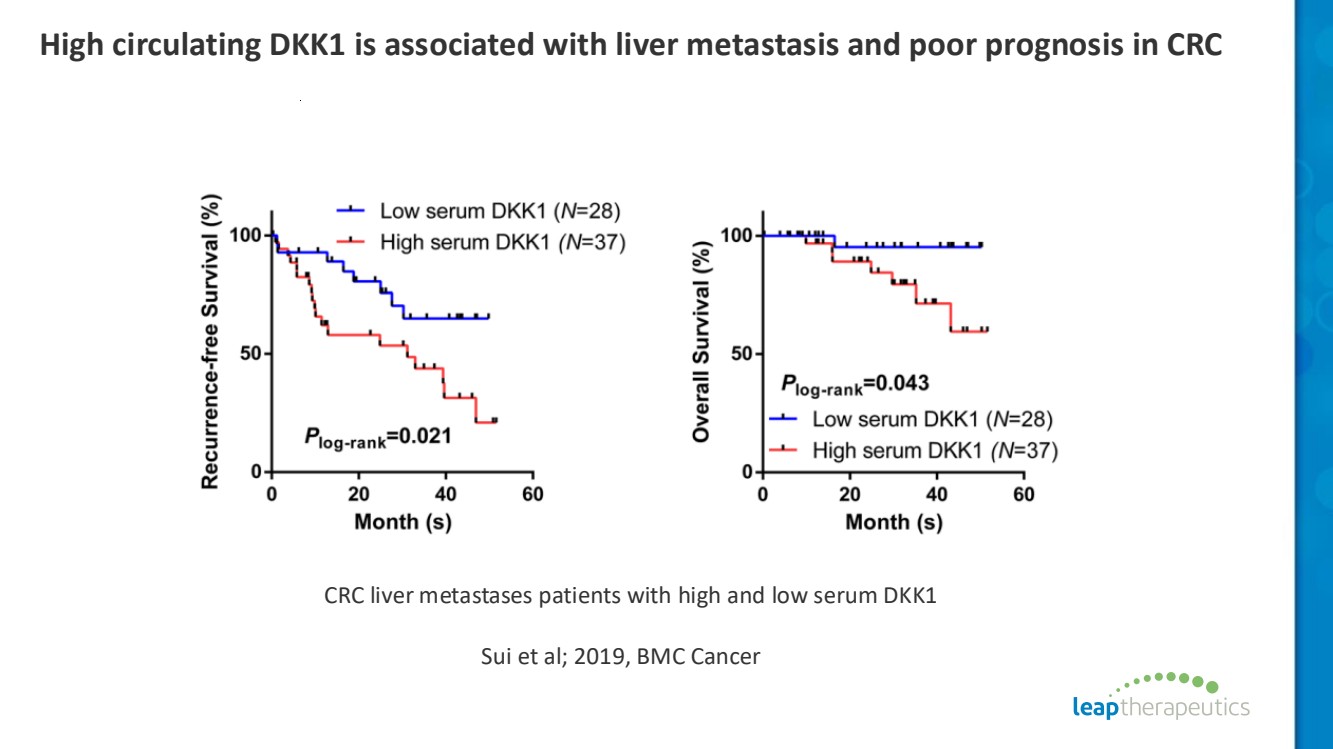
| High circulating DKK1 is associated with liver metastasis and poor prognosis in CRC CRC liver metastases patients with high and low serum DKK1 Sui et al; 2019, BMC Cancer |
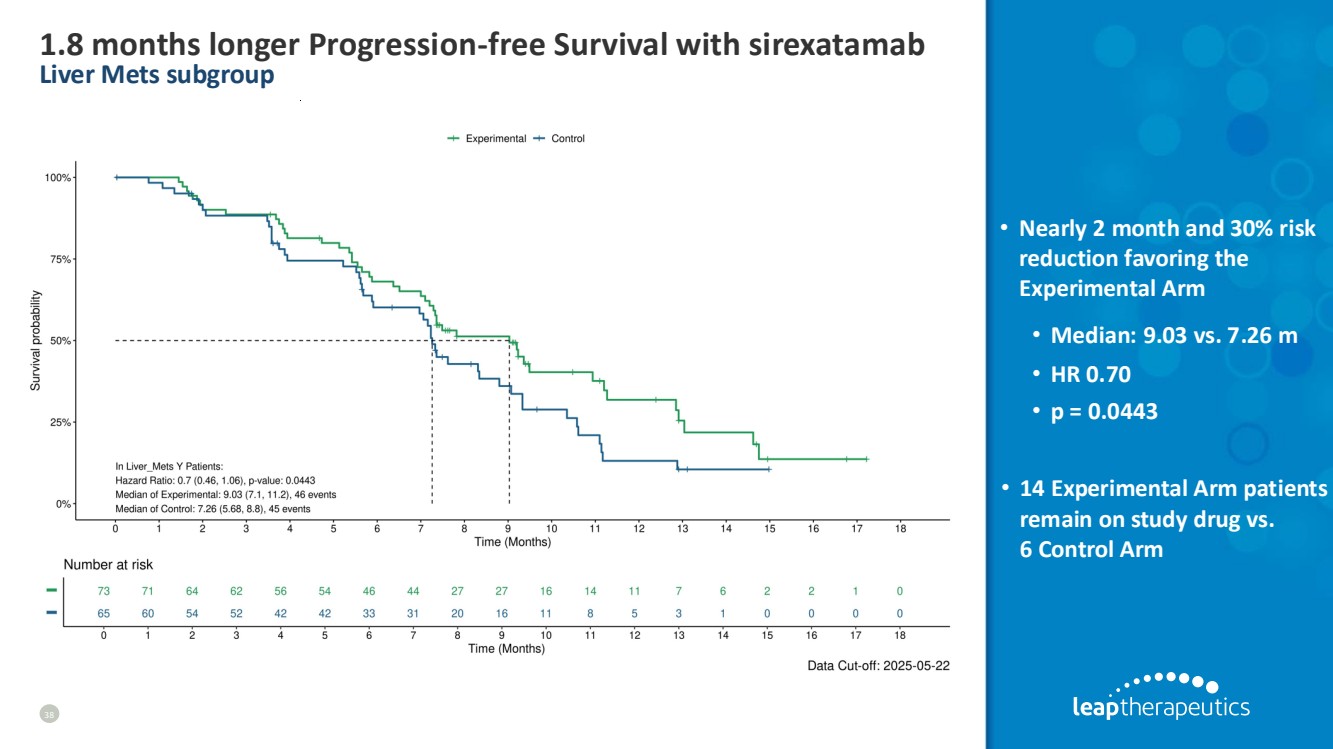
| 1.8 months longer Progression-free Survival with sirexatamab Liver Mets subgroup 38 • Nearly 2 month and 30% risk reduction favoring the Experimental Arm • Median: 9.03 vs. 7.26 m • HR 0.70 • p = 0.0443 • 14 Experimental Arm patients remain on study drug vs. 6 Control Arm |
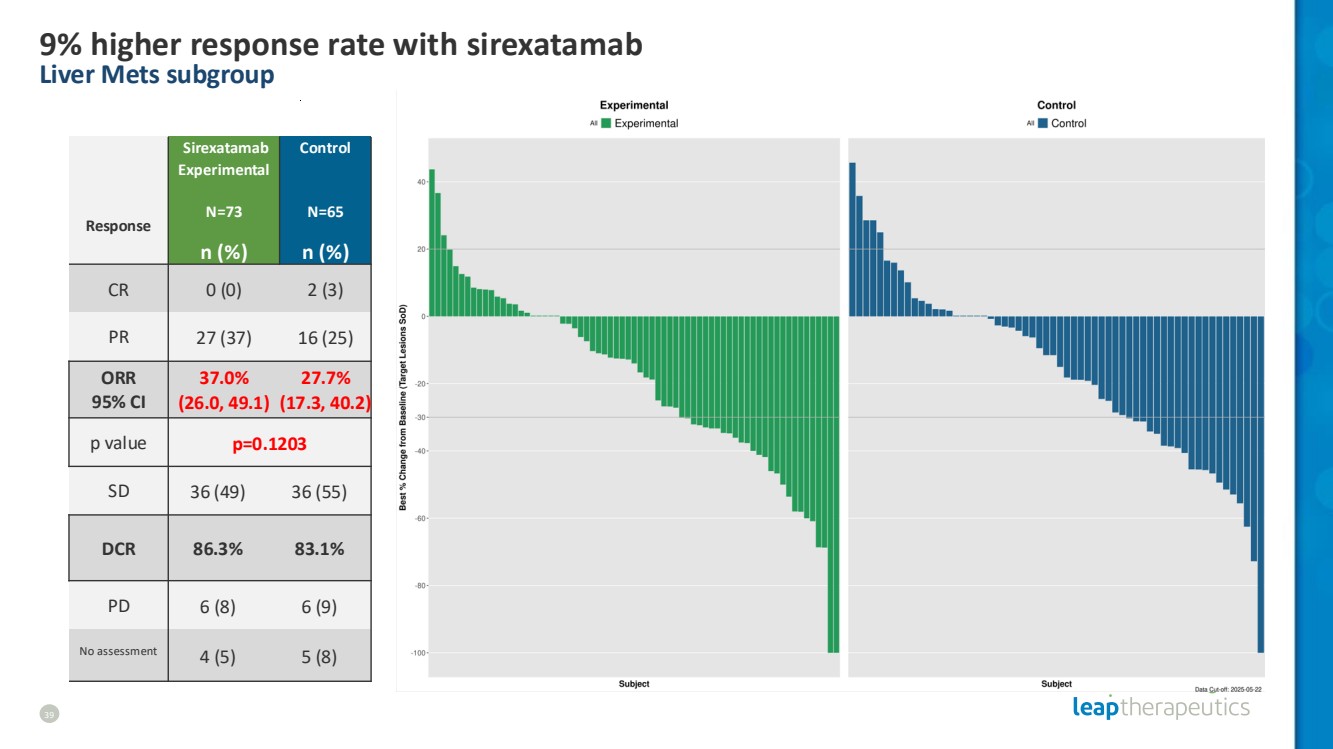
| 9% higher response rate with sirexatamab Liver Mets subgroup 39 Response Sirexatamab Experimental N=73 Control N=65 n (%) n (%) CR 0 (0) 2 (3) PR 27 (37) 16 (25) ORR 95% CI 37.0% (26.0, 49.1) 27.7% (17.3, 40.2) p value p=0.1203 SD 36 (49) 36 (55) DCR 86.3% 83.1% PD 6 (8) 6 (9) No assessment 4 (5) 5 (8) |
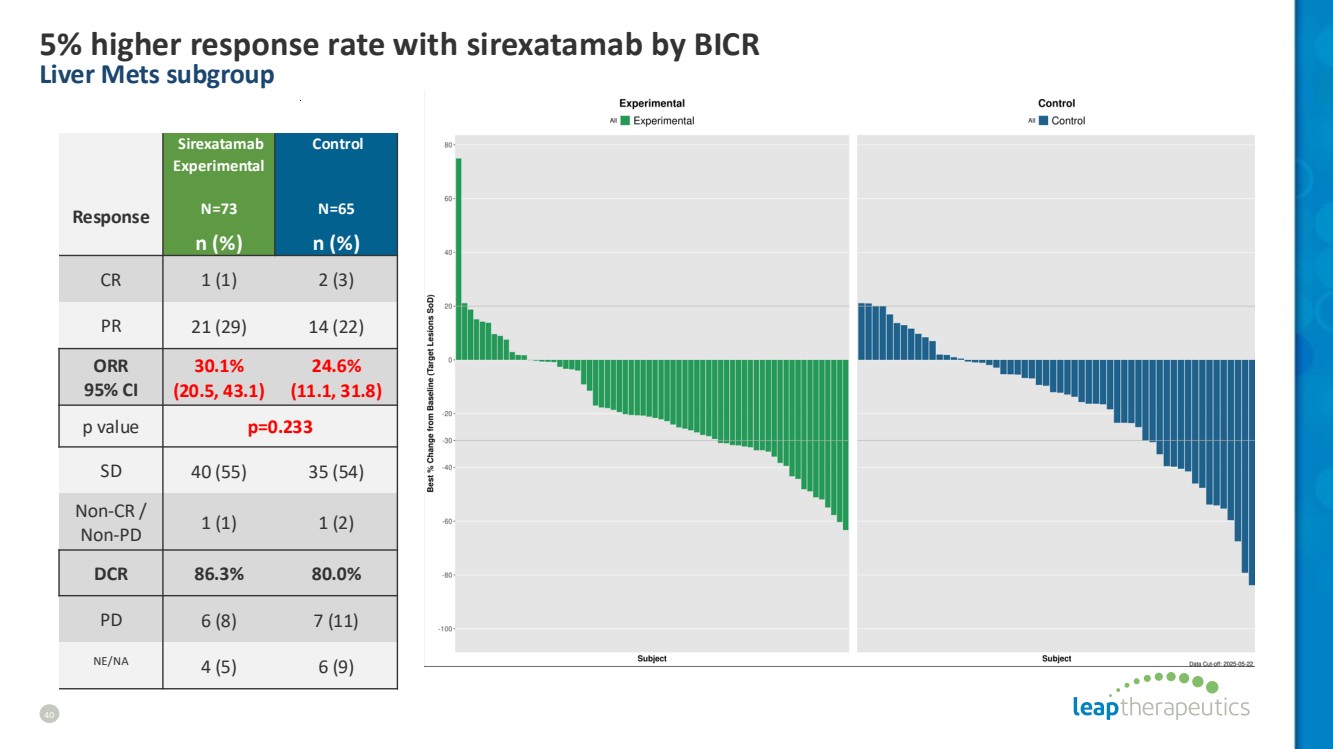
| 5% higher response rate with sirexatamab by BICR Liver Mets subgroup 40 Response Sirexatamab Experimental N=73 Control N=65 n (%) n (%) CR 1 (1) 2 (3) PR 21 (29) 14 (22) ORR 95% CI 30.1% (20.5, 43.1) 24.6% (11.1, 31.8) p value p=0.233 SD 40 (55) 35 (54) Non-CR / Non-PD 1 (1) 1 (2) DCR 86.3% 80.0% PD 6 (8) 7 (11) NE/NA 4 (5) 6 (9) |
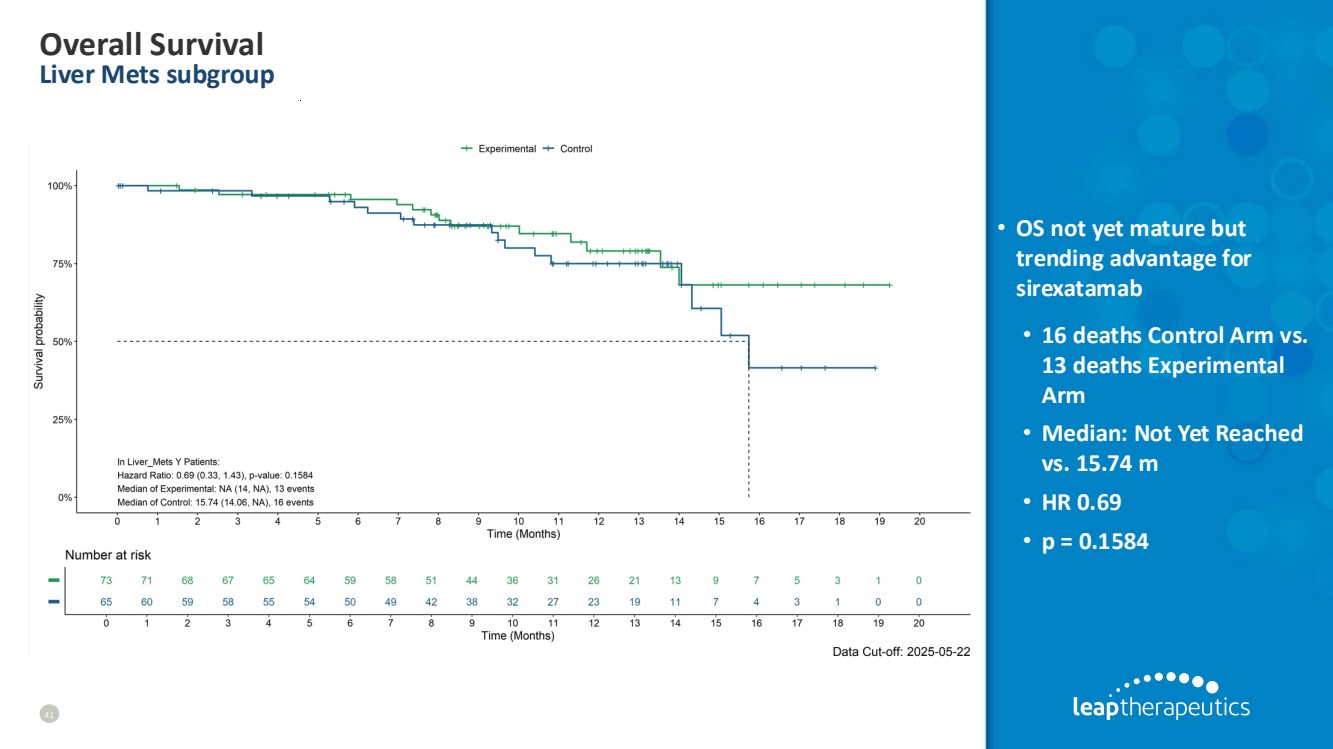
| Overall Survival Liver Mets subgroup 41 • OS not yet mature but trending advantage for sirexatamab • 16 deaths Control Arm vs. 13 deaths Experimental Arm • Median: Not Yet Reached vs. 15.74 m • HR 0.69 • p = 0.1584 |
| ~3 months longer Progression-free Survival with sirexatamab Liver Mets subgroup without prior VEGF 42 • Nearly 3 month improvement favoring the Experimental Arm in patients with liver mets and no prior VEGF exposure • Median: 11.2 vs. 8.34 m • HR 0.64 • p = 0.0725 • 9 Experimental Arm patients remain on study drug vs. 4 Control Arm |

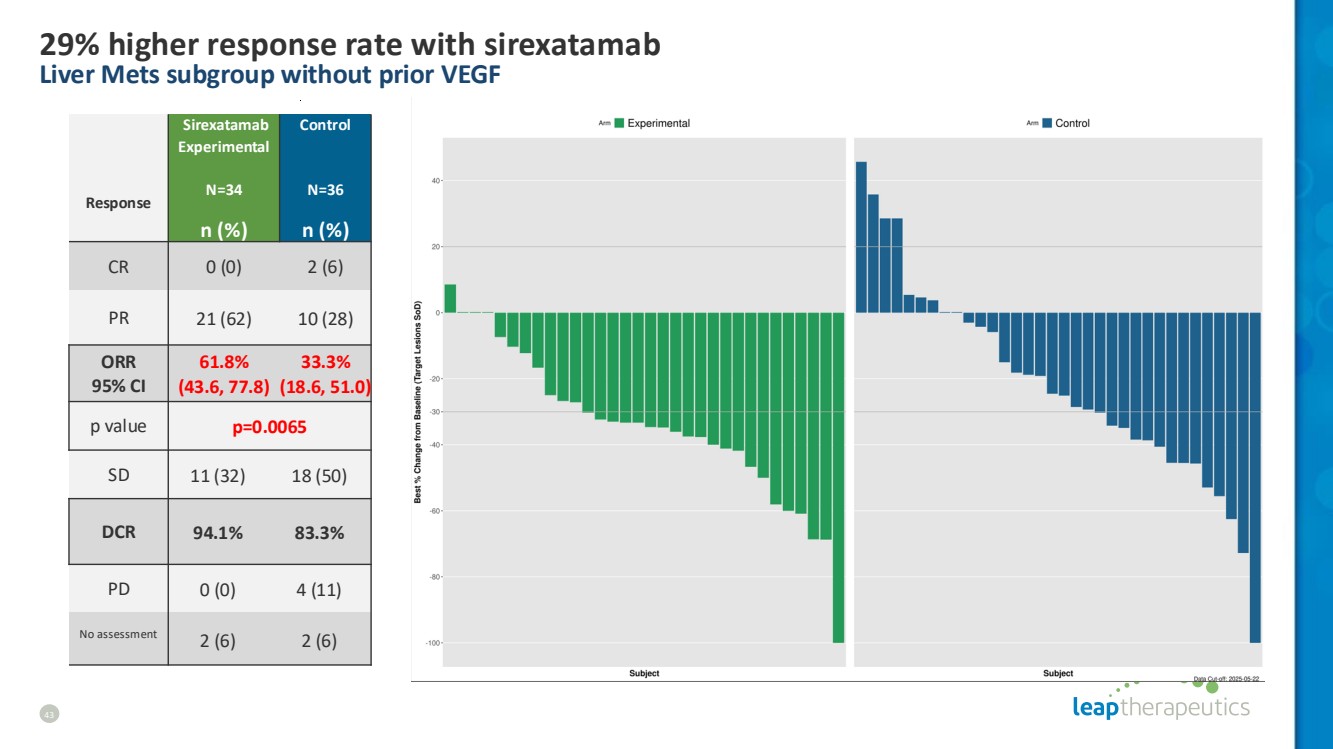
| 43 29% higher response rate with sirexatamab Liver Mets subgroup without prior VEGF Response Sirexatamab Experimental N=34 Control N=36 n (%) n (%) CR 0 (0) 2 (6) PR 21 (62) 10 (28) ORR 95% CI 61.8% (43.6, 77.8) 33.3% (18.6, 51.0) p value p=0.0065 SD 11 (32) 18 (50) DCR 94.1% 83.3% PD 0 (0) 4 (11) No assessment 2 (6) 2 (6) |
| MARKET OPPORTUNITY |

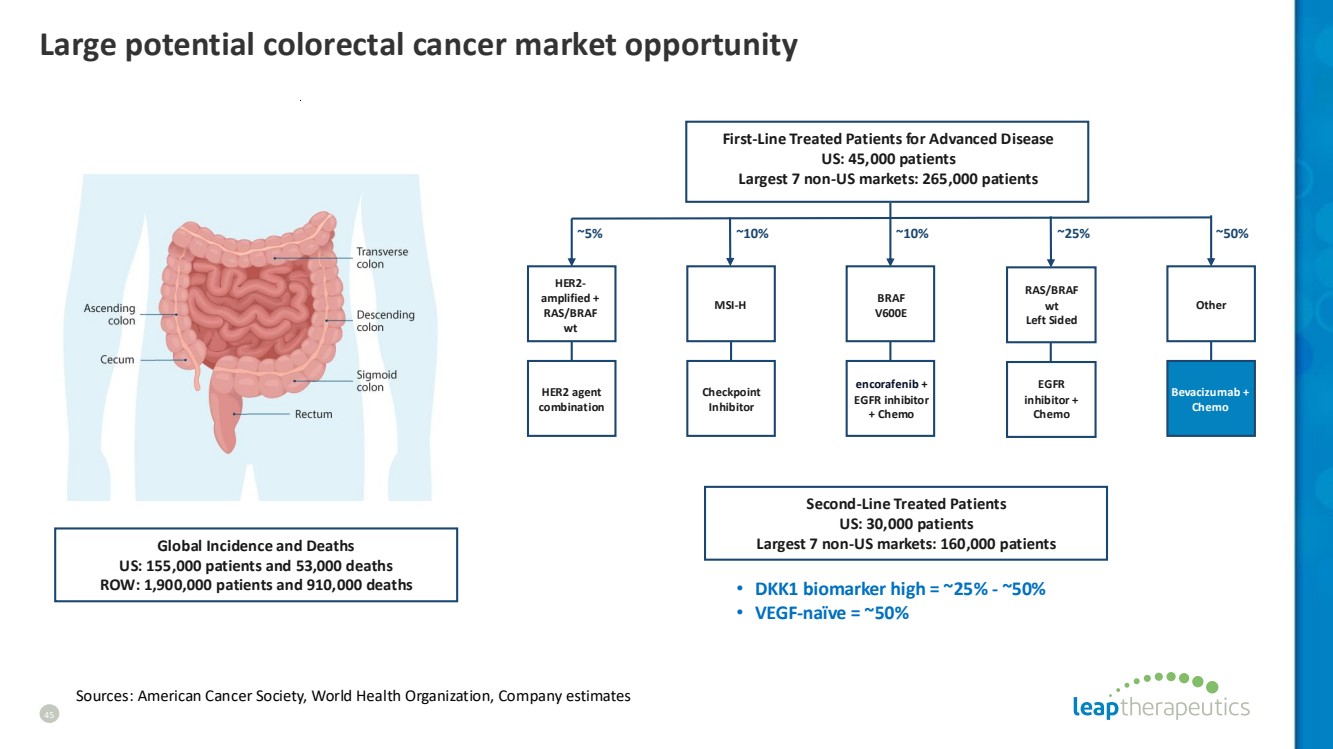
| Large potential colorectal cancer market opportunity Global Incidence and Deaths US: 155,000 patients and 53,000 deaths ROW: 1,900,000 patients and 910,000 deaths Second-Line Treated Patients US: 30,000 patients Largest 7 non-US markets: 160,000 patients First-Line Treated Patients for Advanced Disease US: 45,000 patients Largest 7 non-US markets: 265,000 patients ~5% ~10% ~25% ~50% EGFR inhibitor + Chemo RAS/BRAF wt Left Sided encorafenib + EGFR inhibitor + Chemo BRAF V600E HER2 agent combination HER2- amplified + RAS/BRAF wt Bevacizumab + Chemo Other ~10% MSI-H Checkpoint Inhibitor • DKK1 biomarker high = ~25% - ~50% • VEGF-naïve = ~50% Sources: American Cancer Society, World Health Organization, Company estimates 45 |
| Sirexatamab ORR is enhanced by increasing DKK1 across biomarker subgroups 46 All Patients DKK1-High (upper median) DKK1-High (upper quartile) Group Sirexatamab Experimental Control Sirexatamab Experimental Control Sirexatamab Experimental Control ITT 35% 27% 38% 24% 44% 16% VEGF-naïve 55% 33% 56% 36% 56% 25% VEGF-experienced 13% 21% 17% 6% 22% 0% Liver mets Y 37% 28% 40% 30% 48% 20% Liver mets N 29% 24% 30% 9% 25% 0% • Control arm demonstrates decreasing response with higher DKK1 across subgroups • Experimental arm demonstrates increasing response with higher DKK1 across subgroups |

| FL-501 Anti-GDF-15 monoclonal antibody |
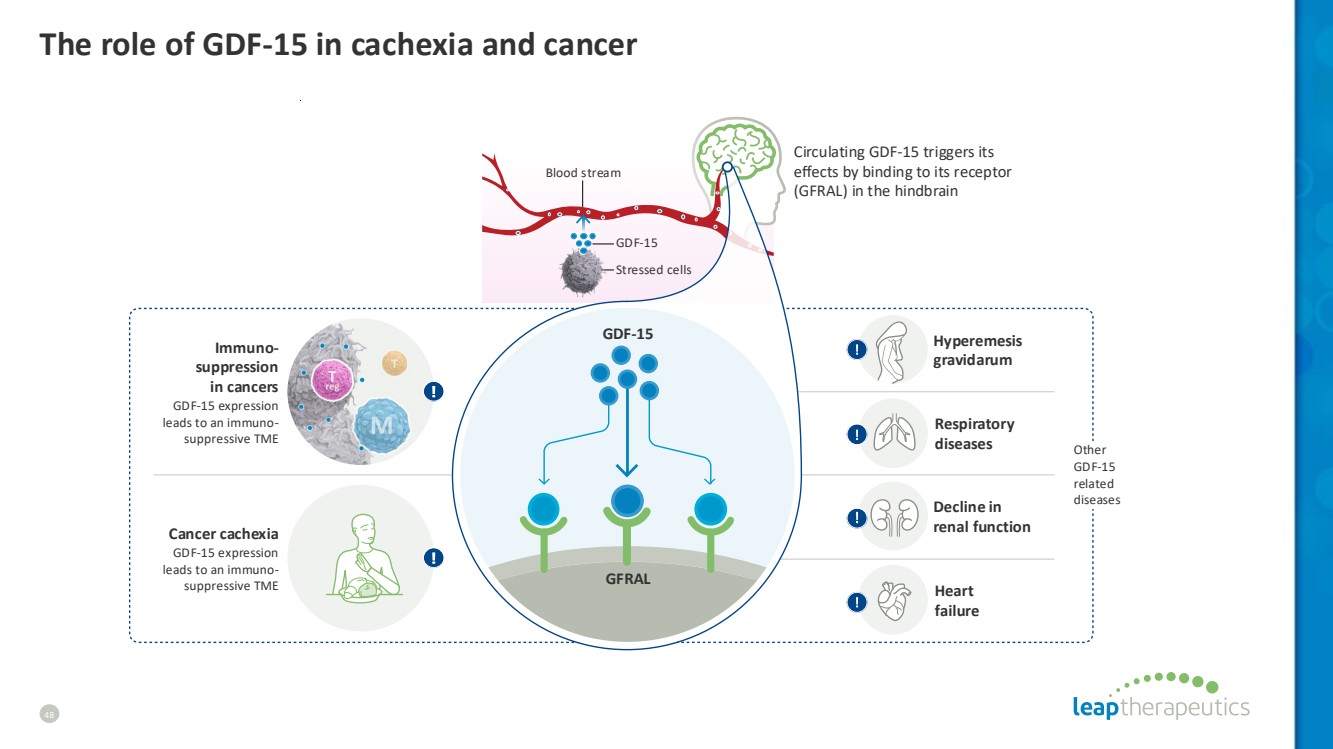
| GDF-15 Blood stream Stressed сells Cancer cachexia GDF-15 expression leads to an immuno-suppressive TME Heart failure Decline in renal function Hyperemesis gravidarum GFRAL GDF-15 Other GDF-15 related diseases Circulating GDF-15 triggers its effects by binding to its receptor (GFRAL) in the hindbrain Immuno-suppression in cancers GDF-15 expression leads to an immuno-suppressive TME Respiratory diseases The role of GDF-15 in cachexia and cancer 48 |
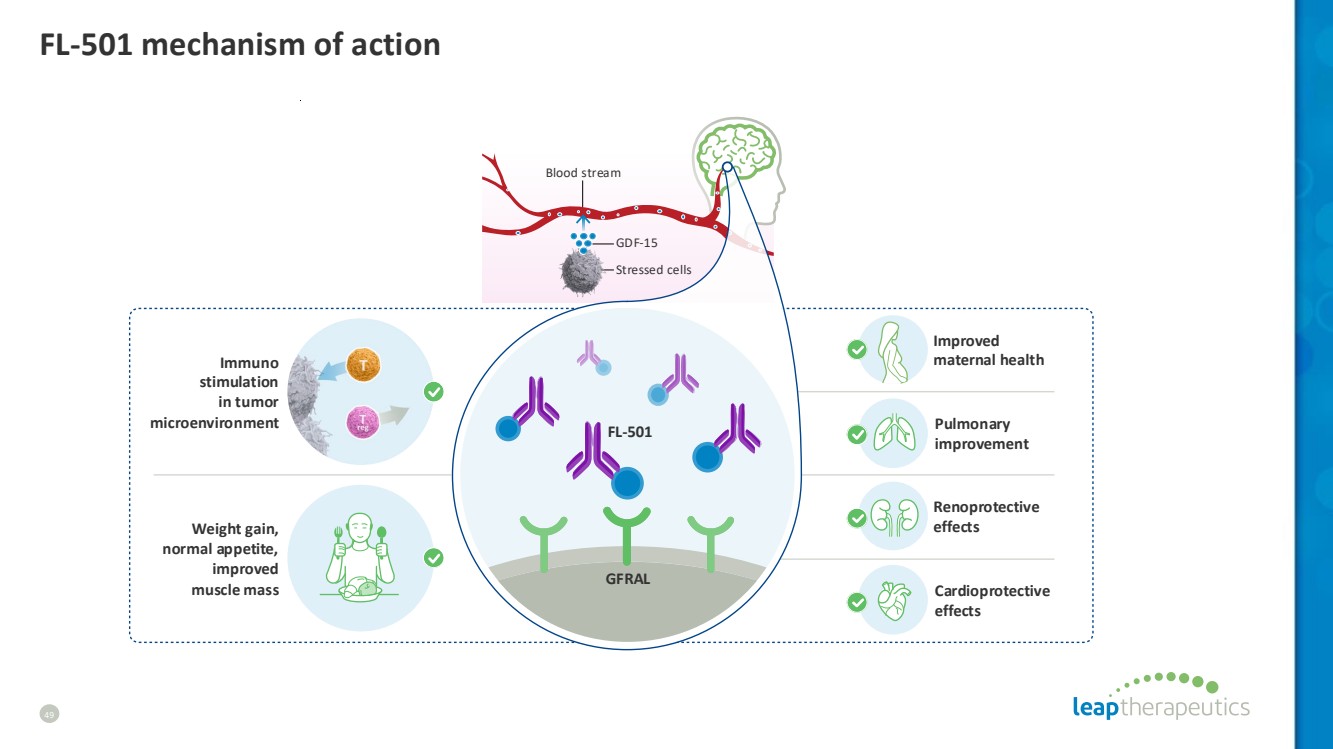
| GDF-15 Blood stream Stressed сells Weight gain, normal appetite, improved muscle mass Cardioprotective effects Renoprotective effects Improved maternal health GFRAL Immuno stimulation in tumor microenvironment Pulmonary improvement FL-501 FL-501 mechanism of action 49 |
| company presentation LEAP THERAPEUTICS June 23, 2025 |
