Pay vs Performance Disclosure - USD ($)
Dec. 31, 2024
Dec. 31, 2023
| Year | Summary Compensation Table Total for PEO(1) ($) | Compensation Actually Paid to CEO(3)(4) ($) | Average Summary Compensation Table Total for Other NEOs(2) ($) | Average Compensation Actually Paid to Other NEOs(3)(4) ($) | Value of Initial Fixed $100 Investment Based on: Total Shareholder Return(5) ($) | Net Income ($ in thousands) | ||||||||||||||||||
| 2024 | 2,123,200 | 497,200 | 1,772,200 | 823,450 | 7.86 | (53,364 | ) | |||||||||||||||||
| 2023 | 3,367,200 | 1,922,200 | 370,695 | 226,195 | 46.94 | (16,782 | ) | |||||||||||||||||
| (1) | The amounts reflect the Summary Compensation Table total compensation for Ted Karkus, our PEO for each of the years listed. | |
| (2) | For 2024, the amount reflects the Summary Compensation Table average compensation total for Jed Latkin, our Chief Operating Officer and Robert Morse, our former Chief Financial Officer. For 2023, the amount reflects the Summary Compensation Table average compensation total for Robert Morse, our former Chief Financial Officer and for Monica Brady, our former Chief Accounting Officer. |
| 2024 | 2023 | |||||||||||||||
| SCT Total to CAP Reconciliation | PEO | Other NEOs | PEO | Other NEOs | ||||||||||||
| SCT Total | $ | 2,123,200 | $ | 1,772,200 | $ | 3,367,200 | $ | 370,695 | ||||||||
| (Deduct): Aggregate value for stock awards and option awards included in SCT Total for the covered fiscal year | (1,220,000 | ) | (1,315,000 | ) | (2,465,000 | ) | (246,500 | ) | ||||||||
| Add: Fair value at year end of awards granted during the covered fiscal year that were outstanding and unvested at the covered fiscal year end | 33,000 | 37,500 | 1,020,000 | 102,000 | ||||||||||||
| Add (Deduct): Year-over-year change in fair value at covered fiscal year end of awards granted in any prior fiscal year that were outstanding and unvested at the covered fiscal year end | (796,000 | ) | ||||||||||||||
| Add: Vesting date fair value of awards granted and vested during the covered fiscal year | 305,000 | 328,750 | ||||||||||||||
| Add (Deduct): Changes as of the vesting date (from the end of the prior fiscal year) in fair value of awards granted in any prior fiscal year for which vesting conditions were satisfied during the covered fiscal year | 52,000 | |||||||||||||||
| CAP Amounts (as calculated) | $ | 497,200 | $ | 823,450 | $ | 1,922,200 | $ | 226,195 | ||||||||
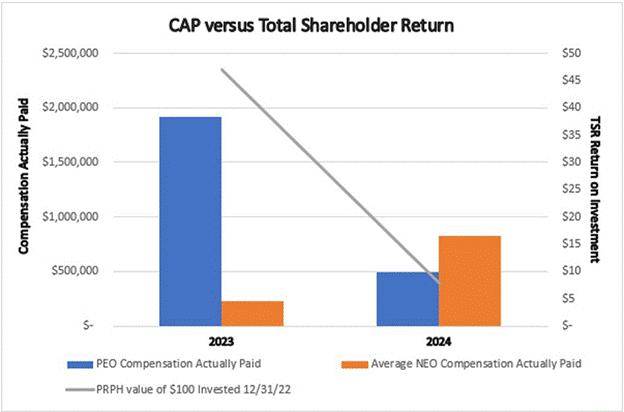
Compensation Actually Paid and Company TSR
The graph below shows the relationship between (1) compensation actually paid to our PEO and the average of the compensation actually paid to our other NEOs and (2) our cumulative TSR, over the two fiscal years ending December 31, 2024.
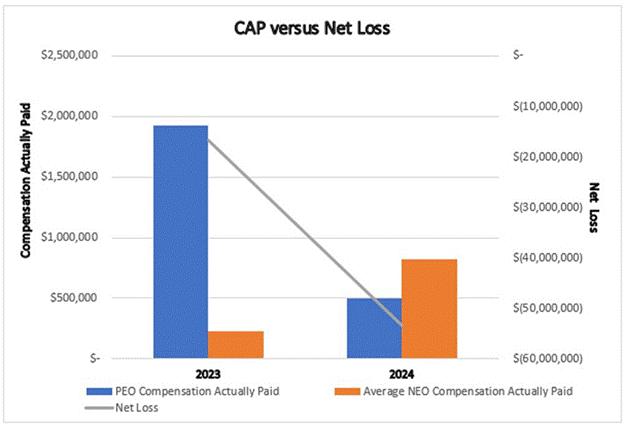
Compensation Actually Paid and Net Loss
The graph below shows the relationship between compensation actually paid to our PEO and the average of the compensation actually paid to the Other NEOs and net loss attributable to the Company over the three fiscal years ending December 31, 2024, as reported in the Company consolidated financial statements.
| (3) | The amounts shown for Compensation Actually Paid to our PEO and Average Compensation Actually Paid to the Other NEOs have been calculated in accordance with Item 402(v) of Regulation S-K and do not reflect compensation actually realized or received by such persons. These amounts reflect total compensation as set forth in the Summary Compensation Table above for each year, adjusted as described in footnote 4 below. | |
| (4) | The dollar amounts reported in these columns represent the amounts of “compensation actually paid.” The amounts are computed in accordance with Item 402(v) of Regulation S-K by deducting and adding the following amounts from the “Total” column of the SCT (pursuant to SEC rules, fair value at each measurement date is computed in a manner consistent with the fair value methodology used to account for share-based payments in our financial statements under GAAP). |
| [1] | The amounts reflect the Summary Compensation Table total compensation for Ted Karkus, our PEO for each of the years listed. |
| [2] | The amounts shown for Compensation Actually Paid to our PEO and Average Compensation Actually Paid to the Other NEOs have been calculated in accordance with Item 402(v) of Regulation S-K and do not reflect compensation actually realized or received by such persons. These amounts reflect total compensation as set forth in the Summary Compensation Table above for each year, adjusted as described in footnote 4 below. |
| [3] | The dollar amounts reported in these columns represent the amounts of “compensation actually paid.” The amounts are computed in accordance with Item 402(v) of Regulation S-K by deducting and adding the following amounts from the “Total” column of the SCT (pursuant to SEC rules, fair value at each measurement date is computed in a manner consistent with the fair value methodology used to account for share-based payments in our financial statements under GAAP). |
| [4] | For 2024, the amount reflects the Summary Compensation Table average compensation total for Jed Latkin, our Chief Operating Officer and Robert Morse, our former Chief Financial Officer. For 2023, the amount reflects the Summary Compensation Table average compensation total for Robert Morse, our former Chief Financial Officer and for Monica Brady, our former Chief Accounting Officer. |
| [5] | This column shows Total Shareholder Return (“TSR”) on a cumulative basis for each year of the two-year period from 2023 through 2024. Dollar values assume $100 was invested for the cumulative period from December 31, 2023 through December 31, 2024 in the Company. Historical performance is not necessarily indicative of future stock performance. |