Pay vs Performance Disclosure - USD ($)
Dec. 31, 2024
Dec. 31, 2023
Dec. 31, 2022
Dec. 31, 2021
In accordance with rules adopted by the Securities and Exchange Commission pursuant to the Dodd-Frank Wall Street Reform and Consumer Protection Act of 2010, we provide the following disclosure regarding executive compensation for our principal executive officer (“PEO”) and
Non-PEO
NEOs and Company performance for the fiscal years listed below. For the most recently completed fiscal year, we did not use any financial performance measure to link Compensation Actually Paid to our NEOs to the Company’s performance; accordingly, this disclosure does not present a company-selected measure in the table below nor a tabular list of our most important performance measures, as permitted under the rules promulgated by the Securities and Exchange Commission. Year |
Summary Compensation Table Total for PEO 1 ($) |
Compensation Actually Paid to PEO 1, 2, 3 ($) |
Average Summary Compensation Table Total for Non-PEO NEOs 1 ($) |
Average Compensation Actually Paid to Non-PEO NEOs 1,2,3 ($) |
Value of Initial Fixed $100 Investment based on 4 |
Net Income ($ Millions) |
||||||||||||||||||||||
| TSR ($) |
Peer Group TSR ($) |
|||||||||||||||||||||||||||
2024 |
4,272,299 | 17,389,937 | 1,790,789 | 6,201,653 | 157.18 | 34.94 | (97.0 | ) | ||||||||||||||||||||
2023 |
3,874,300 | 2,219,787 | 1,740,206 | 1,235,658 | 64.17 | 41.97 | (57.5 | ) | ||||||||||||||||||||
2022 |
2,667,997 | 6,079,613 | 1,190,292 | 2,247,169 | 88.95 | 46.36 | (161.8 | ) | ||||||||||||||||||||
2021 |
3,892,610 | 1,265,141 | 1,530,003 | 519,760 | 39.90 | 76.00 | (122.2 | ) | ||||||||||||||||||||
| 1. | Paul Bolno, M.D., MBA was our PEO for each year presented. The individuals comprising the Non-PEO NEOs for each year presented are listed below. |
2021 |
2022 |
2023 |
2024 | |||
Michael Panzara, M.D., MPH |
Kyle Moran, CFA | Kyle Moran, CFA | Christopher Francis, Ph.D. | |||
Chandra Vargeese, Ph.D. |
Chandra Vargeese, Ph.D. | Chandra Vargeese, Ph.D. | Kyle Moran, CFA | |||
| Chandra Vargeese, Ph.D. |
| 2. | The amounts shown for Compensation Actually Paid have been calculated in accordance with Item 402(v) of Regulation S-K and do not reflect compensation actually earned, realized, or received by the Company’s NEOs. These amounts reflect the Summary Compensation Table Total with certain adjustments as described in footnote 3 below. |
| 3. | Compensation Actually Paid reflects the exclusions and inclusions of certain amounts for the PEO and the Non-PEO NEOs as set forth below. Equity values are calculated in accordance with FASB ASC Topic 718. Amounts in the Exclusion of Stock and Option Awards column are the totals from the Option Awards column set forth in the Summary Compensation Table. |
Year |
Summary Compensation Table Total for PEO ($) |
Exclusion of Stock and Option Awards for PEO ($) |
Inclusion of Equity Values for PEO ($) |
Compensation Actually Paid to PEO ($) | ||||||||||||||||
2024 |
4,272,299 | (3,064,934 | ) | 16,182,572 | 17,389,937 | |||||||||||||||
Year |
Average Summary Compensation Table Total for Non-PEO NEOs ($) |
Average Exclusion of Stock and Option Awards for Non-PEO NEOs ($) |
Average Inclusion of Equity Values for Non- PEO NEOs ($) |
Average Compensation Actually Paid to Non- PEO NEOs ($) | ||||||||||||||||
2024 |
1,790,789 | (1,032,787 | ) | 5,443,651 | 6,201,653 | |||||||||||||||
The amounts in the Inclusion of Equity Values in the tables above are derived from the amounts set forth in the following tables:
Year |
Year-End Fair Value of Equity Awards Granted During Year That Remained Unvested as of Last Day of Year for PEO ($) |
Change in Fair Value from Last Day of Prior Year to Last Day of Year of Unvested Equity Awards for PEO ($) |
Vesting-Date Fair Value of Equity Awards Granted During Year that Vested During Year for PEO ($) |
Change in Fair Value from Last Day of Prior Year to Vesting Date of Unvested Equity Awards that Vested During Year for PEO ($) |
Fair Value at Last Day of Prior Year of Equity Awards Forfeited During Year for PEO ($) |
Total - Inclusion of Equity Values for PEO ($) |
||||||||||||||||||
2024 |
11,130,588 | 4,675,997 | — | 375,987 | — | 16,182,572 | ||||||||||||||||||
Year |
Average Year- End Fair Value of Equity Awards Granted During Year That Remained Unvested as of Last Day of Year for Non-PEO NEOs ($) |
Average Change in Fair Value from Last Day of Prior Year to Last Day of Year of Unvested Equity Awards for Non-PEO NEOs ($) |
Average Vesting-Date Fair Value of Equity Awards Granted During Year that Vested During Year for Non-PEO NEOs($) |
Average Change in Fair Value from Last Day of Prior Year to Vesting Date of Unvested Equity Awards that Vested During Year for Non- PEO NEOs ($) |
Average Fair Value at Last Day of Prior Year of Equity Awards Forfeited During Year for Non- PEO NEOs ($) |
Total - Average Inclusion of Equity Values for Non-PEO NEOs ($) |
||||||||||||||||||
2024 |
3,750,660 | 1,570,299 | — | 122,692 | — | 5,443,651 | ||||||||||||||||||
| 4. | The Peer Group total shareholder return (“TSR”) set forth in this table utilizes the peer companies used for compensation benchmarking purposes, which are summarized in our Compensation Discussion & Analysis section of the proxy statement weighted according to the respective issuer’s stock market capitalization at the beginning of the period, for the years reflected in the table above. The comparison assumes $100 was invested for the period starting December 31, 2020, through the end of the listed year in the Company and in the compensation benchmarking peers, respectively. Historical stock performance is not necessarily indicative of future stock performance. |
2024 | ||||
| Alector, Inc. | Denali Therapeutics Inc. | Prime Medicine, Inc | ||
| Arcturus Therapeutics Holdings Inc. | Dyne Therapeutics, Inc. | PTC Therapeutics, Inc. | ||
| Arrowhead Pharmaceuticals Inc | Editas Medicine, Inc. | Sangamo Therapeutics, Inc. | ||
| Avidity Biosciences Inc. | Intellia Therapeutics, Inc. | Stoke Therapeutics, Inc. | ||
| Beam Therapeutics, Inc. | Ionis Pharmaceuticals, Inc. | Verve Therapeutics, Inc. | ||
2021 |
2022 |
2023 |
2024 | |||
Michael Panzara, M.D., MPH |
Kyle Moran, CFA | Kyle Moran, CFA | Christopher Francis, Ph.D. | |||
Chandra Vargeese, Ph.D. |
Chandra Vargeese, Ph.D. | Chandra Vargeese, Ph.D. | Kyle Moran, CFA | |||
| Chandra Vargeese, Ph.D. |
Year |
Summary Compensation Table Total for PEO ($) |
Exclusion of Stock and Option Awards for PEO ($) |
Inclusion of Equity Values for PEO ($) |
Compensation Actually Paid to PEO ($) | ||||||||||||||||
2024 |
4,272,299 | (3,064,934 | ) | 16,182,572 | 17,389,937 | |||||||||||||||
Year |
Average Summary Compensation Table Total for Non-PEO NEOs ($) |
Average Exclusion of Stock and Option Awards for Non-PEO NEOs ($) |
Average Inclusion of Equity Values for Non- PEO NEOs ($) |
Average Compensation Actually Paid to Non- PEO NEOs ($) | ||||||||||||||||
2024 |
1,790,789 | (1,032,787 | ) | 5,443,651 | 6,201,653 | |||||||||||||||
The amounts in the Inclusion of Equity Values in the tables above are derived from the amounts set forth in the following tables:
Year |
Year-End Fair Value of Equity Awards Granted During Year That Remained Unvested as of Last Day of Year for PEO ($) |
Change in Fair Value from Last Day of Prior Year to Last Day of Year of Unvested Equity Awards for PEO ($) |
Vesting-Date Fair Value of Equity Awards Granted During Year that Vested During Year for PEO ($) |
Change in Fair Value from Last Day of Prior Year to Vesting Date of Unvested Equity Awards that Vested During Year for PEO ($) |
Fair Value at Last Day of Prior Year of Equity Awards Forfeited During Year for PEO ($) |
Total - Inclusion of Equity Values for PEO ($) |
||||||||||||||||||
2024 |
11,130,588 | 4,675,997 | — | 375,987 | — | 16,182,572 | ||||||||||||||||||
Year |
Average Year- End Fair Value of Equity Awards Granted During Year That Remained Unvested as of Last Day of Year for Non-PEO NEOs ($) |
Average Change in Fair Value from Last Day of Prior Year to Last Day of Year of Unvested Equity Awards for Non-PEO NEOs ($) |
Average Vesting-Date Fair Value of Equity Awards Granted During Year that Vested During Year for Non-PEO NEOs($) |
Average Change in Fair Value from Last Day of Prior Year to Vesting Date of Unvested Equity Awards that Vested During Year for Non- PEO NEOs ($) |
Average Fair Value at Last Day of Prior Year of Equity Awards Forfeited During Year for Non- PEO NEOs ($) |
Total - Average Inclusion of Equity Values for Non-PEO NEOs ($) |
||||||||||||||||||
2024 |
3,750,660 | 1,570,299 | — | 122,692 | — | 5,443,651 | ||||||||||||||||||
Year |
Summary Compensation Table Total for PEO ($) |
Exclusion of Stock and Option Awards for PEO ($) |
Inclusion of Equity Values for PEO ($) |
Compensation Actually Paid to PEO ($) | ||||||||||||||||
2024 |
4,272,299 | (3,064,934 | ) | 16,182,572 | 17,389,937 | |||||||||||||||
Year |
Average Summary Compensation Table Total for Non-PEO NEOs ($) |
Average Exclusion of Stock and Option Awards for Non-PEO NEOs ($) |
Average Inclusion of Equity Values for Non- PEO NEOs ($) |
Average Compensation Actually Paid to Non- PEO NEOs ($) | ||||||||||||||||
2024 |
1,790,789 | (1,032,787 | ) | 5,443,651 | 6,201,653 | |||||||||||||||
The amounts in the Inclusion of Equity Values in the tables above are derived from the amounts set forth in the following tables:
Year |
Year-End Fair Value of Equity Awards Granted During Year That Remained Unvested as of Last Day of Year for PEO ($) |
Change in Fair Value from Last Day of Prior Year to Last Day of Year of Unvested Equity Awards for PEO ($) |
Vesting-Date Fair Value of Equity Awards Granted During Year that Vested During Year for PEO ($) |
Change in Fair Value from Last Day of Prior Year to Vesting Date of Unvested Equity Awards that Vested During Year for PEO ($) |
Fair Value at Last Day of Prior Year of Equity Awards Forfeited During Year for PEO ($) |
Total - Inclusion of Equity Values for PEO ($) |
||||||||||||||||||
2024 |
11,130,588 | 4,675,997 | — | 375,987 | — | 16,182,572 | ||||||||||||||||||
Year |
Average Year- End Fair Value of Equity Awards Granted During Year That Remained Unvested as of Last Day of Year for Non-PEO NEOs ($) |
Average Change in Fair Value from Last Day of Prior Year to Last Day of Year of Unvested Equity Awards for Non-PEO NEOs ($) |
Average Vesting-Date Fair Value of Equity Awards Granted During Year that Vested During Year for Non-PEO NEOs($) |
Average Change in Fair Value from Last Day of Prior Year to Vesting Date of Unvested Equity Awards that Vested During Year for Non- PEO NEOs ($) |
Average Fair Value at Last Day of Prior Year of Equity Awards Forfeited During Year for Non- PEO NEOs ($) |
Total - Average Inclusion of Equity Values for Non-PEO NEOs ($) |
||||||||||||||||||
2024 |
3,750,660 | 1,570,299 | — | 122,692 | — | 5,443,651 | ||||||||||||||||||
Relationship Between PEO and
Non-PEO
NEO Compensatio
n Actually Paid and TSR The following chart sets forth the relationship between Compensation Actually Paid to our PEO, the average of Compensation Actually Paid to our
Non-PEO
NEOs, and the cumulative TSR over the four most recently completed fiscal years for the Company and the Peer Group TSR. 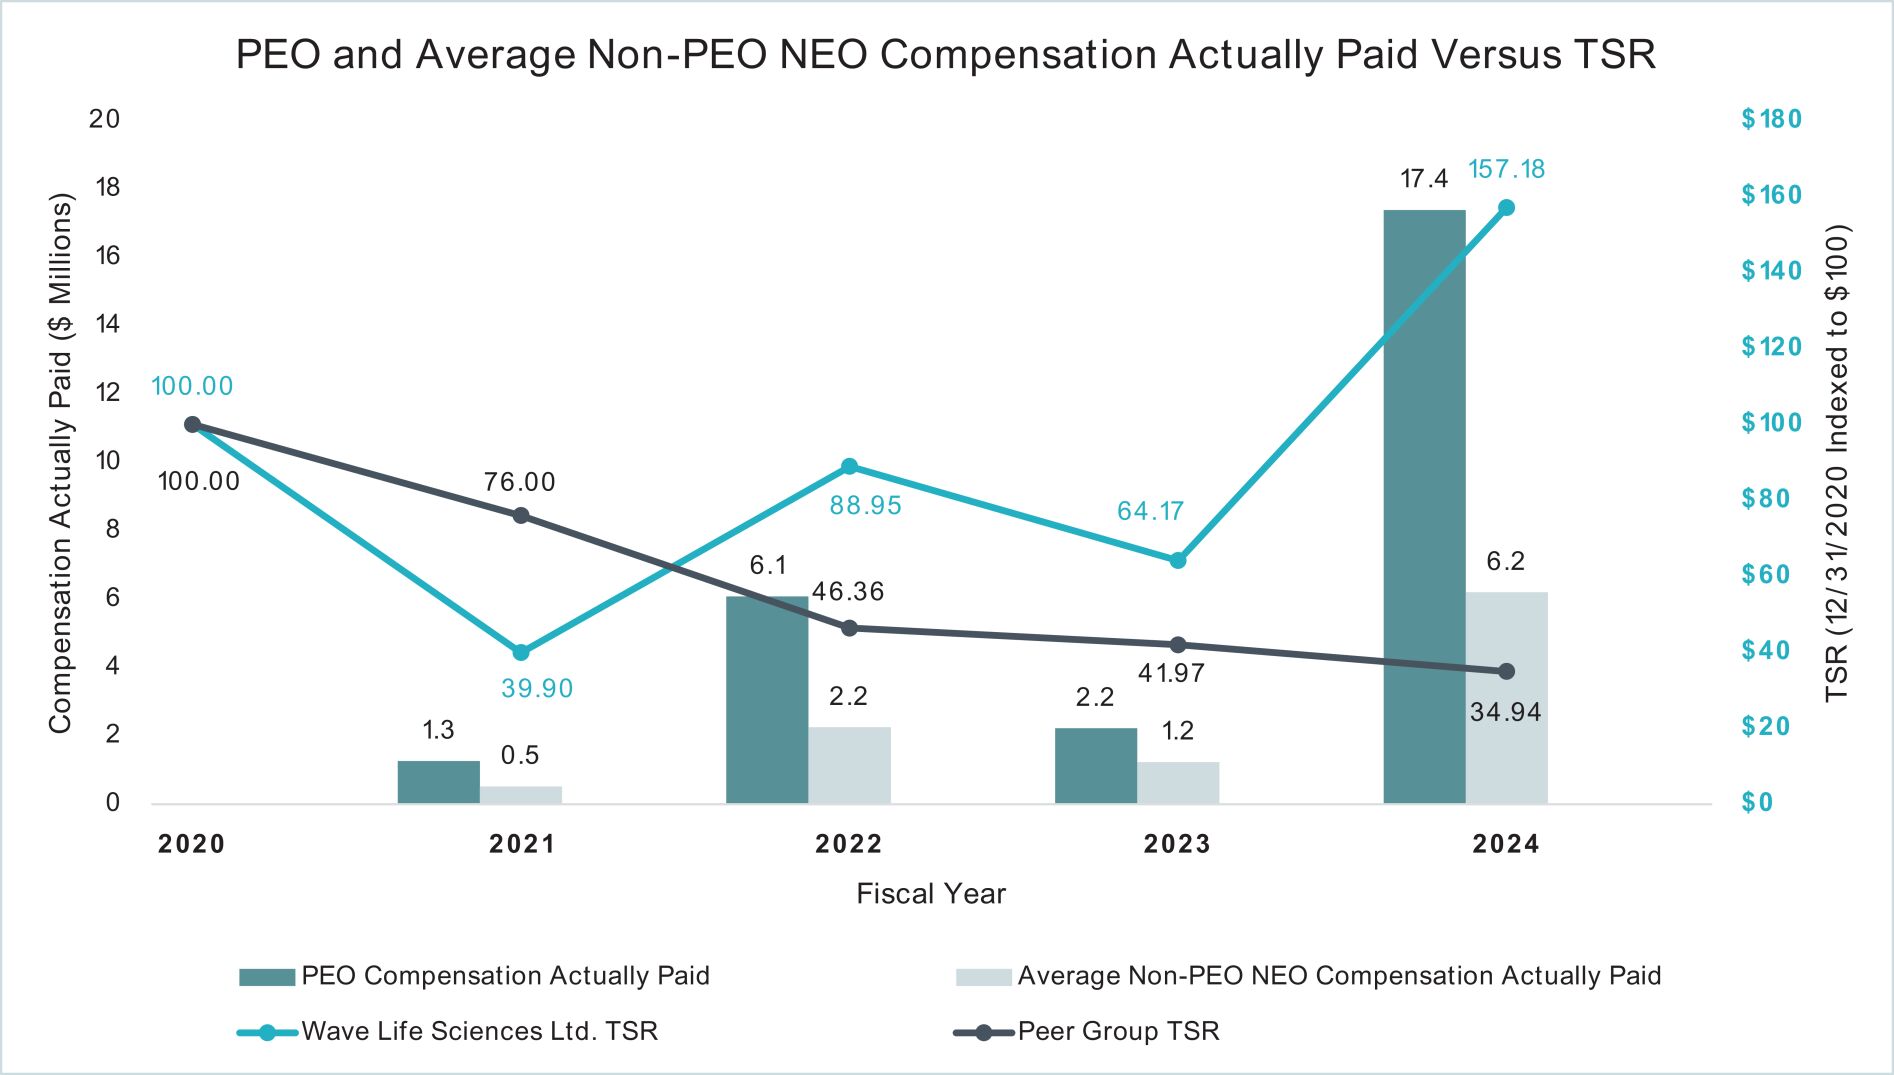
Relationship Between PEO and
Non-PEO
NEO Compensation
Actually Paid and Net Income The following chart sets forth the relationship between Compensation Actually Paid to our PEO, the average of Compensation Actually Paid to our
Non-PEO
NEOs, and our net income during the four most recently completed fiscal years. 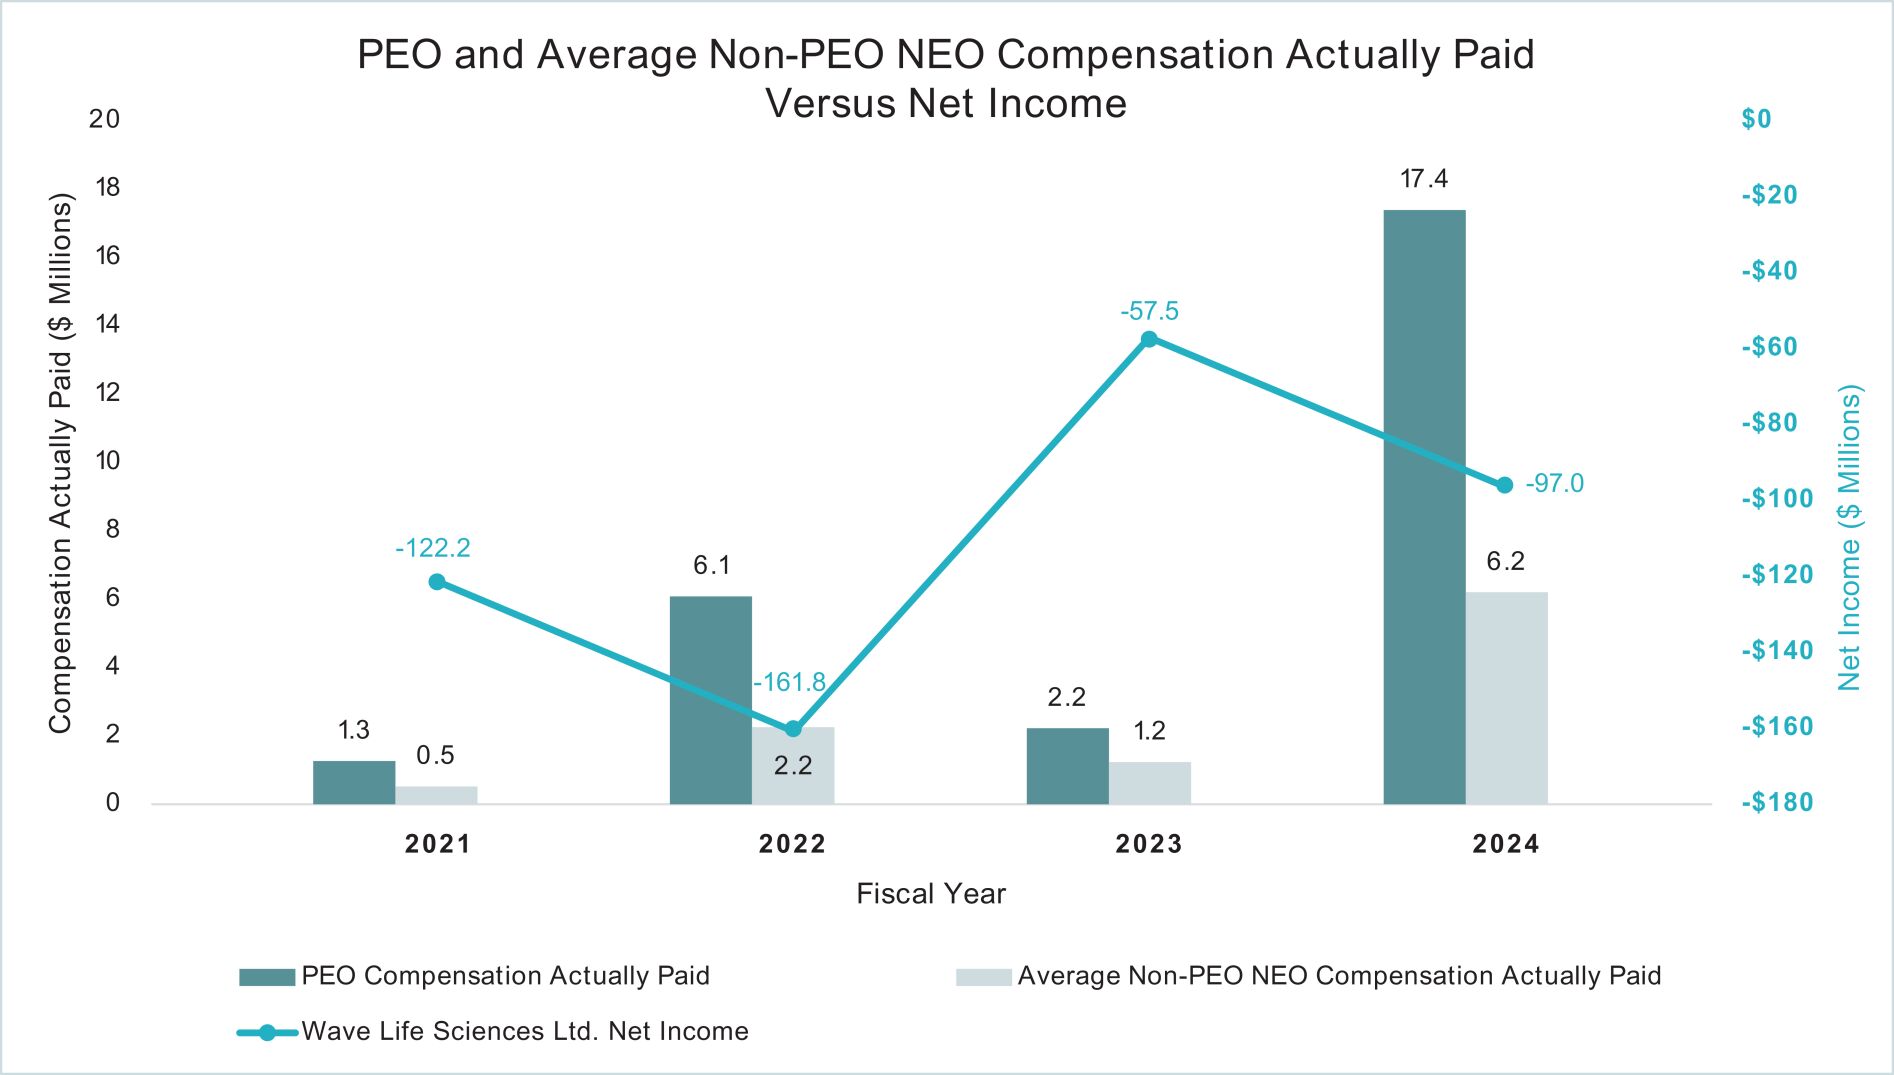
Relationship Between PEO and
Non-PEO
NEO Compensatio
n Actually Paid and TSR The following chart sets forth the relationship between Compensation Actually Paid to our PEO, the average of Compensation Actually Paid to our
Non-PEO
NEOs, and the cumulative TSR over the four most recently completed fiscal years for the Company and the Peer Group TSR.