Shareholder Report
Apr. 30, 2025
USD ($)
Holding
What were the Fund costs for the period?
(based on a hypothetical $10,000 investment)
| Fund (Class) | Costs of a $10,000 investment | Costs paid as a percentage of a $10,000 investment1 |
| International Equity (Investor Class) | $58 | 1.15% |
|
1
|
Expense ratio is expressed on an annualized basis.
|
Management’s Discussion of Fund Performance
The International Equity Investor Class (HLMNX) returned 4.59% (net of fees and expenses) in the six-month period ended April 30, 2025. The Fund's benchmark, the MSCI All Country World ex US Index, increased 5.95% (net of source taxes).
Key Performance Factors
International markets gained despite uncertainty around US tariff policy and the risk that higher tariffs pose to growth. Rising long-end yields in Europe and Japan helped Financials outperform. AI-exposed companies inside China soared after the release of Chinese AI model DeepSeek, while those outside China fell sharply. Shares of the highest-quality, fastest-growing, and most expensive companies underperformed. The Fund lagged the index due to poor relative returns in Industrials and Europe ex EMU, but benefited from strong returns in Health Care, Consumer Discretionary, and Japan.
Sector Analysis
In Industrials, Hong Kong-based Techtronic Industries’ shares declined following the announcement of the Trump administration’s tariffs. Shares of Japan’s Chugai Pharmaceutical rose after its partner Lilly announced positive Phase 3 clinical trial results for Orforglipron, its oral GLP-1 candidate drug for diabetes.
Regional Analysis
Shares of Swiss hearing aid manufacturer Sonova declined due to tariff fears; the company has significant exposure to the US market. In Japan, Sony reported strong results, boosted by growth in its gaming and music divisions, and increased guidance for revenue and margins.
Performance
| 🡱 Top Contributors | 🡳 Top Detractors | |
| Sony | Disco Corp | |
| BBVA | Delta Electronics | |
| Allianz | Schneider Electric | |
| Chugai Pharmaceutical | Techtronic Industries | |
| Infineon Technologies | Haier Smart Home |
The securities shown do not represent all holdings, and it should not be assumed that investment in these securities has been or will be profitable. The following is available upon request: (1) information describing the methodology of the contribution data and (2) a list showing the weight and relative contribution of all holdings during the period. Contribution is the contribution to overall performance over the period.
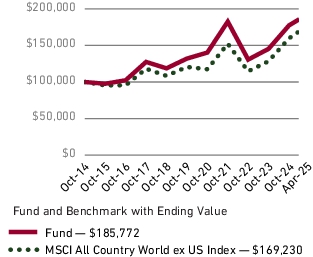
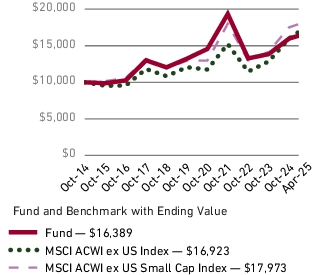
Fund Performance
The following graph and chart compare the beginning and ending account values for the most recently completed 10 fiscal years of the Fund. It compares a $10,000 initial investment in the Fund with an investment in an appropriate, broad-based securities market index.
Growth of $10,000 (USD)
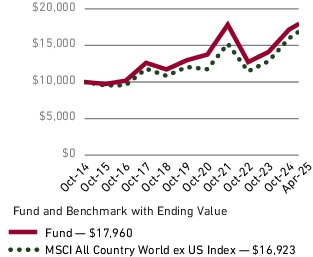
Average Annual Total Return (%)
| 1 Year | 5 Year | 10 Year | |
| Fund | 11.49 | 8.86 | 5.42 |
| MSCI All Country World ex US Index | 11.92 | 10.09 | 4.83 |
Key Fund Statistics
During Reporting Period
| Fund net assets | $12,199.5M | Total advisory fees paid (after waiver/reimbursement) |
$41.2M |
| Total number of holdings | 58 | Period portfolio turnover rate | 7% |
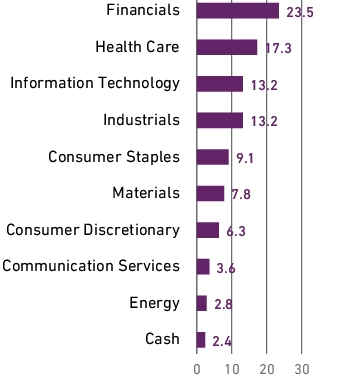
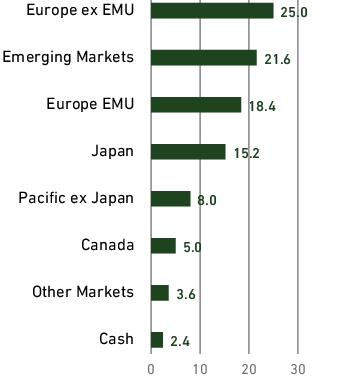
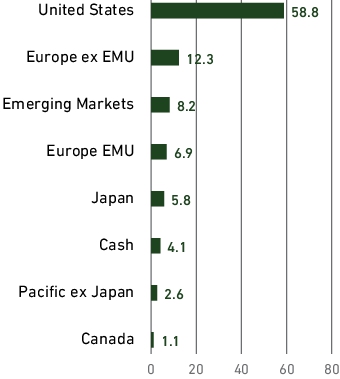
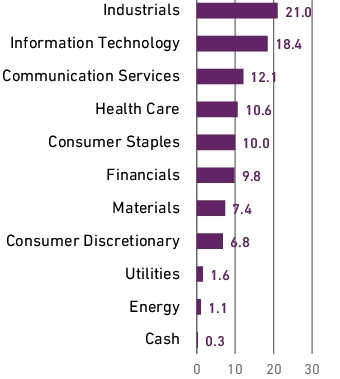
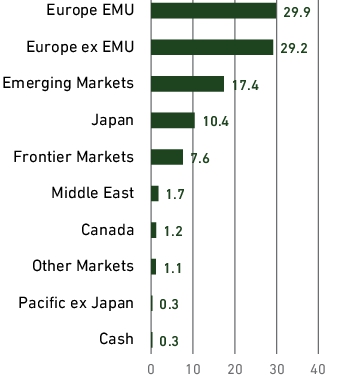
Graphical Representation of Holdings
The table and charts below show the investment makeup of the Fund; percentages indicated and graphical representations are based on the Fund’s net asset value.
Top Ten Holdings
%
Allocation
| Allianz SE, Reg S | 3.8 |
| Chugai Pharmaceutical Co., Ltd. | 3.7 |
| DBS Group Holdings Ltd. | 3.6 |
| HDFC Bank Ltd. - ADR | 3.5 |
| Sony Group Corp. | 3.1 |
| Taiwan Semiconductor Manufacturing Co., Ltd. - Sponsored ADR | 3.0 |
| Haleon plc | 2.9 |
| Manulife Financial Corp. | 2.8 |
| Shell plc | 2.8 |
| Roche Holding AG, Genusschein | 2.7 |
by Sector

by Region

Top Ten Holdings
%
| Allianz SE, Reg S | 3.8 |
| Chugai Pharmaceutical Co., Ltd. | 3.7 |
| DBS Group Holdings Ltd. | 3.6 |
| HDFC Bank Ltd. - ADR | 3.5 |
| Sony Group Corp. | 3.1 |
| Taiwan Semiconductor Manufacturing Co., Ltd. - Sponsored ADR | 3.0 |
| Haleon plc | 2.9 |
| Manulife Financial Corp. | 2.8 |
| Shell plc | 2.8 |
| Roche Holding AG, Genusschein | 2.7 |
Changes in and Disagreements with Accountants
Effective January 31, 2025, KPMG LLP ("KPMG") was dismissed as the independent registered public accounting firm of the Fund. There were no disagreements with KPMG on any matter of accounting principles or practices, financial statement disclosure, or auditing scope or procedures during the two most recent fiscal years and the subsequent interim period through January 31, 2025. PricewaterhouseCoopers LLP has been appointed as the Fund's independent registered public accounting firm for the fiscal year ending October 31, 2025.
What were the Fund costs for the period?
(based on a hypothetical $10,000 investment)
| Fund (Class) | Costs of a $10,000 investment | Costs paid as a percentage of a $10,000 investment1 |
| International Equity (Institutional Class Z) | $37 | 0.73% |
|
1
|
Expense ratio is expressed on an annualized basis.
|
Management’s Discussion of Fund Performance
The International Equity Institutional Class Z (HLIZX) returned 4.80% (net of fees and expenses) in the six-month period ended April 30, 2025. The Fund's benchmark, the MSCI All Country World ex US Index, increased 5.95% (net of source taxes).
Key Performance Factors
International markets gained despite uncertainty around US tariff policy and the risk that higher tariffs pose to growth. Rising long-end yields in Europe and Japan helped Financials outperform. AI-exposed companies inside China soared after the release of Chinese AI model DeepSeek, while those outside China fell sharply. Shares of the highest-quality, fastest-growing, and most expensive companies underperformed. The Fund lagged the index due to poor relative returns in Industrials and Europe ex EMU, but benefited from strong returns in Health Care, Consumer Discretionary, and Japan.
Sector Analysis
In Industrials, Hong Kong-based Techtronic Industries’ shares declined following the announcement of the Trump administration’s tariffs. Shares of Japan’s Chugai Pharmaceutical rose after its partner Lilly announced positive Phase 3 clinical trial results for Orforglipron, its oral GLP-1 candidate drug for diabetes.
Regional Analysis
Shares of Swiss hearing aid manufacturer Sonova declined due to tariff fears; the company has significant exposure to the US market. In Japan, Sony reported strong results, boosted by growth in its gaming and music divisions, and increased guidance for revenue and margins.
Performance
| 🡱 Top Contributors | 🡳 Top Detractors | |
| Sony | Disco Corp | |
| BBVA | Delta Electronics | |
| Allianz | Schneider Electric | |
| Chugai Pharmaceutical | Techtronic Industries | |
| Infineon Technologies | Haier Smart Home |
The securities shown do not represent all holdings, and it should not be assumed that investment in these securities has been or will be profitable. The following is available upon request: (1) information describing the methodology of the contribution data and (2) a list showing the weight and relative contribution of all holdings during the period. Contribution is the contribution to overall performance over the period.
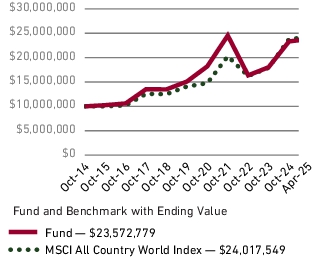
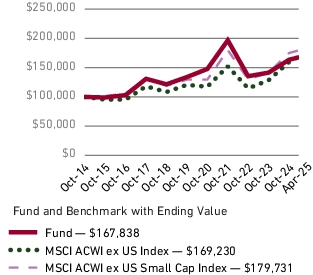
Fund Performance
The following graph and chart compare the beginning and ending account values for the most recently completed 10 fiscal years of the Fund. It compares a $10,000,000 initial investment in the Fund with an investment in an appropriate, broad-based securities market index.
Growth of $10,000,000 (USD)
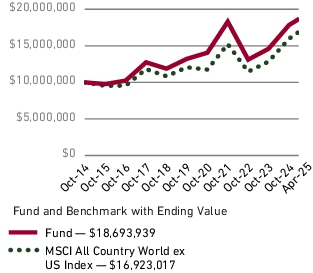
Average Annual Total Return (%)
| 1 Year | 5 Year | 10 Year | |
| Fund | 11.97 | 9.30 | 5.84 |
| MSCI All Country World ex US Index | 11.92 | 10.09 | 4.83 |
Key Fund Statistics
During Reporting Period
| Fund net assets | $12,199.5M | Total advisory fees paid (after waiver/reimbursement) |
$41.2M |
| Total number of holdings | 58 | Period portfolio turnover rate | 7% |
Graphical Representation of Holdings
The table and charts below show the investment makeup of the Fund; percentages indicated and graphical representations are based on the Fund’s net asset value.
Top Ten Holdings
%
Allocation
| Allianz SE, Reg S | 3.8 |
| Chugai Pharmaceutical Co., Ltd. | 3.7 |
| DBS Group Holdings Ltd. | 3.6 |
| HDFC Bank Ltd. - ADR | 3.5 |
| Sony Group Corp. | 3.1 |
| Taiwan Semiconductor Manufacturing Co., Ltd. - Sponsored ADR | 3.0 |
| Haleon plc | 2.9 |
| Manulife Financial Corp. | 2.8 |
| Shell plc | 2.8 |
| Roche Holding AG, Genusschein | 2.7 |
by Sector
by Region
Top Ten Holdings
%
| Allianz SE, Reg S | 3.8 |
| Chugai Pharmaceutical Co., Ltd. | 3.7 |
| DBS Group Holdings Ltd. | 3.6 |
| HDFC Bank Ltd. - ADR | 3.5 |
| Sony Group Corp. | 3.1 |
| Taiwan Semiconductor Manufacturing Co., Ltd. - Sponsored ADR | 3.0 |
| Haleon plc | 2.9 |
| Manulife Financial Corp. | 2.8 |
| Shell plc | 2.8 |
| Roche Holding AG, Genusschein | 2.7 |
Changes in and Disagreements with Accountants
Effective January 31, 2025, KPMG LLP ("KPMG") was dismissed as the independent registered public accounting firm of the Fund. There were no disagreements with KPMG on any matter of accounting principles or practices, financial statement disclosure, or auditing scope or procedures during the two most recent fiscal years and the subsequent interim period through January 31, 2025. PricewaterhouseCoopers LLP has been appointed as the Fund's independent registered public accounting firm for the fiscal year ending October 31, 2025.
What were the Fund costs for the period?
(based on a hypothetical $10,000 investment)
| Fund (Class) | Costs of a $10,000 investment | Costs paid as a percentage of a $10,000 investment1 |
| International Equity (Institutional Class) | $42 | 0.83% |
|
1 |
Expense ratio is expressed on an annualized basis. |
Management’s Discussion of Fund Performance
The International Equity Institutional Class (HLMIX) returned 4.70% (net of fees and expenses) in the six-month period ended April 30, 2025. The Fund's benchmark, the MSCI All Country World ex US Index, increased 5.95% (net of source taxes).
Key Performance Factors
International markets gained despite uncertainty around US tariff policy and the risk that higher tariffs pose to growth. Rising long-end yields in Europe and Japan helped Financials outperform. AI-exposed companies inside China soared after the release of Chinese AI model DeepSeek, while those outside China fell sharply. Shares of the highest-quality, fastest-growing, and most expensive companies underperformed. The Fund lagged the index due to poor relative returns in Industrials and Europe ex EMU, but benefited from strong returns in Health Care, Consumer Discretionary, and Japan.
Sector Analysis
In Industrials, Hong Kong-based Techtronic Industries’ shares declined following the announcement of the Trump administration’s tariffs. Shares of Japan’s Chugai Pharmaceutical rose after its partner Lilly announced positive Phase 3 clinical trial results for Orforglipron, its oral GLP-1 candidate drug for diabetes.
Regional Analysis
Shares of Swiss hearing aid manufacturer Sonova declined due to tariff fears; the company has significant exposure to the US market. In Japan, Sony reported strong results, boosted by growth in its gaming and music divisions, and increased guidance for revenue and margins.
Performance
| 🡱 Top Contributors | 🡳 Top Detractors | |
| Sony | Disco Corp | |
| BBVA | Delta Electronics | |
| Allianz | Schneider Electric | |
| Chugai Pharmaceutical | Techtronic Industries | |
| Infineon Technologies | Haier Smart Home |
The securities shown do not represent all holdings, and it should not be assumed that investment in these securities has been or will be profitable. The following is available upon request: (1) information describing the methodology of the contribution data and (2) a list showing the weight and relative contribution of all holdings during the period. Contribution is the contribution to overall performance over the period.
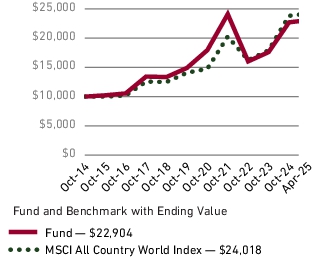
Fund Performance
The following graph and chart compare the beginning and ending account values for the most recently completed 10 fiscal years of the Fund. It compares a $100,000 initial investment in the Fund with an investment in an appropriate, broad-based securities market index.
Growth of $100,000 (USD)
Average Annual Total Return (%)
| 1 Year | 5 Year | 10 Year | |
| Fund | 11.82 | 9.20 | 5.76 |
| MSCI All Country World ex US Index | 11.92 | 10.09 | 4.83 |
Key Fund Statistics
During Reporting Period
| Fund net assets | $12,199.5M | Total advisory fees paid (after waiver/reimbursement) |
$41.2M |
| Total number of holdings | 58 | Period portfolio turnover rate | 7% |
Graphical Representation of Holdings
The table and charts below show the investment makeup of the Fund; percentages indicated and graphical representations are based on the Fund’s net asset value.
Top Ten Holdings
%
Allocation
| Allianz SE, Reg S | 3.8 |
| Chugai Pharmaceutical Co., Ltd. | 3.7 |
| DBS Group Holdings Ltd. | 3.6 |
| HDFC Bank Ltd. - ADR | 3.5 |
| Sony Group Corp. | 3.1 |
| Taiwan Semiconductor Manufacturing Co., Ltd. - Sponsored ADR | 3.0 |
| Haleon plc | 2.9 |
| Manulife Financial Corp. | 2.8 |
| Shell plc | 2.8 |
| Roche Holding AG, Genusschein | 2.7 |
by Sector

by Region

Top Ten Holdings
%
| Allianz SE, Reg S | 3.8 |
| Chugai Pharmaceutical Co., Ltd. | 3.7 |
| DBS Group Holdings Ltd. | 3.6 |
| HDFC Bank Ltd. - ADR | 3.5 |
| Sony Group Corp. | 3.1 |
| Taiwan Semiconductor Manufacturing Co., Ltd. - Sponsored ADR | 3.0 |
| Haleon plc | 2.9 |
| Manulife Financial Corp. | 2.8 |
| Shell plc | 2.8 |
| Roche Holding AG, Genusschein | 2.7 |
Changes in and Disagreements with Accountants
Effective January 31, 2025, KPMG LLP ("KPMG") was dismissed as the independent registered public accounting firm of the Fund. There were no disagreements with KPMG on any matter of accounting principles or practices, financial statement disclosure, or auditing scope or procedures during the two most recent fiscal years and the subsequent interim period through January 31, 2025. PricewaterhouseCoopers LLP has been appointed as the Fund's independent registered public accounting firm for the fiscal year ending October 31, 2025.
What were the Fund costs for the period?
(based on a hypothetical $10,000 investment)
| Fund (Class) | Costs of a $10,000 investment | Costs paid as a percentage of a $10,000 investment1 |
| Global Equity (Institutional Class Z) | $37 | 0.75% |
|
1
|
Expense ratio is expressed on an annualized basis.
|
Management’s Discussion of Fund Performance
The Global Equity Institutional Class Z (HLGZX) increased 1.08% (net of fees and expenses) in the six-month period ended April 30, 2025. The Fund's benchmark, the MSCI All Country World Index, increased 0.88% (net of source taxes).
Key Performance Factors
Donald Trump’s victory in the presidential election initially boosted US equities, as investors looked forward to business-friendly policies, while international markets took a more cautious view of the new administration. In April, the US government’s announcement of high tariffs on all trading partners (especially China) sent markets tumbling, though they recovered somewhat when it became clear US policymakers were open to negotiation.
Sector performance was mixed; Financials and Consumer Staples rose strongly while Information Technology, Energy, and Materials fell. The Fund outperformed the index, with good relative returns in Communication Services and Consumer Discretionary. Lagging returns in Industrials and an underweight in Financials detracted.
Sector Analysis
In Communication Services, shares of streaming business Netflix soared in response to strong subscriber growth. Japanese electronics and media company Sony outperformed in Consumer Discretionary, boosted by growth in its gaming and music divisions.
Regional Analysis
Signs of faltering enthusiasm for artificial intelligence (AI) investments hurt French energy equipment producer Schneider Electric, which provides power and cooling technology used in advanced AI server systems. The company also underwent a leadership transition. The Fund’s underweight in AI-chip producer NVIDIA in the US was helpful.
Performance
| 🡱 Top Contributors | 🡳 Top Detractors | |
| Netflix | UnitedHealth Group | |
| Sony | Globant | |
| NVIDIA | Thermo Fisher Scientific | |
| CME Group | Schneider Electric | |
| Chugai Pharmaceutical | Accenture |
The securities shown do not represent all holdings, and it should not be assumed that investment in these securities has been or will be profitable. The following is available upon request: (1) information describing the methodology of the contribution data and (2) a list showing the weight and relative contribution of all holdings during the period. Contribution is the contribution to overall performance over the period.
Fund Performance
The following graph and chart compare the beginning and ending account values for the most recently completed 10 fiscal years of the Fund. It compares a $10,000,000 initial investment in the Fund with an investment in an appropriate, broad-based securities market index.
Growth of $10,000,000 (USD)
Average Annual Total Return (%)
| 1 Year | 5 Year | 10 Year | |
| Fund | 11.56 | 9.43 | 8.52 |
| MSCI All Country World Index | 11.84 | 13.07 | 8.63 |
Key Fund Statistics
During Reporting Period
| Fund net assets | $528.1M | Total advisory fees paid (after waiver/reimbursement) |
$1.9M |
| Total number of holdings | 61 | Period portfolio turnover rate | 11% |
Graphical Representation of Holdings
The table and charts below show the investment makeup of the Fund; percentages indicated and graphical representations are based on the Fund’s net asset value.
Top Ten Holdings
%
Allocation
| Netflix Inc. | 4.7 |
| Northern Institutional Funds - Treasury Portfolio (Premier Shares) | 4.1 |
| Microsoft Corp. | 4.0 |
| Alphabet Inc., Class A | 3.9 |
| Vertex Pharmaceuticals Inc. | 3.8 |
| Amazon.com Inc. | 3.6 |
| Schneider Electric SE | 3.2 |
| Meta Platforms Inc., Class A | 2.8 |
| CME Group Inc. | 2.7 |
| Sony Group Corp. | 2.5 |
by Sector

by Region

Top Ten Holdings
%
| Netflix Inc. | 4.7 |
| Northern Institutional Funds - Treasury Portfolio (Premier Shares) | 4.1 |
| Microsoft Corp. | 4.0 |
| Alphabet Inc., Class A | 3.9 |
| Vertex Pharmaceuticals Inc. | 3.8 |
| Amazon.com Inc. | 3.6 |
| Schneider Electric SE | 3.2 |
| Meta Platforms Inc., Class A | 2.8 |
| CME Group Inc. | 2.7 |
| Sony Group Corp. | 2.5 |
Changes in and Disagreements with Accountants
Effective January 31, 2025, KPMG LLP ("KPMG") was dismissed as the independent registered public accounting firm of the Fund. There were no disagreements with KPMG on any matter of accounting principles or practices, financial statement disclosure, or auditing scope or procedures during the two most recent fiscal years and the subsequent interim period through January 31, 2025. PricewaterhouseCoopers LLP has been appointed as the Fund's independent registered public accounting firm for the fiscal year ending October 31, 2025.
What were the Fund costs for the period?
(based on a hypothetical $10,000 investment)
| Fund (Class) | Costs of a $10,000 investment | Costs paid as a percentage of a $10,000 investment1 |
| Global Equity (Advisor Class) | $55 | 1.11% |
|
1
|
Expense ratio is expressed on an annualized basis.
|
Management’s Discussion of Fund Performance
The Global Equity Advisor Class (HLMGX) increased 0.91% (net of fees and expenses) in the six-month period ended April 30, 2025. The Fund's benchmark, the MSCI All Country World Index, increased 0.88% (net of source taxes).
Key Performance Factors
Donald Trump’s victory in the presidential election initially boosted US equities, as investors looked forward to business-friendly policies, while international markets took a more cautious view of the new administration. In April, the US government’s announcement of high tariffs on all trading partners (especially China) sent markets tumbling, though they recovered somewhat when it became clear US policymakers were open to negotiation.
Sector performance was mixed; Financials and Consumer Staples rose strongly while Information Technology, Energy, and Materials fell. The Fund performed in line with the index, with good relative returns in Communication Services and Consumer Discretionary. Lagging returns in Industrials and an underweight in Financials detracted.
Sector Analysis
In Communication Services, shares of streaming business Netflix soared in response to strong subscriber growth. Japanese electronics and media company Sony outperformed in Consumer Discretionary, boosted by growth in its gaming and music divisions.
Regional Analysis
Signs of faltering enthusiasm for artificial intelligence (AI) investments hurt French energy equipment producer Schneider Electric, which provides power and cooling technology used in advanced AI server systems. The company also underwent a leadership transition. The Fund’s underweight in AI-chip producer NVIDIA in the US was helpful.
Performance
| 🡱 Top Contributors | 🡳 Top Detractors | |
| Netflix | UnitedHealth Group | |
| Sony | Globant | |
| NVIDIA | Thermo Fisher Scientific | |
| CME Group | Schneider Electric | |
| Chugai Pharmaceutical | Accenture |
The securities shown do not represent all holdings, and it should not be assumed that investment in these securities has been or will be profitable. The following is available upon request: (1) information describing the methodology of the contribution data and (2) a list showing the weight and relative contribution of all holdings during the period. Contribution is the contribution to overall performance over the period.
Fund Performance
The following graph and chart compare the beginning and ending account values for the most recently completed 10 fiscal years of the Fund. It compares a $10,000 initial investment in the Fund with an investment in an appropriate, broad-based securities market index.
Growth of $10,000 (USD)
Average Annual Total Return (%)
| 1 Year | 5 Year | 10 Year | |
| Fund | 11.19 | 9.11 | 8.23 |
| MSCI All Country World Index | 11.84 | 13.07 | 8.63 |
Key Fund Statistics
During Reporting Period
| Fund net assets | $528.1M | Total advisory fees paid (after waiver/reimbursement) |
$1.9M |
| Total number of holdings | 61 | Period portfolio turnover rate | 11% |
Graphical Representation of Holdings
The table and charts below show the investment makeup of the Fund; percentages indicated and graphical representations are based on the Fund’s net asset value.
Top Ten Holdings
%
Allocation
| Netflix Inc. | 4.7 |
| Northern Institutional Funds - Treasury Portfolio (Premier Shares) | 4.1 |
| Microsoft Corp. | 4.0 |
| Alphabet Inc., Class A | 3.9 |
| Vertex Pharmaceuticals Inc. | 3.8 |
| Amazon.com Inc. | 3.6 |
| Schneider Electric SE | 3.2 |
| Meta Platforms Inc., Class A | 2.8 |
| CME Group Inc. | 2.7 |
| Sony Group Corp. | 2.5 |
by Sector

by Region
Top Ten Holdings
%
| Netflix Inc. | 4.7 |
| Northern Institutional Funds - Treasury Portfolio (Premier Shares) | 4.1 |
| Microsoft Corp. | 4.0 |
| Alphabet Inc., Class A | 3.9 |
| Vertex Pharmaceuticals Inc. | 3.8 |
| Amazon.com Inc. | 3.6 |
| Schneider Electric SE | 3.2 |
| Meta Platforms Inc., Class A | 2.8 |
| CME Group Inc. | 2.7 |
| Sony Group Corp. | 2.5 |
Changes in and Disagreements with Accountants
Effective January 31, 2025, KPMG LLP ("KPMG") was dismissed as the independent registered public accounting firm of the Fund. There were no disagreements with KPMG on any matter of accounting principles or practices, financial statement disclosure, or auditing scope or procedures during the two most recent fiscal years and the subsequent interim period through January 31, 2025. PricewaterhouseCoopers LLP has been appointed as the Fund's independent registered public accounting firm for the fiscal year ending October 31, 2025.
What were the Fund costs for the period?
(based on a hypothetical $10,000 investment)
| Fund (Class) | Costs of a $10,000 investment | Costs paid as a percentage of a $10,000 investment1 |
| Global Equity (Institutional Class) | $42 | 0.85% |
|
1
|
Expense ratio is expressed on an annualized basis.
|
Management’s Discussion of Fund Performance
The Global Equity Institutional Class (HLMVX) increased 1.03% (net of fees and expenses) in the six-month period ended April 30, 2025. The Fund's benchmark, the MSCI All Country World Index, increased 0.88% (net of source taxes).
Key Performance Factors
Donald Trump’s victory in the presidential election initially boosted US equities, as investors looked forward to business-friendly policies, while international markets took a more cautious view of the new administration. In April, the US government’s announcement of high tariffs on all trading partners (especially China) sent markets tumbling, though they recovered somewhat when it became clear US policymakers were open to negotiation.
Sector performance was mixed; Financials and Consumer Staples rose strongly while Information Technology, Energy, and Materials fell. The Fund outperformed the index, with good relative returns in Communication Services and Consumer Discretionary. Lagging returns in Industrials and an underweight in Financials detracted.
Sector Analysis
In Communication Services, shares of streaming business Netflix soared in response to strong subscriber growth. Japanese electronics and media company Sony outperformed in Consumer Discretionary, boosted by growth in its gaming and music divisions.
Regional Analysis
Signs of faltering enthusiasm for artificial intelligence (AI) investments hurt French energy equipment producer Schneider Electric, which provides power and cooling technology used in advanced AI server systems. The company also underwent a leadership transition. The Fund’s underweight in AI-chip producer NVIDIA in the US was helpful.
Performance
| 🡱 Top Contributors | 🡳 Top Detractors | |
| Netflix | UnitedHealth Group | |
| Sony | Globant | |
| NVIDIA | Thermo Fisher Scientific | |
| CME Group | Schneider Electric | |
| Chugai Pharmaceutical | Accenture |
The securities shown do not represent all holdings, and it should not be assumed that investment in these securities has been or will be profitable. The following is available upon request: (1) information describing the methodology of the contribution data and (2) a list showing the weight and relative contribution of all holdings during the period. Contribution is the contribution to overall performance over the period.
Fund Performance
The following graph and chart compare the beginning and ending account values for the most recently completed 10 fiscal years of the Fund. It compares a $100,000 initial investment in the Fund with an investment in an appropriate, broad-based securities market index.
Growth of $100,000 (USD)
Average Annual Total Return (%)
| 1 Year | 5 Year | 10 Year | |
| Fund | 11.47 | 9.34 | 8.47 |
| MSCI All Country World Index | 11.84 | 13.07 | 8.63 |
Key Fund Statistics
During Reporting Period
| Fund net assets | $528.1M | Total advisory fees paid (after waiver/reimbursement) |
$1.9M |
| Total number of holdings | 61 | Period portfolio turnover rate | 11% |
Graphical Representation of Holdings
The table and charts below show the investment makeup of the Fund; percentages indicated and graphical representations are based on the Fund’s net asset value.
Top Ten Holdings
%
Allocation
| Netflix Inc. | 4.7 |
| Northern Institutional Funds - Treasury Portfolio (Premier Shares) | 4.1 |
| Microsoft Corp. | 4.0 |
| Alphabet Inc., Class A | 3.9 |
| Vertex Pharmaceuticals Inc. | 3.8 |
| Amazon.com Inc. | 3.6 |
| Schneider Electric SE | 3.2 |
| Meta Platforms Inc., Class A | 2.8 |
| CME Group Inc. | 2.7 |
| Sony Group Corp. | 2.5 |
by Sector
by Region

Top Ten Holdings
%
| Netflix Inc. | 4.7 |
| Northern Institutional Funds - Treasury Portfolio (Premier Shares) | 4.1 |
| Microsoft Corp. | 4.0 |
| Alphabet Inc., Class A | 3.9 |
| Vertex Pharmaceuticals Inc. | 3.8 |
| Amazon.com Inc. | 3.6 |
| Schneider Electric SE | 3.2 |
| Meta Platforms Inc., Class A | 2.8 |
| CME Group Inc. | 2.7 |
| Sony Group Corp. | 2.5 |
Changes in and Disagreements with Accountants
Effective January 31, 2025, KPMG LLP ("KPMG") was dismissed as the independent registered public accounting firm of the Fund. There were no disagreements with KPMG on any matter of accounting principles or practices, financial statement disclosure, or auditing scope or procedures during the two most recent fiscal years and the subsequent interim period through January 31, 2025. PricewaterhouseCoopers LLP has been appointed as the Fund's independent registered public accounting firm for the fiscal year ending October 31, 2025.
What were the Fund costs for the period?
(based on a hypothetical $10,000 investment)
| Fund (Class) | Costs of a $10,000 investment | Costs paid as a percentage of a $10,000 investment1 |
| Emerging Markets (Advisor Class) | $57 | 1.15% |
|
1
|
Expense ratio is expressed on an annualized basis.
|
Management’s Discussion of Fund Performance
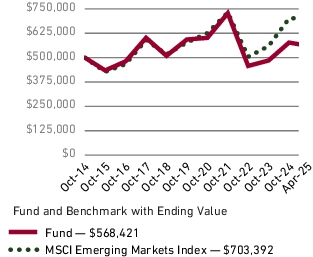
The Emerging Markets Advisor Class (HLEMX) fell 1.13% (net of fees and expenses) in the six-month period ended April 30, 2025. The Fund's benchmark, the MSCI Emerging Markets Index, rose 0.40% in the same period (net of source taxes).
Key Performance Factors
Emerging markets (EMs) rose much of the period, supported by falling interest rates and the Chinese government’s launch of a large stimulus package to reignite its economy. EMs tumbled in early April after the US government announced high tariffs on all trading partners but recovered somewhat when it became clear US policymakers were open to negotiation. Communication Services was the best sector, boosted by Chinese technology leaders in the sector. The Information Technology (IT) sector fell sharply on concerns about a slowdown in AI spending. The Fund had weak relative returns in IT while good stocks in Consumer Staples were helpful.
Sector Analysis
Shares of IT-services company Globant fell due to concerns about slowing growth in the US, its key market. In Consumer Staples, bottler Coca-Cola HBC’s earnings topped market expectations.
Regional Analysis
Shares of Taiwanese semiconductor maker Aspeed were pressured by growth concerns for its AI-server end market. In India, HDFC Bank reported accelerating loan growth and has benefited from central bank efforts to improve liquidity in India’s financial system.
| 🡱 Top Contributors | 🡳 Top Detractors | |
| TSMC | Globant | |
| Emaar Properties | Aspeed | |
| Coca-Cola HBC | Eclat Textile | |
| Sanhua Intelligent Controls | Techtronic Industries | |
| HDFC Bank | Hon Hai Precision |
The securities shown do not represent all holdings, and it should not be assumed that investment in these securities has been or will be profitable. The following is available upon request: (1) information describing the methodology of the contribution data and (2) a list showing the weight and relative contribution of all holdings during the period. Contribution is the contribution to overall performance over the period.
Fund Performance
The following graph and chart compare the beginning and ending account values for the most recently completed 10 fiscal years of the Fund. It compares a $10,000 initial investment in the Fund with an investment in an appropriate, broad-based securities market index.
Growth of $10,000 (USD)

Average Annual Total Return (%)
| 1 Year | 5 Year | 10 Year | |
| Fund | 7.89 | 2.53 | 1.23 |
| MSCI Emerging Markets Index | 9.02 | 6.35 | 3.07 |
Key Fund Statistics
During Reporting Period
| Fund net assets | $440.2M | Total advisory fees paid (after waiver/reimbursement) |
$1.9M |
| Total number of holdings | 70 | Period portfolio turnover rate | 12% |
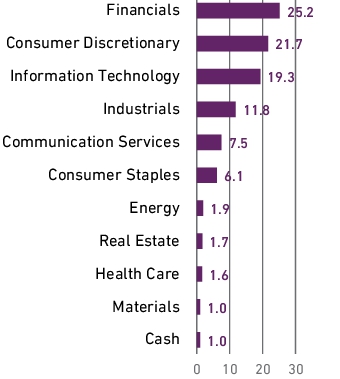
Graphical Representation of Holdings
The table and charts below show the investment makeup of the Fund; percentages indicated and graphical representations are based on the Fund’s net asset value.
Top Ten Holdings
%
Allocation
| Taiwan Semiconductor Manufacturing Co., Ltd. | 5.5 |
| Tencent Holdings Ltd. | 5.2 |
| HDFC Bank Ltd. | 5.0 |
| Alibaba Group Holding Ltd. | 3.4 |
| Samsung Electronics Co., Ltd. - GDR, Reg S | 3.3 |
| Trip.com Group Ltd. | 3.2 |
| Tata Consultancy Services Ltd. | 3.0 |
| ICICI Bank Ltd. | 2.9 |
| Maruti Suzuki India Ltd. | 2.8 |
| ASPEED Technology Inc. | 2.0 |
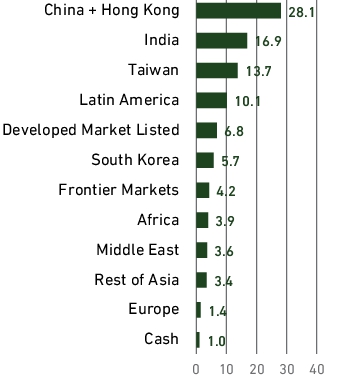
by Sector
by Region
Top Ten Holdings
%
| Taiwan Semiconductor Manufacturing Co., Ltd. | 5.5 |
| Tencent Holdings Ltd. | 5.2 |
| HDFC Bank Ltd. | 5.0 |
| Alibaba Group Holding Ltd. | 3.4 |
| Samsung Electronics Co., Ltd. - GDR, Reg S | 3.3 |
| Trip.com Group Ltd. | 3.2 |
| Tata Consultancy Services Ltd. | 3.0 |
| ICICI Bank Ltd. | 2.9 |
| Maruti Suzuki India Ltd. | 2.8 |
| ASPEED Technology Inc. | 2.0 |
Changes in and Disagreements with Accountants
Effective January 31, 2025, KPMG LLP ("KPMG") was dismissed as the independent registered public accounting firm of the Fund. There were no disagreements with KPMG on any matter of accounting principles or practices, financial statement disclosure, or auditing scope or procedures during the two most recent fiscal years and the subsequent interim period through January 31, 2025. PricewaterhouseCoopers LLP has been appointed as the Fund's independent registered public accounting firm for the fiscal year ending October 31, 2025.
What were the Fund costs for the period?
(based on a hypothetical $10,000 investment)
| Fund (Class) | Costs of a $10,000 investment | Costs paid as a percentage of a $10,000 investment1 |
| Institutional Emerging Markets (Institutional Class) | $52 | 1.06% |
|
1
|
Expense ratio is expressed on an annualized basis.
|
Management’s Discussion of Fund Performance
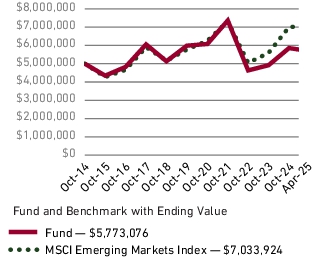
The Institutional Emerging Markets Institutional Class (HLMEX) fell 1.51% (net of fees and expenses) in the six-month period ended April 30, 2025. The Fund's benchmark, the MSCI Emerging Markets Index, rose 0.40% in the same period (net of source taxes).
Key Performance Factors
Emerging markets (EMs) rose much of the period, supported by falling interest rates and the Chinese government’s launch of a large stimulus package to reignite its economy. EMs tumbled in early April after the US government announced high tariffs on all trading partners but recovered somewhat when it became clear US policymakers were open to negotiation. Communication Services was the best sector, boosted by Chinese technology leaders in the sector. The Information Technology (IT) sector fell sharply on concerns about a slowdown in AI spending. The Fund had weak relative returns in IT while good stocks in Consumer Staples were helpful.
Sector Analysis
Shares of IT-services company Globant fell due to concerns about slowing growth in the US, its key market. In Consumer Staples, bottler Coca-Cola HBC’s earnings topped market expectations.
Regional Analysis
Shares of Taiwanese semiconductor maker Aspeed were pressured by growth concerns for its AI-server end market. In India, HDFC Bank reported accelerating loan growth and has benefited from central bank efforts to improve liquidity in India’s financial system.
Performance
| 🡱 Top Contributors | 🡳 Top Detractors | |
| Emaar Properties | Globant | |
| TSMC | Aspeed | |
| Coca-Cola HBC | Eclat Textile | |
| Sanhua Intelligent Controls | Techtronic Industries | |
| HDFC Bank | Hon Hai Precision |
The securities shown do not represent all holdings, and it should not be assumed that investment in these securities has been or will be profitable. The following is available upon request: (1) information describing the methodology of the contribution data and (2) a list showing the weight and relative contribution of all holdings during the period. Contribution is the contribution to overall performance over the period.
Fund Performance
The following graph and chart compare the beginning and ending account values for the most recently completed 10 fiscal years of the Fund. It compares a $500,000 initial investment in the Fund with an investment in an appropriate, broad-based securities market index.
Growth of $500,000 (USD)
Average Annual Total Return (%)
| 1 Year | 5 Year | 10 Year | |
| Fund | 8.34 | 2.50 | 1.29 |
| MSCI Emerging Markets Index | 9.02 | 6.35 | 3.07 |
Key Fund Statistics
During Reporting Period
| Fund net assets | $390.1M | Total advisory fees paid (after waiver/reimbursement) |
$1.8M |
| Total number of holdings | 71 | Period portfolio turnover rate | 17% |
Graphical Representation of Holdings
The table and charts below show the investment makeup of the Fund; percentages indicated and graphical representations are based on the Fund’s net asset value.
Top Ten Holdings
%
Allocation
| Taiwan Semiconductor Manufacturing Co., Ltd. | 5.5 |
| Tencent Holdings Ltd. | 5.2 |
| HDFC Bank Ltd. | 5.0 |
| Alibaba Group Holding Ltd. | 3.4 |
| Samsung Electronics Co., Ltd. - GDR, Reg S | 3.2 |
| Trip.com Group Ltd. | 3.2 |
| Tata Consultancy Services Ltd. | 2.9 |
| ICICI Bank Ltd. | 2.8 |
| Maruti Suzuki India Ltd. | 2.8 |
| ASPEED Technology Inc. | 2.0 |
by Sector
by Region

Top Ten Holdings
%
| Taiwan Semiconductor Manufacturing Co., Ltd. | 5.5 |
| Tencent Holdings Ltd. | 5.2 |
| HDFC Bank Ltd. | 5.0 |
| Alibaba Group Holding Ltd. | 3.4 |
| Samsung Electronics Co., Ltd. - GDR, Reg S | 3.2 |
| Trip.com Group Ltd. | 3.2 |
| Tata Consultancy Services Ltd. | 2.9 |
| ICICI Bank Ltd. | 2.8 |
| Maruti Suzuki India Ltd. | 2.8 |
| ASPEED Technology Inc. | 2.0 |
Changes in and Disagreements with Accountants
Effective January 31, 2025, KPMG LLP ("KPMG") was dismissed as the independent registered public accounting firm of the Fund. There were no disagreements with KPMG on any matter of accounting principles or practices, financial statement disclosure, or auditing scope or procedures during the two most recent fiscal years and the subsequent interim period through January 31, 2025. PricewaterhouseCoopers LLP has been appointed as the Fund's independent registered public accounting firm for the fiscal year ending October 31, 2025.
What were the Fund costs for the period?
(based on a hypothetical $10,000 investment)
| Fund (Class) | Costs of a $10,000 investment | Costs paid as a percentage of a $10,000 investment1 |
| Institutional Emerging Markets (Institutional Class Z) | $47 | 0.96% |
|
1
|
Expense ratio is expressed on an annualized basis.
|
Management’s Discussion of Fund Performance
The Institutional Emerging Markets Institutional Class Z (HLEZX) fell 1.42% (net of fees and expenses) in the six-month period ended April 30, 2025. The Fund's benchmark, the MSCI Emerging Markets Index, rose 0.40% in the same period (net of source taxes).
Key Performance Factors
Emerging markets (EMs) rose much of the period, supported by falling interest rates and the Chinese government’s launch of a large stimulus package to reignite its economy. EMs tumbled in early April after the US government announced high tariffs on all trading partners but recovered somewhat when it became clear US policymakers were open to negotiation. Communication Services was the best sector, boosted by Chinese technology leaders in the sector. The Information Technology (IT) sector fell sharply on concerns about a slowdown in AI spending. The Fund had weak relative returns in IT while good stocks in Consumer Staples were helpful.
Sector Analysis
Shares of IT-services company Globant fell due to concerns about slowing growth in the US, its key market. In Consumer Staples, bottler Coca-Cola HBC’s earnings topped market expectations.
Regional Analysis
Shares of Taiwanese semiconductor maker Aspeed were pressured by growth concerns for its AI-server end market. In India, HDFC Bank reported accelerating loan growth and has benefited from central bank efforts to improve liquidity in India’s financial system.
Performance
| 🡱 Top Contributors | 🡳 Top Detractors | |
| Emaar Properties | Globant | |
| TSMC | Aspeed | |
| Coca-Cola HBC | Eclat Textile | |
| Sanhua Intelligent Controls | Techtronic Industries | |
| HDFC Bank | Hon Hai Precision |
The securities shown do not represent all holdings, and it should not be assumed that investment in these securities has been or will be profitable. The following is available upon request: (1) information describing the methodology of the contribution data and (2) a list showing the weight and relative contribution of all holdings during the period. Contribution is the contribution to overall performance over the period.
Fund Performance
The following graph and chart compare the beginning and ending account values for the most recently completed 10 fiscal years of the Fund. It compares a $5,000,000 initial investment in the Fund with an investment in an appropriate, broad-based securities market index.
Growth of $5,000,000 (USD)
Average Annual Total Return (%)
| 1 Year | 5 Year | 10 Year | |
| Fund | 8.47 | 2.62 | 1.43 |
| MSCI Emerging Markets Index | 9.02 | 6.35 | 3.07 |
Key Fund Statistics
During Reporting Period
| Fund net assets | $390.1M | Total advisory fees paid (after waiver/reimbursement) |
$1.8M |
| Total number of holdings | 71 | Period portfolio turnover rate | 17% |
Graphical Representation of Holdings
The table and charts below show the investment makeup of the Fund; percentages indicated and graphical representations are based on the Fund’s net asset value.
Top Ten Holdings
%
Allocation
| Taiwan Semiconductor Manufacturing Co., Ltd. | 5.5 |
| Tencent Holdings Ltd. | 5.2 |
| HDFC Bank Ltd. | 5.0 |
| Alibaba Group Holding Ltd. | 3.4 |
| Samsung Electronics Co., Ltd. - GDR, Reg S | 3.2 |
| Trip.com Group Ltd. | 3.2 |
| Tata Consultancy Services Ltd. | 2.9 |
| ICICI Bank Ltd. | 2.8 |
| Maruti Suzuki India Ltd. | 2.8 |
| ASPEED Technology Inc. | 2.0 |
by Sector

by Region
Top Ten Holdings
%
| Taiwan Semiconductor Manufacturing Co., Ltd. | 5.5 |
| Tencent Holdings Ltd. | 5.2 |
| HDFC Bank Ltd. | 5.0 |
| Alibaba Group Holding Ltd. | 3.4 |
| Samsung Electronics Co., Ltd. - GDR, Reg S | 3.2 |
| Trip.com Group Ltd. | 3.2 |
| Tata Consultancy Services Ltd. | 2.9 |
| ICICI Bank Ltd. | 2.8 |
| Maruti Suzuki India Ltd. | 2.8 |
| ASPEED Technology Inc. | 2.0 |
Changes in and Disagreements with Accountants
Effective January 31, 2025, KPMG LLP ("KPMG") was dismissed as the independent registered public accounting firm of the Fund. There were no disagreements with KPMG on any matter of accounting principles or practices, financial statement disclosure, or auditing scope or procedures during the two most recent fiscal years and the subsequent interim period through January 31, 2025. PricewaterhouseCoopers LLP has been appointed as the Fund's independent registered public accounting firm for the fiscal year ending October 31, 2025.
What were the Fund costs for the period?
(based on a hypothetical $10,000 investment)
| Fund (Class) | Costs of a $10,000 investment | Costs paid as a percentage of a $10,000 investment1 |
| International Small Companies (Investor Class) | $66 | 1.32% |
|
1
|
Expense ratio is expressed on an annualized basis.
|
Management’s Discussion of Fund Performance
The International Small Companies Investor Class (HLMSX) rose 2.62% (net of fees and expenses) in the six-month period ended April 30, 2025. The Fund's benchmark, the MSCI ACWI ex US Small Cap Index, rose 2.66% in the same period (net of source taxes).1
Key Performance Factors
International small caps gained during the period, outperforming US small caps, as investors worried about the impact of higher tariffs on US growth and inflation. European markets rallied after German legislators approved its fiscal stimulus package. Rising long-end yields in Europe and Japan helped Financials outperform. Information Technology (IT) underperformed as the release of Chinese AI model DeepSeek rattled stocks across the tech supply chain. The Fund kept pace with the index due to strong relative returns in IT and Communication Services but was hurt by weak returns in Consumer Discretionary and Industrials.
Sector Analysis
In Communication Services, mobile network operator Airtel Africa received regulatory approval to increase rates up to 50% in Nigeria. In Consumer Discretionary, Philippine home-improvement retailer Wilcon Depot reported disappointing results due to slow demand and discounting by peers.
Regional Analysis
Yantai China Pet Foods soared after the company reported strong sales and an improvement in profit margins. German life-science products manufacturer STRATEC suffered weakening pricing power; we reduced our holding.
Performance
| 🡱 Top Contributors | 🡳 Top Detractors | |
| Airtel Africa | Wilcon Depot | |
| Yantai China Pet Foods | YouGov | |
| CyberArk | Thule Group | |
| Scout24 | Globant | |
| Bankinter | SH Kelkar |
The securities shown do not represent all holdings, and it should not be assumed that investment in these securities has been or will be profitable. The following is available upon request: (1) information describing the methodology of the contribution data and (2) a list showing the weight and relative contribution of all holdings during the period. Contribution is the contribution to overall performance over the period.
1 The Fund considers the non-broad-based index most relevant when analyzing the Fund’s performance.
Fund Performance
The following graph and chart compare the beginning and ending account values for the most recently completed 10 fiscal years of the Fund. It compares a $10,000 initial investment in the Fund with an investment in (i) an appropriate, broad-based securities market index and (ii) an additional index that reflects the market sectors in which the Fund invests.
Growth of $10,000 (USD)
Average Annual Total Return (%)
| 1 Year | 5 Year | 10 Year | |
| Fund | 6.13 | 6.76 | 4.60 |
| MSCI ACWI ex US Index* | 11.92 | 10.09 | 4.83 |
| MSCI ACWI ex US Small Cap Index* | 8.23 | 10.31 | 5.19 |
*In accordance with new regulatory requirements, the Fund has selected the MSCI ACWI ex US Index as the Fund's broad-based securities market index. The Fund has selected the MSCI ACWI ex US Small Cap Index as a secondary benchmark.
Key Fund Statistics
During Reporting Period
| Fund net assets | $301.3M | Total advisory fees paid (after waiver/reimbursement) |
$1.8M |
| Total number of holdings | 81 | Period portfolio turnover rate | 13% |
Graphical Representation of Holdings
The table and charts below show the investment makeup of the Fund; percentages indicated and graphical representations are based on the Fund’s net asset value.
Top Ten Holdings
%
Allocation
| Hoa Phat Group JSC | 2.5 |
| Siauliu Bankas AB | 2.5 |
| Reply SpA | 2.5 |
| Senior plc | 2.5 |
| Airtel Africa plc | 2.4 |
| Cranswick plc | 2.4 |
| Diploma plc | 2.3 |
| Max Financial Services Ltd. | 2.1 |
| FUCHS SE | 1.9 |
| Scout24 SE | 1.9 |
by Sector
by Region
Top Ten Holdings
%
| Hoa Phat Group JSC | 2.5 |
| Siauliu Bankas AB | 2.5 |
| Reply SpA | 2.5 |
| Senior plc | 2.5 |
| Airtel Africa plc | 2.4 |
| Cranswick plc | 2.4 |
| Diploma plc | 2.3 |
| Max Financial Services Ltd. | 2.1 |
| FUCHS SE | 1.9 |
| Scout24 SE | 1.9 |
Changes in and Disagreements with Accountants
Effective January 31, 2025, KPMG LLP ("KPMG") was dismissed as the independent registered public accounting firm of the Fund. There were no disagreements with KPMG on any matter of accounting principles or practices, financial statement disclosure, or auditing scope or procedures during the two most recent fiscal years and the subsequent interim period through January 31, 2025. PricewaterhouseCoopers LLP has been appointed as the Fund's independent registered public accounting firm for the fiscal year ending October 31, 2025.
What were the Fund costs for the period?
(based on a hypothetical $10,000 investment)
| Fund (Class) | Costs of a $10,000 investment | Costs paid as a percentage of a $10,000 investment1 |
| International Small Companies (Institutional Class) | $59 | 1.17% |
|
1
|
Expense ratio is expressed on an annualized basis.
|
Management’s Discussion of Fund Performance
The International Small Companies Institutional Class (HLMRX) rose 2.64% (net of fees and expenses) in the six-month period ended April 30, 2025. The Fund's benchmark, the MSCI ACWI ex US Small Cap Index, rose 2.66% in the same period (net of source taxes).1
Key Performance Factors
International small caps gained during the period, outperforming US small caps, as investors worried about the impact of higher tariffs on US growth and inflation. European markets rallied after German legislators approved its fiscal stimulus package. Rising long-end yields in Europe and Japan helped Financials outperform. Information Technology (IT) underperformed as the release of Chinese AI model DeepSeek rattled stocks across the tech supply chain. The Fund kept pace with the index due to strong relative returns in IT and Communication Services but was hurt by weak returns in Consumer Discretionary and Industrials.
Sector Analysis
In Communication Services, mobile network operator Airtel Africa received regulatory approval to increase rates up to 50% in Nigeria. In Consumer Discretionary, Philippine home-improvement retailer Wilcon Depot reported disappointing results due to slow demand and discounting by peers.
Regional Analysis
Yantai China Pet Foods soared after the company reported strong sales and an improvement in profit margins. German life-science products manufacturer STRATEC suffered weakening pricing power; we reduced our holding.
Performance
| 🡱 Top Contributors | 🡳 Top Detractors | |
| Airtel Africa | Wilcon Depot | |
| Yantai China Pet Foods | YouGov | |
| CyberArk | Thule Group | |
| Scout24 | Globant | |
| Bankinter | SH Kelkar |
The securities shown do not represent all holdings, and it should not be assumed that investment in these securities has been or will be profitable. The following is available upon request: (1) information describing the methodology of the contribution data and (2) a list showing the weight and relative contribution of all holdings during the period. Contribution is the contribution to overall performance over the period.
1 The Fund considers the non-broad-based index most relevant when analyzing the Fund’s performance.
Fund Performance
The following graph and chart compare the beginning and ending account values for the most recently completed 10 fiscal years of the Fund. It compares a $100,000 initial investment in the Fund with an investment in (i) an appropriate, broad-based securities market index and (ii) an additional index that reflects the market sectors in which the Fund invests.
Growth of $100,000 (USD)
Average Annual Total Return (%)
| 1 Year | 5 Year | 10 Year | |
| Fund | 6.29 | 6.98 | 4.84 |
| MSCI ACWI ex US Index* | 11.92 | 10.09 | 4.83 |
| MSCI ACWI ex US Small Cap Index* | 8.23 | 10.31 | 5.19 |
*In accordance with new regulatory requirements, the Fund has selected the MSCI ACWI ex US Index as the Fund's broad-based securities market index. The Fund has selected the MSCI ACWI ex US Small Cap Index as a secondary benchmark.
Key Fund Statistics
During Reporting Period
| Fund net assets | $301.3M | Total advisory fees paid (after waiver/reimbursement) |
$1.8M |
| Total number of holdings | 81 | Period portfolio turnover rate | 13% |
Graphical Representation of Holdings
The table and charts below show the investment makeup of the Fund; percentages indicated and graphical representations are based on the Fund’s net asset value.
Top Ten Holdings
%
Allocation
| Hoa Phat Group JSC | 2.5 |
| Siauliu Bankas AB | 2.5 |
| Reply SpA | 2.5 |
| Senior plc | 2.5 |
| Airtel Africa plc | 2.4 |
| Cranswick plc | 2.4 |
| Diploma plc | 2.3 |
| Max Financial Services Ltd. | 2.1 |
| FUCHS SE | 1.9 |
| Scout24 SE | 1.9 |
by Sector

by Region

Top Ten Holdings
%
| Hoa Phat Group JSC | 2.5 |
| Siauliu Bankas AB | 2.5 |
| Reply SpA | 2.5 |
| Senior plc | 2.5 |
| Airtel Africa plc | 2.4 |
| Cranswick plc | 2.4 |
| Diploma plc | 2.3 |
| Max Financial Services Ltd. | 2.1 |
| FUCHS SE | 1.9 |
| Scout24 SE | 1.9 |
Changes in and Disagreements with Accountants
Effective January 31, 2025, KPMG LLP ("KPMG") was dismissed as the independent registered public accounting firm of the Fund. There were no disagreements with KPMG on any matter of accounting principles or practices, financial statement disclosure, or auditing scope or procedures during the two most recent fiscal years and the subsequent interim period through January 31, 2025. PricewaterhouseCoopers LLP has been appointed as the Fund's independent registered public accounting firm for the fiscal year ending October 31, 2025.
What were the Fund costs for the period?
(based on a hypothetical $10,000 investment)
| Fund (Class) | Costs of a $10,000 investment | Costs paid as a percentage of a $10,000 investment1 |
| International Small Companies (Institutional Class Z) | $51 | 1.02% |
|
1
|
Expense ratio is expressed on an annualized basis.
|
Management’s Discussion of Fund Performance
The International Small Companies Institutional Class Z (HLRZX) rose 2.72% (net of fees and expenses) in the six-month period ended April 30, 2025. The Fund's benchmark, the MSCI ACWI ex US Small Cap Index, rose 2.66% in the same period (net of source taxes).1
Key Performance Factors
International small caps gained during the period, outperforming US small caps, as investors worried about the impact of higher tariffs on US growth and inflation. European markets rallied after German legislators approved its fiscal stimulus package. Rising long-end yields in Europe and Japan helped Financials outperform. Information Technology (IT) underperformed as the release of Chinese AI model DeepSeek rattled stocks across the tech supply chain. The Fund kept pace with the index due to strong relative returns in IT and Communication Services but was hurt by weak returns in Consumer Discretionary and Industrials.
Sector Analysis
In Communication Services, mobile network operator Airtel Africa received regulatory approval to increase rates up to 50% in Nigeria. In Consumer Discretionary, Philippine home-improvement retailer Wilcon Depot reported disappointing results due to slow demand and discounting by peers.
Regional Analysis
Yantai China Pet Foods soared after the company reported strong sales and an improvement in profit margins. German life-science products manufacturer STRATEC suffered weakening pricing power; we reduced our holding.
Performance
| 🡱 Top Contributors | 🡳 Top Detractors | |
| Airtel Africa | Wilcon Depot | |
| Yantai China Pet Foods | YouGov | |
| CyberArk | Thule Group | |
| Scout24 | Globant | |
| Bankinter | SH Kelkar |
The securities shown do not represent all holdings, and it should not be assumed that investment in these securities has been or will be profitable. The following is available upon request: (1) information describing the methodology of the contribution data and (2) a list showing the weight and relative contribution of all holdings during the period. Contribution is the contribution to overall performance over the period.
1 The Fund considers the non-broad-based index most relevant when analyzing the Fund’s performance.
Fund Performance
The following graph and chart compare the beginning and ending account values for the most recently completed 10 fiscal years of the Fund. It compares a $5,000,000 initial investment in the Fund with an investment in (i) an appropriate, broad-based securities market index and (ii) an additional index that reflects the market sectors in which the Fund invests.
Growth of $5,000,000 (USD)
Average Annual Total Return (%)
| 1 Year | 5 Year | 10 Year | |
| Fund | 6.43 | 7.06 | 4.87 |
| MSCI ACWI ex US Index* | 11.92 | 10.09 | 4.83 |
| MSCI ACWI ex US Small Cap Index* | 8.23 | 10.31 | 5.19 |
*In accordance with new regulatory requirements, the Fund has selected the MSCI ACWI ex US Index as the Fund's broad-based securities market index. The Fund has selected the MSCI ACWI ex US Small Cap Index as a secondary benchmark.
Key Fund Statistics
During Reporting Period
| Fund net assets | $301.3M | Total advisory fees paid (after waiver/reimbursement) |
$1.8M |
| Total number of holdings | 81 | Period portfolio turnover rate | 13% |
Graphical Representation of Holdings
The table and charts below show the investment makeup of the Fund; percentages indicated and graphical representations are based on the Fund’s net asset value.
Top Ten Holdings
%
Allocation
| Hoa Phat Group JSC | 2.5 |
| Siauliu Bankas AB | 2.5 |
| Reply SpA | 2.5 |
| Senior plc | 2.5 |
| Airtel Africa plc | 2.4 |
| Cranswick plc | 2.4 |
| Diploma plc | 2.3 |
| Max Financial Services Ltd. | 2.1 |
| FUCHS SE | 1.9 |
| Scout24 SE | 1.9 |
by Sector

by Region

Top Ten Holdings
%
| Hoa Phat Group JSC | 2.5 |
| Siauliu Bankas AB | 2.5 |
| Reply SpA | 2.5 |
| Senior plc | 2.5 |
| Airtel Africa plc | 2.4 |
| Cranswick plc | 2.4 |
| Diploma plc | 2.3 |
| Max Financial Services Ltd. | 2.1 |
| FUCHS SE | 1.9 |
| Scout24 SE | 1.9 |
Changes in and Disagreements with Accountants
Effective January 31, 2025, KPMG LLP ("KPMG") was dismissed as the independent registered public accounting firm of the Fund. There were no disagreements with KPMG on any matter of accounting principles or practices, financial statement disclosure, or auditing scope or procedures during the two most recent fiscal years and the subsequent interim period through January 31, 2025. PricewaterhouseCoopers LLP has been appointed as the Fund's independent registered public accounting firm for the fiscal year ending October 31, 2025.
What were the Fund costs for the period?
(based on a hypothetical $10,000 investment)
| Fund (Class) | Costs of a $10,000 investment | Costs paid as a percentage of a $10,000 investment1 |
| Frontier Emerging Markets (Institutional Class) | $72 | 1.45% |
|
1 |
Expense ratio is expressed on an annualized basis. |
Management’s Discussion of Fund Performance
The Frontier Emerging Markets Institutional Class (HLFMX) fell 0.82% (net of fees and expenses) in the six-month period ended April 30, 2025. The Fund's benchmark, the MSCI Frontier Emerging Markets Index, rose 4.21% in the same period (net of source taxes).
Key Performance Factors
Frontier emerging markets, which were relatively insulated from the US trade war, outperformed developed markets. Shares of the fastest-growing and most-expensive companies underperformed. The Fund lagged the index due to poor relative returns in Information Technology (IT) and Consumer Discretionary, but benefited from strong relative returns in Industrials, Materials, and Real Estate.
Sector Analysis
IT-services company Globant faced limits to its pricing power as clients prioritized cost savings over product development, which resulted in muted margin expansion. Industrials holding Marsa Maroc, a Moroccan port operator, won a concession to operate a second terminal at the Nador West Med port on the Mediterranean coast. The expected increase in capacity will substantially increase transshipment container throughput.
Regional Analysis
By region, Asian investments detracted the most from the Fund’s performance. Philippine home-improvement retailer Wilcon Depot reported disappointing results due to weak demand and intense discounting by peers. On the other hand, UAE-based Emaar Properties has been generating strong earnings, bolstered by sustained demand for real estate in Dubai.
Performance
| 🡱 Top Contributors | 🡳 Top Detractors | |
| Emaar Properties | Globant | |
| Marsa Maroc | Wilcon Depot | |
| Halyk Savings Bank | Agthia | |
| Airtel Africa | Alfamart | |
| Cementos Argos | FPT |
The securities shown do not represent all holdings, and it should not be assumed that investment in these securities has been or will be profitable. The following is available upon request: (1) information describing the methodology of the contribution data and (2) a list showing the weight and relative contribution of all holdings during the period. Contribution is the contribution to overall performance over the period.
Fund Performance
The following graph and chart compare the beginning and ending account values for the most recently completed 10 fiscal years of the Fund. It compares a $100,000 initial investment in the Fund with an investment in an appropriate, broad-based securities market index.
Growth of $100,000 (USD)
Average Annual Total Return (%)
| 1 Year | 5 Year | 10 Year | |
| Fund | 7.64 | 7.93 | 0.55 |
| MSCI Frontier Emerging Markets Index | 11.83 | 7.53 | 1.07 |
Key Fund Statistics
During Reporting Period
| Fund net assets | $125.4M | Total advisory fees paid (after waiver/reimbursement) |
$0.7M |
| Total number of holdings | 57 | Period portfolio turnover rate | 8% |
Graphical Representation of Holdings
The table and charts below show the investment makeup of the Fund; percentages indicated and graphical representations are based on the Fund’s net asset value.
Top Ten Holdings
Allocation
| Credicorp Ltd. | 5.0 |
| Banca Transilvania SA | 4.7 |
| Halyk Savings Bank of Kazakhstan JSC - GDR, Reg S | 4.3 |
| Societe d'Exploitation des Ports | 3.8 |
| Emaar Properties PJSC | 3.4 |
| International Container Terminal Services Inc. | 3.2 |
| Northern Institutional Funds - Treasury Portfolio (Premier Shares) | 3.2 |
| Bank for Foreign Trade of Vietnam JSC | 3.2 |
| Kaspi.KZ JSC - ADR | 3.0 |
| SM Prime Holdings Inc. | 2.9 |
by Sector

by Region

Top Ten Holdings
| Credicorp Ltd. | 5.0 |
| Banca Transilvania SA | 4.7 |
| Halyk Savings Bank of Kazakhstan JSC - GDR, Reg S | 4.3 |
| Societe d'Exploitation des Ports | 3.8 |
| Emaar Properties PJSC | 3.4 |
| International Container Terminal Services Inc. | 3.2 |
| Northern Institutional Funds - Treasury Portfolio (Premier Shares) | 3.2 |
| Bank for Foreign Trade of Vietnam JSC | 3.2 |
| Kaspi.KZ JSC - ADR | 3.0 |
| SM Prime Holdings Inc. | 2.9 |
Changes in and Disagreements with Accountants
Effective January 31, 2025, KPMG LLP ("KPMG") was dismissed as the independent registered public accounting firm of the Fund. There were no disagreements with KPMG on any matter of accounting principles or practices, financial statement disclosure, or auditing scope or procedures during the two most recent fiscal years and the subsequent interim period through January 31, 2025. PricewaterhouseCoopers LLP has been appointed as the Fund's independent registered public accounting firm for the fiscal year ending October 31, 2025.
What were the Fund costs for the period?
(based on a hypothetical $10,000 investment)
| Fund (Class) | Costs of a $10,000 investment | Costs paid as a percentage of a $10,000 investment1 |
| Frontier Emerging Markets (Institutional Class Z) | $62 | 1.25% |
|
1 |
Expense ratio is expressed on an annualized basis. |
Management’s Discussion of Fund Performance
The Frontier Emerging Markets Institutional Class Z (HLFZX) fell 0.58% (net of fees and expenses) in the six-month period ended April 30, 2025. The Fund's benchmark, the MSCI Frontier Emerging Markets Index, rose 4.21% in the same period (net of source taxes).
Key Performance Factors
Frontier emerging markets, which were relatively insulated from the US trade war, outperformed developed markets. Shares of the fastest-growing and most-expensive companies underperformed. The Fund lagged the index due to poor relative returns in Information Technology (IT) and Consumer Discretionary, but benefited from strong relative returns in Industrials, Materials, and Real Estate.
Sector Analysis
IT-services company Globant faced limits to its pricing power as clients prioritized cost savings over product development, which resulted in muted margin expansion. Industrials holding Marsa Maroc, a Moroccan port operator, won a concession to operate a second terminal at the Nador West Med port on the Mediterranean coast. The expected increase in capacity will substantially increase transshipment container throughput.
Regional Analysis
By region, Asian investments detracted the most from the Fund’s performance. Philippine home-improvement retailer Wilcon Depot reported disappointing results due to weak demand and intense discounting by peers. On the other hand, UAE-based Emaar Properties has been generating strong earnings, bolstered by sustained demand for real estate in Dubai.
Performance
| 🡱 Top Contributors | 🡳 Top Detractors | |
| Emaar Properties | Globant | |
| Marsa Maroc | Wilcon Depot | |
| Halyk Savings Bank | Agthia | |
| Airtel Africa | Alfamart | |
| Cementos Argos | FPT |
The securities shown do not represent all holdings, and it should not be assumed that investment in these securities has been or will be profitable. The following is available upon request: (1) information describing the methodology of the contribution data and (2) a list showing the weight and relative contribution of all holdings during the period. Contribution is the contribution to overall performance over the period.
Fund Performance
The following graph and chart compare the beginning and ending account values for the most recently completed 10 fiscal years of the Fund. It compares a $2,500,000 initial investment in the Fund with an investment in an appropriate, broad-based securities market index.
Growth of $2,500,000 (USD)
Average Annual Total Return (%)
| 1 Year | 5 Year | 10 Year | |
| Fund | 7.93 | 8.29 | 0.78 |
| MSCI Frontier Emerging Markets Index | 11.83 | 7.53 | 1.07 |
Key Fund Statistics
During Reporting Period
| Fund net assets | $125.4M | Total advisory fees paid (after waiver/reimbursement) |
$0.7M |
| Total number of holdings | 57 | Period portfolio turnover rate | 8% |
Graphical Representation of Holdings
The table and charts below show the investment makeup of the Fund; percentages indicated and graphical representations are based on the Fund’s net asset value.
Top Ten Holdings
%
Allocation
| Credicorp Ltd. | 5.0 |
| Banca Transilvania SA | 4.7 |
| Halyk Savings Bank of Kazakhstan JSC - GDR, Reg S | 4.3 |
| Societe d'Exploitation des Ports | 3.8 |
| Emaar Properties PJSC | 3.4 |
| International Container Terminal Services Inc. | 3.2 |
| Northern Institutional Funds - Treasury Portfolio (Premier Shares) | 3.2 |
| Bank for Foreign Trade of Vietnam JSC | 3.2 |
| Kaspi.KZ JSC - ADR | 3.0 |
| SM Prime Holdings Inc. | 2.9 |
by Sector
by Region

Top Ten Holdings
%
| Credicorp Ltd. | 5.0 |
| Banca Transilvania SA | 4.7 |
| Halyk Savings Bank of Kazakhstan JSC - GDR, Reg S | 4.3 |
| Societe d'Exploitation des Ports | 3.8 |
| Emaar Properties PJSC | 3.4 |
| International Container Terminal Services Inc. | 3.2 |
| Northern Institutional Funds - Treasury Portfolio (Premier Shares) | 3.2 |
| Bank for Foreign Trade of Vietnam JSC | 3.2 |
| Kaspi.KZ JSC - ADR | 3.0 |
| SM Prime Holdings Inc. | 2.9 |
Changes in and Disagreements with Accountants
Effective January 31, 2025, KPMG LLP ("KPMG") was dismissed as the independent registered public accounting firm of the Fund. There were no disagreements with KPMG on any matter of accounting principles or practices, financial statement disclosure, or auditing scope or procedures during the two most recent fiscal years and the subsequent interim period through January 31, 2025. PricewaterhouseCoopers LLP has been appointed as the Fund's independent registered public accounting firm for the fiscal year ending October 31, 2025.
What were the Fund costs for the period?
(based on a hypothetical $10,000 investment)
| Fund (Class) | Costs of a $10,000 investment | Costs paid as a percentage of a $10,000 investment1 |
| Frontier Emerging Markets (Investor Class) | $86 | 1.75% |
|
1 |
Expense ratio is expressed on an annualized basis. |
Management’s Discussion of Fund Performance
The Frontier Emerging Markets Investor Class (HLMOX) fell 0.96% (net of fees and expenses) in the six-month period ended April 30, 2025. The Fund's benchmark, the MSCI Frontier Emerging Markets Index, rose 4.21% in the same period (net of source taxes).
Key Performance Factors
Frontier emerging markets, which were relatively insulated from the US trade war, outperformed developed markets. Shares of the fastest-growing and most-expensive companies underperformed. The Fund lagged the index due to poor relative returns in Information Technology (IT) and Consumer Discretionary, but benefited from strong relative returns in Industrials, Materials, and Real Estate.
Sector Analysis
IT-services company Globant faced limits to its pricing power as clients prioritized cost savings over product development, which resulted in muted margin expansion. Industrials holding Marsa Maroc, a Moroccan port operator, won a concession to operate a second terminal at the Nador West Med port on the Mediterranean coast. The expected increase in capacity will substantially increase transshipment container throughput.
Regional Analysis
By region, Asian investments detracted the most from the Fund’s performance. Philippine home-improvement retailer Wilcon Depot reported disappointing results due to weak demand and intense discounting by peers. On the other hand, UAE-based Emaar Properties has been generating strong earnings, bolstered by sustained demand for real estate in Dubai.
Performance
| 🡱 Top Contributors | 🡳 Top Detractors | |
| Emaar Properties | Globant | |
| Marsa Maroc | Wilcon Depot | |
| Halyk Savings Bank | Agthia | |
| Airtel Africa | Alfamart | |
| Cementos Argos | FPT |
The securities shown do not represent all holdings, and it should not be assumed that investment in these securities has been or will be profitable. The following is available upon request: (1) information describing the methodology of the contribution data and (2) a list showing the weight and relative contribution of all holdings during the period. Contribution is the contribution to overall performance over the period.
Fund Performance
The following graph and chart compare the beginning and ending account values for the most recently completed 10 fiscal years of the Fund. It compares a $10,000 initial investment in the Fund with an investment in an appropriate, broad-based securities market index.
Growth of $10,000 (USD)
Average Annual Total Return (%)
| 1 Year | 5 Year | 10 Year | |
| Fund | 7.25 | 7.59 | 0.19 |
| MSCI Frontier Emerging Markets Index | 11.83 | 7.53 | 1.07 |
Key Fund Statistics
During Reporting Period
| Fund net assets | $125.4M | Total advisory fees paid (after waiver/reimbursement) |
$0.7M |
| Total number of holdings | 57 | Period portfolio turnover rate | 8% |
Graphical Representation of Holdings
The table and charts below show the investment makeup of the Fund; percentages indicated and graphical representations are based on the Fund’s net asset value.
Top Ten Holdings
%
Allocation
| Credicorp Ltd. | 5.0 |
| Banca Transilvania SA | 4.7 |
| Halyk Savings Bank of Kazakhstan JSC - GDR, Reg S | 4.3 |
| Societe d'Exploitation des Ports | 3.8 |
| Emaar Properties PJSC | 3.4 |
| International Container Terminal Services Inc. | 3.2 |
| Northern Institutional Funds - Treasury Portfolio (Premier Shares) | 3.2 |
| Bank for Foreign Trade of Vietnam JSC | 3.2 |
| Kaspi.KZ JSC - ADR | 3.0 |
| SM Prime Holdings Inc. | 2.9 |
by Sector

by Region
Top Ten Holdings
%
| Credicorp Ltd. | 5.0 |
| Banca Transilvania SA | 4.7 |
| Halyk Savings Bank of Kazakhstan JSC - GDR, Reg S | 4.3 |
| Societe d'Exploitation des Ports | 3.8 |
| Emaar Properties PJSC | 3.4 |
| International Container Terminal Services Inc. | 3.2 |
| Northern Institutional Funds - Treasury Portfolio (Premier Shares) | 3.2 |
| Bank for Foreign Trade of Vietnam JSC | 3.2 |
| Kaspi.KZ JSC - ADR | 3.0 |
| SM Prime Holdings Inc. | 2.9 |
Changes in and Disagreements with Accountants
Effective January 31, 2025, KPMG LLP ("KPMG") was dismissed as the independent registered public accounting firm of the Fund. There were no disagreements with KPMG on any matter of accounting principles or practices, financial statement disclosure, or auditing scope or procedures during the two most recent fiscal years and the subsequent interim period through January 31, 2025. PricewaterhouseCoopers LLP has been appointed as the Fund's independent registered public accounting firm for the fiscal year ending October 31, 2025.
What were the Fund costs for the period?
(based on a hypothetical $10,000 investment)
| Fund (Class) | Costs of a $10,000 investment | Costs paid as a percentage of a $10,000 investment1 |
| Emerging Markets ex China (Institutional Class) | $52 | 1.05% |
|
1 |
Expense ratio is expressed on an annualized basis. |
Management’s Discussion of Fund Performance
The Emerging Markets ex China Institutional Class (HLXCX) fell 2.11% (net of fees and expenses) in the six-month period ended April 30, 2025. The Fund's benchmark, the MSCI Emerging Markets ex China Index, fell 2.43% in the same period (net of source taxes).
Key Performance Factors
Emerging markets excluding China fell, with Taiwan and South Korea hurt by waning excitement for artificial intelligence (AI)-related businesses. Emerging European markets were buoyed by Germany’s stimulus plans. The South African market continued the rise, bolstered by the stability of its new coalition government. Information Technology (IT) shares fell sharply while Communications Services and Real Estate outperformed. The Fund modestly outperformed due to good stocks in Consumer Discretionary and Real Estate. Lagging returns in IT and Health Care detracted.
Sector Analysis
Returns in Real Estate were boosted by Emaar Properties, which benefited from sustained demand for Dubai real estate. Shares of IT-services company Globant fell due to growth concerns in the US, a key market.
Regional Analysis
Coway, the leading manufacturer of air and water purifiers in South Korea, reported strong earnings growth and raised its dividend. The Fund’s underweight to Taiwanese semiconductor giant TSMC was also helpful. Bumrungrad Hospital in Thailand reported weak results due to a decline in the number of patients from abroad.
Performance
| 🡱 Top Contributors | 🡳 Top Detractors | |
| Emaar Properties | Globant | |
| Coway | Bumrungrad Hospital | |
| Coca-Cola HBC | Agthia | |
| Maruti Suzuki | Kaspi.kz | |
| MercadoLibre | Tata Consultancy Services |
The securities shown do not represent all holdings, and it should not be assumed that investment in these securities has been or will be profitable. The following is available upon request: (1) information describing the methodology of the contribution data and (2) a list showing the weight and relative contribution of all holdings during the period. Contribution is the contribution to overall performance over the period.
Fund Performance
The following graph and chart compare the beginning and ending account values for the most recently completed 10 fiscal years of the Fund. It compares a $100,000 initial investment in the Fund with an investment in an appropriate, broad-based securities market index.
Growth of $100,000 (USD)
Average Annual Total Return (%)
| 1 Year | Since Inception | |
| Fund | 2.62 | 5.30 |
| MSCI Emerging Markets ex China Index | 3.30 | 9.07 |
Key Fund Statistics
During Reporting Period
| Fund net assets | $3.4M | Total advisory fees paid (after waiver/reimbursement) |
$0.0M |
| Total number of holdings | 54 | Period portfolio turnover rate | 4% |
Graphical Representation of Holdings
The table and charts below show the investment makeup of the Fund; percentages indicated and graphical representations are based on the Fund’s net asset value.
Top Ten Holdings
%
Allocation
| Taiwan Semiconductor Manufacturing Co., Ltd. | 9.8 |
| HDFC Bank Ltd. | 5.0 |
| ICICI Bank Ltd. | 4.4 |
| Maruti Suzuki India Ltd. | 4.3 |
| Tata Consultancy Services Ltd. | 4.0 |
| Samsung Electronics Co., Ltd. - GDR, Reg S | 3.5 |
| Emaar Properties PJSC | 3.3 |
| MercadoLibre Inc. | 3.0 |
| Coway Co., Ltd. | 2.9 |
| HDFC Life Insurance Co., Ltd. | 2.5 |
by Sector
by Region
Top Ten Holdings
%
| Taiwan Semiconductor Manufacturing Co., Ltd. | 9.8 |
| HDFC Bank Ltd. | 5.0 |
| ICICI Bank Ltd. | 4.4 |
| Maruti Suzuki India Ltd. | 4.3 |
| Tata Consultancy Services Ltd. | 4.0 |
| Samsung Electronics Co., Ltd. - GDR, Reg S | 3.5 |
| Emaar Properties PJSC | 3.3 |
| MercadoLibre Inc. | 3.0 |
| Coway Co., Ltd. | 2.9 |
| HDFC Life Insurance Co., Ltd. | 2.5 |
Changes in and Disagreements with Accountants
Effective January 31, 2025, KPMG LLP ("KPMG") was dismissed as the independent registered public accounting firm of the Fund. There were no disagreements with KPMG on any matter of accounting principles or practices, financial statement disclosure, or auditing scope or procedures during the two most recent fiscal years and the subsequent interim period through January 31, 2025. PricewaterhouseCoopers LLP has been appointed as the Fund's independent registered public accounting firm for the fiscal year ending October 31, 2025.
What were the Fund costs for the period?
(based on a hypothetical $10,000 investment)
| Fund (Class) | Costs of a $10,000 investment | Costs paid as a percentage of a $10,000 investment1 |
| Chinese Equity (Institutional Class) | $57 | 1.15% |
|
1 |
Expense ratio is expressed on an annualized basis. |
Management’s Discussion of Fund Performance
The Chinese Equity Institutional Class (HLMCX) fell 0.52% (net of fees and expenses) in the six-month period ended April 30, 2025. The Fund's benchmark, the MSCI China All Shares Index, increased 3.16% (net of source taxes).
Key Performance Factors
Chinese stocks rose, buoyed by stronger government support for private enterprise, raising the prospect that the country may reverse its stagnating economic productivity and improve the quality of long-term growth. Additionally, AI-exposed companies inside China soared after the release of Chinese AI model DeepSeek. Shares of the highest-quality, and fastest-growing companies outperformed, while shares of the most-expensive companies underperformed. The Fund lagged the index due to poor relative returns in Information Technology, Consumer Discretionary, and Health Care, but benefited from strong relative returns in Industrials.
Sector Analysis
IT company Delta Electronics, which makes power-management components, declined on concerns about slowing growth outside of China in AI servers, a business where it has dominant share in power supplies. Sales at Inovance, a manufacturer of industrial-automation equipment, surged on strong sales growth in humanoid robots and electric vehicles.
Regional Analysis
Hong Kong-based Techtronic Industries’ shares declined following the announcement of the Trump administration’s tariffs. Chinese video game company NetEase reported strong year-over-year revenue growth for the fourth quarter, benefitting from the popularity of its new PC game Marvel Rivals.
Performance
| 🡱 Top Contributors | 🡳 Top Detractors | |
| Inovance | Techtronic Industries | |
| NetEase | Delta Electronics | |
| Shuanghuan Driveline | ZTO Express | |
| ENN Energy | Trip.com Group | |
| Tencent | Alibaba |
The securities shown do not represent all holdings, and it should not be assumed that investment in these securities has been or will be profitable. The following is available upon request: (1) information describing the methodology of the contribution data and (2) a list showing the weight and relative contribution of all holdings during the period. Contribution is the contribution to overall performance over the period.
Fund Performance
The following graph and chart compare the beginning and ending account values for the most recently completed 10 fiscal years of the Fund. It compares a $100,000 initial investment in the Fund with an investment in an appropriate, broad-based securities market index.
Growth of $100,000 (USD)
Average Annual Total Return (%)
| 1 Year | Since Inception | |
| Fund | 4.63 | -12.64 |
| MSCI China All Shares Index | 17.92 | -6.59 |
Key Fund Statistics
During Reporting Period
| Fund net assets | $2.8M | Total advisory fees paid (after waiver/reimbursement) |
$0.0M |
| Total number of holdings | 47 | Period portfolio turnover rate | 12% |
Graphical Representation of Holdings
The table and charts below show the investment makeup of the Fund; percentages indicated and graphical representations are based on the Fund’s net asset value.
Top Ten Holdings
Allocation
| Tencent Holdings Ltd. | 11.4 |
| Alibaba Group Holding Ltd. | 6.1 |
| AIA Group Ltd. | 3.7 |
| TravelSky Technology Ltd., Class H | 3.3 |
| Hong Kong Exchanges & Clearing Ltd. | 3.3 |
| Northern Institutional Funds - Treasury Portfolio (Premier Shares) | 3.3 |
| Airtac International Group | 3.2 |
| Delta Electronics Inc. | 3.0 |
| Trip.com Group Ltd. | 2.9 |
| Contemporary Amperex Technology Co., Ltd., Class A | 2.9 |
by Sector

by Region
Top Ten Holdings
| Tencent Holdings Ltd. | 11.4 |
| Alibaba Group Holding Ltd. | 6.1 |
| AIA Group Ltd. | 3.7 |
| TravelSky Technology Ltd., Class H | 3.3 |
| Hong Kong Exchanges & Clearing Ltd. | 3.3 |
| Northern Institutional Funds - Treasury Portfolio (Premier Shares) | 3.3 |
| Airtac International Group | 3.2 |
| Delta Electronics Inc. | 3.0 |
| Trip.com Group Ltd. | 2.9 |
| Contemporary Amperex Technology Co., Ltd., Class A | 2.9 |
Changes in and Disagreements with Accountants
Effective January 31, 2025, KPMG LLP ("KPMG") was dismissed as the independent registered public accounting firm of the Fund. There were no disagreements with KPMG on any matter of accounting principles or practices, financial statement disclosure, or auditing scope or procedures during the two most recent fiscal years and the subsequent interim period through January 31, 2025. PricewaterhouseCoopers LLP has been appointed as the Fund's independent registered public accounting firm for the fiscal year ending October 31, 2025.
What were the Fund costs for the period?
(based on a hypothetical $10,000 investment)
| Fund (Class) | Costs of a $10,000 investment | Costs paid as a percentage of a $10,000 investment1 |
| International Developed Markets Equity (Institutional Class) | $41 | 0.80% |
|
1
|
Expense ratio is expressed on an annualized basis.
|
Management’s Discussion of Fund Performance
The International Developed Markets Equity Institutional Class (HLIDX) returned 6.51% (net of fees and expenses) in the six-month period ended April 30, 2025. The Fund's benchmark, the MSCI World ex US Index, increased 8.32% (net of source taxes).
Key Performance Factors
International developed markets gained despite uncertainty around US tariff policy and the risk that higher tariffs pose to growth. Rising long-end yields in Europe and Japan helped Financials outperform. Many AI-exposed companies outside China fell sharply after the release of Chinese AI model DeepSeek. Shares of the highest-quality, fastest-growing, and most expensive companies underperformed. The Fund lagged the index due to poor relative returns in Industrials and Europe ex EMU, but benefited from strong returns in Health Care, Consumer Discretionary, and Japan.
Sector Analysis
In Industrials, Hong Kong-based Techtronic Industries’ shares declined following the announcement of the Trump administration’s tariffs. Shares of Japan’s Chugai Pharmaceutical rose after its partner Lilly announced positive Phase 3 clinical trial results for Orforglipron, its oral GLP-1 candidate drug for diabetes.
Regional Analysis
Shares of Swiss hearing aid manufacturer Sonova declined due to tariff fears; the company has significant exposure to the US market. In Japan, Sony reported strong results, boosted by growth in its gaming and music divisions, and increased guidance for revenue and margins.
Performance
| 🡱 Top Contributors | 🡳 Top Detractors | |
| Sony | Disco Corp. | |
| BBVA | Schneider Electric | |
| Allianz | Techtronic Industries | |
| Chugai Pharmaceutical | TSMC | |
| Infineon Technologies | Sonova |
The securities shown do not represent all holdings, and it should not be assumed that investment in these securities has been or will be profitable. The following is available upon request: (1) information describing the methodology of the contribution data and (2) a list showing the weight and relative contribution of all holdings during the period. Contribution is the contribution to overall performance over the period.
Fund Performance
The following graph and chart compare the beginning and ending account values for the most recently completed 10 fiscal years of the Fund. It compares a $100,000 initial investment in the Fund with an investment in (i) an appropriate, broad-based securities market index and (ii) an additional index that reflects the market sectors in which the Fund invests.
Growth of $100,000 (USD)
Average Annual Total Return (%)
| 1 Year | Since Inception |
|
| Fund | 13.80 | 16.22 |
| MSCI World ex US Index | 13.10 | 19.92 |
| MSCI EAFE Index | 12.57 | 20.52 |
Key Fund Statistics
During Reporting Period
| Fund net assets | $99.4M | Total advisory fees paid (after waiver/reimbursement) |
$0.3M |
| Total number of holdings | 46 | Period portfolio turnover rate | 8% |
Graphical Representation of Holdings
The table and charts below show the investment makeup of the Fund; percentages indicated and graphical representations are based on the Fund’s net asset value.
Top Ten Holdings
%
Allocation
| Allianz SE, Reg S | 4.8 |
| Chugai Pharmaceutical Co., Ltd. | 4.4 |
| DBS Group Holdings Ltd. | 4.3 |
| Sony Group Corp. | 3.9 |
| Haleon plc | 3.6 |
| Manulife Financial Corp. | 3.5 |
| Roche Holding AG, Genusschein | 3.5 |
| Shell plc | 3.4 |
| Northern Institutional Funds - Treasury Portfolio (Premier Shares) | 3.2 |
| Schneider Electric SE | 3.2 |
by Sector

by Region
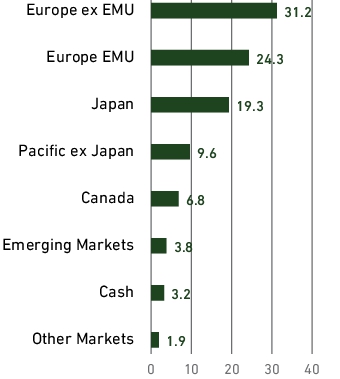
Top Ten Holdings
%
| Allianz SE, Reg S | 4.8 |
| Chugai Pharmaceutical Co., Ltd. | 4.4 |
| DBS Group Holdings Ltd. | 4.3 |
| Sony Group Corp. | 3.9 |
| Haleon plc | 3.6 |
| Manulife Financial Corp. | 3.5 |
| Roche Holding AG, Genusschein | 3.5 |
| Shell plc | 3.4 |
| Northern Institutional Funds - Treasury Portfolio (Premier Shares) | 3.2 |
| Schneider Electric SE | 3.2 |
Changes in and Disagreements with Accountants
Effective January 31, 2025, KPMG LLP ("KPMG") was dismissed as the independent registered public accounting firm of the Fund. There were no disagreements with KPMG on any matter of accounting principles or practices, financial statement disclosure, or auditing scope or procedures during the two most recent fiscal years and the subsequent interim period through January 31, 2025. PricewaterhouseCoopers LLP has been appointed as the Fund's independent registered public accounting firm for the fiscal year ending October 31, 2025.
| [1] | Expense ratio is expressed on an annualized basis. |
| [2] | Expense ratio is expressed on an annualized basis. |
| [3] | Expense ratio is expressed on an annualized basis. |
| [4] | Expense ratio is expressed on an annualized basis. |
| [5] | Expense ratio is expressed on an annualized basis. |
| [6] | Expense ratio is expressed on an annualized basis. |
| [7] | Expense ratio is expressed on an annualized basis. |
| [8] | Expense ratio is expressed on an annualized basis. |
| [9] | Expense ratio is expressed on an annualized basis. |
| [10] | Expense ratio is expressed on an annualized basis. |
| [11] | Expense ratio is expressed on an annualized basis. |
| [12] | Expense ratio is expressed on an annualized basis. |
| [13] | Expense ratio is expressed on an annualized basis. |
| [14] | Expense ratio is expressed on an annualized basis. |
| [15] | Expense ratio is expressed on an annualized basis. |
| [16] | Expense ratio is expressed on an annualized basis. |
| [17] | Expense ratio is expressed on an annualized basis. |
| [18] | Expense ratio is expressed on an annualized basis. |