Pay vs Performance Disclosure
Mar. 29, 2025
USD ($)
Mar. 30, 2024
USD ($)
Apr. 01, 2023
USD ($)
Apr. 02, 2022
USD ($)
Mar. 27, 2021
USD ($)
PAY VERSUS PERFORMANCE
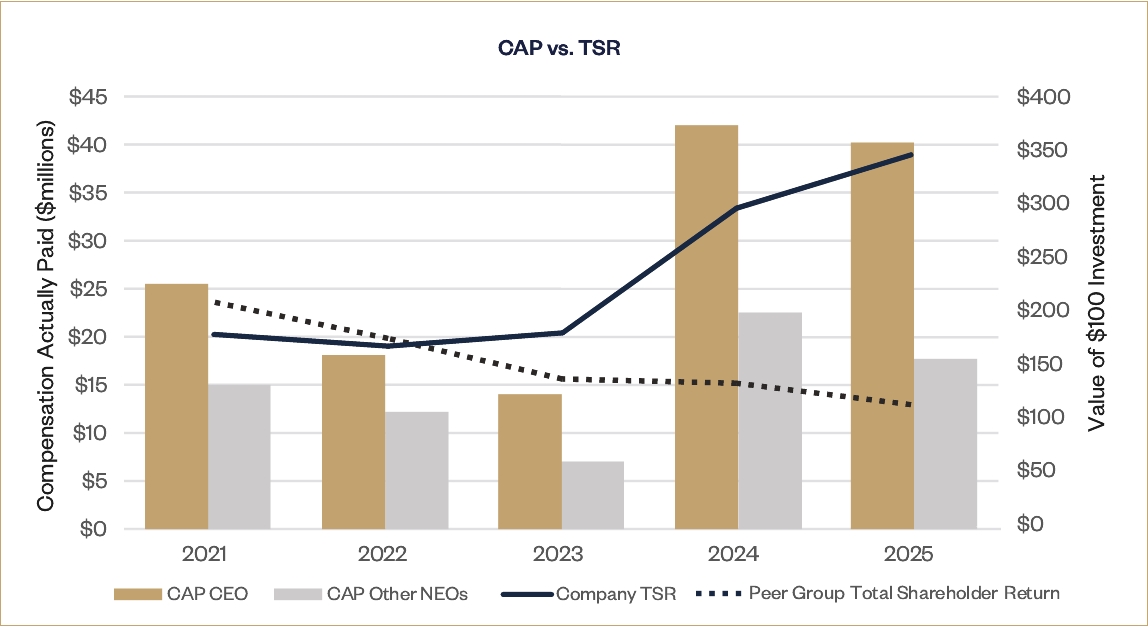
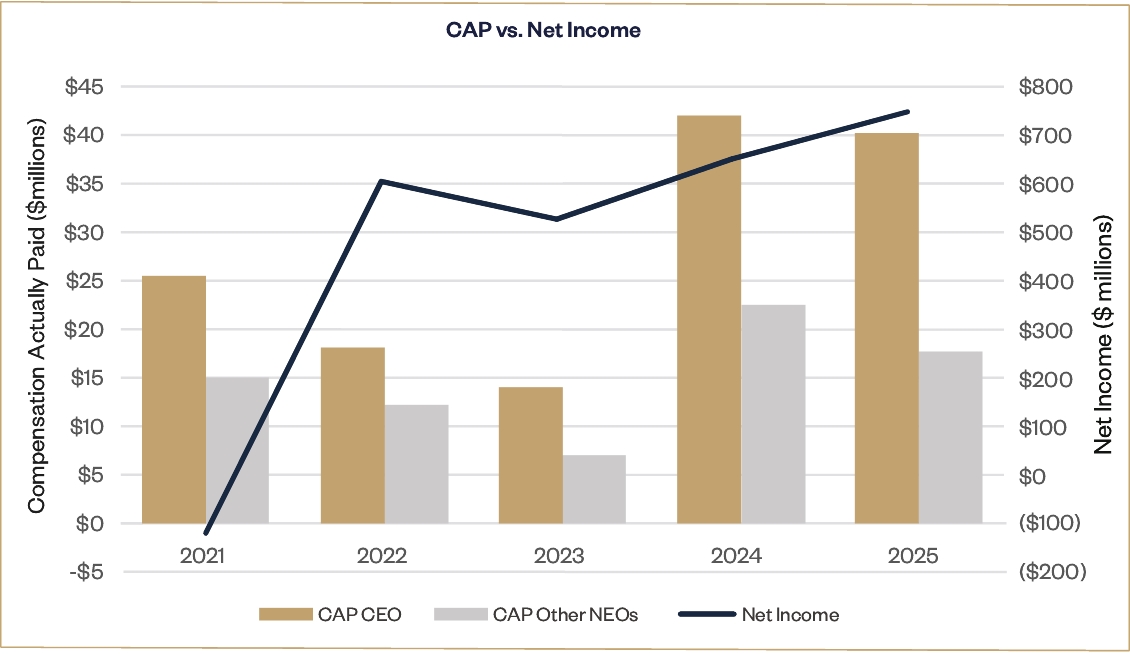
Below is information about the relationship between executive compensation actually paid to our named executive officers and our financial performance, as prepared in accordance with SEC rules. For purposes of the Peer Group Total Shareholder Return column of the Pay Versus Performance Table, we have used the S&P Composite 1500 Apparel, Accessories & Luxury Goods Index, which we also used for purposes of the Stock Performance Graph in our 2025 Annual Report on Form 10-K. For further information about how we align executive compensation with the Company’s performance, see “Compensation Discussion and Analysis” starting on page 58.
Value of Initial Fixed $100 Investment Based On: | ||||||||||||||||||||||||||
Fiscal Year (a) | Summary Compensation Table Total for CEO 1 (b) | Compensation Actually Paid to CEO2-6 (c) | Average Summary Compensation Table Total for Non-CEO NEOs1 (d) | Average Compensation Actually Paid to Non-CEO NEOs2-7 (e) | Total Shareholder Return (f) | Peer Group Total Shareholder Return8 (g) | Net Income ($ millions) (h) | Adjusted Operating Profit Margin9 (i) | ||||||||||||||||||
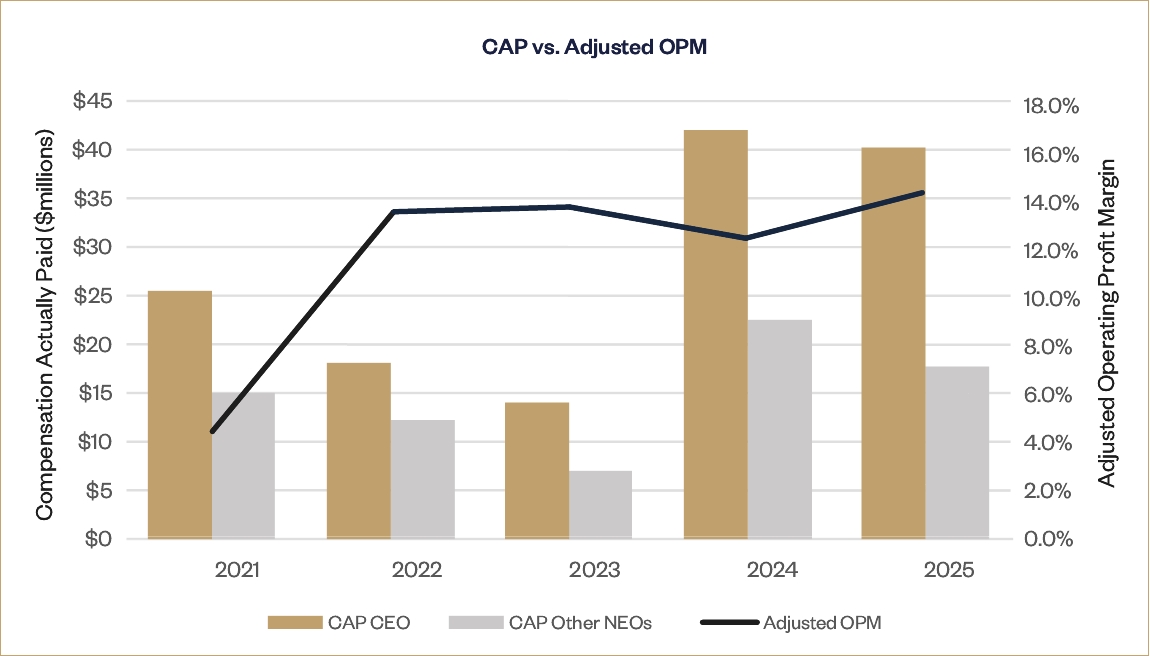
2025 | 23,079,435 | 40,207,798 | 9,648,709 | 17,701,957 | 347.92 | 113.98 | 742.9 | 14.3% | ||||||||||||||||||
2024 | 16,628,568 | 41,971,686 | 8,208,876 | 22,539,380 | 297.99 | 134.47 | 646.3 | 12.4% | ||||||||||||||||||
2023 | 14,471,356 | 14,004,639 | 7,603,556 | 7,025,927 | 181.19 | 137.62 | 522.7 | 13.7% | ||||||||||||||||||
2022 | 18,553,058 | 18,143,171 | 12,597,031 | 12,208,407 | 168.70 | 176.27 | 600.1 | 13.5% | ||||||||||||||||||
2021 | 12,063,568 | 25,475,834 | 8,621,310 | 15,031,334 | 179.67 | 209.53 | (121.11) | 4.4% | ||||||||||||||||||
1. | Mr. Louvet is the CEO for each of the years shown. The Non-CEO NEOs include Mr. R. Lauren, Ms. Nielsen, and Mr. D. Lauren for each of the years shown, Mr. Picicci for Fiscal 2025, Ms. Alagoz for Fiscal 2025, 2024 and Fiscal 2023 and Howard Smith, our Former Chief Commercial Officer, for Fiscal 2022 and Fiscal 2021. |
2. | Fair value amounts or change in fair value, as applicable, of equity awards in the Compensation Actually Paid (“CAP”) columns were determined based on applicable SEC rules with respect to previously granted service-based RSUs and PSUs. For PSUs, changes in fair value were calculated as of the end of the covered year based on the probable outcome of performance conditions, with the PSUs-TSR for Fiscal 2025, Fiscal 2024, Fiscal 2023, and Fiscal 2022 calculated pursuant to a Monte Carlo simulation, as of the last day of the applicable year. No stock options were granted or continued to vest during Fiscal 2025, Fiscal 2024, Fiscal 2023, Fiscal 2022, and Fiscal 2021. |
3. | For Fiscal 2025, the values included in the “CAP to CEO” and “Average CAP to Non-CEO NEOs” columns reflect the following adjustments from the values shown in columns (b) and (d), respectively: |
CEO | Average Non-CEO NEOs | |||||||
Total Reported in Fiscal 2025 Summary Compensation Table (“SCT”) | 23,079,435 | 9,648,709 | ||||||
Less: Value of stock awards reported in SCT | 13,541,857 | 4,485,907 | ||||||
Plus: Year-end value of stock awards granted in fiscal year that are outstanding and unvested | 20,635,005 | 6,108,979 | ||||||
Plus: Change in fair value (from prior year-end) of stock awards granted in prior years that are outstanding and unvested | 11,161,753 | 5,447,890 | ||||||
Plus: Fair value of awards granted this year and that vested this year | 0 | 1,054,140 | ||||||
Plus: Change in fair value (from prior year-end) of prior year stock awards that vested this year | (1,126,538) | (71,854) | ||||||
Less: Prior year-end fair value of stock awards granted in prior years that failed to vest this year | 0 | 0 | ||||||
Compensation Actually Paid for Fiscal 2025 | 40,207,798 | 17,701,957 | ||||||
4. | For Fiscal 2024, the values included in the “CAP to CEO” and “Average CAP to Non-CEO NEOs” columns reflect the following adjustments from the values shown in columns (b) and (d), respectively: |
CEO | Average Non-CEO NEOs | |||||||
Total Reported in Fiscal 2024 Summary Compensation Table (“SCT”) | 16,628,568 | 8,208,876 | ||||||
Less: Value of stock awards reported in SCT | 10,651,323 | 4,237,420 | ||||||
Plus: Year-end value of stock awards granted in fiscal year that are outstanding and unvested | 20,004,712 | 8,548,296 | ||||||
Plus: Change in fair value (from prior year-end) of stock awards granted in prior years that are outstanding and unvested | 15,559,587 | 9,715,837 | ||||||
Plus: Fair value of awards granted this year and that vested this year | 0 | 0 | ||||||
Plus: Change in fair value (from prior year-end) of prior year stock awards that vested this year | 430,142 | 303,791 | ||||||
Less: Prior year-end fair value of stock awards granted in prior years that failed to vest this year | 0 | 0 | ||||||
Compensation Actually Paid for Fiscal 2024 | 41,971,686 | 22,539,380 | ||||||
5. | For Fiscal 2023, the values included in the “CAP to CEO” and “Average CAP to Non-CEO NEOs” columns reflect the following adjustments from the values shown in columns (b) and (d), respectively: |
CEO | Average Non-CEO NEOs | |||||||
Total Reported in Fiscal 2023 SCT | 14,471,356 | 7,603,556 | ||||||
Less: Value of stock awards reported in SCT | 9,110,544 | 4,167,633 | ||||||
Plus: Year-end value of stock awards granted in fiscal year that are outstanding and unvested | 11,554,627 | 5,315,211 | ||||||
Plus: Change in fair value (from prior year-end) of stock awards granted in prior years that are outstanding and unvested | (1,011,216) | (1,210,642) | ||||||
Plus: Fair value of awards granted this year and that vested this year | 0 | 0 | ||||||
Plus: Change in fair value (from prior year-end) of prior year stock awards that vested this year | (1,899,585) | (514,564) | ||||||
Less: Prior year-end fair value of stock awards granted in prior years that failed to vest this year | 0 | 0 | ||||||
Compensation Actually Paid for Fiscal 2023 | 14,004,639 | 7,025,927 | ||||||
6. | For Fiscal 2022, the values included in the “CAP to CEO” and “Average CAP to Non-CEO NEOs” columns reflect the following adjustments from the values shown in columns (b) and (d), respectively: |
CEO | Average Non-CEO NEOs | |||||||
Total Reported in Fiscal 2022 SCT | 18,553,058 | 12,597,031 | ||||||
Less: Value of stock awards reported in SCT | 9,228,711 | 5,258,016 | ||||||
Plus: Year-end value of stock awards granted in fiscal year that are outstanding and unvested | 10,881,406 | 5,950,050 | ||||||
Plus: Change in fair value (from prior year-end) of stock awards granted in prior years that are outstanding and unvested | (2,116,559) | (1,082,579) | ||||||
Plus: Fair value of awards granted this year and that vested this year | 0 | 0 | ||||||
Plus: Change in fair value (from prior year-end) of prior year stock awards that vested this year | 53,977 | 1,921 | ||||||
Less: Prior year-end fair value of stock awards granted in prior years that failed to vest this year | 0 | 0 | ||||||
Compensation Actually Paid for Fiscal 2022 | 18,143,171 | 12,208,407 | ||||||
7. | For Fiscal 2021, the values included in the “CAP to CEO” and “Average CAP to Non-CEO NEOs” columns reflect the following adjustments from the values shown in columns (b) and (d), respectively: |
CEO | Average Non-CEO NEOs | |||||||
Total Reported in Fiscal 2021 SCT | 12,063,568 | 8,621,310 | ||||||
Less: Value of stock awards reported in SCT | 7,131,351 | 4,247,644 | ||||||
Plus: Year-end value of stock awards granted in fiscal year that are outstanding and unvested | 12,943,487 | 7,384,070 | ||||||
Plus: Change in fair value (from prior year-end) of stock awards granted in prior years that are outstanding and unvested | 5,826,919 | 2,725,747 | ||||||
Plus: Fair value of awards granted this year and that vested this year | 0 | 0 | ||||||
Plus: Change in fair value (from prior year-end) of prior year stock awards that vested this year | 1,773,211 | 547,851 | ||||||
Less: Prior year-end fair value of stock awards granted in prior years that failed to vest this year | 0 | 0 | ||||||
Compensation Actually Paid for Fiscal 2021 | 25,475,834 | 15,031,334 | ||||||
8. | The peer group used for this purpose is the S&P Composite 1500 Apparel, Accessories & Luxury Goods Index which is also used for purposes of the Stock Performance Graph in our 2025 Annual Report on Form 10-K. |
9. | We chose Adjusted Operating Profit Margin on a constant dollar basis as our Company Selected measure for evaluating Pay versus Performance because it is a key metric in our short-term incentive plan and in our long-term incentive plan for PSUs. Adjusted Operating Profit Margin is a non-GAAP measure. In our 2023 Proxy Statement, our Fiscal 2022 and Fiscal 2021 Adjusted Operating Profit Margin results were presented on a reported dollar basis. |
1. | Mr. Louvet is the CEO for each of the years shown. The Non-CEO NEOs include Mr. R. Lauren, Ms. Nielsen, and Mr. D. Lauren for each of the years shown, Mr. Picicci for Fiscal 2025, Ms. Alagoz for Fiscal 2025, 2024 and Fiscal 2023 and Howard Smith, our Former Chief Commercial Officer, for Fiscal 2022 and Fiscal 2021. |
8. | The peer group used for this purpose is the S&P Composite 1500 Apparel, Accessories & Luxury Goods Index which is also used for purposes of the Stock Performance Graph in our 2025 Annual Report on Form 10-K. |
3. | For Fiscal 2025, the values included in the “CAP to CEO” and “Average CAP to Non-CEO NEOs” columns reflect the following adjustments from the values shown in columns (b) and (d), respectively: |
CEO | Average Non-CEO NEOs | |||||||
Total Reported in Fiscal 2025 Summary Compensation Table (“SCT”) | 23,079,435 | 9,648,709 | ||||||
Less: Value of stock awards reported in SCT | 13,541,857 | 4,485,907 | ||||||
Plus: Year-end value of stock awards granted in fiscal year that are outstanding and unvested | 20,635,005 | 6,108,979 | ||||||
Plus: Change in fair value (from prior year-end) of stock awards granted in prior years that are outstanding and unvested | 11,161,753 | 5,447,890 | ||||||
Plus: Fair value of awards granted this year and that vested this year | 0 | 1,054,140 | ||||||
Plus: Change in fair value (from prior year-end) of prior year stock awards that vested this year | (1,126,538) | (71,854) | ||||||
Less: Prior year-end fair value of stock awards granted in prior years that failed to vest this year | 0 | 0 | ||||||
Compensation Actually Paid for Fiscal 2025 | 40,207,798 | 17,701,957 | ||||||
4. | For Fiscal 2024, the values included in the “CAP to CEO” and “Average CAP to Non-CEO NEOs” columns reflect the following adjustments from the values shown in columns (b) and (d), respectively: |
CEO | Average Non-CEO NEOs | |||||||
Total Reported in Fiscal 2024 Summary Compensation Table (“SCT”) | 16,628,568 | 8,208,876 | ||||||
Less: Value of stock awards reported in SCT | 10,651,323 | 4,237,420 | ||||||
Plus: Year-end value of stock awards granted in fiscal year that are outstanding and unvested | 20,004,712 | 8,548,296 | ||||||
Plus: Change in fair value (from prior year-end) of stock awards granted in prior years that are outstanding and unvested | 15,559,587 | 9,715,837 | ||||||
Plus: Fair value of awards granted this year and that vested this year | 0 | 0 | ||||||
Plus: Change in fair value (from prior year-end) of prior year stock awards that vested this year | 430,142 | 303,791 | ||||||
Less: Prior year-end fair value of stock awards granted in prior years that failed to vest this year | 0 | 0 | ||||||
Compensation Actually Paid for Fiscal 2024 | 41,971,686 | 22,539,380 | ||||||
5. | For Fiscal 2023, the values included in the “CAP to CEO” and “Average CAP to Non-CEO NEOs” columns reflect the following adjustments from the values shown in columns (b) and (d), respectively: |
CEO | Average Non-CEO NEOs | |||||||
Total Reported in Fiscal 2023 SCT | 14,471,356 | 7,603,556 | ||||||
Less: Value of stock awards reported in SCT | 9,110,544 | 4,167,633 | ||||||
Plus: Year-end value of stock awards granted in fiscal year that are outstanding and unvested | 11,554,627 | 5,315,211 | ||||||
Plus: Change in fair value (from prior year-end) of stock awards granted in prior years that are outstanding and unvested | (1,011,216) | (1,210,642) | ||||||
Plus: Fair value of awards granted this year and that vested this year | 0 | 0 | ||||||
Plus: Change in fair value (from prior year-end) of prior year stock awards that vested this year | (1,899,585) | (514,564) | ||||||
Less: Prior year-end fair value of stock awards granted in prior years that failed to vest this year | 0 | 0 | ||||||
Compensation Actually Paid for Fiscal 2023 | 14,004,639 | 7,025,927 | ||||||
6. | For Fiscal 2022, the values included in the “CAP to CEO” and “Average CAP to Non-CEO NEOs” columns reflect the following adjustments from the values shown in columns (b) and (d), respectively: |
CEO | Average Non-CEO NEOs | |||||||
Total Reported in Fiscal 2022 SCT | 18,553,058 | 12,597,031 | ||||||
Less: Value of stock awards reported in SCT | 9,228,711 | 5,258,016 | ||||||
Plus: Year-end value of stock awards granted in fiscal year that are outstanding and unvested | 10,881,406 | 5,950,050 | ||||||
Plus: Change in fair value (from prior year-end) of stock awards granted in prior years that are outstanding and unvested | (2,116,559) | (1,082,579) | ||||||
Plus: Fair value of awards granted this year and that vested this year | 0 | 0 | ||||||
Plus: Change in fair value (from prior year-end) of prior year stock awards that vested this year | 53,977 | 1,921 | ||||||
Less: Prior year-end fair value of stock awards granted in prior years that failed to vest this year | 0 | 0 | ||||||
Compensation Actually Paid for Fiscal 2022 | 18,143,171 | 12,208,407 | ||||||
7. | For Fiscal 2021, the values included in the “CAP to CEO” and “Average CAP to Non-CEO NEOs” columns reflect the following adjustments from the values shown in columns (b) and (d), respectively: |
CEO | Average Non-CEO NEOs | |||||||
Total Reported in Fiscal 2021 SCT | 12,063,568 | 8,621,310 | ||||||
Less: Value of stock awards reported in SCT | 7,131,351 | 4,247,644 | ||||||
Plus: Year-end value of stock awards granted in fiscal year that are outstanding and unvested | 12,943,487 | 7,384,070 | ||||||
Plus: Change in fair value (from prior year-end) of stock awards granted in prior years that are outstanding and unvested | 5,826,919 | 2,725,747 | ||||||
Plus: Fair value of awards granted this year and that vested this year | 0 | 0 | ||||||
Plus: Change in fair value (from prior year-end) of prior year stock awards that vested this year | 1,773,211 | 547,851 | ||||||
Less: Prior year-end fair value of stock awards granted in prior years that failed to vest this year | 0 | 0 | ||||||
Compensation Actually Paid for Fiscal 2021 | 25,475,834 | 15,031,334 | ||||||
Tabular List
The following tabular list sets forth those measures, which, in our assessment, represent the three financial performance measures and the one non-financial performance measure that we use to link the compensation paid to our named executive officers for Fiscal 2024 to Company performance. See “Compensation Discussion and Analysis”, beginning on page 58 for more information about how these measures impact our NEOs’ compensation.
Financial Performance Measures |
Adjusted Operating Profit Margin (“OPM”) (excludes foreign currency effects, restructuring-related charges, impairment of assets, and certain other benefits (charges)) |
Total Company Revenue (excludes foreign currency effects) |
Relative Total Shareholder Return (“TSR”) |
Non-Financial Performance Measure |
Citizenship and Sustainability scorecard |
9. | We chose Adjusted Operating Profit Margin on a constant dollar basis as our Company Selected measure for evaluating Pay versus Performance because it is a key metric in our short-term incentive plan and in our long-term incentive plan for PSUs. Adjusted Operating Profit Margin is a non-GAAP measure. In our 2023 Proxy Statement, our Fiscal 2022 and Fiscal 2021 Adjusted Operating Profit Margin results were presented on a reported dollar basis. |