| 1 |
| WELCOME REMARKS | DISCLOSURES Cameron Rudd INVESTOR RELATIONS |
| Forward-Looking Statements Forward-Looking Statements Atlanta Braves Holdings, Inc. (the “Company”) has filed with the Securities and Exchange Commission an Annual Report on Form 10-K for the year ended December 31, 2024 (the “2024 Annual Report”) and Quarterly Report on Form 10-Q for the quarter ended March 31, 2025 (the “Quarterly Report”). The Annual Report and the Quarterly Report contain extensive disclosure about the Company and its business, including selected historical financial information and risk factors that an investor should consider before deciding whether to invest in securities of the Company. Certain statements in this presentation constitute forward-looking statements within the meaning of the Private Securities Litigation Reform Act of 1995, including statements regarding business, product and marketing strategies; estimates of future revenues, expenses, and net operating income; expectations related to future partnerships and return on current investments; new service offerings; our projected sources and uses of cash and other matters arising in the ordinary course of business. The words “believe,” “estimate,” “expect,” “anticipate,” “intend,” “plan,” “strategy,” “continue,” “seek,” “may,” “could” and similar expressions or statements regarding future periods are intended to identify forward-looking statements, although not all forward-looking statements may contain such words. Forward-looking statements inherently involve many risks and uncertainties that could cause actual results to differ materially from those projected in these statements. Where, in any forward-looking statement, we express an expectation or belief as to future results or events, such expectation or belief is expressed in good faith and believed to have a reasonable basis, but such statements necessarily involve risks and uncertainties and there can be no assurance that the expectation or belief will result or be achieved or accomplished. Given these uncertainties, we caution you not to place undue reliance on these forward-looking statements. These forward-looking statements and such risks, uncertainties and other factors speak only as of the date of this presentation, and we expressly disclaim any obligation or undertaking to disseminate any updates or revisions to any forward-looking statement contained herein, to reflect any change in our expectations with regard thereto, or any other change in events, conditions or circumstances on which any such statement is based, except to the extent required by law. When considering such forward-looking statements, you should keep in mind any risk factors identified and other cautionary statements contained in this presentation and in our publicly filed documents, including under the heading “Risk Factors” in the 2024 Annual Report and the Quarterly Report, each as filed with the SEC. Such risk factors and statements describe circumstances which could cause actual results to differ materially from those contained in any forward-looking statement. Non-GAAP Financial Measures Company management believes that presenting certain non-GAAP financial measures enhances an investor’s understanding of our financial performance. Management further believes that these non-GAAP financial measures are useful in assessing the Company’s operating performance from period to period by excluding certain items that we believe are not representative of our core business. Non-GAAP measures are not a substitute for GAAP measures and should be considered together with the GAAP financial measures. As calculated, our non-GAAP measures may not be comparable to other similarly titled measures of other companies. Market Data This presentation also contains market data and other information based on industry publications, reports by market research firms or published independent sources. The Company believes that these external sources and estimates are reliable but has not independently verified them. Statements as to the Company’s market position are based on market data currently available to the Company. Although the Company is not aware of any misstatements regarding the market data and other information presented herein, these estimates involve inherent risks and uncertainties and are based on assumptions that are subject to change. Some market data and information is also based on the Company's good faith estimates, which are derived from management's knowledge of its industry and such independent sources. |
| Agenda Schedule of Events Section Speaker 1:00pm – 1:05pm Schedule of Events & Disclosure Cameron Rudd 1:05pm – 1:35pm Fireside Chat Rob Manfred & Terry McGuirk 1:35pm – 2:05pm Braves Overview Derek Schiller 2:05pm – 2:25pm Real Estate Overview Mike Plant 2:25pm – 2:40pm Financial Overview Jill Robinson 2:40pm – 3:00pm Closing Remarks and Q&A Terry, Derek, Mike & Jill |
| Fireside Chat: Major League Baseball Rob Manfred COMMISSIONER, MAJOR LEAGUE BASEBALL Terry McGuirk CHAIRMAN, PRESIDENT & CHIEF EXECUTIVE OFFICER ATLANTA BRAVES HOLDINGS |
| BRAVES OVERVIEW Derek Schiller PRESIDENT & CHIEF EXECUTIVE OFFICER ATLANTA BRAVES |
| 1. Source: US Census Data per state estimates as of 2024. 14+ Million TV households included in the region 35+ Million Total population that makes up the “Braves Country”1 29 Territories Unique media markets included in our geographic footprint We operate in one of the largest territories in all professional sports The Braves are a National Brand |

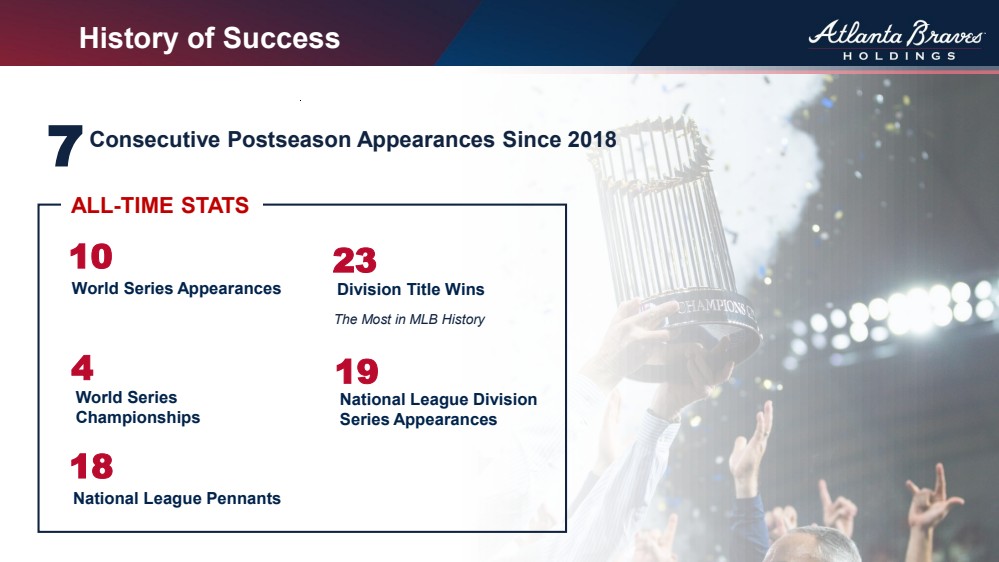
| 8 10 World Series Appearances 19 National League Division Series Appearances 4 World Series Championships 18 National League Pennants 23 Division Title Wins The Most in MLB History 7 Consecutive Postseason Appearances Since 2018 ALL-TIME STATS History of Success |
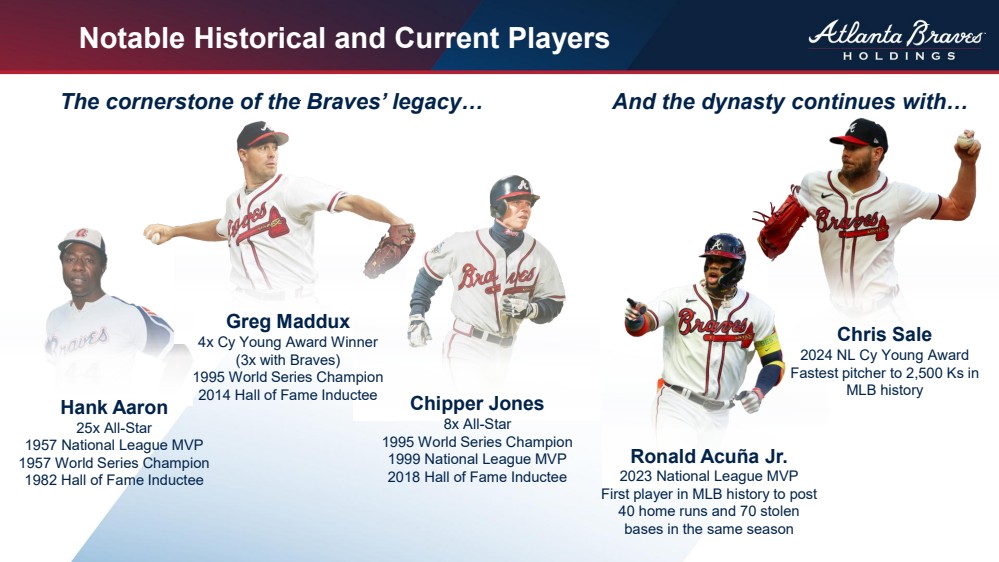
| The cornerstone of the Braves’ legacy… And the dynasty continues with… Chris Sale 2024 NL Cy Young Award Fastest pitcher to 2,500 Ks in MLB history Ronald Acuña Jr. 2023 National League MVP First player in MLB history to post 40 home runs and 70 stolen bases in the same season Greg Maddux 4x Cy Young Award Winner (3x with Braves) 1995 World Series Champion 2014 Hall of Fame Inductee Hank Aaron 25x All-Star 1957 National League MVP 1957 World Series Champion 1982 Hall of Fame Inductee Chipper Jones 8x All-Star 1995 World Series Champion 1999 National League MVP 2018 Hall of Fame Inductee Notable Historical and Current Players |
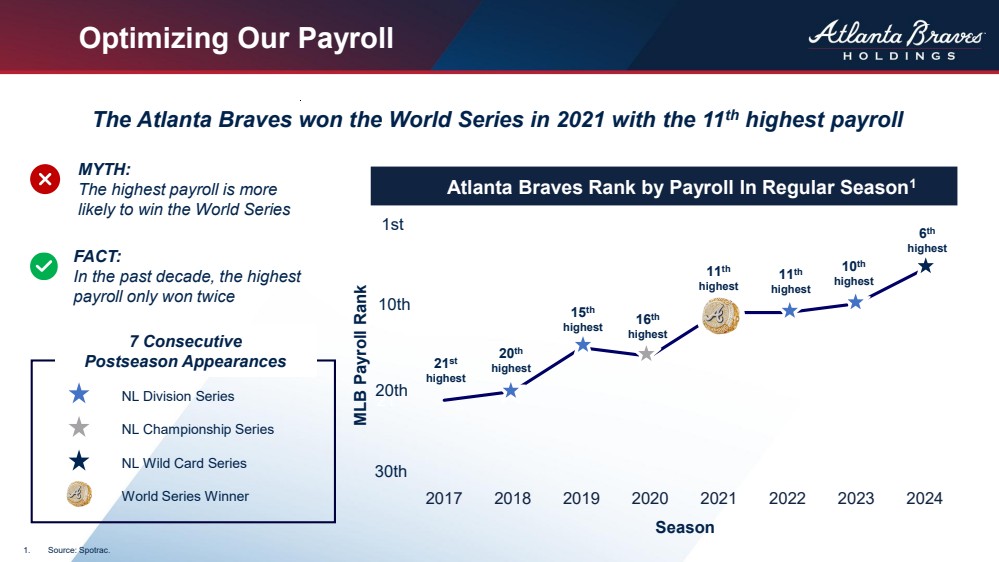
| 1 11 21 2017 2018 2019 2020 2021 2022 2023 2024 Atlanta Braves Rank by Payroll In Regular Season1 MYTH: The highest payroll is more likely to win the World Series FACT: In the past decade, the highest payroll only won twice The Atlanta Braves won the World Series in 2021 with the 11th highest payroll 7 Consecutive Postseason Appearances 11th highest 10th highest 6 th highest 20th highest 21st highest 15th highest NL Division Series NL Championship Series NL Wild Card Series World Series Winner Optimizing Our Payroll 16th highest 11th highest 1st 10th 20th 30th MLB Payroll Rank Season 1. Source: Spotrac. |
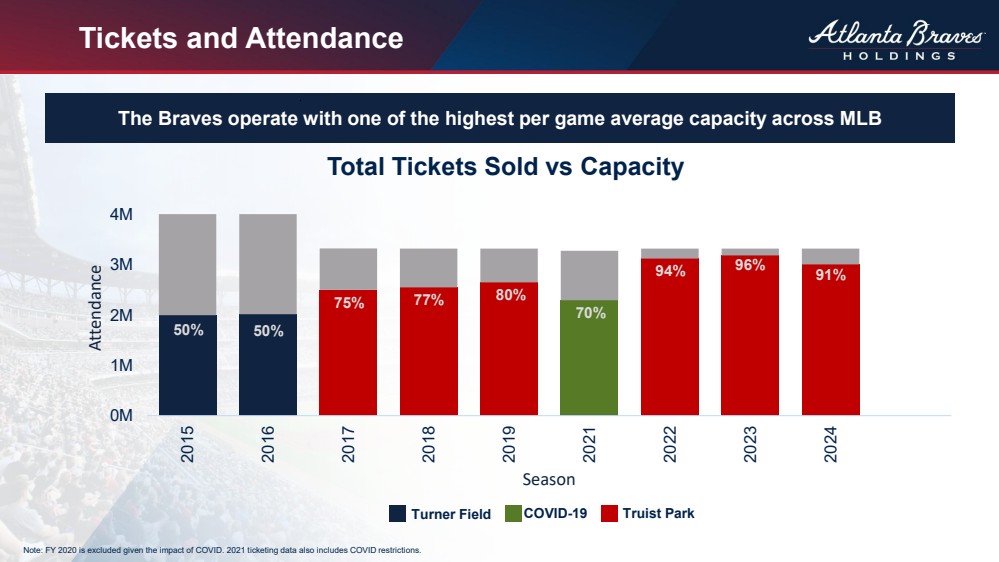
| Note: FY 2020 is excluded given the impact of COVID. 2021 ticketing data also includes COVID restrictions. Total Tickets Sold vs Capacity The Braves operate with one of the highest per game average capacity across MLB 0M 1M 2M 3M 4M 2015 2016 2017 2018 2019 2021 2022 2023 2024 Attendance Season Turner Field COVID-19 Truist Park 91% 94% 96% 70% 77% 80% 75% 50% 50% Tickets and Attendance |
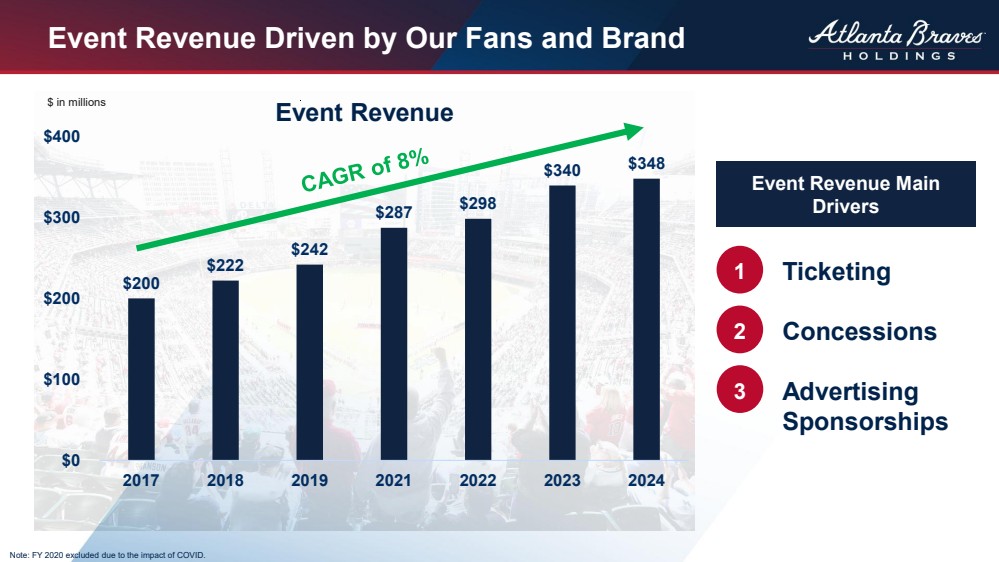
| Note: FY 2020 excluded due to the impact of COVID. $200 $222 $242 $287 $298 $340 $348 $0 $100 $200 $300 $400 2017 2018 2019 2021 2022 2023 2024 Event Revenue Event Revenue Main Drivers Ticketing Concessions Advertising Sponsorships 1 2 3 $ in millions Event Revenue Driven by Our Fans and Brand |
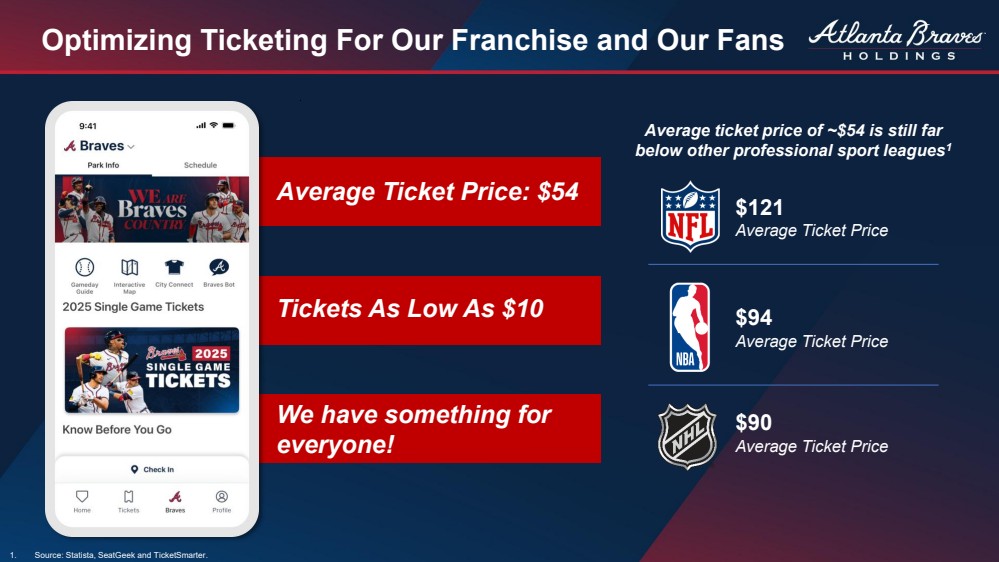
| Average Ticket Price: $54 Tickets As Low As $10 We have something for everyone! Average ticket price of ~$54 is still far below other professional sport leagues1 $121 Average Ticket Price $94 Average Ticket Price $90 Average Ticket Price Optimizing Ticketing For Our Franchise and Our Fans 1. Source: Statista, SeatGeek and TicketSmarter. |
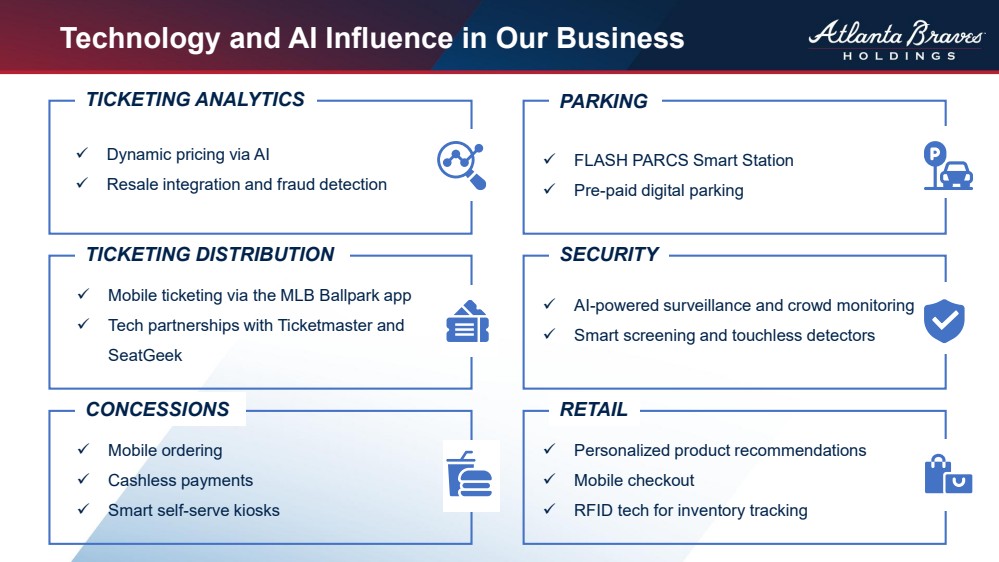
| TICKETING ANALYTICS ✓ Dynamic pricing via AI ✓ Resale integration and fraud detection TICKETING DISTRIBUTION CONCESSIONS PARKING SECURITY RETAIL ✓ Mobile ticketing via the MLB Ballpark app ✓ Tech partnerships with Ticketmaster and SeatGeek ✓ Mobile ordering ✓ Cashless payments ✓ Smart self-serve kiosks ✓ FLASH PARCS Smart Station ✓ Pre-paid digital parking ✓ AI-powered surveillance and crowd monitoring ✓ Smart screening and touchless detectors ✓ Personalized product recommendations ✓ Mobile checkout ✓ RFID tech for inventory tracking Technology and AI Influence in Our Business |
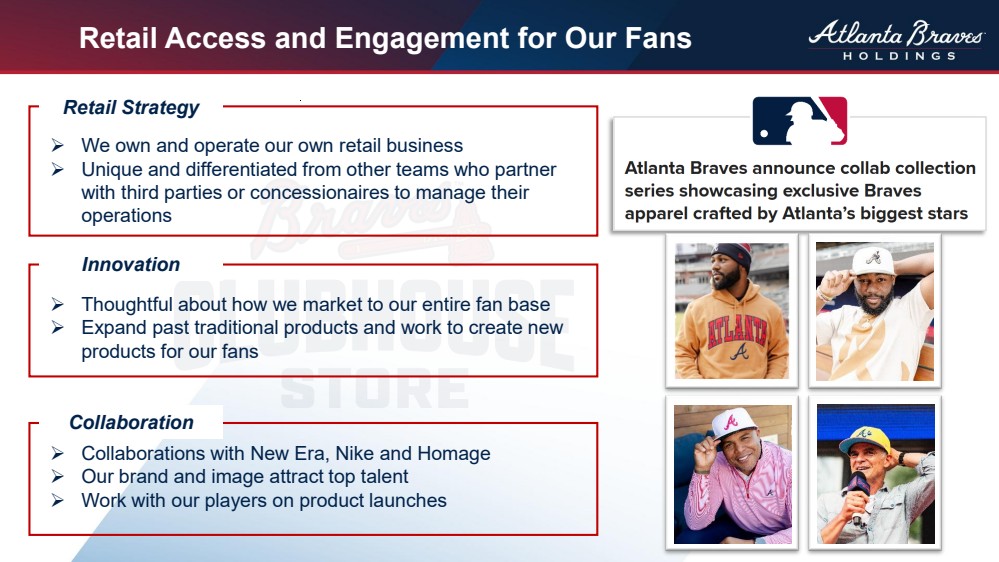
| Retail Strategy Innovation Collaboration ➢ We own and operate our own retail business ➢ Unique and differentiated from other teams who partner with third parties or concessionaires to manage their operations ➢ Thoughtful about how we market to our entire fan base ➢ Expand past traditional products and work to create new products for our fans ➢ Collaborations with New Era, Nike and Homage ➢ Our brand and image attract top talent ➢ Work with our players on product launches Retail Access and Engagement for Our Fans |
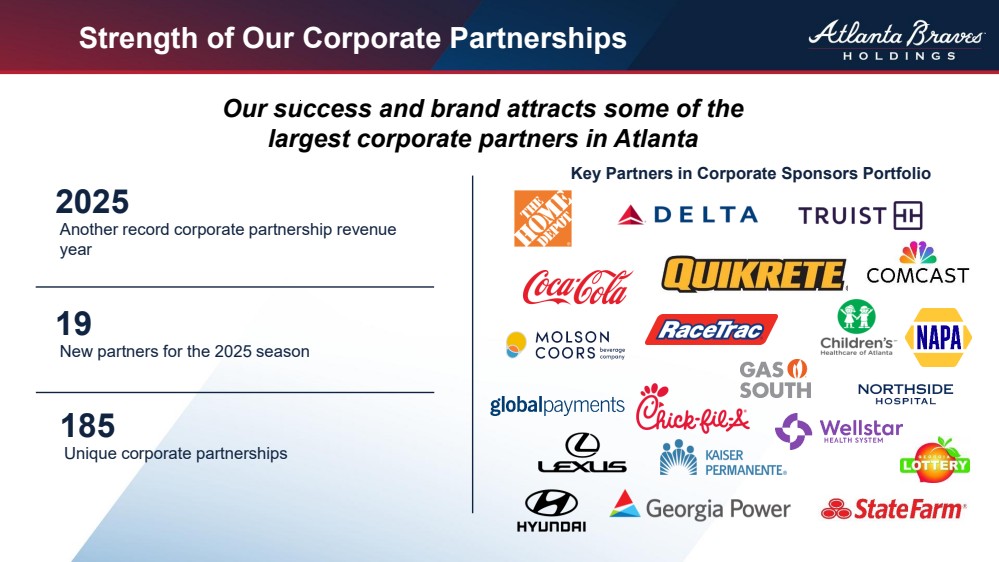
| Our success and brand attracts some of the largest corporate partners in Atlanta 19 New partners for the 2025 season 185 Unique corporate partnerships 2025 Another record corporate partnership revenue year Key Partners in Corporate Sponsors Portfolio Strength of Our Corporate Partnerships |
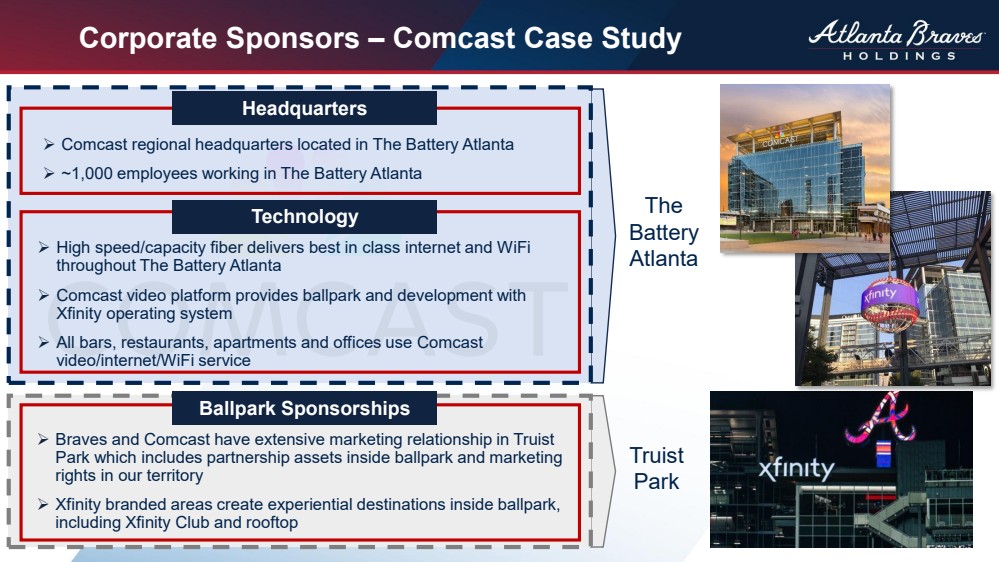
| ➢ Comcast regional headquarters located in The Battery Atlanta ➢ ~1,000 employees working in The Battery Atlanta Headquarters ➢ High speed/capacity fiber delivers best in class internet and WiFi throughout The Battery Atlanta ➢ Comcast video platform provides ballpark and development with Xfinity operating system ➢ All bars, restaurants, apartments and offices use Comcast video/internet/WiFi service Technology ➢ Braves and Comcast have extensive marketing relationship in Truist Park which includes partnership assets inside ballpark and marketing rights in our territory ➢ Xfinity branded areas create experiential destinations inside ballpark, including Xfinity Club and rooftop Ballpark Sponsorships Corporate Sponsors – Comcast Case Study Truist Park The Battery Atlanta |
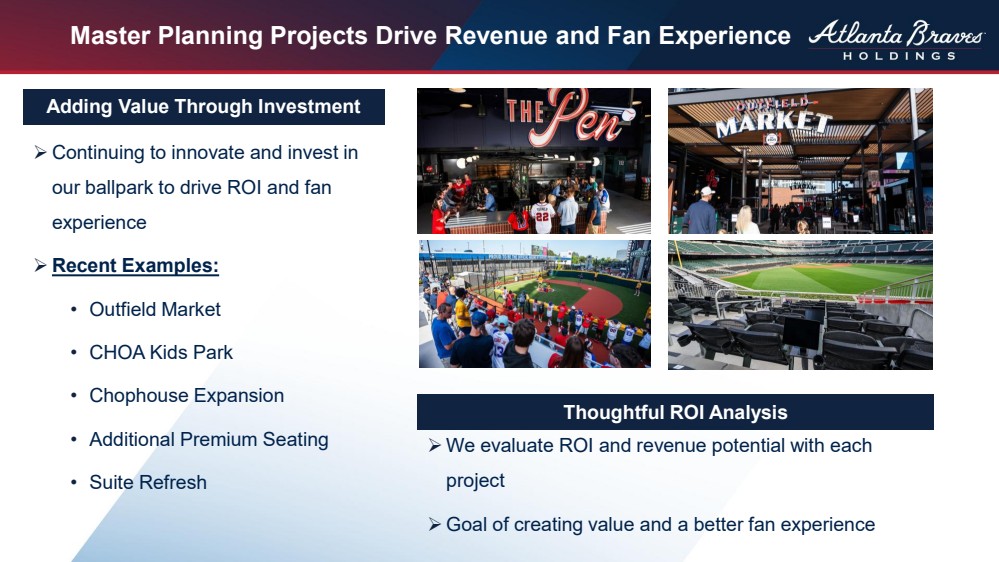
| ➢ Continuing to innovate and invest in our ballpark to drive ROI and fan experience ➢ Recent Examples: • Outfield Market • CHOA Kids Park • Chophouse Expansion • Additional Premium Seating • Suite Refresh Thoughtful ROI Analysis Master Planning Projects Drive Revenue and Fan Experience ➢ We evaluate ROI and revenue potential with each project ➢ Goal of creating value and a better fan experience Adding Value Through Investment |
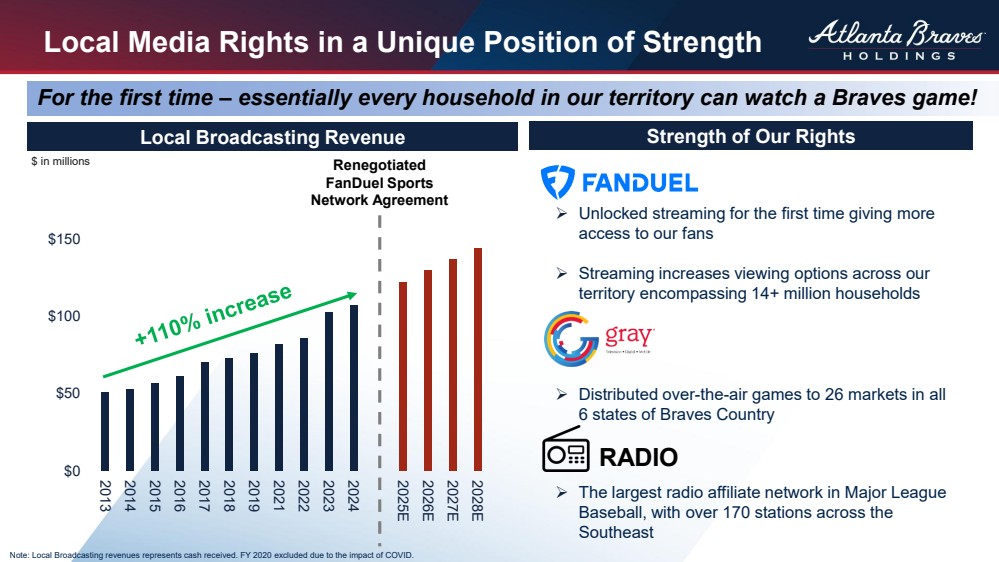
| Local Media Rights in a Unique Position of Strength $0 $50 $100 $150 2013 2014 2015 2016 2017 2018 2019 2021 2022 2023 2024 2025E 2026E 2027E 2028E Local Broadcasting Revenue Renegotiated FanDuel Sports Network Agreement ➢ Unlocked streaming for the first time giving more access to our fans ➢ Streaming increases viewing options across our territory encompassing 14+ million households ➢ Distributed over-the-air games to 26 markets in all 6 states of Braves Country ➢ The largest radio affiliate network in Major League Baseball, with over 170 stations across the Southeast RADIO Strength of Our Rights For the first time – essentially every household in our territory can watch a Braves game! Note: Local Broadcasting revenues represents cash received. FY 2020 excluded due to the impact of COVID. $ in millions |
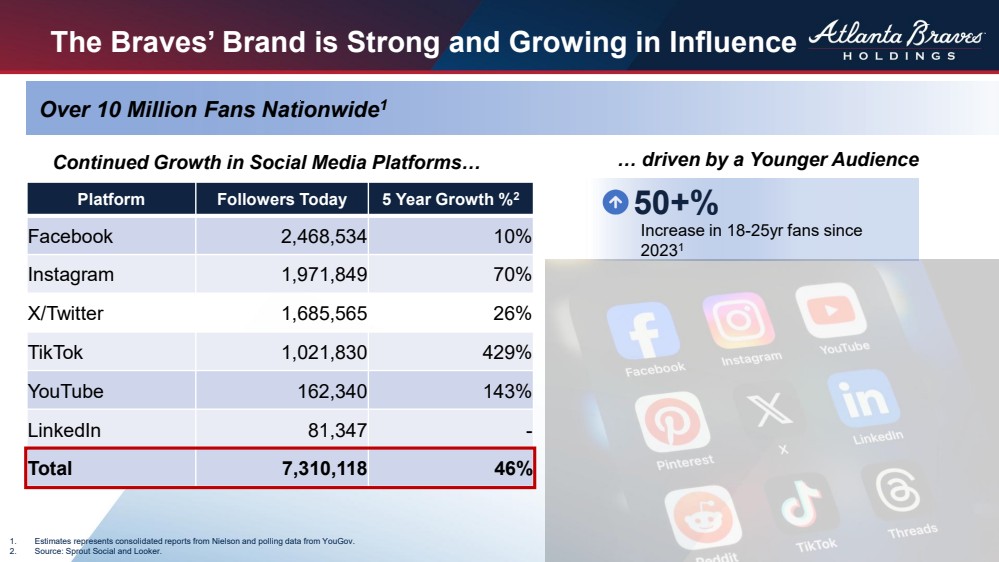
| The Braves’ Brand is Strong and Growing in Influence 1. Estimates represents consolidated reports from Nielson and polling data from YouGov. 2. Source: Sprout Social and Looker. Continued Growth in Social Media Platforms… … driven by a Younger Audience Platform Followers Today 5 Year Growth %2 Facebook 2,468,534 10% Instagram 1,971,849 70% X/Twitter 1,685,565 26% TikTok 1,021,830 429% YouTube 162,340 143% LinkedIn 81,347 - Total 7,310,118 46% Over 10 Million Fans Nationwide1 50+% Increase in 18-25yr fans since 20231 |
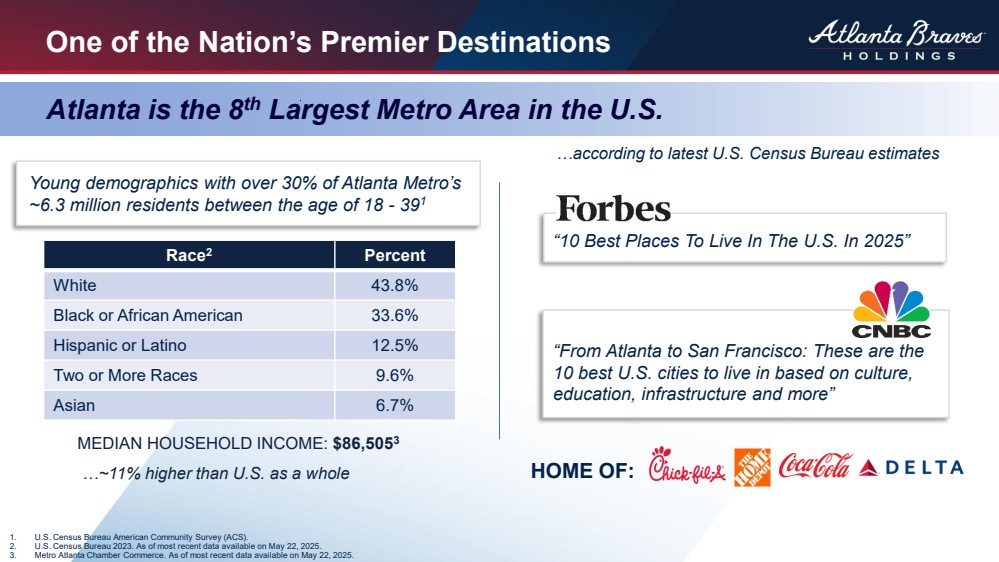
| One of the Nation’s Premier Destinations 1. U.S. Census Bureau American Community Survey (ACS). 2. U.S. Census Bureau 2023. As of most recent data available on May 22, 2025. 3. Metro Atlanta Chamber Commerce. As of most recent data available on May 22, 2025. Atlanta is the 8th Largest Metro Area in the U.S. …according to latest U.S. Census Bureau estimates MEDIAN HOUSEHOLD INCOME: $86,5053 …~11% higher than U.S. as a whole Race2 Percent White 43.8% Black or African American 33.6% Hispanic or Latino 12.5% Two or More Races 9.6% Asian 6.7% “10 Best Places To Live In The U.S. In 2025” “From Atlanta to San Francisco: These are the 10 best U.S. cities to live in based on culture, education, infrastructure and more” HOME OF: Young demographics with over 30% of Atlanta Metro’s ~6.3 million residents between the age of 18 - 391 |
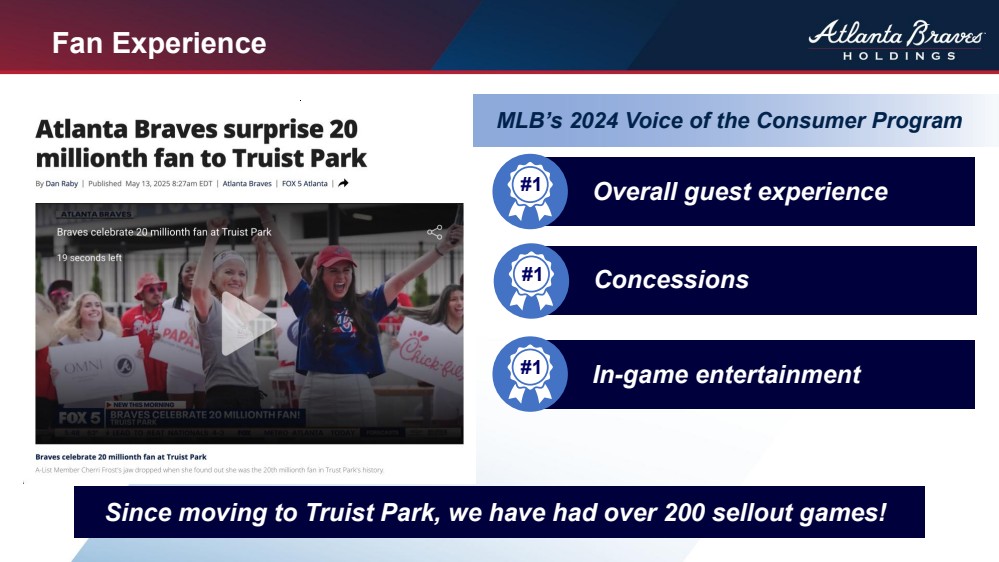
| Fan Experience #1 Overall guest experience #1 Concessions #1 In-game entertainment MLB’s 2024 Voice of the Consumer Program Since moving to Truist Park, we have had over 200 sellout games! |
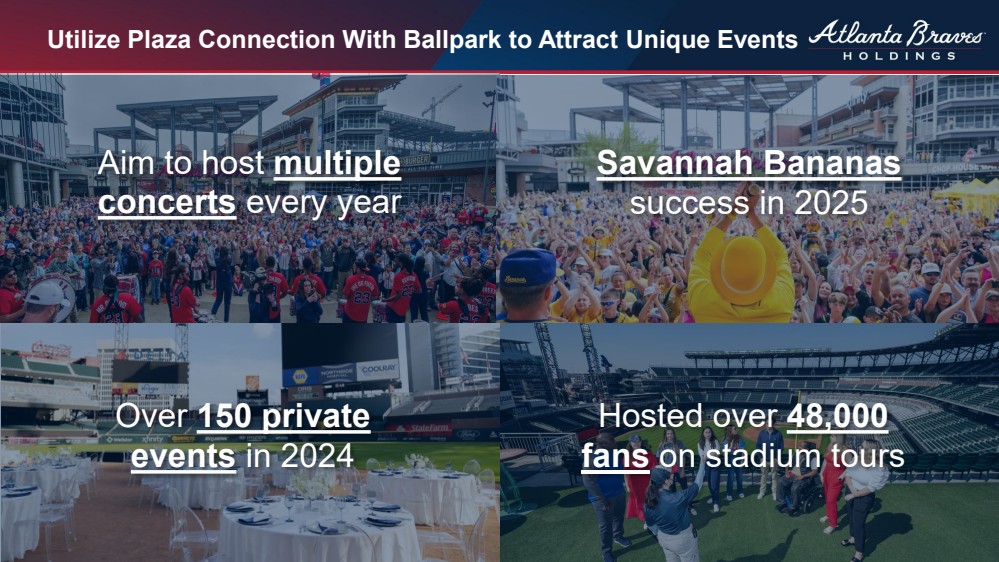
| Utilize Plaza Connection With Ballpark to Attract Unique Events Aim to host multiple concerts every year Savannah Bananas success in 2025 Over 150 private events in 2024 Hosted over 48,000 fans on stadium tours |
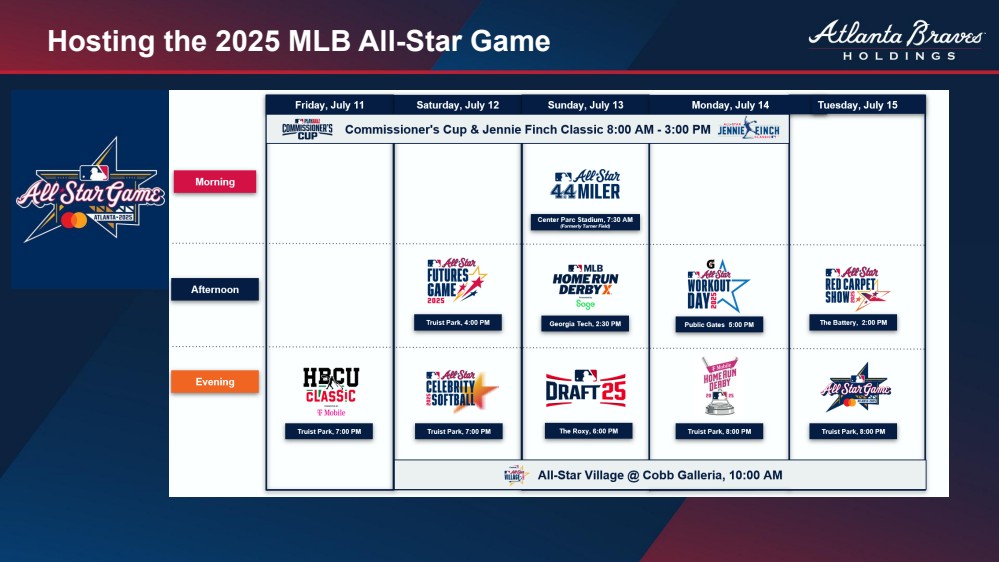
| Hosting the 2025 MLB All-Star Game |
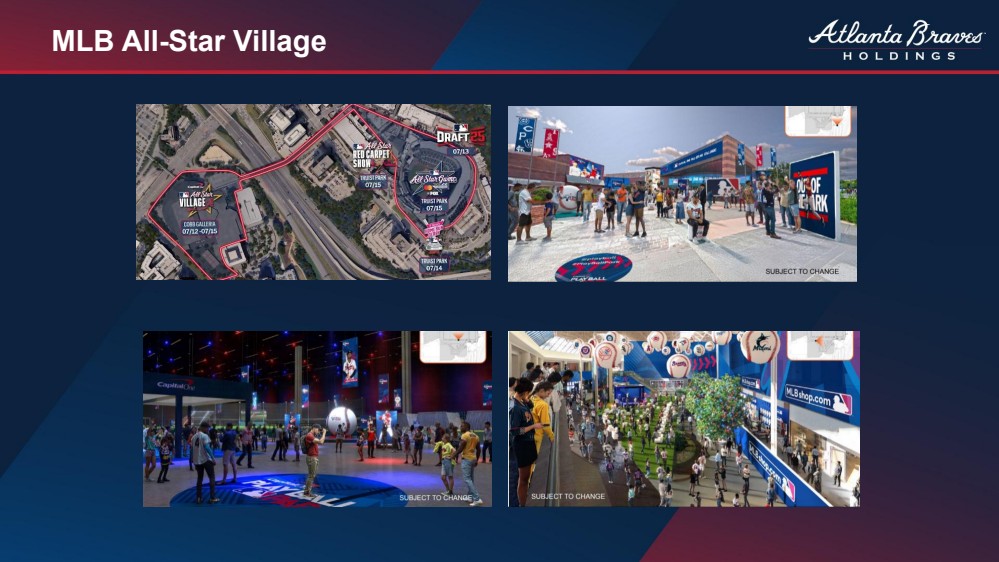
| MLB All-Star Village |
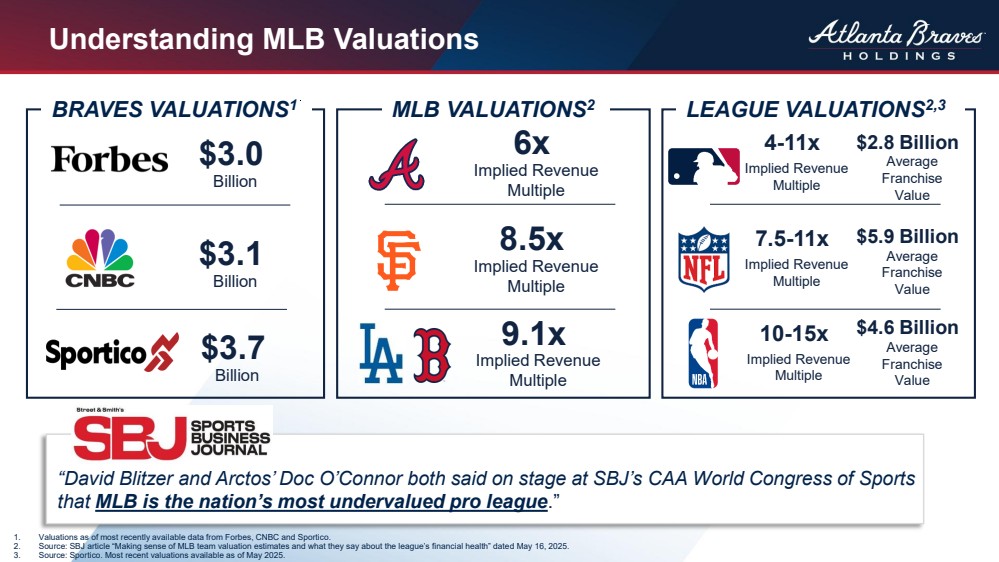
| Understanding MLB Valuations “David Blitzer and Arctos’ Doc O’Connor both said on stage at SBJ’s CAA World Congress of Sports that MLB is the nation’s most undervalued pro league.” MLB VALUATIONS2 6x Implied Revenue Multiple 9.1x Implied Revenue Multiple 8.5x Implied Revenue Multiple LEAGUE VALUATIONS2,3 4-11x Implied Revenue Multiple 10-15x Implied Revenue Multiple 7.5-11x Implied Revenue Multiple BRAVES VALUATIONS1 $3.0 Billion $3.1 Billion $3.7 Billion 1. Valuations as of most recently available data from Forbes, CNBC and Sportico. 2. Source: SBJ article “Making sense of MLB team valuation estimates and what they say about the league’s financial health” dated May 16, 2025. 3. Source: Sportico. Most recent valuations available as of May 2025. $2.8 Billion Average Franchise Value $5.9 Billion Average Franchise Value $4.6 Billion Average Franchise Value |
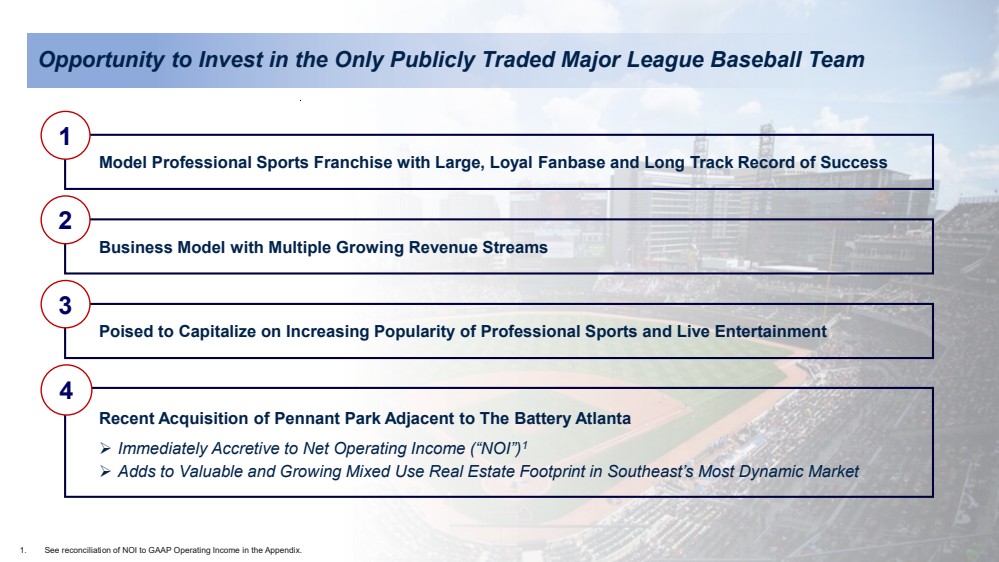
| 1 Model Professional Sports Franchise with Large, Loyal Fanbase and Long Track Record of Success 2 Business Model with Multiple Growing Revenue Streams 3 Poised to Capitalize on Increasing Popularity of Professional Sports and Live Entertainment 4 Recent Acquisition of Pennant Park Adjacent to The Battery Atlanta ➢ Immediately Accretive to Net Operating Income (“NOI”)1 ➢ Adds to Valuable and Growing Mixed Use Real Estate Footprint in Southeast’s Most Dynamic Market Opportunity to Invest in the Only Publicly Traded Major League Baseball Team 1. See reconciliation of NOI to GAAP Operating Income in the Appendix. |
| BRAVES DEVELOPMENT COMPANY OVERVIEW Mike Plant PRESIDENT & CHIEF EXECUTIVE OFFICER BRAVES DEVELOPMENT COMPANY |
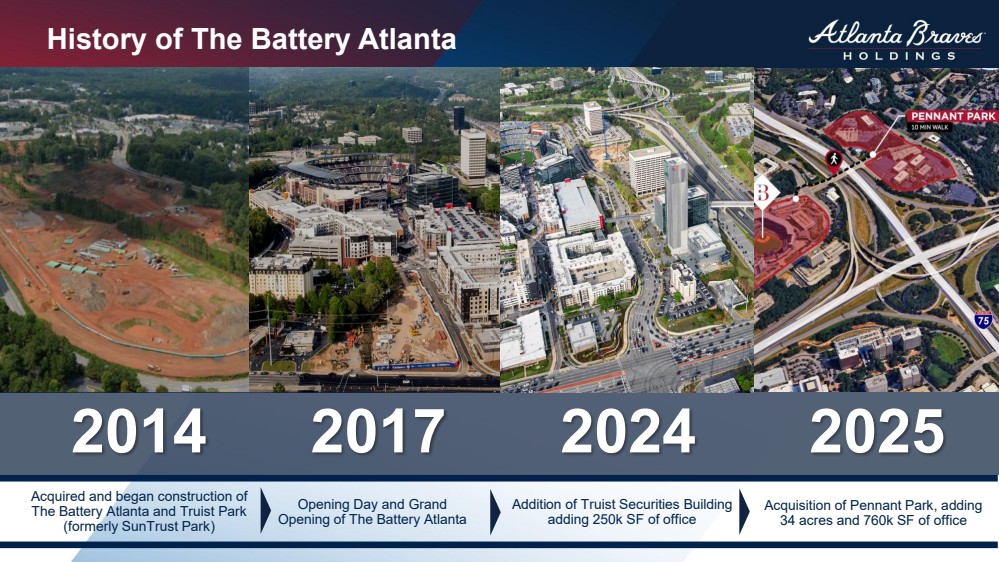
| History of The Battery Atlanta 2014 2017 2024 Acquired and began construction of The Battery Atlanta and Truist Park (formerly SunTrust Park) Opening Day and Grand Opening of The Battery Atlanta Acquisition of Pennant Park, adding 34 acres and 760k SF of office 2025 Addition of Truist Securities Building adding 250k SF of office |
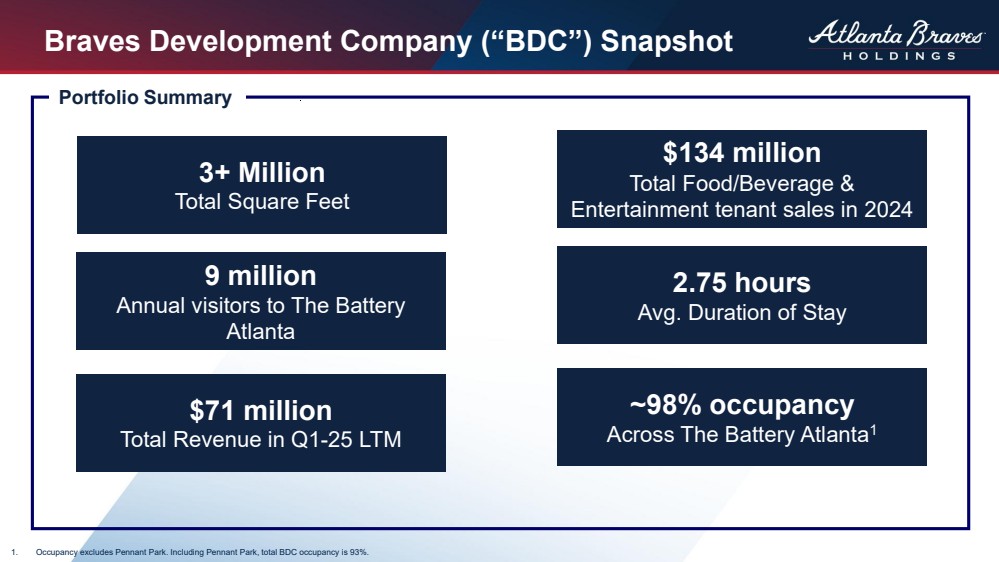
| Braves Development Company (“BDC”) Snapshot 3+ Million Total Square Feet $134 million Total Food/Beverage & Entertainment tenant sales in 2024 2.75 hours Avg. Duration of Stay 9 million Annual visitors to The Battery Atlanta Portfolio Summary ~98% occupancy Across The Battery Atlanta1 $71 million Total Revenue in Q1-25 LTM 1. Occupancy excludes Pennant Park. Including Pennant Park, total BDC occupancy is 93%. |
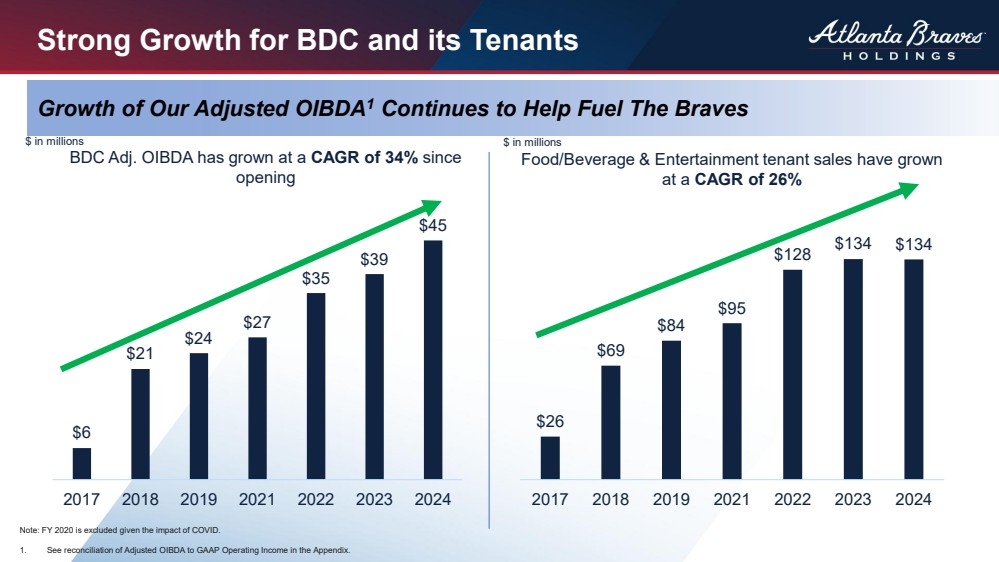
| Strong Growth for BDC and its Tenants Note: FY 2020 is excluded given the impact of COVID. 1. See reconciliation of Adjusted OIBDA to GAAP Operating Income in the Appendix. Growth of Our Adjusted OIBDA1 Continues to Help Fuel The Braves $6 $21 $24 $27 $35 $39 $45 2017 2018 2019 2021 2022 2023 2024 BDC Adj. OIBDA has grown at a CAGR of 34% since opening Food/Beverage & Entertainment tenant sales have grown at a CAGR of 26% $26 $69 $84 $95 $128 $134 $134 2017 2018 2019 2021 2022 2023 2024 $ in millions $ in millions |
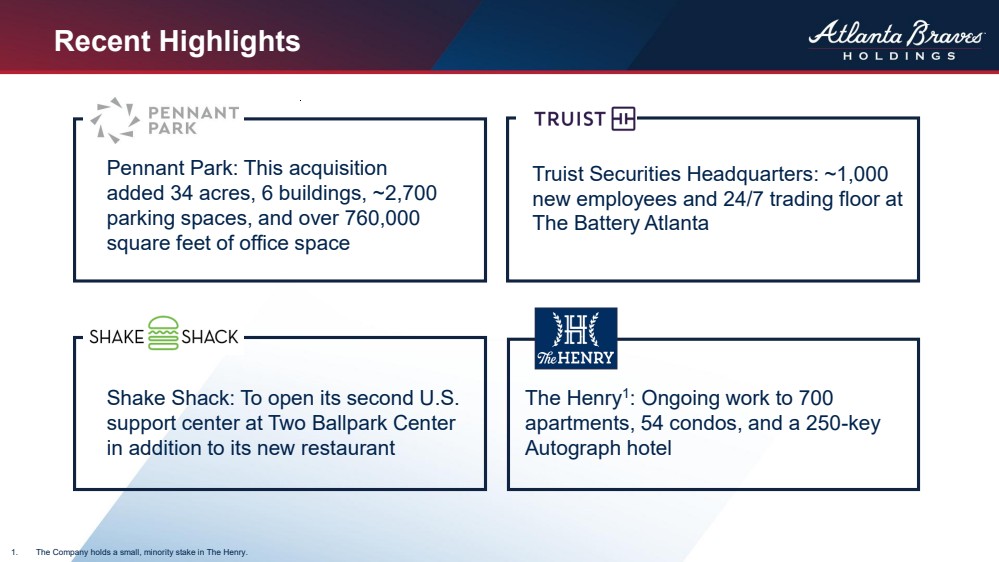
| Recent Highlights 1. The Company holds a small, minority stake in The Henry. Pennant Park: This acquisition added 34 acres, 6 buildings, ~2,700 parking spaces, and over 760,000 square feet of office space Truist Securities Headquarters: ~1,000 new employees and 24/7 trading floor at The Battery Atlanta Shake Shack: To open its second U.S. support center at Two Ballpark Center in addition to its new restaurant The Henry1 : Ongoing work to 700 apartments, 54 condos, and a 250-key Autograph hotel |
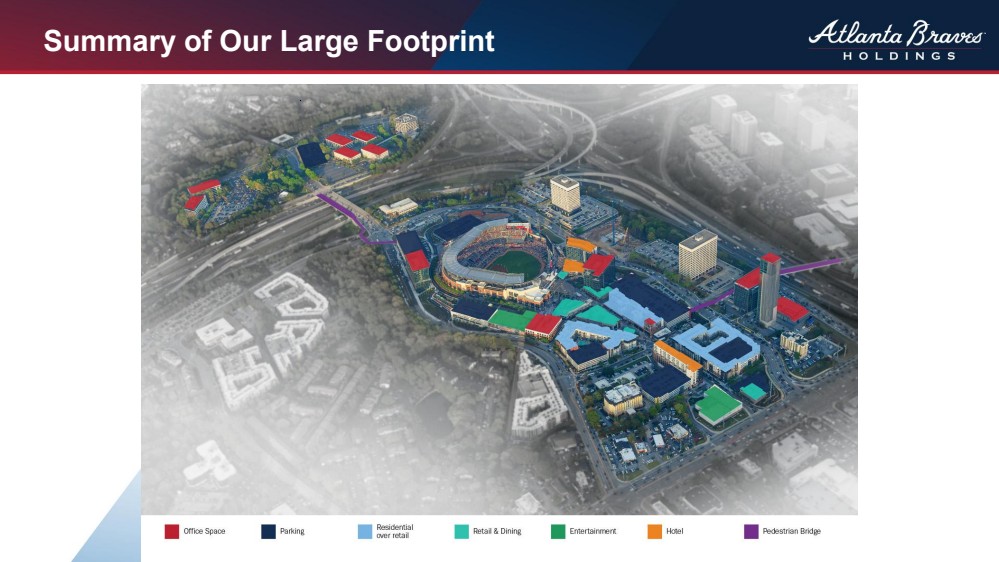
| Summary of Our Large Footprint |
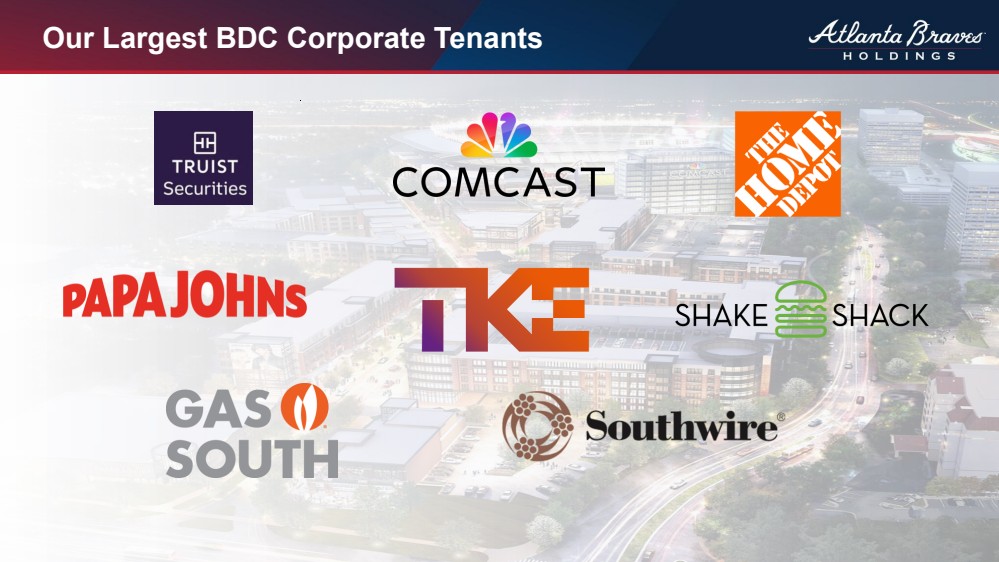
| Our Largest BDC Corporate Tenants |
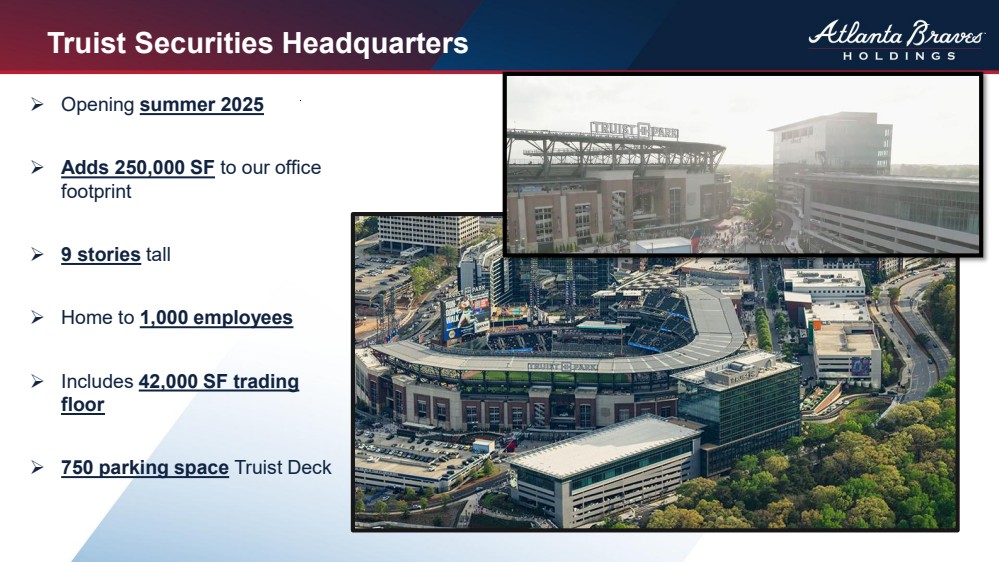
| Truist Securities Headquarters ➢ Opening summer 2025 ➢ Adds 250,000 SF to our office footprint ➢ 9 stories tall ➢ Home to 1,000 employees ➢ Includes 42,000 SF trading floor ➢ 750 parking space Truist Deck |
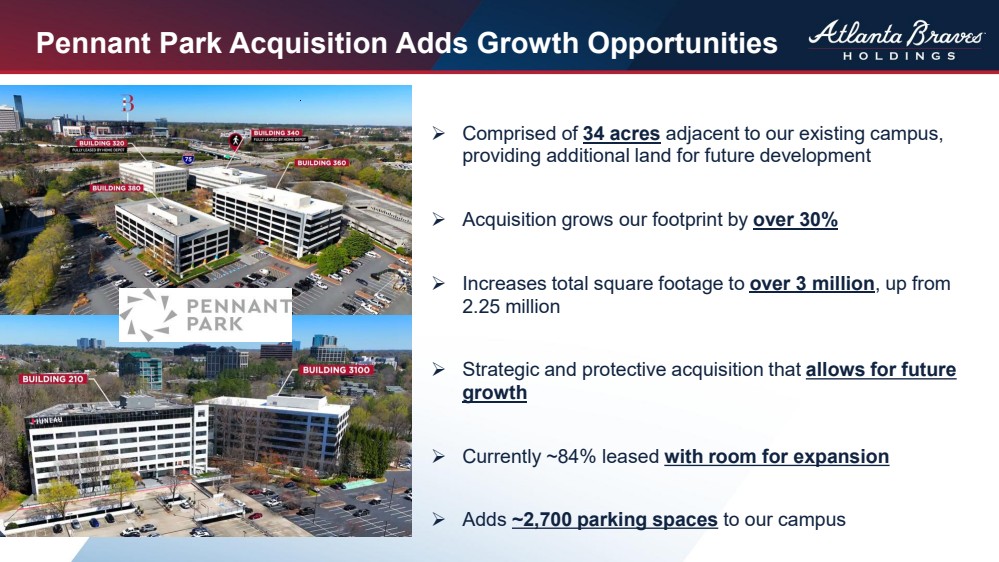
| Pennant Park Acquisition Adds Growth Opportunities ➢ Comprised of 34 acres adjacent to our existing campus, providing additional land for future development ➢ Acquisition grows our footprint by over 30% ➢ Increases total square footage to over 3 million, up from 2.25 million ➢ Strategic and protective acquisition that allows for future growth ➢ Currently ~84% leased with room for expansion ➢ Adds ~2,700 parking spaces to our campus |
| BATTERYATL.COM |
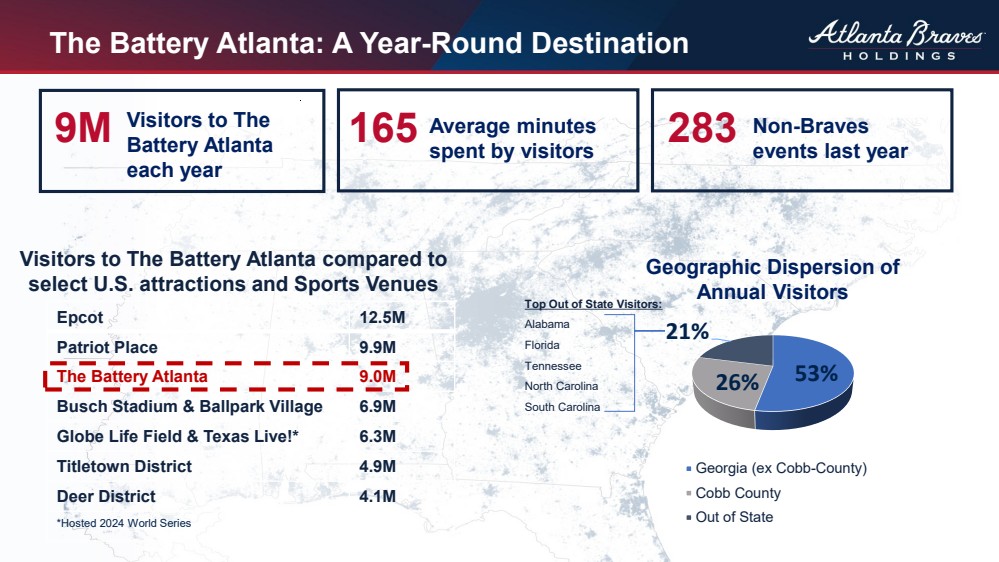
| The Battery Atlanta: A Year-Round Destination Visitors to The Battery Atlanta compared to select U.S. attractions and Sports Venues Visitors to The Battery Atlanta each year Average minutes spent by visitors Non-Braves events last year 9M 165 283 Geographic Dispersion of Annual Visitors Top Out of State Visitors: Alabama Florida Tennessee North Carolina South Carolina Epcot 12.5M Patriot Place 9.9M The Battery Atlanta 9.0M Busch Stadium & Ballpark Village 6.9M Globe Life Field & Texas Live!* 6.3M Titletown District 4.9M Deer District 4.1M *Hosted 2024 World Series 53% 26% 21% Georgia (ex Cobb-County) Cobb County Out of State |
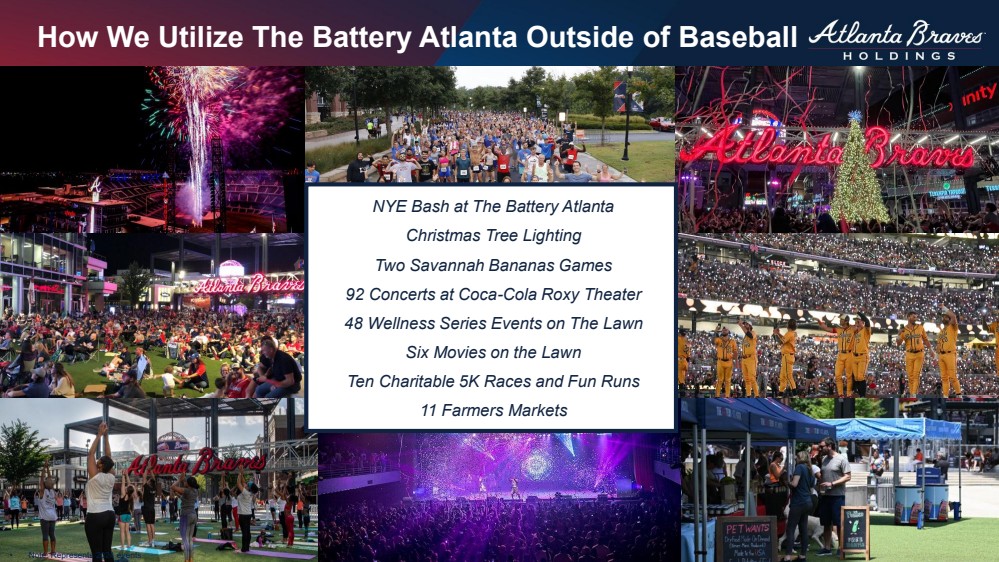
| How We Utilize The Battery Atlanta Outside of Baseball • Note: Represents 2024 events. NYE Bash at The Battery Atlanta Christmas Tree Lighting Two Savannah Bananas Games 92 Concerts at Coca-Cola Roxy Theater 48 Wellness Series Events on The Lawn Six Movies on the Lawn Ten Charitable 5K Races and Fun Runs 11 Farmers Markets |
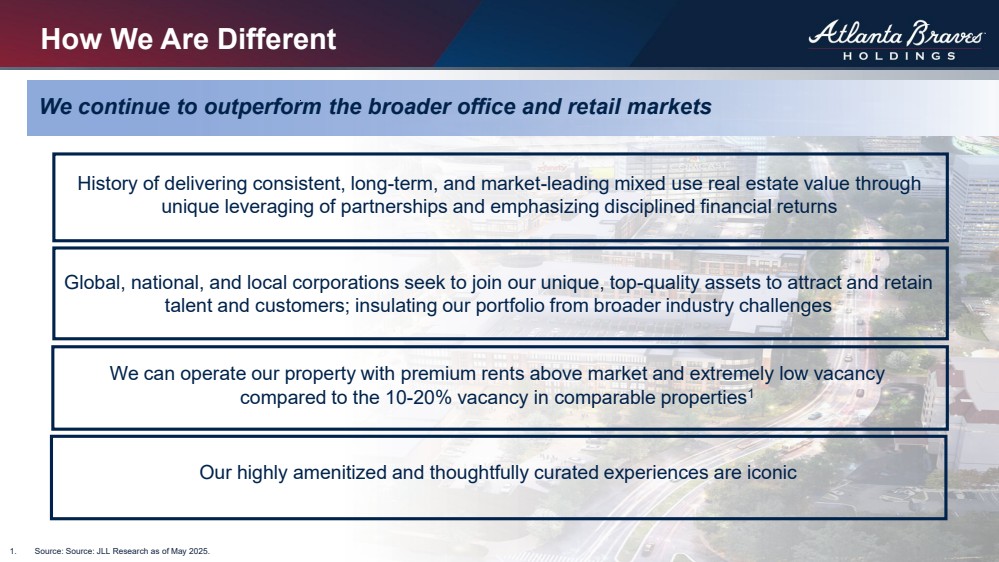
| How We Are Different History of delivering consistent, long-term, and market-leading mixed use real estate value through unique leveraging of partnerships and emphasizing disciplined financial returns Global, national, and local corporations seek to join our unique, top-quality assets to attract and retain talent and customers; insulating our portfolio from broader industry challenges Our highly amenitized and thoughtfully curated experiences are iconic We continue to outperform the broader office and retail markets We can operate our property with premium rents above market and extremely low vacancy compared to the 10-20% vacancy in comparable properties1 1. Source: Source: JLL Research as of May 2025. |
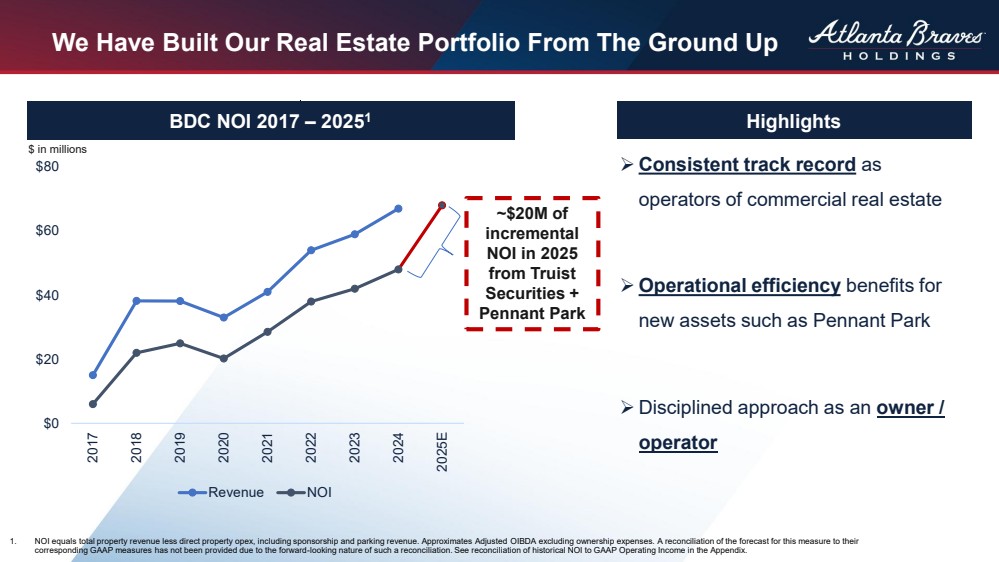
| We Have Built Our Real Estate Portfolio From The Ground Up 1. NOI equals total property revenue less direct property opex, including sponsorship and parking revenue. Approximates Adjusted OIBDA excluding ownership expenses. A reconciliation of the forecast for this measure to their corresponding GAAP measures has not been provided due to the forward-looking nature of such a reconciliation. See reconciliation of historical NOI to GAAP Operating Income in the Appendix. ➢ Consistent track record as operators of commercial real estate ➢ Operational efficiency benefits for new assets such as Pennant Park ➢ Disciplined approach as an owner / operator BDC NOI 2017 – 20251 Highlights ~$20M of incremental NOI in 2025 from Truist Securities + Pennant Park $0 $20 $40 $60 $80 2017 2018 2019 2020 2021 2022 2023 2024 2025E Revenue NOI $ in millions |
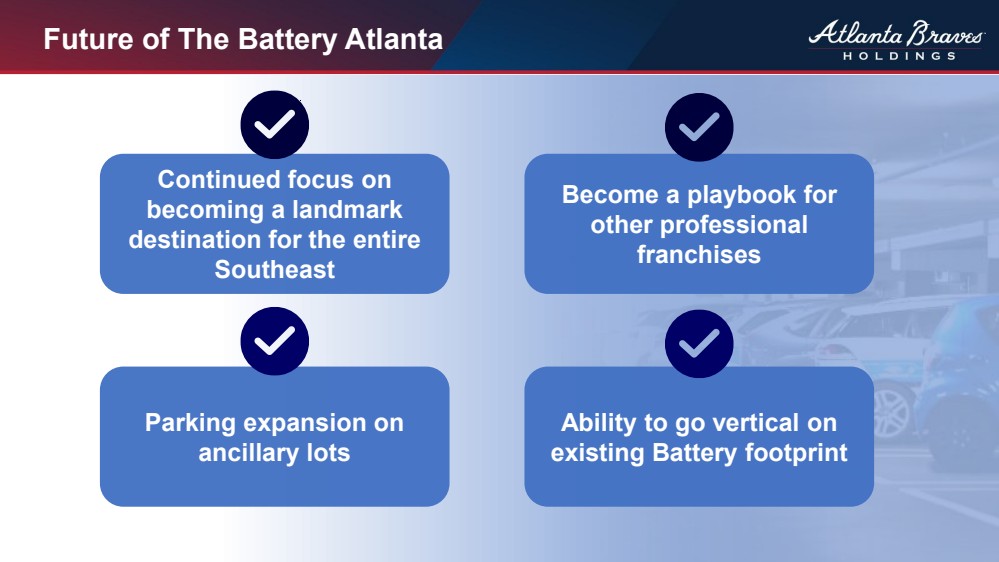
| Future of The Battery Atlanta Continued focus on becoming a landmark destination for the entire Southeast Become a playbook for other professional franchises Parking expansion on ancillary lots Ability to go vertical on existing Battery footprint |
| FINANCIAL OVERVIEW Jill Robinson EVP, CHIEF FINANCIAL OFFICER & TREASURER ATLANTA BRAVES HOLDINGS |
| Summary of Financials Growth of the Business Baseball Segment Details Braves Development Company Revenue Growth NOI Update and Real Estate Valuation Continued strength throughout the seasonality of our business… Summary of Financials |
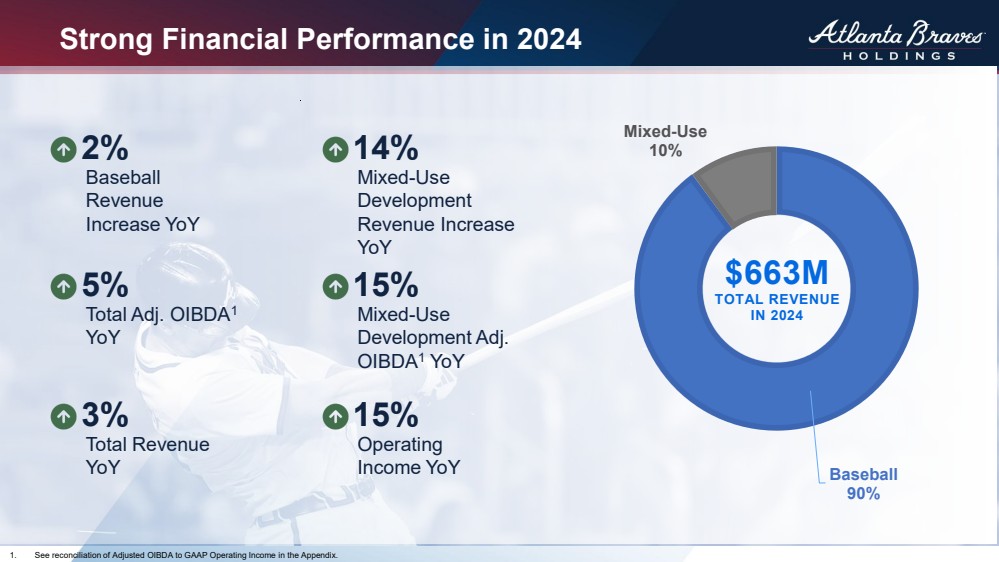
| Strong Financial Performance in 2024 1. See reconciliation of Adjusted OIBDA to GAAP Operating Income in the Appendix. Baseball 90% Mixed-Use 10% $663M TOTAL REVENUE IN 2024 5% Total Adj. OIBDA1 YoY 2% Baseball Revenue Increase YoY 15% Mixed-Use Development Adj. OIBDA1 YoY 14% Mixed-Use Development Revenue Increase YoY 3% Total Revenue YoY 15% Operating Income YoY |
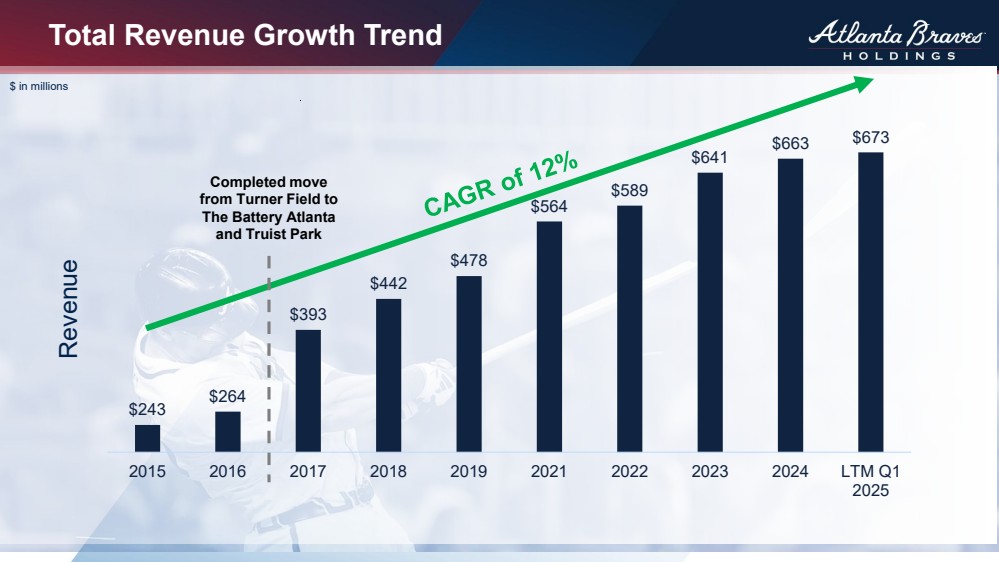
| Total Revenue Growth Trend $243 $264 $393 $442 $478 $564 $589 $641 $663 $673 2015 2016 2017 2018 2019 2021 2022 2023 2024 LTM Q1 2025 Revenue $ in millions Completed move from Turner Field to The Battery Atlanta and Truist Park |
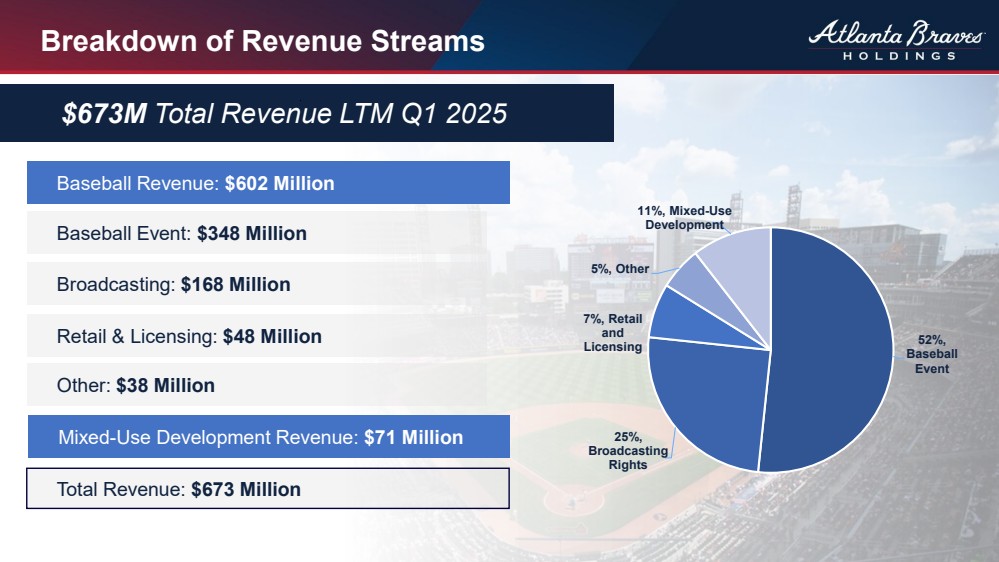
| Breakdown of Revenue Streams Baseball Event: $348 Million Other: $38 Million Broadcasting: $168 Million Retail & Licensing: $48 Million Baseball Revenue: $602 Million Total Revenue: $673 Million Mixed-Use Development Revenue: $71 Million $673M Total Revenue LTM Q1 2025 52%, Baseball Event 25%, Broadcasting Rights 7%, Retail and Licensing 5%, Other 11%, Mixed-Use Development |
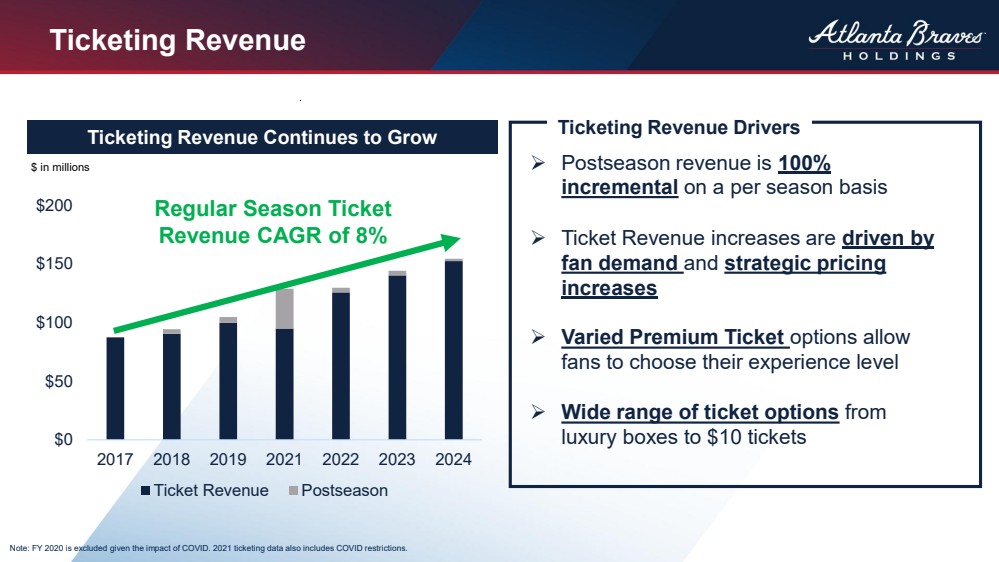
| Ticketing Revenue $0 $50 $100 $150 $200 2017 2018 2019 2021 2022 2023 2024 Ticket Revenue Postseason $ in millions Ticketing Revenue Continues to Grow ➢ Postseason revenue is 100% incremental on a per season basis ➢ Ticket Revenue increases are driven by fan demand and strategic pricing increases ➢ Varied Premium Ticket options allow fans to choose their experience level ➢ Wide range of ticket options from luxury boxes to $10 tickets Note: FY 2020 is excluded given the impact of COVID. 2021 ticketing data also includes COVID restrictions. Regular Season Ticket Revenue CAGR of 8% Ticketing Revenue Drivers |
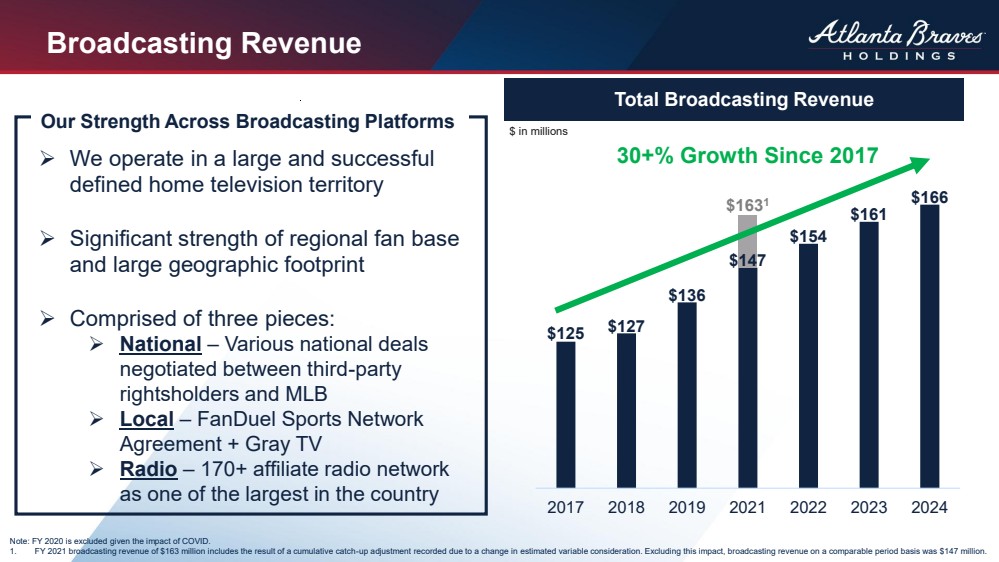
| Broadcasting Revenue ➢ We operate in a large and successful defined home television territory ➢ Significant strength of regional fan base and large geographic footprint ➢ Comprised of three pieces: ➢ National – Various national deals negotiated between third-party rightsholders and MLB ➢ Local – FanDuel Sports Network Agreement + Gray TV ➢ Radio – 170+ affiliate radio network as one of the largest in the country $125 $127 $136 $147 $154 $161 $166 2017 2018 2019 2021 2022 2023 2024 30+% Growth Since 2017 Total Broadcasting Revenue $ in millions Note: FY 2020 is excluded given the impact of COVID. 1. FY 2021 broadcasting revenue of $163 million includes the result of a cumulative catch-up adjustment recorded due to a change in estimated variable consideration. Excluding this impact, broadcasting revenue on a comparable period basis was $147 million. Our Strength Across Broadcasting Platforms $1631 |
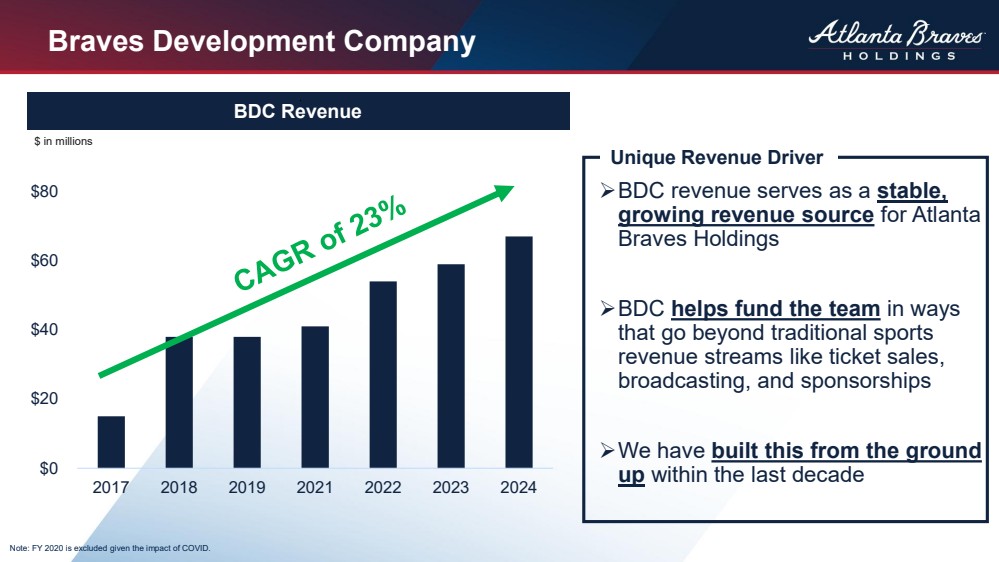
| Braves Development Company ➢BDC revenue serves as a stable, growing revenue source for Atlanta Braves Holdings ➢BDC helps fund the team in ways that go beyond traditional sports revenue streams like ticket sales, broadcasting, and sponsorships ➢We have built this from the ground up within the last decade BDC Revenue $0 $20 $40 $60 $80 2017 2018 2019 2021 2022 2023 2024 Unique Revenue Driver $ in millions Note: FY 2020 is excluded given the impact of COVID. |
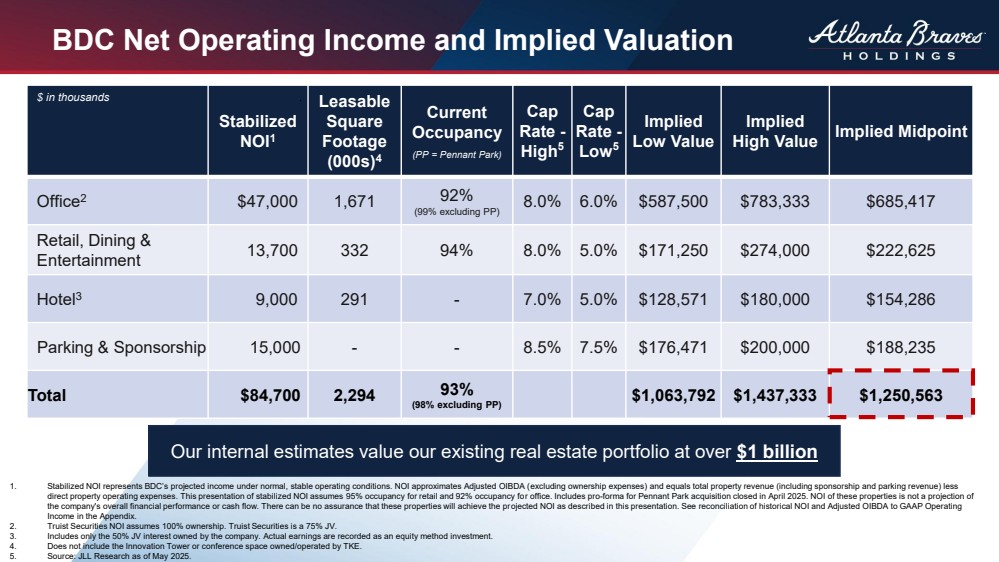
| BDC Net Operating Income and Implied Valuation $ in thousands Stabilized NOI1 Leasable Square Footage (000s)4 Current Occupancy (PP = Pennant Park) Cap Rate - High5 Cap Rate - Low5 Implied Low Value Implied High Value Implied Midpoint Office2 $47,000 1,671 92% (99% excluding PP) 8.0% 6.0% $587,500 $783,333 $685,417 Retail, Dining & Entertainment 13,700 332 94% 8.0% 5.0% $171,250 $274,000 $222,625 Hotel3 9,000 291 - 7.0% 5.0% $128,571 $180,000 $154,286 Parking & Sponsorship 15,000 - - 8.5% 7.5% $176,471 $200,000 $188,235 Total $84,700 2,294 93% (98% excluding PP) $1,063,792 $1,437,333 $1,250,563 1. Stabilized NOI represents BDC’s projected income under normal, stable operating conditions. NOI approximates Adjusted OIBDA (excluding ownership expenses) and equals total property revenue (including sponsorship and parking revenue) less direct property operating expenses. This presentation of stabilized NOI assumes 95% occupancy for retail and 92% occupancy for office. Includes pro-forma for Pennant Park acquisition closed in April 2025. NOI of these properties is not a projection of the company's overall financial performance or cash flow. There can be no assurance that these properties will achieve the projected NOI as described in this presentation. See reconciliation of historical NOI and Adjusted OIBDA to GAAP Operating Income in the Appendix. 2. Truist Securities NOI assumes 100% ownership. Truist Securities is a 75% JV. 3. Includes only the 50% JV interest owned by the company. Actual earnings are recorded as an equity method investment. 4. Does not include the Innovation Tower or conference space owned/operated by TKE. 5. Source: JLL Research as of May 2025. Our internal estimates value our existing real estate portfolio at over $1 billion |
| 52 Investment Characteristics Diversified and Stable Growing Revenue Unique Public Company: Baseball and Real Estate Scarcity Value Opportunity In Growing Sports Entertainment Business |
| 53 |
| APPENDIX |
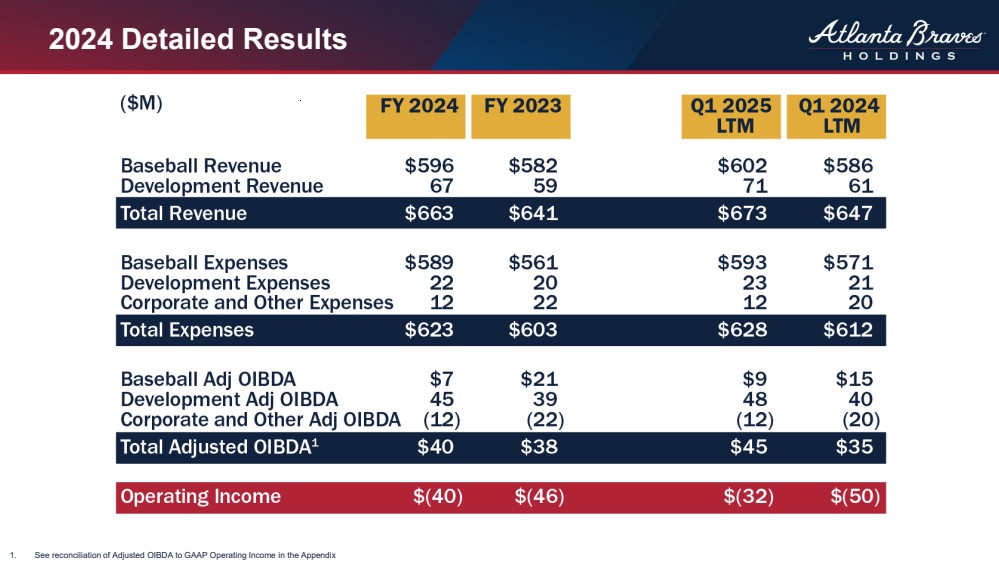
| FY 2024 FY 2023 Q1 2025 LTM Q1 2024 LTM Baseball Revenue $596 $582 $602 $586 Development Revenue 67 59 71 61 Total Revenue $663 $641 $673 $647 Baseball Expenses $589 $561 $593 $571 Development Expenses 22 20 23 21 Total Expenses $611 $581 $616 $592 Baseball Adj OIBDA $7 $21 $9 $15 Development Adj OIBDA 45 39 48 40 Total Adjusted OIBDA1 $52 $60 $57 $55 Operating Income $(40) $(46) $(32) $(50) $ in millions 2024 Detailed Results 1. See reconciliation of Adjusted OIBDA to GAAP Operating Income in the Appendix |
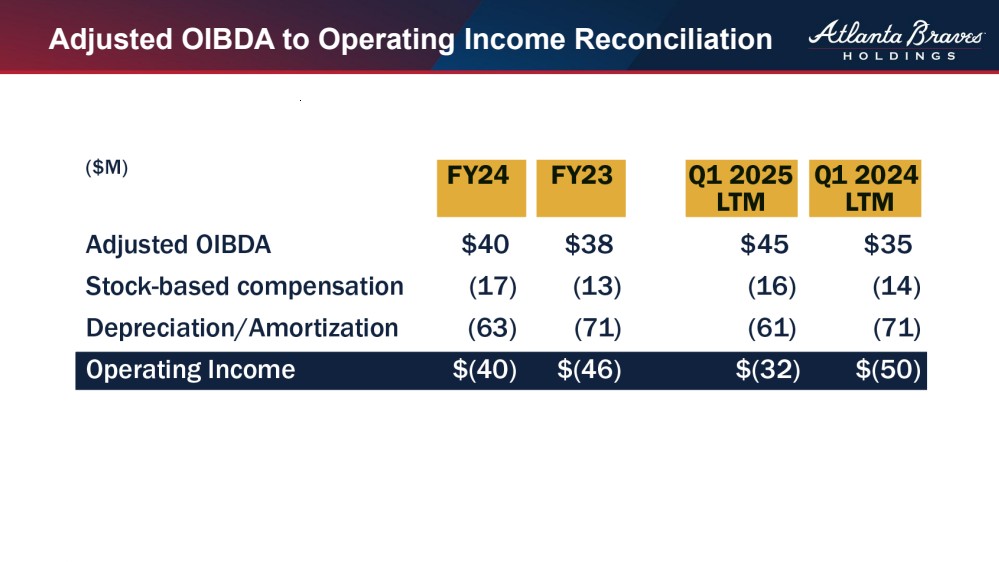
| FY24 FY23 Q1 2025 LTM Q1 2024 LTM Adjusted OIBDA 52 $60 $57 $55 Stock-based Compensation (17) (13) (16) (14) Depreciation/Amortization (63) (71) (61) (71) Corporate Expenses (12) (22) (12) (20) Operating Income $(40) $(46) $(32) $(50) $ in millions Adjusted OIBDA to Operating Income Reconciliation |
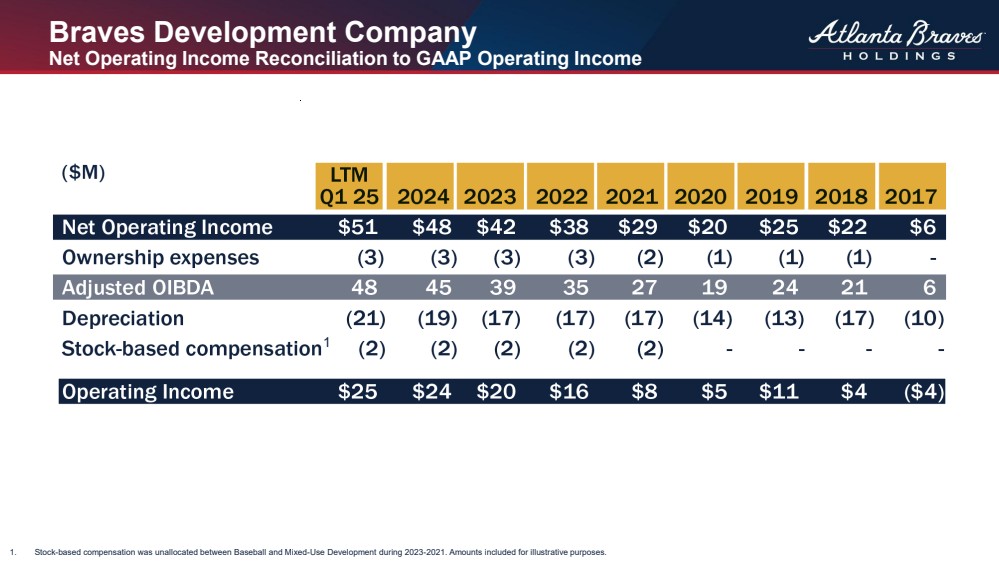
| LTM Q1 25 2024 2023 2022 2021 2020 2019 2018 2017 Net Operating Income (NOI) $51 $48 $42 $38 $29 $20 $25 $22 $6 Ownership expenses (3) (3) (3) (3) (2) (1) (1) (1) - Adjusted OIBDA 48 45 39 35 27 19 24 21 6 Depreciation and amortization (21) (19) (17) (17) (17) (14) (13) (17) (10) Stock-based compensation (2) (2) (2) (2) (2) - - - - Operating Income $25 $24 $20 $16 $8 $5 $11 $4 ($4) $ in millions Braves Development Company Net Operating Income Reconciliation to GAAP Operating Income 1 1. Stock-based compensation was unallocated between Baseball and Mixed-Use Development during 2023-2021. Amounts included for illustrative purposes. |
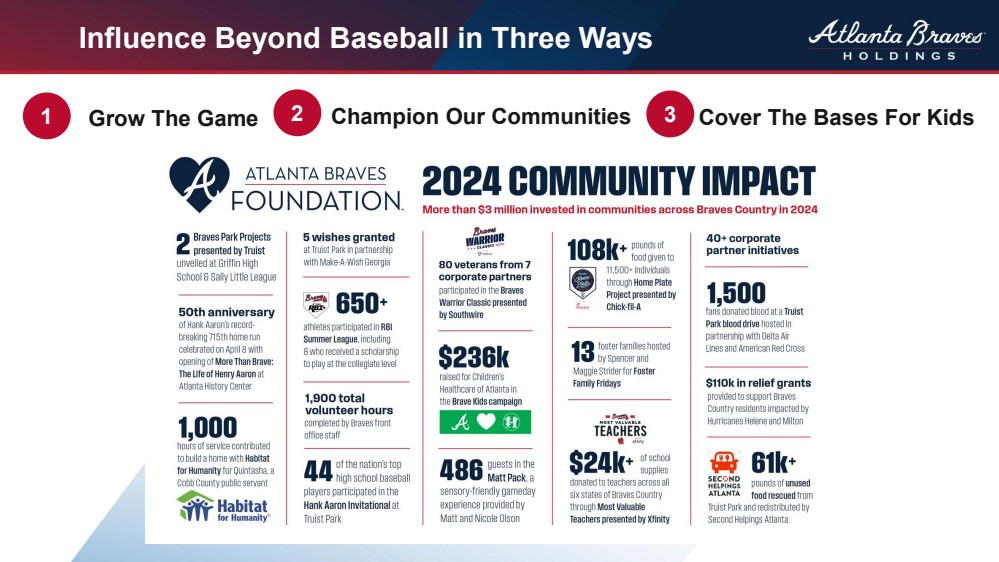
| 1 Grow The Game Influence Beyond Baseball in Three Ways 2 Champion Our Communities 3 Cover The Bases For Kids |
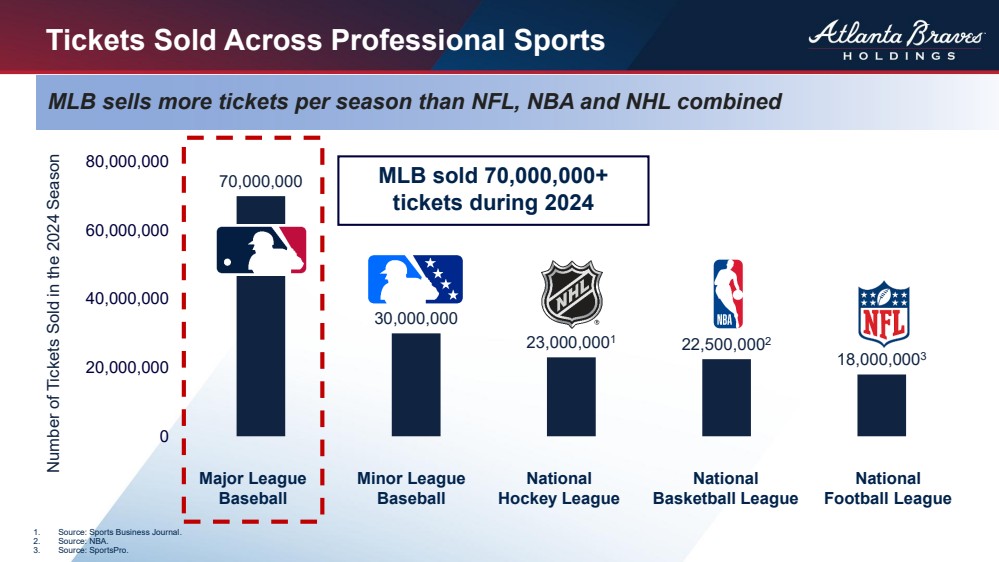
| 70,000,000 30,000,000 23,000,0001 22,500,0002 18,000,0003 0 20,000,000 40,000,000 60,000,000 80,000,000 Tickets Sold Across Professional Sports 1. Source: Sports Business Journal. 2. Source: NBA. 3. Source: SportsPro. MLB sells more tickets per season than NFL, NBA and NHL combined Number of Tickets Sold in the 2024 Season MLB sold 70,000,000+ tickets during 2024 Major League Baseball Minor League Baseball National Hockey League National Basketball League National Football League |
|