Shareholder Report
Jun. 30, 2024
USD ($)
Holding
capitalgroup.com/EMGF-M
(800) 421-4225
.
What were the fund costs for the last
last year
?
(based on a hypothetical $10,000 investment)Share class | Costs of a $10,000 investment | Costs paid as a percentage of a $10,000 investment |
| Class M | $ 69 | 0.68 % |
Management's discussion of fund performance
The fund’s Class M shares gained 2.60% for the year ended June 30, 2024. That result compares with a 13.56% gain for the MSCI Emerging Markets IMI Index. For information on returns for additional periods, including the fund lifetime, please refer to .
capitalgroup.com/EMGF-M
What factors influenced results
Emerging markets advanced during the fund’s fiscal year but rose less than other global economies as China’s rate of economic growth remained a source of concern, the U.S. dollar gained strength and the U.S. Federal Reserve did not lower rates as expected. On an absolute basis, equity markets in India and Taiwan provided strong returns.
Growth in emerging economies was mixed for much of the fund’s fiscal year. India led the way, boosted by rising infrastructure investment, while Southeast Asian countries benefited from stable demand for manufactured goods. China’s economy was helped by rising exports but domestic spending was tepid due to a weak property market. And despite aggressive interest rate cuts, Brazil’s economy struggled.
From a geographic perspective, equities based in China and Brazil weighed on returns, particularly in the health care and financials sectors. The fund’s holdings in information technology, consumer staples, consumer discretionary and financials saw returns surpassing those of the overall portfolio.
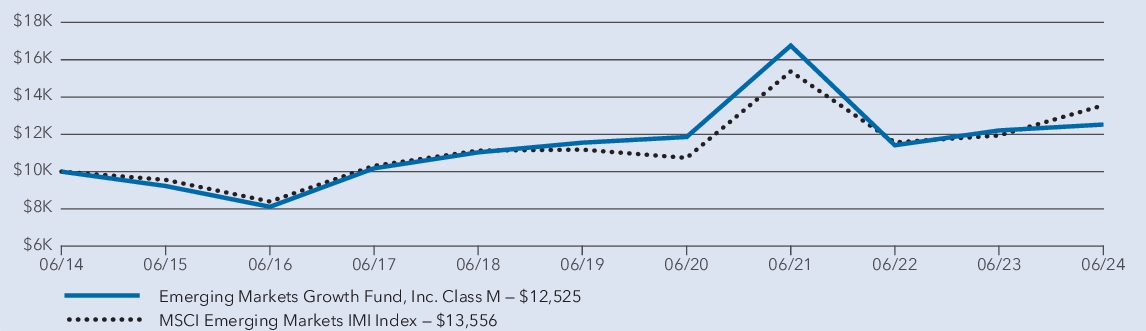
Average annual total returns
1 year | 5 years | 10 years | |
| Emerging Markets Growth Fund — Class M * | 2.60 % | 1.63 % | 2.28 % |
| MSCI Emerging Markets IMI Index † | 13.56 % | 3.93 % | 3.09 % |
*
Investment results assume all distributions are reinvested and reflect applicable fees
and expenses. When applicable, results reflect fee
waivers and/or expense reimbursements, without which they would have been lower.†
Results assume all distributions are reinvested
. Any market index shown is unmanaged, and therefore, has no expenses. Investors cannot invest directly in an index. Source(s): MSCI.Key
fund
statistics| Fund net assets (in millions) | $ 1,373 |
| Total number of portfolio holdings | 150 |
| Total advisory fees paid (in millions) | $ 9 |
| Portfolio turnover rate | 34 % |
Portfolio holdings by sector
(percent of net assets)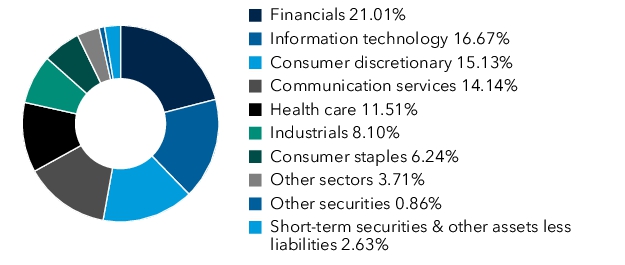
capitalgroup.com/EMGF-F3
(800) 421-4225
.
What were the fund costs for the last
last year
?
(based on a hypothetical $10,000 investment)Share class | Costs of a $10,000 investment | Costs paid as a percentage of a $10,000 investment |
| Class F-3 | $ 72 | 0.71 % |
Management's discussion of fund performance
The fund’s Class F-3 shares gained 2.42% for the year ended June 30, 2024. That result compares with a 13.56% gain for the MSCI Emerging Markets IMI Index. For information on returns for additional periods, including the fund lifetime, please refer to .
capitalgroup.com/EMGF-F3
What factors influenced results
Emerging markets advanced during the fund’s fiscal year but rose less than other global economies as China’s rate of economic growth remained a source of concern, the U.S. dollar gained strength and the U.S. Federal Reserve did not lower rates as expected. On an absolute basis, equity markets in India and Taiwan provided strong returns.
Growth in emerging economies was mixed for much of the fund’s fiscal year. India led the way, boosted by rising infrastructure investment, while Southeast Asian countries benefited from stable demand for manufactured goods. China’s economy was helped by rising exports but domestic spending was tepid due to a weak property market. And despite aggressive interest rate cuts, Brazil’s economy struggled.
From a geographic perspective, equities based in China and Brazil weighed on returns, particularly in the health care and financials sectors. The fund’s holdings in information technology, consumer staples, consumer discretionary and financials saw returns surpassing those of the overall portfolio.
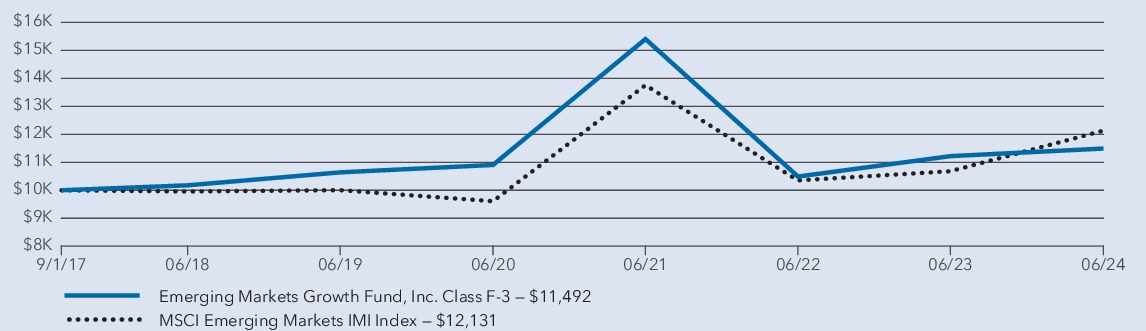
Average annual total returns
1 year | 5 years | Since inception 1 | |
| Emerging Markets Growth Fund — Class F-3 2 | 2.42 % | 1.55 % | 2.06 % |
| MSCI Emerging Markets IMI Index 3 | 13.56 % | 3.93 % | 2.87 % |
1
Class F-3 shares were first offered on September 1, 2017.2
Investment results assume all distributions are reinvested and reflect applicable fees and expenses. When applicable, results reflect fee waivers and/or expense
reimbursements, without which they would have been lower.3
Results assume all distributions
are reinvested. Any market index shown is unmanaged, and therefore, has no expenses. Investors cannot invest directly in an index. Source(s): MSCI.Key fund statistics
| Fund net assets (in millions) | $ 1,373 |
| Total number of portfolio holdings | 150 |
| Total advisory fees paid (in millions) | $ 9 |
| Portfolio turnover rate | 34 % |
Portfolio holdings by sector
(percent of net assets)
capitalgroup.com/EMGF-R6
(800) 421-4225
.
What were the fund costs for the last
last year
?
(based on a hypothetical $10,000 investment)Share class | Costs of a $10,000 investment | Costs paid as a percentage of a $10,000 investment |
| Class R-6 | $ 72 | 0.71 % |
Management's discussion of fund performance
The fund’s Class R-6 shares gained 2.40% for the year ended June 30, 2024. That result compares with a 13.56% gain for the MSCI Emerging Markets IMI Index. For information on returns for additional periods, including the fund lifetime, please refer to .
capitalgroup.com/EMGF-R6
What factors influenced results
Emerging markets advanced during the fund’s fiscal year but rose less than other global economies as China’s rate of economic growth remained a source of concern, the U.S. dollar gained strength and the U.S. Federal Reserve did not lower rates as expected. On an absolute basis, equity markets in India and Taiwan provided strong returns.
Growth in emerging economies was mixed for much of the fund’s fiscal year. India led the way, boosted by rising infrastructure investment, while Southeast Asian countries benefited from stable demand for manufactured goods. China’s economy was helped by rising exports but domestic spending was tepid due to a weak property market. And despite aggressive interest rate cuts, Brazil’s economy struggled.
From a geographic perspective, equities based in China and Brazil weighed on returns, particularly in the health care and financials sectors. The fund’s holdings in information technology, consumer staples, consumer discretionary and financials saw returns surpassing those of the overall portfolio.
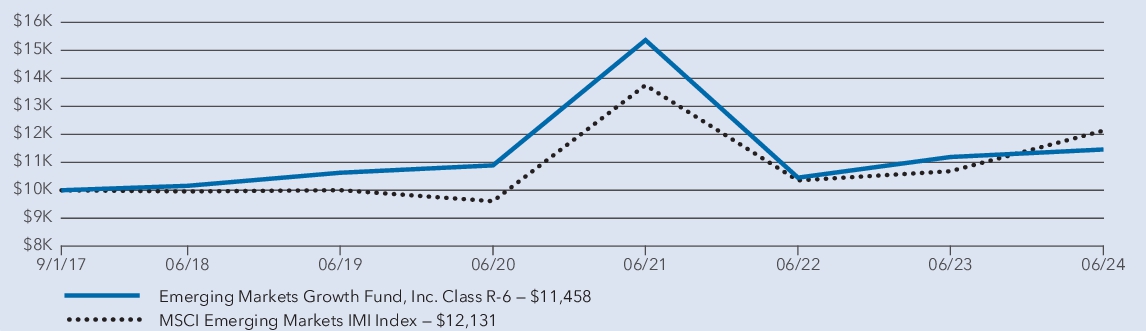
Average annual total returns
1 year | 5 years | Since inception 1 | |
| Emerging Markets Growth Fund — Class R-6 2 | 2.40 % | 1.52 % | 2.01 % |
| MSCI Emerging Markets IMI Index 3 | 13.56 % | 3.93 % | 2.87 % |
1
Class R-6 shares were first offered on September 1, 2017.2
Investment results assume all distributions are reinvested and reflect applicable fees and expenses. When applicable, results reflect fee waivers and/or expense reimbursements, without which they would have been lower.3
Results assume all distributions are reinvested
. Any market index shown is unmanaged, and therefore, has no expenses. Investors cannot invest directly in an index. Source(s): MSCI.Key fund statistics
| Fund net assets (in millions) | $ 1,373 |
| Total number of portfolio holdings | 150 |
| Total advisory fees paid (in millions) | $ 9 |
| Portfolio turnover rate | 34 % |
Portfolio holdings by sector
(percent of net assets)