| June 17, 2025 Annual Shareholders’ Meeting 1 |

| Forward Looking Statements 2 In addition to historical information, this presentation contains forward-looking statements within the meaning of the Private Securities Litigation Reform Act of 1995 that are based on certain assumptions and describe future plans, strategies and expectations of John Marshall Bancorp, Inc. (the “Company”). These forward-looking statements are generally identified by use of the words “believe,” “expect,” “intend,” “anticipate,” “estimate,” “project,” “will,” “should,” “may,” “view,” “opportunity,” “potential,” or similar expressions. Our ability to predict results or the actual effect of future plans or strategies is inherently uncertain. These forward-looking statements are based on our beliefs and assumptions and on the information available to us at the time that these disclosures were prepared, and involve known and unknown risks, uncertainties and other factors that may cause our actual results to differ materially from any future results expressed or implied by such forward-looking statements. Although we believe the expectations reflected in such forward-looking statements are reasonable, we can give no assurance such expectations will prove to have been correct. Should any known or unknown risks and uncertainties develop into actual events, those developments could have material adverse effects on our business, financial condition and results of operations. Factors that could have a material adverse effect on the operations of the Company and John Marshall Bank (the “Bank”) include, but are not limited to, the following: the concentration of our business in the Washington, D.C. metropolitan area and the effect of changes in the economic, political and environmental conditions on this market, including reduction in spending by the U.S. Government; adequacy of our allowance for loan credit losses, allowance for unfunded commitments credit losses, and allowance for credit losses associated with our held-to-maturity and available-for-sale securities portfolios; deterioration of our asset quality; future performance of our loan portfolio with respect to recently originated loans; the level of prepayments on loans and mortgage-backed securities; liquidity, interest rate and operational risks associated with our business; changes in our financial condition or results of operations that reduce capital; our ability to maintain existing deposit relationships or attract new deposit relationships; changes in consumer spending, borrowing and savings habits; inflation and changes in interest rates that may reduce our margins or reduce the fair value of financial instruments; changes in the monetary and fiscal policies of the U.S. Government, including policies of the U.S. Treasury and the Federal Reserve; additional risks related to new lines of business, products, product enhancements or services; increased competition with other financial institutions and fintech companies; adverse changes in the securities markets; changes in the financial condition or future prospects of issuers of securities that we own; our ability to maintain an effective risk management framework; changes in laws or government regulations or policies affecting financial institutions, including changes in regulatory structure and in regulatory fees and capital requirements; compliance with legislative or regulatory requirements; results of examination of us by our regulators, including the possibility that our regulators may require us to increase our allowance for credit losses or to write-down assets or take similar actions; potential claims, damages, and fines related to litigation or government actions; the effectiveness of our internal controls over financial reporting and our ability to remediate any future material weakness in our internal controls over financial reporting; geopolitical conditions, including trade restrictions and tariffs, and acts or threats of terrorism and/or military conflicts, or actions taken by the U.S. or other governments in response to trade restrictions and tariffs, and acts or threats of terrorism and/or military conflicts, negatively impacting business and economic conditions in the U.S. and abroad; the effects of weather-related or natural disasters, which may negatively affect our operations and/or our loan portfolio and increase our cost of conducting business; public health events (such as the COVID-19 pandemic) and governmental and societal responses thereto; technological risks and developments, and cyber threats, attacks, or events; changes in accounting policies and practices; our ability to successfully capitalize on growth opportunities; our ability to retain key employees; deteriorating economic conditions, either nationally or in our market area, including higher unemployment and lower real estate values; implications of our status as a smaller reporting company and as an emerging growth company; and other factors discussed in Item 1A. Risk Factors in the Company’s 2024 Annual Report on Form 10-K filed with the Securities and Exchange Commission on March 28, 2025. These risks and uncertainties should be considered in evaluating forward-looking statements and undue reliance should not be placed on such statements. We do not undertake, and specifically disclaim any obligation, to publicly release the result of any revisions which may be made to any forward-looking statements to reflect events or circumstances after the date of such statements or to reflect the occurrence of anticipated or unanticipated events. All written or oral forward-looking statements attributable to us are expressly qualified in their entirety by this cautionary note. |
| Agenda 3 Company Overview Financial Performance 2024 Stock Price Performance 2025 Outlook |
| 4 Company Overview |

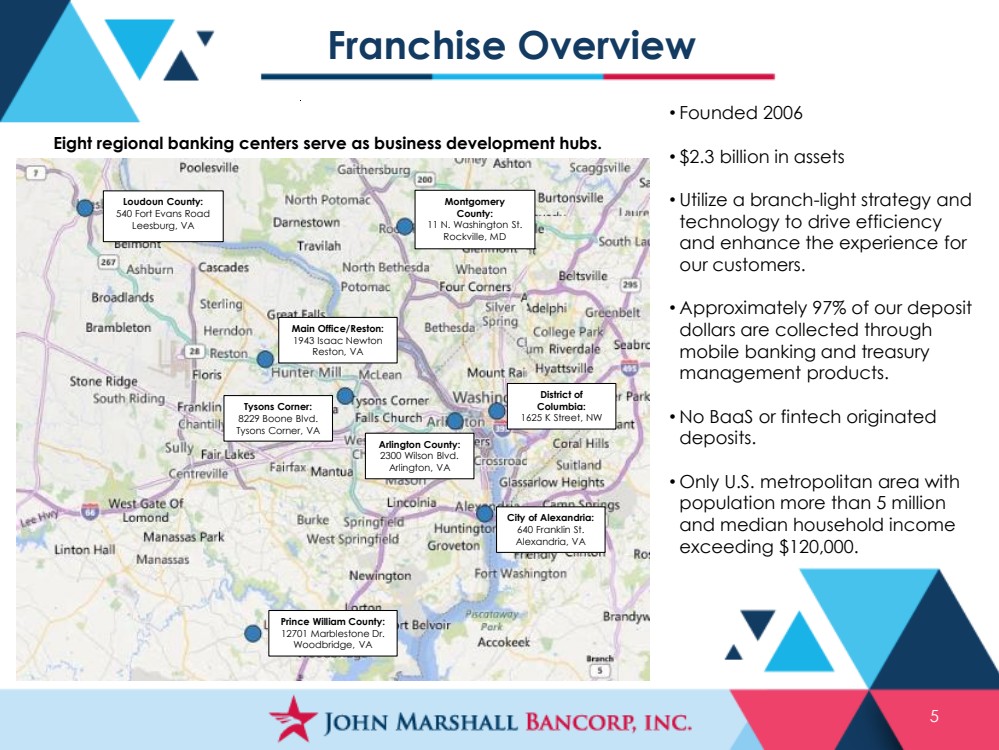
| 5 Franchise Overview • Founded 2006 • $2.3 billion in assets • Utilize a branch-light strategy and technology to drive efficiency and enhance the experience for our customers. • Approximately 97% of our deposit dollars are collected through mobile banking and treasury management products. • No BaaS or fintech originated deposits. • Only U.S. metropolitan area with population more than 5 million and median household income exceeding $120,000. Main Office/Reston: 1943 Isaac Newton Reston, VA District of Columbia: 1625 K Street, NW Tysons Corner: 8229 Boone Blvd. Tysons Corner, VA Prince William County: 12701 Marblestone Dr. Woodbridge, VA Montgomery County: 11 N. Washington St. Rockville, MD City of Alexandria: 640 Franklin St. Alexandria, VA Arlington County: 2300 Wilson Blvd. Arlington, VA Loudoun County: 540 Fort Evans Road Leesburg, VA Eight regional banking centers serve as business development hubs. |
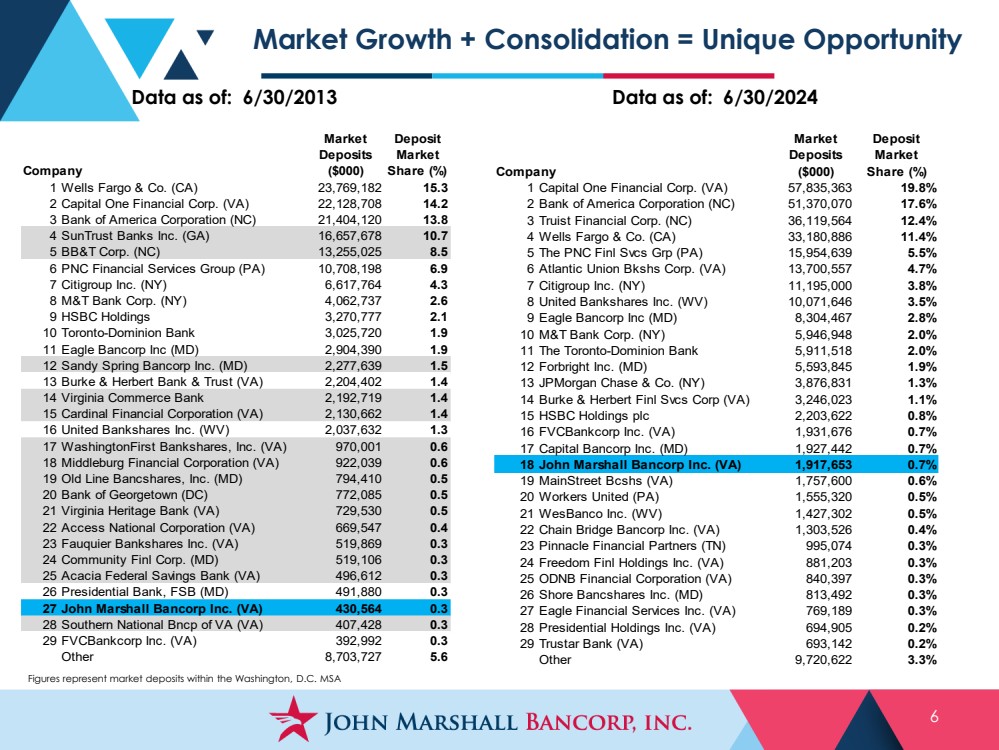
| Market Growth + Consolidation = Unique Opportunity 6 Data as of: 6/30/2013 Data as of: 6/30/2024 Figures represent market deposits within the Washington, D.C. MSA Market Deposit Deposits Market Company ($000) Share (%) 1 Wells Fargo & Co. (CA) 23,769,182 15.3 2 Capital One Financial Corp. (VA) 22,128,708 14.2 3 Bank of America Corporation (NC) 21,404,120 13.8 4 SunTrust Banks Inc. (GA) 16,657,678 10.7 5 BB&T Corp. (NC) 13,255,025 8.5 6 PNC Financial Services Group (PA) 10,708,198 6.9 7 Citigroup Inc. (NY) 6,617,764 4.3 8 M&T Bank Corp. (NY) 4,062,737 2.6 9 HSBC Holdings 3,270,777 2.1 10 Toronto-Dominion Bank 3,025,720 1.9 11 Eagle Bancorp Inc (MD) 2,904,390 1.9 12 Sandy Spring Bancorp Inc. (MD) 2,277,639 1.5 13 Burke & Herbert Bank & Trust (VA) 2,204,402 1.4 14 Virginia Commerce Bank 2,192,719 1.4 15 Cardinal Financial Corporation (VA) 2,130,662 1.4 16 United Bankshares Inc. (WV) 2,037,632 1.3 17 WashingtonFirst Bankshares, Inc. (VA) 970,001 0.6 18 Middleburg Financial Corporation (VA) 922,039 0.6 19 Old Line Bancshares, Inc. (MD) 794,410 0.5 20 Bank of Georgetown (DC) 772,085 0.5 21 Virginia Heritage Bank (VA) 729,530 0.5 22 Access National Corporation (VA) 669,547 0.4 23 Fauquier Bankshares Inc. (VA) 519,869 0.3 24 Community Finl Corp. (MD) 519,106 0.3 25 Acacia Federal Savings Bank (VA) 496,612 0.3 26 Presidential Bank, FSB (MD) 491,880 0.3 27 John Marshall Bancorp Inc. (VA) 430,564 0.3 28 Southern National Bncp of VA (VA) 407,428 0.3 29 FVCBankcorp Inc. (VA) 392,992 0.3 Other 8,703,727 5.6 Market Deposit Deposits Market Company ($000) Share (%) 1 Capital One Financial Corp. (VA) 57,835,363 19.8% 2 Bank of America Corporation (NC) 51,370,070 17.6% 3 Truist Financial Corp. (NC) 36,119,564 12.4% 4 Wells Fargo & Co. (CA) 33,180,886 11.4% 5 The PNC Finl Svcs Grp (PA) 15,954,639 5.5% 6 Atlantic Union Bkshs Corp. (VA) 13,700,557 4.7% 7 Citigroup Inc. (NY) 11,195,000 3.8% 8 United Bankshares Inc. (WV) 10,071,646 3.5% 9 Eagle Bancorp Inc (MD) 8,304,467 2.8% 10 M&T Bank Corp. (NY) 5,946,948 2.0% 11 The Toronto-Dominion Bank 5,911,518 2.0% 12 Forbright Inc. (MD) 5,593,845 1.9% 13 JPMorgan Chase & Co. (NY) 3,876,831 1.3% 14 Burke & Herbert Finl Svcs Corp (VA) 3,246,023 1.1% 15 HSBC Holdings plc 2,203,622 0.8% 16 FVCBankcorp Inc. (VA) 1,931,676 0.7% 17 Capital Bancorp Inc. (MD) 1,927,442 0.7% 18 John Marshall Bancorp Inc. (VA) 1,917,653 0.7% 19 MainStreet Bcshs (VA) 1,757,600 0.6% 20 Workers United (PA) 1,555,320 0.5% 21 WesBanco Inc. (WV) 1,427,302 0.5% 22 Chain Bridge Bancorp Inc. (VA) 1,303,526 0.4% 23 Pinnacle Financial Partners (TN) 995,074 0.3% 24 Freedom Finl Holdings Inc. (VA) 881,203 0.3% 25 ODNB Financial Corporation (VA) 840,397 0.3% 26 Shore Bancshares Inc. (MD) 813,492 0.3% 27 Eagle Financial Services Inc. (VA) 769,189 0.3% 28 Presidential Holdings Inc. (VA) 694,905 0.2% 29 Trustar Bank (VA) 693,142 0.2% Other 9,720,622 3.3% |
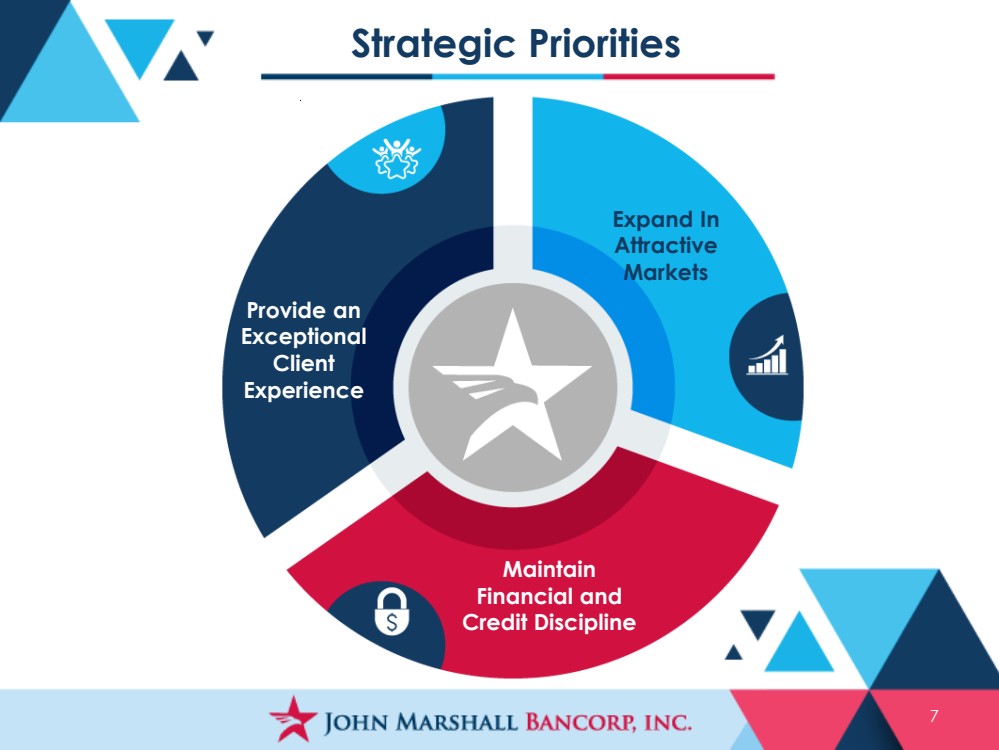
| Strategic Priorities 7 Provide an Exceptional Client Experience Expand In Attractive Markets Maintain Financial and Credit Discipline |
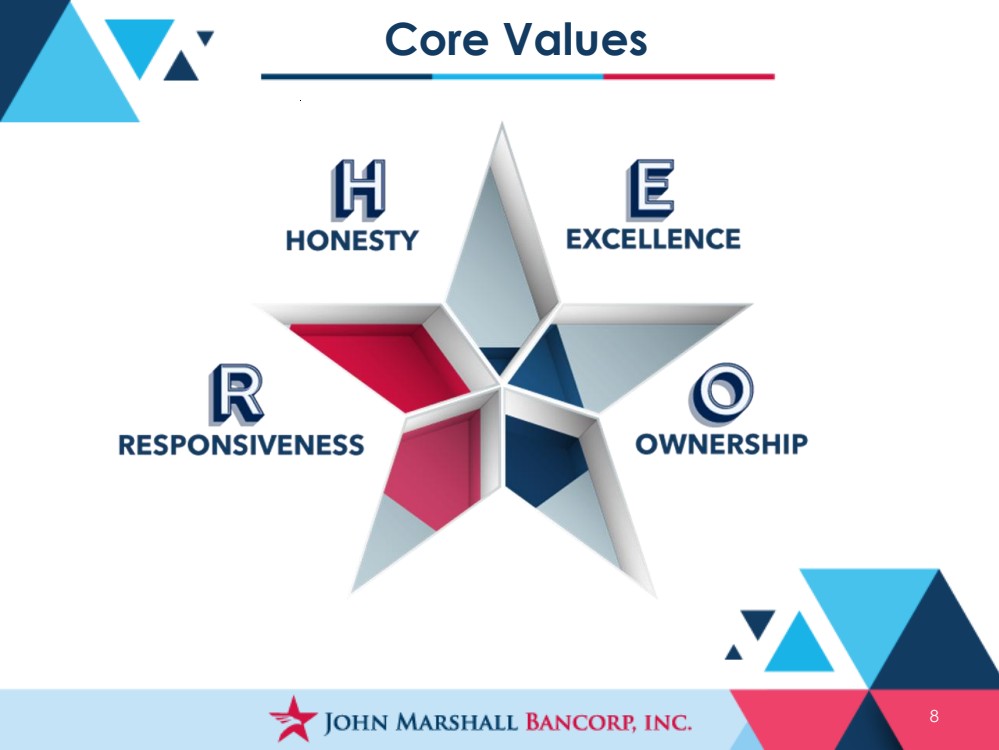
| Core Values 8 |
| Our Shareholder Value Proposition Rewarding Our Shareholders Attractive Market Credit Discipline Prime for Future Growth Experienced Management 9 |

| 10 Financial Performance |

| Financial Performance 11 Growth and Financial Performance Strong Capital Position Exceptional Asset Quality Liquid Balance Sheet Expense Management Competitive Shareholder Returns |
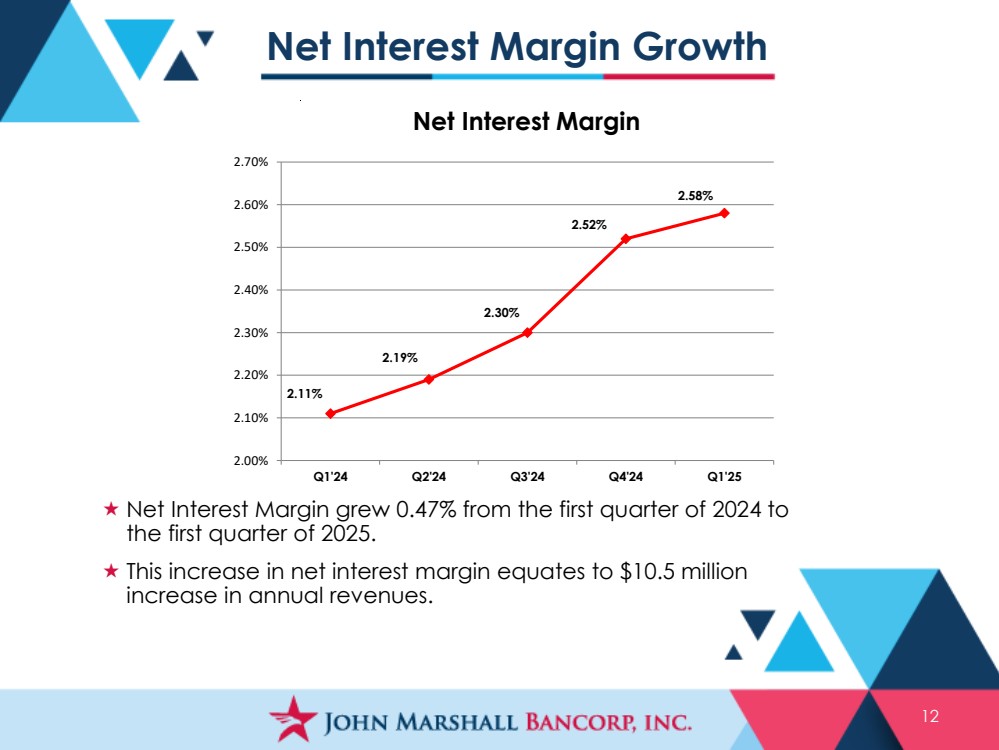
| Net Interest Margin Growth 12 Net Interest Margin 2.11% 2.19% 2.30% 2.52% 2.58% 2.00% 2.10% 2.20% 2.30% 2.40% 2.50% 2.60% 2.70% Q1'24 Q2'24 Q3'24 Q4'24 Q1'25 Net Interest Margin grew 0.47% from the first quarter of 2024 to the first quarter of 2025. This increase in net interest margin equates to $10.5 million increase in annual revenues. |
| Balance Sheet Growth 13 Dollars in millions Total Assets Gross Loans Deposits $1,175 $1,394 $1,582 $1,885 $2,149 $2,348 $2,243 $2,235 2017 2018 2019 2020 2021 2022 2023 2024 $1,007 $1,161 $1,326 $1,563 $1,666 $1,789 $1,860 $1,872 2017 2018 2019 2020 2021 2022 2023 2024 $897 $1,138 $1,309 $1,640 $1,882 $2,068 $1,907 $1,892 2017 2018 2019 2020 2021 2022 2023 2024 |

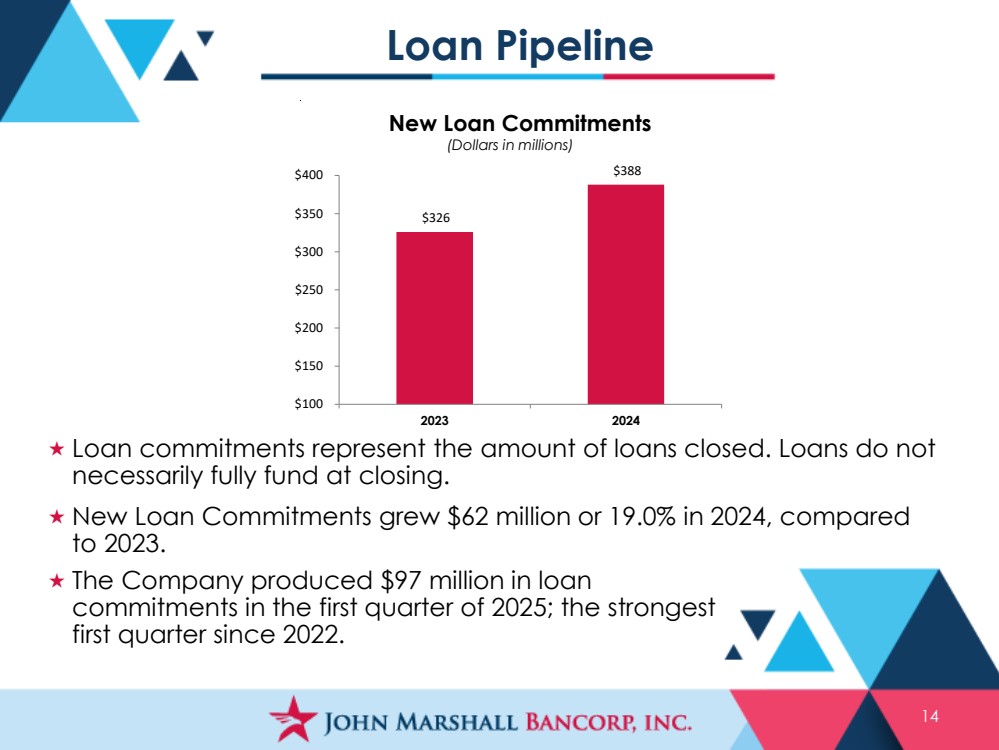
| Loan Pipeline 14 Loan commitments represent the amount of loans closed. Loans do not necessarily fully fund at closing. New Loan Commitments grew $62 million or 19.0% in 2024, compared to 2023. (Dollars in millions) $326 $388 $100 $150 $200 $250 $300 $350 $400 2023 2024 New Loan Commitments The Company produced $97 million in loan commitments in the first quarter of 2025; the strongest first quarter since 2022. |
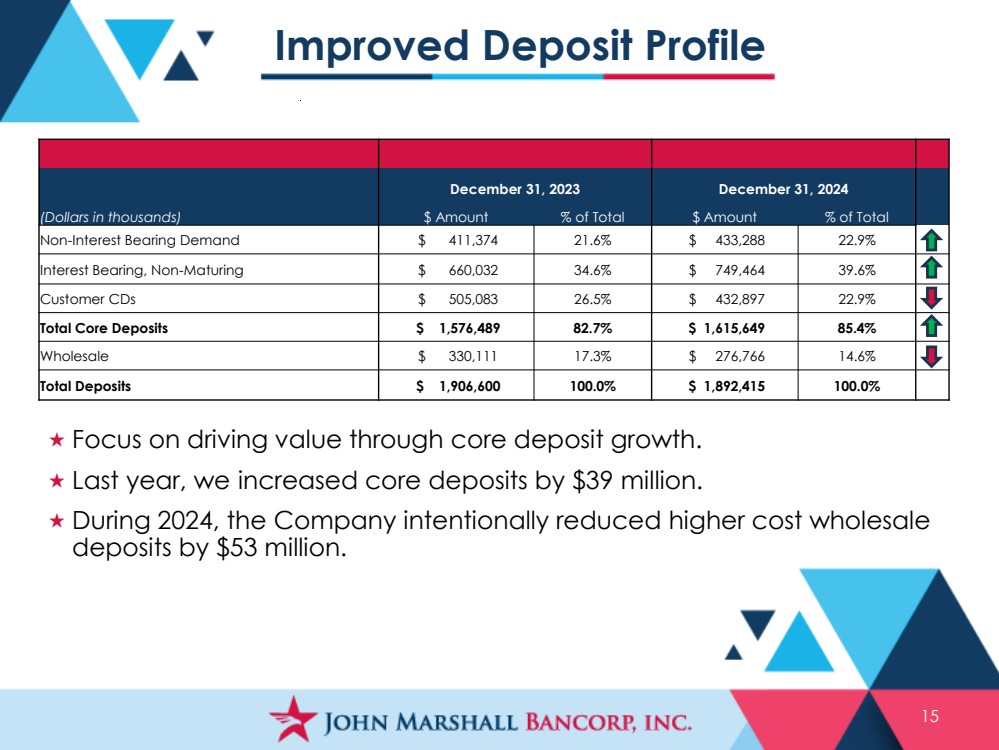
| Improved Deposit Profile 15 Focus on driving value through core deposit growth. Last year, we increased core deposits by $39 million. During 2024, the Company intentionally reduced higher cost wholesale deposits by $53 million. December 31, 2023 December 31, 2024 (Dollars in thousands) $ Amount % of Total $ Amount % of Total Non-Interest Bearing Demand $ 411,374 21.6% $ 433,288 22.9% Interest Bearing, Non-Maturing $ 660,032 34.6% $ 749,464 39.6% Customer CDs $ 505,083 26.5% $ 432,897 22.9% Total Core Deposits $ 1,576,489 82.7% $ 1,615,649 85.4% Wholesale $ 330,111 17.3% $ 276,766 14.6% Total Deposits $ 1,906,600 100.0% $ 1,892,415 100.0% |
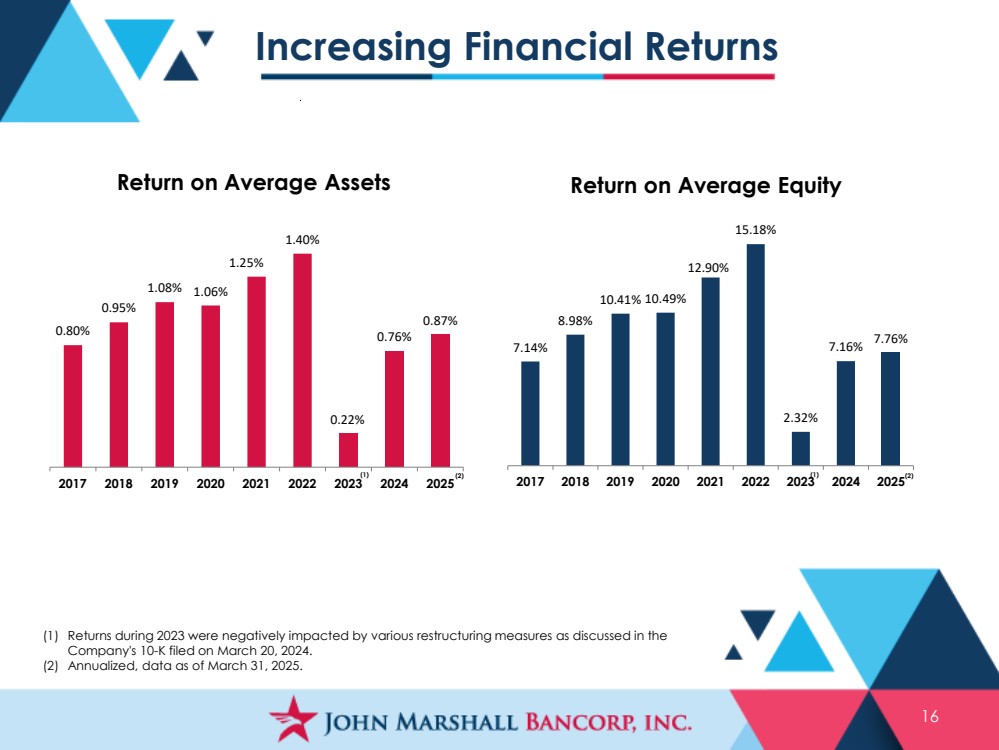
| Increasing Financial Returns 16 Return on Average Assets Return on Average Equity (1) Returns during 2023 were negatively impacted by various restructuring measures as discussed in the Company's 10-K filed on March 20, 2024. (2) Annualized, data as of March 31, 2025. (1) (1) 7.14% 8.98% 10.41% 10.49% 12.90% 15.18% 2.32% 7.16% 7.76% 2017 2018 2019 2020 2021 2022 2023 2024 2025 0.80% 0.95% 1.08% 1.06% 1.25% 1.40% 0.22% 0.76% 0.87% 2017 2018 2019 2020 2021 2022 2023 2024 2025 (2) (2) |
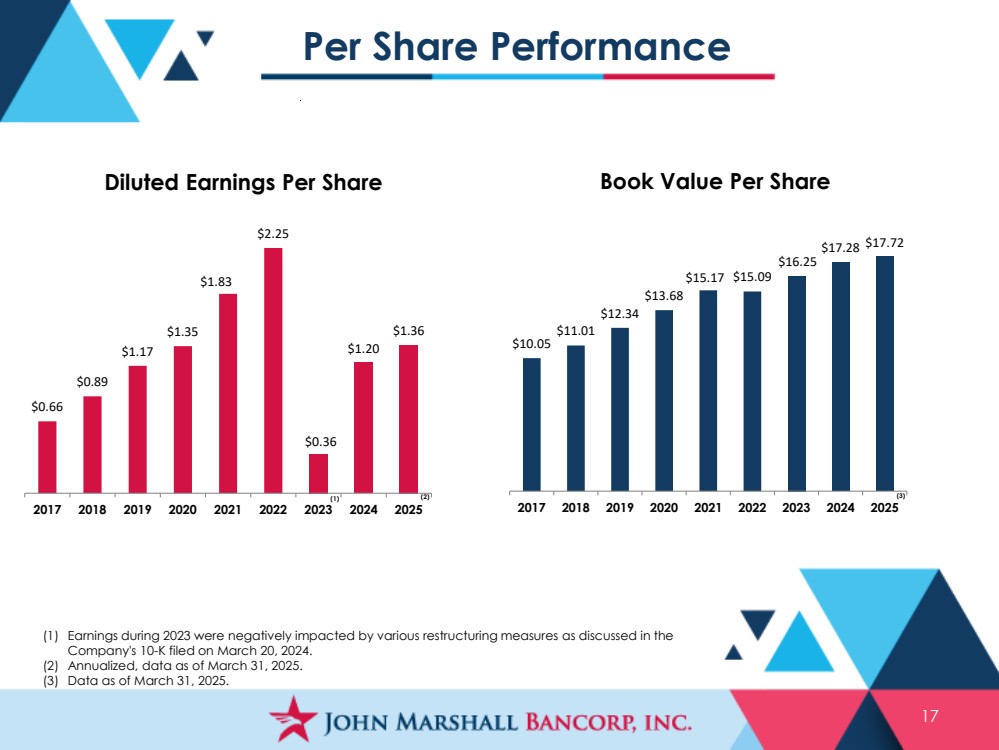
| Per Share Performance 17 Diluted Earnings Per Share (2) (3) (1) $0.66 $0.89 $1.17 $1.35 $1.83 $2.25 $0.36 $1.20 $1.36 2017 2018 2019 2020 2021 2022 2023 2024 2025 Book Value Per Share (1) Earnings during 2023 were negatively impacted by various restructuring measures as discussed in the Company's 10-K filed on March 20, 2024. (2) Annualized, data as of March 31, 2025. (3) Data as of March 31, 2025. $10.05 $11.01 $12.34 $13.68 $15.17 $15.09 $16.25 $17.28 $17.72 2017 2018 2019 2020 2021 2022 2023 2024 2025 |
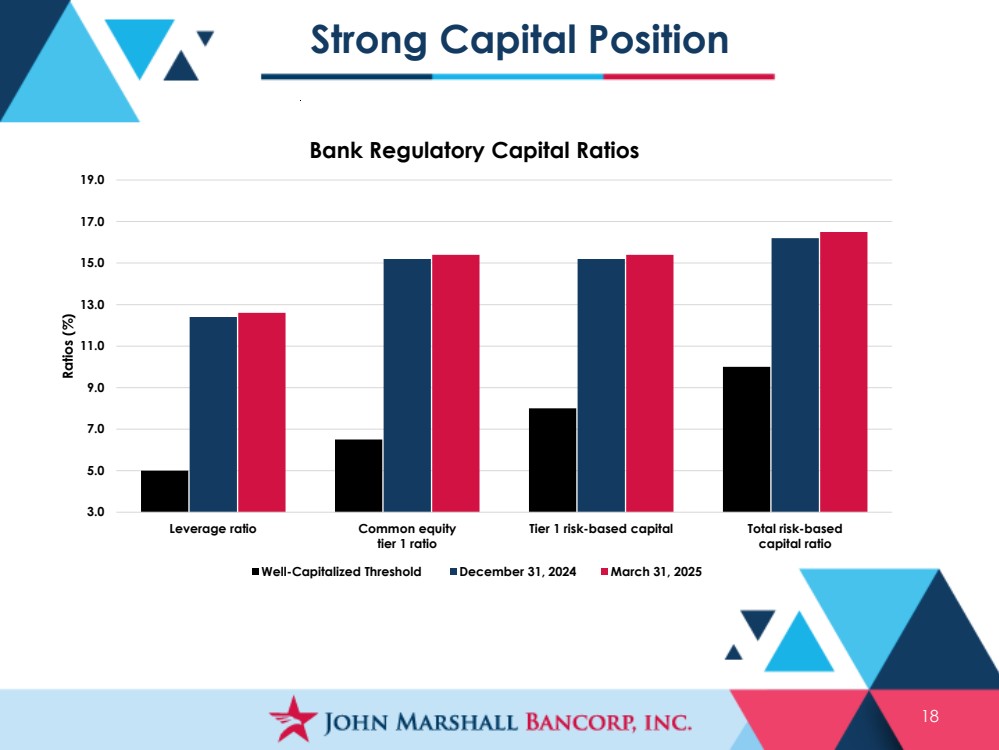
| Strong Capital Position 18 3.0 5.0 7.0 9.0 11.0 13.0 15.0 17.0 19.0 Leverage ratio Common equity tier 1 ratio Tier 1 risk-based capital Total risk-based capital ratio Ratios (%) Bank Regulatory Capital Ratios Well-Capitalized Threshold December 31, 2024 March 31, 2025 |
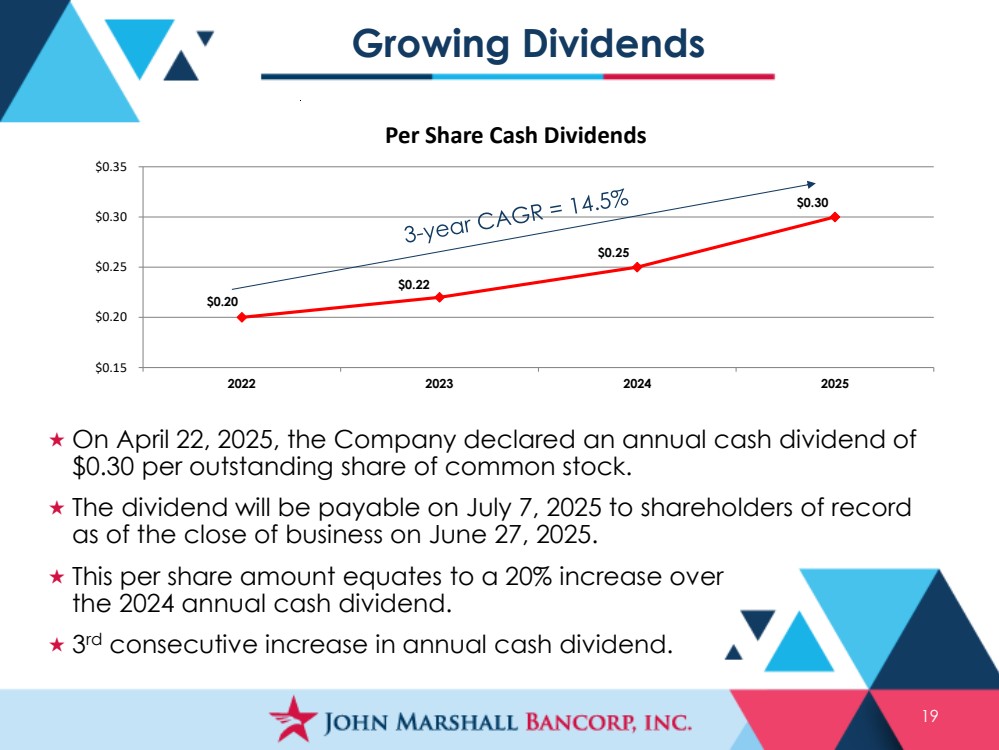
| Growing Dividends 19 $0.20 $0.22 $0.25 $0.30 $0.15 $0.20 $0.25 $0.30 $0.35 2022 2023 2024 2025 Per Share Cash Dividends On April 22, 2025, the Company declared an annual cash dividend of $0.30 per outstanding share of common stock. The dividend will be payable on July 7, 2025 to shareholders of record as of the close of business on June 27, 2025. This per share amount equates to a 20% increase over the 2024 annual cash dividend. 3 rd consecutive increase in annual cash dividend. |
| Capital Management: Share Repurchases 20 On July 23, 2024, the Company announced a share repurchase authorization of 700,000 shares. Through June 13, 2025, the Company had repurchased nearly 70,000 shares. The Company may selectively continue repurchasing shares subject to market conditions, securities laws, and capital management priorities, among other decision criteria. |
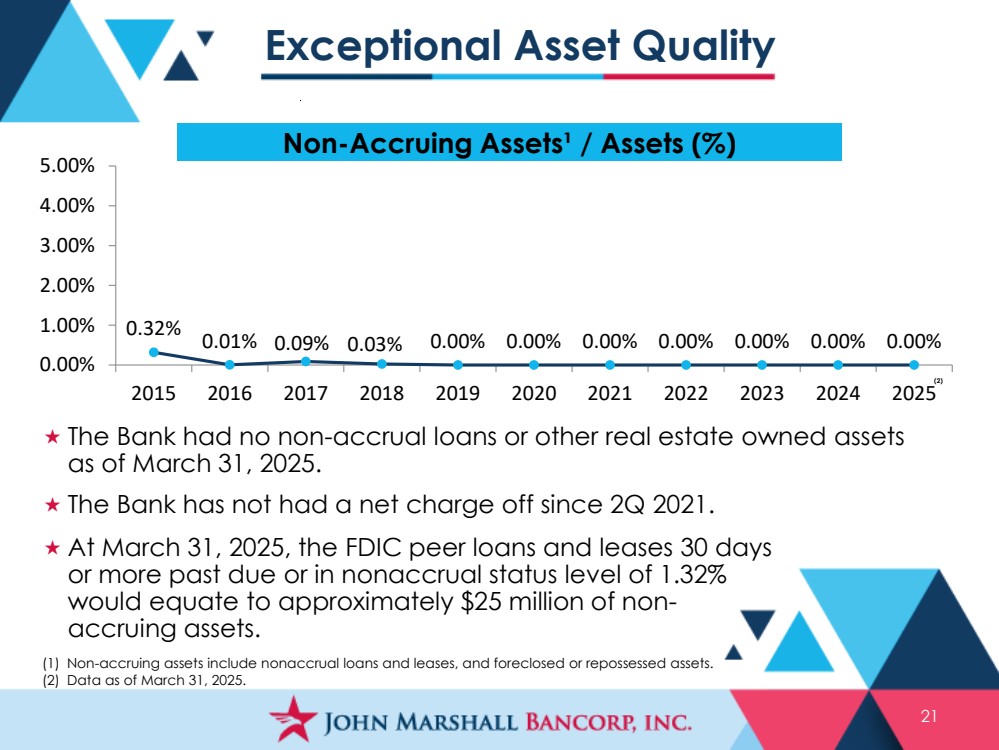
| Exceptional Asset Quality 21 Non-Accruing Assets¹ / Assets (%) (1) Non-accruing assets include nonaccrual loans and leases, and foreclosed or repossessed assets. (2) Data as of March 31, 2025. The Bank had no non-accrual loans or other real estate owned assets as of March 31, 2025. The Bank has not had a net charge off since 2Q 2021. At March 31, 2025, the FDIC peer loans and leases 30 days or more past due or in nonaccrual status level of 1.32% would equate to approximately $25 million of non-accruing assets. (2) 0.32% 0.01% 0.09% 0.03% 0.00% 0.00% 0.00% 0.00% 0.00% 0.00% 0.00% 0.00% 1.00% 2.00% 3.00% 4.00% 5.00% 2015 2016 2017 2018 2019 2020 2021 2022 2023 2024 2025 |
| Liquid Balance Sheet 22 Amounts noted above are as of March 31, 2025. 34.6% $786.9 Million Cash, unencumbered securities (at fair value), and secured borrowings as a percentage of total assets. |
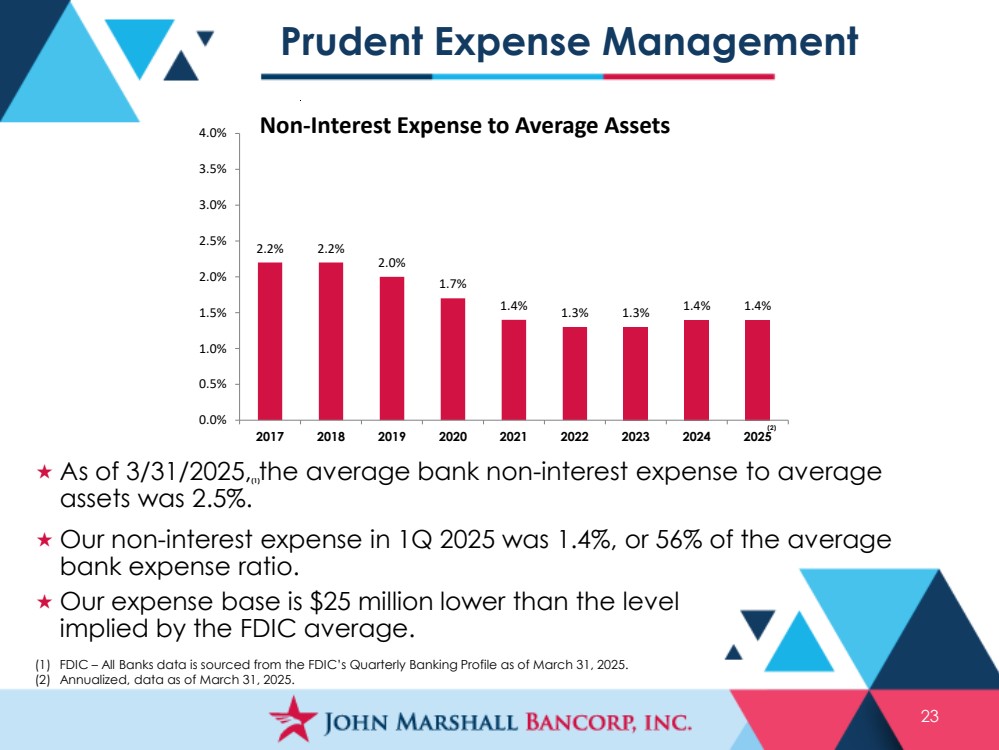
| Prudent Expense Management 23 2.2% 2.2% 2.0% 1.7% 1.4% 1.3% 1.3% 1.4% 1.4% 0.0% 0.5% 1.0% 1.5% 2.0% 2.5% 3.0% 3.5% 4.0% 2017 2018 2019 2020 2021 2022 2023 2024 2025 Non-Interest Expense to Average Assets As of 3/31/2025, the average bank non-interest expense to average assets was 2.5%. Our non-interest expense in 1Q 2025 was 1.4%, or 56% of the average bank expense ratio. (1) FDIC – All Banks data is sourced from the FDIC’s Quarterly Banking Profile as of March 31, 2025. (2) Annualized, data as of March 31, 2025. (2) (1) Our expense base is $25 million lower than the level implied by the FDIC average. |
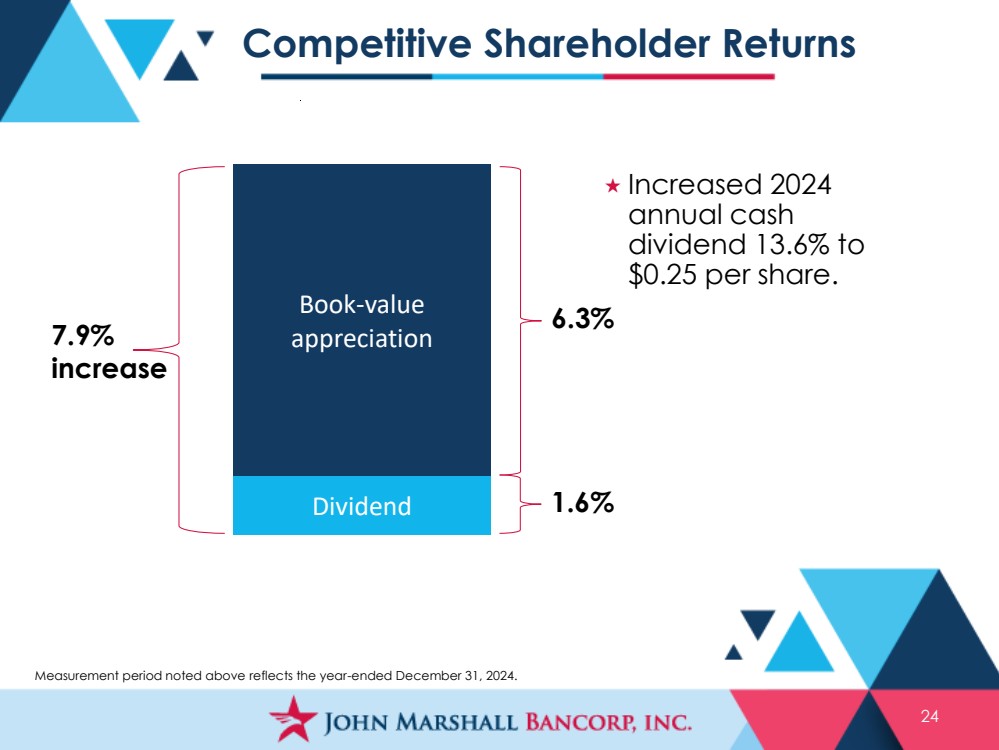
| Competitive Shareholder Returns 24 Dividend Book-value appreciation 1.6% 7.9% increase 6.3% Increased 2024 annual cash dividend 13.6% to $0.25 per share. Measurement period noted above reflects the year-ended December 31, 2024. |
| 25 2024 Stock Price Performance |

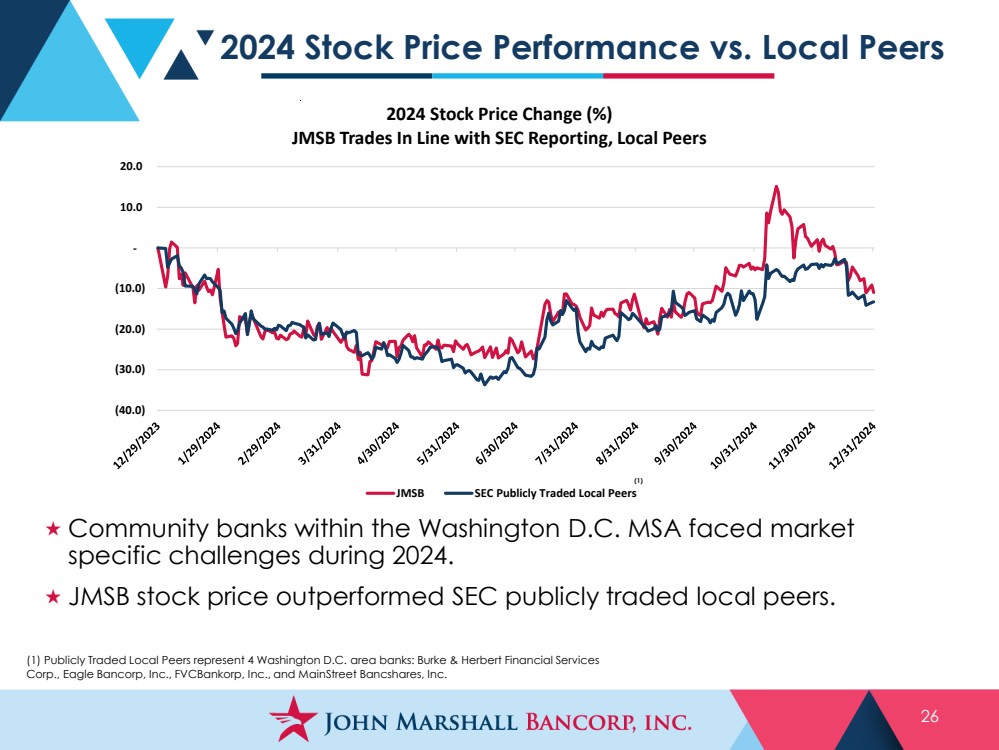
| 2024 Stock Price Performance vs. Local Peers 26 (40.0) (30.0) (20.0) (10.0) - 10.0 20.0 2024 Stock Price Change (%) JMSB Trades In Line with SEC Reporting, Local Peers JMSB SEC Publicly Traded Local Peers (1) (1) Publicly Traded Local Peers represent 4 Washington D.C. area banks: Burke & Herbert Financial Services Corp., Eagle Bancorp, Inc., FVCBankorp, Inc., and MainStreet Bancshares, Inc. Community banks within the Washington D.C. MSA faced market specific challenges during 2024. JMSB stock price outperformed SEC publicly traded local peers. |
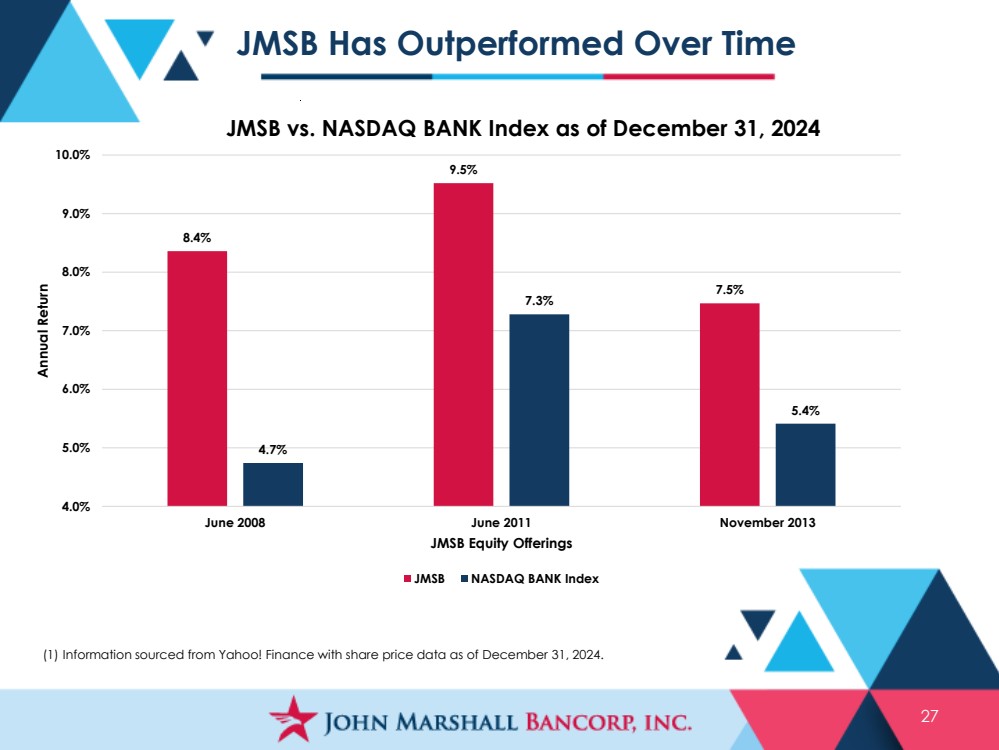
| JMSB Has Outperformed Over Time 27 (1) Information sourced from Yahoo! Finance with share price data as of December 31, 2024. 8.4% 9.5% 7.5% 4.7% 7.3% 5.4% 4.0% 5.0% 6.0% 7.0% 8.0% 9.0% 10.0% June 2008 June 2011 November 2013 Annual Return JMSB Equity Offerings JMSB vs. NASDAQ BANK Index as of December 31, 2024 JMSB NASDAQ BANK Index |
| 28 2025 Outlook |

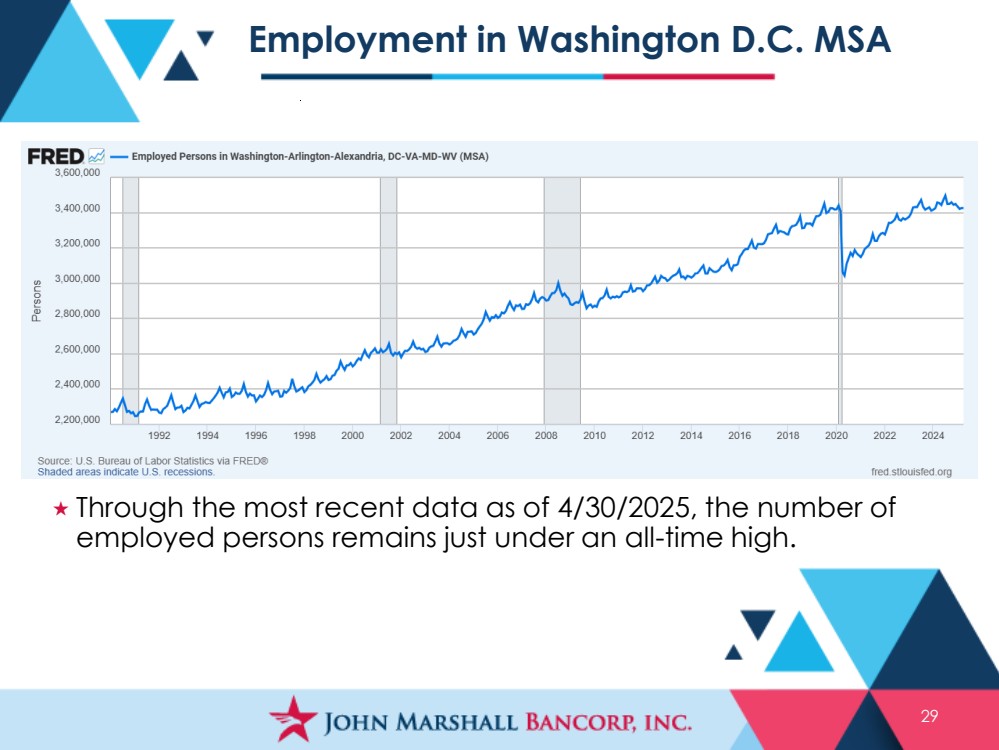
| Employment in Washington D.C. MSA 29 Through the most recent data as of 4/30/2025, the number of employed persons remains just under an all-time high. |
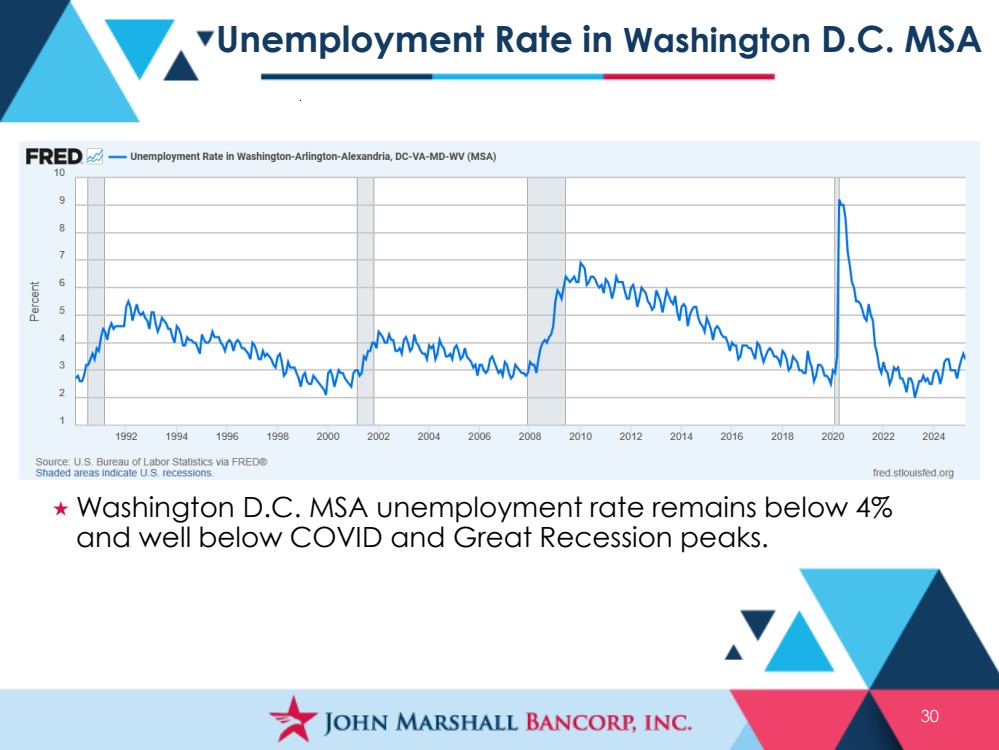
| Unemployment Rate in Washington D.C. MSA 30 Washington D.C. MSA unemployment rate remains below 4% and well below COVID and Great Recession peaks. |
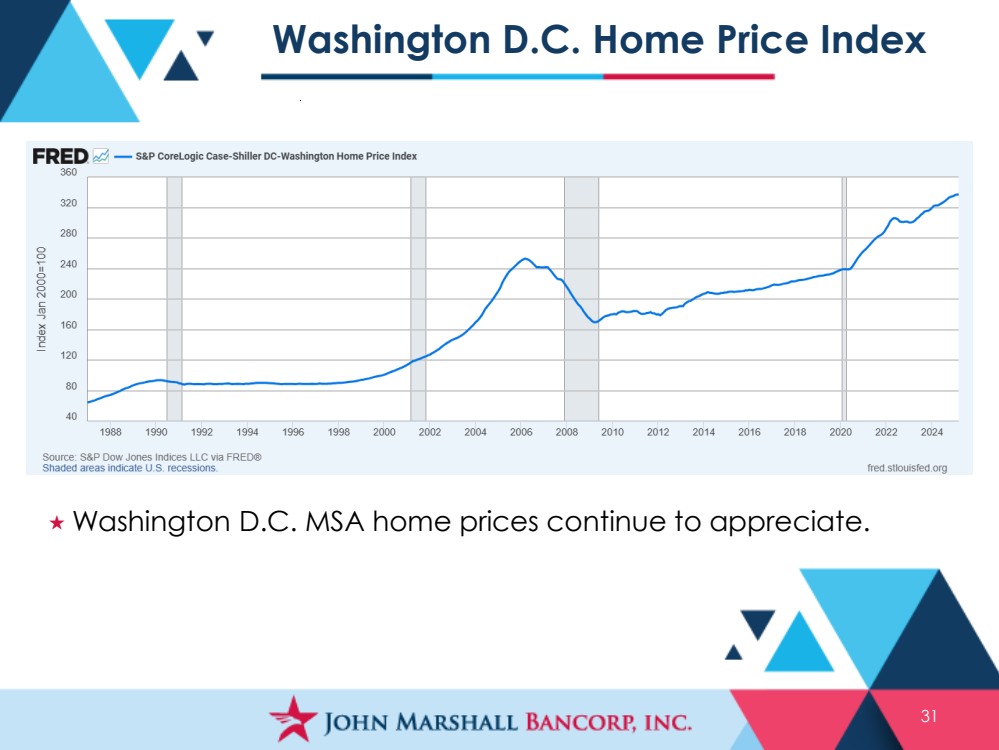
| Washington D.C. Home Price Index 31 Washington D.C. MSA home prices continue to appreciate. |
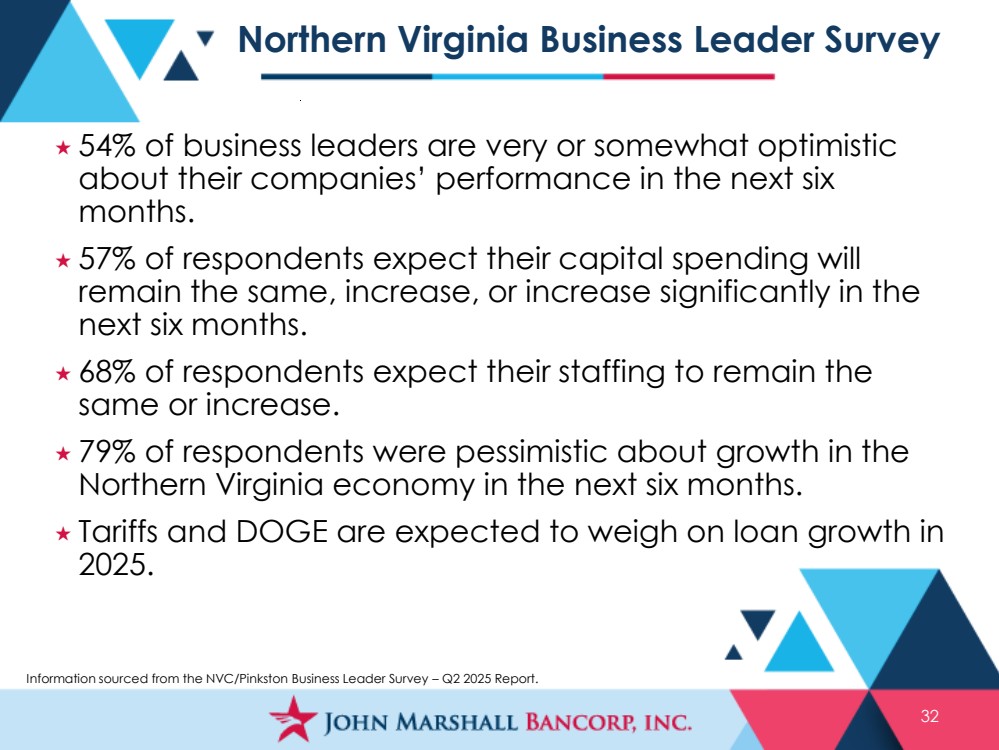
| Northern Virginia Business Leader Survey 32 54% of business leaders are very or somewhat optimistic about their companies’ performance in the next six months. 57% of respondents expect their capital spending will remain the same, increase, or increase significantly in the next six months. 68% of respondents expect their staffing to remain the same or increase. 79% of respondents were pessimistic about growth in the Northern Virginia economy in the next six months. Tariffs and DOGE are expected to weigh on loan growth in 2025. Information sourced from the NVC/Pinkston Business Leader Survey – Q2 2025 Report. |
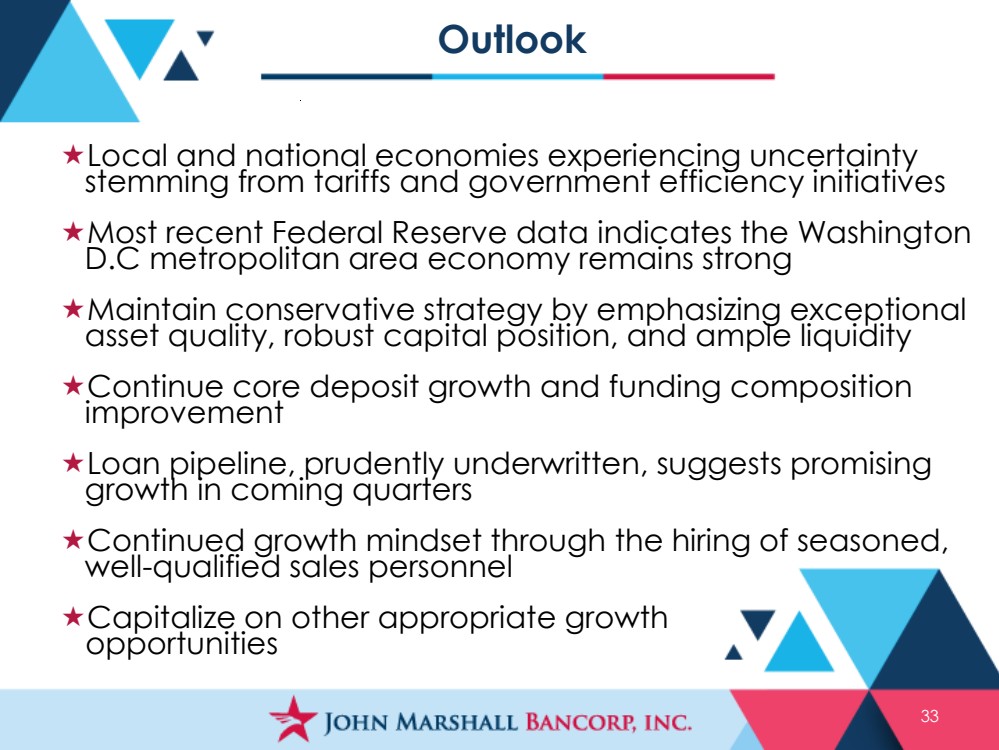
| Outlook 33 Local and national economies experiencing uncertainty stemming from tariffs and government efficiency initiatives Most recent Federal Reserve data indicates the Washington D.C metropolitan area economy remains strong Maintain conservative strategy by emphasizing exceptional asset quality, robust capital position, and ample liquidity Continue core deposit growth and funding composition improvement Loan pipeline, prudently underwritten, suggests promising growth in coming quarters Continued growth mindset through the hiring of seasoned, well-qualified sales personnel Capitalize on other appropriate growth opportunities |