Shareholder Report
Apr. 30, 2025
USD ($)
Holding
What were the fund costs during the last year ?
(Based on a hypothetical $10,000 investment)
| Fund | Costs of a $10,000 investment | Costs paid as a percentage of a $10,000 investment |
||
| Multifactor Large Cap ETF/JHML | $30 | 0.29% |
Management’s Discussion of Fund Performance
SUMMARY OF RESULTS
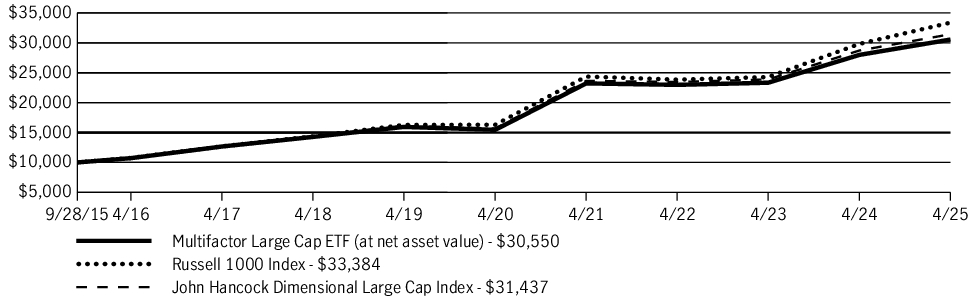
Multifactor Large Cap ETF (JHML) returned 9.16% for the year ended April 30, 2025. U.S. equities delivered a healthy gain in the 12 months ended April 30, 2025. Stocks moved steadily higher through mid-February on optimism about artificial intelligence and strength in the United States’ economic growth versus the rest of the world. However, the market subsequently gave back some of its prior gain on worries about the economic impact of protectionist U.S. trade policy.
TOP PERFORMANCE CONTRIBUTORS
Financial stocks | Financials made the largest contribution to absolute performance due to their strong return and sizable portfolio weighting. Berkshire Hathaway, Inc. was the leading contributor in the sector, followed by JPMorgan Chase & Co. and positions in several credit card providers.
Information technology | NVIDIA Corp., Apple, Inc., Broadcom, Inc., and Palantir Technologies, Inc. all contributed positively.
Other areas of strength | Holdings in the communication services, industrials, and utilities sectors, among others, further added to absolute performance. Meta Platforms, Inc. and Netflix, Inc. were leading contributors in communication services.
TOP PERFORMANCE DETRACTORS
Energy | A number of stocks in the sector posted losses due to a steady decline in oil prices. ConocoPhillips and the refiner Valero Energy Corp. were among the several modest detractors in the sector.
Certain individual stocks | The pharmaceutical giant Merck & Company, Inc. and the semiconductor stock Advanced Micro Devices, Inc. were the largest detractors in the fund as a whole.
The views expressed in this report are exclusively those of the portfolio management team at Dimensional Fund Advisors LP, and are subject to change. They are not meant as investment advice.
Fund Performance
The following graph compares the initial and subsequent account values at the end of each of the most recently completed 10 fiscal years of the fund (or for the life of the fund, if shorter). It assumes a $10,000 initial investment in the fund and in an appropriate, broad-based securities market index for the same period.
GROWTH OF $10,000
| AVERAGE ANNUAL TOTAL RETURN | 1 Year | 5 Years | Since inception |
| Multifactor Large Cap ETF (at net asset value) | 9.16% | 14.60% | 12.35% |
| Russell 1000 Index | 11.94% | 15.42% | 13.40% |
| John Hancock Dimensional Large Cap Index | 9.46% | 14.93% | 12.69% |
Fund Statistics
| Fund net assets | $891,550,519 |
| Total number of portfolio holdings | 782 |
| Total advisory fees paid (net) | $2,172,158 |
| Portfolio turnover rate | 4% |
Graphical Representation of Holdings
The tables below show the investment makeup of the fund, representing a percentage of the total net assets of the fund.
Top Ten Holdings
| Microsoft Corp. | 3.8% |
| Apple, Inc. | 3.8% |
| NVIDIA Corp. | 2.9% |
| Amazon.com, Inc. | 2.6% |
| Alphabet, Inc., Class A | 1.8% |
| Meta Platforms, Inc., Class A | 1.8% |
| Berkshire Hathaway, Inc., Class B | 1.3% |
| Broadcom, Inc. | 1.2% |
| JPMorgan Chase & Co. | 1.2% |
| Eli Lilly & Company | 1.1% |
Sector Composition
| Information technology | 23.0% |
| Financials | 16.4% |
| Industrials | 12.1% |
| Health care | 10.8% |
| Consumer discretionary | 10.0% |
| Communication services | 7.3% |
| Consumer staples | 6.2% |
| Utilities | 4.3% |
| Energy | 3.6% |
| Materials | 3.3% |
| Real estate | 2.9% |
| Short-term investments and other | 0.1% |
Holdings may not have been held by the fund for the entire period and are subject to change without notice. Portfolio composition is subject to review in accordance with the fund’s investment strategy and may vary in the future. Current and future portfolio holdings are subject to risk and may change at any time.
Top Ten Holdings
| Microsoft Corp. | 3.8% |
| Apple, Inc. | 3.8% |
| NVIDIA Corp. | 2.9% |
| Amazon.com, Inc. | 2.6% |
| Alphabet, Inc., Class A | 1.8% |
| Meta Platforms, Inc., Class A | 1.8% |
| Berkshire Hathaway, Inc., Class B | 1.3% |
| Broadcom, Inc. | 1.2% |
| JPMorgan Chase & Co. | 1.2% |
| Eli Lilly & Company | 1.1% |
What were the fund costs during the last year ?
(Based on a hypothetical $10,000 investment)
| Fund | Costs of a $10,000 investment | Costs paid as a percentage of a $10,000 investment |
||
| Multifactor Developed International ETF/JHMD | $41 | 0.39% |
Management’s Discussion of Fund Performance
SUMMARY OF RESULTS
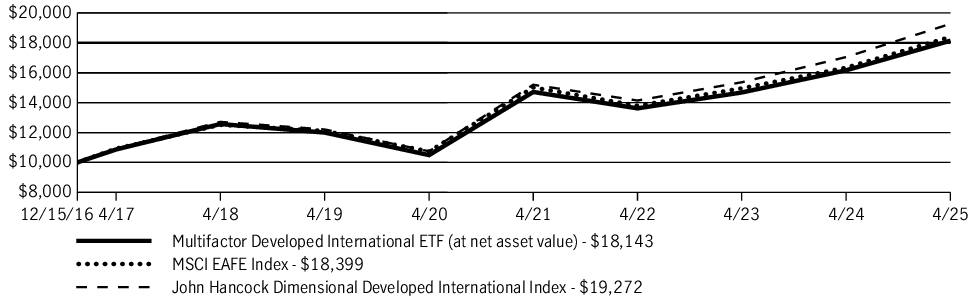
Multifactor Developed International ETF (JHMD) returned 12.23% for the year ended April 30, 2025. International equities delivered strong, double-digit gains in the 12 months ended April 30, 2025, albeit with elevated volatility late in the period in response to shifts in U.S. trade policy. European stocks performed particularly well, reflecting positive sentiment regarding falling interest rates and supportive fiscal policy.
TOP PERFORMANCE CONTRIBUTORS
Financials | Financial stocks, particularly those based in Europe, made the largest contribution to absolute performance due to their strong return and sizable portfolio weighting. Swiss Re AG, HSBC Holdings PLC, and Deutsche Bank AG were among the many meaningful contributors in this area.
Industrials | European industrials also made a strong contribution, led by Rheinmetall AG and Vinci SA.
Communication services | European stocks led the way in this sector, as well, with the largest contributions coming from Deutsche Telecom AG and Orange SA.
TOP PERFORMANCE DETRACTORS
Materials and energy | Commodity-sensitive stocks, in general, lagged in the period. Glencore PLC and TotalEnergies SE were the largest detractors in the two sectors, respectively.
Other areas of weakness | Holdings in the information technology sector combined for a negative total return, primarily due to downturns in the semiconductor stocks ASML Holding NV and STMicroelectronics NV. The pharmaceutical stock Novo Nordisk A/S was the largest detractor in the fund as a whole.
The views expressed in this report are exclusively those of the portfolio management team at Dimensional Fund Advisors LP, and are subject to change. They are not meant as investment advice.
Fund Performance
The following graph compares the initial and subsequent account values at the end of each of the most recently completed 10 fiscal years of the fund (or for the life of the fund, if shorter). It assumes a $10,000 initial investment in the fund and in an appropriate, broad-based securities market index for the same period.
GROWTH OF $10,000
| AVERAGE ANNUAL TOTAL RETURN | 1 Year | 5 Years | Since inception |
| Multifactor Developed International ETF (at net asset value) | 12.23% | 11.58% | 7.37% |
| MSCI EAFE Index | 12.57% | 11.37% | 7.55% |
| John Hancock Dimensional Developed International Index | 13.02% | 12.40% | 8.15% |
Fund Statistics
| Fund net assets | $679,677,172 |
| Total number of portfolio holdings | 585 |
| Total advisory fees paid (net) | $2,189,125 |
| Portfolio turnover rate | 13% |
Graphical Representation of Holdings
The tables below show the investment makeup of the fund, representing a percentage of the total net assets of the fund.
Top Ten Holdings
| Vinci SA | 1.7% |
| Novartis AG | 1.5% |
| Shell PLC | 1.3% |
| TotalEnergies SE | 1.2% |
| ASML Holding NV | 1.0% |
| BNP Paribas SA | 1.0% |
| Nestle SA | 0.9% |
| Novo Nordisk A/S, B Shares | 0.9% |
| Danone SA | 0.8% |
| Deutsche Telekom AG | 0.8% |
Sector Composition
| Financials | 23.2% |
| Industrials | 18.6% |
| Consumer discretionary | 9.7% |
| Health care | 9.1% |
| Consumer staples | 8.6% |
| Materials | 7.2% |
| Communication services | 6.0% |
| Information technology | 5.6% |
| Energy | 4.7% |
| Utilities | 4.4% |
| Real estate | 1.8% |
| Short-term investments and other | 1.1% |
Country Composition
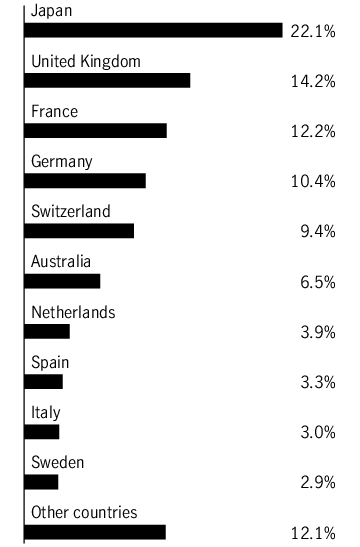
Holdings may not have been held by the fund for the entire period and are subject to change without notice. Portfolio composition is subject to review in accordance with the fund’s investment strategy and may vary in the future. Current and future portfolio holdings are subject to risk and may change at any time.
Top Ten Holdings
| Vinci SA | 1.7% |
| Novartis AG | 1.5% |
| Shell PLC | 1.3% |
| TotalEnergies SE | 1.2% |
| ASML Holding NV | 1.0% |
| BNP Paribas SA | 1.0% |
| Nestle SA | 0.9% |
| Novo Nordisk A/S, B Shares | 0.9% |
| Danone SA | 0.8% |
| Deutsche Telekom AG | 0.8% |
What were the fund costs during the last year ?
(Based on a hypothetical $10,000 investment)
| Fund | Costs of a $10,000 investment | Costs paid as a percentage of a $10,000 investment |
||
| Multifactor Mid Cap ETF/JHMM | $42 | 0.41% |
Management’s Discussion of Fund Performance
SUMMARY OF RESULTS
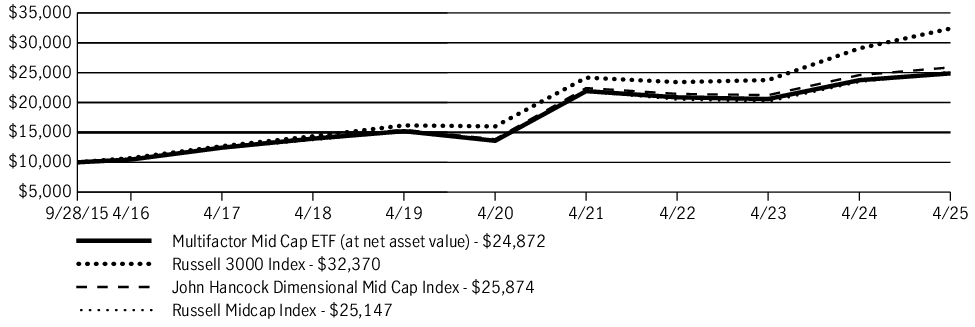
Multifactor Mid Cap ETF (JHMM) returned 4.79% for the year ended April 30, 2025. Mid-cap stocks posted healthy gains in the 12 months ended April 30, 2025, but they finished well off of their intra-period high. After performing well until mid-January, the category fell sharply through early April on concerns that protectionist trade policy would pressure economic growth. Mid-cap stocks staged an impressive rebound in the final weeks of the period, however, allowing the asset class to finish in positive territory.
TOP PERFORMANCE CONTRIBUTORS
Financial stocks | Financials made the largest contribution to absolute performance due to their strong return and sizable portfolio weighting. Robinhood Markets, Inc. was a top performer, as were holdings in a number of non-bank financials.
Utilities | While the sector had only a modest portfolio weighting, it was nonetheless a sizable contributor due to the strong performance of the fund’s holdings. Vistra Corp., which was seen as a beneficiary of AI demand, was the leading contributor.
Other areas of strength | Holdings in the real estate, communication services, and information technology sectors, among others, further added to absolute performance. The technology stock AppLovin Corp. was the largest contributor in the portfolio as a whole.
TOP PERFORMANCE DETRACTORS
Materials and energy | Commodity-sensitive stocks, in general, lagged the broader mid-cap category in the period. Celanese Corp. and Diamondback Energy, Inc. were the largest detractors in the two sectors, respectively.
Healthcare | The fund’s holdings in the sector combined for a small loss and detracted from absolute performance.
The views expressed in this report are exclusively those of the portfolio management team at Dimensional Fund Advisors LP, and are subject to change. They are not meant as investment advice.
Fund Performance
The following graph compares the initial and subsequent account values at the end of each of the most recently completed 10 fiscal years of the fund (or for the life of the fund, if shorter). It assumes a $10,000 initial investment in the fund and in an appropriate, broad-based securities market index for the same period.
GROWTH OF $10,000
| AVERAGE ANNUAL TOTAL RETURN | 1 Year | 5 Years | Since inception |
| Multifactor Mid Cap ETF (at net asset value) | 4.79% | 12.83% | 9.97% |
| Russell 3000 Index | 11.40% | 15.12% | 13.03% |
| John Hancock Dimensional Mid Cap Index | 5.23% | 13.30% | 10.42% |
| Russell Midcap Index | 7.33% | 12.96% | 10.09% |
Fund Statistics
| Fund net assets | $3,790,239,969 |
| Total number of portfolio holdings | 664 |
| Total advisory fees paid (net) | $14,221,574 |
| Portfolio turnover rate | 12% |
Graphical Representation of Holdings
The tables below show the investment makeup of the fund, representing a percentage of the total net assets of the fund.
Top Ten Holdings
| United Rentals, Inc. | 0.5% |
| The Hartford Financial Services Group, Inc. | 0.5% |
| Vistra Corp. | 0.5% |
| Fastenal Company | 0.5% |
| Fair Isaac Corp. | 0.5% |
| Take-Two Interactive Software, Inc. | 0.4% |
| Cencora, Inc. | 0.4% |
| Cheniere Energy, Inc. | 0.4% |
| Entergy Corp. | 0.4% |
| AMETEK, Inc. | 0.4% |
Sector Composition
| Industrials | 19.8% |
| Financials | 16.4% |
| Information technology | 13.1% |
| Consumer discretionary | 10.9% |
| Health care | 10.5% |
| Utilities | 6.0% |
| Real estate | 5.9% |
| Materials | 5.6% |
| Consumer staples | 4.7% |
| Energy | 4.0% |
| Communication services | 3.0% |
| Short-term investments and other | 0.1% |
Holdings may not have been held by the fund for the entire period and are subject to change without notice. Portfolio composition is subject to review in accordance with the fund’s investment strategy and may vary in the future. Current and future portfolio holdings are subject to risk and may change at any time.
Top Ten Holdings
| United Rentals, Inc. | 0.5% |
| The Hartford Financial Services Group, Inc. | 0.5% |
| Vistra Corp. | 0.5% |
| Fastenal Company | 0.5% |
| Fair Isaac Corp. | 0.5% |
| Take-Two Interactive Software, Inc. | 0.4% |
| Cencora, Inc. | 0.4% |
| Cheniere Energy, Inc. | 0.4% |
| Entergy Corp. | 0.4% |
| AMETEK, Inc. | 0.4% |
What were the fund costs during the last year ?
(Based on a hypothetical $10,000 investment)
| Fund | Costs of a $10,000 investment | Costs paid as a percentage of a $10,000 investment |
||
| Multifactor Small Cap ETF/JHSC | $42 | 0.42% |
Management’s Discussion of Fund Performance
SUMMARY OF RESULTS
Multifactor Small Cap ETF (JHSC) returned 0.43% for the year ended April 30, 2025. Small-cap stocks produced a narrow gain in the 12 months ended April 30, 2025. After performing well through the end of 2024, small-cap stocks declined steadily until early April on concerns that protectionist trade policy would pressure economic growth. However, a late rally allowed the category to finish in positive territory for the full period.
TOP PERFORMANCE CONTRIBUTORS
Financial stocks | Financials made the largest contribution to absolute performance due to their strong return and sizable portfolio weighting. Western Alliance Bancorp and Axis Capital Holdings, Ltd. were among the top performers.
Healthcare | The sector, in general, benefited from its defensive nature. Intra-Cellular Therapies, Inc. was the top contributor in both healthcare and the fund as a whole.
TOP PERFORMANCE DETRACTORS
Energy | Small-cap energy stocks experienced sizable losses amid a steady decline in oil prices. Weatherford International PLC and Murphy Oil Corp. were among the many detractors in the sector.
Materials | The sector lagged due to volatility in commodity prices and the softer economic outlook. The chemical producer Olin Corp. was the leading detractor.
Other areas of weakness | Holdings in the information technology, industrials, and consumer discretionary sectors finished in negative territory. The biopharmaceutical company Viking Therapeutics, Inc. was the largest individual detractor.
The views expressed in this report are exclusively those of the portfolio management team at Dimensional Fund Advisors LP, and are subject to change. They are not meant as investment advice.
Fund Performance
The following graph compares the initial and subsequent account values at the end of each of the most recently completed 10 fiscal years of the fund (or for the life of the fund, if shorter). It assumes a $10,000 initial investment in the fund and in an appropriate, broad-based securities market index for the same period.
GROWTH OF $10,000
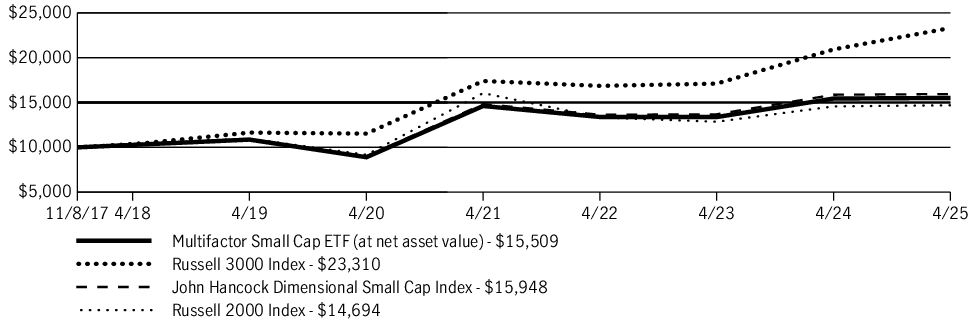
| AVERAGE ANNUAL TOTAL RETURN | 1 Year | 5 Years | Since inception |
| Multifactor Small Cap ETF (at net asset value) | 0.43% | 11.74% | 6.04% |
| Russell 3000 Index | 11.40% | 15.12% | 11.98% |
| John Hancock Dimensional Small Cap Index | 0.50% | 12.15% | 6.44% |
| Russell 2000 Index | 0.87% | 9.88% | 5.28% |
Fund Statistics
| Fund net assets | $484,048,518 |
| Total number of portfolio holdings | 467 |
| Total advisory fees paid (net) | $1,729,405 |
| Portfolio turnover rate | 66% |
Graphical Representation of Holdings
The tables below show the investment makeup of the fund, representing a percentage of the total net assets of the fund.
Top Ten Holdings
| Agree Realty Corp. | 0.5% |
| ExlService Holdings, Inc. | 0.5% |
| Planet Fitness, Inc., Class A | 0.5% |
| REVOLUTION Medicines, Inc. | 0.5% |
| CommVault Systems, Inc. | 0.5% |
| Esab Corp. | 0.5% |
| Casella Waste Systems, Inc., Class A | 0.5% |
| The AZEK Company, Inc. | 0.5% |
| UGI Corp. | 0.5% |
| Axis Capital Holdings, Ltd. | 0.5% |
Sector Composition
| Industrials | 21.6% |
| Financials | 20.2% |
| Consumer discretionary | 13.1% |
| Information technology | 12.2% |
| Real estate | 7.2% |
| Health care | 7.0% |
| Materials | 5.3% |
| Utilities | 4.7% |
| Energy | 3.8% |
| Consumer staples | 2.2% |
| Communication services | 1.9% |
| Short-term investments and other | 0.8% |
Holdings may not have been held by the fund for the entire period and are subject to change without notice. Portfolio composition is subject to review in accordance with the fund’s investment strategy and may vary in the future. Current and future portfolio holdings are subject to risk and may change at any time.
Top Ten Holdings
| Agree Realty Corp. | 0.5% |
| ExlService Holdings, Inc. | 0.5% |
| Planet Fitness, Inc., Class A | 0.5% |
| REVOLUTION Medicines, Inc. | 0.5% |
| CommVault Systems, Inc. | 0.5% |
| Esab Corp. | 0.5% |
| Casella Waste Systems, Inc., Class A | 0.5% |
| The AZEK Company, Inc. | 0.5% |
| UGI Corp. | 0.5% |
| Axis Capital Holdings, Ltd. | 0.5% |
What were the fund costs during the last year ?
(Based on a hypothetical $10,000 investment)
| Fund | Costs of a $10,000 investment | Costs paid as a percentage of a $10,000 investment |
||
| International High Dividend ETF/JHID | $49 | 0.46% |
Management’s Discussion of Fund Performance
SUMMARY OF RESULTS
International High Dividend ETF (JHID) returned 13.84% for the year ended April 30, 2025. International equities delivered strong, double-digit gains in the 12 months ended April 30, 2025, albeit with elevated volatility late in the period in response to shifts in U.S. trade policy. Certain European stocks performed particularly well, reflecting positive sentiment regarding falling interest rates and supportive fiscal policy.
TOP PERFORMANCE CONTRIBUTORS
Financial stocks | Financials made the largest contribution to absolute performance due to their strong return and sizable portfolio weighting. The Italian stocks Poste Italiane SpA and Generali were the leading individual contributors in the sector.
Consumer staples | The U.K.-based tobacco producers British American Tobacco PLC and Imperial Brands PLC were the top contributors in the sector. The British supermarket operator Tesco PLC was also a key contributor.
European stocks | At the country level, Italy and the United Kingdom contributed most on an absolute basis.
TOP PERFORMANCE DETRACTORS
Consumer discretionary | Automotive stocks, which were hurt by sluggish global sales trends and concerns about the impact of U.S. tariffs, were the most notable detractors. The German automakers Volkswagen AG, Bayerische Motoren Werke AG, and Mercedes-Benz Group AG all weighed on fund performance in the period.
Industrials | Japanese companies, including Mitsubishi Corp. and Mitsui & Company, Ltd., were the primary source of weakness in the sector.
The views expressed in this report are exclusively those of the portfolio management team at Manulife Investment Management (US) LLC, and are subject to change. They are not meant as investment advice.
Fund Performance
The following graph compares the initial and subsequent account values at the end of each of the most recently completed 10 fiscal years of the fund (or for the life of the fund, if shorter). It assumes a $10,000 initial investment in the fund and in an appropriate, broad-based securities market index for the same period.
GROWTH OF $10,000
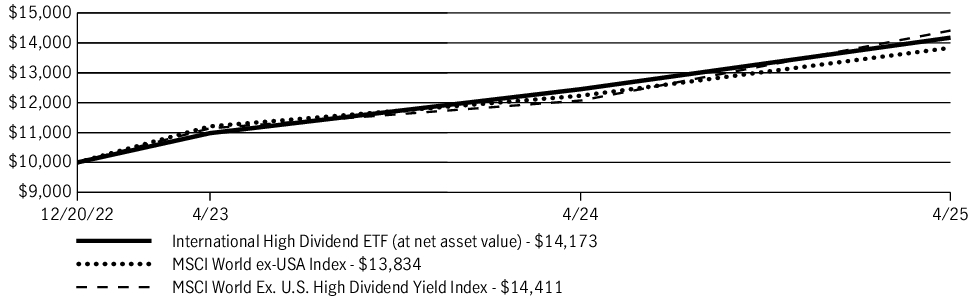
| AVERAGE ANNUAL TOTAL RETURN | 1 Year | Since inception |
| International High Dividend ETF (at net asset value) | 13.84% | 15.91% |
| MSCI World ex-USA Index | 13.10% | 14.73% |
| MSCI World Ex. U.S. High Dividend Yield Index | 19.39% | 16.73% |
Fund Statistics
| Fund net assets | $8,567,201 |
| Total number of portfolio holdings | 100 |
| Total advisory fees paid (net) | $0 |
| Portfolio turnover rate | 43% |
Graphical Representation of Holdings
The tables below show the investment makeup of the fund, representing a percentage of the total net assets of the fund.
Top Ten Holdings
| Poste Italiane SpA | 2.2% |
| Imperial Brands PLC | 2.1% |
| Klepierre SA | 2.1% |
| Heidelberg Materials AG | 2.1% |
| NN Group NV | 2.1% |
| SAP SE | 2.0% |
| Engie SA | 2.0% |
| Generali | 2.0% |
| British American Tobacco PLC | 2.0% |
| Banco Bilbao Vizcaya Argentaria SA | 1.9% |
Sector Composition
| Financials | 27.0% |
| Industrials | 13.9% |
| Health care | 9.0% |
| Consumer staples | 9.0% |
| Energy | 7.8% |
| Materials | 7.6% |
| Utilities | 6.2% |
| Information technology | 5.9% |
| Consumer discretionary | 5.3% |
| Real estate | 3.9% |
| Communication services | 2.6% |
| Short-term investments and other | 1.8% |
Country Composition
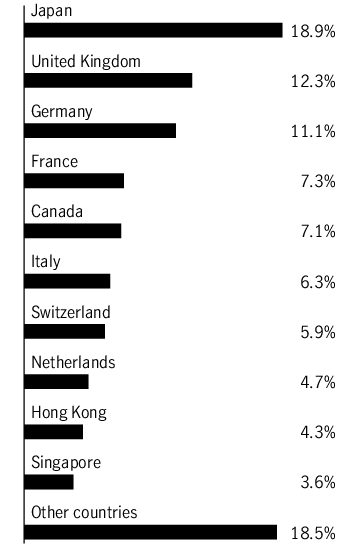
Holdings may not have been held by the fund for the entire period and are subject to change without notice. Portfolio composition is subject to review in accordance with the fund’s investment strategy and may vary in the future. Current and future portfolio holdings are subject to risk and may change at any time.
Top Ten Holdings
| Poste Italiane SpA | 2.2% |
| Imperial Brands PLC | 2.1% |
| Klepierre SA | 2.1% |
| Heidelberg Materials AG | 2.1% |
| NN Group NV | 2.1% |
| SAP SE | 2.0% |
| Engie SA | 2.0% |
| Generali | 2.0% |
| British American Tobacco PLC | 2.0% |
| Banco Bilbao Vizcaya Argentaria SA | 1.9% |
What were the fund costs during the last year ?
(Based on a hypothetical $10,000 investment)
| Fund | Costs of a $10,000 investment | Costs paid as a percentage of a $10,000 investment |
||
| U.S. High Dividend ETF/JHDV | $36 | 0.34% |
Management’s Discussion of Fund Performance
SUMMARY OF RESULTS
U.S. High Dividend ETF (JHDV) returned 9.88% for the year ended April 30, 2025. U.S. dividend-paying stocks posted a gain in the 12 months ended on April 30, 2025, with the bulk of the positive return occurring prior to the new year. During that time, equities were boosted by the combination of falling interest rates and positive economic growth. However, stocks experienced weaker returns and higher volatility from the start of 2025 onward due to concerns about the economic impact of tariffs.
TOP PERFORMANCE CONTRIBUTORS
Information technology stocks | A number of holdings in the sector produced double-digit returns, with the largest contributors to the fund's absolute performance coming from NVIDIA Corp., Apple, Inc., and IBM Corp.
Healthcare | The pharmaceutical stocks Pfizer, Inc., Bristol-Myers Squibb Company, and Eli Lilly & Company accounted for the bulk of the fund’s positive return in the sector.
Other areas of strength | Holdings in the consumer staples, utilities, and real estate sectors, among others, also added to absolute performance. The tobacco stocks Phillip Morris International, Inc. and Altria Group, Inc. were leading contributors in consumer staples.
TOP PERFORMANCE DETRACTORS
Materials | The fund’s holdings in the sector combined for a negative absolute return, largely as a result of positions in the chemical producers LyondellBasell Industries NV and Dow, Inc.
Industrials | United Parcel Service, Inc. lost ground due to lower shipping volumes, and Vertiv Holdings Company—a producer of data center infrastructure—was pressured by reduced enthusiasm for AI in the latter part of the period.
The views expressed in this report are exclusively those of the portfolio management team at Manulife Investment Management (US) LLC, and are subject to change. They are not meant as investment advice.
Fund Performance
The following graph compares the initial and subsequent account values at the end of each of the most recently completed 10 fiscal years of the fund (or for the life of the fund, if shorter). It assumes a $10,000 initial investment in the fund and in an appropriate, broad-based securities market index for the same period.
GROWTH OF $10,000
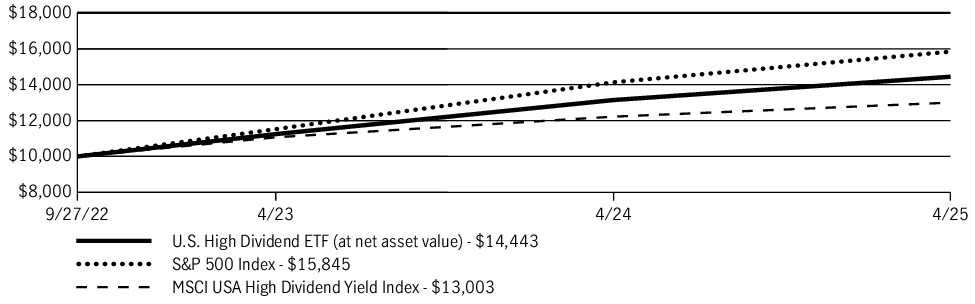
| AVERAGE ANNUAL TOTAL RETURN | 1 Year | Since inception |
| U.S. High Dividend ETF (at net asset value) | 9.88% | 15.24% |
| S&P 500 Index | 12.10% | 19.43% |
| MSCI USA High Dividend Yield Index | 6.41% | 10.66% |
Fund Statistics
| Fund net assets | $7,399,167 |
| Total number of portfolio holdings | 83 |
| Total advisory fees paid (net) | $0 |
| Portfolio turnover rate | 37% |
Graphical Representation of Holdings
The tables below show the investment makeup of the fund, representing a percentage of the total net assets of the fund.
Top Ten Holdings
| Microsoft Corp. | 6.3% |
| Apple, Inc. | 6.2% |
| NVIDIA Corp. | 6.0% |
| Intuit, Inc. | 2.0% |
| CME Group, Inc. | 2.0% |
| Philip Morris International, Inc. | 2.0% |
| OneMain Holdings, Inc. | 2.0% |
| Altria Group, Inc. | 1.9% |
| Simon Property Group, Inc. | 1.9% |
| Bristol-Myers Squibb Company | 1.9% |
Sector Composition
| Information technology | 32.7% |
| Financials | 15.3% |
| Consumer staples | 8.6% |
| Industrials | 8.2% |
| Health care | 8.0% |
| Consumer discretionary | 7.1% |
| Real estate | 6.2% |
| Communication services | 4.3% |
| Energy | 3.1% |
| Utilities | 2.7% |
| Materials | 2.5% |
| Short-term investments and other | 1.3% |
Holdings may not have been held by the fund for the entire period and are subject to change without notice. Portfolio composition is subject to review in accordance with the fund’s investment strategy and may vary in the future. Current and future portfolio holdings are subject to risk and may change at any time.
Top Ten Holdings
| Microsoft Corp. | 6.3% |
| Apple, Inc. | 6.2% |
| NVIDIA Corp. | 6.0% |
| Intuit, Inc. | 2.0% |
| CME Group, Inc. | 2.0% |
| Philip Morris International, Inc. | 2.0% |
| OneMain Holdings, Inc. | 2.0% |
| Altria Group, Inc. | 1.9% |
| Simon Property Group, Inc. | 1.9% |
| Bristol-Myers Squibb Company | 1.9% |
What were the fund costs during the last year ?
(Based on a hypothetical $10,000 investment)
| Fund | Costs of a $10,000 investment | Costs paid as a percentage of a $10,000 investment |
||
| Preferred Income ETF/JHPI | $56 | 0.54% |
Management’s Discussion of Fund Performance
SUMMARY OF RESULTS
Preferred Income ETF (JHPI) returned 7.30% for the year ended April 30, 2025. Preferred securities registered gains in the 12 months ended April 30, 2025, a time in which both the equity and fixed-income markets produced positive returns. Preferreds performed particularly well in the first five months of the period, when the U.S. Federal Reserve’s decision to start cutting interest rates fueled a rally in the bond market. The asset class began to lose steam in late 2024 once investors started to become less optimistic about the interest rate outlook, and it fell further in the period on concerns about rising tariffs. As a result, preferreds finished well off of their intra-period high.
TOP PERFORMANCE CONTRIBUTORS
Banking issues | The banking industry made the largest contribution to absolute performance due to its strong return and sizable portfolio weighting. The regional banks M&T Bank Corp. and KeyCorp were meaningful contributors at the individual security level.
Electric utilities | The sector performed well on expectations that the growth of artificial intelligence will lead to rising power demand. TXMN Energy, Inc. and Vistra Corp. were top contributors.
Communications and insurance | These sectors further contributed to absolute returns, led by U.S. Cellular Corp. and SBL Holdings, Inc., respectively.
TOP PERFORMANCE DETRACTORS
No major segment detracted | No major segment of the portfolio hurt absolute return. A number of individual securities posted losses, however, including SCE Trust (the issuing entity of Southern California Edison) and the pipeline operator Sempra.
The views expressed in this report are exclusively those of the portfolio management team at Manulife Investment Management (US) LLC, and are subject to change. They are not meant as investment advice.
Fund Performance
The following graph compares the initial and subsequent account values at the end of each of the most recently completed 10 fiscal years of the fund (or for the life of the fund, if shorter). It assumes a $10,000 initial investment in the fund and in an appropriate, broad-based securities market index for the same period.
GROWTH OF $10,000
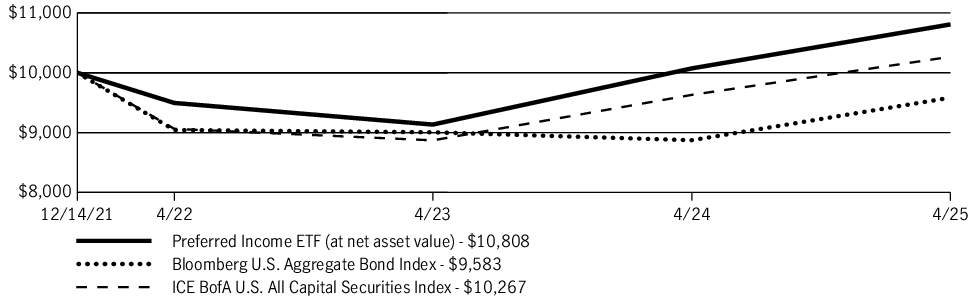
| AVERAGE ANNUAL TOTAL RETURN | 1 Year | Since inception |
| Preferred Income ETF (at net asset value) | 7.30% | 2.33% |
| Bloomberg U.S. Aggregate Bond Index | 8.02% | (1.25)% |
| ICE BofA U.S. All Capital Securities Index | 6.61% | 0.78% |
Fund Statistics
| Fund net assets | $72,064,196 |
| Total number of portfolio holdings | 171 |
| Total advisory fees paid (net) | $84,414 |
| Portfolio turnover rate | 29% |
Graphical Representation of Holdings
The tables below show the investment makeup of the fund, representing a percentage of the total net assets of the fund.
Sector Composition
| Financials | 53.0% |
| Utilities | 26.6% |
| Energy | 6.3% |
| Communication services | 4.7% |
| Real estate | 2.3% |
| Industrials | 1.7% |
| Health care | 0.9% |
| Consumer discretionary | 0.7% |
| Information technology | 0.5% |
| Short-term investments and other | 3.3% |
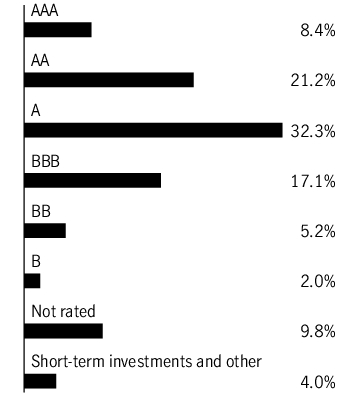
Quality Composition
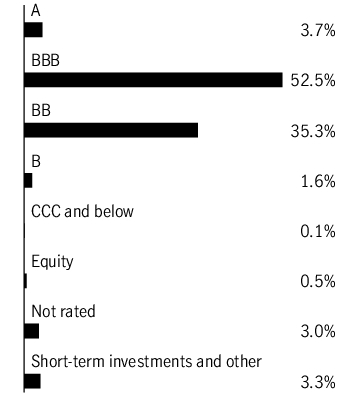
Ratings are from Moody’s Investors Service, Inc. If not available, we have used S&P Global Ratings. In the absence of ratings from these agencies, we have used Fitch Ratings, Inc. “Not rated” securities are those with no ratings available from these agencies. All ratings are as of 4-30-25 and do not reflect subsequent downgrades or upgrades, if any.
Holdings may not have been held by the fund for the entire period and are subject to change without notice. Portfolio composition is subject to review in accordance with the fund’s investment strategy and may vary in the future. Current and future portfolio holdings are subject to risk and may change at any time.
Ratings are from Moody’s Investors Service, Inc. If not available, we have used S&P Global Ratings. In the absence of ratings from these agencies, we have used Fitch Ratings, Inc. “Not rated” securities are those with no ratings available from these agencies. All ratings are as of 4-30-25 and do not reflect subsequent downgrades or upgrades, if any.
What were the fund costs during the last year ?
(Based on a hypothetical $10,000 investment)
| Fund | Costs of a $10,000 investment | Costs paid as a percentage of a $10,000 investment |
||
| Multifactor Emerging Markets ETF/JHEM | $50 | 0.49% |
Management’s Discussion of Fund Performance
SUMMARY OF RESULTS
Multifactor Emerging Markets ETF (JHEM) returned 5.50% for the year ended April 30, 2025. Emerging-market stocks delivered gains in the 12 months ended April 30, 2025. Although a protectionist shift in U.S. trade policy fueled heightened volatility later in the period, the asset class was generally well supported by falling global interest rates and weakness in the U.S. dollar.
TOP PERFORMANCE CONTRIBUTORS
Financial stocks | Financials made the largest contribution to absolute performance due to their strong return and sizable portfolio weighting. The fund was helped by its positions in India, where HDFC Bank, Ltd. and ICICI Bank, Ltd. were top contributors. Holdings in a number of Chinese stocks also fueled positive results, led by China Construction Bank Corp. and Industrial & Commercial Bank of China, Ltd.
Communication services | The Chinese media technology company Tencent Holdings, Ltd., accounted for the majority of the fund’s strength in the sector.
Consumer discretionary | China was the key source of positive returns here, as well, led by Alibaba Group Holding, Ltd. and the electric vehicle maker BYD Company, Ltd.
TOP PERFORMANCE DETRACTORS
Materials and energy | Commodity-sensitive stocks, in general, lagged in the period. Tata Steel, Ltd. and Petroleo Brasileiro SA were among the top detractors, respectively, in the two sectors.
Information technology | The Korean technology giant Samsung Electronics Company, Ltd., which trailed its sector peers on concerns about its sluggish growth, was the leading detractor in both technology and the portfolio as a whole.
The views expressed in this report are exclusively those of the portfolio management team at Dimensional Fund Advisors LP, and are subject to change. They are not meant as investment advice.
Fund Performance
The following graph compares the initial and subsequent account values at the end of each of the most recently completed 10 fiscal years of the fund (or for the life of the fund, if shorter). It assumes a $10,000 initial investment in the fund and in an appropriate, broad-based securities market index for the same period.
GROWTH OF $10,000
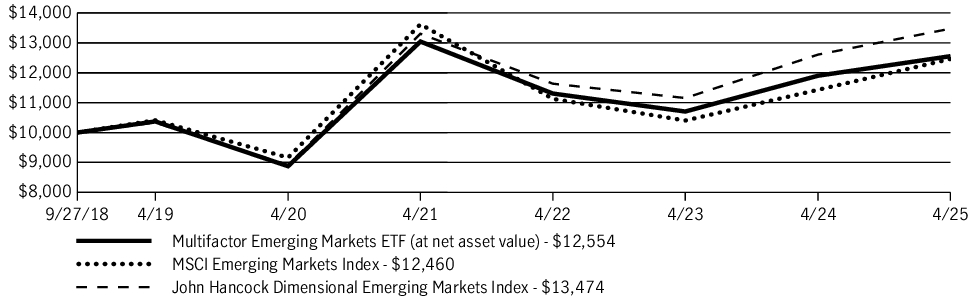
| AVERAGE ANNUAL TOTAL RETURN | 1 Year | 5 Years | Since inception |
| Multifactor Emerging Markets ETF (at net asset value) | 5.50% | 7.19% | 3.51% |
| MSCI Emerging Markets Index | 9.02% | 6.35% | 3.39% |
| John Hancock Dimensional Emerging Markets Index | 6.88% | 8.62% | 4.63% |
Fund Statistics
| Fund net assets | $577,309,977 |
| Total number of portfolio holdings | 878 |
| Total advisory fees paid (net) | $2,292,967 |
| Portfolio turnover rate | 13% |
Graphical Representation of Holdings
The tables below show the investment makeup of the fund, representing a percentage of the total investments of the fund.
Top Ten Holdings
| Tencent Holdings, Ltd. | 3.8% |
| Taiwan Semiconductor Manufacturing Company, Ltd. | 3.7% |
| Alibaba Group Holding, Ltd. | 2.7% |
| Samsung Electronics Company, Ltd. | 2.6% |
| HDFC Bank, Ltd. | 1.5% |
| ICICI Bank, Ltd. | 1.4% |
| Reliance Industries, Ltd. | 1.4% |
| PDD Holdings, Inc., ADR | 1.4% |
| China Construction Bank Corp., H Shares | 1.0% |
| Meituan, Class B | 0.9% |
Sector Composition
| Financials | 25.5% |
| Information technology | 17.1% |
| Consumer discretionary | 15.0% |
| Communication services | 9.4% |
| Materials | 7.4% |
| Industrials | 6.8% |
| Consumer staples | 5.8% |
| Energy | 5.3% |
| Utilities | 3.2% |
| Health care | 3.0% |
| Real estate | 1.1% |
| Short-term investments | 0.4% |
Country Composition
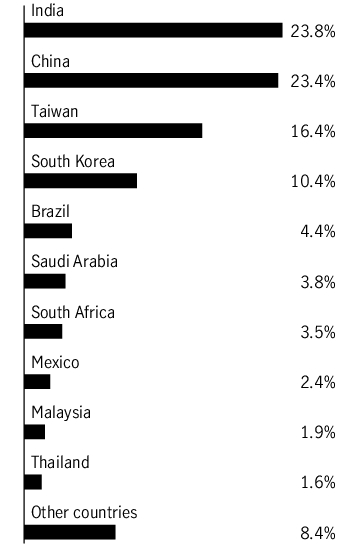
Holdings may not have been held by the fund for the entire period and are subject to change without notice. Portfolio composition is subject to review in accordance with the fund’s investment strategy and may vary in the future. Current and future portfolio holdings are subject to risk and may change at any time.
Top Ten Holdings
| Tencent Holdings, Ltd. | 3.8% |
| Taiwan Semiconductor Manufacturing Company, Ltd. | 3.7% |
| Alibaba Group Holding, Ltd. | 2.7% |
| Samsung Electronics Company, Ltd. | 2.6% |
| HDFC Bank, Ltd. | 1.5% |
| ICICI Bank, Ltd. | 1.4% |
| Reliance Industries, Ltd. | 1.4% |
| PDD Holdings, Inc., ADR | 1.4% |
| China Construction Bank Corp., H Shares | 1.0% |
| Meituan, Class B | 0.9% |
What were the fund costs during the last year ?
(Based on a hypothetical $10,000 investment)
| Fund | Costs of a $10,000 investment | Costs paid as a percentage of a $10,000 investment |
||
| Mortgage-Backed Securities ETF/JHMB | $41 | 0.39% |
Management’s Discussion of Fund Performance
SUMMARY OF RESULTS
Mortgage-Backed Securities ETF (JHMB) returned 9.28% for the year ended April 30, 2025. Mortgage-backed securities (MBS) registered strong total returns in the 12-month period that ended on April 30, 2025. Falling inflation allowed the U.S. Federal Reserve (Fed) to cut interest rates by a full percentage point in the latter half of 2024, bringing the benchmark rate from a range of 5.25%-5.50% to 4.25%-4.50%. U.S. Treasury yields fell in response, boosting fixed-income categories—such as MBS—with above-average interest rate sensitivity.
TOP PERFORMANCE CONTRIBUTORS
Sector allocations | Allocations to commercial mortgage-backed securities (CMBS) interest only securities, GNMA 30 year mortgages, and U.S. agency credit were meaningful contributors to return.
Yield positioning and interest payments | The fund was positioned for a steepening of the yield curve which occurred. The fund's intermediate durations fared better than longer and shorter durations. Interest payments were significant contributors to return.
TOP PERFORMANCE DETRACTORS
Certain holdings outside of MBS | Small portfolio positions in multifamily commercial mortgage-backed securities (CMBS) finished with negative returns, as did other specific segments of CMBS and asset-backed securities.
The views expressed in this report are exclusively those of the portfolio management team at Manulife Investment Management (US) LLC, and are subject to change. They are not meant as investment advice.
Fund Performance
The following graph compares the initial and subsequent account values at the end of each of the most recently completed 10 fiscal years of the fund (or for the life of the fund, if shorter). It assumes a $10,000 initial investment in the fund and in an appropriate, broad-based securities market index for the same period.
GROWTH OF $10,000
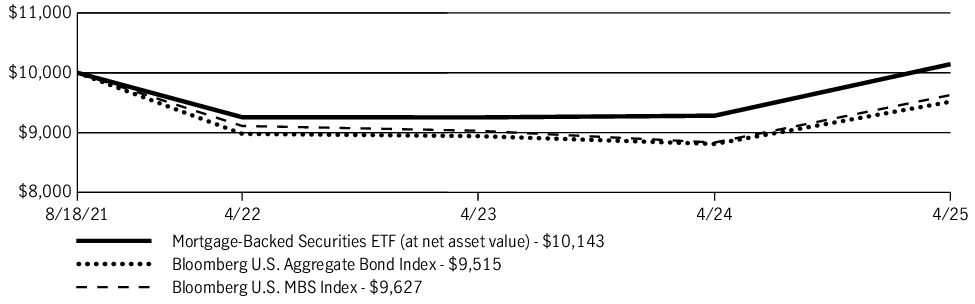
| AVERAGE ANNUAL TOTAL RETURN | 1 Year | Since inception |
| Mortgage-Backed Securities ETF (at net asset value) | 9.28% | 0.39% |
| Bloomberg U.S. Aggregate Bond Index | 8.02% | (1.34)% |
| Bloomberg U.S. MBS Index | 8.99% | (1.02)% |
Fund Statistics
| Fund net assets | $133,104,154 |
| Total number of portfolio holdings | 368 |
| Total advisory fees paid (net) | $82,330 |
| Portfolio turnover rate | 67% |
Graphical Representation of Holdings
The tables below show the investment makeup of the fund, representing a percentage of the total net assets of the fund.
Portfolio Composition
| U.S. Government Agency | 67.2% |
| Collateralized mortgage obligations – Commercial and residential | 15.9% |
| Asset-backed securities | 13.0% |
| Collateralized mortgage obligations – U.S. Government Agency | 3.4% |
| Short-term investments and other | 0.5% |
Quality Composition
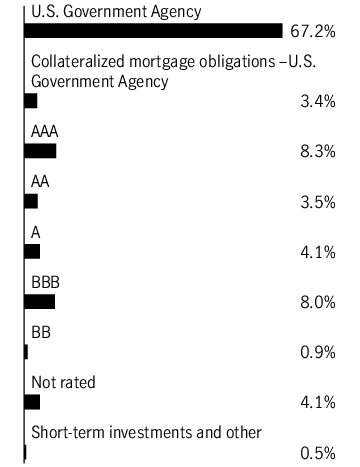
Ratings are from Moody’s Investors Service, Inc. If not available, we have used S&P Global Ratings. In the absence of ratings from these agencies, we have used Fitch Ratings, Inc. “Not rated” securities are those with no ratings available from these agencies. All ratings are as of 4-30-25 and do not reflect subsequent downgrades or upgrades, if any.
Holdings may not have been held by the fund for the entire period and are subject to change without notice. Portfolio composition is subject to review in accordance with the fund’s investment strategy and may vary in the future. Current and future portfolio holdings are subject to risk and may change at any time.
Ratings are from Moody’s Investors Service, Inc. If not available, we have used S&P Global Ratings. In the absence of ratings from these agencies, we have used Fitch Ratings, Inc. “Not rated” securities are those with no ratings available from these agencies. All ratings are as of 4-30-25 and do not reflect subsequent downgrades or upgrades, if any.
What were the fund costs during the last year ?
(Based on a hypothetical $10,000 investment)
| Fund | Costs of a $10,000 investment | Costs paid as a percentage of a $10,000 investment |
||
| Corporate Bond ETF/JHCB | $30 | 0.29% |
Management’s Discussion of Fund Performance
SUMMARY OF RESULTS
Corporate Bond ETF (JHCB) returned 7.74% for the year ended April 30, 2025. Investment-grade corporate bonds delivered solid returns in the 12 months ended April 30, 2025, with a decline in U.S. Treasury yields and the contribution from income offsetting the adverse effect of a modest increase in yield spreads. The asset class was well supported by the backdrop of accommodative U.S. Federal Reserve (Fed) policy, healthy corporate earnings, and generally positive investor risk appetites for the majority of the period.
TOP PERFORMANCE CONTRIBUTORS
Yield positioning and interest payments | The fund was well positioned for a steepening of the yield curve which occurred during the period. Intermediate-term issues generally provided the strongest returns. Interest payments were also significant contributors to return.
Banking issues | Holdings in this industry group made the largest contribution to absolute performance due to their strong return and sizable portfolio weighting. Deutsche Bank AG and Citizens Financial Group were meaningful contributors in this category.
TOP PERFORMANCE DETRACTORS
Asset allocation | Although allocation to the energy and communications sectors contributed to absolute performance, these sectors detracted relative to the Bloomberg U.S. Corporate Bond Index.
Individual security detractors | A narrow group of individual securities finished with losses, including Occidental Petroleum Corp. and pharmaceutical company Viatris, Inc.
The views expressed in this report are exclusively those of the portfolio management team at Manulife Investment Management (US) LLC, and are subject to change. They are not meant as investment advice.
Fund Performance
The following graph compares the initial and subsequent account values at the end of each of the most recently completed 10 fiscal years of the fund (or for the life of the fund, if shorter). It assumes a $10,000 initial investment in the fund and in an appropriate, broad-based securities market index for the same period.
GROWTH OF $10,000
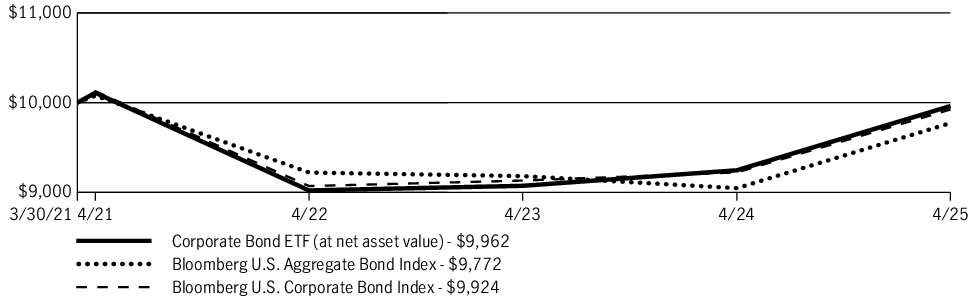
| AVERAGE ANNUAL TOTAL RETURN | 1 Year | Since inception |
| Corporate Bond ETF (at net asset value) | 7.74% | (0.09)% |
| Bloomberg U.S. Aggregate Bond Index | 8.02% | (0.56)% |
| Bloomberg U.S. Corporate Bond Index | 7.60% | (0.19)% |
Fund Statistics
| Fund net assets | $55,700,563 |
| Total number of portfolio holdings | 88 |
| Total advisory fees paid (net) | $0 |
| Portfolio turnover rate | 45% |
Graphical Representation of Holdings
The tables below show the investment makeup of the fund, representing a percentage of the total net assets of the fund.
Sector Composition
| Financials | 43.6% |
| Information technology | 10.7% |
| Industrials | 8.1% |
| Utilities | 8.0% |
| Communication services | 7.0% |
| Energy | 6.8% |
| Health care | 6.8% |
| Real estate | 3.4% |
| Consumer discretionary | 3.3% |
| Materials | 1.2% |
| Short-term investments and other | 1.1% |
Quality Composition
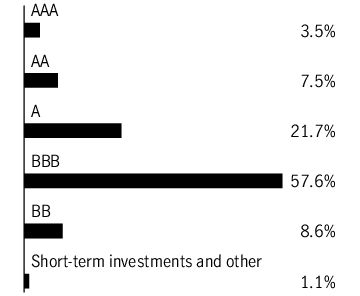
Ratings are from Moody’s Investors Service, Inc. If not available, we have used S&P Global Ratings. In the absence of ratings from these agencies, we have used Fitch Ratings, Inc. “Not rated” securities are those with no ratings available from these agencies. All ratings are as of 4-30-25 and do not reflect subsequent downgrades or upgrades, if any.
Holdings may not have been held by the fund for the entire period and are subject to change without notice. Portfolio composition is subject to review in accordance with the fund’s investment strategy and may vary in the future. Current and future portfolio holdings are subject to risk and may change at any time.
Ratings are from Moody’s Investors Service, Inc. If not available, we have used S&P Global Ratings. In the absence of ratings from these agencies, we have used Fitch Ratings, Inc. “Not rated” securities are those with no ratings available from these agencies. All ratings are as of 4-30-25 and do not reflect subsequent downgrades or upgrades, if any.
What were the fund costs during the last year ?
(Based on a hypothetical $10,000 investment)
| Fund | Costs of a $10,000 investment | Costs paid as a percentage of a $10,000 investment |
||
| Disciplined Value International Select ETF/JDVI | $73 | 0.69% |
Management’s Discussion of Fund Performance
SUMMARY OF RESULTS
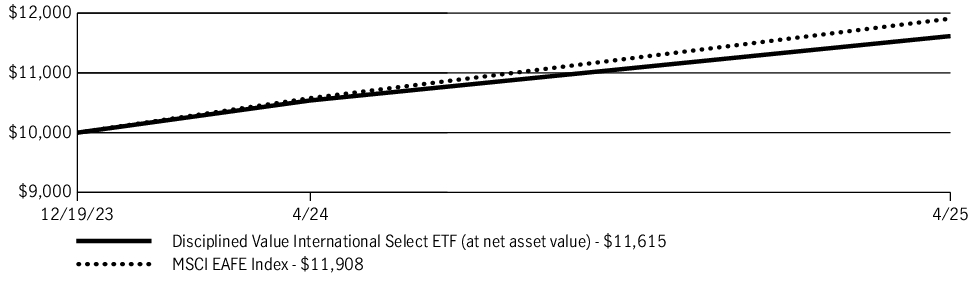
Disciplined Value International Select ETF (JDVI) returned 10.21% for the year ended April 30, 2025. International equities delivered strong, double-digit gains in the 12 months ended April 30, 2025, albeit with elevated volatility late in the period in response to shifts in U.S. trade policy. Certain European stocks performed particularly well, reflecting positive sentiment regarding falling interest rates and supportive fiscal policy.
TOP PERFORMANCE CONTRIBUTORS
Financial stocks | Financials made the largest contribution to absolute performance due to their strong return and sizable portfolio weighting. NatWest Group PLC, Allianz SE, and Nordea Bank Abp were the leading individual contributors in the sector.
Industrials | BAE Systems PLC, which benefited from expectations for rising defense spending in Europe, was the most notable contributor. Positions in Mitsubishi Heavy Industries, Ltd. and Siemens AG also helped results.
Country performance | At the country level, Japan and the United Kingdom contributed most to absolute performance.
TOP PERFORMANCE DETRACTORS
Information technology | The Korean technology giant Samsung Electronics Company, Ltd., which lagged its sector peers by a wide margin on concerns about its sluggish growth, was the largest detractor. Capgemini SE and SK Hynix, Inc. were further detractors of note.
Energy | Shares of Cenovus Energy, Inc. and MEG Energy Corp. fell sharply, weighing on the fund’s absolute performance.
The views expressed in this report are exclusively those of the portfolio management team at Boston Partners Global Investors, Inc., and are subject to change. They are not meant as investment advice.
Fund Performance
The following graph compares the initial and subsequent account values at the end of each of the most recently completed 10 fiscal years of the fund (or for the life of the fund, if shorter). It assumes a $10,000 initial investment in the fund and in an appropriate, broad-based securities market index for the same period.
GROWTH OF $10,000
| AVERAGE ANNUAL TOTAL RETURN | 1 Year | Since inception |
| Disciplined Value International Select ETF (at net asset value) | 10.21% | 11.60% |
| MSCI EAFE Index | 12.57% | 13.65% |
Fund Statistics
| Fund net assets | $34,173,749 |
| Total number of portfolio holdings | 41 |
| Total advisory fees paid (net) | $6,624 |
| Portfolio turnover rate | 55% |
Graphical Representation of Holdings
The tables below show the investment makeup of the fund, representing a percentage of the total net assets of the fund.
Top Ten Holdings
| BAE Systems PLC | 4.8% |
| Sony Group Corp. | 4.7% |
| Novartis AG | 4.4% |
| Mitsubishi Electric Corp. | 4.2% |
| Kinross Gold Corp. | 3.5% |
| Sandoz Group AG | 3.1% |
| Capgemini SE | 3.1% |
| Sumitomo Mitsui Financial Group, Inc. | 3.0% |
| AstraZeneca PLC | 3.0% |
| Siemens AG | 3.0% |
Sector Composition
| Financials | 23.3% |
| Industrials | 23.0% |
| Health care | 10.4% |
| Consumer discretionary | 10.2% |
| Materials | 8.4% |
| Energy | 6.9% |
| Information technology | 6.1% |
| Consumer staples | 6.0% |
| Communication services | 4.5% |
| Other assets and liabilities, net | 1.2% |
Country Composition
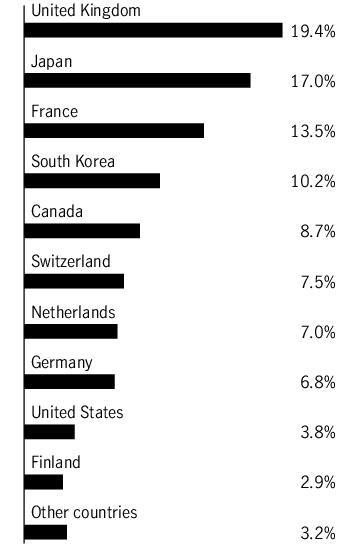
Holdings may not have been held by the fund for the entire period and are subject to change without notice. Portfolio composition is subject to review in accordance with the fund’s investment strategy and may vary in the future. Current and future portfolio holdings are subject to risk and may change at any time.
Top Ten Holdings
| BAE Systems PLC | 4.8% |
| Sony Group Corp. | 4.7% |
| Novartis AG | 4.4% |
| Mitsubishi Electric Corp. | 4.2% |
| Kinross Gold Corp. | 3.5% |
| Sandoz Group AG | 3.1% |
| Capgemini SE | 3.1% |
| Sumitomo Mitsui Financial Group, Inc. | 3.0% |
| AstraZeneca PLC | 3.0% |
| Siemens AG | 3.0% |
What were the fund costs during the last year ?
(Based on a hypothetical $10,000 investment)
| Fund | Costs of a $10,000 investment | Costs paid as a percentage of a $10,000 investment |
||
| Fundamental All Cap Core ETF/JHAC | $74 | 0.72% |
Management’s Discussion of Fund Performance
SUMMARY OF RESULTS
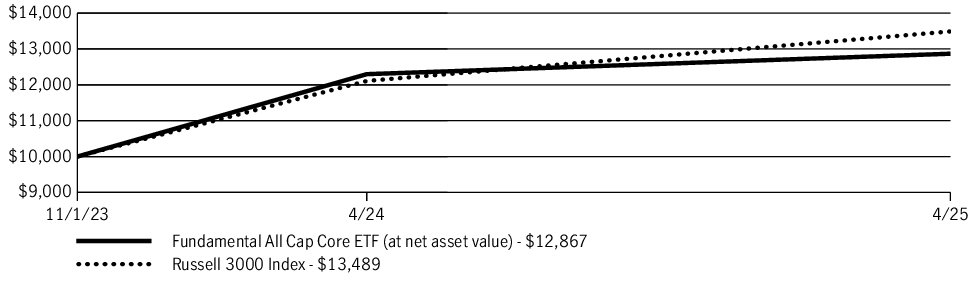
Fundamental All Cap Core ETF (JHAC) returned 4.64% for the year ended April 30, 2025. U.S. equities delivered a healthy gain in the 12 months ended April 30, 2025. Stocks moved steadily higher through mid-February on optimism about artificial intelligence and strength in the United States’ economic growth versus the rest of the world. However, the market subsequently gave back some of its prior gain on worries about the economic impact of protectionist U.S. trade policy. The gains were primarily in large caps, which outperformed mid and small cap stocks.
TOP PERFORMANCE CONTRIBUTORS
Financial stocks | KKR & Company, Inc., a private equity and real estate investment firm, was the leading contributor to absolute returns in the sector. Several other financial stocks, including Morgan Stanley, The Goldman Sachs Group, Inc., and S&P Global, Inc., also helped results.
Information technology | Positions in certain mega-cap technology stocks that drove market performance in 2024 —NVIDIA Corp. and Apple, Inc.—contributed positively. Oracle Corp., a beneficiary of AI enthusiasm, was a further contributor of note.
Energy | The fund’s holding in the liquid natural gas producer Cheniere Energy, Inc., produced a strong absolute return in this sector.
TOP PERFORMANCE DETRACTORS
Consumer discretionary | Mobileye Global, Inc., a producer of autonomous vehicle technologies, was the largest detractor. Lennar Corp. and Polaris, Inc. also pressured results.
Healthcare | The biotechnology stock Avantor, Inc. was the most notable detractor, followed by Hologic, Inc. and Moderna, Inc.
Industrials | Regal Rexnord Corp., a manufacturer of electric motors and power transmission components, accounted for the majority of the fund’s negative performance in the sector.
The views expressed in this report are exclusively those of the portfolio management team at Manulife Investment Management (US) LLC, and are subject to change. They are not meant as investment advice.
Fund Performance
The following graph compares the initial and subsequent account values at the end of each of the most recently completed 10 fiscal years of the fund (or for the life of the fund, if shorter). It assumes a $10,000 initial investment in the fund and in an appropriate, broad-based securities market index for the same period.
GROWTH OF $10,000
| AVERAGE ANNUAL TOTAL RETURN | 1 Year | Since inception |
| Fundamental All Cap Core ETF (at net asset value) | 4.64% | 18.36% |
| Russell 3000 Index | 11.40% | 22.15% |
Fund Statistics
| Fund net assets | $3,939,542 |
| Total number of portfolio holdings | 48 |
| Total advisory fees paid (net) | $0 |
| Portfolio turnover rate | 34% |
Graphical Representation of Holdings
The tables below show the investment makeup of the fund, representing a percentage of the total net assets of the fund.
Top Ten Holdings
| Amazon.com, Inc. | 7.9% |
| NVIDIA Corp. | 5.9% |
| Alphabet, Inc., Class A | 5.8% |
| Cheniere Energy, Inc. | 4.6% |
| Workday, Inc., Class A | 4.4% |
| Apple, Inc. | 4.4% |
| iShares Russell 3000 ETF | 4.2% |
| KKR & Company, Inc. | 3.9% |
| First Hawaiian, Inc. | 3.6% |
| Crown Castle, Inc. | 3.1% |
Sector Composition
| Information technology | 28.5% |
| Financials | 17.5% |
| Consumer discretionary | 16.1% |
| Communication services | 10.6% |
| Health care | 8.4% |
| Energy | 6.1% |
| Consumer staples | 4.2% |
| Real estate | 3.7% |
| Industrials | 3.5% |
| Short-term investments and other | 1.4% |
Holdings may not have been held by the fund for the entire period and are subject to change without notice. Portfolio composition is subject to review in accordance with the fund’s investment strategy and may vary in the future. Current and future portfolio holdings are subject to risk and may change at any time.
Top Ten Holdings
| Amazon.com, Inc. | 7.9% |
| NVIDIA Corp. | 5.9% |
| Alphabet, Inc., Class A | 5.8% |
| Cheniere Energy, Inc. | 4.6% |
| Workday, Inc., Class A | 4.4% |
| Apple, Inc. | 4.4% |
| iShares Russell 3000 ETF | 4.2% |
| KKR & Company, Inc. | 3.9% |
| First Hawaiian, Inc. | 3.6% |
| Crown Castle, Inc. | 3.1% |
This report describes changes to the fund that occurred during the reporting period.
What were the fund costs during the last year ?
(Based on a hypothetical $10,000 investment)
| Fund | Costs of a $10,000 investment | Costs paid as a percentage of a $10,000 investment |
||
| Dynamic Municipal Bond ETF/JHMU | $40 | 0.39% |
Management’s Discussion of Fund Performance
SUMMARY OF RESULTS
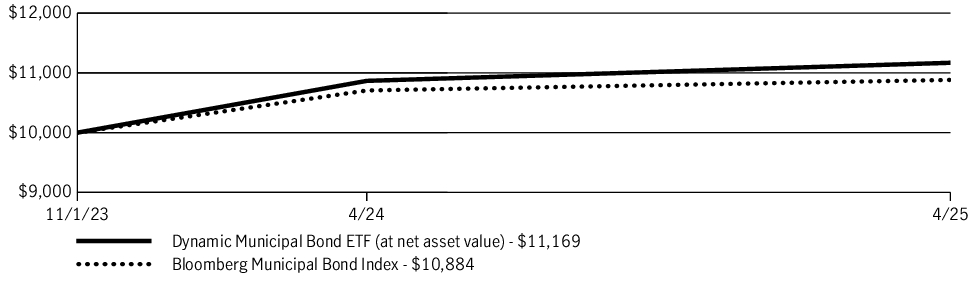
Dynamic Municipal Bond ETF (JHMU) returned 2.79% for the year ended April 30, 2025. Municipal bonds posted positive absolute returns in the annual period, with the contribution from income outweighing the effect of mixed price action. The category lagged the broader fixed-income market due in part to a high level of new-issue supply. In addition, the asset class experienced elevated volatility in early 2025 after the protectionist shift in U.S. trade policy began to fuel concerns about the economic outlook.
TOP PERFORMANCE CONTRIBUTORS
Revenue bonds | This segment of the fund made the largest contribution to absolute performance, due primarily to its substantial portfolio weighting. Healthcare, education, and industrial revenue bonds were key contributors in the category.
General obligation debt | State and local general obligation issues also helped results, albeit with a smaller contribution than revenue bonds due to their smaller portfolio weighting.
TOP PERFORMANCE DETRACTORS
No category detracted | At a time of positive performance for the fund and the market as a whole, no major segment of the portfolio hurt absolute returns. A number of individual securities posted losses, however, including the bonds of Western Carolina University and Glendale Industrial Development Authority.
The views expressed in this report are exclusively those of the portfolio management team at Manulife Investment Management (US) LLC, and are subject to change. They are not meant as investment advice.
Fund Performance
The following graph compares the initial and subsequent account values at the end of each of the most recently completed 10 fiscal years of the fund (or for the life of the fund, if shorter). It assumes a $10,000 initial investment in the fund and in an appropriate, broad-based securities market index for the same period.
GROWTH OF $10,000
| AVERAGE ANNUAL TOTAL RETURN | 1 Year | Since inception |
| Dynamic Municipal Bond ETF (at net asset value) | 2.79% | 7.67% |
| Bloomberg Municipal Bond Index | 1.66% | 5.82% |
Fund Statistics
| Fund net assets | $25,428,947 |
| Total number of portfolio holdings | 127 |
| Total advisory fees paid (net) | $0 |
| Portfolio turnover rate | 83% |
Graphical Representation of Holdings
The tables below show the investment makeup of the fund, representing a percentage of the total net assets of the fund.
Portfolio Composition
| General obligation bonds | 9.7% |
| Revenue bonds | 86.3% |
| Other revenue | 17.7% |
| Airport | 14.5% |
| Health care | 13.5% |
| Education | 13.0% |
| Development | 12.9% |
| Water and sewer | 6.2% |
| Housing | 3.1% |
| Utilities | 2.4% |
| Transportation | 1.0% |
| Tobacco | 0.8% |
| Facilities | 0.6% |
| Pollution | 0.6% |
| Short-term investments and other | 4.0% |
Quality Composition
Ratings are from Moody’s Investors Service, Inc. If not available, we have used S&P Global Ratings. In the absence of ratings from these agencies, we have used Fitch Ratings, Inc. “Not rated” securities are those with no ratings available from these agencies. All ratings are as of 4-30-25 and do not reflect subsequent downgrades or upgrades, if any.
Holdings may not have been held by the fund for the entire period and are subject to change without notice. Portfolio composition is subject to review in accordance with the fund’s investment strategy and may vary in the future. Current and future portfolio holdings are subject to risk and may change at any time.
Ratings are from Moody’s Investors Service, Inc. If not available, we have used S&P Global Ratings. In the absence of ratings from these agencies, we have used Fitch Ratings, Inc. “Not rated” securities are those with no ratings available from these agencies. All ratings are as of 4-30-25 and do not reflect subsequent downgrades or upgrades, if any.
Material Fund Changes
Effective October 4, 2024, the principal investment strategies of the fund were changed to state: The fund may buy bonds of any maturity or duration. The manager may implement short-term trading strategies to take advantage of pricing imbalances within the municipal bond market. There is no guarantee that the manager will be able to implement these strategies effectively and the strategies may have a more significant impact on the fund's performance before it achieves scale.
Related to this change in principal investment strategies, the following high portfolio turnover risk disclosure was added to the fund's prospectus: Trading securities actively and frequently can increase transaction costs (thus lowering performance) and taxable distributions.
This is a summary of certain changes to the fund since 5-1-24 . For more complete information, please refer to the fund’s prospectus. The currently effective prospectus is available at jhinvestments.com/documents or by calling 800-225-6020 .
What were the fund costs during the last year ?
(Based on a hypothetical $10,000 investment)
| Fund | Costs of a $10,000 investment | Costs paid as a percentage of a $10,000 investment |
||
| High Yield ETF/JHHY | $54 | 0.52% |
Management’s Discussion of Fund Performance
SUMMARY OF RESULTS
High Yield ETF (JHHY) returned 8.54% for the year ended April 30, 2025. High-yield corporate bonds delivered robust returns in the 12 months ended April 30, 2025, with a decline in U.S. Treasury yields and the benefit of income offsetting the adverse effect of an increase in yield spreads. The asset class was well supported by the backdrop of accommodative U.S. Federal Reserve (Fed) policy, healthy corporate earnings, and generally positive investor risk appetites for the majority of the period. However, concerns about the economic impact of President Trump’s trade policies led to heightened volatility later in the period.
TOP PERFORMANCE CONTRIBUTORS
All industries produced gains | The contributors to performance were broad based, reflecting the positive return for both the fund and the high-yield market as a whole. The media, telecommunications, healthcare, and technology/electronics industries were the largest contributors.
Wireline integrated & services | This sub-industry within telecommunications contributed the most to absolute performance, led by a position in Lumen Technologies, Inc.
Cable & satellite TV | The bonds of Charter Communications, Inc. performed well in the period, fueling a healthy gain from this subindustry group.
TOP PERFORMANCE DETRACTORS
Oil field equipment & services | The sub-industry was one of the few to finish the period in negative territory, reflecting the decline in crude oil prices. Nabors Industries, Inc. was the largest detractor in the category.
Personal & household products | The fund also lost some ground in this subindustry, with the weakest results coming from a position in Kronos Acquisition Holdings, Inc.
The views expressed in this report are exclusively those of the portfolio management team at Marathon Asset Management, L.P., and are subject to change. They are not meant as investment advice.
Fund Performance
The following graph compares the initial and subsequent account values at the end of each of the most recently completed 10 fiscal years of the fund (or for the life of the fund, if shorter). It assumes a $10,000 initial investment in the fund and in an appropriate, broad-based securities market index for the same period.
GROWTH OF $10,000
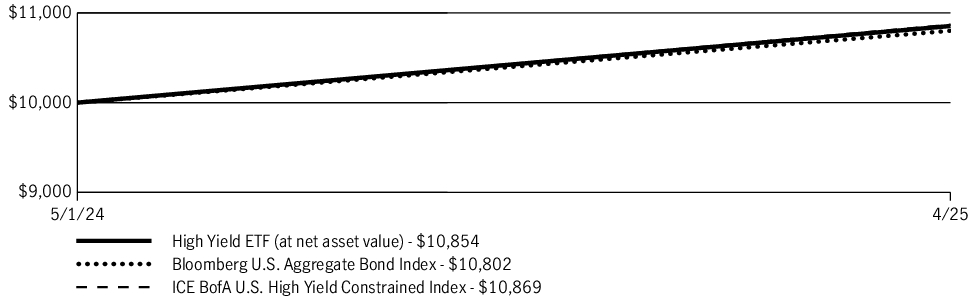
| AVERAGE ANNUAL TOTAL RETURN | 1 Year | Since inception |
| High Yield ETF (at net asset value) | 8.54% | 8.54% |
| Bloomberg U.S. Aggregate Bond Index | 8.02% | 8.02% |
| ICE BofA U.S. High Yield Constrained Index | 8.69% | 8.69% |
Fund Statistics
| Fund net assets | $34,535,264 |
| Total number of portfolio holdings | 547 |
| Total advisory fees paid (net) | $0 |
| Portfolio turnover rate | 252% |
Graphical Representation of Holdings
The tables below show the investment makeup of the fund, representing a percentage of the total net assets of the fund.
Sector Composition
| Consumer discretionary | 15.3% |
| Communication services | 14.4% |
| Industrials | 13.1% |
| Financials | 11.8% |
| Energy | 10.9% |
| Materials | 9.4% |
| Health care | 8.3% |
| Information technology | 4.7% |
| Consumer staples | 4.1% |
| Real estate | 3.6% |
| Utilities | 2.7% |
| Short-term investments and other | 1.7% |
Quality Composition
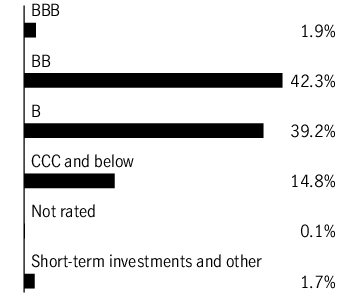
Ratings are from Moody’s Investors Service, Inc. If not available, we have used S&P Global Ratings. In the absence of ratings from these agencies, we have used Fitch Ratings, Inc. “Not rated” securities are those with no ratings available from these agencies. All ratings are as of 4-30-25 and do not reflect subsequent downgrades or upgrades, if any.
Holdings may not have been held by the fund for the entire period and are subject to change without notice. Portfolio composition is subject to review in accordance with the fund’s investment strategy and may vary in the future. Current and future portfolio holdings are subject to risk and may change at any time.
Ratings are from Moody’s Investors Service, Inc. If not available, we have used S&P Global Ratings. In the absence of ratings from these agencies, we have used Fitch Ratings, Inc. “Not rated” securities are those with no ratings available from these agencies. All ratings are as of 4-30-25 and do not reflect subsequent downgrades or upgrades, if any.
What were the fund costs during the last year ?
(Based on a hypothetical $10,000 investment)
| Fund | Costs of a $10,000 investment | Costs paid as a percentage of a $10,000 investment |
||
| Core Bond ETF/JHCR | $11 | 0.29% |
Fund Statistics
| Fund net assets | $10,027,242 |
| Total number of portfolio holdings | 207 |
| Total advisory fees paid (net) | $0 |
| Portfolio turnover rate | 67% |
Graphical Representation of Holdings
The tables below show the investment makeup of the fund, representing a percentage of the total net assets of the fund.
Portfolio Composition
| U.S. Government Agency | 38.9% |
| Corporate bonds | 27.9% |
| U.S. Government | 20.2% |
| Asset-backed securities | 7.7% |
| Collateralized mortgage obligations – Commercial and residential | 3.6% |
| Collateralized mortgage obligations – U.S. Government Agency | 0.6% |
| Short-term investments and other | 1.1% |
Quality Composition
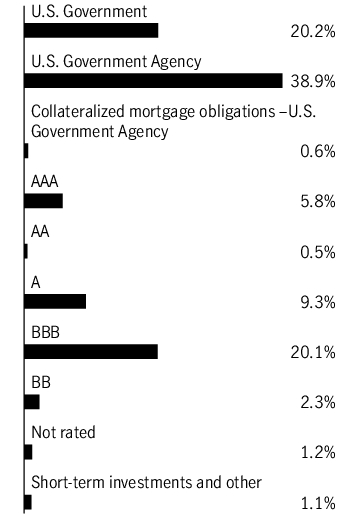
Ratings are from Moody’s Investors Service, Inc. If not available, we have used S&P Global Ratings. In the absence of ratings from these agencies, we have used Fitch Ratings, Inc. “Not rated” securities are those with no ratings available from these agencies. All ratings are as of 4-30-25 and do not reflect subsequent downgrades or upgrades, if any.
Holdings may not have been held by the fund for the entire period and are subject to change without notice. Portfolio composition is subject to review in accordance with the fund’s investment strategy and may vary in the future. Current and future portfolio holdings are subject to risk and may change at any time.
Ratings are from Moody’s Investors Service, Inc. If not available, we have used S&P Global Ratings. In the absence of ratings from these agencies, we have used Fitch Ratings, Inc. “Not rated” securities are those with no ratings available from these agencies. All ratings are as of 4-30-25 and do not reflect subsequent downgrades or upgrades, if any.
What were the fund costs during the last year ?
(Based on a hypothetical $10,000 investment)
| Fund | Costs of a $10,000 investment | Costs paid as a percentage of a $10,000 investment |
||
| Core Plus Bond ETF/JHCP | $13 | 0.36% |
Fund Statistics
| Fund net assets | $48,731,081 |
| Total number of portfolio holdings | 309 |
| Total advisory fees paid (net) | $0 |
| Portfolio turnover rate | 66% |
Graphical Representation of Holdings
The tables below show the investment makeup of the fund, representing a percentage of the total net assets of the fund.
Portfolio Composition
| U.S. Government Agency | 36.2% |
| Corporate bonds | 35.3% |
| U.S. Government | 20.0% |
| Asset-backed securities | 4.3% |
| Collateralized mortgage obligations – Commercial and residential | 2.0% |
| Collateralized mortgage obligations – U.S. Government Agency | 0.6% |
| Short-term investments and other | 1.6% |
Quality Composition
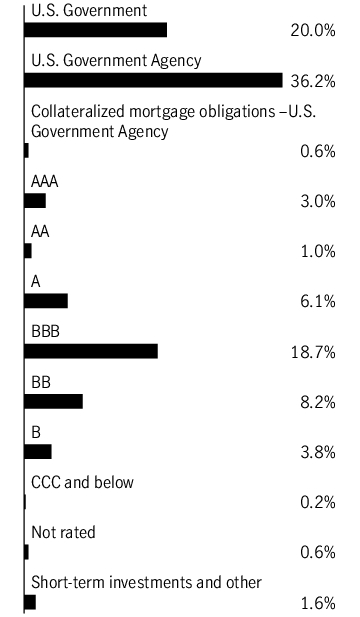
Ratings are from Moody’s Investors Service, Inc. If not available, we have used S&P Global Ratings. In the absence of ratings from these agencies, we have used Fitch Ratings, Inc. “Not rated” securities are those with no ratings available from these agencies. All ratings are as of 4-30-25 and do not reflect subsequent downgrades or upgrades, if any.
Holdings may not have been held by the fund for the entire period and are subject to change without notice. Portfolio composition is subject to review in accordance with the fund’s investment strategy and may vary in the future. Current and future portfolio holdings are subject to risk and may change at any time.
Ratings are from Moody’s Investors Service, Inc. If not available, we have used S&P Global Ratings. In the absence of ratings from these agencies, we have used Fitch Ratings, Inc. “Not rated” securities are those with no ratings available from these agencies. All ratings are as of 4-30-25 and do not reflect subsequent downgrades or upgrades, if any.