Shareholder Report
|
6 Months Ended |
12 Months Ended |
Jul. 01, 2024 |
Dec. 31, 2024
USD ($)
Holding
|
| Shareholder Report [Line Items] |
|
|
| Document Type |
|
N-CSR
|
| Amendment Flag |
|
false
|
| Registrant Name |
|
Natixis Funds Trust I
|
| Entity Central Index Key |
|
0000770540
|
| Entity Investment Company Type |
|
N-1A
|
| Document Period End Date |
|
Dec. 31, 2024
|
| C000178444 |
|
|
| Shareholder Report [Line Items] |
|
|
| Fund Name |
|
Mirova Global Green Bond Fund
|
| Class Name |
|
Class A
|
| Trading Symbol |
|
MGGAX
|
| Annual or Semi-Annual Statement [Text Block] |
|
This annual shareholder report contains important information about Mirova Global Green Bond Fund for the period of January 1, 2024 to December 31, 2024.
|
| Shareholder Report Annual or Semi-Annual |
|
Annual Shareholder Report
|
| Additional Information [Text Block] |
|
You can find additional information (including tax information) about the Fund at im.natixis.com/funddocuments. You can also request the information by contacting us at (800) 225-5478 or by contacting your financial intermediary directly.
|
| Additional Information Phone Number |
|
(800) 225-5478
|
| Additional Information Website |
|
<span style="box-sizing: border-box; color: rgb(0, 0, 0); display: inline; flex-wrap: nowrap; font-size: 12px; font-weight: 400; grid-area: auto; line-height: 18px; margin: 0px; overflow: visible; text-align: left; white-space-collapse: preserve-breaks;">im.natixis.com/funddocuments</span>
|
| Expenses [Text Block] |
|
What were the fund costs for the last year? (based on a hypothetical $10,000 investment)
Class Name |
Costs of a $10,000 investment |
Costs paid as a percentage of a $10,000 investmentFootnote Reference† |
Class A |
$91 |
0.90% |
| Footnote |
Description |
Footnote† |
Annualized for periods less than one year (if applicable). | |
| Expenses Paid, Amount |
|
$ 91
|
| Expense Ratio, Percent |
|
0.90%
|
| Factors Affecting Performance [Text Block] |
|
How did the fund perform last year and what affected its performance?Explanation of Fund Performance In 2024, the Mirova Global Green Bond Fund lagged in overall performance which can be attributed to movements on the yield curve. Top Contributors to Performance •Allocation had a positive impact on the Fund during the year due to its long position on credit, while US and Euro credit spreads compressed. •Issue selection during the year was also positive. The largest contributors to this outperformance were among the corporate holdings, namely Altarea, Johnson Controls, and EIB. Top Detractors from Performance •The Fund's duration and curve strategy during the year incurred a cost, negatively impacting performance. •Yield curve positioning on the CAD zone, Euro zone and USD zone were negative throughout the year. •Among the worst detractors were Philips, Vestas, and Credit Mutuelle Arkea. |
| Performance Past Does Not Indicate Future [Text] |
|
Performance data shown represents past performance and is no guarantee of, and is not necessarily indicative of, future results. Total return and value will vary, and you may have a gain or loss when shares are sold. Current performance may be lower or higher than quoted. For the most recent month-end performance,
|
| Line Graph [Table Text Block] |
|
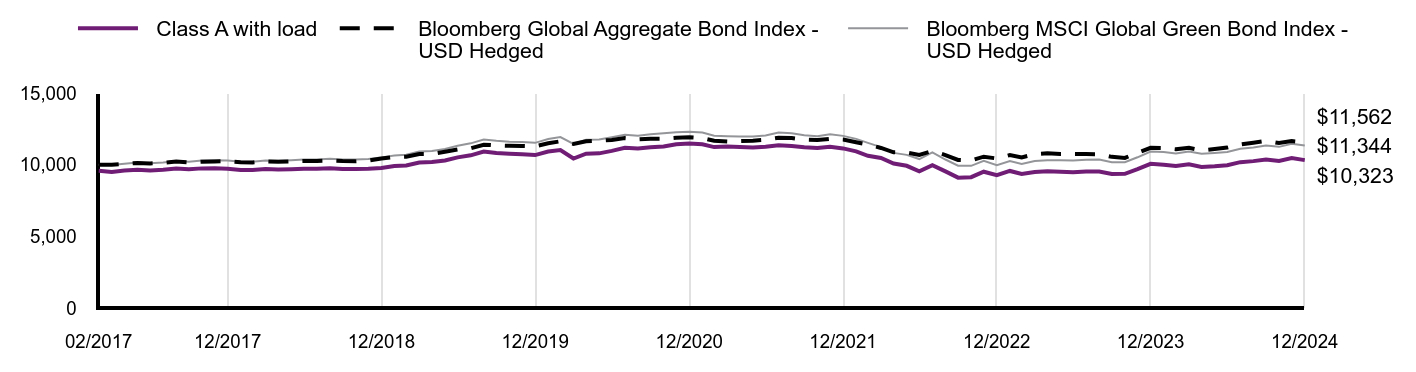
|
Class A with load |
Bloomberg Global Aggregate Bond Index - USD Hedged |
Bloomberg MSCI Global Green Bond Index - USD Hedged |
02/2017 |
$9,579 |
$10,000 |
$10,000 |
03/2017 |
$9,502 |
$9,995 |
$9,984 |
04/2017 |
$9,598 |
$10,063 |
$10,076 |
05/2017 |
$9,646 |
$10,122 |
$10,149 |
06/2017 |
$9,607 |
$10,094 |
$10,103 |
07/2017 |
$9,655 |
$10,127 |
$10,153 |
08/2017 |
$9,741 |
$10,219 |
$10,266 |
09/2017 |
$9,689 |
$10,172 |
$10,216 |
10/2017 |
$9,747 |
$10,215 |
$10,295 |
11/2017 |
$9,756 |
$10,231 |
$10,316 |
12/2017 |
$9,719 |
$10,253 |
$10,302 |
01/2018 |
$9,631 |
$10,180 |
$10,217 |
02/2018 |
$9,631 |
$10,157 |
$10,217 |
03/2018 |
$9,701 |
$10,242 |
$10,293 |
04/2018 |
$9,662 |
$10,203 |
$10,271 |
05/2018 |
$9,691 |
$10,242 |
$10,322 |
06/2018 |
$9,713 |
$10,261 |
$10,362 |
07/2018 |
$9,713 |
$10,263 |
$10,368 |
08/2018 |
$9,752 |
$10,295 |
$10,422 |
09/2018 |
$9,697 |
$10,256 |
$10,372 |
10/2018 |
$9,697 |
$10,236 |
$10,372 |
11/2018 |
$9,717 |
$10,286 |
$10,404 |
12/2018 |
$9,781 |
$10,434 |
$10,515 |
01/2019 |
$9,912 |
$10,545 |
$10,648 |
02/2019 |
$9,952 |
$10,557 |
$10,694 |
03/2019 |
$10,156 |
$10,747 |
$10,923 |
04/2019 |
$10,186 |
$10,753 |
$10,961 |
05/2019 |
$10,298 |
$10,908 |
$11,095 |
06/2019 |
$10,517 |
$11,061 |
$11,327 |
07/2019 |
$10,659 |
$11,148 |
$11,494 |
08/2019 |
$10,922 |
$11,400 |
$11,757 |
09/2019 |
$10,814 |
$11,348 |
$11,675 |
10/2019 |
$10,773 |
$11,328 |
$11,613 |
11/2019 |
$10,732 |
$11,315 |
$11,596 |
12/2019 |
$10,676 |
$11,292 |
$11,529 |
01/2020 |
$10,924 |
$11,495 |
$11,801 |
02/2020 |
$11,027 |
$11,636 |
$11,929 |
03/2020 |
$10,434 |
$11,455 |
$11,460 |
04/2020 |
$10,774 |
$11,640 |
$11,743 |
05/2020 |
$10,795 |
$11,673 |
$11,771 |
06/2020 |
$10,969 |
$11,732 |
$11,922 |
07/2020 |
$11,186 |
$11,860 |
$12,093 |
08/2020 |
$11,134 |
$11,774 |
$12,027 |
09/2020 |
$11,216 |
$11,817 |
$12,125 |
10/2020 |
$11,268 |
$11,818 |
$12,192 |
11/2020 |
$11,434 |
$11,885 |
$12,265 |
12/2020 |
$11,489 |
$11,922 |
$12,298 |
01/2021 |
$11,425 |
$11,858 |
$12,244 |
02/2021 |
$11,233 |
$11,673 |
$12,021 |
03/2021 |
$11,267 |
$11,627 |
$11,990 |
04/2021 |
$11,234 |
$11,658 |
$11,967 |
05/2021 |
$11,202 |
$11,684 |
$11,972 |
06/2021 |
$11,261 |
$11,741 |
$12,037 |
07/2021 |
$11,369 |
$11,887 |
$12,248 |
08/2021 |
$11,315 |
$11,863 |
$12,200 |
09/2021 |
$11,230 |
$11,751 |
$12,055 |
10/2021 |
$11,165 |
$11,720 |
$11,991 |
11/2021 |
$11,252 |
$11,804 |
$12,132 |
12/2021 |
$11,142 |
$11,756 |
$12,016 |
01/2022 |
$10,933 |
$11,571 |
$11,806 |
02/2022 |
$10,625 |
$11,417 |
$11,524 |
03/2022 |
$10,473 |
$11,171 |
$11,233 |
04/2022 |
$10,083 |
$10,871 |
$10,828 |
05/2022 |
$9,927 |
$10,856 |
$10,691 |
06/2022 |
$9,548 |
$10,691 |
$10,398 |
07/2022 |
$9,971 |
$10,963 |
$10,872 |
08/2022 |
$9,536 |
$10,677 |
$10,366 |
09/2022 |
$9,101 |
$10,334 |
$9,935 |
10/2022 |
$9,135 |
$10,299 |
$9,925 |
11/2022 |
$9,514 |
$10,562 |
$10,278 |
12/2022 |
$9,277 |
$10,437 |
$9,972 |
01/2023 |
$9,568 |
$10,677 |
$10,263 |
02/2023 |
$9,359 |
$10,507 |
$10,054 |
03/2023 |
$9,498 |
$10,740 |
$10,267 |
04/2023 |
$9,545 |
$10,795 |
$10,312 |
05/2023 |
$9,510 |
$10,753 |
$10,308 |
06/2023 |
$9,475 |
$10,746 |
$10,299 |
07/2023 |
$9,533 |
$10,750 |
$10,341 |
08/2023 |
$9,533 |
$10,736 |
$10,359 |
09/2023 |
$9,359 |
$10,551 |
$10,170 |
10/2023 |
$9,370 |
$10,476 |
$10,171 |
11/2023 |
$9,695 |
$10,836 |
$10,520 |
12/2023 |
$10,064 |
$11,183 |
$10,925 |
01/2024 |
$9,993 |
$11,161 |
$10,887 |
02/2024 |
$9,910 |
$11,084 |
$10,788 |
03/2024 |
$10,028 |
$11,184 |
$10,928 |
04/2024 |
$9,851 |
$11,004 |
$10,770 |
05/2024 |
$9,898 |
$11,101 |
$10,826 |
06/2024 |
$9,969 |
$11,198 |
$10,886 |
07/2024 |
$10,182 |
$11,414 |
$11,123 |
08/2024 |
$10,253 |
$11,539 |
$11,204 |
09/2024 |
$10,372 |
$11,673 |
$11,344 |
10/2024 |
$10,265 |
$11,515 |
$11,249 |
11/2024 |
$10,466 |
$11,652 |
$11,458 |
12/2024 |
$10,323 |
$11,562 |
$11,344 |
|
| Average Annual Return [Table Text Block] |
|
AATR |
1 Year |
5 Years |
Since Inception 2/28/17 |
Class A at NAV |
2.57% |
(0.67%) |
0.96% |
Class A with 4.25% MSCFootnote Reference1 |
(1.82%) |
(1.53%) |
0.41% |
Bloomberg Global Aggregate Bond Index - USD Hedged |
3.40% |
0.48% |
1.86% |
Bloomberg MSCI Global Green Bond Index - USD Hedged |
3.83% |
(0.32%) |
1.62% | |
| Performance Inception Date |
|
Feb. 28, 2017
|
| Previous Investment Adviser [Text Block] |
|
|
| Updated Performance Information Location [Text Block] |
|
visit im.natixis.com/en-us/products/mutual-funds/price-and-performance
|
| AssetsNet |
|
$ 38,096,678
|
| Holdings Count | Holding |
|
82
|
| Advisory Fees Paid, Amount |
|
$ 17,744
|
| InvestmentCompanyPortfolioTurnover |
|
10.00%
|
| Additional Fund Statistics [Text Block] |
|
Total Net Assets |
$38,096,678 |
# of Portfolio Holdings (including overnight repurchase agreements and derivatives) |
82 |
Portfolio Turnover Rate |
10% |
Total Advisory Fees Paid (after waiver/reimbursement, if applicable) |
$17,744 | |
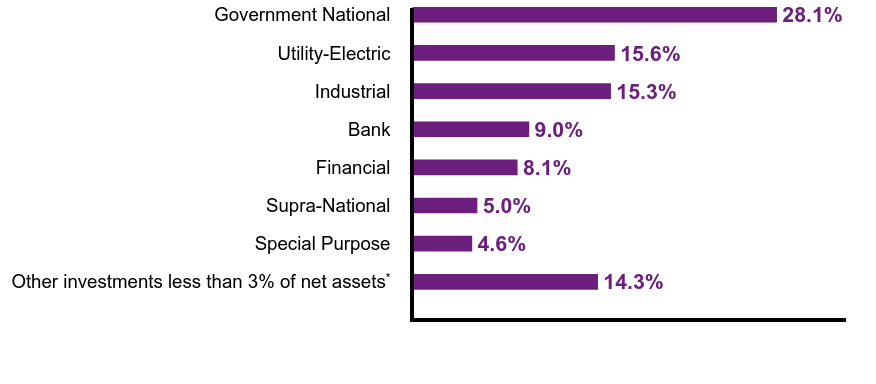
| Holdings [Text Block] |
|
Value |
Value |
Other investments less than 3% of net assetsFootnote Reference* |
14.3% |
Special Purpose |
4.6% |
Supra-National |
5.0% |
Financial |
8.1% |
Bank |
9.0% |
Industrial |
15.3% |
Utility-Electric |
15.6% |
Government National |
28.1% |
| Footnote |
Description |
Footnote* |
Net of other assets less liabilities (including futures contracts) |
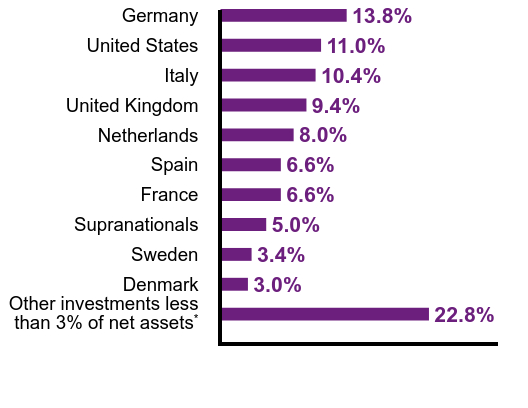
Value |
Value |
Other investments less than 3% of net assetsFootnote Reference* |
22.8% |
Denmark |
3.0% |
Sweden |
3.4% |
Supranationals |
5.0% |
France |
6.6% |
Spain |
6.6% |
Netherlands |
8.0% |
United Kingdom |
9.4% |
Italy |
10.4% |
United States |
11.0% |
Germany |
13.8% | |
| Credit Quality Explanation [Text Block] |
|
Credit ratings are by S&P Global Ratings. A credit rating is an assessment provided by a nationally recognized statistical rating organization (NRSRO) of the creditworthiness of an issuer with respect to debt obligations except for those debt obligations that are only privately rated. Ratings are measured on a scale that generally ranges from AAA (highest) to D (lowest). The credit ratings shown relate to the creditworthiness of the issuers of the underlying securities in the Fund, and not to the Fund or its shares. Credit ratings are subject to change.
|
| C000178445 |
|
|
| Shareholder Report [Line Items] |
|
|
| Fund Name |
|
Mirova Global Green Bond Fund
|
| Class Name |
|
Class N
|
| Trading Symbol |
|
MGGNX
|
| Annual or Semi-Annual Statement [Text Block] |
|
This annual shareholder report contains important information about Mirova Global Green Bond Fund for the period of January 1, 2024 to December 31, 2024.
|
| Shareholder Report Annual or Semi-Annual |
|
Annual Shareholder Report
|
| Additional Information [Text Block] |
|
You can find additional information (including tax information) about the Fund at im.natixis.com/funddocuments. You can also request the information by contacting us at (800) 225-5478 or by contacting your financial intermediary directly.
|
| Additional Information Phone Number |
|
(800) 225-5478
|
| Additional Information Website |
|
<span style="box-sizing: border-box; color: rgb(0, 0, 0); display: inline; flex-wrap: nowrap; font-size: 12px; font-weight: 400; grid-area: auto; line-height: 18px; margin: 0px; overflow: visible; text-align: left; white-space-collapse: preserve-breaks;">im.natixis.com/funddocuments</span>
|
| Expenses [Text Block] |
|
What were the fund costs for the last year? (based on a hypothetical $10,000 investment)
Class Name |
Costs of a $10,000 investment |
Costs paid as a percentage of a $10,000 investmentFootnote Reference† |
Class N |
$61 |
0.60% |
| Footnote |
Description |
Footnote† |
Annualized for periods less than one year (if applicable). | |
| Expenses Paid, Amount |
|
$ 61
|
| Expense Ratio, Percent |
|
0.60%
|
| Factors Affecting Performance [Text Block] |
|
How did the fund perform last year and what affected its performance?Explanation of Fund Performance In 2024, the Mirova Global Green Bond Fund lagged in overall performance which can be attributed to movements on the yield curve. Top Contributors to Performance •Allocation had a positive impact on the Fund during the year due to its long position on credit, while US and Euro credit spreads compressed. •Issue selection during the year was also positive. The largest contributors to this outperformance were among the corporate holdings, namely Altarea, Johnson Controls, and EIB. Top Detractors from Performance •The Fund's duration and curve strategy during the year incurred a cost, negatively impacting performance. •Yield curve positioning on the CAD zone, Euro zone and USD zone were negative throughout the year. •Among the worst detractors were Philips, Vestas, and Credit Mutuelle Arkea. |
| Performance Past Does Not Indicate Future [Text] |
|
Performance data shown represents past performance and is no guarantee of, and is not necessarily indicative of, future results. Total return and value will vary, and you may have a gain or loss when shares are sold. Current performance may be lower or higher than quoted. For the most recent month-end performance,
|
| Line Graph [Table Text Block] |
|
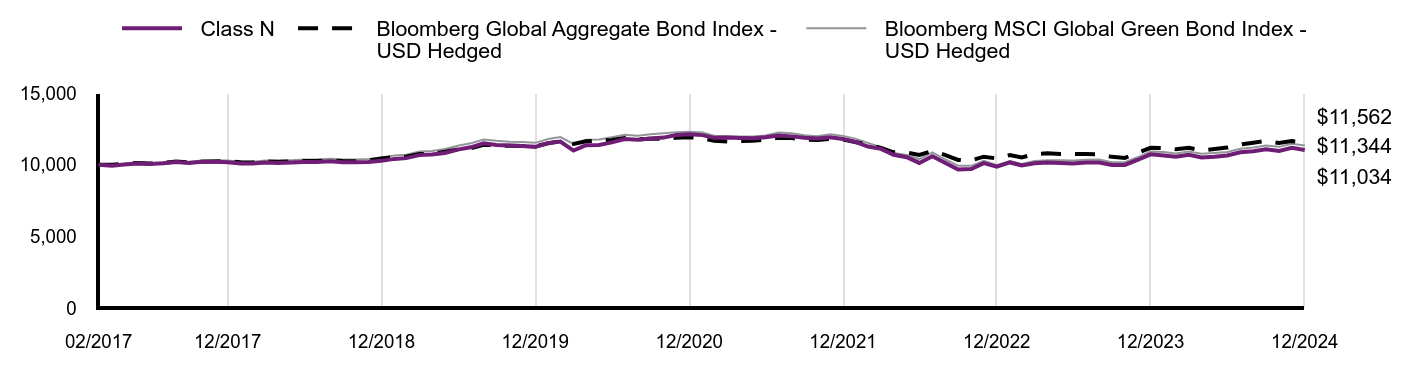
|
Class N |
Bloomberg Global Aggregate Bond Index - USD Hedged |
Bloomberg MSCI Global Green Bond Index - USD Hedged |
02/2017 |
$10,000 |
$10,000 |
$10,000 |
03/2017 |
$9,930 |
$9,995 |
$9,984 |
04/2017 |
$10,020 |
$10,063 |
$10,076 |
05/2017 |
$10,080 |
$10,122 |
$10,149 |
06/2017 |
$10,050 |
$10,094 |
$10,103 |
07/2017 |
$10,100 |
$10,127 |
$10,153 |
08/2017 |
$10,190 |
$10,219 |
$10,266 |
09/2017 |
$10,131 |
$10,172 |
$10,216 |
10/2017 |
$10,201 |
$10,215 |
$10,295 |
11/2017 |
$10,211 |
$10,231 |
$10,316 |
12/2017 |
$10,177 |
$10,253 |
$10,302 |
01/2018 |
$10,086 |
$10,180 |
$10,217 |
02/2018 |
$10,086 |
$10,157 |
$10,217 |
03/2018 |
$10,165 |
$10,242 |
$10,293 |
04/2018 |
$10,123 |
$10,203 |
$10,271 |
05/2018 |
$10,165 |
$10,242 |
$10,322 |
06/2018 |
$10,184 |
$10,261 |
$10,362 |
07/2018 |
$10,194 |
$10,263 |
$10,368 |
08/2018 |
$10,236 |
$10,295 |
$10,422 |
09/2018 |
$10,176 |
$10,256 |
$10,372 |
10/2018 |
$10,176 |
$10,236 |
$10,372 |
11/2018 |
$10,196 |
$10,286 |
$10,404 |
12/2018 |
$10,272 |
$10,434 |
$10,515 |
01/2019 |
$10,409 |
$10,545 |
$10,648 |
02/2019 |
$10,462 |
$10,557 |
$10,694 |
03/2019 |
$10,672 |
$10,747 |
$10,923 |
04/2019 |
$10,714 |
$10,753 |
$10,961 |
05/2019 |
$10,820 |
$10,908 |
$11,095 |
06/2019 |
$11,059 |
$11,061 |
$11,327 |
07/2019 |
$11,219 |
$11,148 |
$11,494 |
08/2019 |
$11,495 |
$11,400 |
$11,757 |
09/2019 |
$11,385 |
$11,348 |
$11,675 |
10/2019 |
$11,343 |
$11,328 |
$11,613 |
11/2019 |
$11,311 |
$11,315 |
$11,596 |
12/2019 |
$11,249 |
$11,292 |
$11,529 |
01/2020 |
$11,509 |
$11,495 |
$11,801 |
02/2020 |
$11,617 |
$11,636 |
$11,929 |
03/2020 |
$10,991 |
$11,455 |
$11,460 |
04/2020 |
$11,361 |
$11,640 |
$11,743 |
05/2020 |
$11,382 |
$11,673 |
$11,771 |
06/2020 |
$11,562 |
$11,732 |
$11,922 |
07/2020 |
$11,801 |
$11,860 |
$12,093 |
08/2020 |
$11,747 |
$11,774 |
$12,027 |
09/2020 |
$11,840 |
$11,817 |
$12,125 |
10/2020 |
$11,895 |
$11,818 |
$12,192 |
11/2020 |
$12,070 |
$11,885 |
$12,265 |
12/2020 |
$12,137 |
$11,922 |
$12,298 |
01/2021 |
$12,069 |
$11,858 |
$12,244 |
02/2021 |
$11,878 |
$11,673 |
$12,021 |
03/2021 |
$11,910 |
$11,627 |
$11,990 |
04/2021 |
$11,876 |
$11,658 |
$11,967 |
05/2021 |
$11,853 |
$11,684 |
$11,972 |
06/2021 |
$11,913 |
$11,741 |
$12,037 |
07/2021 |
$12,038 |
$11,887 |
$12,248 |
08/2021 |
$11,981 |
$11,863 |
$12,200 |
09/2021 |
$11,889 |
$11,751 |
$12,055 |
10/2021 |
$11,832 |
$11,720 |
$11,991 |
11/2021 |
$11,923 |
$11,804 |
$12,132 |
12/2021 |
$11,805 |
$11,756 |
$12,016 |
01/2022 |
$11,584 |
$11,571 |
$11,806 |
02/2022 |
$11,271 |
$11,417 |
$11,524 |
03/2022 |
$11,107 |
$11,171 |
$11,233 |
04/2022 |
$10,694 |
$10,871 |
$10,828 |
05/2022 |
$10,529 |
$10,856 |
$10,691 |
06/2022 |
$10,128 |
$10,691 |
$10,398 |
07/2022 |
$10,588 |
$10,963 |
$10,872 |
08/2022 |
$10,116 |
$10,677 |
$10,366 |
09/2022 |
$9,668 |
$10,334 |
$9,935 |
10/2022 |
$9,704 |
$10,299 |
$9,925 |
11/2022 |
$10,116 |
$10,562 |
$10,278 |
12/2022 |
$9,867 |
$10,437 |
$9,972 |
01/2023 |
$10,161 |
$10,677 |
$10,263 |
02/2023 |
$9,953 |
$10,507 |
$10,054 |
03/2023 |
$10,100 |
$10,740 |
$10,267 |
04/2023 |
$10,149 |
$10,795 |
$10,312 |
05/2023 |
$10,124 |
$10,753 |
$10,308 |
06/2023 |
$10,087 |
$10,746 |
$10,299 |
07/2023 |
$10,149 |
$10,750 |
$10,341 |
08/2023 |
$10,149 |
$10,736 |
$10,359 |
09/2023 |
$9,977 |
$10,551 |
$10,170 |
10/2023 |
$9,989 |
$10,476 |
$10,171 |
11/2023 |
$10,333 |
$10,836 |
$10,520 |
12/2023 |
$10,728 |
$11,183 |
$10,925 |
01/2024 |
$10,653 |
$11,161 |
$10,887 |
02/2024 |
$10,565 |
$11,084 |
$10,788 |
03/2024 |
$10,691 |
$11,184 |
$10,928 |
04/2024 |
$10,515 |
$11,004 |
$10,770 |
05/2024 |
$10,565 |
$11,101 |
$10,826 |
06/2024 |
$10,653 |
$11,198 |
$10,886 |
07/2024 |
$10,866 |
$11,414 |
$11,123 |
08/2024 |
$10,942 |
$11,539 |
$11,204 |
09/2024 |
$11,080 |
$11,673 |
$11,344 |
10/2024 |
$10,967 |
$11,515 |
$11,249 |
11/2024 |
$11,180 |
$11,652 |
$11,458 |
12/2024 |
$11,034 |
$11,562 |
$11,344 |
|
| Average Annual Return [Table Text Block] |
|
AATR |
1 Year |
5 Years |
Since Inception 2/28/17 |
Class N |
2.85% |
(0.39%) |
1.26% |
Bloomberg Global Aggregate Bond Index - USD Hedged |
3.40% |
0.48% |
1.86% |
Bloomberg MSCI Global Green Bond Index - USD Hedged |
3.83% |
(0.32%) |
1.62% | |
| Performance Inception Date |
|
Feb. 28, 2017
|
| Previous Investment Adviser [Text Block] |
|
|
| Updated Performance Information Location [Text Block] |
|
visit im.natixis.com/en-us/products/mutual-funds/price-and-performance
|
| AssetsNet |
|
$ 38,096,678
|
| Holdings Count | Holding |
|
82
|
| Advisory Fees Paid, Amount |
|
$ 17,744
|
| InvestmentCompanyPortfolioTurnover |
|
10.00%
|
| Additional Fund Statistics [Text Block] |
|
Total Net Assets |
$38,096,678 |
# of Portfolio Holdings (including overnight repurchase agreements and derivatives) |
82 |
Portfolio Turnover Rate |
10% |
Total Advisory Fees Paid (after waiver/reimbursement, if applicable) |
$17,744 | |
| Holdings [Text Block] |
|
Value |
Value |
Other investments less than 3% of net assetsFootnote Reference* |
14.3% |
Special Purpose |
4.6% |
Supra-National |
5.0% |
Financial |
8.1% |
Bank |
9.0% |
Industrial |
15.3% |
Utility-Electric |
15.6% |
Government National |
28.1% |
| Footnote |
Description |
Footnote* |
Net of other assets less liabilities (including futures contracts) |
Value |
Value |
Other investments less than 3% of net assetsFootnote Reference* |
22.8% |
Denmark |
3.0% |
Sweden |
3.4% |
Supranationals |
5.0% |
France |
6.6% |
Spain |
6.6% |
Netherlands |
8.0% |
United Kingdom |
9.4% |
Italy |
10.4% |
United States |
11.0% |
Germany |
13.8% | |
| Credit Quality Explanation [Text Block] |
|
Credit ratings are by S&P Global Ratings. A credit rating is an assessment provided by a nationally recognized statistical rating organization (NRSRO) of the creditworthiness of an issuer with respect to debt obligations except for those debt obligations that are only privately rated. Ratings are measured on a scale that generally ranges from AAA (highest) to D (lowest). The credit ratings shown relate to the creditworthiness of the issuers of the underlying securities in the Fund, and not to the Fund or its shares. Credit ratings are subject to change.
|
| C000178446 |
|
|
| Shareholder Report [Line Items] |
|
|
| Fund Name |
|
Mirova Global Green Bond Fund
|
| Class Name |
|
Class Y
|
| Trading Symbol |
|
MGGYX
|
| Annual or Semi-Annual Statement [Text Block] |
|
This annual shareholder report contains important information about Mirova Global Green Bond Fund for the period of January 1, 2024 to December 31, 2024.
|
| Shareholder Report Annual or Semi-Annual |
|
Annual Shareholder Report
|
| Additional Information [Text Block] |
|
You can find additional information (including tax information) about the Fund at im.natixis.com/funddocuments. You can also request the information by contacting us at (800) 225-5478 or by contacting your financial intermediary directly.
|
| Additional Information Phone Number |
|
(800) 225-5478
|
| Additional Information Website |
|
<span style="box-sizing: border-box; color: rgb(0, 0, 0); display: inline; flex-wrap: nowrap; font-size: 12px; font-weight: 400; grid-area: auto; line-height: 18px; margin: 0px; overflow: visible; text-align: left; white-space-collapse: preserve-breaks;">im.natixis.com/funddocuments</span>
|
| Expenses [Text Block] |
|
What were the fund costs for the last year? (based on a hypothetical $10,000 investment)
Class Name |
Costs of a $10,000 investment |
Costs paid as a percentage of a $10,000 investmentFootnote Reference† |
Class Y |
$66 |
0.65% |
| Footnote |
Description |
Footnote† |
Annualized for periods less than one year (if applicable). | |
| Expenses Paid, Amount |
|
$ 66
|
| Expense Ratio, Percent |
|
0.65%
|
| Factors Affecting Performance [Text Block] |
|
How did the fund perform last year and what affected its performance?Explanation of Fund Performance In 2024, the Mirova Global Green Bond Fund lagged in overall performance which can be attributed to movements on the yield curve. Top Contributors to Performance •Allocation had a positive impact on the Fund during the year due to its long position on credit, while US and Euro credit spreads compressed. •Issue selection during the year was also positive. The largest contributors to this outperformance were among the corporate holdings, namely Altarea, Johnson Controls, and EIB. Top Detractors from Performance •The Fund's duration and curve strategy during the year incurred a cost, negatively impacting performance. •Yield curve positioning on the CAD zone, Euro zone and USD zone were negative throughout the year. •Among the worst detractors were Philips, Vestas, and Credit Mutuelle Arkea. |
| Performance Past Does Not Indicate Future [Text] |
|
Performance data shown represents past performance and is no guarantee of, and is not necessarily indicative of, future results. Total return and value will vary, and you may have a gain or loss when shares are sold. Current performance may be lower or higher than quoted. For the most recent month-end performance,
|
| Line Graph [Table Text Block] |
|

|
Class Y |
Bloomberg Global Aggregate Bond Index - USD Hedged |
Bloomberg MSCI Global Green Bond Index - USD Hedged |
02/2017 |
$10,000 |
$10,000 |
$10,000 |
03/2017 |
$9,920 |
$9,995 |
$9,984 |
04/2017 |
$10,020 |
$10,063 |
$10,076 |
05/2017 |
$10,080 |
$10,122 |
$10,149 |
06/2017 |
$10,040 |
$10,094 |
$10,103 |
07/2017 |
$10,090 |
$10,127 |
$10,153 |
08/2017 |
$10,180 |
$10,219 |
$10,266 |
09/2017 |
$10,130 |
$10,172 |
$10,216 |
10/2017 |
$10,191 |
$10,215 |
$10,295 |
11/2017 |
$10,201 |
$10,231 |
$10,316 |
12/2017 |
$10,166 |
$10,253 |
$10,302 |
01/2018 |
$10,075 |
$10,180 |
$10,217 |
02/2018 |
$10,075 |
$10,157 |
$10,217 |
03/2018 |
$10,153 |
$10,242 |
$10,293 |
04/2018 |
$10,112 |
$10,203 |
$10,271 |
05/2018 |
$10,153 |
$10,242 |
$10,322 |
06/2018 |
$10,171 |
$10,261 |
$10,362 |
07/2018 |
$10,171 |
$10,263 |
$10,368 |
08/2018 |
$10,213 |
$10,295 |
$10,422 |
09/2018 |
$10,162 |
$10,256 |
$10,372 |
10/2018 |
$10,162 |
$10,236 |
$10,372 |
11/2018 |
$10,183 |
$10,286 |
$10,404 |
12/2018 |
$10,257 |
$10,434 |
$10,515 |
01/2019 |
$10,405 |
$10,545 |
$10,648 |
02/2019 |
$10,436 |
$10,557 |
$10,694 |
03/2019 |
$10,656 |
$10,747 |
$10,923 |
04/2019 |
$10,688 |
$10,753 |
$10,961 |
05/2019 |
$10,804 |
$10,908 |
$11,095 |
06/2019 |
$11,042 |
$11,061 |
$11,327 |
07/2019 |
$11,190 |
$11,148 |
$11,494 |
08/2019 |
$11,477 |
$11,400 |
$11,757 |
09/2019 |
$11,367 |
$11,348 |
$11,675 |
10/2019 |
$11,324 |
$11,328 |
$11,613 |
11/2019 |
$11,282 |
$11,315 |
$11,596 |
12/2019 |
$11,218 |
$11,292 |
$11,529 |
01/2020 |
$11,489 |
$11,495 |
$11,801 |
02/2020 |
$11,597 |
$11,636 |
$11,929 |
03/2020 |
$10,970 |
$11,455 |
$11,460 |
04/2020 |
$11,339 |
$11,640 |
$11,743 |
05/2020 |
$11,361 |
$11,673 |
$11,771 |
06/2020 |
$11,539 |
$11,732 |
$11,922 |
07/2020 |
$11,778 |
$11,860 |
$12,093 |
08/2020 |
$11,724 |
$11,774 |
$12,027 |
09/2020 |
$11,816 |
$11,817 |
$12,125 |
10/2020 |
$11,871 |
$11,818 |
$12,192 |
11/2020 |
$12,045 |
$11,885 |
$12,265 |
12/2020 |
$12,099 |
$11,922 |
$12,298 |
01/2021 |
$12,043 |
$11,858 |
$12,244 |
02/2021 |
$11,852 |
$11,673 |
$12,021 |
03/2021 |
$11,883 |
$11,627 |
$11,990 |
04/2021 |
$11,849 |
$11,658 |
$11,967 |
05/2021 |
$11,826 |
$11,684 |
$11,972 |
06/2021 |
$11,884 |
$11,741 |
$12,037 |
07/2021 |
$11,997 |
$11,887 |
$12,248 |
08/2021 |
$11,952 |
$11,863 |
$12,200 |
09/2021 |
$11,859 |
$11,751 |
$12,055 |
10/2021 |
$11,791 |
$11,720 |
$11,991 |
11/2021 |
$11,893 |
$11,804 |
$12,132 |
12/2021 |
$11,774 |
$11,756 |
$12,016 |
01/2022 |
$11,554 |
$11,571 |
$11,806 |
02/2022 |
$11,229 |
$11,417 |
$11,524 |
03/2022 |
$11,076 |
$11,171 |
$11,233 |
04/2022 |
$10,664 |
$10,871 |
$10,828 |
05/2022 |
$10,499 |
$10,856 |
$10,691 |
06/2022 |
$10,099 |
$10,691 |
$10,398 |
07/2022 |
$10,558 |
$10,963 |
$10,872 |
08/2022 |
$10,087 |
$10,677 |
$10,366 |
09/2022 |
$9,640 |
$10,334 |
$9,935 |
10/2022 |
$9,675 |
$10,299 |
$9,925 |
11/2022 |
$10,075 |
$10,562 |
$10,278 |
12/2022 |
$9,838 |
$10,437 |
$9,972 |
01/2023 |
$10,132 |
$10,677 |
$10,263 |
02/2023 |
$9,923 |
$10,507 |
$10,054 |
03/2023 |
$10,070 |
$10,740 |
$10,267 |
04/2023 |
$10,119 |
$10,795 |
$10,312 |
05/2023 |
$10,083 |
$10,753 |
$10,308 |
06/2023 |
$10,058 |
$10,746 |
$10,299 |
07/2023 |
$10,107 |
$10,750 |
$10,341 |
08/2023 |
$10,119 |
$10,736 |
$10,359 |
09/2023 |
$9,936 |
$10,551 |
$10,170 |
10/2023 |
$9,948 |
$10,476 |
$10,171 |
11/2023 |
$10,291 |
$10,836 |
$10,520 |
12/2023 |
$10,693 |
$11,183 |
$10,925 |
01/2024 |
$10,605 |
$11,161 |
$10,887 |
02/2024 |
$10,530 |
$11,084 |
$10,788 |
03/2024 |
$10,655 |
$11,184 |
$10,928 |
04/2024 |
$10,480 |
$11,004 |
$10,770 |
05/2024 |
$10,518 |
$11,101 |
$10,826 |
06/2024 |
$10,605 |
$11,198 |
$10,886 |
07/2024 |
$10,831 |
$11,414 |
$11,123 |
08/2024 |
$10,906 |
$11,539 |
$11,204 |
09/2024 |
$11,044 |
$11,673 |
$11,344 |
10/2024 |
$10,918 |
$11,515 |
$11,249 |
11/2024 |
$11,144 |
$11,652 |
$11,458 |
12/2024 |
$10,992 |
$11,562 |
$11,344 |
|
| Average Annual Return [Table Text Block] |
|
AATR |
1 Year |
5 Years |
Since Inception 2/28/17 |
Class Y |
2.80% |
(0.41%) |
1.21% |
Bloomberg Global Aggregate Bond Index - USD Hedged |
3.40% |
0.48% |
1.86% |
Bloomberg MSCI Global Green Bond Index - USD Hedged |
3.83% |
(0.32%) |
1.62% | |
| Performance Inception Date |
|
Feb. 28, 2017
|
| Previous Investment Adviser [Text Block] |
|
|
| Updated Performance Information Location [Text Block] |
|
visit im.natixis.com/en-us/products/mutual-funds/price-and-performance
|
| AssetsNet |
|
$ 38,096,678
|
| Holdings Count | Holding |
|
82
|
| Advisory Fees Paid, Amount |
|
$ 17,744
|
| InvestmentCompanyPortfolioTurnover |
|
10.00%
|
| Additional Fund Statistics [Text Block] |
|
Total Net Assets |
$38,096,678 |
# of Portfolio Holdings (including overnight repurchase agreements and derivatives) |
82 |
Portfolio Turnover Rate |
10% |
Total Advisory Fees Paid (after waiver/reimbursement, if applicable) |
$17,744 | |
| Holdings [Text Block] |
|
Value |
Value |
Other investments less than 3% of net assetsFootnote Reference* |
14.3% |
Special Purpose |
4.6% |
Supra-National |
5.0% |
Financial |
8.1% |
Bank |
9.0% |
Industrial |
15.3% |
Utility-Electric |
15.6% |
Government National |
28.1% |
| Footnote |
Description |
Footnote* |
Net of other assets less liabilities (including futures contracts) |
Value |
Value |
Other investments less than 3% of net assetsFootnote Reference* |
22.8% |
Denmark |
3.0% |
Sweden |
3.4% |
Supranationals |
5.0% |
France |
6.6% |
Spain |
6.6% |
Netherlands |
8.0% |
United Kingdom |
9.4% |
Italy |
10.4% |
United States |
11.0% |
Germany |
13.8% | |
| Credit Quality Explanation [Text Block] |
|
Credit ratings are by S&P Global Ratings. A credit rating is an assessment provided by a nationally recognized statistical rating organization (NRSRO) of the creditworthiness of an issuer with respect to debt obligations except for those debt obligations that are only privately rated. Ratings are measured on a scale that generally ranges from AAA (highest) to D (lowest). The credit ratings shown relate to the creditworthiness of the issuers of the underlying securities in the Fund, and not to the Fund or its shares. Credit ratings are subject to change.
|
| C000167845 |
|
|
| Shareholder Report [Line Items] |
|
|
| Fund Name |
|
Mirova Global Sustainable Equity Fund
|
| Class Name |
|
Class A
|
| Trading Symbol |
|
ESGMX
|
| Annual or Semi-Annual Statement [Text Block] |
|
This annual shareholder report contains important information about Mirova Global Sustainable Equity Fund for the period of January 1, 2024 to December 31, 2024.
|
| Shareholder Report Annual or Semi-Annual |
|
Annual Shareholder Report
|
| Additional Information [Text Block] |
|
You can find additional information (including tax information) about the Fund at im.natixis.com/funddocuments. You can also request the information by contacting us at (800) 225-5478 or by contacting your financial intermediary directly.
|
| Additional Information Phone Number |
|
(800) 225-5478
|
| Additional Information Website |
|
<span style="box-sizing: border-box; color: rgb(0, 0, 0); display: inline; flex-wrap: nowrap; font-size: 12px; font-weight: 400; grid-area: auto; line-height: 18px; margin: 0px; overflow: visible; text-align: left; white-space-collapse: preserve-breaks;">im.natixis.com/funddocuments</span>
|
| Expenses [Text Block] |
|
What were the fund costs for the last year? (based on a hypothetical $10,000 investment)
Class Name |
Costs of a $10,000 investment |
Costs paid as a percentage of a $10,000 investmentFootnote Reference† |
Class A |
$128 |
1.20% |
| Footnote |
Description |
Footnote† |
Annualized for periods less than one year (if applicable). | |
| Expenses Paid, Amount |
|
$ 128
|
| Expense Ratio, Percent |
|
1.20%
|
| Factors Affecting Performance [Text Block] |
|
How did the fund perform last year and what affected its performance?Explanation of Fund Performance While the Fund delivered strong absolute returns for the full year, it lagged in overall performance mainly due to fourth quarter results as the Fund was underexposed to some of the areas expected to benefit under a Trump presidency. This included U.S. stocks, bank and energy stocks, and lower quality and procyclical areas. Certain companies also faced industry-wide or company-specific challenges. Top Contributors to Performance • Lack of exposure to the Energy and Real Estate sectors and an underweight to Consumer Staples contributed to performance. • Stock selection in Health Care (Eli Lilly and Intuitive Surgical) and Materials (Smurfit Westrock and not owning mining companies) contributed. •Nvidia, Taiwan Semi and eBay were the largest contributors to performance. Top Detractors from Performance •An overweight to Health Care and Materials, and underweight to Communication Services, which was led by Magnificent 7 stocks the Fund does not own (Meta, Alphabet), detracted. •As U.S. equities outperformed, driven in part by the Magnificent 7, the Fund’s U.S. underweight and Europe overweight detracted. •Stock picks in Industrials (Vestas Wind Systems and AGCO Corp) and Financials (AIA Group and Legal & General) detracted from relative performance. •Vestas Wind Systems, Aptiv and Adobe were the largest detractors overall. The Fund continued to invest for the long term, in high-quality companies likely to benefit from the demographic, technological, environmental and governance related transitions expected to transform the world’s economies during the next decade. |
| Performance Past Does Not Indicate Future [Text] |
|
Performance data shown represents past performance and is no guarantee of, and is not necessarily indicative of, future results. Total return and value will vary, and you may have a gain or loss when shares are sold. Current performance may be lower or higher than quoted. For the most recent month-end performance,
|
| Line Graph [Table Text Block] |
|
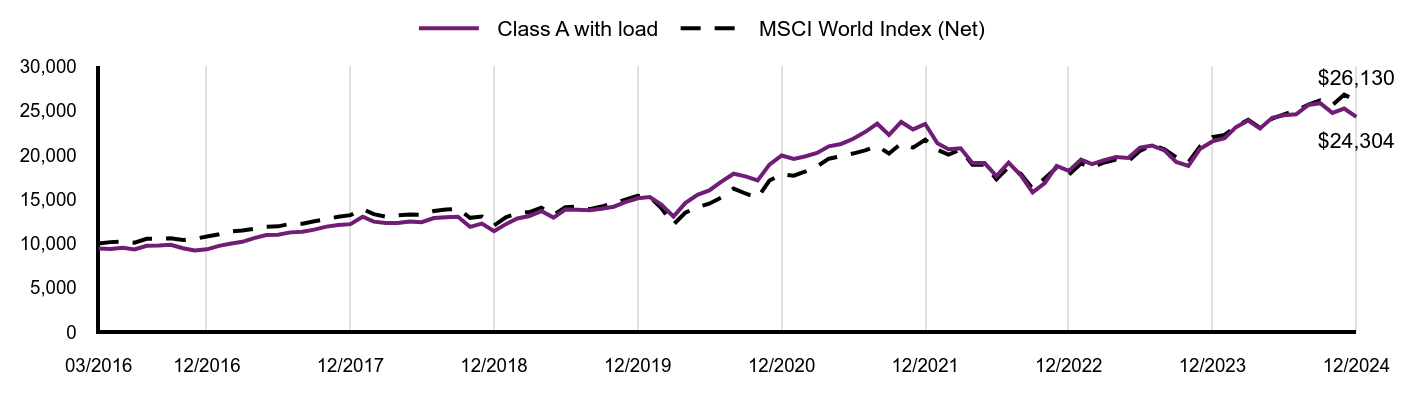
|
Class A with load |
MSCI World Index (Net) |
03/2016 |
$9,425 |
$10,000 |
04/2016 |
$9,369 |
$10,158 |
05/2016 |
$9,529 |
$10,215 |
06/2016 |
$9,331 |
$10,101 |
07/2016 |
$9,746 |
$10,528 |
08/2016 |
$9,764 |
$10,536 |
09/2016 |
$9,859 |
$10,592 |
10/2016 |
$9,463 |
$10,387 |
11/2016 |
$9,208 |
$10,537 |
12/2016 |
$9,345 |
$10,789 |
01/2017 |
$9,732 |
$11,049 |
02/2017 |
$9,967 |
$11,356 |
03/2017 |
$10,194 |
$11,477 |
04/2017 |
$10,609 |
$11,647 |
05/2017 |
$10,968 |
$11,893 |
06/2017 |
$10,987 |
$11,939 |
07/2017 |
$11,261 |
$12,224 |
08/2017 |
$11,336 |
$12,242 |
09/2017 |
$11,572 |
$12,516 |
10/2017 |
$11,912 |
$12,753 |
11/2017 |
$12,101 |
$13,029 |
12/2017 |
$12,189 |
$13,206 |
01/2018 |
$13,029 |
$13,903 |
02/2018 |
$12,476 |
$13,327 |
03/2018 |
$12,333 |
$13,036 |
04/2018 |
$12,322 |
$13,186 |
05/2018 |
$12,475 |
$13,269 |
06/2018 |
$12,418 |
$13,262 |
07/2018 |
$12,879 |
$13,677 |
08/2018 |
$12,975 |
$13,846 |
09/2018 |
$13,023 |
$13,923 |
10/2018 |
$11,880 |
$12,901 |
11/2018 |
$12,245 |
$13,047 |
12/2018 |
$11,392 |
$12,055 |
01/2019 |
$12,218 |
$12,993 |
02/2019 |
$12,834 |
$13,384 |
03/2019 |
$13,103 |
$13,560 |
04/2019 |
$13,667 |
$14,040 |
05/2019 |
$12,935 |
$13,230 |
06/2019 |
$13,838 |
$14,102 |
07/2019 |
$13,808 |
$14,172 |
08/2019 |
$13,757 |
$13,882 |
09/2019 |
$13,938 |
$14,177 |
10/2019 |
$14,159 |
$14,538 |
11/2019 |
$14,681 |
$14,943 |
12/2019 |
$15,109 |
$15,391 |
01/2020 |
$15,261 |
$15,297 |
02/2020 |
$14,400 |
$14,004 |
03/2020 |
$13,053 |
$12,151 |
04/2020 |
$14,573 |
$13,478 |
05/2020 |
$15,510 |
$14,129 |
06/2020 |
$16,008 |
$14,503 |
07/2020 |
$16,995 |
$15,197 |
08/2020 |
$17,891 |
$16,212 |
09/2020 |
$17,596 |
$15,653 |
10/2020 |
$17,128 |
$15,173 |
11/2020 |
$18,919 |
$17,113 |
12/2020 |
$19,954 |
$17,838 |
01/2021 |
$19,566 |
$17,661 |
02/2021 |
$19,842 |
$18,114 |
03/2021 |
$20,239 |
$18,716 |
04/2021 |
$20,983 |
$19,587 |
05/2021 |
$21,252 |
$19,869 |
06/2021 |
$21,810 |
$20,166 |
07/2021 |
$22,595 |
$20,527 |
08/2021 |
$23,545 |
$21,038 |
09/2021 |
$22,274 |
$20,164 |
10/2021 |
$23,741 |
$21,306 |
11/2021 |
$22,894 |
$20,839 |
12/2021 |
$23,509 |
$21,730 |
01/2022 |
$21,333 |
$20,580 |
02/2022 |
$20,657 |
$20,060 |
03/2022 |
$20,772 |
$20,610 |
04/2022 |
$19,088 |
$18,898 |
05/2022 |
$19,088 |
$18,912 |
06/2022 |
$17,624 |
$17,274 |
07/2022 |
$19,148 |
$18,646 |
08/2022 |
$17,707 |
$17,866 |
09/2022 |
$15,790 |
$16,205 |
10/2022 |
$16,838 |
$17,369 |
11/2022 |
$18,767 |
$18,577 |
12/2022 |
$18,206 |
$17,788 |
01/2023 |
$19,486 |
$19,047 |
02/2023 |
$18,983 |
$18,589 |
03/2023 |
$19,426 |
$19,163 |
04/2023 |
$19,785 |
$19,499 |
05/2023 |
$19,666 |
$19,304 |
06/2023 |
$20,827 |
$20,472 |
07/2023 |
$21,066 |
$21,159 |
08/2023 |
$20,527 |
$20,654 |
09/2023 |
$19,223 |
$19,763 |
10/2023 |
$18,780 |
$19,190 |
11/2023 |
$20,719 |
$20,989 |
12/2023 |
$21,541 |
$22,019 |
01/2024 |
$21,913 |
$22,283 |
02/2024 |
$23,150 |
$23,228 |
03/2024 |
$23,906 |
$23,975 |
04/2024 |
$23,000 |
$23,084 |
05/2024 |
$24,213 |
$24,115 |
06/2024 |
$24,489 |
$24,605 |
07/2024 |
$24,598 |
$25,039 |
08/2024 |
$25,667 |
$25,701 |
09/2024 |
$25,859 |
$26,172 |
10/2024 |
$24,766 |
$25,652 |
11/2024 |
$25,258 |
$26,830 |
12/2024 |
$24,304 |
$26,130 |
|
| Average Annual Return [Table Text Block] |
|
AATR |
1 Year |
5 Years |
Since Inception 3/31/16 |
Class A at NAV |
12.83% |
9.97% |
11.43% |
Class A with 5.75% MSCFootnote Reference1 |
6.37% |
8.68% |
10.68% |
MSCI World Index (Net) |
18.67% |
11.17% |
11.56% | |
| Performance Inception Date |
|
Mar. 31, 2016
|
| Previous Investment Adviser [Text Block] |
|
|
| Updated Performance Information Location [Text Block] |
|
visit im.natixis.com/en-us/products/mutual-funds/price-and-performance
|
| AssetsNet |
|
$ 974,101,733
|
| Holdings Count | Holding |
|
51
|
| Advisory Fees Paid, Amount |
|
$ 8,602,808
|
| InvestmentCompanyPortfolioTurnover |
|
18.00%
|
| Additional Fund Statistics [Text Block] |
|
Total Net Assets |
$974,101,733 |
# of Portfolio Holdings (including overnight repurchase agreements) |
51 |
Portfolio Turnover Rate |
18% |
Total Advisory Fees Paid (after waiver/reimbursement, if applicable) |
$8,602,808 | |
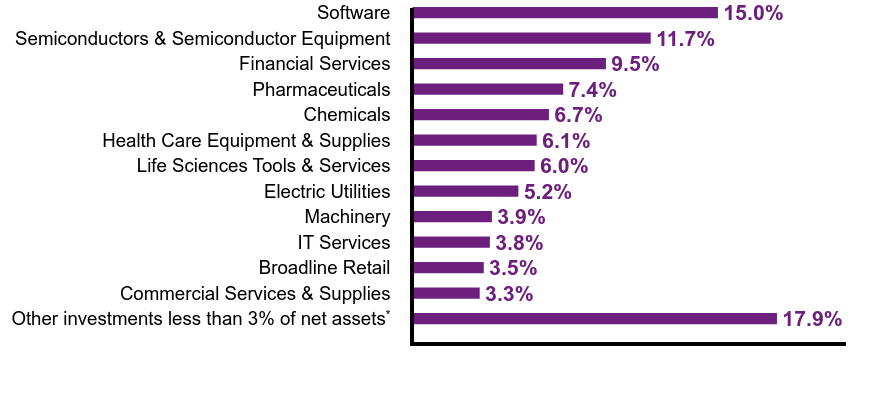
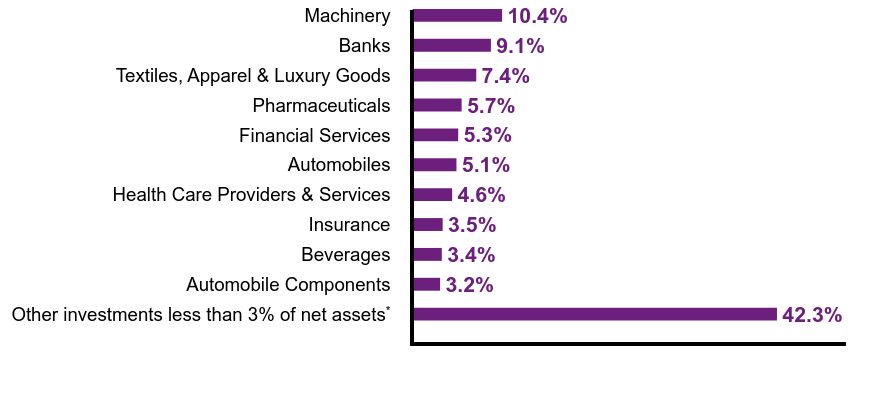
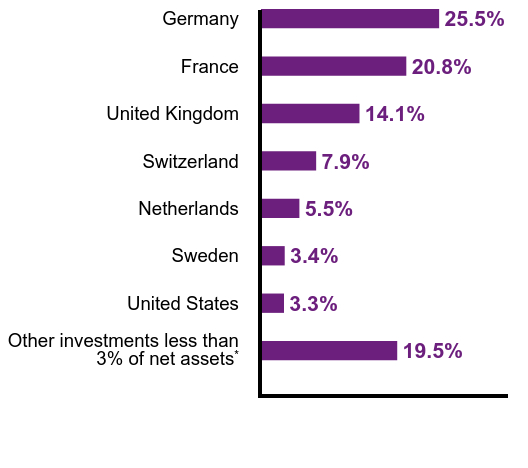
| Holdings [Text Block] |
|
Value |
Value |
Other investments less than 3% of net assetsFootnote Reference* |
17.9% |
Commercial Services & Supplies |
3.3% |
Broadline Retail |
3.5% |
IT Services |
3.8% |
Machinery |
3.9% |
Electric Utilities |
5.2% |
Life Sciences Tools & Services |
6.0% |
Health Care Equipment & Supplies |
6.1% |
Chemicals |
6.7% |
Pharmaceuticals |
7.4% |
Financial Services |
9.5% |
Semiconductors & Semiconductor Equipment |
11.7% |
Software |
15.0% |
| Footnote |
Description |
Footnote* |
Net of other assets less liabilities |
NVIDIA Corp. |
5.9% |
Microsoft Corp. |
5.5% |
Mastercard, Inc., Class A |
5.2% |
Eli Lilly & Co. |
3.8% |
Ecolab, Inc. |
3.7% |
eBay, Inc. |
3.5% |
Thermo Fisher Scientific, Inc. |
3.4% |
Taiwan Semiconductor Manufacturing Co. Ltd., ADR |
3.2% |
Roper Technologies, Inc. |
3.0% |
Iberdrola SA |
2.9% |
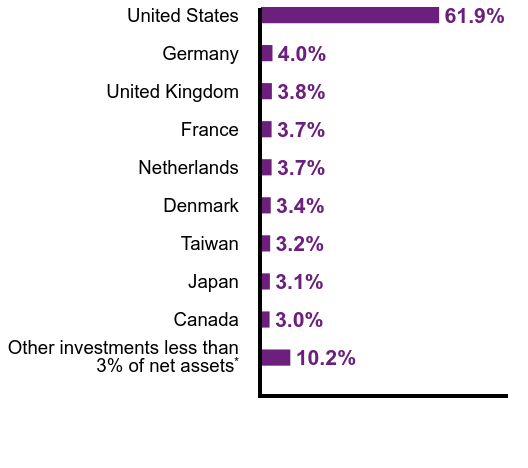
Value |
Value |
Other investments less than 3% of net assetsFootnote Reference* |
10.2% |
Canada |
3.0% |
Japan |
3.1% |
Taiwan |
3.2% |
Denmark |
3.4% |
Netherlands |
3.7% |
France |
3.7% |
United Kingdom |
3.8% |
Germany |
4.0% |
United States |
61.9% |
| Footnote |
Description |
Footnote* |
Net of other assets less liabilities | |
| Material Fund Change [Text Block] |
|
There were no material fund changes during the period. |
| C000167846 |
|
|
| Shareholder Report [Line Items] |
|
|
| Fund Name |
|
Mirova Global Sustainable Equity Fund
|
| Class Name |
|
Class C
|
| Trading Symbol |
|
ESGCX
|
| Annual or Semi-Annual Statement [Text Block] |
|
This annual shareholder report contains important information about Mirova Global Sustainable Equity Fund for the period of January 1, 2024 to December 31, 2024.
|
| Shareholder Report Annual or Semi-Annual |
|
Annual Shareholder Report
|
| Additional Information [Text Block] |
|
You can find additional information (including tax information) about the Fund at im.natixis.com/funddocuments. You can also request the information by contacting us at (800) 225-5478 or by contacting your financial intermediary directly.
|
| Additional Information Phone Number |
|
(800) 225-5478
|
| Additional Information Website |
|
<span style="box-sizing: border-box; color: rgb(0, 0, 0); display: inline; flex-wrap: nowrap; font-size: 12px; font-weight: 400; grid-area: auto; line-height: 18px; margin: 0px; overflow: visible; text-align: left; white-space-collapse: preserve-breaks;">im.natixis.com/funddocuments</span>
|
| Expenses [Text Block] |
|
What were the fund costs for the last year? (based on a hypothetical $10,000 investment)
Class Name |
Costs of a $10,000 investment |
Costs paid as a percentage of a $10,000 investmentFootnote Reference† |
Class C |
$207 |
1.95% |
| Footnote |
Description |
Footnote† |
Annualized for periods less than one year (if applicable). | |
| Expenses Paid, Amount |
|
$ 207
|
| Expense Ratio, Percent |
|
1.95%
|
| Factors Affecting Performance [Text Block] |
|
How did the fund perform last year and what affected its performance?Explanation of Fund Performance While the Fund delivered strong absolute returns for the full year, it lagged in overall performance mainly due to fourth quarter results as the Fund was underexposed to some of the areas expected to benefit under a Trump presidency. This included U.S. stocks, bank and energy stocks, and lower quality and procyclical areas. Certain companies also faced industry-wide or company-specific challenges. Top Contributors to Performance • Lack of exposure to the Energy and Real Estate sectors and an underweight to Consumer Staples contributed to performance. • Stock selection in Health Care (Eli Lilly and Intuitive Surgical) and Materials (Smurfit Westrock and not owning mining companies) contributed. •Nvidia, Taiwan Semi and eBay were the largest contributors to performance. Top Detractors from Performance •An overweight to Health Care and Materials, and underweight to Communication Services, which was led by Magnificent 7 stocks the Fund does not own (Meta, Alphabet), detracted. •As U.S. equities outperformed, driven in part by the Magnificent 7, the Fund’s U.S. underweight and Europe overweight detracted. •Stock picks in Industrials (Vestas Wind Systems and AGCO Corp) and Financials (AIA Group and Legal & General) detracted from relative performance. •Vestas Wind Systems, Aptiv and Adobe were the largest detractors overall. The Fund continued to invest for the long term, in high-quality companies likely to benefit from the demographic, technological, environmental and governance related transitions expected to transform the world’s economies during the next decade. |
| Performance Past Does Not Indicate Future [Text] |
|
Performance data shown represents past performance and is no guarantee of, and is not necessarily indicative of, future results. Total return and value will vary, and you may have a gain or loss when shares are sold. Current performance may be lower or higher than quoted. For the most recent month-end performance,
|
| Line Graph [Table Text Block] |
|
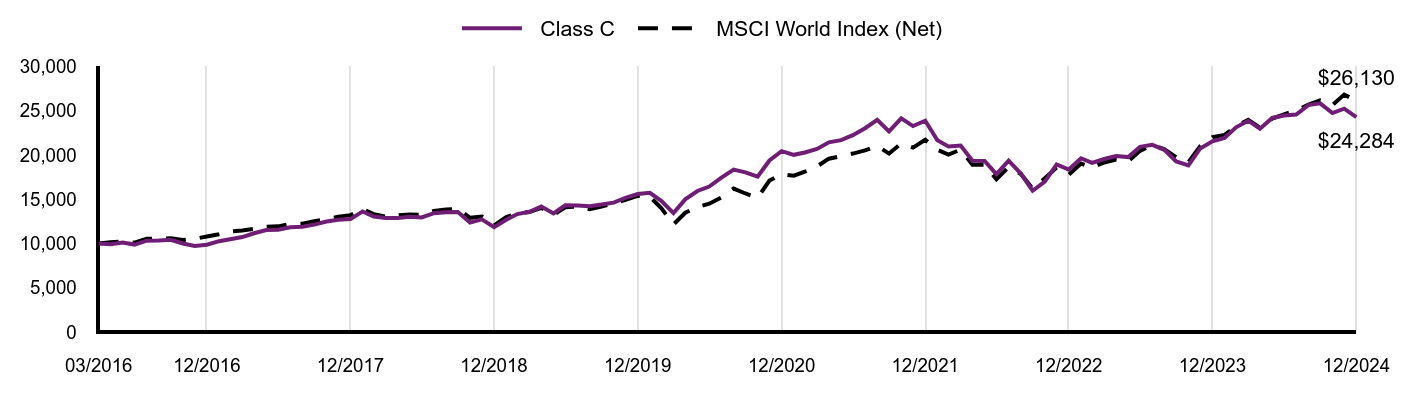
|
Class C |
MSCI World Index (Net) |
03/2016 |
$10,000 |
$10,000 |
04/2016 |
$9,930 |
$10,158 |
05/2016 |
$10,100 |
$10,215 |
06/2016 |
$9,880 |
$10,101 |
07/2016 |
$10,320 |
$10,528 |
08/2016 |
$10,330 |
$10,536 |
09/2016 |
$10,420 |
$10,592 |
10/2016 |
$10,000 |
$10,387 |
11/2016 |
$9,720 |
$10,537 |
12/2016 |
$9,861 |
$10,789 |
01/2017 |
$10,262 |
$11,049 |
02/2017 |
$10,492 |
$11,356 |
03/2017 |
$10,732 |
$11,477 |
04/2017 |
$11,163 |
$11,647 |
05/2017 |
$11,533 |
$11,893 |
06/2017 |
$11,553 |
$11,939 |
07/2017 |
$11,833 |
$12,224 |
08/2017 |
$11,894 |
$12,242 |
09/2017 |
$12,134 |
$12,516 |
10/2017 |
$12,484 |
$12,753 |
11/2017 |
$12,684 |
$13,029 |
12/2017 |
$12,761 |
$13,206 |
01/2018 |
$13,630 |
$13,903 |
02/2018 |
$13,054 |
$13,327 |
03/2018 |
$12,892 |
$13,036 |
04/2018 |
$12,871 |
$13,186 |
05/2018 |
$13,023 |
$13,269 |
06/2018 |
$12,952 |
$13,262 |
07/2018 |
$13,430 |
$13,677 |
08/2018 |
$13,521 |
$13,846 |
09/2018 |
$13,562 |
$13,923 |
10/2018 |
$12,362 |
$12,901 |
11/2018 |
$12,728 |
$13,047 |
12/2018 |
$11,841 |
$12,055 |
01/2019 |
$12,695 |
$12,993 |
02/2019 |
$13,327 |
$13,384 |
03/2019 |
$13,590 |
$13,560 |
04/2019 |
$14,177 |
$14,040 |
05/2019 |
$13,401 |
$13,230 |
06/2019 |
$14,326 |
$14,102 |
07/2019 |
$14,294 |
$14,172 |
08/2019 |
$14,219 |
$13,882 |
09/2019 |
$14,400 |
$14,177 |
10/2019 |
$14,623 |
$14,538 |
11/2019 |
$15,155 |
$14,943 |
12/2019 |
$15,590 |
$15,391 |
01/2020 |
$15,729 |
$15,297 |
02/2020 |
$14,830 |
$14,004 |
03/2020 |
$13,438 |
$12,151 |
04/2020 |
$14,991 |
$13,478 |
05/2020 |
$15,938 |
$14,129 |
06/2020 |
$16,444 |
$14,503 |
07/2020 |
$17,456 |
$15,197 |
08/2020 |
$18,360 |
$16,212 |
09/2020 |
$18,048 |
$15,653 |
10/2020 |
$17,553 |
$15,173 |
11/2020 |
$19,382 |
$17,113 |
12/2020 |
$20,434 |
$17,838 |
01/2021 |
$20,024 |
$17,661 |
02/2021 |
$20,283 |
$18,114 |
03/2021 |
$20,682 |
$18,716 |
04/2021 |
$21,436 |
$19,587 |
05/2021 |
$21,687 |
$19,869 |
06/2021 |
$22,245 |
$20,166 |
07/2021 |
$23,032 |
$20,527 |
08/2021 |
$23,983 |
$21,038 |
09/2021 |
$22,671 |
$20,164 |
10/2021 |
$24,147 |
$21,306 |
11/2021 |
$23,272 |
$20,839 |
12/2021 |
$23,878 |
$21,730 |
01/2022 |
$21,663 |
$20,580 |
02/2022 |
$20,969 |
$20,060 |
03/2022 |
$21,066 |
$20,610 |
04/2022 |
$19,350 |
$18,898 |
05/2022 |
$19,337 |
$18,912 |
06/2022 |
$17,841 |
$17,274 |
07/2022 |
$19,362 |
$18,646 |
08/2022 |
$17,904 |
$17,866 |
09/2022 |
$15,964 |
$16,205 |
10/2022 |
$17,004 |
$17,369 |
11/2022 |
$18,944 |
$18,577 |
12/2022 |
$18,361 |
$17,788 |
01/2023 |
$19,641 |
$19,047 |
02/2023 |
$19,121 |
$18,589 |
03/2023 |
$19,553 |
$19,163 |
04/2023 |
$19,895 |
$19,499 |
05/2023 |
$19,768 |
$19,304 |
06/2023 |
$20,923 |
$20,472 |
07/2023 |
$21,152 |
$21,159 |
08/2023 |
$20,593 |
$20,654 |
09/2023 |
$19,274 |
$19,763 |
10/2023 |
$18,830 |
$19,190 |
11/2023 |
$20,745 |
$20,989 |
12/2023 |
$21,558 |
$22,019 |
01/2024 |
$21,926 |
$22,283 |
02/2024 |
$23,131 |
$23,228 |
03/2024 |
$23,880 |
$23,975 |
04/2024 |
$22,981 |
$23,084 |
05/2024 |
$24,193 |
$24,115 |
06/2024 |
$24,469 |
$24,605 |
07/2024 |
$24,577 |
$25,039 |
08/2024 |
$25,646 |
$25,701 |
09/2024 |
$25,838 |
$26,172 |
10/2024 |
$24,745 |
$25,652 |
11/2024 |
$25,237 |
$26,830 |
12/2024 |
$24,284 |
$26,130 |
|
| Average Annual Return [Table Text Block] |
|
AATR |
1 Year |
5 Years |
Since Inception 3/31/16 |
Class C at NAV |
11.99% |
9.14% |
10.67% |
Class C with 1.00% CDSCFootnote Reference1 |
10.99% |
9.14% |
10.67% |
MSCI World Index (Net) |
18.67% |
11.17% |
11.56% | |
| Performance Inception Date |
|
Mar. 31, 2016
|
| Previous Investment Adviser [Text Block] |
|
|
| Updated Performance Information Location [Text Block] |
|
visit im.natixis.com/en-us/products/mutual-funds/price-and-performance
|
| AssetsNet |
|
$ 974,101,733
|
| Holdings Count | Holding |
|
51
|
| Advisory Fees Paid, Amount |
|
$ 8,602,808
|
| InvestmentCompanyPortfolioTurnover |
|
18.00%
|
| Additional Fund Statistics [Text Block] |
|
Total Net Assets |
$974,101,733 |
# of Portfolio Holdings (including overnight repurchase agreements) |
51 |
Portfolio Turnover Rate |
18% |
Total Advisory Fees Paid (after waiver/reimbursement, if applicable) |
$8,602,808 | |
| Holdings [Text Block] |
|
Value |
Value |
Other investments less than 3% of net assetsFootnote Reference* |
17.9% |
Commercial Services & Supplies |
3.3% |
Broadline Retail |
3.5% |
IT Services |
3.8% |
Machinery |
3.9% |
Electric Utilities |
5.2% |
Life Sciences Tools & Services |
6.0% |
Health Care Equipment & Supplies |
6.1% |
Chemicals |
6.7% |
Pharmaceuticals |
7.4% |
Financial Services |
9.5% |
Semiconductors & Semiconductor Equipment |
11.7% |
Software |
15.0% |
| Footnote |
Description |
Footnote* |
Net of other assets less liabilities |
NVIDIA Corp. |
5.9% |
Microsoft Corp. |
5.5% |
Mastercard, Inc., Class A |
5.2% |
Eli Lilly & Co. |
3.8% |
Ecolab, Inc. |
3.7% |
eBay, Inc. |
3.5% |
Thermo Fisher Scientific, Inc. |
3.4% |
Taiwan Semiconductor Manufacturing Co. Ltd., ADR |
3.2% |
Roper Technologies, Inc. |
3.0% |
Iberdrola SA |
2.9% |
Value |
Value |
Other investments less than 3% of net assetsFootnote Reference* |
10.2% |
Canada |
3.0% |
Japan |
3.1% |
Taiwan |
3.2% |
Denmark |
3.4% |
Netherlands |
3.7% |
France |
3.7% |
United Kingdom |
3.8% |
Germany |
4.0% |
United States |
61.9% |
| Footnote |
Description |
Footnote* |
Net of other assets less liabilities | |
| Material Fund Change [Text Block] |
|
There were no material fund changes during the period. |
| C000190736 |
|
|
| Shareholder Report [Line Items] |
|
|
| Fund Name |
|
Mirova Global Sustainable Equity Fund
|
| Class Name |
|
Class N
|
| Trading Symbol |
|
ESGNX
|
| Annual or Semi-Annual Statement [Text Block] |
|
This annual shareholder report contains important information about Mirova Global Sustainable Equity Fund for the period of January 1, 2024 to December 31, 2024.
|
| Shareholder Report Annual or Semi-Annual |
|
Annual Shareholder Report
|
| Additional Information [Text Block] |
|
You can find additional information (including tax information) about the Fund at im.natixis.com/funddocuments. You can also request the information by contacting us at (800) 225-5478 or by contacting your financial intermediary directly.
|
| Additional Information Phone Number |
|
(800) 225-5478
|
| Additional Information Website |
|
<span style="box-sizing: border-box; color: rgb(0, 0, 0); display: inline; flex-wrap: nowrap; font-size: 12px; font-weight: 400; grid-area: auto; line-height: 18px; margin: 0px; overflow: visible; text-align: left; white-space-collapse: preserve-breaks;">im.natixis.com/funddocuments</span>
|
| Expenses [Text Block] |
|
What were the fund costs for the last year? (based on a hypothetical $10,000 investment)
Class Name |
Costs of a $10,000 investment |
Costs paid as a percentage of a $10,000 investmentFootnote Reference† |
Class N |
$95 |
0.89% |
| Footnote |
Description |
Footnote† |
Annualized for periods less than one year (if applicable). | |
| Expenses Paid, Amount |
|
$ 95
|
| Expense Ratio, Percent |
|
0.89%
|
| Factors Affecting Performance [Text Block] |
|
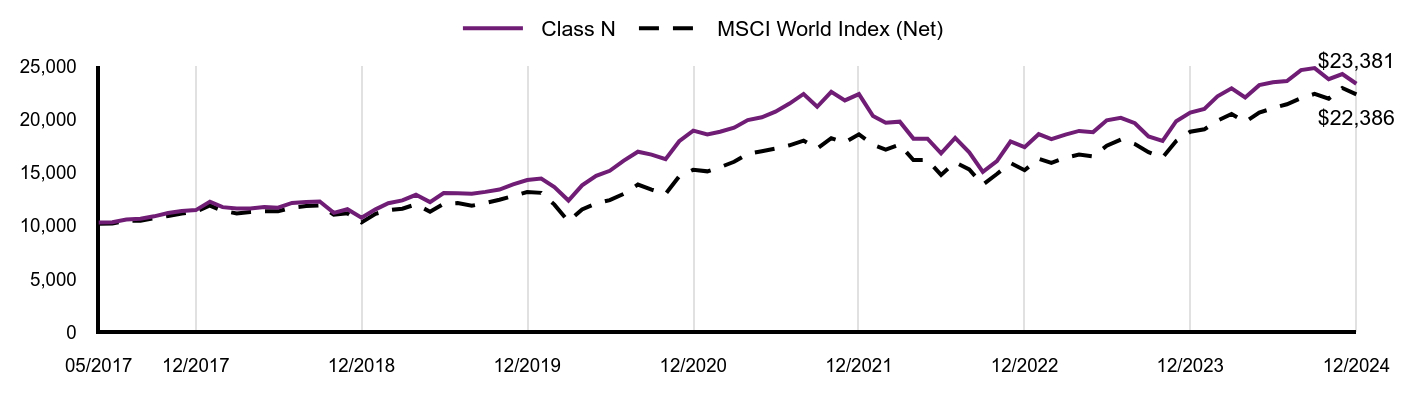
How did the fund perform last year and what affected its performance?Explanation of Fund Performance While the Fund delivered strong absolute returns for the full year, it lagged in overall performance mainly due to fourth quarter results as the Fund was underexposed to some of the areas expected to benefit under a Trump presidency. This included U.S. stocks, bank and energy stocks, and lower quality and procyclical areas. Certain companies also faced industry-wide or company-specific challenges. Top Contributors to Performance • Lack of exposure to the Energy and Real Estate sectors and an underweight to Consumer Staples contributed to performance. • Stock selection in Health Care (Eli Lilly and Intuitive Surgical) and Materials (Smurfit Westrock and not owning mining companies) contributed. •Nvidia, Taiwan Semi and eBay were the largest contributors to performance. Top Detractors from Performance •An overweight to Health Care and Materials, and underweight to Communication Services, which was led by Magnificent 7 stocks the Fund does not own (Meta, Alphabet), detracted. •As U.S. equities outperformed, driven in part by the Magnificent 7, the Fund’s U.S. underweight and Europe overweight detracted. •Stock picks in Industrials (Vestas Wind Systems and AGCO Corp) and Financials (AIA Group and Legal & General) detracted from relative performance. •Vestas Wind Systems, Aptiv and Adobe were the largest detractors overall. The Fund continued to invest for the long term, in high-quality companies likely to benefit from the demographic, technological, environmental and governance related transitions expected to transform the world’s economies during the next decade. |
| Performance Past Does Not Indicate Future [Text] |
|
Performance data shown represents past performance and is no guarantee of, and is not necessarily indicative of, future results. Total return and value will vary, and you may have a gain or loss when shares are sold. Current performance may be lower or higher than quoted. For the most recent month-end performance,
|
| Line Graph [Table Text Block] |
|
|
Class N |
MSCI World Index (Net) |
05/2017 |
$10,319 |
$10,189 |
06/2017 |
$10,337 |
$10,228 |
07/2017 |
$10,593 |
$10,473 |
08/2017 |
$10,673 |
$10,487 |
09/2017 |
$10,895 |
$10,723 |
10/2017 |
$11,213 |
$10,925 |
11/2017 |
$11,399 |
$11,162 |
12/2017 |
$11,481 |
$11,313 |
01/2018 |
$12,278 |
$11,910 |
02/2018 |
$11,759 |
$11,417 |
03/2018 |
$11,624 |
$11,168 |
04/2018 |
$11,623 |
$11,296 |
05/2018 |
$11,767 |
$11,367 |
06/2018 |
$11,713 |
$11,362 |
07/2018 |
$12,155 |
$11,717 |
08/2018 |
$12,245 |
$11,862 |
09/2018 |
$12,299 |
$11,928 |
10/2018 |
$11,217 |
$11,052 |
11/2018 |
$11,560 |
$11,177 |
12/2018 |
$10,762 |
$10,327 |
01/2019 |
$11,549 |
$11,131 |
02/2019 |
$12,129 |
$11,466 |
03/2019 |
$12,392 |
$11,616 |
04/2019 |
$12,923 |
$12,028 |
05/2019 |
$12,233 |
$11,334 |
06/2019 |
$13,093 |
$12,081 |
07/2019 |
$13,064 |
$12,141 |
08/2019 |
$13,017 |
$11,893 |
09/2019 |
$13,197 |
$12,146 |
10/2019 |
$13,414 |
$12,455 |
11/2019 |
$13,905 |
$12,802 |
12/2019 |
$14,319 |
$13,185 |
01/2020 |
$14,452 |
$13,105 |
02/2020 |
$13,650 |
$11,997 |
03/2020 |
$12,380 |
$10,409 |
04/2020 |
$13,813 |
$11,547 |
05/2020 |
$14,706 |
$12,104 |
06/2020 |
$15,186 |
$12,425 |
07/2020 |
$16,137 |
$13,019 |
08/2020 |
$16,981 |
$13,889 |
09/2020 |
$16,703 |
$13,410 |
10/2020 |
$16,271 |
$12,998 |
11/2020 |
$17,970 |
$14,660 |
12/2020 |
$18,964 |
$15,282 |
01/2021 |
$18,598 |
$15,130 |
02/2021 |
$18,858 |
$15,518 |
03/2021 |
$19,243 |
$16,034 |
04/2021 |
$19,964 |
$16,780 |
05/2021 |
$20,218 |
$17,022 |
06/2021 |
$20,754 |
$17,276 |
07/2021 |
$21,514 |
$17,585 |
08/2021 |
$22,421 |
$18,023 |
09/2021 |
$21,212 |
$17,274 |
10/2021 |
$22,616 |
$18,253 |
11/2021 |
$21,816 |
$17,853 |
12/2021 |
$22,409 |
$18,616 |
01/2022 |
$20,343 |
$17,631 |
02/2022 |
$19,705 |
$17,185 |
03/2022 |
$19,813 |
$17,657 |
04/2022 |
$18,213 |
$16,190 |
05/2022 |
$18,213 |
$16,202 |
06/2022 |
$16,830 |
$14,799 |
07/2022 |
$18,280 |
$15,974 |
08/2022 |
$16,920 |
$15,306 |
09/2022 |
$15,087 |
$13,883 |
10/2022 |
$16,099 |
$14,880 |
11/2022 |
$17,943 |
$15,915 |
12/2022 |
$17,408 |
$15,239 |
01/2023 |
$18,632 |
$16,317 |
02/2023 |
$18,156 |
$15,925 |
03/2023 |
$18,587 |
$16,417 |
04/2023 |
$18,939 |
$16,705 |
05/2023 |
$18,825 |
$16,538 |
06/2023 |
$19,937 |
$17,538 |
07/2023 |
$20,175 |
$18,127 |
08/2023 |
$19,664 |
$17,694 |
09/2023 |
$18,417 |
$16,931 |
10/2023 |
$18,009 |
$16,440 |
11/2023 |
$19,857 |
$17,981 |
12/2023 |
$20,664 |
$18,864 |
01/2024 |
$21,018 |
$19,090 |
02/2024 |
$22,204 |
$19,899 |
03/2024 |
$22,946 |
$20,539 |
04/2024 |
$22,085 |
$19,776 |
05/2024 |
$23,249 |
$20,659 |
06/2024 |
$23,523 |
$21,079 |
07/2024 |
$23,637 |
$21,451 |
08/2024 |
$24,664 |
$22,018 |
09/2024 |
$24,858 |
$22,421 |
10/2024 |
$23,808 |
$21,976 |
11/2024 |
$24,299 |
$22,985 |
12/2024 |
$23,381 |
$22,386 |
|
| Average Annual Return [Table Text Block] |
|
AATR |
1 Year |
5 Years |
Since Inception 5/1/17 |
Class N |
13.15% |
10.30% |
11.71% |
MSCI World Index (Net) |
18.67% |
11.17% |
11.04% | |
| Performance Inception Date |
|
May 01, 2017
|
| Previous Investment Adviser [Text Block] |
|
|
| Updated Performance Information Location [Text Block] |
|
visit im.natixis.com/en-us/products/mutual-funds/price-and-performance
|
| AssetsNet |
|
$ 974,101,733
|
| Holdings Count | Holding |
|
51
|
| Advisory Fees Paid, Amount |
|
$ 8,602,808
|
| InvestmentCompanyPortfolioTurnover |
|
18.00%
|
| Additional Fund Statistics [Text Block] |
|
Total Net Assets |
$974,101,733 |
# of Portfolio Holdings (including overnight repurchase agreements) |
51 |
Portfolio Turnover Rate |
18% |
Total Advisory Fees Paid (after waiver/reimbursement, if applicable) |
$8,602,808 | |
| Holdings [Text Block] |
|
Value |
Value |
Other investments less than 3% of net assetsFootnote Reference* |
17.9% |
Commercial Services & Supplies |
3.3% |
Broadline Retail |
3.5% |
IT Services |
3.8% |
Machinery |
3.9% |
Electric Utilities |
5.2% |
Life Sciences Tools & Services |
6.0% |
Health Care Equipment & Supplies |
6.1% |
Chemicals |
6.7% |
Pharmaceuticals |
7.4% |
Financial Services |
9.5% |
Semiconductors & Semiconductor Equipment |
11.7% |
Software |
15.0% |
| Footnote |
Description |
Footnote* |
Net of other assets less liabilities |
NVIDIA Corp. |
5.9% |
Microsoft Corp. |
5.5% |
Mastercard, Inc., Class A |
5.2% |
Eli Lilly & Co. |
3.8% |
Ecolab, Inc. |
3.7% |
eBay, Inc. |
3.5% |
Thermo Fisher Scientific, Inc. |
3.4% |
Taiwan Semiconductor Manufacturing Co. Ltd., ADR |
3.2% |
Roper Technologies, Inc. |
3.0% |
Iberdrola SA |
2.9% |
Value |
Value |
Other investments less than 3% of net assetsFootnote Reference* |
10.2% |
Canada |
3.0% |
Japan |
3.1% |
Taiwan |
3.2% |
Denmark |
3.4% |
Netherlands |
3.7% |
France |
3.7% |
United Kingdom |
3.8% |
Germany |
4.0% |
United States |
61.9% |
| Footnote |
Description |
Footnote* |
Net of other assets less liabilities | |
| Material Fund Change [Text Block] |
|
There were no material fund changes during the period. |
| C000167847 |
|
|
| Shareholder Report [Line Items] |
|
|
| Fund Name |
|
Mirova Global Sustainable Equity Fund
|
| Class Name |
|
Class Y
|
| Trading Symbol |
|
ESGYX
|
| Annual or Semi-Annual Statement [Text Block] |
|
This annual shareholder report contains important information about Mirova Global Sustainable Equity Fund for the period of January 1, 2024 to December 31, 2024.
|
| Shareholder Report Annual or Semi-Annual |
|
Annual Shareholder Report
|
| Additional Information [Text Block] |
|
You can find additional information (including tax information) about the Fund at im.natixis.com/funddocuments. You can also request the information by contacting us at (800) 225-5478 or by contacting your financial intermediary directly.
|
| Additional Information Phone Number |
|
(800) 225-5478
|
| Additional Information Website |
|
<span style="box-sizing: border-box; color: rgb(0, 0, 0); display: inline; flex-wrap: nowrap; font-size: 12px; font-weight: 400; grid-area: auto; line-height: 18px; margin: 0px; overflow: visible; text-align: left; white-space-collapse: preserve-breaks;">im.natixis.com/funddocuments</span>
|
| Expenses [Text Block] |
|
What were the fund costs for the last year? (based on a hypothetical $10,000 investment)
Class Name |
Costs of a $10,000 investment |
Costs paid as a percentage of a $10,000 investmentFootnote Reference† |
Class Y |
$101 |
0.95% |
| Footnote |
Description |
Footnote† |
Annualized for periods less than one year (if applicable). | |
| Expenses Paid, Amount |
|
$ 101
|
| Expense Ratio, Percent |
|
0.95%
|
| Factors Affecting Performance [Text Block] |
|
How did the fund perform last year and what affected its performance?Explanation of Fund Performance While the Fund delivered strong absolute returns for the full year, it lagged in overall performance mainly due to fourth quarter results as the Fund was underexposed to some of the areas expected to benefit under a Trump presidency. This included U.S. stocks, bank and energy stocks, and lower quality and procyclical areas. Certain companies also faced industry-wide or company-specific challenges. Top Contributors to Performance • Lack of exposure to the Energy and Real Estate sectors and an underweight to Consumer Staples contributed to performance. • Stock selection in Health Care (Eli Lilly and Intuitive Surgical) and Materials (Smurfit Westrock and not owning mining companies) contributed. •Nvidia, Taiwan Semi and eBay were the largest contributors to performance. Top Detractors from Performance •An overweight to Health Care and Materials, and underweight to Communication Services, which was led by Magnificent 7 stocks the Fund does not own (Meta, Alphabet), detracted. •As U.S. equities outperformed, driven in part by the Magnificent 7, the Fund’s U.S. underweight and Europe overweight detracted. •Stock picks in Industrials (Vestas Wind Systems and AGCO Corp) and Financials (AIA Group and Legal & General) detracted from relative performance. •Vestas Wind Systems, Aptiv and Adobe were the largest detractors overall. The Fund continued to invest for the long term, in high-quality companies likely to benefit from the demographic, technological, environmental and governance related transitions expected to transform the world’s economies during the next decade. |
| Performance Past Does Not Indicate Future [Text] |
|
Performance data shown represents past performance and is no guarantee of, and is not necessarily indicative of, future results. Total return and value will vary, and you may have a gain or loss when shares are sold. Current performance may be lower or higher than quoted. For the most recent month-end performance,
|
| Line Graph [Table Text Block] |
|
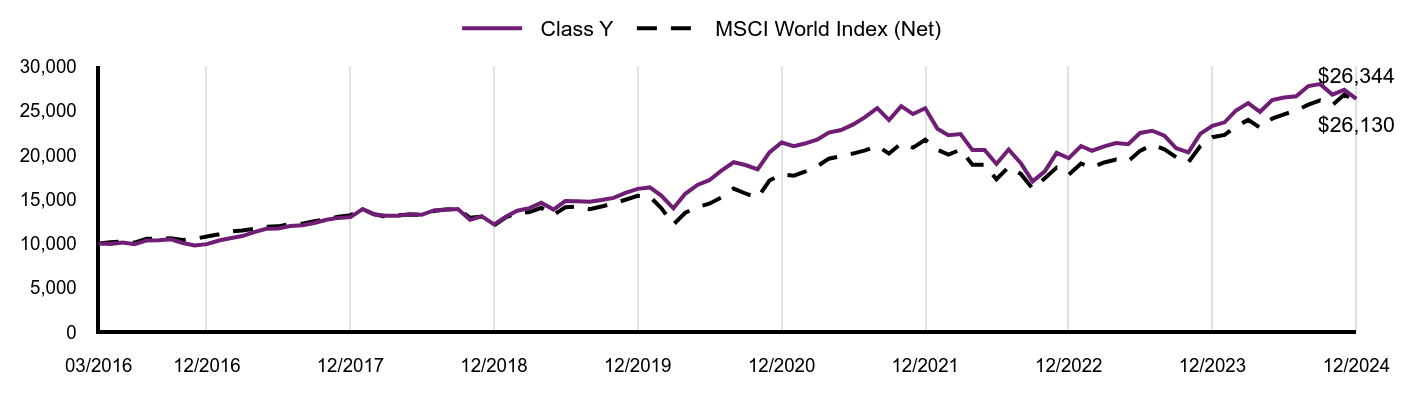
|
Class Y |
MSCI World Index (Net) |
03/2016 |
$10,000 |
$10,000 |
04/2016 |
$9,940 |
$10,158 |
05/2016 |
$10,120 |
$10,215 |
06/2016 |
$9,910 |
$10,101 |
07/2016 |
$10,350 |
$10,528 |
08/2016 |
$10,370 |
$10,536 |
09/2016 |
$10,470 |
$10,592 |
10/2016 |
$10,060 |
$10,387 |
11/2016 |
$9,790 |
$10,537 |
12/2016 |
$9,930 |
$10,789 |
01/2017 |
$10,341 |
$11,049 |
02/2017 |
$10,591 |
$11,356 |
03/2017 |
$10,842 |
$11,477 |
04/2017 |
$11,283 |
$11,647 |
05/2017 |
$11,673 |
$11,893 |
06/2017 |
$11,693 |
$11,939 |
07/2017 |
$11,984 |
$12,224 |
08/2017 |
$12,064 |
$12,242 |
09/2017 |
$12,325 |
$12,516 |
10/2017 |
$12,685 |
$12,753 |
11/2017 |
$12,896 |
$13,029 |
12/2017 |
$12,983 |
$13,206 |
01/2018 |
$13,885 |
$13,903 |
02/2018 |
$13,297 |
$13,327 |
03/2018 |
$13,145 |
$13,036 |
04/2018 |
$13,144 |
$13,186 |
05/2018 |
$13,307 |
$13,269 |
06/2018 |
$13,246 |
$13,262 |
07/2018 |
$13,745 |
$13,677 |
08/2018 |
$13,847 |
$13,846 |
09/2018 |
$13,909 |
$13,923 |
10/2018 |
$12,675 |
$12,901 |
11/2018 |
$13,072 |
$13,047 |
12/2018 |
$12,163 |
$12,055 |
01/2019 |
$13,052 |
$12,993 |
02/2019 |
$13,708 |
$13,384 |
03/2019 |
$14,005 |
$13,560 |
04/2019 |
$14,616 |
$14,040 |
05/2019 |
$13,836 |
$13,230 |
06/2019 |
$14,797 |
$14,102 |
07/2019 |
$14,776 |
$14,172 |
08/2019 |
$14,712 |
$13,882 |
09/2019 |
$14,915 |
$14,177 |
10/2019 |
$15,160 |
$14,538 |
11/2019 |
$15,715 |
$14,943 |
12/2019 |
$16,176 |
$15,391 |
01/2020 |
$16,338 |
$15,297 |
02/2020 |
$15,421 |
$14,004 |
03/2020 |
$13,985 |
$12,151 |
04/2020 |
$15,616 |
$13,478 |
05/2020 |
$16,614 |
$14,129 |
06/2020 |
$17,156 |
$14,503 |
07/2020 |
$18,230 |
$15,197 |
08/2020 |
$19,184 |
$16,212 |
09/2020 |
$18,870 |
$15,653 |
10/2020 |
$18,371 |
$15,173 |
11/2020 |
$20,301 |
$17,113 |
12/2020 |
$21,420 |
$17,838 |
01/2021 |
$21,007 |
$17,661 |
02/2021 |
$21,300 |
$18,114 |
03/2021 |
$21,735 |
$18,716 |
04/2021 |
$22,539 |
$19,587 |
05/2021 |
$22,825 |
$19,869 |
06/2021 |
$23,430 |
$20,166 |
07/2021 |
$24,289 |
$20,527 |
08/2021 |
$25,313 |
$21,038 |
09/2021 |
$23,948 |
$20,164 |
10/2021 |
$25,534 |
$21,306 |
11/2021 |
$24,631 |
$20,839 |
12/2021 |
$25,288 |
$21,730 |
01/2022 |
$22,968 |
$20,580 |
02/2022 |
$22,235 |
$20,060 |
03/2022 |
$22,369 |
$20,610 |
04/2022 |
$20,562 |
$18,898 |
05/2022 |
$20,562 |
$18,912 |
06/2022 |
$18,989 |
$17,274 |
07/2022 |
$20,626 |
$18,646 |
08/2022 |
$19,090 |
$17,866 |
09/2022 |
$17,021 |
$16,205 |
10/2022 |
$18,163 |
$17,369 |
11/2022 |
$20,245 |
$18,577 |
12/2022 |
$19,641 |
$17,788 |
01/2023 |
$21,022 |
$19,047 |
02/2023 |
$20,485 |
$18,589 |
03/2023 |
$20,971 |
$19,163 |
04/2023 |
$21,355 |
$19,499 |
05/2023 |
$21,227 |
$19,304 |
06/2023 |
$22,494 |
$20,472 |
07/2023 |
$22,750 |
$21,159 |
08/2023 |
$22,187 |
$20,654 |
09/2023 |
$20,766 |
$19,763 |
10/2023 |
$20,306 |
$19,190 |
11/2023 |
$22,391 |
$20,989 |
12/2023 |
$23,300 |
$22,019 |
01/2024 |
$23,699 |
$22,283 |
02/2024 |
$25,037 |
$23,228 |
03/2024 |
$25,873 |
$23,975 |
04/2024 |
$24,890 |
$23,084 |
05/2024 |
$26,215 |
$24,115 |
06/2024 |
$26,511 |
$24,605 |
07/2024 |
$26,640 |
$25,039 |
08/2024 |
$27,798 |
$25,701 |
09/2024 |
$28,017 |
$26,172 |
10/2024 |
$26,833 |
$25,652 |
11/2024 |
$27,373 |
$26,830 |
12/2024 |
$26,344 |
$26,130 |
|
| Average Annual Return [Table Text Block] |
|
AATR |
1 Year |
5 Years |
Since Inception 3/31/16 |
Class Y |
13.06% |
10.25% |
11.70% |
MSCI World Index (Net) |
18.67% |
11.17% |
11.56% | |
| Performance Inception Date |
|
Mar. 31, 2016
|
| Previous Investment Adviser [Text Block] |
|
|
| Updated Performance Information Location [Text Block] |
|
visit im.natixis.com/en-us/products/mutual-funds/price-and-performance
|
| AssetsNet |
|
$ 974,101,733
|
| Holdings Count | Holding |
|
51
|
| Advisory Fees Paid, Amount |
|
$ 8,602,808
|
| InvestmentCompanyPortfolioTurnover |
|
18.00%
|
| Additional Fund Statistics [Text Block] |
|
Total Net Assets |
$974,101,733 |
# of Portfolio Holdings (including overnight repurchase agreements) |
51 |
Portfolio Turnover Rate |
18% |
Total Advisory Fees Paid (after waiver/reimbursement, if applicable) |
$8,602,808 | |
| Holdings [Text Block] |
|
Value |
Value |
Other investments less than 3% of net assetsFootnote Reference* |
17.9% |
Commercial Services & Supplies |
3.3% |
Broadline Retail |
3.5% |
IT Services |
3.8% |
Machinery |
3.9% |
Electric Utilities |
5.2% |
Life Sciences Tools & Services |
6.0% |
Health Care Equipment & Supplies |
6.1% |
Chemicals |
6.7% |
Pharmaceuticals |
7.4% |
Financial Services |
9.5% |
Semiconductors & Semiconductor Equipment |
11.7% |
Software |
15.0% |
| Footnote |
Description |
Footnote* |
Net of other assets less liabilities |
NVIDIA Corp. |
5.9% |
Microsoft Corp. |
5.5% |
Mastercard, Inc., Class A |
5.2% |
Eli Lilly & Co. |
3.8% |
Ecolab, Inc. |
3.7% |
eBay, Inc. |
3.5% |
Thermo Fisher Scientific, Inc. |
3.4% |
Taiwan Semiconductor Manufacturing Co. Ltd., ADR |
3.2% |
Roper Technologies, Inc. |
3.0% |
Iberdrola SA |
2.9% |
Value |
Value |
Other investments less than 3% of net assetsFootnote Reference* |
10.2% |
Canada |
3.0% |
Japan |
3.1% |
Taiwan |
3.2% |
Denmark |
3.4% |
Netherlands |
3.7% |
France |
3.7% |
United Kingdom |
3.8% |
Germany |
4.0% |
United States |
61.9% |
| Footnote |
Description |
Footnote* |
Net of other assets less liabilities | |
| Material Fund Change [Text Block] |
|
There were no material fund changes during the period. |
| C000094872 |
|
|
| Shareholder Report [Line Items] |
|
|
| Fund Name |
|
Natixis Oakmark International Fund
|
| Class Name |
|
Class A
|
| Trading Symbol |
|
NOIAX
|
| Annual or Semi-Annual Statement [Text Block] |
|
This annual shareholder report contains important information about Natixis Oakmark International Fund for the period of January 1, 2024 to December 31, 2024.
|
| Shareholder Report Annual or Semi-Annual |
|
Annual Shareholder Report
|
| Additional Information [Text Block] |
|
You can find additional information (including tax information) about the Fund at im.natixis.com/funddocuments. You can also request the information by contacting us at (800) 225-5478 or by contacting your financial intermediary directly.
|
| Additional Information Phone Number |
|
(800) 225-5478
|
| Additional Information Website |
|
<span style="box-sizing: border-box; color: rgb(0, 0, 0); display: inline; flex-wrap: nowrap; font-size: 12px; font-weight: 400; grid-area: auto; line-height: 18px; margin: 0px; overflow: visible; text-align: left; white-space-collapse: preserve-breaks;">im.natixis.com/funddocuments</span>
|
| Expenses [Text Block] |
|
What were the fund costs for the last year? (based on a hypothetical $10,000 investment)
Class Name |
Costs of a $10,000 investment |
Costs paid as a percentage of a $10,000 investmentFootnote Reference† |
Class A |
$112 |
1.15% |
| Footnote |
Description |
Footnote† |
Annualized for periods less than one year (if applicable). | |
| Expenses Paid, Amount |
|
$ 112
|
| Expense Ratio, Percent |
|
1.15%
|
| Factors Affecting Performance [Text Block] |
|
How did the fund perform last year and what affected its performance?Explanation of Fund Performance On an absolute-return basis, the industrials and communication services sectors were the only sectors that contributed to the Fund’s return. Health care and consumer discretionary detracted the most to the Fund’s absolute return for the year. Geographically, Italy and Japan had the largest contribution to absolute performance of the Fund, while France and Germany were the largest detractors. Top Contributors to Performance •Intesa Sanpaolo was a contributor during the 1-year period. The company started the year strong after posting results that benefited from increased fees and commissions. Solid performance continued throughout the year with the company’s net interest income being a highlight. During the year, Intesa launched management changes, which we believe could be pivotal in the continued growth of total fee income and commission over the coming years. •Prosus was another contributor during the 1-year period. The Netherlands-headquartered broadline retail company, which, in our view, is a discounted way to invest in Tencent, saw its stock price rise on improved sentiment toward Chinese stocks after the announcement of a multipronged stimulus package by the Chinese government. During the year, we met with the new CEO, who emphasized focus on balancing steady growth and increasing profitability to unlock further value. Top Detractors from Performance •Bayer was a detractor during the 1-year period. The Germany-headquartered pharmaceuticals company’s stock price declined following its third-quarter earnings release. While pharma revenues exceeded consensus expectations, crop market weakness weighed on performance and drove a downgrade in 2025 guidance. •Kering was another detractor during the 1-year period. The France-headquartered luxury holdings company’s stock price declined initially following the release of first-quarter results with underperformance mainly concentrated around Gucci globally, but most severely in China. The company’s stock price continued to slip after reporting challenging third-quarter earnings and portfolio brands, including Gucci and Yves Saint Laurent, struggled during the period. |
| Performance Past Does Not Indicate Future [Text] |
|
Performance data shown represents past performance and is no guarantee of, and is not necessarily indicative of, future results. Total return and value will vary, and you may have a gain or loss when shares are sold. Current performance may be lower or higher than quoted. For the most recent month-end performance,
|
| Line Graph [Table Text Block] |
|
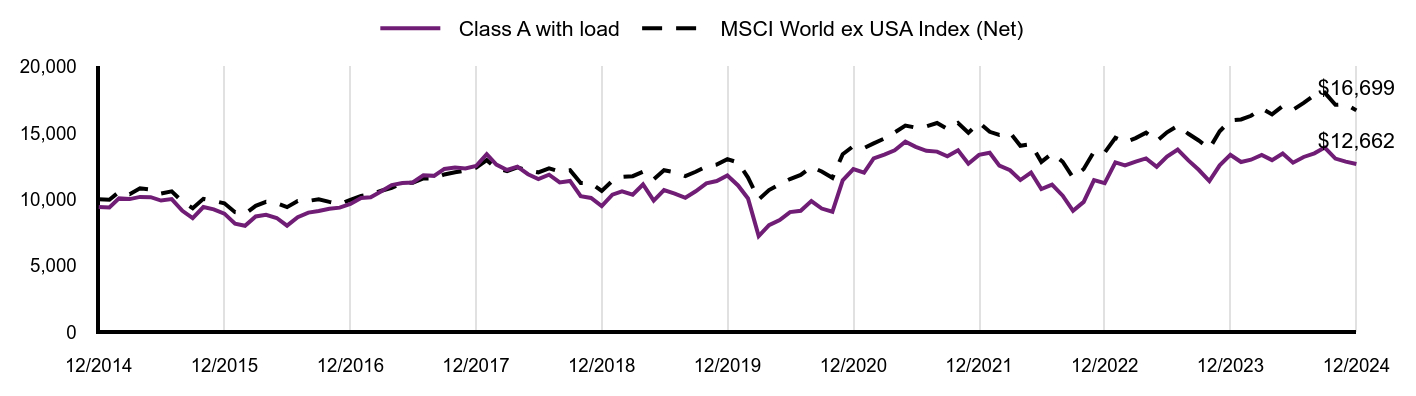
|
Class A with load |
MSCI World ex USA Index (Net) |
12/2014 |
$9,424 |
$10,000 |
01/2015 |
$9,379 |
$9,965 |
02/2015 |
$10,068 |
$10,560 |
03/2015 |
$10,015 |
$10,383 |
04/2015 |
$10,179 |
$10,833 |
05/2015 |
$10,156 |
$10,739 |
06/2015 |
$9,905 |
$10,434 |
07/2015 |
$10,019 |
$10,599 |
08/2015 |
$9,135 |
$9,827 |
09/2015 |
$8,587 |
$9,331 |
10/2015 |
$9,417 |
$10,033 |
11/2015 |
$9,242 |
$9,873 |
12/2015 |
$8,920 |
$9,696 |
01/2016 |
$8,166 |
$9,029 |
02/2016 |
$8,003 |
$8,903 |
03/2016 |
$8,703 |
$9,507 |
04/2016 |
$8,825 |
$9,813 |
05/2016 |
$8,591 |
$9,702 |
06/2016 |
$8,013 |
$9,407 |
07/2016 |
$8,646 |
$9,870 |
08/2016 |
$8,997 |
$9,879 |
09/2016 |
$9,114 |
$9,999 |
10/2016 |
$9,286 |
$9,805 |
11/2016 |
$9,372 |
$9,648 |
12/2016 |
$9,651 |
$9,963 |
01/2017 |
$10,104 |
$10,259 |
02/2017 |
$10,159 |
$10,378 |
03/2017 |
$10,604 |
$10,641 |
04/2017 |
$11,073 |
$10,867 |
05/2017 |
$11,223 |
$11,230 |
06/2017 |
$11,263 |
$11,240 |
07/2017 |
$11,803 |
$11,575 |
08/2017 |
$11,764 |
$11,572 |
09/2017 |
$12,288 |
$11,872 |
10/2017 |
$12,399 |
$12,034 |
11/2017 |
$12,328 |
$12,156 |
12/2017 |
$12,504 |
$12,374 |
01/2018 |
$13,395 |
$12,951 |
02/2018 |
$12,616 |
$12,336 |
03/2018 |
$12,207 |
$12,122 |
04/2018 |
$12,456 |
$12,400 |
05/2018 |
$11,886 |
$12,165 |
06/2018 |
$11,525 |
$12,032 |
07/2018 |
$11,854 |
$12,327 |
08/2018 |
$11,268 |
$12,094 |
09/2018 |
$11,380 |
$12,189 |
10/2018 |
$10,233 |
$11,220 |
11/2018 |
$10,096 |
$11,210 |
12/2018 |
$9,484 |
$10,631 |
01/2019 |
$10,349 |
$11,389 |
02/2019 |
$10,593 |
$11,682 |
03/2019 |
$10,349 |
$11,742 |
04/2019 |
$11,114 |
$12,074 |
05/2019 |
$9,904 |
$11,503 |
06/2019 |
$10,694 |
$12,187 |
07/2019 |
$10,433 |
$12,040 |
08/2019 |
$10,114 |
$11,744 |
09/2019 |
$10,601 |
$12,073 |
10/2019 |
$11,198 |
$12,464 |
11/2019 |
$11,374 |
$12,619 |
12/2019 |
$11,794 |
$13,022 |
01/2020 |
$11,041 |
$12,770 |
02/2020 |
$10,063 |
$11,636 |
03/2020 |
$7,225 |
$9,993 |
04/2020 |
$8,047 |
$10,690 |
05/2020 |
$8,436 |
$11,144 |
06/2020 |
$9,033 |
$11,526 |
07/2020 |
$9,137 |
$11,833 |
08/2020 |
$9,864 |
$12,443 |
09/2020 |
$9,302 |
$12,093 |
10/2020 |
$9,059 |
$11,618 |
11/2020 |
$11,430 |
$13,400 |
12/2020 |
$12,272 |
$14,010 |
01/2021 |
$12,012 |
$13,860 |
02/2021 |
$13,079 |
$14,213 |
03/2021 |
$13,365 |
$14,576 |
04/2021 |
$13,695 |
$15,034 |
05/2021 |
$14,337 |
$15,557 |
06/2021 |
$13,947 |
$15,399 |
07/2021 |
$13,651 |
$15,501 |
08/2021 |
$13,591 |
$15,750 |
09/2021 |
$13,235 |
$15,297 |
10/2021 |
$13,695 |
$15,753 |
11/2021 |
$12,679 |
$15,015 |
12/2021 |
$13,344 |
$15,778 |
01/2022 |
$13,511 |
$15,082 |
02/2022 |
$12,533 |
$14,847 |
03/2022 |
$12,190 |
$15,019 |
04/2022 |
$11,450 |
$14,033 |
05/2022 |
$12,014 |
$14,150 |
06/2022 |
$10,772 |
$12,818 |
07/2022 |
$11,106 |
$13,456 |
08/2022 |
$10,270 |
$12,827 |
09/2022 |
$9,133 |
$11,640 |
10/2022 |
$9,803 |
$12,281 |
11/2022 |
$11,450 |
$13,589 |
12/2022 |
$11,221 |
$13,523 |
01/2023 |
$12,780 |
$14,632 |
02/2023 |
$12,556 |
$14,290 |
03/2023 |
$12,843 |
$14,608 |
04/2023 |
$13,076 |
$15,023 |
05/2023 |
$12,449 |
$14,367 |
06/2023 |
$13,211 |
$15,050 |
07/2023 |
$13,749 |
$15,538 |
08/2023 |
$12,933 |
$14,936 |
09/2023 |
$12,225 |
$14,433 |
10/2023 |
$11,374 |
$13,824 |
11/2023 |
$12,557 |
$15,123 |
12/2023 |
$13,346 |
$15,949 |
01/2024 |
$12,809 |
$16,018 |
02/2024 |
$12,982 |
$16,292 |
03/2024 |
$13,346 |
$16,841 |
04/2024 |
$12,951 |
$16,395 |
05/2024 |
$13,452 |
$17,022 |
06/2024 |
$12,759 |
$16,740 |
07/2024 |
$13,188 |
$17,265 |
08/2024 |
$13,462 |
$17,841 |
09/2024 |
$13,900 |
$18,039 |
10/2024 |
$13,069 |
$17,119 |
11/2024 |
$12,841 |
$17,160 |
12/2024 |
$12,662 |
$16,699 |
|
| Average Annual Return [Table Text Block] |
|
AATR |
1 Year |
5 Years |
10 Years |
Class A at NAV |
(5.13%) |
1.43% |
3.00% |
Class A with 5.75% MSCFootnote Reference1 |
(10.57%) |
0.24% |
2.39% |
MSCI World ex USA Index (Net) |
4.70% |
5.10% |
5.26% | |
| Previous Investment Adviser [Text Block] |
|
|
| Updated Performance Information Location [Text Block] |
|
visit im.natixis.com/en-us/products/mutual-funds/price-and-performance
|
| AssetsNet |
|
$ 269,010,643
|
| Holdings Count | Holding |
|
69
|
| Advisory Fees Paid, Amount |
|
$ 2,037,075
|
| InvestmentCompanyPortfolioTurnover |
|
35.00%
|
| Additional Fund Statistics [Text Block] |
|
Total Net Assets |
$269,010,643 |
# of Portfolio Holdings (including overnight repurchase agreements) |
69 |
Portfolio Turnover Rate |
35% |
Total Advisory Fees Paid (after waiver/reimbursement, if applicable) |
$2,037,075 | |
| Holdings [Text Block] |
|
Value |
Value |
Other investments less than 3% of net assetsFootnote Reference* |
42.3% |
Automobile Components |
3.2% |
Beverages |
3.4% |
Insurance |
3.5% |
Health Care Providers & Services |
4.6% |
Automobiles |
5.1% |
Financial Services |
5.3% |
Pharmaceuticals |
5.7% |
Textiles, Apparel & Luxury Goods |
7.4% |
Banks |
9.1% |
Machinery |
10.4% |
| Footnote |
Description |
Footnote* |
Net of other assets less liabilities |
BNP Paribas SA |
3.7% |
Kering SA |
3.3% |
CNH Industrial NV |
3.2% |
Continental AG |
3.2% |
Bayer AG |
3.2% |
Edenred SE |
2.8% |
Bayerische Motoren Werke AG |
2.8% |
Fresenius Medical Care AG |
2.5% |
Mercedes-Benz Group AG, (Registered) |
2.3% |
Airbus SE |
2.2% |
Value |
Value |
Other investments less than 3% of net assetsFootnote Reference* |
19.5% |
United States |
3.3% |
Sweden |
3.4% |
Netherlands |
5.5% |
Switzerland |
7.9% |
United Kingdom |
14.1% |
France |
20.8% |
Germany |
25.5% |
| Footnote |
Description |
Footnote* |
Net of other assets less liabilities | |
| Material Fund Change [Text Block] |
|
There were no material fund changes during the period. |
| C000094873 |
|
|
| Shareholder Report [Line Items] |
|
|
| Fund Name |
|
Natixis Oakmark International Fund
|
| Class Name |
|
Class C
|
| Trading Symbol |
|
NOICX
|
| Annual or Semi-Annual Statement [Text Block] |
|
This annual shareholder report contains important information about Natixis Oakmark International Fund for the period of January 1, 2024 to December 31, 2024.
|
| Shareholder Report Annual or Semi-Annual |
|
Annual Shareholder Report
|
| Additional Information [Text Block] |
|
You can find additional information (including tax information) about the Fund at im.natixis.com/funddocuments. You can also request the information by contacting us at (800) 225-5478 or by contacting your financial intermediary directly.
|
| Additional Information Phone Number |
|
(800) 225-5478
|
| Additional Information Website |
|
<span style="box-sizing: border-box; color: rgb(0, 0, 0); display: inline; flex-wrap: nowrap; font-size: 12px; font-weight: 400; grid-area: auto; line-height: 18px; margin: 0px; overflow: visible; text-align: left; white-space-collapse: preserve-breaks;">im.natixis.com/funddocuments</span>
|
| Expenses [Text Block] |
|
What were the fund costs for the last year? (based on a hypothetical $10,000 investment)
Class Name |
Costs of a $10,000 investment |
Costs paid as a percentage of a $10,000 investmentFootnote Reference† |
Class C |
$184 |
1.90% |
| Footnote |
Description |
Footnote† |
Annualized for periods less than one year (if applicable). | |
| Expenses Paid, Amount |
|
$ 184
|
| Expense Ratio, Percent |
|
1.90%
|
| Factors Affecting Performance [Text Block] |
|
How did the fund perform last year and what affected its performance?Explanation of Fund Performance On an absolute-return basis, the industrials and communication services sectors were the only sectors that contributed to the Fund’s return. Health care and consumer discretionary detracted the most to the Fund’s absolute return for the year. Geographically, Italy and Japan had the largest contribution to absolute performance of the Fund, while France and Germany were the largest detractors. Top Contributors to Performance •Intesa Sanpaolo was a contributor during the 1-year period. The company started the year strong after posting results that benefited from increased fees and commissions. Solid performance continued throughout the year with the company’s net interest income being a highlight. During the year, Intesa launched management changes, which we believe could be pivotal in the continued growth of total fee income and commission over the coming years. •Prosus was another contributor during the 1-year period. The Netherlands-headquartered broadline retail company, which, in our view, is a discounted way to invest in Tencent, saw its stock price rise on improved sentiment toward Chinese stocks after the announcement of a multipronged stimulus package by the Chinese government. During the year, we met with the new CEO, who emphasized focus on balancing steady growth and increasing profitability to unlock further value. Top Detractors from Performance •Bayer was a detractor during the 1-year period. The Germany-headquartered pharmaceuticals company’s stock price declined following its third-quarter earnings release. While pharma revenues exceeded consensus expectations, crop market weakness weighed on performance and drove a downgrade in 2025 guidance. •Kering was another detractor during the 1-year period. The France-headquartered luxury holdings company’s stock price declined initially following the release of first-quarter results with underperformance mainly concentrated around Gucci globally, but most severely in China. The company’s stock price continued to slip after reporting challenging third-quarter earnings and portfolio brands, including Gucci and Yves Saint Laurent, struggled during the period. |
| Performance Past Does Not Indicate Future [Text] |
|
Performance data shown represents past performance and is no guarantee of, and is not necessarily indicative of, future results. Total return and value will vary, and you may have a gain or loss when shares are sold. Current performance may be lower or higher than quoted. For the most recent month-end performance,
|
| Line Graph [Table Text Block] |
|
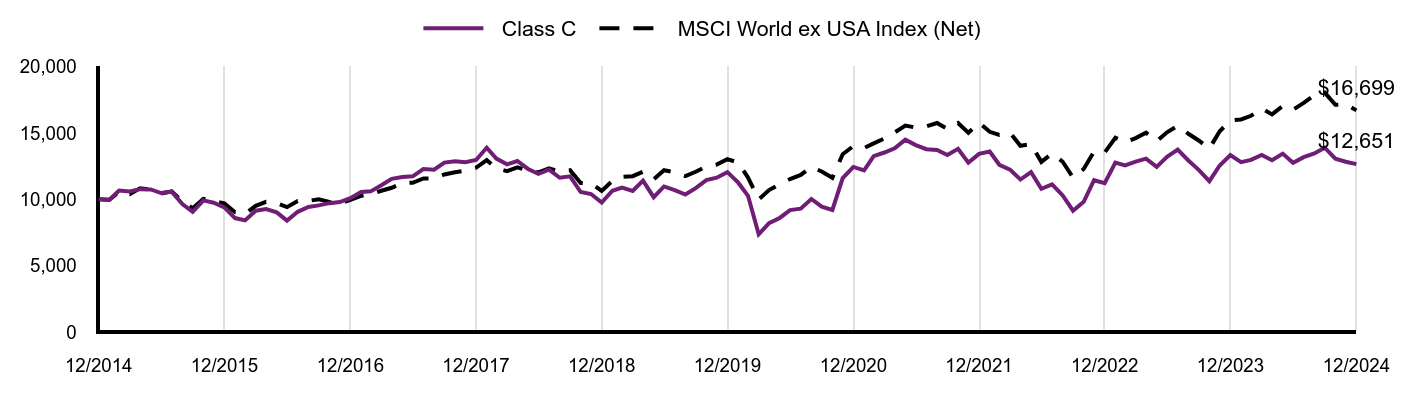
|
Class C |
MSCI World ex USA Index (Net) |
12/2014 |
$10,000 |
$10,000 |
01/2015 |
$9,943 |
$9,965 |
02/2015 |
$10,661 |
$10,560 |
03/2015 |
$10,596 |
$10,383 |
04/2015 |
$10,764 |
$10,833 |
05/2015 |
$10,740 |
$10,739 |
06/2015 |
$10,469 |
$10,434 |
07/2015 |
$10,575 |
$10,599 |
08/2015 |
$9,639 |
$9,827 |
09/2015 |
$9,056 |
$9,331 |
10/2015 |
$9,919 |
$10,033 |
11/2015 |
$9,738 |
$9,873 |
12/2015 |
$9,392 |
$9,696 |
01/2016 |
$8,585 |
$9,029 |
02/2016 |
$8,410 |
$8,903 |
03/2016 |
$9,142 |
$9,507 |
04/2016 |
$9,265 |
$9,813 |
05/2016 |
$9,014 |
$9,702 |
06/2016 |
$8,396 |
$9,407 |
07/2016 |
$9,056 |
$9,870 |
08/2016 |
$9,424 |
$9,879 |
09/2016 |
$9,541 |
$9,999 |
10/2016 |
$9,708 |
$9,805 |
11/2016 |
$9,791 |
$9,648 |
12/2016 |
$10,083 |
$9,963 |
01/2017 |
$10,547 |
$10,259 |
02/2017 |
$10,597 |
$10,378 |
03/2017 |
$11,061 |
$10,641 |
04/2017 |
$11,541 |
$10,867 |
05/2017 |
$11,685 |
$11,230 |
06/2017 |
$11,727 |
$11,240 |
07/2017 |
$12,283 |
$11,575 |
08/2017 |
$12,224 |
$11,572 |
09/2017 |
$12,764 |
$11,872 |
10/2017 |
$12,873 |
$12,034 |
11/2017 |
$12,789 |
$12,156 |
12/2017 |
$12,962 |
$12,374 |
01/2018 |
$13,885 |
$12,951 |
02/2018 |
$13,063 |
$12,336 |
03/2018 |
$12,631 |
$12,122 |
04/2018 |
$12,886 |
$12,400 |
05/2018 |
$12,284 |
$12,165 |
06/2018 |
$11,911 |
$12,032 |
07/2018 |
$12,233 |
$12,327 |
08/2018 |
$11,623 |
$12,094 |
09/2018 |
$11,733 |
$12,189 |
10/2018 |
$10,547 |
$11,220 |
11/2018 |
$10,395 |
$11,210 |
12/2018 |
$9,755 |
$10,631 |
01/2019 |
$10,642 |
$11,389 |
02/2019 |
$10,888 |
$11,682 |
03/2019 |
$10,633 |
$11,742 |
04/2019 |
$11,406 |
$12,074 |
05/2019 |
$10,159 |
$11,503 |
06/2019 |
$10,967 |
$12,187 |
07/2019 |
$10,686 |
$12,040 |
08/2019 |
$10,361 |
$11,744 |
09/2019 |
$10,844 |
$12,073 |
10/2019 |
$11,450 |
$12,464 |
11/2019 |
$11,625 |
$12,619 |
12/2019 |
$12,042 |
$13,022 |
01/2020 |
$11,270 |
$12,770 |
02/2020 |
$10,264 |
$11,636 |
03/2020 |
$7,364 |
$9,993 |
04/2020 |
$8,199 |
$10,690 |
05/2020 |
$8,594 |
$11,144 |
06/2020 |
$9,187 |
$11,526 |
07/2020 |
$9,294 |
$11,833 |
08/2020 |
$10,022 |
$12,443 |
09/2020 |
$9,447 |
$12,093 |
10/2020 |
$9,196 |
$11,618 |
11/2020 |
$11,593 |
$13,400 |
12/2020 |
$12,437 |
$14,010 |
01/2021 |
$12,177 |
$13,860 |
02/2021 |
$13,245 |
$14,213 |
03/2021 |
$13,524 |
$14,576 |
04/2021 |
$13,847 |
$15,034 |
05/2021 |
$14,494 |
$15,557 |
06/2021 |
$14,081 |
$15,399 |
07/2021 |
$13,776 |
$15,501 |
08/2021 |
$13,713 |
$15,750 |
09/2021 |
$13,335 |
$15,297 |
10/2021 |
$13,803 |
$15,753 |
11/2021 |
$12,760 |
$15,015 |
12/2021 |
$13,422 |
$15,778 |
01/2022 |
$13,594 |
$15,082 |
02/2022 |
$12,600 |
$14,847 |
03/2022 |
$12,239 |
$15,019 |
04/2022 |
$11,489 |
$14,033 |
05/2022 |
$12,049 |
$14,150 |
06/2022 |
$10,794 |
$12,818 |
07/2022 |
$11,128 |
$13,456 |
08/2022 |
$10,288 |
$12,827 |
09/2022 |
$9,141 |
$11,640 |
10/2022 |
$9,809 |
$12,281 |
11/2022 |
$11,435 |
$13,589 |
12/2022 |
$11,208 |
$13,523 |
01/2023 |
$12,769 |
$14,632 |
02/2023 |
$12,545 |
$14,290 |
03/2023 |
$12,832 |
$14,608 |
04/2023 |
$13,065 |
$15,023 |
05/2023 |
$12,439 |
$14,367 |
06/2023 |
$13,200 |
$15,050 |
07/2023 |
$13,737 |
$15,538 |
08/2023 |
$12,922 |
$14,936 |
09/2023 |
$12,215 |
$14,433 |
10/2023 |
$11,364 |
$13,824 |
11/2023 |
$12,546 |
$15,123 |
12/2023 |
$13,335 |
$15,949 |
01/2024 |
$12,798 |
$16,018 |
02/2024 |
$12,971 |
$16,292 |
03/2024 |
$13,335 |
$16,841 |
04/2024 |
$12,940 |
$16,395 |
05/2024 |
$13,441 |
$17,022 |
06/2024 |
$12,748 |
$16,740 |
07/2024 |
$13,177 |
$17,265 |
08/2024 |
$13,450 |
$17,841 |
09/2024 |
$13,888 |
$18,039 |
10/2024 |
$13,058 |
$17,119 |
11/2024 |
$12,830 |
$17,160 |
12/2024 |
$12,651 |
$16,699 |
|
| Average Annual Return [Table Text Block] |
|
AATR |
1 Year |
5 Years |
10 Years |
Class C at NAV |
(5.88%) |
0.67% |
2.38% |
Class C with 1.00% CDSCFootnote Reference1 |
(6.81%) |
0.67% |
2.38% |
MSCI World ex USA Index (Net) |
4.70% |
5.10% |
5.26% | |
| Previous Investment Adviser [Text Block] |
|
|
| Updated Performance Information Location [Text Block] |
|
visit im.natixis.com/en-us/products/mutual-funds/price-and-performance
|
| AssetsNet |
|
$ 269,010,643
|
| Holdings Count | Holding |
|
69
|
| Advisory Fees Paid, Amount |
|
$ 2,037,075
|
| InvestmentCompanyPortfolioTurnover |
|
35.00%
|
| Additional Fund Statistics [Text Block] |
|
Total Net Assets |
$269,010,643 |
# of Portfolio Holdings (including overnight repurchase agreements) |
69 |
Portfolio Turnover Rate |
35% |
Total Advisory Fees Paid (after waiver/reimbursement, if applicable) |
$2,037,075 | |
| Holdings [Text Block] |
|
Value |
Value |
Other investments less than 3% of net assetsFootnote Reference* |
42.3% |
Automobile Components |
3.2% |
Beverages |
3.4% |
Insurance |
3.5% |
Health Care Providers & Services |
4.6% |
Automobiles |
5.1% |
Financial Services |
5.3% |
Pharmaceuticals |
5.7% |
Textiles, Apparel & Luxury Goods |
7.4% |
Banks |
9.1% |
Machinery |
10.4% |
| Footnote |
Description |
Footnote* |
Net of other assets less liabilities |
BNP Paribas SA |
3.7% |
Kering SA |
3.3% |
CNH Industrial NV |
3.2% |
Continental AG |
3.2% |
Bayer AG |
3.2% |
Edenred SE |
2.8% |
Bayerische Motoren Werke AG |
2.8% |
Fresenius Medical Care AG |
2.5% |
Mercedes-Benz Group AG, (Registered) |
2.3% |
Airbus SE |
2.2% |
Value |
Value |
Other investments less than 3% of net assetsFootnote Reference* |
19.5% |
United States |
3.3% |
Sweden |
3.4% |
Netherlands |
5.5% |
Switzerland |
7.9% |
United Kingdom |
14.1% |
France |
20.8% |
Germany |
25.5% |
| Footnote |
Description |
Footnote* |
Net of other assets less liabilities | |
| Material Fund Change [Text Block] |
|
There were no material fund changes during the period. |
| C000190734 |
|
|
| Shareholder Report [Line Items] |
|
|
| Fund Name |
|
Natixis Oakmark International Fund
|
| Class Name |
|
Class N
|
| Trading Symbol |
|
NIONX
|
| Annual or Semi-Annual Statement [Text Block] |
|
This annual shareholder report contains important information about Natixis Oakmark International Fund for the period of January 1, 2024 to December 31, 2024.
|
| Shareholder Report Annual or Semi-Annual |
|
Annual Shareholder Report
|
| Additional Information [Text Block] |
|
You can find additional information (including tax information) about the Fund at im.natixis.com/funddocuments. You can also request the information by contacting us at (800) 225-5478 or by contacting your financial intermediary directly.
|
| Additional Information Phone Number |
|
(800) 225-5478
|
| Additional Information Website |
|
<span style="box-sizing: border-box; color: rgb(0, 0, 0); display: inline; flex-wrap: nowrap; font-size: 12px; font-weight: 400; grid-area: auto; line-height: 18px; margin: 0px; overflow: visible; text-align: left; white-space-collapse: preserve-breaks;">im.natixis.com/funddocuments</span>
|
| Expenses [Text Block] |
|
What were the fund costs for the last year? (based on a hypothetical $10,000 investment)
Class Name |
Costs of a $10,000 investment |
Costs paid as a percentage of a $10,000 investmentFootnote Reference† |
Class N |
$83 |
0.85% |
| Footnote |
Description |
Footnote† |
Annualized for periods less than one year (if applicable). | |
| Expenses Paid, Amount |
|
$ 83
|
| Expense Ratio, Percent |
|
0.85%
|
| Factors Affecting Performance [Text Block] |
|
How did the fund perform last year and what affected its performance?Explanation of Fund Performance On an absolute-return basis, the industrials and communication services sectors were the only sectors that contributed to the Fund’s return. Health care and consumer discretionary detracted the most to the Fund’s absolute return for the year. Geographically, Italy and Japan had the largest contribution to absolute performance of the Fund, while France and Germany were the largest detractors. Top Contributors to Performance •Intesa Sanpaolo was a contributor during the 1-year period. The company started the year strong after posting results that benefited from increased fees and commissions. Solid performance continued throughout the year with the company’s net interest income being a highlight. During the year, Intesa launched management changes, which we believe could be pivotal in the continued growth of total fee income and commission over the coming years. •Prosus was another contributor during the 1-year period. The Netherlands-headquartered broadline retail company, which, in our view, is a discounted way to invest in Tencent, saw its stock price rise on improved sentiment toward Chinese stocks after the announcement of a multipronged stimulus package by the Chinese government. During the year, we met with the new CEO, who emphasized focus on balancing steady growth and increasing profitability to unlock further value. Top Detractors from Performance •Bayer was a detractor during the 1-year period. The Germany-headquartered pharmaceuticals company’s stock price declined following its third-quarter earnings release. While pharma revenues exceeded consensus expectations, crop market weakness weighed on performance and drove a downgrade in 2025 guidance. •Kering was another detractor during the 1-year period. The France-headquartered luxury holdings company’s stock price declined initially following the release of first-quarter results with underperformance mainly concentrated around Gucci globally, but most severely in China. The company’s stock price continued to slip after reporting challenging third-quarter earnings and portfolio brands, including Gucci and Yves Saint Laurent, struggled during the period. |
| Performance Past Does Not Indicate Future [Text] |
|
Performance data shown represents past performance and is no guarantee of, and is not necessarily indicative of, future results. Total return and value will vary, and you may have a gain or loss when shares are sold. Current performance may be lower or higher than quoted. For the most recent month-end performance,
|
| Line Graph [Table Text Block] |
|
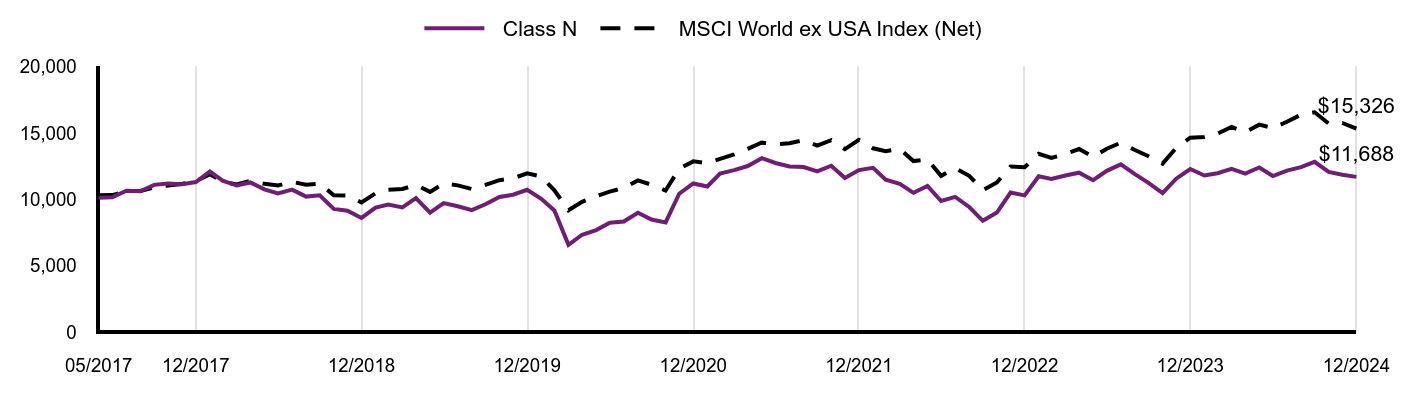
|
Class N |
MSCI World ex USA Index (Net) |
05/2017 |
$10,114 |
$10,306 |
06/2017 |
$10,150 |
$10,316 |
07/2017 |
$10,644 |
$10,623 |
08/2017 |
$10,608 |
$10,620 |
09/2017 |
$11,087 |
$10,896 |
10/2017 |
$11,187 |
$11,044 |
11/2017 |
$11,130 |
$11,156 |
12/2017 |
$11,296 |
$11,357 |
01/2018 |
$12,101 |
$11,886 |
02/2018 |
$11,405 |
$11,321 |
03/2018 |
$11,035 |
$11,125 |
04/2018 |
$11,267 |
$11,381 |
05/2018 |
$10,753 |
$11,165 |
06/2018 |
$10,434 |
$11,042 |
07/2018 |
$10,724 |
$11,314 |
08/2018 |
$10,202 |
$11,100 |
09/2018 |
$10,303 |
$11,186 |
10/2018 |
$9,273 |
$10,298 |
11/2018 |
$9,143 |
$10,288 |
12/2018 |
$8,592 |
$9,757 |
01/2019 |
$9,378 |
$10,453 |
02/2019 |
$9,607 |
$10,721 |
03/2019 |
$9,386 |
$10,776 |
04/2019 |
$10,081 |
$11,081 |
05/2019 |
$8,989 |
$10,557 |
06/2019 |
$9,707 |
$11,184 |
07/2019 |
$9,470 |
$11,050 |
08/2019 |
$9,187 |
$10,778 |
09/2019 |
$9,623 |
$11,080 |
10/2019 |
$10,173 |
$11,439 |
11/2019 |
$10,341 |
$11,581 |
12/2019 |
$10,718 |
$11,951 |
01/2020 |
$10,038 |
$11,720 |
02/2020 |
$9,153 |
$10,679 |
03/2020 |
$6,568 |
$9,171 |
04/2020 |
$7,327 |
$9,811 |
05/2020 |
$7,683 |
$10,228 |
06/2020 |
$8,228 |
$10,578 |
07/2020 |
$8,323 |
$10,860 |
08/2020 |
$8,987 |
$11,420 |
09/2020 |
$8,473 |
$11,098 |
10/2020 |
$8,260 |
$10,662 |
11/2020 |
$10,417 |
$12,298 |
12/2020 |
$11,194 |
$12,857 |
01/2021 |
$10,964 |
$12,720 |
02/2021 |
$11,941 |
$13,045 |
03/2021 |
$12,195 |
$13,377 |
04/2021 |
$12,505 |
$13,798 |
05/2021 |
$13,093 |
$14,278 |
06/2021 |
$12,736 |
$14,132 |
07/2021 |
$12,473 |
$14,226 |
08/2021 |
$12,426 |
$14,455 |
09/2021 |
$12,100 |
$14,039 |
10/2021 |
$12,529 |
$14,457 |
11/2021 |
$11,599 |
$13,781 |
12/2021 |
$12,203 |
$14,481 |
01/2022 |
$12,373 |
$13,842 |
02/2022 |
$11,475 |
$13,626 |
03/2022 |
$11,159 |
$13,784 |
04/2022 |
$10,487 |
$12,879 |
05/2022 |
$11,005 |
$12,986 |
06/2022 |
$9,872 |
$11,764 |
07/2022 |
$10,180 |
$12,349 |
08/2022 |
$9,419 |
$11,772 |
09/2022 |
$8,375 |
$10,682 |
10/2022 |
$8,998 |
$11,271 |
11/2022 |
$10,504 |
$12,472 |
12/2022 |
$10,293 |
$12,411 |
01/2023 |
$11,731 |
$13,428 |
02/2023 |
$11,532 |
$13,115 |
03/2023 |
$11,788 |
$13,406 |
04/2023 |
$12,004 |
$13,787 |
05/2023 |
$11,434 |
$13,186 |
06/2023 |
$12,144 |
$13,813 |
07/2023 |
$12,631 |
$14,260 |
08/2023 |
$11,896 |
$13,708 |
09/2023 |
$11,235 |
$13,246 |
10/2023 |
$10,459 |
$12,687 |
11/2023 |
$11,549 |
$13,879 |
12/2023 |
$12,280 |
$14,638 |
01/2024 |
$11,791 |
$14,701 |
02/2024 |
$11,959 |
$14,952 |
03/2024 |
$12,288 |
$15,456 |
04/2024 |
$11,930 |
$15,047 |
05/2024 |
$12,394 |
$15,622 |
06/2024 |
$11,753 |
$15,363 |
07/2024 |
$12,158 |
$15,845 |
08/2024 |
$12,420 |
$16,374 |
09/2024 |
$12,825 |
$16,555 |
10/2024 |
$12,057 |
$15,711 |
11/2024 |
$11,846 |
$15,749 |
12/2024 |
$11,688 |
$15,326 |
|
| Average Annual Return [Table Text Block] |
|
AATR |
1 Year |
5 Years |
Since Inception 5/1/17 |
Class N |
(4.82%) |
1.75% |
2.05% |
MSCI World ex USA Index (Net) |
4.70% |
5.10% |
5.70% | |
| Performance Inception Date |
|
May 01, 2017
|
| Previous Investment Adviser [Text Block] |
|
|
| Updated Performance Information Location [Text Block] |
|
visit im.natixis.com/en-us/products/mutual-funds/price-and-performance
|
| AssetsNet |
|
$ 269,010,643
|
| Holdings Count | Holding |
|
69
|
| Advisory Fees Paid, Amount |
|
$ 2,037,075
|
| InvestmentCompanyPortfolioTurnover |
|
35.00%
|
| Additional Fund Statistics [Text Block] |
|
Total Net Assets |
$269,010,643 |
# of Portfolio Holdings (including overnight repurchase agreements) |
69 |
Portfolio Turnover Rate |
35% |
Total Advisory Fees Paid (after waiver/reimbursement, if applicable) |
$2,037,075 | |
| Holdings [Text Block] |
|
Value |
Value |
Other investments less than 3% of net assetsFootnote Reference* |
42.3% |
Automobile Components |
3.2% |
Beverages |
3.4% |
Insurance |
3.5% |
Health Care Providers & Services |
4.6% |
Automobiles |
5.1% |
Financial Services |
5.3% |
Pharmaceuticals |
5.7% |
Textiles, Apparel & Luxury Goods |
7.4% |
Banks |
9.1% |
Machinery |
10.4% |
| Footnote |
Description |
Footnote* |
Net of other assets less liabilities |
BNP Paribas SA |
3.7% |
Kering SA |
3.3% |
CNH Industrial NV |
3.2% |
Continental AG |
3.2% |
Bayer AG |
3.2% |
Edenred SE |
2.8% |
Bayerische Motoren Werke AG |
2.8% |
Fresenius Medical Care AG |
2.5% |
Mercedes-Benz Group AG, (Registered) |
2.3% |
Airbus SE |
2.2% |
Value |
Value |
Other investments less than 3% of net assetsFootnote Reference* |
19.5% |
United States |
3.3% |
Sweden |
3.4% |
Netherlands |
5.5% |
Switzerland |
7.9% |
United Kingdom |
14.1% |
France |
20.8% |
Germany |
25.5% |
| Footnote |
Description |
Footnote* |
Net of other assets less liabilities | |
| Material Fund Change [Text Block] |
|
There were no material fund changes during the period. |
| C000190735 |
|
|
| Shareholder Report [Line Items] |
|
|
| Fund Name |
|
Natixis Oakmark International Fund
|
| Class Name |
|
Class Y
|
| Trading Symbol |
|
NOIYX
|
| Annual or Semi-Annual Statement [Text Block] |
|
This annual shareholder report contains important information about Natixis Oakmark International Fund for the period of January 1, 2024 to December 31, 2024.
|
| Shareholder Report Annual or Semi-Annual |
|
Annual Shareholder Report
|
| Additional Information [Text Block] |
|
You can find additional information (including tax information) about the Fund at im.natixis.com/funddocuments. You can also request the information by contacting us at (800) 225-5478 or by contacting your financial intermediary directly.
|
| Additional Information Phone Number |
|
(800) 225-5478
|
| Additional Information Website |
|
<span style="box-sizing: border-box; color: rgb(0, 0, 0); display: inline; flex-wrap: nowrap; font-size: 12px; font-weight: 400; grid-area: auto; line-height: 18px; margin: 0px; overflow: visible; text-align: left; white-space-collapse: preserve-breaks;">im.natixis.com/funddocuments</span>
|
| Expenses [Text Block] |
|
What were the fund costs for the last year? (based on a hypothetical $10,000 investment)
Class Name |
Costs of a $10,000 investment |
Costs paid as a percentage of a $10,000 investmentFootnote Reference† |
Class Y |
$88 |
0.90% |
| Footnote |
Description |
Footnote† |
Annualized for periods less than one year (if applicable). | |
| Expenses Paid, Amount |
|
$ 88
|
| Expense Ratio, Percent |
|
0.90%
|
| Factors Affecting Performance [Text Block] |
|
How did the fund perform last year and what affected its performance?Explanation of Fund Performance On an absolute-return basis, the industrials and communication services sectors were the only sectors that contributed to the Fund’s return. Health care and consumer discretionary detracted the most to the Fund’s absolute return for the year. Geographically, Italy and Japan had the largest contribution to absolute performance of the Fund, while France and Germany were the largest detractors. Top Contributors to Performance •Intesa Sanpaolo was a contributor during the 1-year period. The company started the year strong after posting results that benefited from increased fees and commissions. Solid performance continued throughout the year with the company’s net interest income being a highlight. During the year, Intesa launched management changes, which we believe could be pivotal in the continued growth of total fee income and commission over the coming years. •Prosus was another contributor during the 1-year period. The Netherlands-headquartered broadline retail company, which, in our view, is a discounted way to invest in Tencent, saw its stock price rise on improved sentiment toward Chinese stocks after the announcement of a multipronged stimulus package by the Chinese government. During the year, we met with the new CEO, who emphasized focus on balancing steady growth and increasing profitability to unlock further value. Top Detractors from Performance •Bayer was a detractor during the 1-year period. The Germany-headquartered pharmaceuticals company’s stock price declined following its third-quarter earnings release. While pharma revenues exceeded consensus expectations, crop market weakness weighed on performance and drove a downgrade in 2025 guidance. •Kering was another detractor during the 1-year period. The France-headquartered luxury holdings company’s stock price declined initially following the release of first-quarter results with underperformance mainly concentrated around Gucci globally, but most severely in China. The company’s stock price continued to slip after reporting challenging third-quarter earnings and portfolio brands, including Gucci and Yves Saint Laurent, struggled during the period. |
| Performance Past Does Not Indicate Future [Text] |
|
Performance data shown represents past performance and is no guarantee of, and is not necessarily indicative of, future results. Total return and value will vary, and you may have a gain or loss when shares are sold. Current performance may be lower or higher than quoted. For the most recent month-end performance,
|
| Line Graph [Table Text Block] |
|
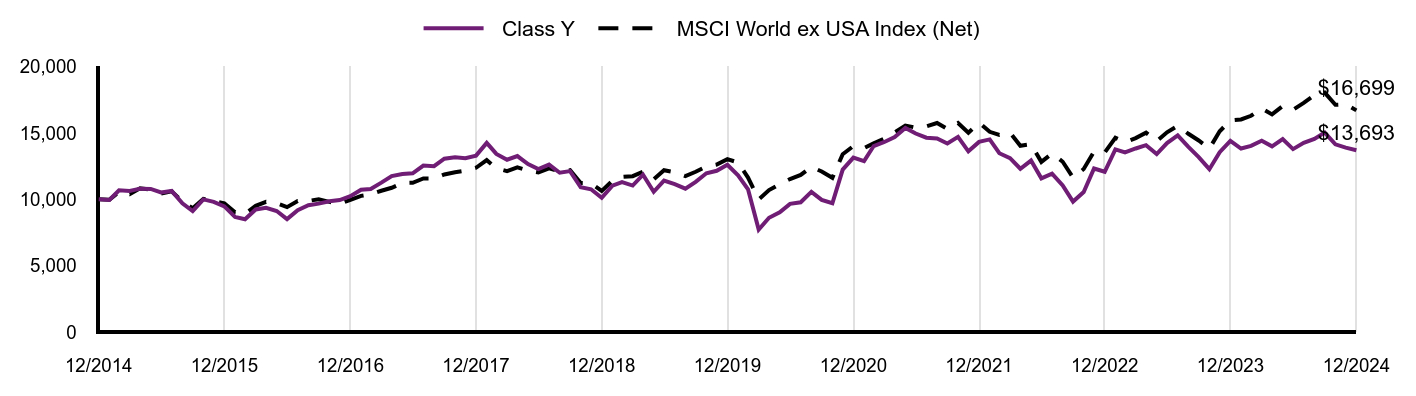
|
Class Y |
MSCI World ex USA Index (Net) |
12/2014 |
$10,000 |
$10,000 |
01/2015 |
$9,952 |
$9,965 |
02/2015 |
$10,683 |
$10,560 |
03/2015 |
$10,627 |
$10,383 |
04/2015 |
$10,801 |
$10,833 |
05/2015 |
$10,777 |
$10,739 |
06/2015 |
$10,510 |
$10,434 |
07/2015 |
$10,631 |
$10,599 |
08/2015 |
$9,693 |
$9,827 |
09/2015 |
$9,111 |
$9,331 |
10/2015 |
$9,992 |
$10,033 |
11/2015 |
$9,807 |
$9,873 |
12/2015 |
$9,465 |
$9,696 |
01/2016 |
$8,665 |
$9,029 |
02/2016 |
$8,492 |
$8,903 |
03/2016 |
$9,234 |
$9,507 |
04/2016 |
$9,364 |
$9,813 |
05/2016 |
$9,116 |
$9,702 |
06/2016 |
$8,503 |
$9,407 |
07/2016 |
$9,174 |
$9,870 |
08/2016 |
$9,547 |
$9,879 |
09/2016 |
$9,671 |
$9,999 |
10/2016 |
$9,853 |
$9,805 |
11/2016 |
$9,944 |
$9,648 |
12/2016 |
$10,240 |
$9,963 |
01/2017 |
$10,721 |
$10,259 |
02/2017 |
$10,780 |
$10,378 |
03/2017 |
$11,252 |
$10,641 |
04/2017 |
$11,749 |
$10,867 |
05/2017 |
$11,909 |
$11,230 |
06/2017 |
$11,960 |
$11,240 |
07/2017 |
$12,541 |
$11,575 |
08/2017 |
$12,491 |
$11,572 |
09/2017 |
$13,055 |
$11,872 |
10/2017 |
$13,173 |
$12,034 |
11/2017 |
$13,098 |
$12,156 |
12/2017 |
$13,290 |
$12,374 |
01/2018 |
$14,246 |
$12,951 |
02/2018 |
$13,418 |
$12,336 |
03/2018 |
$12,982 |
$12,122 |
04/2018 |
$13,255 |
$12,400 |
05/2018 |
$12,649 |
$12,165 |
06/2018 |
$12,273 |
$12,032 |
07/2018 |
$12,615 |
$12,327 |
08/2018 |
$12,000 |
$12,094 |
09/2018 |
$12,120 |
$12,189 |
10/2018 |
$10,907 |
$11,220 |
11/2018 |
$10,753 |
$11,210 |
12/2018 |
$10,110 |
$10,631 |
01/2019 |
$11,026 |
$11,389 |
02/2019 |
$11,296 |
$11,682 |
03/2019 |
$11,035 |
$11,742 |
04/2019 |
$11,853 |
$12,074 |
05/2019 |
$10,568 |
$11,503 |
06/2019 |
$11,413 |
$12,187 |
07/2019 |
$11,134 |
$12,040 |
08/2019 |
$10,801 |
$11,744 |
09/2019 |
$11,314 |
$12,073 |
10/2019 |
$11,961 |
$12,464 |
11/2019 |
$12,149 |
$12,619 |
12/2019 |
$12,600 |
$13,022 |
01/2020 |
$11,801 |
$12,770 |
02/2020 |
$10,751 |
$11,636 |
03/2020 |
$7,722 |
$9,993 |
04/2020 |
$8,605 |
$10,690 |
05/2020 |
$9,023 |
$11,144 |
06/2020 |
$9,655 |
$11,526 |
07/2020 |
$9,775 |
$11,833 |
08/2020 |
$10,556 |
$12,443 |
09/2020 |
$9,952 |
$12,093 |
10/2020 |
$9,701 |
$11,618 |
11/2020 |
$12,238 |
$13,400 |
12/2020 |
$13,144 |
$14,010 |
01/2021 |
$12,873 |
$13,860 |
02/2021 |
$14,012 |
$14,213 |
03/2021 |
$14,320 |
$14,576 |
04/2021 |
$14,685 |
$15,034 |
05/2021 |
$15,376 |
$15,557 |
06/2021 |
$14,956 |
$15,399 |
07/2021 |
$14,638 |
$15,501 |
08/2021 |
$14,582 |
$15,750 |
09/2021 |
$14,199 |
$15,297 |
10/2021 |
$14,704 |
$15,753 |
11/2021 |
$13,611 |
$15,015 |
12/2021 |
$14,323 |
$15,778 |
01/2022 |
$14,513 |
$15,082 |
02/2022 |
$13,468 |
$14,847 |
03/2022 |
$13,097 |
$15,019 |
04/2022 |
$12,299 |
$14,033 |
05/2022 |
$12,916 |
$14,150 |
06/2022 |
$11,576 |
$12,818 |
07/2022 |
$11,937 |
$13,456 |
08/2022 |
$11,044 |
$12,827 |
09/2022 |
$9,827 |
$11,640 |
10/2022 |
$10,550 |
$12,281 |
11/2022 |
$12,318 |
$13,589 |
12/2022 |
$12,073 |
$13,523 |
01/2023 |
$13,760 |
$14,632 |
02/2023 |
$13,527 |
$14,290 |
03/2023 |
$13,828 |
$14,608 |
04/2023 |
$14,081 |
$15,023 |
05/2023 |
$13,412 |
$14,367 |
06/2023 |
$14,236 |
$15,050 |
07/2023 |
$14,818 |
$15,538 |
08/2023 |
$13,945 |
$14,936 |
09/2023 |
$13,179 |
$14,433 |
10/2023 |
$12,267 |
$13,824 |
11/2023 |
$13,547 |
$15,123 |
12/2023 |
$14,398 |
$15,949 |
01/2024 |
$13,824 |
$16,018 |
02/2024 |
$14,022 |
$16,292 |
03/2024 |
$14,408 |
$16,841 |
04/2024 |
$13,988 |
$16,395 |
05/2024 |
$14,533 |
$17,022 |
06/2024 |
$13,780 |
$16,740 |
07/2024 |
$14,255 |
$17,265 |
08/2024 |
$14,552 |
$17,841 |
09/2024 |
$15,027 |
$18,039 |
10/2024 |
$14,137 |
$17,119 |
11/2024 |
$13,889 |
$17,160 |
12/2024 |
$13,693 |
$16,699 |
|
| Average Annual Return [Table Text Block] |
|
AATR |
1 Year |
5 Years |
10 Years |
Class Y |
(4.89%) |
1.68% |
3.19%Footnote Reference* |
MSCI World ex USA Index (Net) |
4.70% |
5.10% |
5.26% | |
| Previous Investment Adviser [Text Block] |
|
|
| Updated Performance Information Location [Text Block] |
|
visit im.natixis.com/en-us/products/mutual-funds/price-and-performance
|
| AssetsNet |
|
$ 269,010,643
|
| Holdings Count | Holding |
|
69
|
| Advisory Fees Paid, Amount |
|
$ 2,037,075
|
| InvestmentCompanyPortfolioTurnover |
|
35.00%
|
| Additional Fund Statistics [Text Block] |
|
Total Net Assets |
$269,010,643 |
# of Portfolio Holdings (including overnight repurchase agreements) |
69 |
Portfolio Turnover Rate |
35% |
Total Advisory Fees Paid (after waiver/reimbursement, if applicable) |
$2,037,075 | |
| Holdings [Text Block] |
|
Value |
Value |
Other investments less than 3% of net assetsFootnote Reference* |
42.3% |
Automobile Components |
3.2% |
Beverages |
3.4% |
Insurance |
3.5% |
Health Care Providers & Services |
4.6% |
Automobiles |
5.1% |
Financial Services |
5.3% |
Pharmaceuticals |
5.7% |
Textiles, Apparel & Luxury Goods |
7.4% |
Banks |
9.1% |
Machinery |
10.4% |
| Footnote |
Description |
Footnote* |
Net of other assets less liabilities |
BNP Paribas SA |
3.7% |
Kering SA |
3.3% |
CNH Industrial NV |
3.2% |
Continental AG |
3.2% |
Bayer AG |
3.2% |
Edenred SE |
2.8% |
Bayerische Motoren Werke AG |
2.8% |
Fresenius Medical Care AG |
2.5% |
Mercedes-Benz Group AG, (Registered) |
2.3% |
Airbus SE |
2.2% |
Value |
Value |
Other investments less than 3% of net assetsFootnote Reference* |
19.5% |
United States |
3.3% |
Sweden |
3.4% |
Netherlands |
5.5% |
Switzerland |
7.9% |
United Kingdom |
14.1% |
France |
20.8% |
Germany |
25.5% |
| Footnote |
Description |
Footnote* |
Net of other assets less liabilities | |
| Material Fund Change [Text Block] |
|
There were no material fund changes during the period. |
| C000018161 |
|
|
| Shareholder Report [Line Items] |
|
|
| Fund Name |
|
Natixis U.S. Equity Opportunities Fund
|
| Class Name |
|
Class A
|
| Trading Symbol |
|
NEFSX
|
| Annual or Semi-Annual Statement [Text Block] |
|
This annual shareholder report contains important information about Natixis U.S. Equity Opportunities Fund for the period of January 1, 2024 to December 31, 2024.
|
| Shareholder Report Annual or Semi-Annual |
|
Annual Shareholder Report
|
| Additional Information [Text Block] |
|
You can find additional information (including tax information) about the Fund at im.natixis.com/funddocuments. You can also request the information by contacting us at (800) 225-5478 or by contacting your financial intermediary directly.
|
| Additional Information Phone Number |
|
(800) 225-5478
|
| Additional Information Website |
|
<span style="box-sizing: border-box; color: rgb(0, 0, 0); display: inline; flex-wrap: nowrap; font-size: 12px; font-weight: 400; grid-area: auto; line-height: 18px; margin: 0px; overflow: visible; text-align: left; white-space-collapse: preserve-breaks;">im.natixis.com/funddocuments</span>
|
| Expenses [Text Block] |
|
What were the fund costs for the last year? (based on a hypothetical $10,000 investment)
Class Name |
Costs of a $10,000 investment |
Costs paid as a percentage of a $10,000 investmentFootnote Reference† |
Class A |
$120 |
1.07% |
| Footnote |
Description |
Footnote† |
Annualized for periods less than one year (if applicable). | |
| Expenses Paid, Amount |
|
$ 120
|
| Expense Ratio, Percent |
|
1.07%
|
| Factors Affecting Performance [Text Block] |
|
How did the fund perform last year and what affected its performance?Explanation of Fund Performance The Natixis U.S. Equity Opportunities Fund is composed of two separately managed portfolio sleeves, combining the value expertise of Harris Associates, L.P. ("Harris Associates") with the growth expertise of Loomis, Sayles & Company, L.P. ("Loomis Sayles"). Harris Associates Large Cap Value Sleeve On an absolute-return basis, the financials sector contributed the most to the return of the Fund, while health care and energy had the only negative contributions. Top Contributors to Performance Fiserv and Alphabet were top contributors during the 1-year period. Fiserv's stock price rose due to solid second-quarter results, improved free-cash-flow conversion, and significant share repurchases. Alphabet's stock price increased after strong first-quarter results, driven by revenue growth across Search, YouTube, and Cloud. Despite ongoing antitrust litigation, we still see attractive upside. Top Detractors from Performance Centene and APA Corporation were top detractors during the 1-year period. Centene's stock price declined due to investor concerns about legislative changes. APA Corporation's stock price fell due to issues with a liquified natural gas export contract and new U.K. emissions regulations. Loomis Sayles All Cap Growth Sleeve We are an active manager with a long-term, private equity approach to investing. Through our proprietary bottom-up research framework, we look to invest in those few high-quality businesses with sustainable competitive advantages and profitable growth when they trade at a significant discount to intrinsic value. Top Contributors to Performance Nvidia, Meta Platforms, and Tesla contributed the most to performance. Stock selection in the information technology, communication services, consumer discretionary, and healthcare sectors, and allocations in the communication services, consumer discretionary, and industrials sectors, contributed positively to relative performance. Top Detractors from Performance Boeing, Mobileye Global, and Monster Beverage detracted the most from performance. Stock selection in the industrials, consumer staples, and financials sectors, and allocations in the healthcare, information technology, and financials sectors, detracted from relative performance. |
| Performance Past Does Not Indicate Future [Text] |
|
Performance data shown represents past performance and is no guarantee of, and is not necessarily indicative of, future results. Total return and value will vary, and you may have a gain or loss when shares are sold. Current performance may be lower or higher than quoted. For the most recent month-end performance,
|
| Line Graph [Table Text Block] |
|
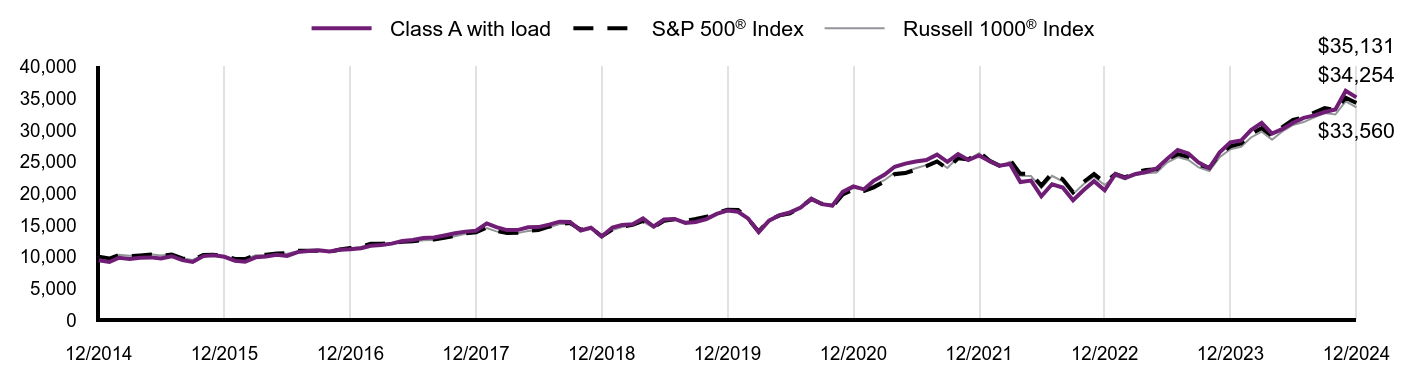
|
Class A with load |
S&P 500® Index |
Russell 1000® Index |
12/2014 |
$9,426 |
$10,000 |
$10,000 |
01/2015 |
$9,154 |
$9,700 |
$9,725 |
02/2015 |
$9,828 |
$10,257 |
$10,287 |
03/2015 |
$9,646 |
$10,095 |
$10,159 |
04/2015 |
$9,828 |
$10,192 |
$10,231 |
05/2015 |
$9,883 |
$10,323 |
$10,365 |
06/2015 |
$9,699 |
$10,123 |
$10,171 |
07/2015 |
$10,068 |
$10,335 |
$10,367 |
08/2015 |
$9,445 |
$9,712 |
$9,743 |
09/2015 |
$9,170 |
$9,471 |
$9,476 |
10/2015 |
$10,085 |
$10,270 |
$10,243 |
11/2015 |
$10,204 |
$10,301 |
$10,277 |
12/2015 |
$9,978 |
$10,138 |
$10,092 |
01/2016 |
$9,327 |
$9,635 |
$9,549 |
02/2016 |
$9,193 |
$9,622 |
$9,545 |
03/2016 |
$9,891 |
$10,275 |
$10,210 |
04/2016 |
$10,034 |
$10,315 |
$10,266 |
05/2016 |
$10,297 |
$10,500 |
$10,446 |
06/2016 |
$10,107 |
$10,527 |
$10,469 |
07/2016 |
$10,713 |
$10,915 |
$10,868 |
08/2016 |
$10,873 |
$10,931 |
$10,882 |
09/2016 |
$11,019 |
$10,933 |
$10,891 |
10/2016 |
$10,815 |
$10,733 |
$10,679 |
11/2016 |
$11,085 |
$11,131 |
$11,100 |
12/2016 |
$11,161 |
$11,351 |
$11,308 |
01/2017 |
$11,338 |
$11,566 |
$11,536 |
02/2017 |
$11,718 |
$12,025 |
$11,982 |
03/2017 |
$11,832 |
$12,039 |
$11,990 |
04/2017 |
$12,057 |
$12,163 |
$12,116 |
05/2017 |
$12,457 |
$12,334 |
$12,271 |
06/2017 |
$12,627 |
$12,411 |
$12,357 |
07/2017 |
$12,953 |
$12,666 |
$12,601 |
08/2017 |
$13,019 |
$12,705 |
$12,641 |
09/2017 |
$13,334 |
$12,967 |
$12,910 |
10/2017 |
$13,682 |
$13,270 |
$13,206 |
11/2017 |
$13,948 |
$13,677 |
$13,609 |
12/2017 |
$14,095 |
$13,829 |
$13,761 |
01/2018 |
$15,237 |
$14,621 |
$14,516 |
02/2018 |
$14,648 |
$14,082 |
$13,983 |
03/2018 |
$14,190 |
$13,724 |
$13,666 |
04/2018 |
$14,186 |
$13,777 |
$13,712 |
05/2018 |
$14,638 |
$14,108 |
$14,062 |
06/2018 |
$14,662 |
$14,195 |
$14,153 |
07/2018 |
$15,048 |
$14,724 |
$14,642 |
08/2018 |
$15,520 |
$15,203 |
$15,146 |
09/2018 |
$15,454 |
$15,290 |
$15,204 |
10/2018 |
$14,131 |
$14,245 |
$14,128 |
11/2018 |
$14,564 |
$14,535 |
$14,415 |
12/2018 |
$13,182 |
$13,223 |
$13,102 |
01/2019 |
$14,590 |
$14,282 |
$14,200 |
02/2019 |
$15,002 |
$14,741 |
$14,681 |
03/2019 |
$15,113 |
$15,027 |
$14,937 |
04/2019 |
$16,023 |
$15,636 |
$15,540 |
05/2019 |
$14,754 |
$14,642 |
$14,550 |
06/2019 |
$15,861 |
$15,674 |
$15,571 |
07/2019 |
$15,957 |
$15,899 |
$15,813 |
08/2019 |
$15,323 |
$15,648 |
$15,523 |
09/2019 |
$15,476 |
$15,940 |
$15,792 |
10/2019 |
$15,926 |
$16,286 |
$16,127 |
11/2019 |
$16,736 |
$16,877 |
$16,737 |
12/2019 |
$17,272 |
$17,386 |
$17,220 |
01/2020 |
$17,088 |
$17,379 |
$17,238 |
02/2020 |
$16,038 |
$15,949 |
$15,830 |
03/2020 |
$13,859 |
$13,979 |
$13,738 |
04/2020 |
$15,678 |
$15,771 |
$15,553 |
05/2020 |
$16,568 |
$16,522 |
$16,374 |
06/2020 |
$16,982 |
$16,850 |
$16,736 |
07/2020 |
$17,765 |
$17,801 |
$17,716 |
08/2020 |
$19,141 |
$19,080 |
$19,016 |
09/2020 |
$18,280 |
$18,355 |
$18,321 |
10/2020 |
$18,056 |
$17,867 |
$17,879 |
11/2020 |
$20,220 |
$19,823 |
$19,985 |
12/2020 |
$21,087 |
$20,585 |
$20,830 |
01/2021 |
$20,623 |
$20,377 |
$20,658 |
02/2021 |
$21,973 |
$20,939 |
$21,257 |
03/2021 |
$22,924 |
$21,856 |
$22,061 |
04/2021 |
$24,186 |
$23,022 |
$23,249 |
05/2021 |
$24,679 |
$23,183 |
$23,359 |
06/2021 |
$25,010 |
$23,724 |
$23,944 |
07/2021 |
$25,245 |
$24,288 |
$24,442 |
08/2021 |
$26,097 |
$25,026 |
$25,149 |
09/2021 |
$24,971 |
$23,863 |
$23,994 |
10/2021 |
$26,181 |
$25,534 |
$25,659 |
11/2021 |
$25,256 |
$25,357 |
$25,315 |
12/2021 |
$25,967 |
$26,494 |
$26,340 |
01/2022 |
$25,057 |
$25,123 |
$24,855 |
02/2022 |
$24,353 |
$24,371 |
$24,173 |
03/2022 |
$24,630 |
$25,276 |
$24,989 |
04/2022 |
$21,777 |
$23,071 |
$22,761 |
05/2022 |
$22,009 |
$23,114 |
$22,727 |
06/2022 |
$19,534 |
$21,206 |
$20,823 |
07/2022 |
$21,420 |
$23,161 |
$22,763 |
08/2022 |
$20,919 |
$22,217 |
$21,889 |
09/2022 |
$18,901 |
$20,170 |
$19,863 |
10/2022 |
$20,518 |
$21,804 |
$21,456 |
11/2022 |
$21,909 |
$23,022 |
$22,617 |
12/2022 |
$20,476 |
$21,696 |
$21,302 |
01/2023 |
$23,059 |
$23,059 |
$22,730 |
02/2023 |
$22,417 |
$22,496 |
$22,189 |
03/2023 |
$23,045 |
$23,322 |
$22,891 |
04/2023 |
$23,358 |
$23,686 |
$23,175 |
05/2023 |
$23,924 |
$23,789 |
$23,283 |
06/2023 |
$25,409 |
$25,361 |
$24,855 |
07/2023 |
$26,837 |
$26,176 |
$25,710 |
08/2023 |
$26,286 |
$25,759 |
$25,260 |
09/2023 |
$24,836 |
$24,531 |
$24,073 |
10/2023 |
$23,959 |
$24,015 |
$23,491 |
11/2023 |
$26,469 |
$26,208 |
$25,685 |
12/2023 |
$28,053 |
$27,399 |
$26,953 |
01/2024 |
$28,328 |
$27,859 |
$27,329 |
02/2024 |
$29,970 |
$29,347 |
$28,805 |
03/2024 |
$31,108 |
$30,291 |
$29,728 |
04/2024 |
$29,425 |
$29,054 |
$28,463 |
05/2024 |
$30,159 |
$30,494 |
$29,804 |
06/2024 |
$31,144 |
$31,589 |
$30,790 |
07/2024 |
$31,908 |
$31,973 |
$31,238 |
08/2024 |
$32,290 |
$32,749 |
$31,979 |
09/2024 |
$32,825 |
$33,448 |
$32,663 |
10/2024 |
$33,230 |
$33,145 |
$32,434 |
11/2024 |
$36,171 |
$35,090 |
$34,522 |
12/2024 |
$35,131 |
$34,254 |
$33,560 |
|
| Average Annual Return [Table Text Block] |
|
AATR |
1 Year |
5 Years |
10 Years |
Class A at NAV |
25.23% |
15.26% |
14.06% |
Class A with 5.75% MSCFootnote Reference1 |
18.03% |
13.90% |
13.39% |
S&P 500® Index |
25.02% |
14.53% |
13.10% |
Russell 1000® Index |
24.51% |
14.28% |
12.87% | |
| Previous Investment Adviser [Text Block] |
|
|
| Material Change Description [Text Block] |
|
This report describes changes to the Fund that occurred during the reporting period.
|
| Material Change Date |
Jul. 01, 2024
|
|
| Updated Performance Information Location [Text Block] |
|
visit im.natixis.com/en-us/products/mutual-funds/price-and-performance
|
| AssetsNet |
|
$ 1,128,654,333
|
| Holdings Count | Holding |
|
75
|
| Advisory Fees Paid, Amount |
|
$ 7,057,328
|
| InvestmentCompanyPortfolioTurnover |
|
33.00%
|
| Additional Fund Statistics [Text Block] |
|
Total Net Assets |
$1,128,654,333 |
# of Portfolio Holdings (including overnight repurchase agreements) |
75 |
Portfolio Turnover Rate |
33% |
Total Advisory Fees Paid (after waiver/reimbursement, if applicable) |
$7,057,328 | |
| Holdings [Text Block] |
|
Value |
Value |
Other investments less than 3% of net assetsFootnote Reference* |
35.6% |
Insurance |
3.3% |
Broadline Retail |
3.4% |
Financial Services |
4.7% |
Entertainment |
5.3% |
Oil, Gas & Consumable Fuels |
5.3% |
Semiconductors & Semiconductor Equipment |
6.1% |
Automobiles |
6.2% |
Banks |
6.7% |
Capital Markets |
7.4% |
Software |
7.5% |
Interactive Media & Services |
8.5% |
| Footnote |
Description |
Footnote* |
Net of other assets less liabilities |
Alphabet, Inc., Class A |
4.6% |
NVIDIA Corp. |
4.5% |
Tesla, Inc. |
4.0% |
Meta Platforms, Inc., Class A |
3.6% |
Amazon.com, Inc. |
3.1% |
Netflix, Inc. |
3.0% |
Deere & Co. |
2.3% |
Citigroup, Inc. |
2.3% |
Oracle Corp. |
2.2% |
Charles Schwab Corp. |
2.2% | |
| Material Fund Change [Text Block] |
|
Effective July 1, 2024, the Fund had the following material changes, which were reported in a supplement to the Fund's prospectus. For more information, you may review the Fund's prospectus at im.natixis.com/funddocuments or upon request at (800) 225-5478 or through your financial intermediary. Expenses: The expense limit as a percentage of average daily net assets was reduced to 1.08% from 1.12%. |
| Material Fund Change Expenses [Text Block] |
|
Expenses: The expense limit as a percentage of average daily net assets was reduced to 1.08% from 1.12%.
|
| Summary of Change Legend [Text Block] |
|
Effective July 1, 2024, the Fund had the following material changes, which were reported in a supplement to the Fund's prospectus. For more information, you may review the Fund's prospectus at im.natixis.com/funddocuments or upon request at (800) 225-5478 or through your financial intermediary.
|
| Updated Prospectus Phone Number |
|
(800) 225-5478
|
| Updated Prospectus Web Address |
|
<span style="box-sizing: border-box; color: rgb(0, 0, 0); display: inline; flex-wrap: nowrap; font-size: 10.6667px; font-weight: 400; grid-area: auto; line-height: 16px; margin: 0px; overflow: visible; text-align: left; white-space-collapse: preserve-breaks;">im.natixis.com/funddocuments</span>
|
| C000018163 |
|
|
| Shareholder Report [Line Items] |
|
|
| Fund Name |
|
Natixis U.S. Equity Opportunities Fund
|
| Class Name |
|
Class C
|
| Trading Symbol |
|
NECCX
|
| Annual or Semi-Annual Statement [Text Block] |
|
This annual shareholder report contains important information about Natixis U.S. Equity Opportunities Fund for the period of January 1, 2024 to December 31, 2024.
|
| Shareholder Report Annual or Semi-Annual |
|
Annual Shareholder Report
|
| Additional Information [Text Block] |
|
You can find additional information (including tax information) about the Fund at im.natixis.com/funddocuments. You can also request the information by contacting us at (800) 225-5478 or by contacting your financial intermediary directly.
|
| Additional Information Phone Number |
|
(800) 225-5478
|
| Additional Information Website |
|
<span style="box-sizing: border-box; color: rgb(0, 0, 0); display: inline; flex-wrap: nowrap; font-size: 12px; font-weight: 400; grid-area: auto; line-height: 18px; margin: 0px; overflow: visible; text-align: left; white-space-collapse: preserve-breaks;">im.natixis.com/funddocuments</span>
|
| Expenses [Text Block] |
|
What were the fund costs for the last year? (based on a hypothetical $10,000 investment)
Class Name |
Costs of a $10,000 investment |
Costs paid as a percentage of a $10,000 investmentFootnote Reference† |
Class C |
$204 |
1.82% |
| Footnote |
Description |
Footnote† |
Annualized for periods less than one year (if applicable). | |
| Expenses Paid, Amount |
|
$ 204
|
| Expense Ratio, Percent |
|
1.82%
|
| Factors Affecting Performance [Text Block] |
|
How did the fund perform last year and what affected its performance?Explanation of Fund Performance The Natixis U.S. Equity Opportunities Fund is composed of two separately managed portfolio sleeves, combining the value expertise of Harris Associates, L.P. ("Harris Associates") with the growth expertise of Loomis, Sayles & Company, L.P. ("Loomis Sayles"). Harris Associates Large Cap Value Sleeve On an absolute-return basis, the financials sector contributed the most to the return of the Fund, while health care and energy had the only negative contributions. Top Contributors to Performance Fiserv and Alphabet were top contributors during the 1-year period. Fiserv's stock price rose due to solid second-quarter results, improved free-cash-flow conversion, and significant share repurchases. Alphabet's stock price increased after strong first-quarter results, driven by revenue growth across Search, YouTube, and Cloud. Despite ongoing antitrust litigation, we still see attractive upside. Top Detractors from Performance Centene and APA Corporation were top detractors during the 1-year period. Centene's stock price declined due to investor concerns about legislative changes. APA Corporation's stock price fell due to issues with a liquified natural gas export contract and new U.K. emissions regulations. Loomis Sayles All Cap Growth Sleeve We are an active manager with a long-term, private equity approach to investing. Through our proprietary bottom-up research framework, we look to invest in those few high-quality businesses with sustainable competitive advantages and profitable growth when they trade at a significant discount to intrinsic value. Top Contributors to Performance Nvidia, Meta Platforms, and Tesla contributed the most to performance. Stock selection in the information technology, communication services, consumer discretionary, and healthcare sectors, and allocations in the communication services, consumer discretionary, and industrials sectors, contributed positively to relative performance. Top Detractors from Performance Boeing, Mobileye Global, and Monster Beverage detracted the most from performance. Stock selection in the industrials, consumer staples, and financials sectors, and allocations in the healthcare, information technology, and financials sectors, detracted from relative performance. |
| Performance Past Does Not Indicate Future [Text] |
|
Performance data shown represents past performance and is no guarantee of, and is not necessarily indicative of, future results. Total return and value will vary, and you may have a gain or loss when shares are sold. Current performance may be lower or higher than quoted. For the most recent month-end performance,
|
| Line Graph [Table Text Block] |
|
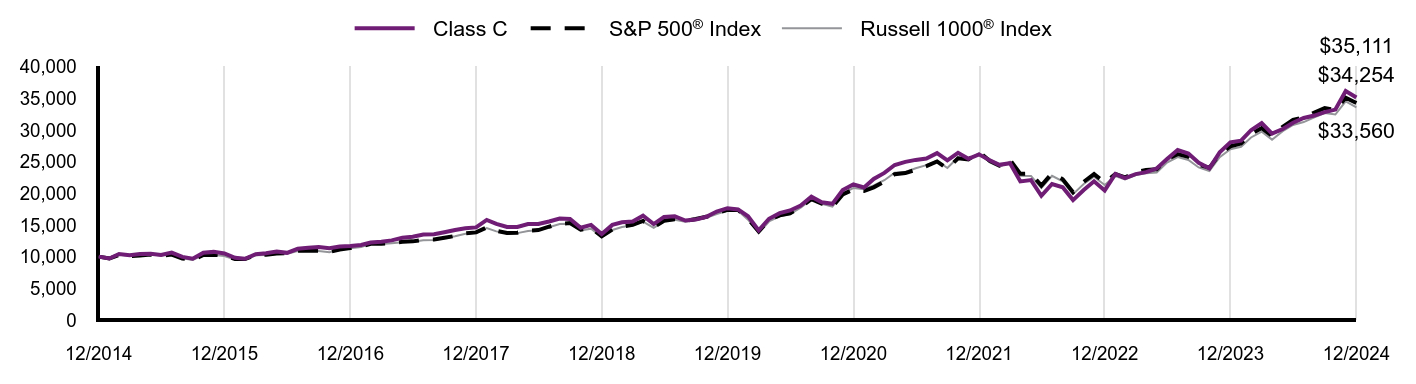
|
Class C |
S&P 500® Index |
Russell 1000® Index |
12/2014 |
$10,000 |
$10,000 |
$10,000 |
01/2015 |
$9,704 |
$9,700 |
$9,725 |
02/2015 |
$10,415 |
$10,257 |
$10,287 |
03/2015 |
$10,212 |
$10,095 |
$10,159 |
04/2015 |
$10,400 |
$10,192 |
$10,231 |
05/2015 |
$10,450 |
$10,323 |
$10,365 |
06/2015 |
$10,249 |
$10,123 |
$10,171 |
07/2015 |
$10,636 |
$10,335 |
$10,367 |
08/2015 |
$9,968 |
$9,712 |
$9,743 |
09/2015 |
$9,672 |
$9,471 |
$9,476 |
10/2015 |
$10,631 |
$10,270 |
$10,243 |
11/2015 |
$10,751 |
$10,301 |
$10,277 |
12/2015 |
$10,506 |
$10,138 |
$10,092 |
01/2016 |
$9,813 |
$9,635 |
$9,549 |
02/2016 |
$9,670 |
$9,622 |
$9,545 |
03/2016 |
$10,395 |
$10,275 |
$10,210 |
04/2016 |
$10,540 |
$10,315 |
$10,266 |
05/2016 |
$10,808 |
$10,500 |
$10,446 |
06/2016 |
$10,599 |
$10,527 |
$10,469 |
07/2016 |
$11,232 |
$10,915 |
$10,868 |
08/2016 |
$11,392 |
$10,931 |
$10,882 |
09/2016 |
$11,537 |
$10,933 |
$10,891 |
10/2016 |
$11,317 |
$10,733 |
$10,679 |
11/2016 |
$11,591 |
$11,131 |
$11,100 |
12/2016 |
$11,664 |
$11,351 |
$11,308 |
01/2017 |
$11,842 |
$11,566 |
$11,536 |
02/2017 |
$12,232 |
$12,025 |
$11,982 |
03/2017 |
$12,340 |
$12,039 |
$11,990 |
04/2017 |
$12,568 |
$12,163 |
$12,116 |
05/2017 |
$12,976 |
$12,334 |
$12,271 |
06/2017 |
$13,145 |
$12,411 |
$12,357 |
07/2017 |
$13,477 |
$12,666 |
$12,601 |
08/2017 |
$13,537 |
$12,705 |
$12,641 |
09/2017 |
$13,858 |
$12,967 |
$12,910 |
10/2017 |
$14,211 |
$13,270 |
$13,206 |
11/2017 |
$14,478 |
$13,677 |
$13,609 |
12/2017 |
$14,620 |
$13,829 |
$13,761 |
01/2018 |
$15,797 |
$14,621 |
$14,516 |
02/2018 |
$15,172 |
$14,082 |
$13,983 |
03/2018 |
$14,689 |
$13,724 |
$13,666 |
04/2018 |
$14,682 |
$13,777 |
$13,712 |
05/2018 |
$15,139 |
$14,108 |
$14,062 |
06/2018 |
$15,151 |
$14,195 |
$14,153 |
07/2018 |
$15,543 |
$14,724 |
$14,642 |
08/2018 |
$16,018 |
$15,203 |
$15,146 |
09/2018 |
$15,936 |
$15,290 |
$15,204 |
10/2018 |
$14,565 |
$14,245 |
$14,128 |
11/2018 |
$15,004 |
$14,535 |
$14,415 |
12/2018 |
$13,571 |
$13,223 |
$13,102 |
01/2019 |
$15,014 |
$14,282 |
$14,200 |
02/2019 |
$15,426 |
$14,741 |
$14,681 |
03/2019 |
$15,532 |
$15,027 |
$14,937 |
04/2019 |
$16,454 |
$15,636 |
$15,540 |
05/2019 |
$15,143 |
$14,642 |
$14,550 |
06/2019 |
$16,267 |
$15,674 |
$15,571 |
07/2019 |
$16,357 |
$15,899 |
$15,813 |
08/2019 |
$15,698 |
$15,648 |
$15,523 |
09/2019 |
$15,844 |
$15,940 |
$15,792 |
10/2019 |
$16,295 |
$16,286 |
$16,127 |
11/2019 |
$17,113 |
$16,877 |
$16,737 |
12/2019 |
$17,651 |
$17,386 |
$17,220 |
01/2020 |
$17,449 |
$17,379 |
$17,238 |
02/2020 |
$16,373 |
$15,949 |
$15,830 |
03/2020 |
$14,137 |
$13,979 |
$13,738 |
04/2020 |
$15,982 |
$15,771 |
$15,553 |
05/2020 |
$16,871 |
$16,522 |
$16,374 |
06/2020 |
$17,287 |
$16,850 |
$16,736 |
07/2020 |
$18,079 |
$17,801 |
$17,716 |
08/2020 |
$19,466 |
$19,080 |
$19,016 |
09/2020 |
$18,576 |
$18,355 |
$18,321 |
10/2020 |
$18,332 |
$17,867 |
$17,879 |
11/2020 |
$20,518 |
$19,823 |
$19,985 |
12/2020 |
$21,384 |
$20,585 |
$20,830 |
01/2021 |
$20,905 |
$20,377 |
$20,658 |
02/2021 |
$22,263 |
$20,939 |
$21,257 |
03/2021 |
$23,211 |
$21,856 |
$22,061 |
04/2021 |
$24,467 |
$23,022 |
$23,249 |
05/2021 |
$24,957 |
$23,183 |
$23,359 |
06/2021 |
$25,270 |
$23,724 |
$23,944 |
07/2021 |
$25,489 |
$24,288 |
$24,442 |
08/2021 |
$26,335 |
$25,026 |
$25,149 |
09/2021 |
$25,187 |
$23,863 |
$23,994 |
10/2021 |
$26,387 |
$25,534 |
$25,659 |
11/2021 |
$25,437 |
$25,357 |
$25,315 |
12/2021 |
$26,145 |
$26,494 |
$26,340 |
01/2022 |
$25,211 |
$25,123 |
$24,855 |
02/2022 |
$24,492 |
$24,371 |
$24,173 |
03/2022 |
$24,743 |
$25,276 |
$24,989 |
04/2022 |
$21,870 |
$23,071 |
$22,761 |
05/2022 |
$22,091 |
$23,114 |
$22,727 |
06/2022 |
$19,599 |
$21,206 |
$20,823 |
07/2022 |
$21,468 |
$23,161 |
$22,763 |
08/2022 |
$20,948 |
$22,217 |
$21,889 |
09/2022 |
$18,924 |
$20,170 |
$19,863 |
10/2022 |
$20,520 |
$21,804 |
$21,456 |
11/2022 |
$21,896 |
$23,022 |
$22,617 |
12/2022 |
$20,453 |
$21,696 |
$21,302 |
01/2023 |
$23,045 |
$23,059 |
$22,730 |
02/2023 |
$22,404 |
$22,496 |
$22,189 |
03/2023 |
$23,031 |
$23,322 |
$22,891 |
04/2023 |
$23,344 |
$23,686 |
$23,175 |
05/2023 |
$23,910 |
$23,789 |
$23,283 |
06/2023 |
$25,394 |
$25,361 |
$24,855 |
07/2023 |
$26,821 |
$26,176 |
$25,710 |
08/2023 |
$26,270 |
$25,759 |
$25,260 |
09/2023 |
$24,821 |
$24,531 |
$24,073 |
10/2023 |
$23,945 |
$24,015 |
$23,491 |
11/2023 |
$26,454 |
$26,208 |
$25,685 |
12/2023 |
$28,037 |
$27,399 |
$26,953 |
01/2024 |
$28,311 |
$27,859 |
$27,329 |
02/2024 |
$29,952 |
$29,347 |
$28,805 |
03/2024 |
$31,090 |
$30,291 |
$29,728 |
04/2024 |
$29,408 |
$29,054 |
$28,463 |
05/2024 |
$30,141 |
$30,494 |
$29,804 |
06/2024 |
$31,126 |
$31,589 |
$30,790 |
07/2024 |
$31,889 |
$31,973 |
$31,238 |
08/2024 |
$32,271 |
$32,749 |
$31,979 |
09/2024 |
$32,805 |
$33,448 |
$32,663 |
10/2024 |
$33,210 |
$33,145 |
$32,434 |
11/2024 |
$36,149 |
$35,090 |
$34,522 |
12/2024 |
$35,111 |
$34,254 |
$33,560 |
|
| Average Annual Return [Table Text Block] |
|
AATR |
1 Year |
5 Years |
10 Years |
Class C at NAV |
24.32% |
14.39% |
13.38% |
Class C with 1.00% CDSCFootnote Reference1 |
23.32% |
14.39% |
13.38% |
S&P 500® Index |
25.02% |
14.53% |
13.10% |
Russell 1000® Index |
24.51% |
14.28% |
12.87% | |
| Previous Investment Adviser [Text Block] |
|
|
| Material Change Description [Text Block] |
|
This report describes changes to the Fund that occurred during the reporting period.
|
| Material Change Date |
Jul. 01, 2024
|
|
| Updated Performance Information Location [Text Block] |
|
visit im.natixis.com/en-us/products/mutual-funds/price-and-performance
|
| AssetsNet |
|
$ 1,128,654,333
|
| Holdings Count | Holding |
|
75
|
| Advisory Fees Paid, Amount |
|
$ 7,057,328
|
| InvestmentCompanyPortfolioTurnover |
|
33.00%
|
| Additional Fund Statistics [Text Block] |
|
Total Net Assets |
$1,128,654,333 |
# of Portfolio Holdings (including overnight repurchase agreements) |
75 |
Portfolio Turnover Rate |
33% |
Total Advisory Fees Paid (after waiver/reimbursement, if applicable) |
$7,057,328 | |
| Holdings [Text Block] |
|
Value |
Value |
Other investments less than 3% of net assetsFootnote Reference* |
35.6% |
Insurance |
3.3% |
Broadline Retail |
3.4% |
Financial Services |
4.7% |
Entertainment |
5.3% |
Oil, Gas & Consumable Fuels |
5.3% |
Semiconductors & Semiconductor Equipment |
6.1% |
Automobiles |
6.2% |
Banks |
6.7% |
Capital Markets |
7.4% |
Software |
7.5% |
Interactive Media & Services |
8.5% |
| Footnote |
Description |
Footnote* |
Net of other assets less liabilities |
Alphabet, Inc., Class A |
4.6% |
NVIDIA Corp. |
4.5% |
Tesla, Inc. |
4.0% |
Meta Platforms, Inc., Class A |
3.6% |
Amazon.com, Inc. |
3.1% |
Netflix, Inc. |
3.0% |
Deere & Co. |
2.3% |
Citigroup, Inc. |
2.3% |
Oracle Corp. |
2.2% |
Charles Schwab Corp. |
2.2% | |
| Material Fund Change [Text Block] |
|
Effective July 1, 2024, the Fund had the following material changes, which were reported in a supplement to the Fund's prospectus. For more information, you may review the Fund's prospectus at im.natixis.com/funddocuments or upon request at (800) 225-5478 or through your financial intermediary. Expenses: The expense limit as a percentage of average daily net assets was reduced to 1.83% from 1.87%. |
| Material Fund Change Expenses [Text Block] |
|
Expenses: The expense limit as a percentage of average daily net assets was reduced to 1.83% from 1.87%.
|
| Summary of Change Legend [Text Block] |
|
Effective July 1, 2024, the Fund had the following material changes, which were reported in a supplement to the Fund's prospectus. For more information, you may review the Fund's prospectus at im.natixis.com/funddocuments or upon request at (800) 225-5478 or through your financial intermediary.
|
| Updated Prospectus Phone Number |
|
(800) 225-5478
|
| Updated Prospectus Web Address |
|
<span style="box-sizing: border-box; color: rgb(0, 0, 0); display: inline; flex-wrap: nowrap; font-size: 10.6667px; font-weight: 400; grid-area: auto; line-height: 16px; margin: 0px; overflow: visible; text-align: left; white-space-collapse: preserve-breaks;">im.natixis.com/funddocuments</span>
|
| C000190732 |
|
|
| Shareholder Report [Line Items] |
|
|
| Fund Name |
|
Natixis U.S. Equity Opportunities Fund
|
| Class Name |
|
Class N
|
| Trading Symbol |
|
NESNX
|
| Annual or Semi-Annual Statement [Text Block] |
|
This annual shareholder report contains important information about Natixis U.S. Equity Opportunities Fund for the period of January 1, 2024 to December 31, 2024.
|
| Shareholder Report Annual or Semi-Annual |
|
Annual Shareholder Report
|
| Additional Information [Text Block] |
|
You can find additional information (including tax information) about the Fund at im.natixis.com/funddocuments. You can also request the information by contacting us at (800) 225-5478 or by contacting your financial intermediary directly.
|
| Additional Information Phone Number |
|
(800) 225-5478
|
| Additional Information Website |
|
<span style="box-sizing: border-box; color: rgb(0, 0, 0); display: inline; flex-wrap: nowrap; font-size: 12px; font-weight: 400; grid-area: auto; line-height: 18px; margin: 0px; overflow: visible; text-align: left; white-space-collapse: preserve-breaks;">im.natixis.com/funddocuments</span>
|
| Expenses [Text Block] |
|
What were the fund costs for the last year? (based on a hypothetical $10,000 investment)
Class Name |
Costs of a $10,000 investment |
Costs paid as a percentage of a $10,000 investmentFootnote Reference† |
Class N |
$86 |
0.76% |
| Footnote |
Description |
Footnote† |
Annualized for periods less than one year (if applicable). | |
| Expenses Paid, Amount |
|
$ 86
|
| Expense Ratio, Percent |
|
0.76%
|
| Factors Affecting Performance [Text Block] |
|
How did the fund perform last year and what affected its performance?Explanation of Fund Performance The Natixis U.S. Equity Opportunities Fund is composed of two separately managed portfolio sleeves, combining the value expertise of Harris Associates, L.P. ("Harris Associates") with the growth expertise of Loomis, Sayles & Company, L.P. ("Loomis Sayles"). Harris Associates Large Cap Value Sleeve On an absolute-return basis, the financials sector contributed the most to the return of the Fund, while health care and energy had the only negative contributions. Top Contributors to Performance Fiserv and Alphabet were top contributors during the 1-year period. Fiserv's stock price rose due to solid second-quarter results, improved free-cash-flow conversion, and significant share repurchases. Alphabet's stock price increased after strong first-quarter results, driven by revenue growth across Search, YouTube, and Cloud. Despite ongoing antitrust litigation, we still see attractive upside. Top Detractors from Performance Centene and APA Corporation were top detractors during the 1-year period. Centene's stock price declined due to investor concerns about legislative changes. APA Corporation's stock price fell due to issues with a liquified natural gas export contract and new U.K. emissions regulations. Loomis Sayles All Cap Growth Sleeve We are an active manager with a long-term, private equity approach to investing. Through our proprietary bottom-up research framework, we look to invest in those few high-quality businesses with sustainable competitive advantages and profitable growth when they trade at a significant discount to intrinsic value. Top Contributors to Performance Nvidia, Meta Platforms, and Tesla contributed the most to performance. Stock selection in the information technology, communication services, consumer discretionary, and healthcare sectors, and allocations in the communication services, consumer discretionary, and industrials sectors, contributed positively to relative performance. Top Detractors from Performance Boeing, Mobileye Global, and Monster Beverage detracted the most from performance. Stock selection in the industrials, consumer staples, and financials sectors, and allocations in the healthcare, information technology, and financials sectors, detracted from relative performance. |
| Performance Past Does Not Indicate Future [Text] |
|
Performance data shown represents past performance and is no guarantee of, and is not necessarily indicative of, future results. Total return and value will vary, and you may have a gain or loss when shares are sold. Current performance may be lower or higher than quoted. For the most recent month-end performance,
|
| Line Graph [Table Text Block] |
|
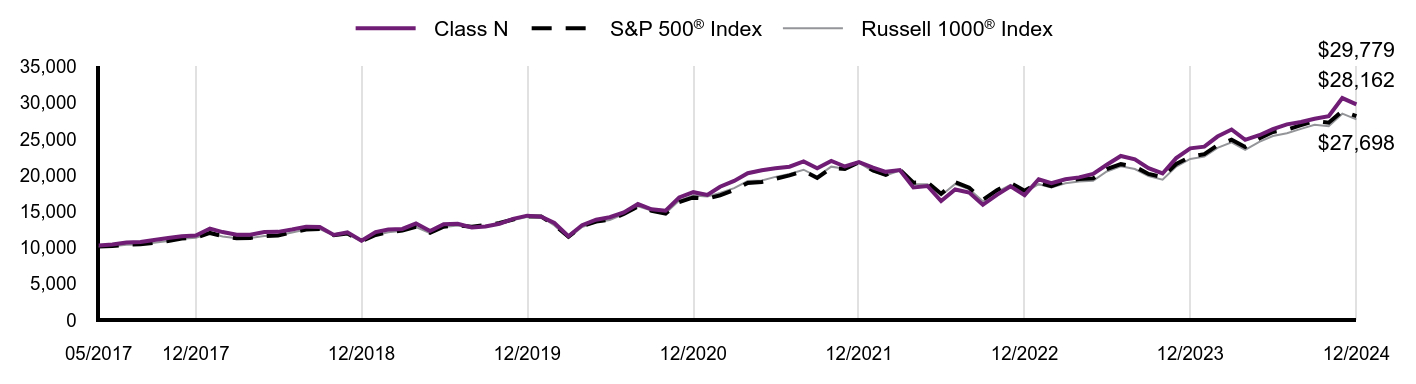
|
Class N |
S&P 500® Index |
Russell 1000® Index |
05/2017 |
$10,298 |
$10,141 |
$10,128 |
06/2017 |
$10,439 |
$10,204 |
$10,198 |
07/2017 |
$10,712 |
$10,414 |
$10,400 |
08/2017 |
$10,774 |
$10,446 |
$10,433 |
09/2017 |
$11,037 |
$10,661 |
$10,655 |
10/2017 |
$11,329 |
$10,910 |
$10,899 |
11/2017 |
$11,552 |
$11,245 |
$11,232 |
12/2017 |
$11,678 |
$11,370 |
$11,357 |
01/2018 |
$12,629 |
$12,021 |
$11,980 |
02/2018 |
$12,144 |
$11,578 |
$11,541 |
03/2018 |
$11,766 |
$11,283 |
$11,279 |
04/2018 |
$11,771 |
$11,327 |
$11,317 |
05/2018 |
$12,150 |
$11,599 |
$11,606 |
06/2018 |
$12,173 |
$11,671 |
$11,681 |
07/2018 |
$12,496 |
$12,105 |
$12,084 |
08/2018 |
$12,890 |
$12,500 |
$12,500 |
09/2018 |
$12,840 |
$12,571 |
$12,548 |
10/2018 |
$11,746 |
$11,711 |
$11,660 |
11/2018 |
$12,109 |
$11,950 |
$11,897 |
12/2018 |
$10,965 |
$10,871 |
$10,814 |
01/2019 |
$12,137 |
$11,742 |
$11,720 |
02/2019 |
$12,484 |
$12,119 |
$12,117 |
03/2019 |
$12,581 |
$12,355 |
$12,328 |
04/2019 |
$13,340 |
$12,855 |
$12,825 |
05/2019 |
$12,290 |
$12,038 |
$12,008 |
06/2019 |
$13,216 |
$12,887 |
$12,851 |
07/2019 |
$13,297 |
$13,072 |
$13,051 |
08/2019 |
$12,772 |
$12,865 |
$12,812 |
09/2019 |
$12,905 |
$13,105 |
$13,034 |
10/2019 |
$13,281 |
$13,389 |
$13,310 |
11/2019 |
$13,963 |
$13,875 |
$13,813 |
12/2019 |
$14,412 |
$14,294 |
$14,212 |
01/2020 |
$14,263 |
$14,288 |
$14,227 |
02/2020 |
$13,391 |
$13,112 |
$13,065 |
03/2020 |
$11,573 |
$11,493 |
$11,338 |
04/2020 |
$13,099 |
$12,966 |
$12,836 |
05/2020 |
$13,844 |
$13,584 |
$13,514 |
06/2020 |
$14,196 |
$13,854 |
$13,813 |
07/2020 |
$14,856 |
$14,635 |
$14,621 |
08/2020 |
$16,009 |
$15,687 |
$15,695 |
09/2020 |
$15,292 |
$15,091 |
$15,121 |
10/2020 |
$15,106 |
$14,689 |
$14,756 |
11/2020 |
$16,923 |
$16,297 |
$16,494 |
12/2020 |
$17,652 |
$16,924 |
$17,191 |
01/2021 |
$17,268 |
$16,753 |
$17,050 |
02/2021 |
$18,404 |
$17,215 |
$17,544 |
03/2021 |
$19,209 |
$17,969 |
$18,208 |
04/2021 |
$20,266 |
$18,928 |
$19,188 |
05/2021 |
$20,688 |
$19,060 |
$19,279 |
06/2021 |
$20,970 |
$19,505 |
$19,762 |
07/2021 |
$21,175 |
$19,969 |
$20,173 |
08/2021 |
$21,893 |
$20,576 |
$20,756 |
09/2021 |
$20,954 |
$19,619 |
$19,803 |
10/2021 |
$21,973 |
$20,993 |
$21,177 |
11/2021 |
$21,201 |
$20,848 |
$20,893 |
12/2021 |
$21,805 |
$21,782 |
$21,739 |
01/2022 |
$21,048 |
$20,655 |
$20,514 |
02/2022 |
$20,460 |
$20,036 |
$19,951 |
03/2022 |
$20,698 |
$20,780 |
$20,624 |
04/2022 |
$18,306 |
$18,968 |
$18,785 |
05/2022 |
$18,506 |
$19,003 |
$18,757 |
06/2022 |
$16,432 |
$17,435 |
$17,186 |
07/2022 |
$18,020 |
$19,042 |
$18,787 |
08/2022 |
$17,600 |
$18,266 |
$18,065 |
09/2022 |
$15,909 |
$16,583 |
$16,394 |
10/2022 |
$17,276 |
$17,926 |
$17,709 |
11/2022 |
$18,448 |
$18,928 |
$18,667 |
12/2022 |
$17,251 |
$17,837 |
$17,581 |
01/2023 |
$19,433 |
$18,958 |
$18,760 |
02/2023 |
$18,893 |
$18,495 |
$18,313 |
03/2023 |
$19,428 |
$19,174 |
$18,893 |
04/2023 |
$19,695 |
$19,474 |
$19,127 |
05/2023 |
$20,181 |
$19,558 |
$19,216 |
06/2023 |
$21,436 |
$20,851 |
$20,514 |
07/2023 |
$22,654 |
$21,521 |
$21,219 |
08/2023 |
$22,191 |
$21,178 |
$20,848 |
09/2023 |
$20,973 |
$20,168 |
$19,868 |
10/2023 |
$20,236 |
$19,744 |
$19,388 |
11/2023 |
$22,361 |
$21,547 |
$21,199 |
12/2023 |
$23,710 |
$22,526 |
$22,245 |
01/2024 |
$23,944 |
$22,905 |
$22,556 |
02/2024 |
$25,336 |
$24,128 |
$23,774 |
03/2024 |
$26,310 |
$24,904 |
$24,536 |
04/2024 |
$24,887 |
$23,887 |
$23,492 |
05/2024 |
$25,515 |
$25,071 |
$24,598 |
06/2024 |
$26,362 |
$25,971 |
$25,412 |
07/2024 |
$27,014 |
$26,287 |
$25,782 |
08/2024 |
$27,345 |
$26,925 |
$26,393 |
09/2024 |
$27,798 |
$27,500 |
$26,957 |
10/2024 |
$28,149 |
$27,250 |
$26,769 |
11/2024 |
$30,651 |
$28,850 |
$28,492 |
12/2024 |
$29,779 |
$28,162 |
$27,698 |
|
| Average Annual Return [Table Text Block] |
|
AATR |
1 Year |
5 Years |
Since Inception 5/1/17 |
Class N |
25.60% |
15.62% |
15.29% |
S&P 500® Index |
25.02% |
14.53% |
14.37% |
Russell 1000® Index |
24.51% |
14.28% |
14.12% | |
| Performance Inception Date |
|
May 01, 2017
|
| Previous Investment Adviser [Text Block] |
|
|
| Material Change Description [Text Block] |
|
This report describes changes to the Fund that occurred during the reporting period.
|
| Material Change Date |
Jul. 01, 2024
|
|
| Updated Performance Information Location [Text Block] |
|
visit im.natixis.com/en-us/products/mutual-funds/price-and-performance
|
| AssetsNet |
|
$ 1,128,654,333
|
| Holdings Count | Holding |
|
75
|
| Advisory Fees Paid, Amount |
|
$ 7,057,328
|
| InvestmentCompanyPortfolioTurnover |
|
33.00%
|
| Additional Fund Statistics [Text Block] |
|
Total Net Assets |
$1,128,654,333 |
# of Portfolio Holdings (including overnight repurchase agreements) |
75 |
Portfolio Turnover Rate |
33% |
Total Advisory Fees Paid (after waiver/reimbursement, if applicable) |
$7,057,328 | |
| Holdings [Text Block] |
|
Value |
Value |
Other investments less than 3% of net assetsFootnote Reference* |
35.6% |
Insurance |
3.3% |
Broadline Retail |
3.4% |
Financial Services |
4.7% |
Entertainment |
5.3% |
Oil, Gas & Consumable Fuels |
5.3% |
Semiconductors & Semiconductor Equipment |
6.1% |
Automobiles |
6.2% |
Banks |
6.7% |
Capital Markets |
7.4% |
Software |
7.5% |
Interactive Media & Services |
8.5% |
| Footnote |
Description |
Footnote* |
Net of other assets less liabilities |
Alphabet, Inc., Class A |
4.6% |
NVIDIA Corp. |
4.5% |
Tesla, Inc. |
4.0% |
Meta Platforms, Inc., Class A |
3.6% |
Amazon.com, Inc. |
3.1% |
Netflix, Inc. |
3.0% |
Deere & Co. |
2.3% |
Citigroup, Inc. |
2.3% |
Oracle Corp. |
2.2% |
Charles Schwab Corp. |
2.2% | |
| Material Fund Change [Text Block] |
|
Effective July 1, 2024, the Fund had the following material changes, which were reported in a supplement to the Fund's prospectus. For more information, you may review the Fund's prospectus at im.natixis.com/funddocuments or upon request at (800) 225-5478 or through your financial intermediary. Expenses: The expense limit as a percentage of average daily net assets was reduced to 0.78% from 0.82%. |
| Material Fund Change Expenses [Text Block] |
|
Expenses: The expense limit as a percentage of average daily net assets was reduced to 0.78% from 0.82%.
|
| Summary of Change Legend [Text Block] |
|
Effective July 1, 2024, the Fund had the following material changes, which were reported in a supplement to the Fund's prospectus. For more information, you may review the Fund's prospectus at im.natixis.com/funddocuments or upon request at (800) 225-5478 or through your financial intermediary.
|
| Updated Prospectus Phone Number |
|
(800) 225-5478
|
| Updated Prospectus Web Address |
|
<span style="box-sizing: border-box; color: rgb(0, 0, 0); display: inline; flex-wrap: nowrap; font-size: 10.6667px; font-weight: 400; grid-area: auto; line-height: 16px; margin: 0px; overflow: visible; text-align: left; white-space-collapse: preserve-breaks;">im.natixis.com/funddocuments</span>
|
| C000018164 |
|
|
| Shareholder Report [Line Items] |
|
|
| Fund Name |
|
Natixis U.S. Equity Opportunities Fund
|
| Class Name |
|
Class Y
|
| Trading Symbol |
|
NESYX
|
| Annual or Semi-Annual Statement [Text Block] |
|
This annual shareholder report contains important information about Natixis U.S. Equity Opportunities Fund for the period of January 1, 2024 to December 31, 2024.
|
| Shareholder Report Annual or Semi-Annual |
|
Annual Shareholder Report
|
| Additional Information [Text Block] |
|
You can find additional information (including tax information) about the Fund at im.natixis.com/funddocuments. You can also request the information by contacting us at (800) 225-5478 or by contacting your financial intermediary directly.
|
| Additional Information Phone Number |
|
(800) 225-5478
|
| Additional Information Website |
|
<span style="box-sizing: border-box; color: rgb(0, 0, 0); display: inline; flex-wrap: nowrap; font-size: 12px; font-weight: 400; grid-area: auto; line-height: 18px; margin: 0px; overflow: visible; text-align: left; white-space-collapse: preserve-breaks;">im.natixis.com/funddocuments</span>
|
| Expenses [Text Block] |
|
What were the fund costs for the last year? (based on a hypothetical $10,000 investment)
Class Name |
Costs of a $10,000 investment |
Costs paid as a percentage of a $10,000 investmentFootnote Reference† |
Class Y |
$92 |
0.82% |
| Footnote |
Description |
Footnote† |
Annualized for periods less than one year (if applicable). | |
| Expenses Paid, Amount |
|
$ 92
|
| Expense Ratio, Percent |
|
0.82%
|
| Factors Affecting Performance [Text Block] |
|
How did the fund perform last year and what affected its performance?Explanation of Fund Performance The Natixis U.S. Equity Opportunities Fund is composed of two separately managed portfolio sleeves, combining the value expertise of Harris Associates, L.P. ("Harris Associates") with the growth expertise of Loomis, Sayles & Company, L.P. ("Loomis Sayles"). Harris Associates Large Cap Value Sleeve On an absolute-return basis, the financials sector contributed the most to the return of the Fund, while health care and energy had the only negative contributions. Top Contributors to Performance Fiserv and Alphabet were top contributors during the 1-year period. Fiserv's stock price rose due to solid second-quarter results, improved free-cash-flow conversion, and significant share repurchases. Alphabet's stock price increased after strong first-quarter results, driven by revenue growth across Search, YouTube, and Cloud. Despite ongoing antitrust litigation, we still see attractive upside. Top Detractors from Performance Centene and APA Corporation were top detractors during the 1-year period. Centene's stock price declined due to investor concerns about legislative changes. APA Corporation's stock price fell due to issues with a liquified natural gas export contract and new U.K. emissions regulations. Loomis Sayles All Cap Growth Sleeve We are an active manager with a long-term, private equity approach to investing. Through our proprietary bottom-up research framework, we look to invest in those few high-quality businesses with sustainable competitive advantages and profitable growth when they trade at a significant discount to intrinsic value. Top Contributors to Performance Nvidia, Meta Platforms, and Tesla contributed the most to performance. Stock selection in the information technology, communication services, consumer discretionary, and healthcare sectors, and allocations in the communication services, consumer discretionary, and industrials sectors, contributed positively to relative performance. Top Detractors from Performance Boeing, Mobileye Global, and Monster Beverage detracted the most from performance. Stock selection in the industrials, consumer staples, and financials sectors, and allocations in the healthcare, information technology, and financials sectors, detracted from relative performance. |
| Performance Past Does Not Indicate Future [Text] |
|
Performance data shown represents past performance and is no guarantee of, and is not necessarily indicative of, future results. Total return and value will vary, and you may have a gain or loss when shares are sold. Current performance may be lower or higher than quoted. For the most recent month-end performance,
|
| Line Graph [Table Text Block] |
|
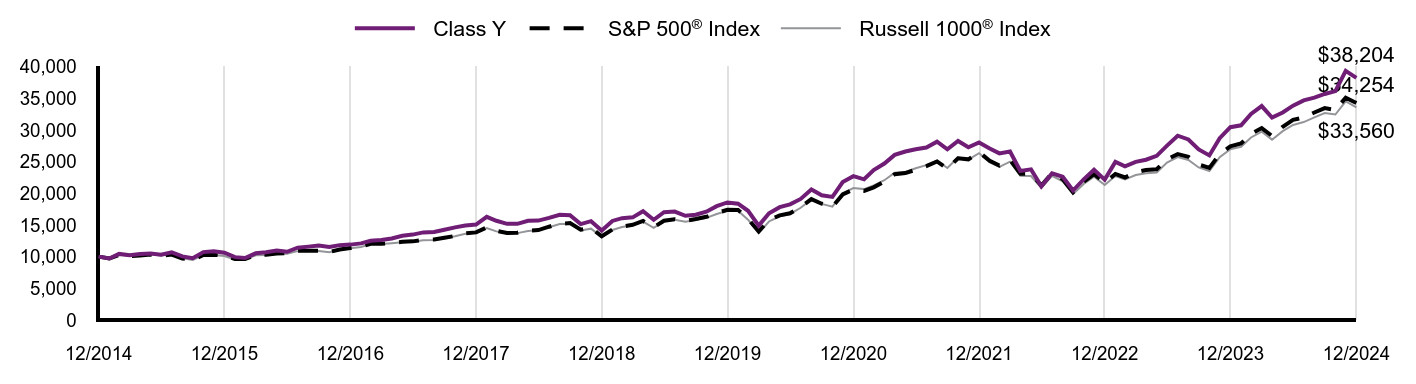
|
Class Y |
S&P 500® Index |
Russell 1000® Index |
12/2014 |
$10,000 |
$10,000 |
$10,000 |
01/2015 |
$9,711 |
$9,700 |
$9,725 |
02/2015 |
$10,430 |
$10,257 |
$10,287 |
03/2015 |
$10,237 |
$10,095 |
$10,159 |
04/2015 |
$10,433 |
$10,192 |
$10,231 |
05/2015 |
$10,494 |
$10,323 |
$10,365 |
06/2015 |
$10,300 |
$10,123 |
$10,171 |
07/2015 |
$10,695 |
$10,335 |
$10,367 |
08/2015 |
$10,034 |
$9,712 |
$9,743 |
09/2015 |
$9,746 |
$9,471 |
$9,476 |
10/2015 |
$10,718 |
$10,270 |
$10,243 |
11/2015 |
$10,848 |
$10,301 |
$10,277 |
12/2015 |
$10,611 |
$10,138 |
$10,092 |
01/2016 |
$9,922 |
$9,635 |
$9,549 |
02/2016 |
$9,781 |
$9,622 |
$9,545 |
03/2016 |
$10,527 |
$10,275 |
$10,210 |
04/2016 |
$10,679 |
$10,315 |
$10,266 |
05/2016 |
$10,963 |
$10,500 |
$10,446 |
06/2016 |
$10,760 |
$10,527 |
$10,469 |
07/2016 |
$11,410 |
$10,915 |
$10,868 |
08/2016 |
$11,580 |
$10,931 |
$10,882 |
09/2016 |
$11,739 |
$10,933 |
$10,891 |
10/2016 |
$11,525 |
$10,733 |
$10,679 |
11/2016 |
$11,813 |
$11,131 |
$11,100 |
12/2016 |
$11,897 |
$11,351 |
$11,308 |
01/2017 |
$12,092 |
$11,566 |
$11,536 |
02/2017 |
$12,496 |
$12,025 |
$11,982 |
03/2017 |
$12,623 |
$12,039 |
$11,990 |
04/2017 |
$12,862 |
$12,163 |
$12,116 |
05/2017 |
$13,291 |
$12,334 |
$12,271 |
06/2017 |
$13,477 |
$12,411 |
$12,357 |
07/2017 |
$13,827 |
$12,666 |
$12,601 |
08/2017 |
$13,902 |
$12,705 |
$12,641 |
09/2017 |
$14,242 |
$12,967 |
$12,910 |
10/2017 |
$14,616 |
$13,270 |
$13,206 |
11/2017 |
$14,901 |
$13,677 |
$13,609 |
12/2017 |
$15,063 |
$13,829 |
$13,761 |
01/2018 |
$16,290 |
$14,621 |
$14,516 |
02/2018 |
$15,660 |
$14,082 |
$13,983 |
03/2018 |
$15,172 |
$13,724 |
$13,666 |
04/2018 |
$15,175 |
$13,777 |
$13,712 |
05/2018 |
$15,662 |
$14,108 |
$14,062 |
06/2018 |
$15,687 |
$14,195 |
$14,153 |
07/2018 |
$16,108 |
$14,724 |
$14,642 |
08/2018 |
$16,612 |
$15,203 |
$15,146 |
09/2018 |
$16,544 |
$15,290 |
$15,204 |
10/2018 |
$15,132 |
$14,245 |
$14,128 |
11/2018 |
$15,600 |
$14,535 |
$14,415 |
12/2018 |
$14,122 |
$13,223 |
$13,102 |
01/2019 |
$15,635 |
$14,282 |
$14,200 |
02/2019 |
$16,078 |
$14,741 |
$14,681 |
03/2019 |
$16,202 |
$15,027 |
$14,937 |
04/2019 |
$17,177 |
$15,636 |
$15,540 |
05/2019 |
$15,824 |
$14,642 |
$14,550 |
06/2019 |
$17,014 |
$15,674 |
$15,571 |
07/2019 |
$17,121 |
$15,899 |
$15,813 |
08/2019 |
$16,445 |
$15,648 |
$15,523 |
09/2019 |
$16,612 |
$15,940 |
$15,792 |
10/2019 |
$17,097 |
$16,286 |
$16,127 |
11/2019 |
$17,973 |
$16,877 |
$16,737 |
12/2019 |
$18,551 |
$17,386 |
$17,220 |
01/2020 |
$18,356 |
$17,379 |
$17,238 |
02/2020 |
$17,235 |
$15,949 |
$15,830 |
03/2020 |
$14,893 |
$13,979 |
$13,738 |
04/2020 |
$16,852 |
$15,771 |
$15,553 |
05/2020 |
$17,811 |
$16,522 |
$16,374 |
06/2020 |
$18,260 |
$16,850 |
$16,736 |
07/2020 |
$19,110 |
$17,801 |
$17,716 |
08/2020 |
$20,593 |
$19,080 |
$19,016 |
09/2020 |
$19,673 |
$18,355 |
$18,321 |
10/2020 |
$19,433 |
$17,867 |
$17,879 |
11/2020 |
$21,765 |
$19,823 |
$19,985 |
12/2020 |
$22,699 |
$20,585 |
$20,830 |
01/2021 |
$22,205 |
$20,377 |
$20,658 |
02/2021 |
$23,669 |
$20,939 |
$21,257 |
03/2021 |
$24,701 |
$21,856 |
$22,061 |
04/2021 |
$26,059 |
$23,022 |
$23,249 |
05/2021 |
$26,598 |
$23,183 |
$23,359 |
06/2021 |
$26,961 |
$23,724 |
$23,944 |
07/2021 |
$27,220 |
$24,288 |
$24,442 |
08/2021 |
$28,146 |
$25,026 |
$25,149 |
09/2021 |
$26,936 |
$23,863 |
$23,994 |
10/2021 |
$28,249 |
$25,534 |
$25,659 |
11/2021 |
$27,255 |
$25,357 |
$25,315 |
12/2021 |
$28,028 |
$26,494 |
$26,340 |
01/2022 |
$27,052 |
$25,123 |
$24,855 |
02/2022 |
$26,299 |
$24,371 |
$24,173 |
03/2022 |
$26,600 |
$25,276 |
$24,989 |
04/2022 |
$23,523 |
$23,071 |
$22,761 |
05/2022 |
$23,780 |
$23,114 |
$22,727 |
06/2022 |
$21,112 |
$21,206 |
$20,823 |
07/2022 |
$23,148 |
$23,161 |
$22,763 |
08/2022 |
$22,612 |
$22,217 |
$21,889 |
09/2022 |
$20,437 |
$20,170 |
$19,863 |
10/2022 |
$22,195 |
$21,804 |
$21,456 |
11/2022 |
$23,700 |
$23,022 |
$22,617 |
12/2022 |
$22,156 |
$21,696 |
$21,302 |
01/2023 |
$24,961 |
$23,059 |
$22,730 |
02/2023 |
$24,265 |
$22,496 |
$22,189 |
03/2023 |
$24,955 |
$23,322 |
$22,891 |
04/2023 |
$25,293 |
$23,686 |
$23,175 |
05/2023 |
$25,912 |
$23,789 |
$23,283 |
06/2023 |
$27,523 |
$25,361 |
$24,855 |
07/2023 |
$29,087 |
$26,176 |
$25,710 |
08/2023 |
$28,491 |
$25,759 |
$25,260 |
09/2023 |
$26,927 |
$24,531 |
$24,073 |
10/2023 |
$25,977 |
$24,015 |
$23,491 |
11/2023 |
$28,704 |
$26,208 |
$25,685 |
12/2023 |
$30,432 |
$27,399 |
$26,953 |
01/2024 |
$30,733 |
$27,859 |
$27,329 |
02/2024 |
$32,520 |
$29,347 |
$28,805 |
03/2024 |
$33,767 |
$30,291 |
$29,728 |
04/2024 |
$31,941 |
$29,054 |
$28,463 |
05/2024 |
$32,750 |
$30,494 |
$29,804 |
06/2024 |
$33,828 |
$31,589 |
$30,790 |
07/2024 |
$34,662 |
$31,973 |
$31,238 |
08/2024 |
$35,089 |
$32,749 |
$31,979 |
09/2024 |
$35,672 |
$33,448 |
$32,663 |
10/2024 |
$36,117 |
$33,145 |
$32,434 |
11/2024 |
$39,321 |
$35,090 |
$34,522 |
12/2024 |
$38,204 |
$34,254 |
$33,560 |
|
| Average Annual Return [Table Text Block] |
|
AATR |
1 Year |
5 Years |
10 Years |
Since Inception 1/1/00 |
Class Y |
25.54% |
15.54% |
14.34% |
-% |
S&P 500® Index |
25.02% |
14.53% |
13.10% |
23.30% |
Russell 1000® Index |
24.51% |
14.28% |
12.87% |
14.12% | |
| Performance Inception Date |
|
Jan. 01, 2000
|
| Previous Investment Adviser [Text Block] |
|
|
| Material Change Description [Text Block] |
|
This report describes changes to the Fund that occurred during the reporting period.
|
| Material Change Date |
Jul. 01, 2024
|
|
| Updated Performance Information Location [Text Block] |
|
visit im.natixis.com/en-us/products/mutual-funds/price-and-performance
|
| AssetsNet |
|
$ 1,128,654,333
|
| Holdings Count | Holding |
|
75
|
| Advisory Fees Paid, Amount |
|
$ 7,057,328
|
| InvestmentCompanyPortfolioTurnover |
|
33.00%
|
| Additional Fund Statistics [Text Block] |
|
Total Net Assets |
$1,128,654,333 |
# of Portfolio Holdings (including overnight repurchase agreements) |
75 |
Portfolio Turnover Rate |
33% |
Total Advisory Fees Paid (after waiver/reimbursement, if applicable) |
$7,057,328 | |
| Holdings [Text Block] |
|
Value |
Value |
Other investments less than 3% of net assetsFootnote Reference* |
35.6% |
Insurance |
3.3% |
Broadline Retail |
3.4% |
Financial Services |
4.7% |
Entertainment |
5.3% |
Oil, Gas & Consumable Fuels |
5.3% |
Semiconductors & Semiconductor Equipment |
6.1% |
Automobiles |
6.2% |
Banks |
6.7% |
Capital Markets |
7.4% |
Software |
7.5% |
Interactive Media & Services |
8.5% |
| Footnote |
Description |
Footnote* |
Net of other assets less liabilities |
Alphabet, Inc., Class A |
4.6% |
NVIDIA Corp. |
4.5% |
Tesla, Inc. |
4.0% |
Meta Platforms, Inc., Class A |
3.6% |
Amazon.com, Inc. |
3.1% |
Netflix, Inc. |
3.0% |
Deere & Co. |
2.3% |
Citigroup, Inc. |
2.3% |
Oracle Corp. |
2.2% |
Charles Schwab Corp. |
2.2% | |
| Material Fund Change [Text Block] |
|
Effective July 1, 2024, the Fund had the following material changes, which were reported in a supplement to the Fund's prospectus. For more information, you may review the Fund's prospectus at im.natixis.com/funddocuments or upon request at (800) 225-5478 or through your financial intermediary. Expenses: The expense limit as a percentage of average daily net assets was reduced to 0.83% from 0.87%. |
| Material Fund Change Expenses [Text Block] |
|
Expenses: The expense limit as a percentage of average daily net assets was reduced to 0.83% from 0.87%.
|
| Summary of Change Legend [Text Block] |
|
Effective July 1, 2024, the Fund had the following material changes, which were reported in a supplement to the Fund's prospectus. For more information, you may review the Fund's prospectus at im.natixis.com/funddocuments or upon request at (800) 225-5478 or through your financial intermediary.
|
| Updated Prospectus Phone Number |
|
(800) 225-5478
|
| Updated Prospectus Web Address |
|
<span style="box-sizing: border-box; color: rgb(0, 0, 0); display: inline; flex-wrap: nowrap; font-size: 10.6667px; font-weight: 400; grid-area: auto; line-height: 16px; margin: 0px; overflow: visible; text-align: left; white-space-collapse: preserve-breaks;">im.natixis.com/funddocuments</span>
|
| C000018172 |
|
|
| Shareholder Report [Line Items] |
|
|
| Fund Name |
|
Vaughan Nelson Small Cap Value Fund
|
| Class Name |
|
Class A
|
| Trading Symbol |
|
NEFJX
|
| Annual or Semi-Annual Statement [Text Block] |
|
This annual shareholder report contains important information about Vaughan Nelson Small Cap Value Fund for the period of January 1, 2024 to December 31, 2024.
|
| Shareholder Report Annual or Semi-Annual |
|
Annual Shareholder Report
|
| Additional Information [Text Block] |
|
You can find additional information (including tax information) about the Fund at im.natixis.com/funddocuments. You can also request the information by contacting us at (800) 225-5478 or by contacting your financial intermediary directly.
|
| Additional Information Phone Number |
|
(800) 225-5478
|
| Additional Information Website |
|
<span style="box-sizing: border-box; color: rgb(0, 0, 0); display: inline; flex-wrap: nowrap; font-size: 12px; font-weight: 400; grid-area: auto; line-height: 18px; margin: 0px; overflow: visible; text-align: left; white-space-collapse: preserve-breaks;">im.natixis.com/funddocuments</span>
|
| Expenses [Text Block] |
|
What were the fund costs for the last year? (based on a hypothetical $10,000 investment)
Class Name |
Costs of a $10,000 investment |
Costs paid as a percentage of a $10,000 investmentFootnote Reference† |
Class A |
$128 |
1.25% |
| Footnote |
Description |
Footnote† |
Annualized for periods less than one year (if applicable). | |
| Expenses Paid, Amount |
|
$ 128
|
| Expense Ratio, Percent |
|
1.25%
|
| Factors Affecting Performance [Text Block] |
|
How did the fund perform last year and what affected its performance?Top Contributors to Performance •The largest contributor to the fund’s 2024 performance was the portfolio's overweight position and selection in Information Technology led by Celestica Inc. •Selection and an underweight position within Energy also contributed to performance with Antero Resources Corporation leading. •Selection within Consumer Staples positively impacted performance thanks to strong returns from Coca-Cola Consolidated, Inc. Top Detractors from Performance •The largest detractor from the fund’s 2024 performance was the portfolio’s overweight position and security selection within Materials with Chemours Co. as the weakest name. •Security selection within Health Care negatively impacted performance. AMN Healthcare Services, Inc. hindered the sector the most. •The portfolio’s underweight position and selection within Financials detracted from performance with Selective Insurance Group, Inc. being the weakest name. Investment Activity As a result of buys and sells and market action, the portfolio is overweight Industrials, Information Technology, Materials, and Consumer Staples while underweight Real Estate, Utilities, Communication Services, Health Care, Financials, Energy, and Consumer Discretionary. We continued to sell positions that we believe to be fully valued or that could face increased earnings pressure as we move into the late stages of this economic recovery and added to existing positions or established new positions that met our investment criteria. We continue to position the portfolio into companies that have lower earnings variability, higher profitability, and stronger balance sheets than the broader investment universe, and where we can get these characteristics at similar valuation levels to the benchmark index. We still do not favor any single industry or sector and continue to look for the characteristics noted above across all industries. |
| Performance Past Does Not Indicate Future [Text] |
|
Performance data shown represents past performance and is no guarantee of, and is not necessarily indicative of, future results. Total return and value will vary, and you may have a gain or loss when shares are sold. Current performance may be lower or higher than quoted. For the most recent month-end performance,
|
| Line Graph [Table Text Block] |
|
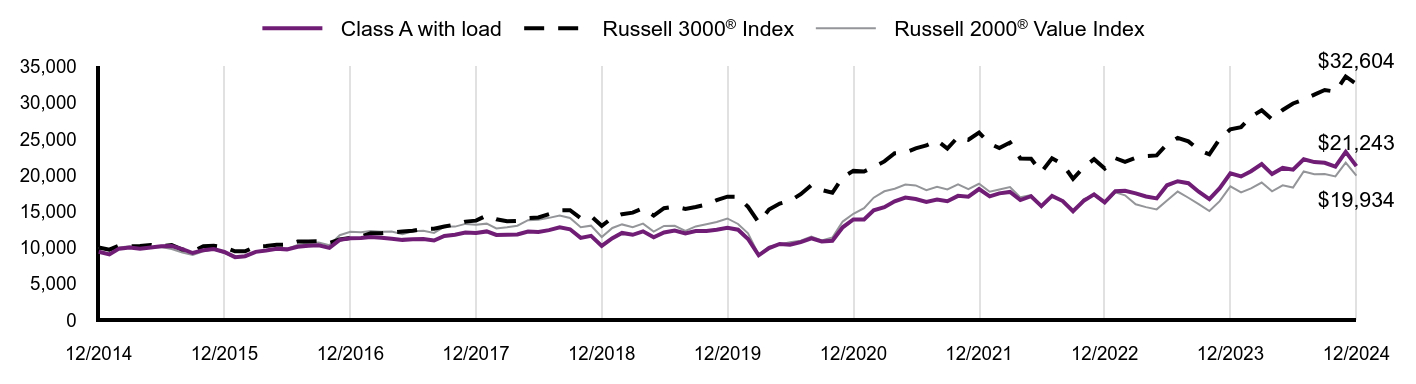
|
Class A with load |
Russell 3000® Index |
Russell 2000® Value Index |
12/2014 |
$9,425 |
$10,000 |
$10,000 |
01/2015 |
$9,055 |
$9,722 |
$9,584 |
02/2015 |
$9,854 |
$10,285 |
$10,029 |
03/2015 |
$10,005 |
$10,180 |
$10,198 |
04/2015 |
$9,828 |
$10,226 |
$9,980 |
05/2015 |
$10,027 |
$10,368 |
$10,063 |
06/2015 |
$10,194 |
$10,194 |
$10,076 |
07/2015 |
$10,212 |
$10,365 |
$9,798 |
08/2015 |
$9,791 |
$9,739 |
$9,317 |
09/2015 |
$9,250 |
$9,455 |
$8,994 |
10/2015 |
$9,648 |
$10,202 |
$9,498 |
11/2015 |
$9,800 |
$10,258 |
$9,768 |
12/2015 |
$9,398 |
$10,048 |
$9,253 |
01/2016 |
$8,683 |
$9,481 |
$8,632 |
02/2016 |
$8,810 |
$9,478 |
$8,690 |
03/2016 |
$9,414 |
$10,145 |
$9,411 |
04/2016 |
$9,599 |
$10,208 |
$9,610 |
05/2016 |
$9,852 |
$10,391 |
$9,786 |
06/2016 |
$9,755 |
$10,412 |
$9,816 |
07/2016 |
$10,112 |
$10,825 |
$10,346 |
08/2016 |
$10,258 |
$10,853 |
$10,603 |
09/2016 |
$10,322 |
$10,870 |
$10,686 |
10/2016 |
$9,966 |
$10,635 |
$10,335 |
11/2016 |
$11,073 |
$11,111 |
$11,707 |
12/2016 |
$11,300 |
$11,327 |
$12,190 |
01/2017 |
$11,317 |
$11,541 |
$12,103 |
02/2017 |
$11,471 |
$11,970 |
$12,278 |
03/2017 |
$11,352 |
$11,978 |
$12,174 |
04/2017 |
$11,220 |
$12,105 |
$12,222 |
05/2017 |
$11,066 |
$12,229 |
$11,842 |
06/2017 |
$11,143 |
$12,339 |
$12,256 |
07/2017 |
$11,173 |
$12,572 |
$12,333 |
08/2017 |
$10,983 |
$12,596 |
$12,030 |
09/2017 |
$11,611 |
$12,903 |
$12,882 |
10/2017 |
$11,783 |
$13,185 |
$12,899 |
11/2017 |
$12,079 |
$13,585 |
$13,272 |
12/2017 |
$12,010 |
$13,721 |
$13,146 |
01/2018 |
$12,234 |
$14,444 |
$13,308 |
02/2018 |
$11,740 |
$13,912 |
$12,642 |
03/2018 |
$11,759 |
$13,633 |
$12,799 |
04/2018 |
$11,804 |
$13,684 |
$13,020 |
05/2018 |
$12,227 |
$14,071 |
$13,778 |
06/2018 |
$12,161 |
$14,163 |
$13,861 |
07/2018 |
$12,406 |
$14,633 |
$14,106 |
08/2018 |
$12,809 |
$15,147 |
$14,442 |
09/2018 |
$12,525 |
$15,172 |
$14,084 |
10/2018 |
$11,341 |
$14,055 |
$12,823 |
11/2018 |
$11,625 |
$14,336 |
$13,029 |
12/2018 |
$10,227 |
$13,002 |
$11,455 |
01/2019 |
$11,301 |
$14,118 |
$12,707 |
02/2019 |
$12,022 |
$14,614 |
$13,201 |
03/2019 |
$11,768 |
$14,828 |
$12,821 |
04/2019 |
$12,245 |
$15,420 |
$13,306 |
05/2019 |
$11,433 |
$14,422 |
$12,219 |
06/2019 |
$12,097 |
$15,435 |
$12,997 |
07/2019 |
$12,351 |
$15,664 |
$13,018 |
08/2019 |
$11,966 |
$15,345 |
$12,291 |
09/2019 |
$12,294 |
$15,614 |
$12,923 |
10/2019 |
$12,302 |
$15,950 |
$13,236 |
11/2019 |
$12,474 |
$16,557 |
$13,545 |
12/2019 |
$12,749 |
$17,035 |
$14,020 |
01/2020 |
$12,469 |
$17,016 |
$13,263 |
02/2020 |
$11,190 |
$15,623 |
$11,975 |
03/2020 |
$8,937 |
$13,475 |
$9,020 |
04/2020 |
$9,924 |
$15,259 |
$10,133 |
05/2020 |
$10,498 |
$16,075 |
$10,424 |
06/2020 |
$10,390 |
$16,443 |
$10,726 |
07/2020 |
$10,756 |
$17,376 |
$10,947 |
08/2020 |
$11,272 |
$18,635 |
$11,536 |
09/2020 |
$10,856 |
$17,957 |
$11,000 |
10/2020 |
$10,939 |
$17,569 |
$11,393 |
11/2020 |
$12,802 |
$19,707 |
$13,593 |
12/2020 |
$13,885 |
$20,593 |
$14,669 |
01/2021 |
$13,877 |
$20,501 |
$15,441 |
02/2021 |
$15,158 |
$21,142 |
$16,892 |
03/2021 |
$15,574 |
$21,900 |
$17,775 |
04/2021 |
$16,389 |
$23,029 |
$18,134 |
05/2021 |
$16,913 |
$23,134 |
$18,698 |
06/2021 |
$16,714 |
$23,705 |
$18,585 |
07/2021 |
$16,298 |
$24,105 |
$17,920 |
08/2021 |
$16,630 |
$24,793 |
$18,400 |
09/2021 |
$16,406 |
$23,681 |
$18,031 |
10/2021 |
$17,146 |
$25,282 |
$18,719 |
11/2021 |
$17,030 |
$24,897 |
$18,079 |
12/2021 |
$18,084 |
$25,877 |
$18,816 |
01/2022 |
$17,082 |
$24,355 |
$17,719 |
02/2022 |
$17,487 |
$23,741 |
$18,013 |
03/2022 |
$17,689 |
$24,512 |
$18,365 |
04/2022 |
$16,570 |
$22,312 |
$16,940 |
05/2022 |
$17,098 |
$22,282 |
$17,265 |
06/2022 |
$15,733 |
$20,418 |
$15,559 |
07/2022 |
$17,139 |
$22,333 |
$17,066 |
08/2022 |
$16,426 |
$21,500 |
$16,526 |
09/2022 |
$15,040 |
$19,506 |
$14,842 |
10/2022 |
$16,467 |
$21,106 |
$16,711 |
11/2022 |
$17,356 |
$22,208 |
$17,221 |
12/2022 |
$16,240 |
$20,907 |
$16,091 |
01/2023 |
$17,793 |
$22,347 |
$17,627 |
02/2023 |
$17,836 |
$21,825 |
$17,220 |
03/2023 |
$17,482 |
$22,408 |
$15,986 |
04/2023 |
$17,054 |
$22,647 |
$15,587 |
05/2023 |
$16,797 |
$22,735 |
$15,280 |
06/2023 |
$18,606 |
$24,288 |
$16,494 |
07/2023 |
$19,163 |
$25,158 |
$17,739 |
08/2023 |
$18,895 |
$24,673 |
$16,885 |
09/2023 |
$17,718 |
$23,497 |
$16,006 |
10/2023 |
$16,701 |
$22,875 |
$15,051 |
11/2023 |
$18,210 |
$25,008 |
$16,406 |
12/2023 |
$20,271 |
$26,334 |
$18,448 |
01/2024 |
$19,830 |
$26,626 |
$17,610 |
02/2024 |
$20,550 |
$28,067 |
$18,186 |
03/2024 |
$21,527 |
$28,973 |
$18,983 |
04/2024 |
$20,153 |
$27,698 |
$17,774 |
05/2024 |
$21,001 |
$29,006 |
$18,605 |
06/2024 |
$20,754 |
$29,904 |
$18,291 |
07/2024 |
$22,193 |
$30,460 |
$20,520 |
08/2024 |
$21,806 |
$31,123 |
$20,135 |
09/2024 |
$21,709 |
$31,767 |
$20,148 |
10/2024 |
$21,173 |
$31,534 |
$19,833 |
11/2024 |
$23,223 |
$33,632 |
$21,746 |
12/2024 |
$21,243 |
$32,604 |
$19,934 |
|
| Average Annual Return [Table Text Block] |
|
AATR |
1 Year |
5 Years |
10 Years |
Class A at NAV |
4.80% |
10.75% |
8.47% |
Class A with 5.75% MSCFootnote Reference1 |
(1.22%) |
9.45% |
7.83% |
Russell 3000® Index |
23.81% |
13.86% |
12.55% |
Russell 2000® Value Index |
8.05% |
7.29% |
7.14% | |
| Previous Investment Adviser [Text Block] |
|
|
| Updated Performance Information Location [Text Block] |
|
visit im.natixis.com/en-us/products/mutual-funds/price-and-performance
|
| AssetsNet |
|
$ 1,220,283,826
|
| Holdings Count | Holding |
|
61
|
| Advisory Fees Paid, Amount |
|
$ 8,955,710
|
| InvestmentCompanyPortfolioTurnover |
|
80.00%
|
| Additional Fund Statistics [Text Block] |
|
Total Net Assets |
$1,220,283,826 |
# of Portfolio Holdings (including overnight repurchase agreements) |
61 |
Portfolio Turnover Rate |
80% |
Total Advisory Fees Paid (after waiver/reimbursement, if applicable) |
$8,955,710 | |
| Holdings [Text Block] |
|
Value |
Value |
Other investments less than 3% of net assetsFootnote Reference* |
34.8% |
Short-Term Investments |
5.7% |
Textiles, Apparel & Luxury Goods |
3.0% |
Mortgage Real Estate Investment Trusts (REITs) |
3.1% |
Specialty Retail |
3.1% |
Health Care Providers & Services |
3.2% |
Chemicals |
4.2% |
Insurance |
4.5% |
Machinery |
4.9% |
Electronic Equipment, Instruments & Components |
4.9% |
Oil, Gas & Consumable Fuels |
5.9% |
Trading Companies & Distributors |
6.3% |
Banks |
16.4% |
| Footnote |
Description |
Footnote* |
Net of other assets less liabilities |
Element Solutions, Inc. |
3.4% |
Comerica, Inc. |
3.0% |
Western Alliance Bancorp |
3.0% |
Zions Bancorp NA |
2.7% |
Beacon Roofing Supply, Inc. |
2.7% |
First American Financial Corp. |
2.5% |
Cushman & Wakefield PLC |
2.5% |
Celestica, Inc. |
2.4% |
Cullen/Frost Bankers, Inc. |
2.2% |
Cadence Bank |
2.1% | |
| Material Fund Change [Text Block] |
|
There were no material fund changes during the period. |
| C000018174 |
|
|
| Shareholder Report [Line Items] |
|
|
| Fund Name |
|
Vaughan Nelson Small Cap Value Fund
|
| Class Name |
|
Class C
|
| Trading Symbol |
|
NEJCX
|
| Annual or Semi-Annual Statement [Text Block] |
|
This annual shareholder report contains important information about Vaughan Nelson Small Cap Value Fund for the period of January 1, 2024 to December 31, 2024.
|
| Shareholder Report Annual or Semi-Annual |
|
Annual Shareholder Report
|
| Additional Information [Text Block] |
|
You can find additional information (including tax information) about the Fund at im.natixis.com/funddocuments. You can also request the information by contacting us at (800) 225-5478 or by contacting your financial intermediary directly.
|
| Additional Information Phone Number |
|
(800) 225-5478
|
| Additional Information Website |
|
<span style="box-sizing: border-box; color: rgb(0, 0, 0); display: inline; flex-wrap: nowrap; font-size: 12px; font-weight: 400; grid-area: auto; line-height: 18px; margin: 0px; overflow: visible; text-align: left; white-space-collapse: preserve-breaks;">im.natixis.com/funddocuments</span>
|
| Expenses [Text Block] |
|
What were the fund costs for the last year? (based on a hypothetical $10,000 investment)
Class Name |
Costs of a $10,000 investment |
Costs paid as a percentage of a $10,000 investmentFootnote Reference† |
Class C |
$204 |
2.00% |
| Footnote |
Description |
Footnote† |
Annualized for periods less than one year (if applicable). | |
| Expenses Paid, Amount |
|
$ 204
|
| Expense Ratio, Percent |
|
2.00%
|
| Factors Affecting Performance [Text Block] |
|
How did the fund perform last year and what affected its performance?Top Contributors to Performance •The largest contributor to the fund’s 2024 performance was the portfolio's overweight position and selection in Information Technology led by Celestica Inc. •Selection and an underweight position within Energy also contributed to performance with Antero Resources Corporation leading. •Selection within Consumer Staples positively impacted performance thanks to strong returns from Coca-Cola Consolidated, Inc. Top Detractors from Performance •The largest detractor from the fund’s 2024 performance was the portfolio’s overweight position and security selection within Materials with Chemours Co. as the weakest name. •Security selection within Health Care negatively impacted performance. AMN Healthcare Services, Inc. hindered the sector the most. •The portfolio’s underweight position and selection within Financials detracted from performance with Selective Insurance Group, Inc. being the weakest name. Investment Activity As a result of buys and sells and market action, the portfolio is overweight Industrials, Information Technology, Materials, and Consumer Staples while underweight Real Estate, Utilities, Communication Services, Health Care, Financials, Energy, and Consumer Discretionary. We continued to sell positions that we believe to be fully valued or that could face increased earnings pressure as we move into the late stages of this economic recovery and added to existing positions or established new positions that met our investment criteria. We continue to position the portfolio into companies that have lower earnings variability, higher profitability, and stronger balance sheets than the broader investment universe, and where we can get these characteristics at similar valuation levels to the benchmark index. We still do not favor any single industry or sector and continue to look for the characteristics noted above across all industries. |
| Performance Past Does Not Indicate Future [Text] |
|
Performance data shown represents past performance and is no guarantee of, and is not necessarily indicative of, future results. Total return and value will vary, and you may have a gain or loss when shares are sold. Current performance may be lower or higher than quoted. For the most recent month-end performance,
|
| Line Graph [Table Text Block] |
|
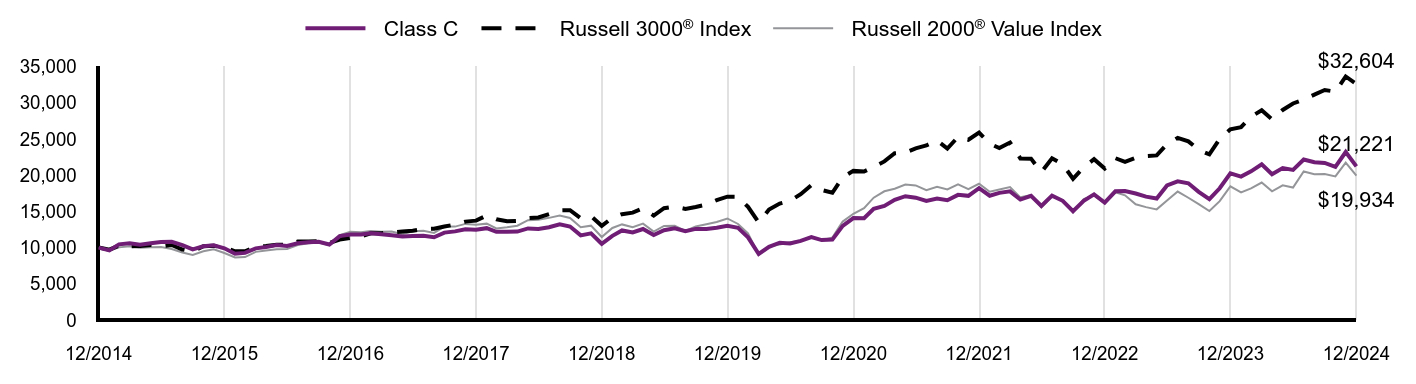
|
Class C |
Russell 3000® Index |
Russell 2000® Value Index |
12/2014 |
$10,000 |
$10,000 |
$10,000 |
01/2015 |
$9,603 |
$9,722 |
$9,584 |
02/2015 |
$10,443 |
$10,285 |
$10,029 |
03/2015 |
$10,599 |
$10,180 |
$10,198 |
04/2015 |
$10,406 |
$10,226 |
$9,980 |
05/2015 |
$10,605 |
$10,368 |
$10,063 |
06/2015 |
$10,778 |
$10,194 |
$10,076 |
07/2015 |
$10,791 |
$10,365 |
$9,798 |
08/2015 |
$10,333 |
$9,739 |
$9,317 |
09/2015 |
$9,756 |
$9,455 |
$8,994 |
10/2015 |
$10,174 |
$10,202 |
$9,498 |
11/2015 |
$10,326 |
$10,258 |
$9,768 |
12/2015 |
$9,898 |
$10,048 |
$9,253 |
01/2016 |
$9,139 |
$9,481 |
$8,632 |
02/2016 |
$9,267 |
$9,478 |
$8,690 |
03/2016 |
$9,898 |
$10,145 |
$9,411 |
04/2016 |
$10,080 |
$10,208 |
$9,610 |
05/2016 |
$10,343 |
$10,391 |
$9,786 |
06/2016 |
$10,236 |
$10,412 |
$9,816 |
07/2016 |
$10,606 |
$10,825 |
$10,346 |
08/2016 |
$10,746 |
$10,853 |
$10,603 |
09/2016 |
$10,811 |
$10,870 |
$10,686 |
10/2016 |
$10,425 |
$10,635 |
$10,335 |
11/2016 |
$11,584 |
$11,111 |
$11,707 |
12/2016 |
$11,810 |
$11,327 |
$12,190 |
01/2017 |
$11,819 |
$11,541 |
$12,103 |
02/2017 |
$11,980 |
$11,970 |
$12,278 |
03/2017 |
$11,846 |
$11,978 |
$12,174 |
04/2017 |
$11,704 |
$12,105 |
$12,222 |
05/2017 |
$11,525 |
$12,229 |
$11,842 |
06/2017 |
$11,610 |
$12,339 |
$12,256 |
07/2017 |
$11,628 |
$12,572 |
$12,333 |
08/2017 |
$11,421 |
$12,596 |
$12,030 |
09/2017 |
$12,071 |
$12,903 |
$12,882 |
10/2017 |
$12,241 |
$13,185 |
$12,899 |
11/2017 |
$12,542 |
$13,585 |
$13,272 |
12/2017 |
$12,459 |
$13,721 |
$13,146 |
01/2018 |
$12,684 |
$14,444 |
$13,308 |
02/2018 |
$12,171 |
$13,912 |
$12,642 |
03/2018 |
$12,171 |
$13,633 |
$12,799 |
04/2018 |
$12,213 |
$13,684 |
$13,020 |
05/2018 |
$12,650 |
$14,071 |
$13,778 |
06/2018 |
$12,572 |
$14,163 |
$13,861 |
07/2018 |
$12,807 |
$14,633 |
$14,106 |
08/2018 |
$13,222 |
$15,147 |
$14,442 |
09/2018 |
$12,908 |
$15,172 |
$14,084 |
10/2018 |
$11,687 |
$14,055 |
$12,823 |
11/2018 |
$11,967 |
$14,336 |
$13,029 |
12/2018 |
$10,527 |
$13,002 |
$11,455 |
01/2019 |
$11,627 |
$14,118 |
$12,707 |
02/2019 |
$12,366 |
$14,614 |
$13,201 |
03/2019 |
$12,087 |
$14,828 |
$12,821 |
04/2019 |
$12,566 |
$15,420 |
$13,306 |
05/2019 |
$11,727 |
$14,422 |
$12,219 |
06/2019 |
$12,401 |
$15,435 |
$12,997 |
07/2019 |
$12,665 |
$15,664 |
$13,018 |
08/2019 |
$12,253 |
$15,345 |
$12,291 |
09/2019 |
$12,582 |
$15,614 |
$12,923 |
10/2019 |
$12,582 |
$15,950 |
$13,236 |
11/2019 |
$12,747 |
$16,557 |
$13,545 |
12/2019 |
$13,020 |
$17,035 |
$14,020 |
01/2020 |
$12,738 |
$17,016 |
$13,263 |
02/2020 |
$11,409 |
$15,623 |
$11,975 |
03/2020 |
$9,117 |
$13,475 |
$9,020 |
04/2020 |
$10,107 |
$15,259 |
$10,133 |
05/2020 |
$10,681 |
$16,075 |
$10,424 |
06/2020 |
$10,580 |
$16,443 |
$10,726 |
07/2020 |
$10,934 |
$17,376 |
$10,947 |
08/2020 |
$11,457 |
$18,635 |
$11,536 |
09/2020 |
$11,035 |
$17,957 |
$11,000 |
10/2020 |
$11,103 |
$17,569 |
$11,393 |
11/2020 |
$12,993 |
$19,707 |
$13,593 |
12/2020 |
$14,073 |
$20,593 |
$14,669 |
01/2021 |
$14,056 |
$20,501 |
$15,441 |
02/2021 |
$15,355 |
$21,142 |
$16,892 |
03/2021 |
$15,760 |
$21,900 |
$17,775 |
04/2021 |
$16,587 |
$23,029 |
$18,134 |
05/2021 |
$17,093 |
$23,134 |
$18,698 |
06/2021 |
$16,890 |
$23,705 |
$18,585 |
07/2021 |
$16,452 |
$24,105 |
$17,920 |
08/2021 |
$16,772 |
$24,793 |
$18,400 |
09/2021 |
$16,536 |
$23,681 |
$18,031 |
10/2021 |
$17,279 |
$25,282 |
$18,719 |
11/2021 |
$17,144 |
$24,897 |
$18,079 |
12/2021 |
$18,217 |
$25,877 |
$18,816 |
01/2022 |
$17,167 |
$24,355 |
$17,719 |
02/2022 |
$17,561 |
$23,741 |
$18,013 |
03/2022 |
$17,771 |
$24,512 |
$18,365 |
04/2022 |
$16,626 |
$22,312 |
$16,940 |
05/2022 |
$17,154 |
$22,282 |
$17,265 |
06/2022 |
$15,764 |
$20,418 |
$15,559 |
07/2022 |
$17,182 |
$22,333 |
$17,066 |
08/2022 |
$16,459 |
$21,500 |
$16,526 |
09/2022 |
$15,041 |
$19,506 |
$14,842 |
10/2022 |
$16,459 |
$21,106 |
$16,711 |
11/2022 |
$17,349 |
$22,208 |
$17,221 |
12/2022 |
$16,211 |
$20,907 |
$16,091 |
01/2023 |
$17,774 |
$22,347 |
$17,627 |
02/2023 |
$17,817 |
$21,825 |
$17,220 |
03/2023 |
$17,464 |
$22,408 |
$15,986 |
04/2023 |
$17,036 |
$22,647 |
$15,587 |
05/2023 |
$16,779 |
$22,735 |
$15,280 |
06/2023 |
$18,587 |
$24,288 |
$16,494 |
07/2023 |
$19,143 |
$25,158 |
$17,739 |
08/2023 |
$18,875 |
$24,673 |
$16,885 |
09/2023 |
$17,699 |
$23,497 |
$16,006 |
10/2023 |
$16,683 |
$22,875 |
$15,051 |
11/2023 |
$18,191 |
$25,008 |
$16,406 |
12/2023 |
$20,249 |
$26,334 |
$18,448 |
01/2024 |
$19,809 |
$26,626 |
$17,610 |
02/2024 |
$20,528 |
$28,067 |
$18,186 |
03/2024 |
$21,504 |
$28,973 |
$18,983 |
04/2024 |
$20,131 |
$27,698 |
$17,774 |
05/2024 |
$20,978 |
$29,006 |
$18,605 |
06/2024 |
$20,732 |
$29,904 |
$18,291 |
07/2024 |
$22,169 |
$30,460 |
$20,520 |
08/2024 |
$21,783 |
$31,123 |
$20,135 |
09/2024 |
$21,686 |
$31,767 |
$20,148 |
10/2024 |
$21,150 |
$31,534 |
$19,833 |
11/2024 |
$23,198 |
$33,632 |
$21,746 |
12/2024 |
$21,221 |
$32,604 |
$19,934 |
|
| Average Annual Return [Table Text Block] |
|
AATR |
1 Year |
5 Years |
10 Years |
Class C at NAV |
4.00% |
9.92% |
7.81% |
Class C with 1.00% CDSCFootnote Reference1 |
3.00% |
9.92% |
7.81% |
Russell 3000® Index |
23.81% |
13.86% |
12.55% |
Russell 2000® Value Index |
8.05% |
7.29% |
7.14% | |
| Previous Investment Adviser [Text Block] |
|
|
| Updated Performance Information Location [Text Block] |
|
visit im.natixis.com/en-us/products/mutual-funds/price-and-performance
|
| AssetsNet |
|
$ 1,220,283,826
|
| Holdings Count | Holding |
|
61
|
| Advisory Fees Paid, Amount |
|
$ 8,955,710
|
| InvestmentCompanyPortfolioTurnover |
|
80.00%
|
| Additional Fund Statistics [Text Block] |
|
Total Net Assets |
$1,220,283,826 |
# of Portfolio Holdings (including overnight repurchase agreements) |
61 |
Portfolio Turnover Rate |
80% |
Total Advisory Fees Paid (after waiver/reimbursement, if applicable) |
$8,955,710 | |
| Holdings [Text Block] |
|
Value |
Value |
Other investments less than 3% of net assetsFootnote Reference* |
34.8% |
Short-Term Investments |
5.7% |
Textiles, Apparel & Luxury Goods |
3.0% |
Mortgage Real Estate Investment Trusts (REITs) |
3.1% |
Specialty Retail |
3.1% |
Health Care Providers & Services |
3.2% |
Chemicals |
4.2% |
Insurance |
4.5% |
Machinery |
4.9% |
Electronic Equipment, Instruments & Components |
4.9% |
Oil, Gas & Consumable Fuels |
5.9% |
Trading Companies & Distributors |
6.3% |
Banks |
16.4% |
| Footnote |
Description |
Footnote* |
Net of other assets less liabilities |
Element Solutions, Inc. |
3.4% |
Comerica, Inc. |
3.0% |
Western Alliance Bancorp |
3.0% |
Zions Bancorp NA |
2.7% |
Beacon Roofing Supply, Inc. |
2.7% |
First American Financial Corp. |
2.5% |
Cushman & Wakefield PLC |
2.5% |
Celestica, Inc. |
2.4% |
Cullen/Frost Bankers, Inc. |
2.2% |
Cadence Bank |
2.1% | |
| Material Fund Change [Text Block] |
|
There were no material fund changes during the period. |
| C000190733 |
|
|
| Shareholder Report [Line Items] |
|
|
| Fund Name |
|
Vaughan Nelson Small Cap Value Fund
|
| Class Name |
|
Class N
|
| Trading Symbol |
|
VSCNX
|
| Annual or Semi-Annual Statement [Text Block] |
|
This annual shareholder report contains important information about Vaughan Nelson Small Cap Value Fund for the period of January 1, 2024 to December 31, 2024.
|
| Shareholder Report Annual or Semi-Annual |
|
Annual Shareholder Report
|
| Additional Information [Text Block] |
|
You can find additional information (including tax information) about the Fund at im.natixis.com/funddocuments. You can also request the information by contacting us at (800) 225-5478 or by contacting your financial intermediary directly.
|
| Additional Information Phone Number |
|
(800) 225-5478
|
| Additional Information Website |
|
<span style="box-sizing: border-box; color: rgb(0, 0, 0); display: inline; flex-wrap: nowrap; font-size: 12px; font-weight: 400; grid-area: auto; line-height: 18px; margin: 0px; overflow: visible; text-align: left; white-space-collapse: preserve-breaks;">im.natixis.com/funddocuments</span>
|
| Expenses [Text Block] |
|
What were the fund costs for the last year? (based on a hypothetical $10,000 investment)
Class Name |
Costs of a $10,000 investment |
Costs paid as a percentage of a $10,000 investmentFootnote Reference† |
Class N |
$97 |
0.95% |
| Footnote |
Description |
Footnote† |
Annualized for periods less than one year (if applicable). | |
| Expenses Paid, Amount |
|
$ 97
|
| Expense Ratio, Percent |
|
0.95%
|
| Factors Affecting Performance [Text Block] |
|
How did the fund perform last year and what affected its performance?Top Contributors to Performance •The largest contributor to the fund’s 2024 performance was the portfolio's overweight position and selection in Information Technology led by Celestica Inc. •Selection and an underweight position within Energy also contributed to performance with Antero Resources Corporation leading. •Selection within Consumer Staples positively impacted performance thanks to strong returns from Coca-Cola Consolidated, Inc. Top Detractors from Performance •The largest detractor from the fund’s 2024 performance was the portfolio’s overweight position and security selection within Materials with Chemours Co. as the weakest name. •Security selection within Health Care negatively impacted performance. AMN Healthcare Services, Inc. hindered the sector the most. •The portfolio’s underweight position and selection within Financials detracted from performance with Selective Insurance Group, Inc. being the weakest name. Investment Activity As a result of buys and sells and market action, the portfolio is overweight Industrials, Information Technology, Materials, and Consumer Staples while underweight Real Estate, Utilities, Communication Services, Health Care, Financials, Energy, and Consumer Discretionary. We continued to sell positions that we believe to be fully valued or that could face increased earnings pressure as we move into the late stages of this economic recovery and added to existing positions or established new positions that met our investment criteria. We continue to position the portfolio into companies that have lower earnings variability, higher profitability, and stronger balance sheets than the broader investment universe, and where we can get these characteristics at similar valuation levels to the benchmark index. We still do not favor any single industry or sector and continue to look for the characteristics noted above across all industries. |
| Performance Past Does Not Indicate Future [Text] |
|
Performance data shown represents past performance and is no guarantee of, and is not necessarily indicative of, future results. Total return and value will vary, and you may have a gain or loss when shares are sold. Current performance may be lower or higher than quoted. For the most recent month-end performance,
|
| Line Graph [Table Text Block] |
|
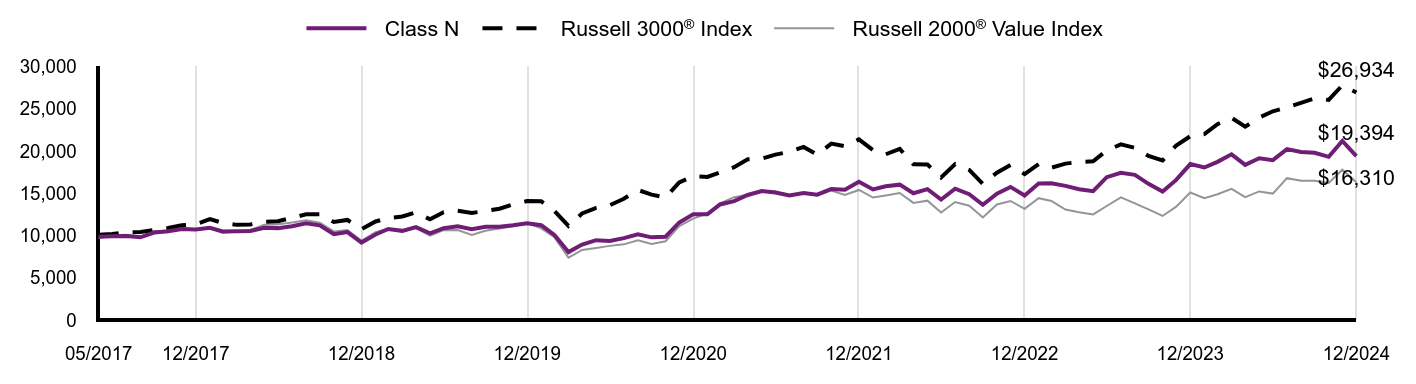
|
Class N |
Russell 3000® Index |
Russell 2000® Value Index |
05/2017 |
$9,852 |
$10,102 |
$9,689 |
06/2017 |
$9,923 |
$10,194 |
$10,028 |
07/2017 |
$9,954 |
$10,386 |
$10,091 |
08/2017 |
$9,790 |
$10,406 |
$9,843 |
09/2017 |
$10,353 |
$10,659 |
$10,540 |
10/2017 |
$10,512 |
$10,892 |
$10,554 |
11/2017 |
$10,777 |
$11,223 |
$10,859 |
12/2017 |
$10,717 |
$11,335 |
$10,755 |
01/2018 |
$10,922 |
$11,932 |
$10,888 |
02/2018 |
$10,485 |
$11,493 |
$10,344 |
03/2018 |
$10,501 |
$11,262 |
$10,472 |
04/2018 |
$10,546 |
$11,305 |
$10,653 |
05/2018 |
$10,927 |
$11,624 |
$11,273 |
06/2018 |
$10,876 |
$11,700 |
$11,341 |
07/2018 |
$11,092 |
$12,088 |
$11,541 |
08/2018 |
$11,457 |
$12,513 |
$11,816 |
09/2018 |
$11,206 |
$12,533 |
$11,523 |
10/2018 |
$10,153 |
$11,611 |
$10,491 |
11/2018 |
$10,409 |
$11,843 |
$10,660 |
12/2018 |
$9,166 |
$10,741 |
$9,372 |
01/2019 |
$10,126 |
$11,663 |
$10,397 |
02/2019 |
$10,778 |
$12,073 |
$10,801 |
03/2019 |
$10,553 |
$12,249 |
$10,490 |
04/2019 |
$10,989 |
$12,738 |
$10,886 |
05/2019 |
$10,260 |
$11,914 |
$9,997 |
06/2019 |
$10,863 |
$12,751 |
$10,634 |
07/2019 |
$11,094 |
$12,940 |
$10,651 |
08/2019 |
$10,744 |
$12,677 |
$10,057 |
09/2019 |
$11,045 |
$12,899 |
$10,573 |
10/2019 |
$11,052 |
$13,177 |
$10,829 |
11/2019 |
$11,213 |
$13,678 |
$11,083 |
12/2019 |
$11,464 |
$14,073 |
$11,471 |
01/2020 |
$11,217 |
$14,057 |
$10,852 |
02/2020 |
$10,063 |
$12,906 |
$9,797 |
03/2020 |
$8,039 |
$11,131 |
$7,380 |
04/2020 |
$8,928 |
$12,606 |
$8,291 |
05/2020 |
$9,449 |
$13,280 |
$8,528 |
06/2020 |
$9,356 |
$13,583 |
$8,775 |
07/2020 |
$9,691 |
$14,355 |
$8,956 |
08/2020 |
$10,155 |
$15,395 |
$9,439 |
09/2020 |
$9,784 |
$14,834 |
$9,000 |
10/2020 |
$9,855 |
$14,514 |
$9,322 |
11/2020 |
$11,545 |
$16,280 |
$11,121 |
12/2020 |
$12,527 |
$17,012 |
$12,002 |
01/2021 |
$12,520 |
$16,936 |
$12,634 |
02/2021 |
$13,678 |
$17,466 |
$13,821 |
03/2021 |
$14,064 |
$18,092 |
$14,543 |
04/2021 |
$14,800 |
$19,024 |
$14,837 |
05/2021 |
$15,272 |
$19,111 |
$15,299 |
06/2021 |
$15,101 |
$19,582 |
$15,206 |
07/2021 |
$14,729 |
$19,914 |
$14,662 |
08/2021 |
$15,029 |
$20,482 |
$15,054 |
09/2021 |
$14,836 |
$19,563 |
$14,753 |
10/2021 |
$15,508 |
$20,885 |
$15,315 |
11/2021 |
$15,408 |
$20,568 |
$14,792 |
12/2021 |
$16,365 |
$21,377 |
$15,395 |
01/2022 |
$15,459 |
$20,120 |
$14,498 |
02/2022 |
$15,830 |
$19,613 |
$14,738 |
03/2022 |
$16,020 |
$20,249 |
$15,026 |
04/2022 |
$15,005 |
$18,432 |
$13,860 |
05/2022 |
$15,490 |
$18,407 |
$14,126 |
06/2022 |
$14,256 |
$16,867 |
$12,730 |
07/2022 |
$15,543 |
$18,450 |
$13,963 |
08/2022 |
$14,891 |
$17,761 |
$13,521 |
09/2022 |
$13,639 |
$16,114 |
$12,144 |
10/2022 |
$14,943 |
$17,436 |
$13,672 |
11/2022 |
$15,754 |
$18,346 |
$14,090 |
12/2022 |
$14,737 |
$17,272 |
$13,166 |
01/2023 |
$16,160 |
$18,461 |
$14,422 |
02/2023 |
$16,187 |
$18,030 |
$14,089 |
03/2023 |
$15,877 |
$18,512 |
$13,079 |
04/2023 |
$15,485 |
$18,709 |
$12,753 |
05/2023 |
$15,257 |
$18,782 |
$12,502 |
06/2023 |
$16,908 |
$20,064 |
$13,495 |
07/2023 |
$17,418 |
$20,783 |
$14,514 |
08/2023 |
$17,181 |
$20,382 |
$13,815 |
09/2023 |
$16,114 |
$19,411 |
$13,096 |
10/2023 |
$15,202 |
$18,897 |
$12,315 |
11/2023 |
$16,579 |
$20,659 |
$13,423 |
12/2023 |
$18,456 |
$21,755 |
$15,094 |
01/2024 |
$18,053 |
$21,996 |
$14,408 |
02/2024 |
$18,722 |
$23,186 |
$14,880 |
03/2024 |
$19,611 |
$23,934 |
$15,532 |
04/2024 |
$18,364 |
$22,881 |
$14,542 |
05/2024 |
$19,143 |
$23,962 |
$15,222 |
06/2024 |
$18,923 |
$24,704 |
$14,966 |
07/2024 |
$20,234 |
$25,163 |
$16,789 |
08/2024 |
$19,895 |
$25,711 |
$16,474 |
09/2024 |
$19,803 |
$26,243 |
$16,485 |
10/2024 |
$19,318 |
$26,050 |
$16,227 |
11/2024 |
$21,196 |
$27,783 |
$17,792 |
12/2024 |
$19,394 |
$26,934 |
$16,310 |
|
| Average Annual Return [Table Text Block] |
|
AATR |
1 Year |
5 Years |
Since Inception 5/1/17 |
Class N |
5.08% |
11.09% |
9.02% |
Russell 3000® Index |
23.81% |
13.86% |
13.71% |
Russell 2000® Value Index |
8.05% |
7.29% |
6.50% | |
| Performance Inception Date |
|
May 01, 2017
|
| Previous Investment Adviser [Text Block] |
|
|
| Updated Performance Information Location [Text Block] |
|
visit im.natixis.com/en-us/products/mutual-funds/price-and-performance
|
| AssetsNet |
|
$ 1,220,283,826
|
| Holdings Count | Holding |
|
61
|
| Advisory Fees Paid, Amount |
|
$ 8,955,710
|
| InvestmentCompanyPortfolioTurnover |
|
80.00%
|
| Additional Fund Statistics [Text Block] |
|
Total Net Assets |
$1,220,283,826 |
# of Portfolio Holdings (including overnight repurchase agreements) |
61 |
Portfolio Turnover Rate |
80% |
Total Advisory Fees Paid (after waiver/reimbursement, if applicable) |
$8,955,710 | |
| Holdings [Text Block] |
|
Value |
Value |
Other investments less than 3% of net assetsFootnote Reference* |
34.8% |
Short-Term Investments |
5.7% |
Textiles, Apparel & Luxury Goods |
3.0% |
Mortgage Real Estate Investment Trusts (REITs) |
3.1% |
Specialty Retail |
3.1% |
Health Care Providers & Services |
3.2% |
Chemicals |
4.2% |
Insurance |
4.5% |
Machinery |
4.9% |
Electronic Equipment, Instruments & Components |
4.9% |
Oil, Gas & Consumable Fuels |
5.9% |
Trading Companies & Distributors |
6.3% |
Banks |
16.4% |
| Footnote |
Description |
Footnote* |
Net of other assets less liabilities |
Element Solutions, Inc. |
3.4% |
Comerica, Inc. |
3.0% |
Western Alliance Bancorp |
3.0% |
Zions Bancorp NA |
2.7% |
Beacon Roofing Supply, Inc. |
2.7% |
First American Financial Corp. |
2.5% |
Cushman & Wakefield PLC |
2.5% |
Celestica, Inc. |
2.4% |
Cullen/Frost Bankers, Inc. |
2.2% |
Cadence Bank |
2.1% | |
| Material Fund Change [Text Block] |
|
There were no material fund changes during the period. |
| C000069268 |
|
|
| Shareholder Report [Line Items] |
|
|
| Fund Name |
|
Vaughan Nelson Small Cap Value Fund
|
| Class Name |
|
Class Y
|
| Trading Symbol |
|
NEJYX
|
| Annual or Semi-Annual Statement [Text Block] |
|
This annual shareholder report contains important information about Vaughan Nelson Small Cap Value Fund for the period of January 1, 2024 to December 31, 2024.
|
| Shareholder Report Annual or Semi-Annual |
|
Annual Shareholder Report
|
| Additional Information [Text Block] |
|
You can find additional information (including tax information) about the Fund at im.natixis.com/funddocuments. You can also request the information by contacting us at (800) 225-5478 or by contacting your financial intermediary directly.
|
| Additional Information Phone Number |
|
(800) 225-5478
|
| Additional Information Website |
|
<span style="box-sizing: border-box; color: rgb(0, 0, 0); display: inline; flex-wrap: nowrap; font-size: 12px; font-weight: 400; grid-area: auto; line-height: 18px; margin: 0px; overflow: visible; text-align: left; white-space-collapse: preserve-breaks;">im.natixis.com/funddocuments</span>
|
| Expenses [Text Block] |
|
What were the fund costs for the last year? (based on a hypothetical $10,000 investment)
Class Name |
Costs of a $10,000 investment |
Costs paid as a percentage of a $10,000 investmentFootnote Reference† |
Class Y |
$103 |
1.00% |
| Footnote |
Description |
Footnote† |
Annualized for periods less than one year (if applicable). | |
| Expenses Paid, Amount |
|
$ 103
|
| Expense Ratio, Percent |
|
1.00%
|
| Factors Affecting Performance [Text Block] |
|
How did the fund perform last year and what affected its performance?Top Contributors to Performance •The largest contributor to the fund’s 2024 performance was the portfolio's overweight position and selection in Information Technology led by Celestica Inc. •Selection and an underweight position within Energy also contributed to performance with Antero Resources Corporation leading. •Selection within Consumer Staples positively impacted performance thanks to strong returns from Coca-Cola Consolidated, Inc. Top Detractors from Performance •The largest detractor from the fund’s 2024 performance was the portfolio’s overweight position and security selection within Materials with Chemours Co. as the weakest name. •Security selection within Health Care negatively impacted performance. AMN Healthcare Services, Inc. hindered the sector the most. •The portfolio’s underweight position and selection within Financials detracted from performance with Selective Insurance Group, Inc. being the weakest name. Investment Activity As a result of buys and sells and market action, the portfolio is overweight Industrials, Information Technology, Materials, and Consumer Staples while underweight Real Estate, Utilities, Communication Services, Health Care, Financials, Energy, and Consumer Discretionary. We continued to sell positions that we believe to be fully valued or that could face increased earnings pressure as we move into the late stages of this economic recovery and added to existing positions or established new positions that met our investment criteria. We continue to position the portfolio into companies that have lower earnings variability, higher profitability, and stronger balance sheets than the broader investment universe, and where we can get these characteristics at similar valuation levels to the benchmark index. We still do not favor any single industry or sector and continue to look for the characteristics noted above across all industries. |
| Performance Past Does Not Indicate Future [Text] |
|
Performance data shown represents past performance and is no guarantee of, and is not necessarily indicative of, future results. Total return and value will vary, and you may have a gain or loss when shares are sold. Current performance may be lower or higher than quoted. For the most recent month-end performance,
|
| Line Graph [Table Text Block] |
|
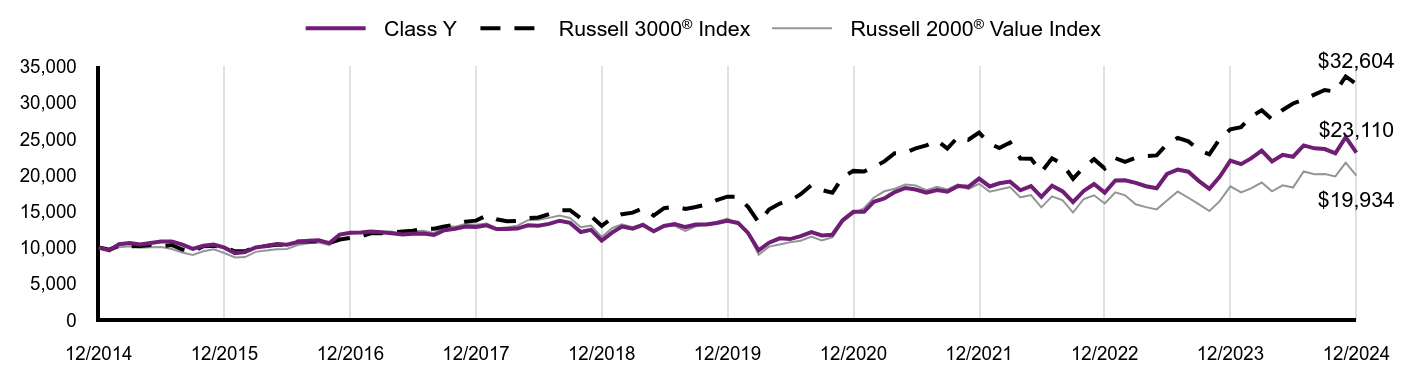
|
Class Y |
Russell 3000® Index |
Russell 2000® Value Index |
12/2014 |
$10,000 |
$10,000 |
$10,000 |
01/2015 |
$9,612 |
$9,722 |
$9,584 |
02/2015 |
$10,459 |
$10,285 |
$10,029 |
03/2015 |
$10,625 |
$10,180 |
$10,198 |
04/2015 |
$10,437 |
$10,226 |
$9,980 |
05/2015 |
$10,648 |
$10,368 |
$10,063 |
06/2015 |
$10,831 |
$10,194 |
$10,076 |
07/2015 |
$10,855 |
$10,365 |
$9,798 |
08/2015 |
$10,404 |
$9,739 |
$9,317 |
09/2015 |
$9,832 |
$9,455 |
$8,994 |
10/2015 |
$10,260 |
$10,202 |
$9,498 |
11/2015 |
$10,423 |
$10,258 |
$9,768 |
12/2015 |
$9,995 |
$10,048 |
$9,253 |
01/2016 |
$9,237 |
$9,481 |
$8,632 |
02/2016 |
$9,374 |
$9,478 |
$8,690 |
03/2016 |
$10,022 |
$10,145 |
$9,411 |
04/2016 |
$10,219 |
$10,208 |
$9,610 |
05/2016 |
$10,493 |
$10,391 |
$9,786 |
06/2016 |
$10,392 |
$10,412 |
$9,816 |
07/2016 |
$10,773 |
$10,825 |
$10,346 |
08/2016 |
$10,929 |
$10,853 |
$10,603 |
09/2016 |
$11,002 |
$10,870 |
$10,686 |
10/2016 |
$10,622 |
$10,635 |
$10,335 |
11/2016 |
$11,802 |
$11,111 |
$11,707 |
12/2016 |
$12,047 |
$11,327 |
$12,190 |
01/2017 |
$12,070 |
$11,541 |
$12,103 |
02/2017 |
$12,236 |
$11,970 |
$12,278 |
03/2017 |
$12,112 |
$11,978 |
$12,174 |
04/2017 |
$11,976 |
$12,105 |
$12,222 |
05/2017 |
$11,810 |
$12,229 |
$11,842 |
06/2017 |
$11,902 |
$12,339 |
$12,256 |
07/2017 |
$11,933 |
$12,572 |
$12,333 |
08/2017 |
$11,731 |
$12,596 |
$12,030 |
09/2017 |
$12,405 |
$12,903 |
$12,882 |
10/2017 |
$12,595 |
$13,185 |
$12,899 |
11/2017 |
$12,908 |
$13,585 |
$13,272 |
12/2017 |
$12,842 |
$13,721 |
$13,146 |
01/2018 |
$13,080 |
$14,444 |
$13,308 |
02/2018 |
$12,557 |
$13,912 |
$12,642 |
03/2018 |
$12,576 |
$13,633 |
$12,799 |
04/2018 |
$12,629 |
$13,684 |
$13,020 |
05/2018 |
$13,086 |
$14,071 |
$13,778 |
06/2018 |
$13,018 |
$14,163 |
$13,861 |
07/2018 |
$13,278 |
$14,633 |
$14,106 |
08/2018 |
$13,714 |
$15,147 |
$14,442 |
09/2018 |
$13,414 |
$15,172 |
$14,084 |
10/2018 |
$12,152 |
$14,055 |
$12,823 |
11/2018 |
$12,452 |
$14,336 |
$13,029 |
12/2018 |
$10,965 |
$13,002 |
$11,455 |
01/2019 |
$12,105 |
$14,118 |
$12,707 |
02/2019 |
$12,893 |
$14,614 |
$13,201 |
03/2019 |
$12,616 |
$14,828 |
$12,821 |
04/2019 |
$13,129 |
$15,420 |
$13,306 |
05/2019 |
$12,265 |
$14,422 |
$12,219 |
06/2019 |
$12,978 |
$15,435 |
$12,997 |
07/2019 |
$13,255 |
$15,664 |
$13,018 |
08/2019 |
$12,836 |
$15,345 |
$12,291 |
09/2019 |
$13,196 |
$15,614 |
$12,923 |
10/2019 |
$13,205 |
$15,950 |
$13,236 |
11/2019 |
$13,398 |
$16,557 |
$13,545 |
12/2019 |
$13,693 |
$17,035 |
$14,020 |
01/2020 |
$13,406 |
$17,016 |
$13,263 |
02/2020 |
$12,027 |
$15,623 |
$11,975 |
03/2020 |
$9,608 |
$13,475 |
$9,020 |
04/2020 |
$10,670 |
$15,259 |
$10,133 |
05/2020 |
$11,284 |
$16,075 |
$10,424 |
06/2020 |
$11,173 |
$16,443 |
$10,726 |
07/2020 |
$11,574 |
$17,376 |
$10,947 |
08/2020 |
$12,128 |
$18,635 |
$11,536 |
09/2020 |
$11,685 |
$17,957 |
$11,000 |
10/2020 |
$11,770 |
$17,569 |
$11,393 |
11/2020 |
$13,790 |
$19,707 |
$13,593 |
12/2020 |
$14,957 |
$20,593 |
$14,669 |
01/2021 |
$14,948 |
$20,501 |
$15,441 |
02/2021 |
$16,332 |
$21,142 |
$16,892 |
03/2021 |
$16,785 |
$21,900 |
$17,775 |
04/2021 |
$17,673 |
$23,029 |
$18,134 |
05/2021 |
$18,237 |
$23,134 |
$18,698 |
06/2021 |
$18,023 |
$23,705 |
$18,585 |
07/2021 |
$17,579 |
$24,105 |
$17,920 |
08/2021 |
$17,938 |
$24,793 |
$18,400 |
09/2021 |
$17,707 |
$23,681 |
$18,031 |
10/2021 |
$18,510 |
$25,282 |
$18,719 |
11/2021 |
$18,391 |
$24,897 |
$18,079 |
12/2021 |
$19,535 |
$25,877 |
$18,816 |
01/2022 |
$18,442 |
$24,355 |
$17,719 |
02/2022 |
$18,886 |
$23,741 |
$18,013 |
03/2022 |
$19,112 |
$24,512 |
$18,365 |
04/2022 |
$17,911 |
$22,312 |
$16,940 |
05/2022 |
$18,479 |
$22,282 |
$17,265 |
06/2022 |
$17,017 |
$20,418 |
$15,559 |
07/2022 |
$18,543 |
$22,333 |
$17,066 |
08/2022 |
$17,764 |
$21,500 |
$16,526 |
09/2022 |
$16,270 |
$19,506 |
$14,842 |
10/2022 |
$17,827 |
$21,106 |
$16,711 |
11/2022 |
$18,785 |
$22,208 |
$17,221 |
12/2022 |
$17,586 |
$20,907 |
$16,091 |
01/2023 |
$19,273 |
$22,347 |
$17,627 |
02/2023 |
$19,306 |
$21,825 |
$17,220 |
03/2023 |
$18,936 |
$22,408 |
$15,986 |
04/2023 |
$18,468 |
$22,647 |
$15,587 |
05/2023 |
$18,195 |
$22,735 |
$15,280 |
06/2023 |
$20,166 |
$24,288 |
$16,494 |
07/2023 |
$20,776 |
$25,158 |
$17,739 |
08/2023 |
$20,482 |
$24,673 |
$16,885 |
09/2023 |
$19,219 |
$23,497 |
$16,006 |
10/2023 |
$18,119 |
$22,875 |
$15,051 |
11/2023 |
$19,763 |
$25,008 |
$16,406 |
12/2023 |
$21,999 |
$26,334 |
$18,448 |
01/2024 |
$21,518 |
$26,626 |
$17,610 |
02/2024 |
$22,316 |
$28,067 |
$18,186 |
03/2024 |
$23,377 |
$28,973 |
$18,983 |
04/2024 |
$21,890 |
$27,698 |
$17,774 |
05/2024 |
$22,809 |
$29,006 |
$18,605 |
06/2024 |
$22,546 |
$29,904 |
$18,291 |
07/2024 |
$24,110 |
$30,460 |
$20,520 |
08/2024 |
$23,706 |
$31,123 |
$20,135 |
09/2024 |
$23,607 |
$31,767 |
$20,148 |
10/2024 |
$23,016 |
$31,534 |
$19,833 |
11/2024 |
$25,259 |
$33,632 |
$21,746 |
12/2024 |
$23,110 |
$32,604 |
$19,934 |
|
| Average Annual Return [Table Text Block] |
|
AATR |
1 Year |
5 Years |
10 Years |
Class Y |
5.05% |
11.04% |
8.74% |
Russell 3000® Index |
23.81% |
13.86% |
12.55% |
Russell 2000® Value Index |
8.05% |
7.29% |
7.14% | |
| Previous Investment Adviser [Text Block] |
|
|
| Updated Performance Information Location [Text Block] |
|
visit im.natixis.com/en-us/products/mutual-funds/price-and-performance
|
| AssetsNet |
|
$ 1,220,283,826
|
| Holdings Count | Holding |
|
61
|
| Advisory Fees Paid, Amount |
|
$ 8,955,710
|
| InvestmentCompanyPortfolioTurnover |
|
80.00%
|
| Additional Fund Statistics [Text Block] |
|
Total Net Assets |
$1,220,283,826 |
# of Portfolio Holdings (including overnight repurchase agreements) |
61 |
Portfolio Turnover Rate |
80% |
Total Advisory Fees Paid (after waiver/reimbursement, if applicable) |
$8,955,710 | |
| Holdings [Text Block] |
|
Value |
Value |
Other investments less than 3% of net assetsFootnote Reference* |
34.8% |
Short-Term Investments |
5.7% |
Textiles, Apparel & Luxury Goods |
3.0% |
Mortgage Real Estate Investment Trusts (REITs) |
3.1% |
Specialty Retail |
3.1% |
Health Care Providers & Services |
3.2% |
Chemicals |
4.2% |
Insurance |
4.5% |
Machinery |
4.9% |
Electronic Equipment, Instruments & Components |
4.9% |
Oil, Gas & Consumable Fuels |
5.9% |
Trading Companies & Distributors |
6.3% |
Banks |
16.4% |
| Footnote |
Description |
Footnote* |
Net of other assets less liabilities |
Element Solutions, Inc. |
3.4% |
Comerica, Inc. |
3.0% |
Western Alliance Bancorp |
3.0% |
Zions Bancorp NA |
2.7% |
Beacon Roofing Supply, Inc. |
2.7% |
First American Financial Corp. |
2.5% |
Cushman & Wakefield PLC |
2.5% |
Celestica, Inc. |
2.4% |
Cullen/Frost Bankers, Inc. |
2.2% |
Cadence Bank |
2.1% | |
| Material Fund Change [Text Block] |
|
There were no material fund changes during the period. |