Exhibit 99.2

CANADA MORTGAGE AND HOUSING CORPORATION 2024 Annual Report To request an alternate format, please contact us at: 1-800-668-2642 700 Montreal Road, contactcentre@cmhc.ca Ottawa, ON K1A 0P7 CMHC.ca
Exhibit 99.2
CANADA MORTGAGE AND HOUSING CORPORATION 2024 Annual Report To request an alternate format, please contact us at: 1-800-668-2642 700 Montreal Road, contactcentre@cmhc.ca Ottawa, ON K1A 0P7 CMHC.ca

Canada Mortgage and Housing Corporation contributes to the well-being of Canada’s housing system. We deliver housing finance solutions and provide lenders reliable access to mortgage funding. We also provide crucial research and data to inform decisions for better housing sector outcomes, and deliver housing programs for the Government of Canada. 2024 Annual Report 2

Table of Contents Message From the Chair 4 Message From the President and CEO 6 Our Strategy 8 Our Performance 10 Management Discussion and Analysis 12 2024 Overview 13 Business and Financial Highlights 16 Consolidated Financial Highlights 16 Deliver commercial solutions 19 Deliver government programs and priorities 26 Build for the future 31 Capital Management 34 Risk Management 36 2024 Climate-Related Financial Risk Disclosures 39 Consolidated Financial Statements 55 Corporate Governance 140 Appendix: Enhanced Financial Reporting by Crown Corporations 144 Glossary 150 Historical Information 153 2024 Annual Report 3

Message From the Chair “CMHC is entering the new year in excellent shape and ready to support the housing needs of Canadians in even more focused and innovative ways. We are ready to be there again for Canadians.” The year 2024 was a momentous one for housing in Canada. It was a year that asked Canadians to become experts in monetary policy and macroeconomics. It asked developers to do more with less to make their numbers work. And the latest housing projections became as hotly anticipated as hockey scores. Through it all, CMHC was there for Canada. It was there with help for Canadians making housing decisions, with programs and products for private and not-for-profit builders, and with trustworthy data to make sense of it all. Read on to learn how CMHC fared in delivering these services in a challenging year – its successes, the obstacles we faced, and how we’ve tried to overcome them. Read on to see how we’re working hard to maintain the trust of Canadians. 2024 Annual Report 4

2024 is also the year that I joined CMHC as Board chair, She also inherited an organization in good shape thanks and it’s been an honour to help oversee all this crucial to the leadership of acting CEO Michel Tremblay. Michel work. I’d like to thank my predecessor, Derek Ballantyne, has now returned to his post as Chief Financial Officer for his contributions in leading us to where we are today and Senior Vice-President, Corporate Services, and we as an organization. are fortunate to still be able to call upon his experience and knowledge, along with that of the rest of the Executive I’m pleased to lead a strong board, anchored by Committee. The Board is truly grateful to all the leaders longstanding members and revitalized by new ones who who’ve worked to smooth out all this transition. joined with us this year. Our backgrounds vary, giving us the broad outlook that good stewardship requires, This is a time of change and opportunity for CMHC, and we share a commitment to the organization and as you will see in this report, it is entering the new and to the well-being of Canada’s housing system. year in excellent shape and ready to support the housing needs of Canadians in even more focused and innovative CMHC also welcomed a new CEO this past year. ways. We are ready to be there again for Canadians. Coleen Volk did an amazing job getting up to speed and making a positive impact right away – supported, of course, by a strong team. Don Iveson Chair, CMHC Board of Directors 2024 Annual Report 5

Message From the President and CEO “As the country faced ongoing housing challenges in 2024, Canada Mortgage and Housing Corporation continued to deliver strong results for Canadians.” Headwinds were strong as many homeowners renewed their mortgage at higher interest rates, renters faced higher rents in most markets, and far too many vulnerable people struggled to keep a roof over their heads. Yet throughout the year, CMHC remained focused on the three areas where it has the greatest impact. Deliver commercial solutions In 2024, we met major boosts in demand for our commercial products. Our MLI Select product incentivized multi-unit developers to build more affordable rental housing. Federal mortgage reforms to help new homebuyers created extra demand for our Homeowners MLI and our securitization products. More on page 19. Deliver government programs and priorities Last year, the federal government announced Budget 2024 and the new Canada Housing Plan, and tasked CMHC with delivering on several of its initiatives. 2024 Annual Report 6

We stood up new programs like the Co-op Housing I began my mandate along with several new members of Development Program, and launched a second round our Board of Directors, including the Chair, Don Iveson. of the Housing Accelerator Fund so that more local It’s a pleasure to work with such an engaged, community- governments can cut red tape and fast track home connected Board and we’ll benefit from its sage guidance construction. We also enhanced existing programs such and stewardship in the years to come. as the Affordable Housing Fund and the Apartment Finally, I’m grateful for the engagement of our many Construction Loan Program, helping more developers industry and government partners. In the months and get the financing they need to build more rental homes. years ahead, we’re committed to strengthening these More on page 26. relationships which are more important than ever in these uncertain times. Because together we’re stronger, Build for the future and together we’ll reach our shared goal – a healthier In 2024, we produced more timely, unbiased research housing system for all Canadians. and insights to help housing partners make sound decisions. Notably, we drilled further into our study of Canada’s housing supply challenges, gaining a clearer picture of supply gaps at the local level. In March 2024 we also hosted a national housing conference on behalf of the federal government, bringing together thought leaders from across the country to discuss innovative Coleen Volk solutions. More on page 31. President and Chief Executive Officer Strong team, mission that matters I joined CMHC as President and CEO mid-way through 2024, returning to the company after several years in the federal and Alberta governments. The housing context has definitely changed since I first worked at CMHC. But as you’ll read in this report, the company is as high-performing as ever. None of our achievements would be possible without our dedicated CMHC employees. They are fully invested in our mission, and guided by a strong, forward-looking leadership team. 2024 Annual Report 7

Our Strategy CMHC’s strategy is guided by the National Housing Act. The Act, in relation to financing for housing, promotes housing affordability and choice, facilitates access to, and competition and efficiency in the provision of, housing finance, protects the availability of adequate funding for housing at low cost, and generally contributes to the well-being of the housing sector in the national economy. As the housing landscape shifts, with changes in the environment and clearer roles within the system, our strategy evolves to address these changes. Providing access to adequate and affordable housing remains a major challenge, and our strategic choices are shaped to address these shifts. We focus our efforts on delivering commercial solutions, supporting government priorities and programs, and building for the future to maximize our impact on a well-functioning housing system. Three key outcomes To address the challenges of providing adequate and affordable housing, our strategic choices focused on three key outcomes. These outcomes, aligned with our strategy and mandate, define the changes needed across the housing system and guided our efforts: • People in core housing need have equitable and reliable access to housing that is secure and affordable. • Canada has the number of homes and the mix of housing options to serve diverse needs. • Canada’s housing system supports sustainability and stability. 2024 Annual Report 8

Three core activities Our efforts to contribute to these critical outcomes are driven by three core activities, each directly supporting our strategy: Deliver CMHC supports the sustainability and stability of Canada’s housing system through the delivery of public Commercial mortgage insurance and mortgage funding solutions. Solutions We contribute to the well-being of the housing sector by preserving the availability of capital, maintaining our ability to respond to disruptive events, and ensuring that we remain competitive and financially viable, with due regard for exposure to loss. Deliver CMHC helps the federal government deliver on its commitment to increase housing supply and make Government housing more affordable. This includes leading the Programs and delivery of housing programs, such as those included in the National Housing Strategy (NHS). The ongoing Priorities delivery of our programs also reflects our commitment to broader government-wide priorities, including climate compatibility, equity, and reconciliation. Build for the CMHC continues to act as a thought leader, given our deep knowledge of the housing system. We work closely Future with all orders of government and housing system participants, providing expert advice to fill knowledge gaps and support the creation of a stable and sustainable housing system. Meanwhile, this contributes to enhanced delivery of our own programs and development of new solutions as we build for the future. We endeavour to reflect the complexity and intersectionality of housing issues in the research, data and insights we deliver. To drive our strategy, our performance measures (see page 10) assess whether our products, programs and activities are achieving the desired impact in alignment with broader goals. 2024 Annual Report 9

Our Performance Our performance measures help us assess progress on our strategy and inform our decision making through evidence-based data. The performance highlights below show our contribution to addressing Canada’s housing shortfalls in 2024. 504,531 units 2024 TARGET 536,000 units new, repaired and assisted by CMHC programs* 118,541 units 2024 TARGET new, repaired and assisted, affordable 177,000 units to those in Core Housing Need* $77.3M 2024 TARGET ** $100M Incremental affordable housing funding 79% 2024 TARGET of units supported located in markets with greatest 75% need of new and/or improved rental supply*** 48% 2024 TARGET Ratio of climate compatible dwelling units/total dwelling 25% units (including retrofits) supported by CMHC * Includes commitments to all new and existing units facilitated through CMHC’s activities, including National Housing Strategy, Mortgage Loan Insurance, Legacy programs as well as Partnerships (units facilitated through Incremental Affordable Housing Funding) and Innovation. Some units may be double-counted in cases where projects receive funding from multiple programs. ** Funding secured through partnerships with private entities and that is committed to supporting or creating units affordable to people in core housing need. *** This measure captures approved rental units in markets identified as in high rental need based on their vacancy rates and affordability levels, as well as units in Northern and on-reserve communities. 2024 Annual Report 10

Notes: Numbers of units created and repaired in 2024 exceeded those in 2023 with most programs achieving their 2024 targets. The discrepancy between actuals and targets is primarily due to a significant increase in the Affordable Housing Fund new construction target in 2024 resulting from the pull-forward of program funding from future years. If the units target had not been changed or accelerated, the AHF would have met its targets. Also, a higher number of loans was approved in 2024 compared to 2023, however, the units per loan size deviated significantly compared to the historical norm resulting in fewer new and existing units than expected in 2024. The lower-than-expected number of units addressing core housing need was attributed to a recent trend in a diminished share of existing units that typically have rents closer to or below market rents. In 2024, $77.3 million in incremental affordable housing funding was secured, nearly doubling the amount committed in 2023. Although this result did not meet the target, significant investments were achieved through important partnerships with private entities, including Habitat for Humanity, contributing to additional housing units for those in need. Approximately 299,000 units (79%) were placed in markets facing the greatest rental supply shortages, reflecting a 40,000-unit increase over 2023. Nearly 50% of the units facilitated in 2024 were climate-compatible, surpassing our 25% target. This achievement underscores our commitment to housing finance solutions that support the transition to a low-carbon future, where homes and communities are resilient to climate change. 2024 Annual Report 11

Management Discussion and Analysis The following management discussion and analysis of the financial condition and results of operations was prepared for the year ended 31 December 2024 and approved by the Board of Directors on 19 March 2025. This section should be read in conjunction with the audited consolidated financial statements. Unless otherwise indicated, all financial information in this report has been prepared in accordance with International Financial Reporting Standards (IFRS) and all amounts are expressed in Canadian dollars. Forward-looking statements Our annual report contains forward-looking statements that include, but are not limited to: • the statements with respect to our outlook for the regulatory environment in which we operate; • the outlook and priorities for each activity; and the risk environment. By their nature, forward-looking statements require us to make assumptions. They are subject to inherent risks and uncertainties that may cause actual results to differ materially from expectations expressed in the forward-looking statements. Non-IFRS measures We use a number of financial measures to assess our performance. Some of these measures are not calculated in accordance with IFRS and are not defined by IFRS, and do not have standardized meanings that would ensure consistency and comparability with other institutions. These non-IFRS measures are presented to supplement the information disclosed. They may be useful in analyzing performance and understanding the measures used by management in its financial and operational decision making. Where non-IFRS measures are used throughout the annual report, a definition of the term will be disclosed in the glossary for non-IFRS financial measures. 2024 Annual Report 12
2024 Overview A range of factors, both external and Rental markets remained tight but slightly more rental internal, had an impact on our activities units became available, with vacancy rates rising from in 2024. The following overview of these 1.5 percent in 2023 to 2.2 percent in 2024. Rent increases slowed to 5.4 percent in 2024, compared factors provides context to the results to 8 percent in the previous year. However, rents contained in this Annual Report. for new tenants were still 24 percent higher in 2024 when units turned over. External Canada’s housing construction remained elevated in 2024, reaching 245,000 units – above the past decade’s average In 2024, rapid population growth, the effects of elevated of 222,000 units. 2024 housing starts marked a 1-percent interest rates and global economic and geopolitical increase from 2023, though it remains below the 2021 uncertainties were all factors that impacted housing peak of 274,000 units. in Canada. Inflation eased significantly over the year, prompting the Bank of Canada to lower its policy rate Foreign trade from 5 percent in April to 3.25 percent by December. This brought the policy rate down to what is considered At time of writing, Canada is preparing for the potential the neutral range of 2.25 to 3.25 percent, after a period impact of U.S. tariffs. A 25% tariff across the board of rapid interest rate hikes that began in early 2022. lasting up to six months would disrupt the Canadian It marked a gradual shift toward stimulating more economy and housing markets. It could spur a major economic and housing activity. recession, with GDP decreasing and unemployment increasing significantly. Should the trade conflict extend Even with rapid population growth, Canada’s economic beyond two quarters, the impact on the economy and growth was modest at 1.5 percent in 2024 due to the Canadian housing markets would be more significant. delayed effect of high interest rates. High borrowing costs Housing starts could drop almost 8 percent nationally weighed on spending and investment, as consumption and sales of existing houses could fall almost 3 percent. grew modestly while business investment and net exports stalled. Government spending outpaced overall economic Further, if Canada imposes its own tariffs, we could see growth and was a key driver of economic activity. increased prices for U.S. supplies being imported for use The labour market softened with the unemployment in the Canadian construction industry. This may result rate increasing from 5.4 percent in January 2024 to in inflationary pressure on new housing construction, 6.7 percent in December 2024. averaging up to 3.9 percent. Elevated interest rates and modest economic growth However, tariffs could also present an opportunity to slowed housing activity. Sales remained subdued accelerate other factors that would address our housing throughout 2024, totaling 483,000 units, a 7-percent crisis. More focus on interprovincial trade could lead increase from 2023 but below the 10-year average to a less fragmented construction industry and a greater of 522,000 units. The average MLS® price increased by capacity to invest in productivity-enhancing technologies. 1 percent from 2023 to $690,000, lower than the 2022 Canadian supply chains for housing could also be peak of $710,000. For many Canadians, the combination consolidated, as a relatively new abundance of materials of near-peak home prices and elevated mortgage rates like steel and aluminum, in the short term, could make made it hard to afford a home. them more affordable to Canadian builders. 2024 Annual Report 13
Internal Lastly, all MAP action items from the OAG performance audit on Chronic Homelessness in 2022, whose objectives Recalibration with Housing, Infrastructure included examining whether CMHC contributed to the and Communities Canada prevention and reduction of chronic homelessness, were In 2024, CMHC continued recalibrating roles and completed in Q2 2024. responsibilities with the newly formed department of Housing Infrastructure and Communities Canada Reconciliation Action Plan (HICC). This change sees HICC assume the primary On 20 June 2024, the eve of National Indigenous lead on strategic housing policy, supporting the Minister Peoples Day, CMHC launched an internal Reconciliation of Housing, Infrastructure and Communities. CMHC Action Plan (RAP). As an internal guiding document, it remains focused on delivering housing finance solutions, provides a roadmap for the organization’s reconciliation building and sharing our housing knowledge and journey over the next two years by committing to expertise, and delivering housing programs. near-term actions, longer term actions and key measures that we will track our reconciliation progress against. Refocusing government spending It is built upon four overarching pillars: Budget 2023 announced federal government-wide spending • Culture and inclusion reductions of $15.4 billion over the next five years, which included spending by Crown corporations. As both an • Talent development Enterprise and Appropriated Crown corporation, CMHC • Renewed relationships received direction and guidance from both the Minister • Improved Indigenous housing outcomes. of Finance and President of Treasury Board to reduce administrative expenses by 3 percent by 2026 and to Our hybrid workplace reduce professional services and travel by 15 percent beginning in 2024. These reductions were reflected In 2024, we announced increased requirements for in CMHC’s 2024-2028 Corporate Plan1. in-office presence for employees and executives at three and four days per week, respectively, starting as early as CMHC’s actual spending during the year was in line with January 2025. The decision was made to reinforce our the spending reduction target, as reflected in the Corporate commitment to community as a core value, and to be Plan. To respect the target, we found efficiencies in more in line with the ecosystem in which we operate, operations, in conjunction with reducing discretionary such as with our financial and public sector peers. spending, all while ensuring no impact to Canadians. A plan was put in place to address current space Special examinations/audits constraints across our six offices. In Q2 2024, the Office of the Auditor General of Pay Equity Plan Canada (OAG) began a performance audit of Federal In 2024, CMHC established a Pay Equity Committee Real Property. The scope of the audit includes a review and completed a full review of compensation elements of the Federal Lands Initiative led by CMHC, as well as as required under the Pay Equity Act2. The Pay Equity initiatives under other federal departments. This report Committee posted the Pay Equity Plan in time to meet is expected to be completed in Spring 2025. the legislative requirements, including the results of the pay equity analysis. Target salaries for female and male The OAG Audit on Housing in First Nations Communities job classes were compared and it was determined that was completed and tabled in Parliament in Q1 2024. The there is no pay equity gap between female and male objective of this audit was to examine the extent that gendered jobs. The Pay Equity Plan outlines activities CMHC and Indigenous Services Canada supported First that will allow CMHC to continue to move toward Nations in closing the housing gap on-reserve by improving the elimination of female- and male- stereotyped jobs. housing conditions and increasing First Nations’ capacity to manage housing. Action items identified in the Management Action Plan (MAP) from this audit are expected to be completed by Q1 2027. 1 https://www.cmhc-schl.gc.ca/about-us/corporate-reporting/summary-of-the-corporate-plan 2 https://laws-lois.justice.gc.ca/eng/acts/P-4.2 2024 Annual Report 14

Workplace Diversity, Equity and Inclusion • We strengthened the measurement of our Inclusion CMHC advanced many commitments under its Workplace Index by broadening the dimensions we assess and Diversity, Equity and Inclusion Strategy to meet legislative introducing an inclusion risk management framework. requirements and, more importantly, reduce employment We achieved a stable and favourable corporate equity barriers for employees. Notable highlights include: Inclusion Index at 81% in 2024. • We met all minimum workforce representation goals • We completed 24 of 35 actions from our Accessibility except for Indigenous representation, which we are Plan 2023-20253. For example, we incorporated addressing through various talent attraction accessibility considerations into procurement and retention strategies. We remain committed processes, launched a pilot program designed to to sustaining a workforce that is representative develop leadership skills among employees with of the Canadian population. disabilities and strengthen our leadership pipeline, and published our Annual Accessibility Progress Report4. CMHC Total CMHC People Leaders Group 2024 Actual 2024 Minimum Goal 2024 Actual 2024 Minimum Goal Women 60.4% 50.9% 54.0% 50.9% Indigenous people 3.2% 5.0% 1.7% 5.0% People with disabilities 12.0% 12.0% 12.0% 12.0% Racialized people 46.1% 28.0% 29.0% 28.0% 2SLGBTQI+ people 6.6% 4.0% 6.8% 4.0% Note: People Leaders are individuals in a permanent or temporary position, with at least one reporting employee or who are Advisors or higher. Representation rates are based on the finite population (survey participants). Goals are based on Statistics Canada sources on the current and projected population of Canada. 3 https://www.cmhc-schl.gc.ca/about-us/corporate-reporting/transparency/accessibility-at-cmhc/2023-2025-accessibility-plan 4 https://www.cmhc-schl.gc.ca/about-us/corporate-reporting/transparency/accessibility-at-cmhc 2024 Annual Report 15
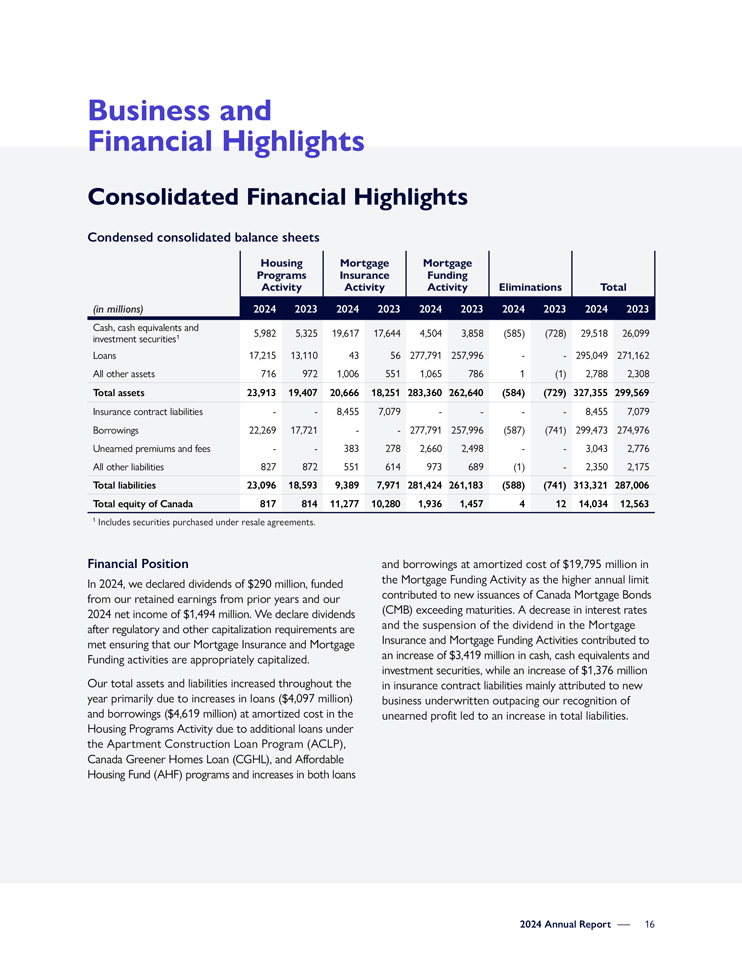
Business and Financial Highlights Consolidated Financial Highlights Condensed consolidated balance sheets Housing Mortgage Mortgage Programs Insurance Funding Activity Activity Activity Eliminations Total (in millions) 2024 2023 2024 2023 2024 2023 2024 2023 2024 2023 Cash, cash equivalents and 1 5,982 5,325 19,617 17,644 4,504 3,858 (585) (728) 29,518 26,099 investment securities Loans 17,215 13,110 43 56 277,791 257,996 — 295,049 271,162 All other assets 716 972 1,006 551 1,065 786 1 (1) 2,788 2,308 Total assets 23,913 19,407 20,666 18,251 283,360 262,640 (584) (729) 327,355 299,569 Insurance contract liabilities — 8,455 7,079 — — 8,455 7,079 Borrowings 22,269 17,721 — 277,791 257,996 (587) (741) 299,473 274,976 Unearned premiums and fees — 383 278 2,660 2,498 — 3,043 2,776 All other liabilities 827 872 551 614 973 689 (1)—2,350 2,175 Total liabilities 23,096 18,593 9,389 7,971 281,424 261,183 (588) (741) 313,321 287,006 Total equity of Canada 817 814 11,277 10,280 1,936 1,457 4 12 14,034 12,563 1 Includes securities purchased under resale agreements. Financial Position and borrowings at amortized cost of $19,795 million in In 2024, we declared dividends of $290 million, funded the Mortgage Funding Activity as the higher annual limit from our retained earnings from prior years and our contributed to new issuances of Canada Mortgage Bonds 2024 net income of $1,494 million. We declare dividends (CMB) exceeding maturities. A decrease in interest rates after regulatory and other capitalization requirements are and the suspension of the dividend in the Mortgage met ensuring that our Mortgage Insurance and Mortgage Insurance and Mortgage Funding Activities contributed to Funding activities are appropriately capitalized. an increase of $3,419 million in cash, cash equivalents and investment securities, while an increase of $1,376 million Our total assets and liabilities increased throughout the in insurance contract liabilities mainly attributed to new year primarily due to increases in loans ($4,097 million) business underwritten outpacing our recognition of and borrowings ($4,619 million) at amortized cost in the unearned profit led to an increase in total liabilities. Housing Programs Activity due to additional loans under the Apartment Construction Loan Program (ACLP), Canada Greener Homes Loan (CGHL), and Affordable Housing Fund (AHF) programs and increases in both loans 2024 Annual Report 16
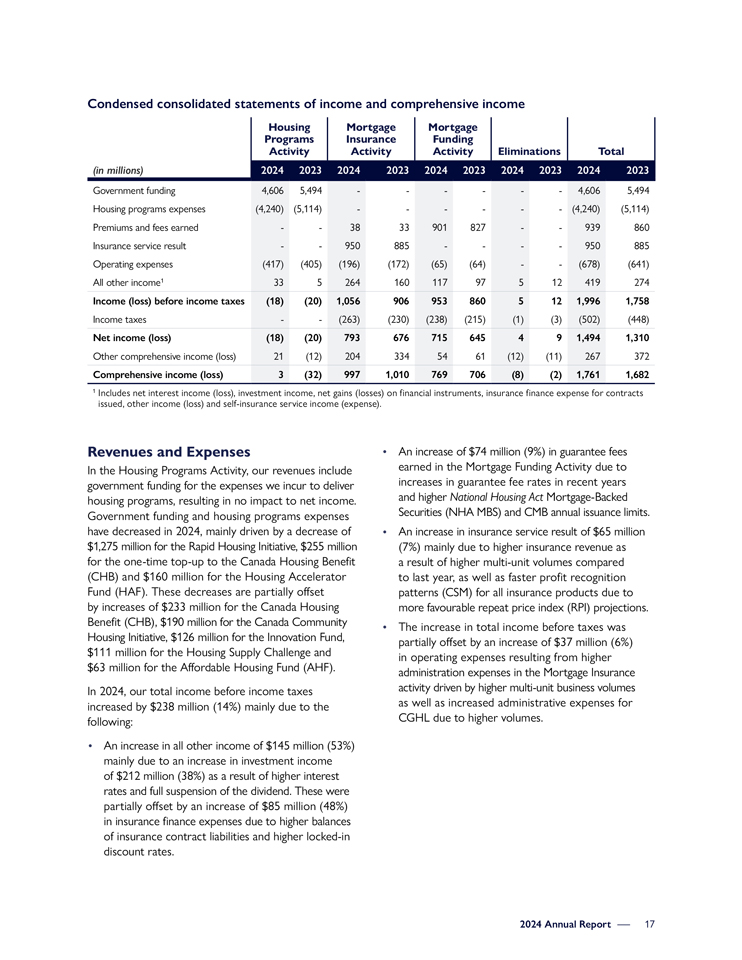
Condensed consolidated statements of income and comprehensive income Housing Mortgage Mortgage Programs Insurance Funding Activity Activity Activity Eliminations Total (in millions) 2024 2023 2024 2023 2024 2023 2024 2023 2024 2023 Government funding 4,606 5,494 — — — 4,606 5,494 Housing programs expenses (4,240) (5,114) — — — (4,240) (5,114) Premiums and fees earned — 38 33 901 827 — 939 860 Insurance service result — 950 885 — — 950 885 Operating expenses (417) (405) (196) (172) (65) (64) — (678) (641) All other income1 33 5 264 160 117 97 5 12 419 274 Income (loss) before income taxes (18) (20) 1,056 906 953 860 5 12 1,996 1,758 Income taxes — (263) (230) (238) (215) (1) (3) (502) (448) Net income (loss) (18) (20) 793 676 715 645 4 9 1,494 1,310 Other comprehensive income (loss) 21 (12) 204 334 54 61 (12) (11) 267 372 Comprehensive income (loss) 3 (32) 997 1,010 769 706 (8) (2) 1,761 1,682 1 Includes net interest income (loss), investment income, net gains (losses) on financial instruments, insurance finance expense for contracts issued, other income (loss) and self-insurance service income (expense). Revenues and Expenses In the Housing Programs Activity, our revenues include government funding for the expenses we incur to deliver housing programs, resulting in no impact to net income. Government funding and housing programs expenses have decreased in 2024, mainly driven by a decrease of $1,275 million for the Rapid Housing Initiative, $255 million for the one-time top-up to the Canada Housing Benefit (CHB) and $160 million for the Housing Accelerator Fund (HAF). These decreases are partially offset by increases of $233 million for the Canada Housing Benefit (CHB), $190 million for the Canada Community Housing Initiative, $126 million for the Innovation Fund, $111 million for the Housing Supply Challenge and $63 million for the Affordable Housing Fund (AHF). In 2024, our total income before income taxes increased by $238 million (14%) mainly due to the following: • An increase in all other income of $145 million (53%) mainly due to an increase in investment income of $212 million (38%) as a result of higher interest rates and full suspension of the dividend. These were partially offset by an increase of $85 million (48%) in insurance finance expenses due to higher balances of insurance contract liabilities and higher locked-in discount rates. An increase of $74 million (9%) in guarantee fees earned in the Mortgage Funding Activity due to increases in guarantee fee rates in recent years and higher National Housing Act Mortgage-Backed Securities (NHA MBS) and CMB annual issuance limits. An increase in insurance service result of $65 million (7%) mainly due to higher insurance revenue as a result of higher multi-unit volumes compared to last year, as well as faster profit recognition patterns (CSM) for all insurance products due to more favourable repeat price index (RPI) projections. The increase in total income before taxes was partially offset by an increase of $37 million (6%) in operating expenses resulting from higher administration expenses in the Mortgage Insurance activity driven by higher multi-unit business volumes as well as increased administrative expenses for CGHL due to higher volumes. 2024 Annual Report 17
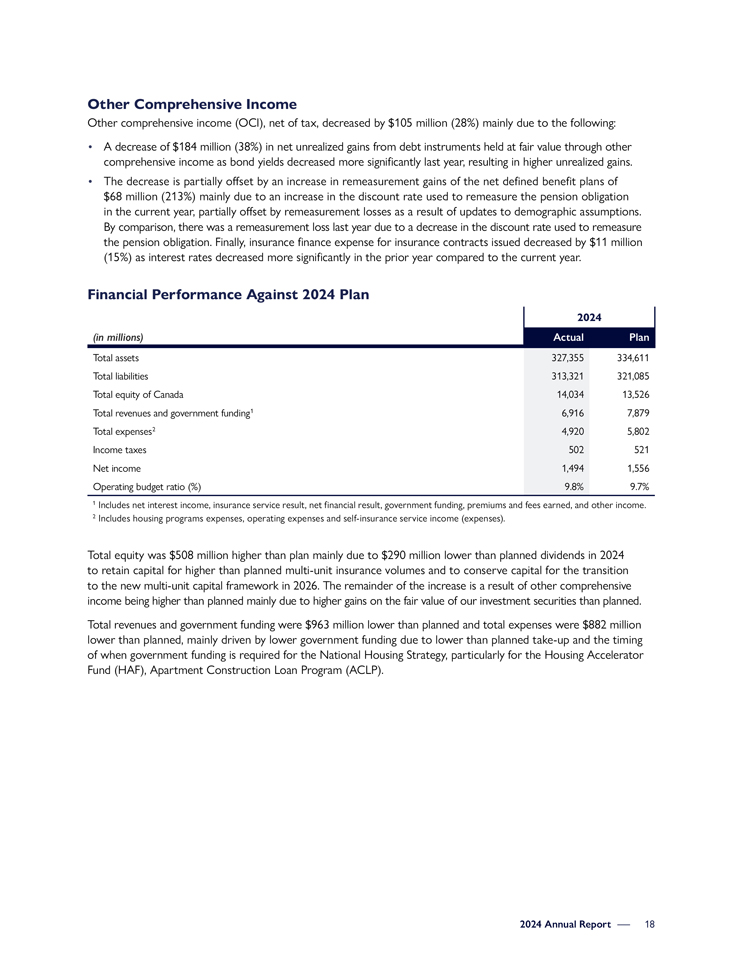
Other Comprehensive Income Other comprehensive income (OCI), net of tax, decreased by $105 million (28%) mainly due to the following: • A decrease of $184 million (38%) in net unrealized gains from debt instruments held at fair value through other comprehensive income as bond yields decreased more significantly last year, resulting in higher unrealized gains. • The decrease is partially offset by an increase in remeasurement gains of the net defined benefit plans of $68 million (213%) mainly due to an increase in the discount rate used to remeasure the pension obligation in the current year, partially offset by remeasurement losses as a result of updates to demographic assumptions. By comparison, there was a remeasurement loss last year due to a decrease in the discount rate used to remeasure the pension obligation. Finally, insurance finance expense for insurance contracts issued decreased by $11 million (15%) as interest rates decreased more significantly in the prior year compared to the current year. Financial Performance Against 2024 Plan 2024 (in millions) Actual Plan Total assets 327,355 334,611 Total liabilities 313,321 321,085 Total equity of Canada 14,034 13,526 Total revenues and government funding1 6,916 7,879 Total expenses2 4,920 5,802 Income taxes 502 521 Net income 1,494 1,556 Operating budget ratio (%) 9.8% 9.7% 1 Includes net interest income, insurance service result, net financial result, government funding, premiums and fees earned, and other income. 2 Includes housing programs expenses, operating expenses and self-insurance service income (expenses). Total equity was $508 million higher than plan mainly due to $290 million lower than planned dividends in 2024 to retain capital for higher than planned multi-unit insurance volumes and to conserve capital for the transition to the new multi-unit capital framework in 2026. The remainder of the increase is a result of other comprehensive income being higher than planned mainly due to higher gains on the fair value of our investment securities than planned. Total revenues and government funding were $963 million lower than planned and total expenses were $882 million lower than planned, mainly driven by lower government funding due to lower than planned take-up and the timing of when government funding is required for the National Housing Strategy, particularly for the Housing Accelerator Fund (HAF), Apartment Construction Loan Program (ACLP). 2024 Annual Report 18

Deliver commercial solutions We deliver mortgage loan insurance and mortgage funding solutions on a commercial basis to approved lenders and issuers. In doing this, we play a key role in maintaining a well-functioning housing finance system through all economic cycles. Our activities support the stability of the Canadian financial system while operating on a commercial basis with due regard for loss and without the need for government funding. Mortgage Loan Insurance What we do We offer competitive mortgage loan insurance (MLI) products to facilitate access to homeownership. We also offer effective multi-unit mortgage loan insurance (MU MLI) products that enable the financing of new construction of multi-unit residential properties, as well as purchase and refinancing to preserve the existing stock of multi-unit residential properties, including affordable rental housing. How we do it We work with lenders to offer both high- and low-ratio transactional and portfolio homeowner MLI products in all parts of Canada. We also offer a range of MU MLI products that reduce risks for lending institutions, which gives borrowers greater access to financing and allows lenders to offer them more favourable interest rates. 2024 Annual Report 19
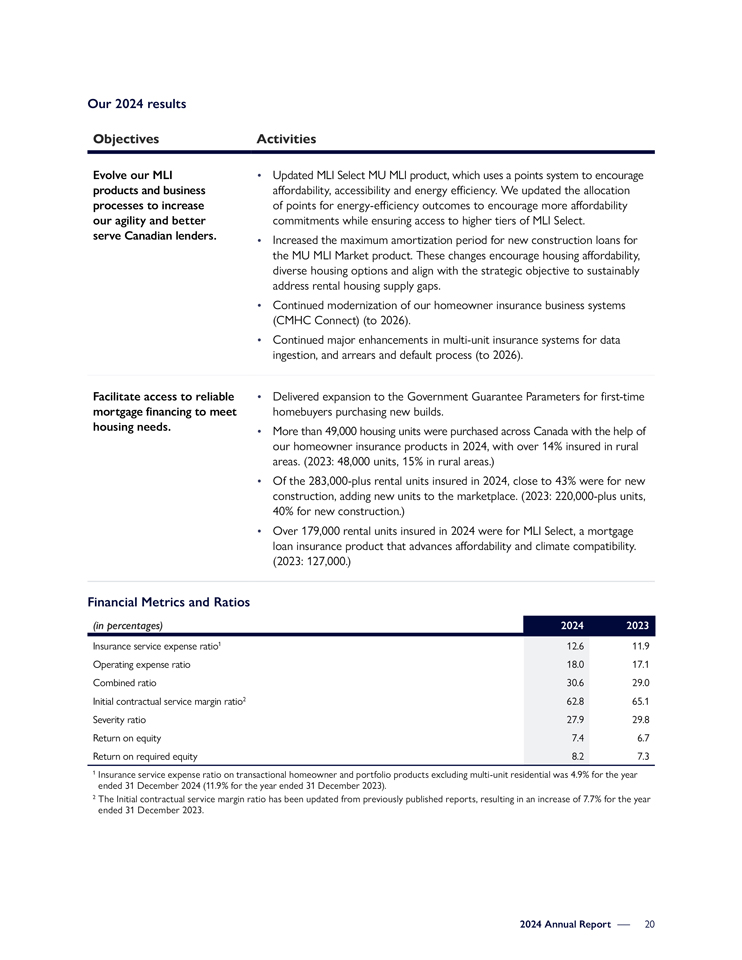
Our 2024 results Objectives Activities Evolve our MLI • Updated MLI Select MU MLI product, which uses a points system to encourage products and business affordability, accessibility and energy efficiency. We updated the allocation processes to increase of points for energy-efficiency outcomes to encourage more affordability our agility and better commitments while ensuring access to higher tiers of MLI Select. serve Canadian lenders. • Increased the maximum amortization period for new construction loans for the MU MLI Market product. These changes encourage housing affordability, diverse housing options and align with the strategic objective to sustainably address rental housing supply gaps. • Continued modernization of our homeowner insurance business systems (CMHC Connect) (to 2026). • Continued major enhancements in multi-unit insurance systems for data ingestion, and arrears and default process (to 2026). Facilitate access to reliable • Delivered expansion to the Government Guarantee Parameters for first-time mortgage financing to meet homebuyers purchasing new builds. housing needs. • More than 49,000 housing units were purchased across Canada with the help of our homeowner insurance products in 2024, with over 14% insured in rural areas. (2023: 48,000 units, 15% in rural areas.) • Of the 283,000-plus rental units insured in 2024, close to 43% were for new construction, adding new units to the marketplace. (2023: 220,000-plus units, 40% for new construction.) • Over 179,000 rental units insured in 2024 were for MLI Select, a mortgage loan insurance product that advances affordability and climate compatibility. (2023: 127,000.) Financial Metrics and Ratios (in percentages) 2024 2023 Insurance service expense ratio1 12.6 11.9 Operating expense ratio 18.0 17.1 Combined ratio 30.6 29.0 Initial contractual service margin ratio2 62.8 65.1 Severity ratio 27.9 29.8 Return on equity 7.4 6.7 Return on required equity 8.2 7.3 1 Insurance service expense ratio on transactional homeowner and portfolio products excluding multi-unit residential was 4.9% for the year ended 31 December 2024 (11.9% for the year ended 31 December 2023). 2 The Initial contractual service margin ratio has been updated from previously published reports, resulting in an increase of 7.7% for the year ended 31 December 2023. 2024 Annual Report 20

The insurance service expense ratio increased primarily due to increasing multi-unit arrears volumes particularly in Quebec. The operating expense ratio increased mainly due to higher allocated corporate costs commensurate with the increased size of the multi-unit business and the resources required to support it. The initial contractual service margin ratio decreased mainly due to a higher risk adjustment assumption implemented in the fourth quarter of 2023, to cover the cost of capital for the transactional homeowner products. The severity ratio decreased compared to prior year due to reduced property sale costs. The return on equity and return on required equity ratio increased mainly due to higher insurance service result and higher investment income as described previously. The increases in these ratios are partially offset by higher average equity and higher required capital respectively as we continue to retain capital to support multi-unit insurance business growth. Insurance-in-force ($B)1 Contractual Service Margin (CSM) (in millions, unless otherwise indicated) 2024 2023 2024 2023 Transactional homeowner 162 169 2,059 1,960 Portfolio 65 77 65 78 Multi-unit residential 213 168 3,395 2,792 Total 440 414 5,519 4,830 1 Insurance-in-force figures are as reported by the mortgage lenders/servicers. CMHC’s total insurance-in-force is $440 billion which is compliant with the legislated limit of $800 billion set by the Government of Canada. This year, insurance-in-force increased by $26 billion due to new volumes insured exceeding the run-off of existing policies-in-force. New loans insured were $85 billion, while estimated loan amortization and pay-downs were $59 billion. CSM increased by $689 million (14%) as our new business underwritten continues to outpace the recognition of earned profit, primarily due to price increases and continued high demand for our multi-unit products. Insured volumes Insured Premiums and (units) volumes ($) fees received1 Claims paid2 (in millions, unless otherwise indicated) 2024 2023 2024 2023 2024 2023 2024 2023 Transactional homeowner 49,569 48,056 17,227 16,030 606 561 35 45 Portfolio 10,614 26,935 2,766 7,185 10 28 3 5 Multi-unit residential 283,711 220,925 65,167 43,257 1,673 968 7 2 Total 343,894 295,916 85,160 66,472 2,289 1,557 45 52 1 Premiums and fees received may not equal premiums received on insurance contracts written in the period and premiums and fees deferred on self-insured contracts written during the period, due to timing of receipts. 2 Claims paid refers to the net cash amounts paid out on settlement of the claims, excluding claims administration expenses. Transactional homeowner unit volumes increased largely due to declining interest rates, which boosted the housing market. Portfolio unit volumes decreased due to fewer large pools insured, as well as smaller lenders submitting smaller sized pools compared to prior year. The increase in multi-unit residential unit volumes is driven by an increase in new construction units insured, especially in the MLI Select product, which focuses on affordability, accessibility, and climate compatibility. 2024 Annual Report 21
Total insured dollars increased, driven primarily by the increases in multi-unit residential, which are the result of the increases in unit volumes, as explained previously and an increase in the cost per unit due to a larger proportion of MLI Select high LTV ratio loans. Transactional homeowner volumes increased due to higher units insured, especially in provinces with elevated home prices. The overall increase in both multi-unit residential and transactional homeowner is partially offset by the decrease in portfolio volumes due to the reasons explained previously. The increase in total premiums and fees received of $732 million is primarily attributed to multi-unit residential due to higher volumes, recent premium increases and a higher proportion of loans with higher loan-to-value. The increase in transactional homeowner and decrease in portfolio premiums and fees received is due to changes in insured volumes as explained previously. Claims paid remain low and have decreased slightly compared to prior year due to primarily sustained higher home prices. 2024 2023 No. of delinquent loans Arrears rate No. of delinquent loans Arrears rate Transactional homeowner 2,920 0.38% 3,068 0.38% Portfolio 797 0.16% 874 0.15% Multi-unit residential 129 0.35% 119 0.37% Total 3,846 0.30% 4,061 0.29% The arrears rate includes all loans more than 90 days past due as a percentage of outstanding insured loans. Reported delinquencies remain low in all regions, which is consistent with strong economic conditions. Factors that impacted results Demand for multi-unit mortgage loan insurance (MU MLI) products remained strong throughout 2024. These products have helped cushion the impact of elevated interest rates and construction costs on multi-unit projects. By reducing financing costs and providing more favourable loan conditions, MU MLI has helped many multi-unit projects move forward, supporting the preservation and creation of purpose-built rental housing units. The growth in multi-unit residential volumes is primarily driven by an increase in newly insured construction units, particularly through the MLI Select product, which emphasizes affordability, accessibility and climate compatibility. The overall rise in insured dollars is largely due to higher volumes in multi-unit residential units, coupled with an increase in the insured loan amount per unit, given increased cost of construction. This uptick in loan amounts per unit is influenced by a higher proportion of high loan-to-value ratio loans, made possible by the MLI Select product’s lower down-payment requirements compared to other multi-unit products. However, this positive trend in multi-unit residential is somewhat offset by a decline in transactional homeowner and portfolio volumes. Trends, risks and look ahead to 2025 On the upside, the policy interest rate moderated over 2024, which may lead to greater affordability and mitigate the risk from the high number of mortgage renewals expected in 2025. Further, modest economic growth and an upward trend in GDP per capita may stimulate income growth, and a rebound in home-sale prices may help build equity for existing homeowners. However, elevated uncertainty related to foreign trade, particularly in construction materials, and the potential for supply-chain disruptions, could offset these factors. Lower interest rates, along with slower rises in construction costs, will likely take some pressure off the development and financing of multi-unit projects. We will closely monitor economic conditions to ensure our MU MLI products continue to support the housing market through all economic cycles. 2024 Annual Report 22
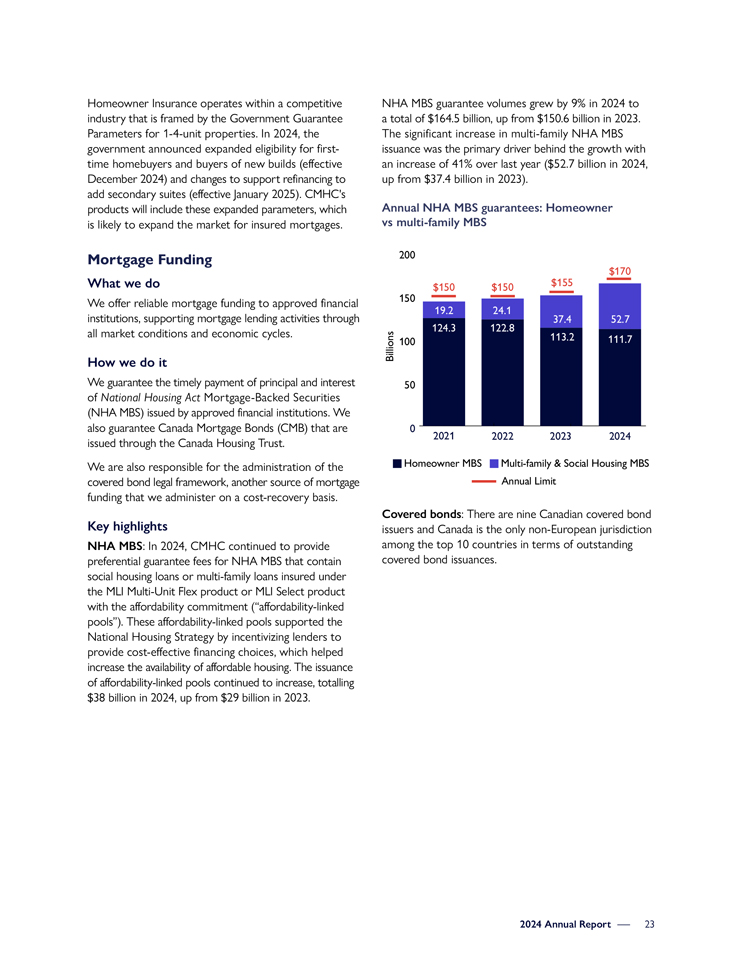
Homeowner Insurance operates within a competitive industry that is framed by the Government Guarantee Parameters for 1-4-unit properties. In 2024, the government announced expanded eligibility for first-time homebuyers and buyers of new builds (effective December 2024) and changes to support refinancing to add secondary suites (effective January 2025). CMHC’s products will include these expanded parameters, which is likely to expand the market for insured mortgages. Mortgage Funding What we do We offer reliable mortgage funding to approved financial institutions, supporting mortgage lending activities through all market conditions and economic cycles. How we do it We guarantee the timely payment of principal and interest of National Housing Act Mortgage-Backed Securities (NHA MBS) issued by approved financial institutions. We also guarantee Canada Mortgage Bonds (CMB) that are issued through the Canada Housing Trust. We are also responsible for the administration of the covered bond legal framework, another source of mortgage funding that we administer on a cost-recovery basis. Key highlights NHA MBS: In 2024, CMHC continued to provide preferential guarantee fees for NHA MBS that contain social housing loans or multi-family loans insured under the MLI Multi-Unit Flex product or MLI Select product with the affordability commitment (“affordability-linked pools”). These affordability-linked pools supported the National Housing Strategy by incentivizing lenders to provide cost-effective financing choices, which helped increase the availability of affordable housing. The issuance of affordability-linked pools continued to increase, totalling $38 billion in 2024, up from $29 billion in 2023. NHA MBS guarantee volumes grew by 9% in 2024 to a total of $164.5 billion, up from $150.6 billion in 2023. The significant increase in multi-family NHA MBS issuance was the primary driver behind the growth with an increase of 41% over last year ($52.7 billion in 2024, up from $37.4 billion in 2023). Annual NHA MBS guarantees: Homeowner vs multi-family MBS 200 $170 $150 $150 $155 150 19.2 24.1 37.4 52.7 124.3 122.8 Billions 100 113.2 111.7 50 0 2021 2022 2023 2024 Homeowner MBS Multi-family & Social Housing MBS Annual Limit Covered bonds: There are nine Canadian covered bond issuers and Canada is the only non-European jurisdiction among the top 10 countries in terms of outstanding covered bond issuances. 2024 Annual Report 23

Our 2024 results Objectives Activities Offer lenders • Guaranteed $60 billion of Canada Mortgage Bond (CMB), helping provide an increase reliable access to of $20 billion in CMB funding to multi-family Mortgage-Backed Securities (MBS). mortgage funding. • Continued to provide affordability-linked pools with priority access to 10-year CMB funding. $17.5 billion of affordability-linked pools received priority access to CMB funding. • $38.8 billion of Affordability-Linked NHA Mortgage-Backed Securities were issued by Approved Issuers in 2024. (2023: $29 billion.) • Played a key leadership role in the industry’s transition from the Canadian Dollar Offered Rate (CDOR) to the Canadian Overnight Repo Rate Average (CORRA). On 1 July 2024, CMHC transitioned all outstanding floating-rate CDOR-based securities guaranteed under its securitization program to CORRA ($28 billion in NHA MBS and $13.5 billion in CMB). Financial Metrics and Ratios (in percentages) 2024 2023 Operating expense ratio 5.9 6.7 Return on equity 42.1 46.3 The operating expense ratio is lower than last year, mainly due to an increase in guarantee and application fees earned, as older pools with lower fees are gradually replaced with new pools with higher associated fees. The return on equity decreased compared to prior year, due to the higher average equity, as a result of the temporary suspension of the dividend effective August 2024. Total guarantees-in- New securities Guarantee and force ($B) guaranteed ($B) application fees received1 2024 2023 2024 2023 2024 2023 National Housing Act Mortgage- 277 254 164 151 801 740 Backed Securities (NHA MBS) Canada Mortgage Bonds (CMB) 276 254 60 45 262 195 Total 553 508 224 196 1,063 935 1 Guarantee and application fees received for NHA MBS; guarantee fees received for CMB. Total guarantees-in-force represents the maximum principal obligation related to the timely payment guarantee. Guarantees-in-force increased by $45 billion (9%) in 2024, due to a lower prepayment rate as well as a higher annual issuance limit effective since Q4 2023. High interest rates have slowed down the housing market leading to lower prepayment rates. Our total guarantees-in-force is compliant with the $800 billion limit set by the Government of Canada. Guarantee and application fees received increased by $128 million (14%), whilst new securities guaranteed increased by $28 billion (14%) compared to last year. Guarantee fees are higher due to the higher guarantee volumes compared to last year, which is the result of the higher annual issuance limits on both NHA MBS and CMB. Factors that impacted results In 2024, the Government of Canada authorized CMHC to provide up to $60 billion of new guarantees of CMB and $170 billion of new guarantees of NHA MBS. This includes a $20 billion increase in annual CMB funding capacity, as well as an increase of $20 billion in NHA MBS funding capacity, which has been fully implemented and has provided incremental funding for the multi-unit market. The National Housing Act was amended to raise the legislative limit for guarantees issued by CMHC in respect of NHA MBS and CMB to $800 billion to accommodate the increased funding capacity. 2024 Annual Report 24
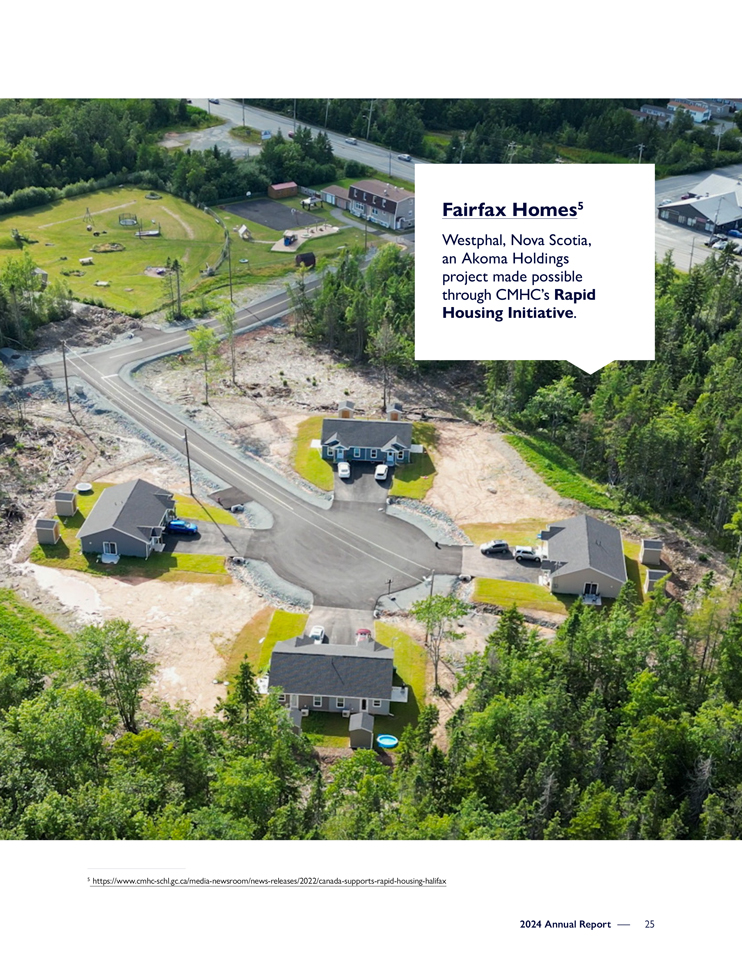
Fairfax Homes5 Westphal, Nova Scotia, an Akoma Holdings project made possible through CMHC’s Rapid Housing Initiative. 5 https://www.cmhc-schl.gc.ca/media-newsroom/news-releases/2022/canada-supports-rapid-housing-halifax 2024 Annual Report 25

Deliver government programs and priorities What we do We deliver housing programs for the Government of Canada by providing financial solutions that increase supply and preserve housing. How we do it Through parliamentary appropriations and low-cost funding from the government, we deliver housing programs by: • Building and maintaining functions and capabilities that allow scalable delivery of housing programs; and • Focusing the delivery and administration of housing programs to achieve Government of Canada targets. 2024 Annual Report 26
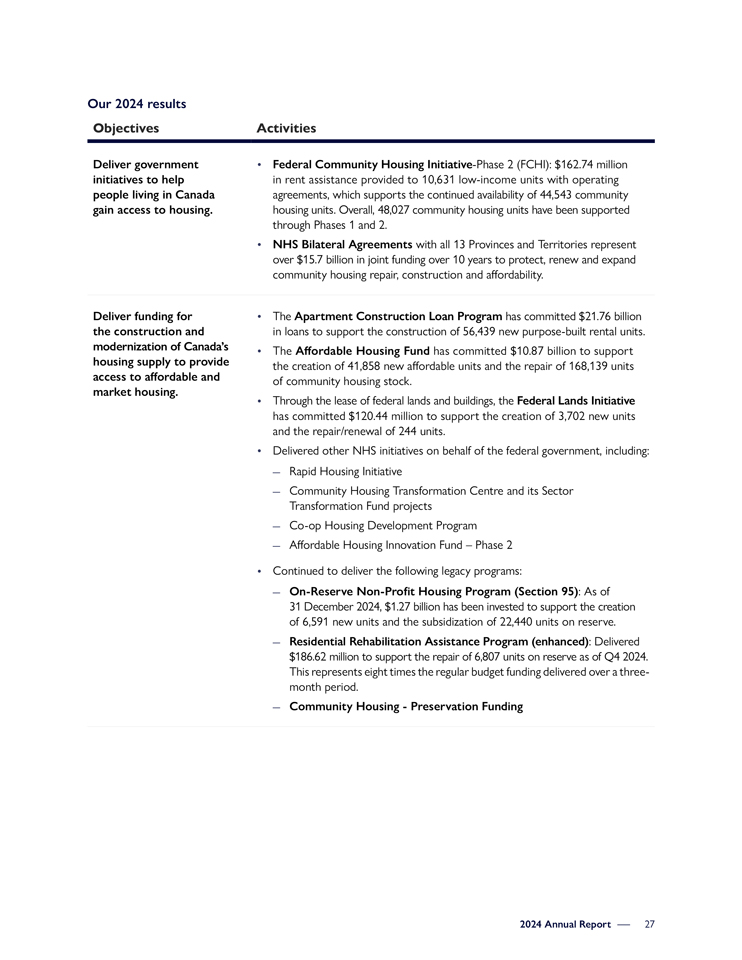
Our 2024 results Objectives Activities Deliver government • Federal Community Housing Initiative-Phase 2 (FCHI): $162.74 million initiatives to help in rent assistance provided to 10,631 low-income units with operating people living in Canada agreements, which supports the continued availability of 44,543 community gain access to housing. housing units. Overall, 48,027 community housing units have been supported through Phases 1 and 2. • NHS Bilateral Agreements with all 13 Provinces and Territories represent over $15.7 billion in joint funding over 10 years to protect, renew and expand community housing repair, construction and affordability. Deliver funding for • The Apartment Construction Loan Program has committed $21.76 billion the construction and in loans to support the construction of 56,439 new purpose-built rental units. modernization of Canada’s • The Affordable Housing Fund has committed $10.87 billion to support housing supply to provide the creation of 41,858 new affordable units and the repair of 168,139 units access to affordable and of community housing stock. market housing. • Through the lease of federal lands and buildings, the Federal Lands Initiative has committed $120.44 million to support the creation of 3,702 new units and the repair/renewal of 244 units. • Delivered other NHS initiatives on behalf of the federal government, including: – Rapid Housing Initiative – Community Housing Transformation Centre and its Sector Transformation Fund projects – Co-op Housing Development Program – Affordable Housing Innovation Fund – Phase 2 • Continued to deliver the following legacy programs: – On-Reserve Non-Profit Housing Program (Section 95): As of 31 December 2024, $1.27 billion has been invested to support the creation of 6,591 new units and the subsidization of 22,440 units on reserve. – Residential Rehabilitation Assistance Program (enhanced): Delivered $186.62 million to support the repair of 6,807 units on reserve as of Q4 2024. This represents eight times the regular budget funding delivered over a three- month period. – Community Housing—Preservation Funding 2024 Annual Report 27
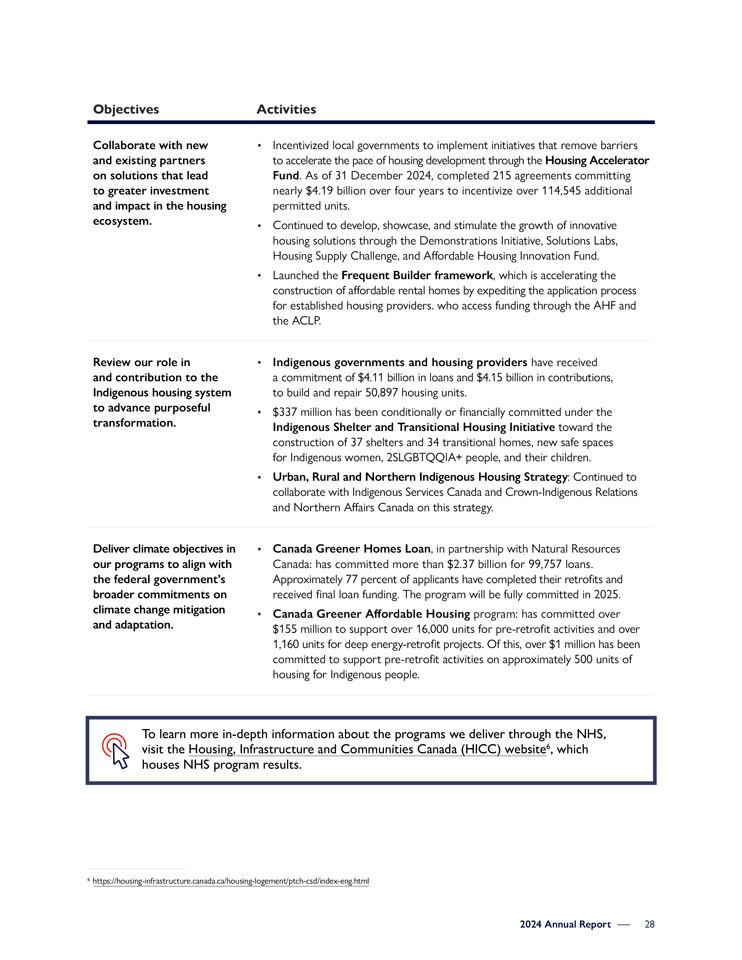
Objectives Activities Collaborate with new • Incentivized local governments to implement initiatives that remove barriers and existing partners to accelerate the pace of housing development through the Housing Accelerator on solutions that lead Fund. As of 31 December 2024, completed 215 agreements committing to greater investment nearly $4.19 billion over four years to incentivize over 114,545 additional and impact in the housing permitted units. ecosystem. • Continued to develop, showcase, and stimulate the growth of innovative housing solutions through the Demonstrations Initiative, Solutions Labs, Housing Supply Challenge, and Affordable Housing Innovation Fund. • Launched the Frequent Builder framework, which is accelerating the construction of affordable rental homes by expediting the application process for established housing providers. who access funding through the AHF and the ACLP. Review our role in • Indigenous governments and housing providers have received and contribution to the a commitment of $4.11 billion in loans and $4.15 billion in contributions, Indigenous housing system to build and repair 50,897 housing units. to advance purposeful • $337 million has been conditionally or financially committed under the transformation. Indigenous Shelter and Transitional Housing Initiative toward the construction of 37 shelters and 34 transitional homes, new safe spaces for Indigenous women, 2SLGBTQQIA+ people, and their children. • Urban, Rural and Northern Indigenous Housing Strategy: Continued to collaborate with Indigenous Services Canada and Crown-Indigenous Relations and Northern Affairs Canada on this strategy. Deliver climate objectives in • Canada Greener Homes Loan, in partnership with Natural Resources our programs to align with Canada: has committed more than $2.37 billion for 99,757 loans. the federal government’s Approximately 77 percent of applicants have completed their retrofits and broader commitments on received final loan funding. The program will be fully committed in 2025. climate change mitigation • Canada Greener Affordable Housing program: has committed over and adaptation. $155 million to support over 16,000 units for pre-retrofit activities and over 1,160 units for deep energy-retrofit projects. Of this, over $1 million has been committed to support pre-retrofit activities on approximately 500 units of housing for Indigenous people. To learn more in-depth information about the programs we deliver through the NHS, visit the Housing, Infrastructure and Communities Canada (HICC) website6, which houses NHS program results. 6 https://housing-infrastructure.canada.ca/housing-logement/ptch-csd/index-eng.html 2024 Annual Report 28
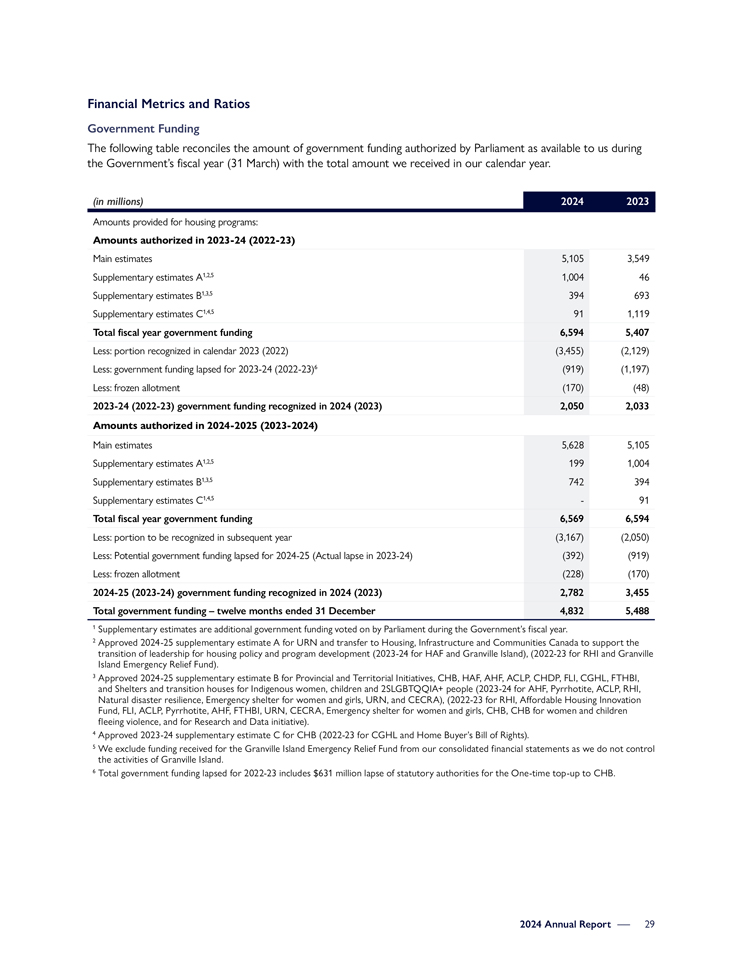
Financial Metrics and Ratios Government Funding The following table reconciles the amount of government funding authorized by Parliament as available to us during the Government’s fiscal year (31 March) with the total amount we received in our calendar year. (in millions) 2024 2023 Amounts provided for housing programs: Amounts authorized in 2023-24 (2022-23) Main estimates 5,105 3,549 Supplementary estimates A1,2,5 1,004 46 Supplementary estimates B1,3,5 394 693 Supplementary estimates C1,4,5 91 1,119 Total fiscal year government funding 6,594 5,407 Less: portion recognized in calendar 2023 (2022) (3,455) (2,129) Less: government funding lapsed for 2023-24 (2022-23)6 (919) (1,197) Less: frozen allotment (170) (48) 2023-24 (2022-23) government funding recognized in 2024 (2023) 2,050 2,033 Amounts authorized in 2024-2025 (2023-2024) Main estimates 5,628 5,105 Supplementary estimates A1,2,5 199 1,004 Supplementary estimates B1,3,5 742 394 Supplementary estimates C1,4,5—91 Total fiscal year government funding 6,569 6,594 Less: portion to be recognized in subsequent year (3,167) (2,050) Less: Potential government funding lapsed for 2024-25 (Actual lapse in 2023-24) (392) (919) Less: frozen allotment (228) (170) 2024-25 (2023-24) government funding recognized in 2024 (2023) 2,782 3,455 Total government funding – twelve months ended 31 December 4,832 5,488 1 Supplementary estimates are additional government funding voted on by Parliament during the Government’s fiscal year. 2 Approved 2024-25 supplementary estimate A for URN and transfer to Housing, Infrastructure and Communities Canada to support the transition of leadership for housing policy and program development (2023-24 for HAF and Granville Island), (2022-23 for RHI and Granville Island Emergency Relief Fund). 3 Approved 2024-25 supplementary estimate B for Provincial and Territorial Initiatives, CHB, HAF, AHF, ACLP, CHDP, FLI, CGHL, FTHBI, and Shelters and transition houses for Indigenous women, children and 2SLGBTQQIA+ people (2023-24 for AHF, Pyrrhotite, ACLP, RHI, Natural disaster resilience, Emergency shelter for women and girls, URN, and CECRA), (2022-23 for RHI, Affordable Housing Innovation Fund, FLI, ACLP, Pyrrhotite, AHF, FTHBI, URN, CECRA, Emergency shelter for women and girls, CHB, CHB for women and children fleeing violence, and for Research and Data initiative). 4 Approved 2023-24 supplementary estimate C for CHB (2022-23 for CGHL and Home Buyer’s Bill of Rights). 5 We exclude funding received for the Granville Island Emergency Relief Fund from our consolidated financial statements as we do not control the activities of Granville Island. 6 Total government funding lapsed for 2022-23 includes $631 million lapse of statutory authorities for the One-time top-up to CHB. 2024 Annual Report 29

Factors that impacted results Budget 2024 and Fall Economic Statement 2024 included significant investments for housing, expanding existing programs and creating new ones. CMHC was tasked with delivering the following: • Enhancements and new loan funding to ACLP; • Enhancements and new funding to AHF, including funds to create a new Rapid Housing Sub-Stream; • Enhancements and new funding to the Federal Lands Initiative (FLI); • A second round of the Housing Accelerator Fund (HAF). Trends, risks and look ahead to 2025 On the upside, new, lower immigration targets may slow increases in housing demand, especially in the rental market, since most immigrants rent when they arrive. Also, modest but positive economic growth, with an expected shift to increasing GDP per capita, shows potential for income growth. However, foreign trade risks remain elevated, which creates a risk of economic contraction that could be hard on both renters and homeowners. In the event of an economic contraction, more households may remain in rentals, or return to them, increasing demand and putting upward pressure on rents. We are closely monitoring the potential impact of the current economic and policy environment on our overall program outcomes for future years. Sagonaska Place7 Belleville, Ontario, a Summers & Co project made possible through CMHC’s Federal Lands Initiative, Affordable Housing Fund and Seed Funding. 7 https://www.cmhc-schl.gc.ca/media-newsroom/news-releases/2024/canada-convert-federal-building-into-affordable-homes-belleville 2024 Annual Report 30

Build for the future “By closely monitoring key trends, we remained agile in addressing challenges and providing evidence-based guidance on housing to stakeholders.” What we do We build and share our knowledge and expertise of the housing system to drive informed decision making, stimulate dialogue and improve outcomes in the housing sector. We address critical knowledge gaps in the housing market by providing timely, relevant and objective insights. How we do it We conduct and support surveys, research and analysis to better understand current and future housing system challenges and explore potential solutions. Our focus areas include: housing supply and demand, housing finance, housing needs, building science and construction innovation, and Indigenous and northern housing. 2024 Annual Report 31

Our 2024 results Objectives Activities Understand • Published flagship reports on housing market outlook8, housing supply current and future developments9 and analysis of the rental markets10. challenges of the • Released findings from the third cycle of the Canadian Housing Survey housing system, in partnership with Statistics Canada. barriers to housing • Completed the first phase of development of the Integrated Housing Model affordability and that will be used for estimating the supply gap and for forecasting housing households in core variables at provincial level and 6 largest Census Metropolitan Areas (CMAs). housing need, recognizing the • Published study on Indigenous insurance and risk11, and supported research unique needs of and initiatives addressing core housing needs12, and housing models13 to improve Indigenous people housing outcomes for Indigenous peoples, including women, 2SLGBTQQIA+14 and racialized individuals, and other underrepresented groups living in urban, rural, and Canadians. northern communities. Create solutions to • Published research on filtering15, and environmental, social and governance address current and performance measurement16 in the housing sector. future challenges in the • Reported on progress towards CMHC-led UNDA Action Plan17 measures. housing system with • Published Urban Rural and Northern Indigenous (URN) What We Heard a focus on economic, report, summarizing the views and perspectives informing the URN Strategy. environmental, and social vulnerabilities. Strengthen thought • Published impactful thought leadership articles exploring critical housing issues, leadership in the housing such as affordability, rental markets and Canada’s housing construction capacity. system by offering bold insights that influence others to act. 8 https://www.cmhc-schl.gc.ca/professionals/housing-markets-data-and-research/market-reports/housing-market/housing-market-outlook 9 https://www.cmhc-schl.gc.ca/professionals/housing-markets-data-and-research/market-reports/housing-market/housing-supply-report 10https://www.cmhc-schl.gc.ca/professionals/housing-markets-data-and-research/market-reports/rental-market-reports-major-centres 11https://www.cmhc-schl.gc.ca/blog/2024/addressing-indigenous-insurance-challenges 12https://abo-peoples.org/wp-content/uploads/2024/05/May23Phase-3-Part-1-Housing-Costing-Study-Report_FINAL.docx.pdf 13https://www.cmhc-schl.gc.ca/blog/2024/developing-saaca-housing-model-indigenous-communities-across-canada 14https://www.cmhc-schl.gc.ca/professionals/housing-markets-data-and-research/housing-research/research-reports/housing-needs/ exploring-metis-women-slgbtqia-peoples-housing-issues-canada 15https://www.cmhc-schl.gc.ca/professionals/housing-markets-data-and-research/housing-research/research-reports/accelerate-supply/ understanding-filtering-long-term-strategy-new-supply-housing-affordability 16https://www.cmhc-schl.gc.ca/professionals/housing-markets-data-and-research/housing-research/research-reports/accelerate-supply/ exploring-environmental-social-governance-performance-measurement 17https://www.justice.gc.ca/eng/declaration/ap-pa/ah/pdf/unda-action-plan-digital-eng.pdf 2024 Annual Report 32

Factors that impacted results Evolving economic and housing conditions influenced our research, insights and policy work. By closely monitoring key trends, we remained agile in addressing challenges and providing evidence-based guidance on housing to stakeholders. Trends, risks and look ahead to 2025 We remain focused on delivering the objectives outlined in CMHC’s Corporate Plan, while closely monitoring financial, reputational, operational and strategic risks. The broader macroeconomic environment will continue to shape our research priorities and insights. With the increasing political and economic volatility across the global landscape, we will need to be more agile and adaptive in our planning and forecasting. Maintaining a proactive approach will allow us to adapt and respond effectively to emerging challenges and opportunities in the housing system. La Maison des Papillons18 Montreal, Quebec, a Le Murier project made possible through the Canada-Québec Rapid Housing Initiative Agreement. 18https://www.cmhc-schl.gc.ca/media-newsroom/news-releases/2024/new-housing-units-people-living-mental-health-issues-montreal 2024 Annual Report 33

Capital Management Frameworks For our Housing Programs Activity, we maintain a reserve fund pursuant to Section 29 of the CMHC Act which includes profits of the Corporation, after providing for all matters, that in the opinion of the Board of Directors, are required to carry out the purposes of the Corporation. Aside from the reserve fund, we do not hold capital for our Housing Programs activities, as they do not present material financial risks that are not already otherwise mitigated. For our Mortgage Insurance Activity, our capital management framework follows OSFI regulations with respect to the use of the MICAT as our Own Risk and Solvency Assessment (ORSA) economic capital is lower than OSFI’s regulatory capital requirements. Due to the significant growth in multi-unit insurance business in recent years, OSFI is implementing a new capital framework to address multi-unit insurance risks. This new framework leverages the Capital Adequacy Requirements (CAR) for standardized banks, which is based on Basel III and differentiates required capital based on the type of exposure. As a result, different considerations will be given to properties with and without elevated risks, whether they are under development/construction, and second position mortgages. The target implementation date is 1 January 2026 and includes a 5 year transition plan for multi-unit insurance-in-force immediately prior to transition beginning in 2026 and ending in 2030. With respect to our Mortgage Funding Activity, our capital management framework follows industry best practices and incorporates regulatory principles from OSFI, including those set out in OSFI’s E19 – Own Risk and Solvency Assessment guideline, and those of the Basel Committee on Banking Supervision. Our capital adequacy assessment uses an integrated approach to evaluate our capital needs from both a regulatory and economic capital basis to establish capital targets that take into consideration our strategy and risk appetite. In August 2024, our Board of Directors approved maintaining the internal targets and operating levels of 155% and 165% respectively for Mortgage Insurance and 105% and 110% for Mortgage Funding for 2025. For Mortgage Funding, the Board approved an increase of the economic capital required at the operating level from $2.2 billion to $2.6 billion, effective 1 January 2025. However, this is not expected to have an impact on our economic capital available to economic capital required ratio for the next year, as our liquidity target is higher. Ratios The following table presents our capital management ratios as at 31 December. (in percentages) 2024 2023 Mortgage Insurance: Capital available to 188 185 minimum capital required (MICAT) Mortgage Funding: Economic capital 127 109 available to economic capital required The Mortgage Insurance capital available to minimum capital required ratio increased compared to last year mainly due to increases in our capital available that was generated from our comprehensive income. Mortgage Funding capital available to capital required ratio increased compared to last year, mainly due to a higher economic capital available. On 22 August 2024, the Board of Directors approved the temporary suspension of all remaining dividends to retain capital for multi-unit growth in the Mortgage Insurance Activity which contributed to the increase in the economic capital available during the year. Refer to the Consolidated Financial Statements Note 10 – Capital Management for further disclosure on capital management. 2024 Annual Report 34

Dividend Breakdown The following table presents dividends paid over the last 5 years. (in millions) 2024 2023 2022 2021 20201 Dividends Paid 290 1,080 2,180 5,080 -Dividends Declared 290 1,080 2,180 5,080—1 Dividend was temporarily suspended in 2020 due to the COVID-19 pandemic. As part of Budget 2024, the Government issued revisions to the Capital and Dividend Framework for Financial Crown Corporations. The nature of the revisions relate primarily to specific expectations of Financial Crown Corporations regarding the amount of capital to be retained and how excess capital should be deployed as well as specific disclosure requirements. The primary impact to CMHC related to additional disclosures regarding the types of scenarios that might lead to a recapitalization and the amount of notice that would be provided to the Government of Canada should a recapitalization be required. These additional disclosures were included in our 2025-2029 Corporate Plan Summary. There were no specific impacts to the preparation of our annual reports. 2024 Annual Report 35

Risk Management Our Enterprise Risk Management Framework (ERMF) is crucial to our proactive risk management practice. It helps us effectively identify and manage current and emerging risks in the financial system that affect housing and CMHC. It also helps ensure our risk management activities are comprehensive and play an integral part in strategy formulation as well as day-to-day business activities and decision-making. In these ways, it reinforces an effective risk culture across the organization and, ultimately, helps us to achieve our strategic and business objectives. Risk Environment and Profile In 2024, financial risks remained overall low and within risk tolerances. • Credit risk and liquidity risk remained low and stable supported by strong credit quality. • Market risk was within established risk limits and tolerances, as the diversification of our investment portfolios continued to provide resiliency and mitigate the impact of uncertain market and economic conditions. • Homeowner insurance risk was stable and arrears remained low. Interest rate and renewal risk remains low and exposure to variable rate mortgages continues to decrease. • Multi-unit insurance risk remained moderate due to product mix weighted towards higher risk loans. • Capital adequacy risk was moderate as CMHC suspended dividends to support increased multi-unit volumes and updated capital requirements for multi-unit exposures. Our strategic risks are being effectively managed within risk tolerances. CMHC continues to conduct stress-testing activities and monitor its mortgage insurance portfolio in consideration of the large number of borrowers who will renew mortgages at higher rates in 2025 and the political and economic uncertainty that exists in its operating environment (e.g., the impact on housing affordability of possible protectionist policies, such as trade tariffs). Within operational risk, cyber, third party, operational resilience, and data governance risks continue to be key risks for the corporation. Various transformative programs and initiatives are ongoing to strengthen our control environment in these areas while ensuring increased operational efficiency and optimized risk management practices and oversight. In addition, we have continued to update our risk management practices, policies, and tools to align with industry standards, legislative requirements, and regulatory guidelines. 2024 Annual Report 36

ORSA and Stress Testing CMHC conducts an Own Risk and Solvency Assessment (ORSA), which enables the company to better understand the interrelationships between our risk profile and our capital needs. Through this process, we assess risks quantitively and evaluate our capital needs and solvency position to set internal capital targets. We also conduct Corporate-Wide Stress Testing (CWST), a quantitative assessment of capital sufficiency under specific adverse economic and financial conditions. CWST evaluates the mortgage insurance, mortgage funding, and investment portfolios, based on selected adverse scenarios (such as a deep or severe economic recession). Through the CWST program, we can determine if actions need to be taken by management to maintain sufficient capital. The 2024 ORSA and Stress Testing exercise confirmed that, despite uncertainties in the Canadian economy, CMHC remains adequately capitalized to withstand financial stress, even under the extreme hypothetical market shocks assumed in the exercises. In addition, we confirm that the currently planned management actions ensure CMHC’s compliance with OSFI’s new supervisory framework for multi-unit mortgage insurance under the base projection. We continue to closely monitor current and emerging risks to safeguard CMHC’s financial resilience. OFSI Consultations and Guidelines The following announcements by the Office of the Superintendent of Financial Institutions (OFSI) took place in 2024, which affect CMHC: OSFI’s New Supervisory Framework On 8 February 2024, OSFI released its new supervisory framework for federally regulated financial institutions (FRFIs) and private pension plans. Officially implemented on 1 April 2024, the new framework is the most significant change to OSFI’s supervisory approach in 25 years and brings notable changes including: • expanding the 4-point risk rating scale to an 8-point scale which will provide an earlier indication of changes in OSFI’s risk assessment of their organizations; • including more information about the drivers of risk rating; and • introducing new risk assessment categories: business risk, financial resilience, operational resilience and risk governance, together with the integration of climate risk considerations. Guideline B-10 Third-Party Risk Management This guideline came into effect on 1 May 2024 and sets out associated risk expectations to manage third-party arrangements. Our Vendor Risk Management Program and related governance documents provide accountability, guidance and tools for effective third- party risk management practices by outlining the processes to identify, assess, treat (control), and monitor third-party risk exposure. Our third-party risk management practices have been aligned with the requirements of Guideline B-10 and will continue to enhance and embed in our operations. Guideline B-13 Technology and Cyber Risk Management In January 2024, this OFSI Guideline came into effect. It sets out expectations for the sound management of technology and cyber risk for FRFIs outlining expectations for financial institutions to compete effectively and take full advantage of digital innovation, while maintaining sound technology risk management. CMHC’s practices align to the principles of Guideline B-13. We continue to enhance processes to improve our maturity in this space. Consultation on draft Standardized Climate Scenario Exercise (SCSE) In December 2024, CMHC responded to a consultation on the draft SCSE — Phase 2 (Phase 1 was completed in December 2023). The SCSE aims to increase FRFIs’ understanding of their potential exposures to climate-related risks. It also aims to build their capacity to conduct climate scenario analysis and risk assessments. As a fully standardized exercise, the SCSE will also give OSFI a comparable quantitative assessment of climate-related risks across FRFIs. OSFI used feedback from the first phase of the SCSE consultation to update the draft methodology, create a draft workbook with a set of instructions, and produce a “What We Heard” report. Guideline for Assurance on Capital, Leverage and Liquidity Returns In July 2024, OSFI revised this Guideline, which seeks to inform external auditors and institutions on the work to be performed on their regulatory returns to enhance and align OSFI’s assurance expectations across all FRFIs. Regulatory returns are key contributors to the assessment of the soundness of a FRFI. Beginning in Q1 2024, reviews and senior management attestations will be provided on the accuracy and completeness of the MICAT Cover schedule on a quarterly basis. 2024 Annual Report 37

Updates to policies, guidelines and processes will be introduced as required to meet OSFI’s requirements. As part of adopting the Basel III reforms and International Financial Reporting Standard (IFRS) 17, OSFI has enhanced and aligned assurance expectations on the capital, leverage and liquidity returns for banks and insurers. For banks, the scope now includes liquidity metrics in addition to capital and leverage metrics. For insurers, the scope now includes an internal audit opinion in addition to the management attestation and external audit opinion. Guideline E-21 Operational Risk Management and Resilience (ORR) On 22 August 2024, OSFI published this Guideline, which sets expectations for financial institutions to prepare for and recover from severe disruptive events. It enhances expectations for operational risk management and establishes new ones related to operational resilience, business continuity risk management, crisis management, change management and data risk management. Financial institutions are expected to immediately adhere to operational risk management expectations in the Guideline (Sections 1 and 2), however, there is a phased implementation approach for other expectations with full adherence and operationalization expected by 1 September 2026. CMHC has developed a plan to be compliant by the effective date. Minimum Qualifying Rate (MQR) Effective 21 November 2024, OSFI announced that it no longer requires a set MQR for uninsured straight switches at renewal. This applies when a borrower switches their uninsured mortgage from one federally regulated lender to another with no increase to the amortization period, nor the loan amount. While this is mainly applicable to Lenders, CMHC must continue to apply Guideline B-20, sound mortgage underwriting principles. Regulatory Notice on Culture Risk Management On 21 November 2024, OSFI released this Regulatory Notice, effective immediately. This notice sets expectations for managing culture risk in areas of governance and enterprise-wide culture management. OSFI will use regulatory judgement as to when they will start testing/ performing industry reviews. This is a regulatory notice, which is considered quick and temporary guidance to be repealed or included in a guideline in the future. The future state is to be determined. A previous consultation process in Q2 2023 revealed that CMHC is adequately aligned with these expectations. International Financial Reporting Standard (IFRS) 17 Guideline On 21 November 2024, OSFI published this Guideline which replaces the IFRS 17 Advisory and brings together existing accounting expectations, removes redundant information, clarifies accounting expectations and addresses specific comparability concerns. There was no new guidance added. Future Changes to Accounting Standards The following new standard issued by the International Accounting Standards Board (IASB) and effective 1 January 2027 has been assessed as having a material impact on the Corporation in the future. In addition to the standard discussed below, other new or amended International Financial Reporting Standards (IFRS) being assessed are disclosed in Note 3 of our 2024 audited consolidated financial statements. IFRS 18 Presentation and Disclosure in the Financial Statements – effective date of 1 January 2027 In April 2024, the IASB issued IFRS 18 Presentation and Disclosure in the Financial Statements, which will replace IAS 1 Presentation of Financial Statements, effective 1 January 2027. IFRS 18 will not affect how our financial performance is measured but will affect the presentation of our financial statements and our disclosure requirements for some of our Notes to Consolidated Financial Statements. Under IFRS 18, there will be a new Statement of Income and Comprehensive Income presentation and additional disclosure requirements including management performance measures. We will evaluate where we will need to change our existing accounting and reporting processes as a result of IFRS 18. We have assembled a project team dedicated to analyzing and implementing the new accounting standard, and development of a detailed project plan is underway. We are currently assessing the potential impact of this new standard on our consolidated financial statements. 2024 Annual Report 38

2024 Climate- Related Financial Risk Disclosures CMHC continues to advance the alignment of its climate risk management practices and disclosures to expectations for climate risk management and climate-related financial disclosures set out by the Office of the Superintendent of Financial Institutions (OSFI) in its published Guideline B-15 Climate Risk Management and the former Task-Force on Climate-related Financial Disclosures (TCFD) by the Financial Stability Board, now managed by the IFRS Foundation. We also monitor global standards set out by the International Sustainability Standards Board (ISSB): IFRS S1 General Requirements for Disclosure of Sustainability related Financial Information; and IFRS S2 Climate-related Disclosures. We are not currently required to report against requirements issued by the ISSB. In December 2024, the Canadian Sustainability Standards Board (CSSB) issued its inaugural Canadian Sustainability Disclosure Standards (CSDS) CSDS 1 General Requirements for Disclosure of Sustainability related Financial Information and CSDS 2 Climate-related Disclosures. We are not currently required to report against requirements issued by the CSSB and have not yet assessed the impact of these standards on our climate-related financial disclosures. In 2024, the Government of Canada updated its Greening Government Strategy (GGS) with an expectation for crown corporations to align with the GGS. CMHC continues to adapt its practices in respect of climate-resilience and green operations. We will do this by developing a climate transition plan to establish clear and measurable steps toward emissions reductions, using internationally recognized methodologies such as the Greenhouse Gas Protocol, and establishing processes that seek to enhance climate resilience within our services and activities. The following section describes the actions we are taking to integrate climate considerations across the four categories of climate risk management: governance, strategy, risk management and metrics and targets as outlined in OSFI’s B-15 Guideline and TCFD recommendations. 2024 Annual Report 39
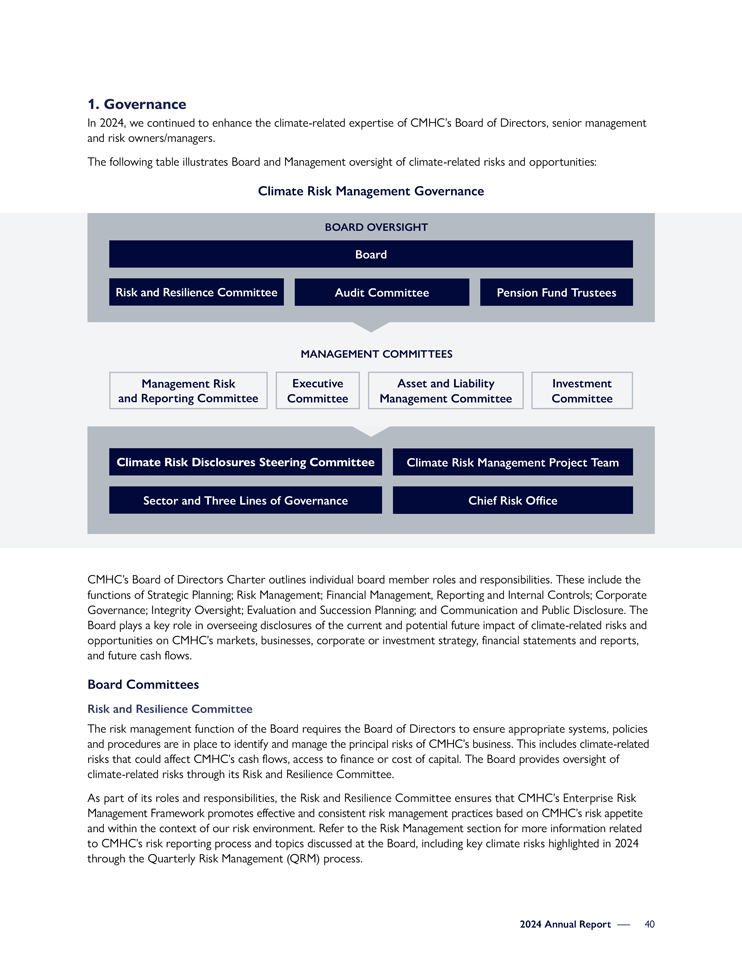
1. Governance In 2024, we continued to enhance the climate-related expertise of CMHC’s Board of Directors, senior management and risk owners/managers. The following table illustrates Board and Management oversight of climate-related risks and opportunities: Climate Risk Management Governance BOARD OVERSIGHT Board Risk and Resilience Committee Audit Committee Pension Fund Trustees MANAGEMENT COMMITTEES Management Risk Executive Asset and Liability Investment and Reporting Committee Committee Management Committee Committee Climate Risk Disclosures Steering Committee Climate Risk Management Project Team Sector and Three Lines of Governance Chief Risk Office CMHC’s Board of Directors Charter outlines individual board member roles and responsibilities. These include the functions of Strategic Planning; Risk Management; Financial Management, Reporting and Internal Controls; Corporate Governance; Integrity Oversight; Evaluation and Succession Planning; and Communication and Public Disclosure. The Board plays a key role in overseeing disclosures of the current and potential future impact of climate-related risks and opportunities on CMHC’s markets, businesses, corporate or investment strategy, financial statements and reports, and future cash flows. Board Committees Risk and Resilience Committee The risk management function of the Board requires the Board of Directors to ensure appropriate systems, policies and procedures are in place to identify and manage the principal risks of CMHC’s business. This includes climate-related risks that could affect CMHC’s cash flows, access to finance or cost of capital. The Board provides oversight of climate-related risks through its Risk and Resilience Committee. As part of its roles and responsibilities, the Risk and Resilience Committee ensures that CMHC’s Enterprise Risk Management Framework promotes effective and consistent risk management practices based on CMHC’s risk appetite and within the context of our risk environment. Refer to the Risk Management section for more information related to CMHC’s risk reporting process and topics discussed at the Board, including key climate risks highlighted in 2024 through the Quarterly Risk Management (QRM) process. 2024 Annual Report 40
Audit Committee The Audit Committee assists the Board of Directors in fulfilling its oversight responsibilities, including financial reporting, audit processes, and internal controls. The committee oversees the establishment of an internal controls framework and ensures that management implements and maintains appropriate policies and systems of internal controls. The committee also ensures that adequate policies, measures and practices are in place to identify, assess and manage risks throughout CMHC, including climate. Pension Fund Trustees The Pension Fund Trustees manage and administer, at the direction of the Board, all aspects of the Pension Fund (Fund), including ensuring that all the risks, including climate, are identified and managed. The Trustees also review and recommend to the Board, any changes to the Statement of Investment Principles and Beliefs, any CMHC risk policies applicable to the Fund, and the Annual Report, including the climate related financial disclosures report. Management Committees Management Risk and Reporting Committee The Management Risk and Reporting Committee (MRRC) meets at least monthly and reviews, assesses, approves (as required), and oversees key enterprise risks and trends, including the implementation of climate-risk management frameworks and requirements. The committee’s membership is comprised of members of the Executive Committee. Executive Committee The Executive Committee (ExCo) meets bi-weekly and supports the Board of Directors with developing the organization’s strategy and priorities. It is also responsible for the strategy execution and monitors performance metrics. The committee monitors the organization’s budget and financial results as well as approves key projects, including scope, benefits and related investment. Where directed by the President/CEO, ExCo provides strategic direction regarding climate-related risks and opportunities. The committee is comprised of the President/CEO and senior leadership from Finance, Risk, Insurance and Securitization, Housing Programs, Corporate Affairs and Policy, Business Transformation, Housing Insights, and People and Culture. Asset and Liability Management Committee The Asset and Liability Management Committee (ALCO) reviews and approves key assumptions, methodologies, models, limitations, and recommends approval to the Board of Directors and its committees on matters related to the management of financial related risks, including climate-related risks. As a transversal risk, climate risk may impact the organization through a range of financial risk categories. Any impacts to our financial position because of climate-related risks would be communicated to this committee. The committee meets twice per quarter and is comprised of senior leadership in Insurance and Securitization, Investments and Treasury, Housing Programs, Finance, Risk, Actuarial Services and Audit and Evaluation. On a quarterly basis, the committee chair reports committee activities to the MRRC. Investment Committee The Investment Committee is an advisory group to the Vice-President, Investments and Treasury on matters related to the investment management of the Insurance and Securitization Investment Portfolios. Specifically related to climate risk, the Investment Committee reviews asset allocation recommendations from the Investments and Treasury team that are grounded in analysis of potential climate-related impacts under multiple scenarios. The committee meets at least four times per year and is comprised of senior leadership from Investments and Treasury, Oversight and Risk Analytics, Finance, and Risk Management, Strategy and Products. Climate Risk Disclosures Steering Committee This committee provides guidance and direction on CMHC’s Climate Risk Management project. The goal is to enhance CMHC’s climate-related management and disclosure capabilities for alignment with TCFD recommendations and OSFI’s B-15 guideline requirements and timelines. It is also meant to ensure the existing company infrastructure (corporate governance, risk management processes, strategic and financial planning and decision-making) is aligned to advance climate-related risks and opportunities management in the organization. 2024 Annual Report 41

The committee met monthly in 2024 and was comprised of membership from Finance, Chief Risk Office, Insurance and Securitization and Housing Programs. The committee reports to the MRRC and ALCO committees, to leverage specific expertise or decision-making authority when required. Board and Senior Management Skills and Competencies Board and Senior Management Literacy Sessions To ensure the Board and Senior Management are equipped with the necessary knowledge to effectively manage climate- related risk, climate risk literacy sessions were held with the Board and MRRC. Session topics included updates on: • CMHC climate-related risks and potential opportunities. • Reporting and regulatory requirements. • Progress of the CMHC Climate Risk Management project. In addition to the above, workshops were held with CMHC’s sector risk experts (First Line of Defence). Topics covered included: • Reporting and regulatory requirements. • Roles and responsibilities for the sector risk experts. • Assessment of climate-related risks. • Reporting of climate-related risks in QRM reports. Board Expertise in Risk Management In 2024, CMHC updated its Competency, Diversity and Location matrix for its Board of Directors. 55% of CMHC’s current Board members have professional experience in risk management including in complex financial risks, clients or activities. Our current board chair has significant experience in climate risk matters and serves on the Expert Panel on Adaptation at the Canadian Climate Institute. Board Remuneration As a crown corporation, CMHC’s Board members’ remuneration is determined by the Privy Council Office (PCO) and is outlined in CMHC’s Board Remuneration and Expense Guidelines. Currently, climate-related considerations are not directly factored into Board members’ remuneration. 2024 Annual Report 42
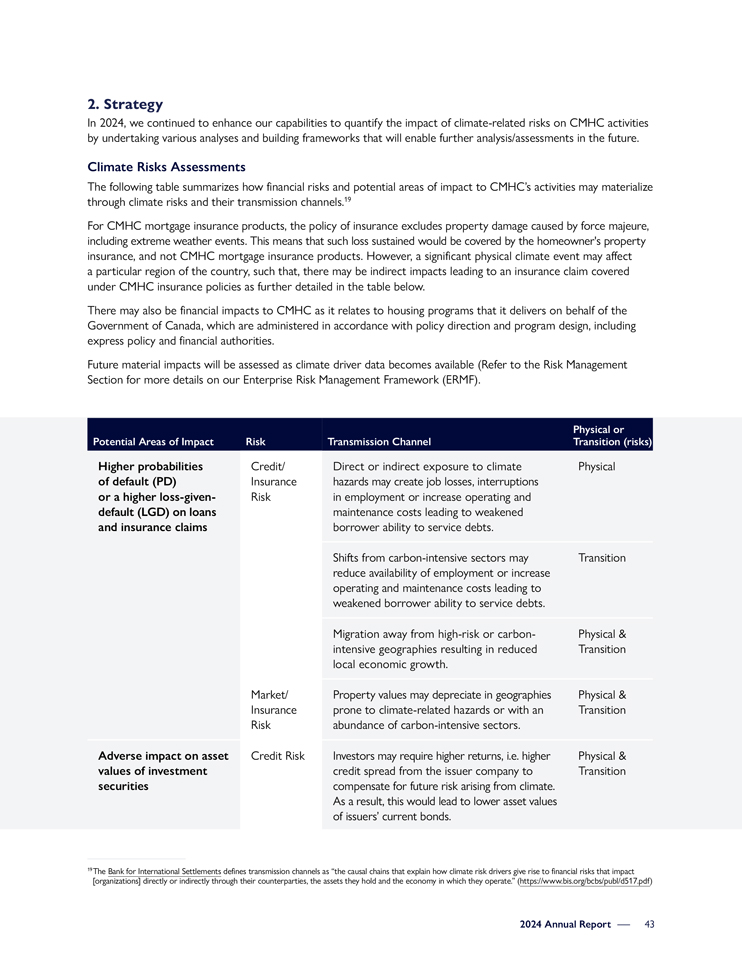
2. Strategy In 2024, we continued to enhance our capabilities to quantify the impact of climate-related risks on CMHC activities by undertaking various analyses and building frameworks that will enable further analysis/assessments in the future. Climate Risks Assessments The following table summarizes how financial risks and potential areas of impact to CMHC’s activities may materialize through climate risks and their transmission channels.19 For CMHC mortgage insurance products, the policy of insurance excludes property damage caused by force majeure, including extreme weather events. This means that such loss sustained would be covered by the homeowner’s property insurance, and not CMHC mortgage insurance products. However, a significant physical climate event may affect a particular region of the country, such that, there may be indirect impacts leading to an insurance claim covered under CMHC insurance policies as further detailed in the table below. There may also be financial impacts to CMHC as it relates to housing programs that it delivers on behalf of the Government of Canada, which are administered in accordance with policy direction and program design, including express policy and financial authorities. Future material impacts will be assessed as climate driver data becomes available (Refer to the Risk Management Section for more details on our Enterprise Risk Management Framework (ERMF). Physical or Potential Areas of Impact Risk Transmission Channel Transition (risks) Higher probabilities Credit/ Direct or indirect exposure to climate Physical of default (PD) Insurance hazards may create job losses, interruptions or a higher loss-given- Risk in employment or increase operating and default (LGD) on loans maintenance costs leading to weakened and insurance claims borrower ability to service debts. Shifts from carbon-intensive sectors may Transition reduce availability of employment or increase operating and maintenance costs leading to weakened borrower ability to service debts. Migration away from high-risk or carbon- Physical & intensive geographies resulting in reduced Transition local economic growth. Market/ Property values may depreciate in geographies Physical & Insurance prone to climate-related hazards or with an Transition Risk abundance of carbon-intensive sectors. Adverse impact on asset Credit Risk Investors may require higher returns, i.e. higher Physical & values of investment credit spread from the issuer company to Transition securities compensate for future risk arising from climate. As a result, this would lead to lower asset values of issuers’ current bonds. 19The Bank for International Settlements defines transmission channels as “the causal chains that explain how climate risk drivers give rise to financial risks that impact [organizations] directly or indirectly through their counterparties, the assets they hold and the economy in which they operate.” (https://www.bis.org/bcbs/publ/d517.pdf) 2024 Annual Report 43

Physical or Potential Areas of Impact Risk Transmission Channel Transition (risks) Claims on timely payment Liquidity Risk Large losses to small non-diversified financial Physical & guarantees from institutions with overly concentrated mortgage Transition vulnerable regional issuers portfolios in high-risk geographies. Satisfying payments Liquidity Risk Concentrated lending in hazard prone areas Physical & required by borrowings may lead to losses weakening ability to service Transition that support lending debt obligations. activities Prioritizing Climate Risks & Related Drivers In 2024, CMHC continued to focus on wildfire and flood as the priority physical risk drivers for our assessments to understand climate impacts to our business strategy and financial performance. In 2024, we made progress in measuring transition risk but acknowledge that there remain some methodological and data challenges (e.g., unavailability of high-quality data at industry level and information on building heating and energy sources) to overcome to assess the effects of transition risk on CMHC’s activities. We are also building expertise and alternative approaches to performing the assessments despite these limitations. As the data landscape improves and methodologies evolve, we will prioritize assessing the potential impact of carbon pricing, net-zero building codes and targets, and shifting consumer and investor preferences. These risk drivers were prioritized through a process which considered the potential for material impact on CMHC. This process included a literature review to determine a complete list of climate hazards and transition risks that might affect CMHC, given current climate data. The following criteria were considered in this process: • Frequency of event, using data from the Canadian National Disaster Database. • Total value of primary insurance claims, by single-event costs according to information available from the Insurance Bureau of Canada. • Government of Canada priorities expressed in National Adaptation Strategy, the National Risk Profile, and budgets. • Data availability. CMHC intends to revisit this process regularly to ensure we are appropriately identifying and managing climate risks to our activities. Exposure to Flood Risk In 2024, we continued to advance our analysis and further assess our flood risk exposure in the Mortgage Insurance (MI) and Mortgage Funding (MF) activities. CMHC’s exposures to riverine flood risks are calculated based on properties located in areas where probabilities of flooding are equal to or greater than 1 event in every 100 years. Assessment of our MI and MF activity exposure to flood hazards is foundational to informing our understanding of flood risks. We estimate the exposure as follows20: • Homeowner21 (Transactional and Portfolio) MI activity: 48,737 insured loans, totalling $8.5 billion, representing 3.6% of the insured in-force balance. At 6.5%, British Columbia has the highest % of units with flood risk exposure. • Multi-Unit MI activity: 1,045 insured loans, totalling $6.3 billion, representing 3.4% of the insured in-force balance. At 4.9%, Alberta has the highest % of units with flood risk exposure. • British Columbia has the highest insured outstanding balance in flood risk per unit, followed by Alberta and Manitoba. • MF activity: 83,427 securitized loans, totalling $20.5 billion, representing 3.8% of the overall balance of securitized loans. British Columbia has the highest exposure at approximately 6.1%. Note that CMHC is reviewing the methodology used in the calculation of flood risk exposure to ensure completeness and to quantify risk. This may lead to different results in the future. 20Results are based on the latest data available as of the end of Q2 2024. Estimates are based on loans that could be correctly geocoded or mapped (approximately 98% of homeowner loans, 99% of MU loans, 95% of NHA MBS securitized loans). 21Note that CMHC’s 2023 Annual Report only included Homeowner Transactional MI business. 2024 Annual Report 44

Developing Wildfire Hazard Maps In 2024, work was completed to develop wildfire hazard maps and estimate the effect of historical wildfire events on house prices. By combining open data sources on Tree Cover, Fire Season Length, and dryness of fuel sources from Natural Resources Canada and Environment and Climate Change Canada, a map was produced identifying those areas of Canada most at risk of wildfire events. In addition, historical wildfire events were also analysed to determine their impact on house prices. This work will continue to be refined in 2025 which will lead to publishing of exposure and impact numbers. Climate Resilience Climate Scenario Analysis in Mortgage Insurance Investments Strategic Asset Allocation (SAA) Process In 2024, CMHC subscribed to a third-party climate scenario solution to analyse various climate change scenarios and forecast expected returns of model portfolios under our MI activity. The solution generates potential financial impacts of climate risks and uncertainties on asset classes and markets in which they invest, by modeling climate risk transmission channels. The exercise involved obtaining investment returns for each of the MI portfolio’s underlying exposures. We considered four climate scenarios using standard assumptions, as outlined below: • Current Policies: Only currently implemented policies are preserved, leading to high physical risk. • Below 2 Degrees: Gradually increases the stringency of climate policies, giving a 67% chance of limiting global warming to below 2 degrees Celsius. • Delayed Transition: Annual emissions do not decrease until 2030. Strong policies are needed to limit warming to below 2 degrees Celsius. Negative emissions are limited. • Net Zero 2050: Limits global warming to 1.5 degrees Celsius through stringent climate policies and innovation, reaching global net zero CO emissions around 2050. 2 This analysis enabled us to incorporate climate risk into CMHC’s SAA process. The results of the analysis indicated that none of the portfolio options were disproportionally exposed to any climate scenario thus there was no recommendation for any changes to the proposed allocation weights. Additionally, we don’t perceive any material impact to the MI portfolio within the 10-year horizon covered by the SAA. We will review the data on an annual basis and suggest recommendations to mitigate climate risk if/when impacts become sufficiently material to warrant this. Climate Scenario Analysis in the Own Risk and Solvency Assessment process In 2024, we initiated the integration of climate risk into our Own Risk and Solvency Assessment (ORSA) process which applies to our MI and MF activities. This exercise aims to assess the feasibility and impact of climate scenarios on capital adequacy, ultimately ensuring compliance with regulatory expectations. Our approach involves leveraging third party scenarios similar to those described in the SAA process above. We are testing the third-party application with the goal of using it to assess the applicability of these scenarios to the ORSA framework and determine their feasibility in quantifying climate-related capital requirements. By fiscal year-end 2025, we will incorporate transition climate risk into our assessments and work towards integrating key physical climate risks (e.g., flood and wildfire) for CMHC’s MI and MF activities. Standardized Climate Scenario Exercise (SCSE) CMHC has participated in the OSFI SCSE. Our participation has been instrumental in enhancing our understanding and management of climate-related risks. CMHC is not a direct property insurer for flood or wildfire damages, however, the process enabled us to identify areas within our mortgage insurance portfolio that are vulnerable to riverine or coastal flooding and wildfires, helping us better understand our exposure to indirect risks in our MI activity. 2024 Annual Report 45

Operational Resilience Climate Risk Assessment for Critical Services In 2024, the Corporate Business Continuity Management (BCM) team performed climate risk assessments to evaluate the potential risk to CMHC’s mission critical services in the event of a material climate emergency or disaster. Risk was assessed by analyzing the geographical distribution (i.e. location) of staff supporting these services, and the potential disruption to the services. Each critical service was assigned a risk score based on the concentration index, corresponding to low, medium, high, or severe climate risk. In 2025, each sector will consider how operations/activities would continue in the event a climate disaster strikes regions for critical services with severe or high climate risk and put in place appropriate recovery strategies in the sector’s Business Continuity Plan to mitigate the risk. Business Continuity Management & Scenario Planning In 2024, the BCM Team conducted the annual training and tabletop exercise with our mission critical employees. Our mission critical employees are now more aware and prepared to respond to an emergency or disaster situation and mitigate climate risk in the most critical functions of the company. Opportunities We continue to offer products and programs that incentivize energy efficiency and greenhouse gas (GHG) emissions reductions. (Refer to the Housing Programs and Mortgage Insurance sections of this report for products and programs). In addition, for Housing Programs, CMHC will continue to work with Housing, Infrastructure and Communities Canada (HICC) and other government agencies on policy development, program design and authorities as it relates to climate-risks and promotion of building resilience and energy efficiency. Look Ahead • Advance integration of climate-related risk into the ORSA process. • Continue refining work around assessing impact of wildfire events. • Continue assessing impacts from climate-related physical (flood and wildfire) and transition risks on CMHC’s MI and MF activities. • Assess the exposure of climate-related physical (flood and wildfire) on CMHC’s Housing Programs activity. • Identify and assess potential climate-related risks in all stages of CMHC’s value chain (excluding those mentioned above), and physical risk drivers beyond flood and wildfire. • Identify and assess CMHC’s climate-related opportunities. 2024 Annual Report 46
3. Risk Management As a transversal risk, climate change will drive and exacerbate impacts of existing risks to the company. Therefore, we continue to enhance our understanding of how climate-related risks will impact strategic, financial, operational, and legal and compliance risks, and adjust our processes and policies to adequately address these risks. Managing Climate Risk CMHC defines climate risk as the risk resulting from the impact of climate drivers (physical and transition) on our business (operations, programs, commercial activities, investments, financial planning) and decision-making. CMHC’s risk appetite recognizes that consequences of climate-related risks can ultimately manifest as strategy, financial, operations, or reputation consequences or a combination thereof. The Risk Appetite Measure (RAM) limits in the Risk Appetite Framework (RAF) therefore help manage climate risk within our appetite (e.g., climate events that have financial impacts would be accounted for in the established limits set for our financial RAMs). In 2024, enterprise-level risk appetite was cascaded to CMHC’s MI activity. Risk Monitoring and Reporting The Enterprise Risk Management Framework (ERMF) establishes CMHC’s approach to the reporting of risks. More specifically, risk assessment results must be reported by the Chief Risk Officer (CRO) to Senior Management and the Board of Directors on a quarterly basis, through the QRM Report. The QRM Report provides an assessment of CMHC’s enterprise risk profile, including key risks and the effectiveness of risk mitigation and control activities. To incorporate climate risk content into QRM reports, a cross-functional Climate Risk Panel was established in 2024 with subject matter expert representation from CMHC’s risk oversight teams and business areas. The Panel helps identify the extent to which climate risk drivers are impacting CMHC and supports the integration of climate risk content into QRM reports. Key climate risks highlighted in 2024 include the increasing frequency of natural disasters, putting upward pressure on construction and property insurance costs through increased claims. These would result in higher homeownership expenses and exacerbate housing supply and affordability conditions. Operational Risk Assessments In 2024, we integrated climate risk drivers into our operational risk assessment and risk event analysis tools by including both climate physical and transition risks as risk drivers which will now be considered through our risk and control self-assessment activities (RCSAs) and risk event analysis performed by our sector risk experts. These were mapped to the existing risk categories within our ERMF. This will ensure accurate data inputs can be made and will allow for effective climate risk monitoring. This integration will also enhance our ability to proactively manage emerging climate risks and consider climate in risk event analysis. 2024 Annual Report 47

Integration of climate risk into the Enterprise Risk Management Framework (ERMF) and Risk Taxonomy In 2024, we identified the risk categories in our new Risk Taxonomy that are most likely to be impacted by climate risk drivers, considering the transversal nature of climate risk. Risk taxonomy and climate risk mapping (Levels 1, 2, and 3)22,23 Strategic Financial Operational Legal and Compliance Service/Product Design Strategic Development Credit Compliance and Execution External disclosure Strategy definition Default Process Design (other than financial) Internal and external Corporate governance Counterparty Regulatory Compliance disclosure Insurance Internal reporting Legal External financial Pricing Litigation & Dispute disclosure Organizational Liquidity resilience Market Liquidity Third party Market Technology Interest Rate People and Talent Capital Adequacy Physical health and Safety Required Capital Model Available Capital Fraud Climate risks & Reputational Impacts (transversal to the organization’s risk universe) Level 1 Risks Level 2 Risks Level 3 Risks 22This chart does not represent CMHC’s full Risk Taxonomy, but rather only those categories identified as most likely to be impacted by climate risk drivers. 23Our risk taxonomy is structured by top level risk categories (Level 1), risk sub-categories (Level 2), and specific risk categories (Level 3). 2024 Annual Report 48
Look Ahead • The development of a stand-alone climate risk policy started in the fourth quarter of 2024 to strengthen climate risk management practices. Approval of the policy is expected in the first half of 2025. • In advancing our efforts in climate risk management, CMHC will cascade enterprise-level risk appetite to CMHC’s MF activity in 2025. 4. Metrics and Targets Since 2005, CMHC has gathered and disclosed our performance on environmental metrics and targets. In 2024, we expanded our capabilities to measure and report on Scope 3 GHG emissions from the following activities within our value chain: purchased goods and services (IT operations), waste generated in operations, business travel, and employee commuting. The following summarizes progress towards achievement of CMHC’s established reduction goals. Net-Zero Commitment As a Crown corporation, we align our operational goals to improve our environmental footprint to directives stipulated in the Greening Government Strategy, overseen by the Treasury Board of Canada Secretariat. The current federal government strategy describes how the government will reduce its environmental impact and transition to low carbon, climate resilient operations. These specific targets align with the Paris Agreement. Our absolute emissions reductions targets include: • 40% reduction from 2005 (baseline) levels by 2025. • Aspire to achieve subsequent 10% reductions every five years to reach at least 90% by 2050 without the use of carbon credits/offsets. • Reduction to net zero by 2050. • The purchase of carbon credits/offsets may be used as needed to address any remaining emissions to reach the 2050 net zero goal. CMHC calculates its GHG emissions in alignment with the Greenhouse Gas Protocol. CMHC uses the financial control approach to define its organizational boundary because this approach aligns best with the consolidation approach adopted for our financial reporting. Under this approach, CMHC accounts for all GHG emissions from operations over which CMHC has financial control (CMHC and the Canada Housing Trust). Refer to the CMHC Pension Plan climate report within its annual report for more details on GHG emissions associated with the plan. In measuring our GHG emissions, we use assumptions and extrapolations derived from the best available activity data and rely on third-party sources for various inputs. We are not able to foresee or predict the information from third- party sources. Thus, changes to the assumptions and amounts that affect the information we receive from third parties could materially change in future periods. Scope 1 and 2 Greenhouse Gas Emissions Annual greenhouse gas emissions for the 700 Montreal Road site are calculated by summing the billed energy consumption from the utility providers and multiplying the annual consumption by emission factors specific to each utility. For utility bills that have consumption spanning two different reporting years, the consumption in the current reporting periods is estimated by calendarizing the consumption data assuming equal daily use for the overlap period. Emission factors are updated annually and are obtained from Environment Canada’s latest annual National Inventory Report. For the 2024 reporting year we are at an approximately 68% reduction over the 2005 baseline levels which has surpassed the aspiration of a 40% reduction by 2025. Some of these reductions can be attributed to reduced building usage and efficiencies achieved through retrofits and renovations. From 2023 to 2024 we saw an annual decrease of 22% in Scope 124 and 225 emissions. The annual reduction can be attributed to annual consumption of electricity decreasing from the previous year, driven by retrofits and renovations and a change in Ontario’s electrical emission factor. 24Scope 1 refers a company’s direct emissions produced on-site from the combustion of owned or controlled sources for example, for heating or cooling buildings. 25Scope 2 refers to indirect emissions from electricity, heat, or steam purchased by a company that are produced by a utility provider. 2024 Annual Report 49
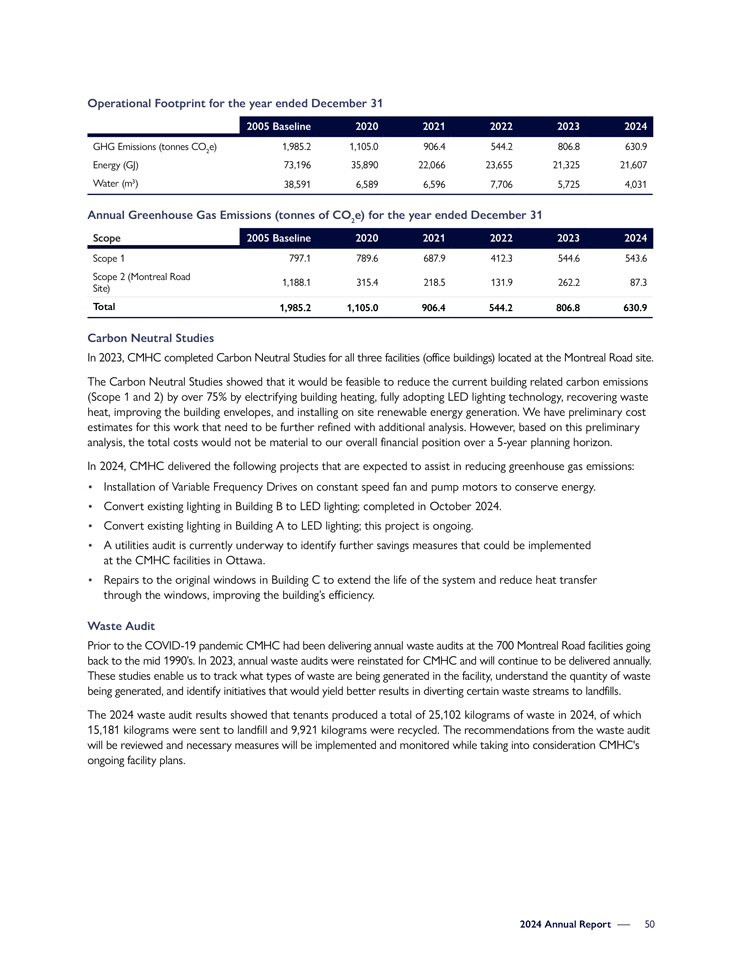
Operational Footprint for the year ended December 31 2005 Baseline 2020 2021 2022 2023 2024 GHG Emissions (tonnes CO e) 1,985.2 1,105.0 906.4 544.2 806.8 630.9 2 Energy (GJ) 73,196 35,890 22,066 23,655 21,325 21,607 Water (m3) 38,591 6,589 6,596 7,706 5,725 4,031 Annual Greenhouse Gas Emissions (tonnes of CO e) for the year ended December 31 2 Scope 2005 Baseline 2020 2021 2022 2023 2024 Scope 1 797.1 789.6 687.9 412.3 544.6 543.6 Scope 2 (Montreal Road 1,188.1 315.4 218.5 131.9 262.2 87.3 Site) Total 1,985.2 1,105.0 906.4 544.2 806.8 630.9 Carbon Neutral Studies In 2023, CMHC completed Carbon Neutral Studies for all three facilities (office buildings) located at the Montreal Road site. The Carbon Neutral Studies showed that it would be feasible to reduce the current building related carbon emissions (Scope 1 and 2) by over 75% by electrifying building heating, fully adopting LED lighting technology, recovering waste heat, improving the building envelopes, and installing on site renewable energy generation. We have preliminary cost estimates for this work that need to be further refined with additional analysis. However, based on this preliminary analysis, the total costs would not be material to our overall financial position over a 5-year planning horizon. In 2024, CMHC delivered the following projects that are expected to assist in reducing greenhouse gas emissions: • Installation of Variable Frequency Drives on constant speed fan and pump motors to conserve energy. • Convert existing lighting in Building B to LED lighting; completed in October 2024. • Convert existing lighting in Building A to LED lighting; this project is ongoing. • A utilities audit is currently underway to identify further savings measures that could be implemented at the CMHC facilities in Ottawa. • Repairs to the original windows in Building C to extend the life of the system and reduce heat transfer through the windows, improving the building’s efficiency. Waste Audit Prior to the COVID-19 pandemic CMHC had been delivering annual waste audits at the 700 Montreal Road facilities going back to the mid 1990’s. In 2023, annual waste audits were reinstated for CMHC and will continue to be delivered annually. These studies enable us to track what types of waste are being generated in the facility, understand the quantity of waste being generated, and identify initiatives that would yield better results in diverting certain waste streams to landfills. The 2024 waste audit results showed that tenants produced a total of 25,102 kilograms of waste in 2024, of which 15,181 kilograms were sent to landfill and 9,921 kilograms were recycled. The recommendations from the waste audit will be reviewed and necessary measures will be implemented and monitored while taking into consideration CMHC’s ongoing facility plans. 2024 Annual Report 50

Scope 3 Greenhouse Gas Emissions We calculate and report CMHC’s operational Scope 3 GHG emissions using calculation methods stipulated in the GHG Protocol’s Technical Guidance for calculating Scope 3 Emissions. These methods involve collecting internal activity data then converting that data into GHG emissions using regional or international emission factors that best represent specific activities or collecting emissions data from third-party data providers. If necessary, we apply Global Warming Potential (GWP) values sourced from the Intergovernmental Panel on Change (IPCC) to convert GHG emissions to carbon dioxide equivalent (CO e). 2 Key assumptions made for business travel include assuming that flight distances are from departure airport to destination airport, defining flight haul types as such: <450km: Domestic, 450km—3700km: Short-haul, >3700km: Long-haul, all rental cars are petrol fueled, and classifying all air and rail travelers as average passengers. For employee commuting, we assume that all commuting is done from employees’ home address to their assigned office, commuting frequency is dependent on employee position type (hybrid, onsite, etc.), all cars are petrol fueled and there is no carpooling. Annual Operational Scope 3 Greenhouse Gas emissions The table below shows the operational Scope 3 GHG emissions measured to date. CMHC has not established a Scope 3 base year because Scope 3 inventory isn’t sufficiently complete to date. We will also report on trends in scope 3 emissions once our scope 3 inventory is sufficiently complete. Scope 3 GHG emissions (tonnes of CO e) 2 Operational Scope 3 GHG emissions by category for the year ended December 31, 2024 Category 1: Purchased goods and services (IT Emissions) 3.0 Category 5: Waste generated in operations (Montreal Road Site) 10.5 Category 6: Business travel 1,049.6 Category 7: Employee commuting 630.4 Total operational Scope 3 GHG emissions 1,693.5 The following Scope 3 categories are applicable to CMHC’s activities, but their measurement has not been completed to date; • Category 1: Purchased good and services (excluding IT emissions mentioned above) • Category 2: Capital goods • Category 4: Upstream transportation and distribution • Category 5: Waste generated in operations (excluding those for the Montreal Road site) • Category 8: Upstream leased assets • Category 15: Investments (excluding those reported in the section below for the MI activity) Other Scope 3 categories are not included in CMHC’s GHG inventory because they are not applicable to CMHC activities. 2024 Annual Report 51

Emissions from Mortgage Insurance Investment Portfolio (Financed Emissions) In 2024, we continued to expand our capabilities to measure and report on the emissions of our investment portfolio in the MI activity to include investments in sub-sovereign debt. We calculate and report the emissions from our investment activities in accordance with the Partnership for Carbon Accounting Financials (PCAF). Emissions from our debt investments are determined through corporate disclosures and third-party data of those entities currently not disclosing information. PCAF sets guidelines on approach for climate reporting calculations by asset class. We leverage data from third-party data providers for corporate sub- sovereign and sovereign debt reporting. Data limitation and availability is still a challenge that the industry is facing but it has been improving every year. For corporate debts where data is missing, we assume that the third-party estimate is a good proxy of company’s climate risk. For sovereign debt emissions reporting, we assume a linear extrapolation of emissions based on the most recent update since the third-party data is refreshed every 5-10 years. For corporate debt, the relative decrease in Weighted Average Carbon Intensity (WACI) and Carbon Footprint between 2023 and 2024 is due to modest changes in our sector allocation. For sovereign debt, the relative increase in emissions is mainly due to shrinkage in purchasing power parity (PPP) adjusted gross domestic product (GDP) over the last year as well as an update in the source of GDP data. Emissions from Debt Portfolios for Mortgage Insurance Activity Total Carbon Current Value Emissions Weighted of Investment (million tonnes Carbon Average Carbon ($ billion) of CO e) Footprint* Intensity** 2 Portfolio Carbon Footprint for the year ended December 31 2024 2023 2024 2023 2024 2023 2024 2023 Corporate Debt 7.9 7.1 0.46 0.58 58 82 120 138 Sovereign Debt 7.9 6.4 1.77 1.40 323 290 N/A N/A Sub-Sovereign Debt 3.3 3.2 0.61 N/A*** 268 N/A N/A N/A *Carbon Footprint: Total carbon emissions for a portfolio normalized by total market value of portfolio **Weighted Average Carbon Intensity (WACI): Portfolio’s relative exposure to carbon-intensive industries ***N/A represents emissions not measured due to the lack of data or methodology in the respective reporting period or a metric that’s not applicable to a specific asset class 2024 Annual Report 52
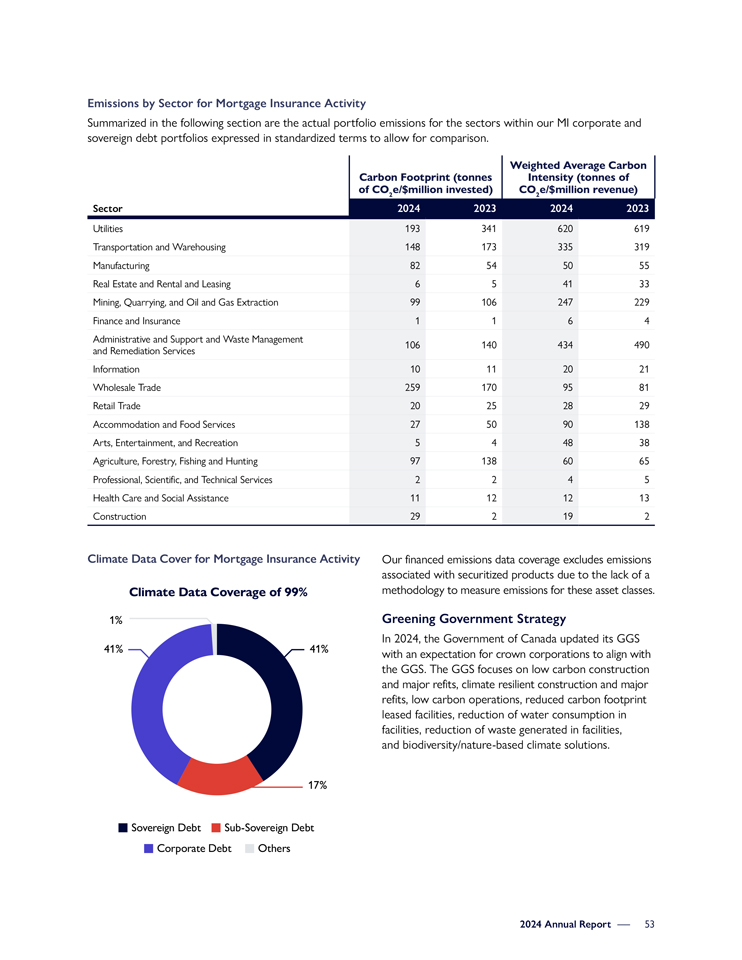
Emissions by Sector for Mortgage Insurance Activity Summarized in the following section are the actual portfolio emissions for the sectors within our MI corporate and sovereign debt portfolios expressed in standardized terms to allow for comparison. Weighted Average Carbon Carbon Footprint (tonnes Intensity (tonnes of of CO e/$million invested) CO e/$million revenue) 2 2 Sector 2024 2023 2024 2023 Utilities 193 341 620 619 Transportation and Warehousing 148 173 335 319 Manufacturing 82 54 50 55 Real Estate and Rental and Leasing 6 5 41 33 Mining, Quarrying, and Oil and Gas Extraction 99 106 247 229 Finance and Insurance 1 1 6 4 Administrative and Support and Waste Management 106 140 434 490 and Remediation Services Information 10 11 20 21 Wholesale Trade 259 170 95 81 Retail Trade 20 25 28 29 Accommodation and Food Services 27 50 90 138 Arts, Entertainment, and Recreation 5 4 48 38 Agriculture, Forestry, Fishing and Hunting 97 138 60 65 Professional, Scientific, and Technical Services 2 2 4 5 Health Care and Social Assistance 11 12 12 13 Construction 29 2 19 2 Climate Data Cover for Mortgage Insurance Activity Our financed emissions data coverage excludes emissions associated with securitized products due to the lack of a Climate Data Coverage of 99% methodology to measure emissions for these asset classes. 1% Greening Government Strategy In 2024, the Government of Canada updated its GGS 41% 41% with an expectation for crown corporations to align with the GGS. The GGS focuses on low carbon construction and major refits, climate resilient construction and major refits, low carbon operations, reduced carbon footprint leased facilities, reduction of water consumption in facilities, reduction of waste generated in facilities, and biodiversity/nature-based climate solutions. 17% Sovereign Debt Sub-Sovereign Debt Corporate Debt Others 2024 Annual Report 53

The following initiatives have been completed and/or are planned to address the GGS commitments: • CMHC is continuing to measure and report on GHG emissions, including Scope 3 emissions. • CMHC is continuing to track progress and develop waste reduction programs targeted to areas of poor diversion identified in the annual audits. Refer to the Waste Audit section for details. • CMHC has completed the major renovation of Building C at the Montreal Road Site which incorporated extensive upgrades to the building HVAC and lighting systems which have significantly contributed to low carbon operations. Refer to the Carbon Neutral Studies section for details. • CMHC has incorporated water efficient plumbing fixtures throughout Building C at the Montreal Road Site which have significantly reduced water use in the building. • We have performed climate risk assessments to evaluate the potential risk to CMHC’s mission critical services in the event of a material climate emergency or disaster. Refer to the Climate Risk Assessment for Critical Services section above. Look Ahead • Advance measurement of Scope 3 GHG emissions. • Advance implementation of recommendations from the Carbon Neutral Studies and waste audits, including installation of solar panels, energy recovery ventilators and electrification of the heating system in Building B. • Initiate measurement of the GHG emissions from CMHC’s Housing Programs and MF Investments. 2024 Annual Report 54

| Management’s Responsibility for Financial Reporting | 56 | |||||
| Independent Auditors’ Report | 57 | |||||
| Consolidated Balance Sheet | 59 | |||||
| Consolidated Statement of Income and Comprehensive Income | 60 | |||||
| Consolidated Statement of Equity of Canada | 61 | |||||
| Consolidated Statement of Cash Flows | 62 | |||||
| Notes to Consolidated Financial Statements | 63 | |||||
| 1. Corporate Information |
63 | |||||
| 2. Basis of Preparation and Material Accounting Policy Information |
63 | |||||
| 3. Current and Future Accounting Changes |
79 | |||||
| 4. Critical Judgments in Applying Accounting Policies and Making Estimates |
80 | |||||
| 5. Segmented Information |
84 | |||||
| 6. Government Funding and Housing Programs Expenses |
87 | |||||
| 7. Mortgage Insurance |
88 | |||||
| 8. Mortgage Funding |
97 | |||||
| 9. Structured Entities |
98 | |||||
| 10. Capital Management |
99 | |||||
| 11. Fair Value Measurement |
102 | |||||
| 12. Cash and Cash Equivalents |
108 | |||||
| 13. Investment Securities |
109 | |||||
| 14. Loans |
111 | |||||
| 15. Borrowings |
115 | |||||
| 16. Derivatives |
117 | |||||
| 17. Financial Instruments Income and Expenses |
118 | |||||
| 18. Market Risk |
119 | |||||
| 19. Credit Risk |
122 | |||||
| 20. Liquidity Risk |
126 | |||||
| 21. Accounts Receivable and Other Assets |
128 | |||||
| 22. Investment Property |
128 | |||||
| 23. Accounts Payable and Other Liabilities |
128 | |||||
| 24. Pension and Other Post-Employment Benefits |
129 | |||||
| 25. Income Taxes |
135 | |||||
| 26. Related Party Transactions |
137 | |||||
| 27. Commitments and Contingent Liabilities |
138 | |||||
| 28. Operating Expenses |
138 | |||||
| 29. Current and Non-Current Assets and Liabilities |
139 | |||||
2024 Annual Report — 55
Management’s Responsibility for Financial Reporting
Year ended 31 December 2024
Management is responsible for the integrity and objectivity of the consolidated financial statements and related financial information presented in this annual report. The consolidated financial statements have been prepared in accordance with International Financial Reporting Standards (IFRS) and, consequently, include amounts which are based on the best estimates and judgment of Management. The financial information contained elsewhere in this Annual Report is consistent with that in the consolidated financial statements.
In carrying out its responsibilities, Management maintains appropriate financial systems and related internal controls to provide reasonable assurance that financial information is reliable; assets are safeguarded; transactions are properly authorized and are in accordance with the relevant legislation, by-laws of the Corporation and Government directives; resources are managed efficiently and economically; and operations are carried out effectively. The system of internal controls is assessed by internal audit, which conducts periodic audits of different aspects of the operations.
The Board of Directors, acting through the Audit Committee whose members are neither officers nor employees of the Corporation, oversees Management’s responsibilities for financial reporting and internal control systems. The Board of Directors, upon the recommendation of the Audit Committee, has approved the consolidated financial statements.
Ernst & Young LLP and the Auditor General of Canada have audited the consolidated financial statements. The auditors have full access to, and meet periodically with, the Audit Committee to discuss their audit and related matters.

|

| |
| Coleen Volk, CPA | Michel Tremblay, CPA | |
| President and Chief Executive Officer | Chief Financial Officer and Senior Vice President, | |
| Corporate Services | ||
| 19 March 2025 | ||
2024 Annual Report — 56
INDEPENDENT AUDITORS’ REPORT
To the Minister of Housing, Infrastructure and Communities
Report on the Audit of the Consolidated Financial Statements
Opinion
We have audited the consolidated financial statements of Canada Mortgage and Housing Corporation and its subsidiary (the Group), which comprise the consolidated balance sheet as at 31 December 2024, and the consolidated statement of income and comprehensive income, consolidated statement of equity of Canada and consolidated statement of cash flows for the year then ended, and notes to the consolidated financial statements, including material accounting policy information.
In our opinion, the accompanying consolidated financial statements present fairly, in all material respects, the consolidated financial position of the Group as at 31 December 2024, and its consolidated financial performance and its consolidated cash flows for the year then ended in accordance with IFRS Accounting Standards as issued by the International Accounting Standards Board (IASB).
Basis for Opinion
We conducted our audit in accordance with Canadian generally accepted auditing standards. Our responsibilities under those standards are further described in the Auditors’ Responsibilities for the Audit of the Consolidated Financial Statements section of our report. We are independent of the Group in accordance with the ethical requirements that are relevant to our audit of the consolidated financial statements in Canada, and we have fulfilled our other ethical responsibilities in accordance with these requirements. We believe that the audit evidence we have obtained is sufficient and appropriate to provide a basis for our opinion.
Other Information
Management is responsible for the other information. The other information comprises the information included in the annual report, but does not include the consolidated financial statements and our auditors’ report thereon.
Our opinion on the consolidated financial statements does not cover the other information and we do not express any form of assurance conclusion thereon.
In connection with our audit of the consolidated financial statements, our responsibility is to read the other information and, in doing so, consider whether the other information is materially inconsistent with the consolidated financial statements or our knowledge obtained in the audit, or otherwise appears to be materially misstated.
If, based on the work we have performed, we conclude that there is a material misstatement of this other information, we are required to report that fact. We have nothing to report in this regard.
Responsibilities of Management and Those Charged with Governance for the Consolidated Financial Statements
Management is responsible for the preparation and fair presentation of the consolidated financial statements in accordance with IFRS Accounting Standards as issued by the IASB, and for such internal control as management determines is necessary to enable the preparation of consolidated financial statements that are free from material misstatement, whether due to fraud or error.
In preparing the consolidated financial statements, management is responsible for assessing the Group’s ability to continue as a going concern, disclosing, as applicable, matters related to going concern and using the going concern basis of accounting unless management either intends to liquidate the Group or to cease operations, or has no realistic alternative but to do so.
Those charged with governance are responsible for overseeing the Group’s financial reporting process.
Auditors’ Responsibilities for the Audit of the Consolidated Financial Statements
Our objectives are to obtain reasonable assurance about whether the consolidated financial statements as a whole are free from material misstatement, whether due to fraud or error, and to issue an auditors’ report that includes our opinion. Reasonable assurance is a high level of assurance, but is not a guarantee that an audit conducted in accordance with Canadian generally accepted auditing standards will always detect a material misstatement when it exists. Misstatements can arise from fraud or error and are considered material if, individually or in the aggregate, they could reasonably be expected to influence the economic decisions of users taken on the basis of these consolidated financial statements.
As part of an audit in accordance with Canadian generally accepted auditing standards, we exercise professional judgment and maintain professional skepticism throughout the audit. We also:
| ● | Identify and assess the risks of material misstatement of the consolidated financial statements, whether due to fraud or error, design and perform audit procedures responsive to those risks, and obtain audit evidence that is sufficient and appropriate to provide a basis for our opinion. The risk of not detecting a material misstatement resulting from fraud is higher than for one resulting from error, as fraud may involve collusion, forgery, intentional omissions, misrepresentations, or the override of internal control. |
2024 Annual Report — 57
| ● | Obtain an understanding of internal control relevant to the audit in order to design audit procedures that are appropriate in the circumstances, but not for the purpose of expressing an opinion on the effectiveness of the Group’s internal control. |
| ● | Evaluate the appropriateness of accounting policies used and the reasonableness of accounting estimates and related disclosures made by management. |
| ● | Conclude on the appropriateness of management’s use of the going concern basis of accounting and, based on the audit evidence obtained, whether a material uncertainty exists related to events or conditions that may cast significant doubt on the Group’s ability to continue as a going concern. If we conclude that a material uncertainty exists, we are required to draw attention in our auditors’ report to the related disclosures in the consolidated financial statements or, if such disclosures are inadequate, to modify our opinion. Our conclusions are based on the audit evidence obtained up to the date of our auditors’ report. However, future events or conditions may cause the Group to cease to continue as a going concern. |
| ● | Evaluate the overall presentation, structure and content of the consolidated financial statements, including the disclosures, and whether the consolidated financial statements represent the underlying transactions and events in a manner that achieves fair presentation. |
| ● | Plan and perform the group audit to obtain sufficient appropriate audit evidence regarding the financial information of the Canada Housing Trust or business units within the Group as a basis for forming an opinion on the group financial statements. We are responsible for the direction, supervision and review of the audit work performed for purposes of the group audit. We remain solely responsible for our audit opinion. |
We communicate with those charged with governance regarding, among other matters, the planned scope and timing of the audit and significant audit findings, including any significant deficiencies in internal control that we identify during our audit.
Report on Compliance with Specified Authorities
Opinion
In conjunction with the audit of the consolidated financial statements, we have audited transactions of Canada Mortgage and Housing Corporation coming to our notice for compliance with specified authorities. The specified authorities against which compliance was audited are Part X of the Financial Administration Act and regulations, the Canada Mortgage and Housing Corporation Act, the National Housing Act, the by-laws of Canada Mortgage and Housing Corporation, and the directives issued pursuant to section 89 of the Financial Administration Act.
In our opinion, the transactions of Canada Mortgage and Housing Corporation that came to our notice during the audit of the consolidated financial statements have complied, in all material respects, with the specified authorities referred to above. Further, as required by the Financial Administration Act, we report that, in our opinion, the accounting principles in IFRS Accounting Standards as issued by the IASB have been applied on a basis consistent with that of the preceding year.
Responsibilities of Management for Compliance with Specified Authorities
Management is responsible for Canada Mortgage and Housing Corporation’s compliance with the specified authorities named above, and for such internal control as management determines is necessary to enable Canada Mortgage and Housing Corporation to comply with the specified authorities.
Auditors’ Responsibilities for the Audit of Compliance with Specified Authorities
Our audit responsibilities include planning and performing procedures to provide an audit opinion and reporting on whether the transactions coming to our notice during the audit of the consolidated financial statements are in compliance with the specified authorities referred to above.

Sophie Bernard, CPA
Principal
for the Auditor General of Canada

Chartered Professional Accountants
Licensed Public Accountants
Ottawa, Canada
19 March 2025
2024 Annual Report — 58
Consolidated Balance Sheet
| (in millions of Canadian dollars) |
Notes | As at 31 December 2024 | As at 31 December 2023 | |||||||||
| Assets |
||||||||||||
| Cash and cash equivalents |
12 | 1,655 | 1,939 | |||||||||
| Securities purchased under resale agreements |
950 | 700 | ||||||||||
| Accrued interest receivable |
13 | 1,117 | 843 | |||||||||
| Investment securities: |
||||||||||||
| Fair value through profit or loss |
57 | 69 | ||||||||||
| Fair value through other comprehensive income |
23,287 | 20,162 | ||||||||||
| Amortized cost |
3,569 | 3,229 | ||||||||||
| Derivatives |
16 | - | 161 | |||||||||
| Due from the Government of Canada |
6 | 177 | 240 | |||||||||
| Loans: |
14 | |||||||||||
| Fair value through profit or loss |
521 | 512 | ||||||||||
| Amortized cost |
294,528 | 270,650 | ||||||||||
| Accounts receivable and other assets |
21 | 476 | 479 | |||||||||
| Investment property |
22 | 396 | 398 | |||||||||
| Defined benefit plans asset |
24 | 199 | 187 | |||||||||
| Deferred income tax assets |
25 | 423 | - | |||||||||
| 327,355 | 299,569 | |||||||||||
| Liabilities |
||||||||||||
| Accounts payable and other liabilities |
23 | 693 | 573 | |||||||||
| Income taxes payable |
229 | 545 | ||||||||||
| Accrued interest payable |
1,043 | 786 | ||||||||||
| Derivatives |
16 | 205 | 55 | |||||||||
| Insurance contract liabilities |
7 | 8,455 | 7,079 | |||||||||
| Borrowings: |
15 | |||||||||||
| Fair value through profit or loss |
148 | 219 | ||||||||||
| Amortized cost |
299,325 | 274,757 | ||||||||||
| Defined benefit plans liability |
24 | 180 | 180 | |||||||||
| Unearned premiums and fees |
7, 8 | 3,043 | 2,776 | |||||||||
| Deferred income tax liabilities |
25 | - | 36 | |||||||||
| 313,321 | 287,006 | |||||||||||
| Commitments and contingent liabilities |
27 | |||||||||||
| Equity of Canada |
10 | |||||||||||
| Contributed capital |
25 | 25 | ||||||||||
| Accumulated other comprehensive income (loss) |
(90) | (321) | ||||||||||
| Reserve fund |
172 | 72 | ||||||||||
| Retained earnings |
13,927 | 12,787 | ||||||||||
| 14,034 | 12,563 | |||||||||||
| 327,355 | 299,569 | |||||||||||
The accompanying notes are an integral part of these consolidated financial statements.

|

| |
| Don Iveson | Coleen Volk, CPA | |
| Chair | President and Chief Executive Officer | |
2024 Annual Report — 59
Consolidated Statement of Income and Comprehensive Income
Year ended 31 December
| (in millions of Canadian dollars) |
Notes | 2024 | 2023 | |||||||||
| Interest income |
17 | 8,039 | 7,077 | |||||||||
| Interest expense |
17 | (7,916) | (6,961) | |||||||||
| Net interest income |
123 | 116 | ||||||||||
| Insurance revenue |
7 | 1,087 | 1,004 | |||||||||
| Insurance service expense |
7 | (137) | (119) | |||||||||
| Insurance service result |
950 | 885 | ||||||||||
| Investment income |
17 | 765 | 553 | |||||||||
| Net gains (losses) on financial instruments |
17 | (194) | (212) | |||||||||
| Insurance finance expense for contracts issued |
7 | (263) | (178) | |||||||||
| Net financial result |
308 | 163 | ||||||||||
| Government funding |
6 | 4,606 | 5,494 | |||||||||
| Housing programs expenses |
6 | (4,240) | (5,114) | |||||||||
| Premiums and fees earned |
7, 8 | 939 | 860 | |||||||||
| Operating expenses |
28 | (678) | (641) | |||||||||
| Other income (loss) |
(10) | (13) | ||||||||||
| Self-insurance service income (expenses) |
(2) | 8 | ||||||||||
| Income before income taxes |
1,996 | 1,758 | ||||||||||
| Income taxes |
25 | (502) | (448) | |||||||||
| Net income |
1,494 | 1,310 | ||||||||||
| Other comprehensive income (loss), net of tax |
||||||||||||
| Items that will be subsequently reclassified to net income (loss) |
||||||||||||
| Net unrealized gains (losses) from debt instruments held at fair value through other comprehensive income |
176 | 357 | ||||||||||
| Reclassification of losses on debt instruments held at fair value through other comprehensive income on disposal in the year |
119 | 122 | ||||||||||
| Insurance finance income (expense) for contracts issued |
7, 25 | (64) | (75) | |||||||||
| Total items that will be subsequently reclassified to net income |
231 | 404 | ||||||||||
| Items that will not be subsequently reclassified to net income |
||||||||||||
| Remeasurement gains (losses) on defined benefit plans |
24, 25 | 36 | (32) | |||||||||
| Total other comprehensive income (loss), net of tax |
267 | 372 | ||||||||||
| Comprehensive income |
1,761 | 1,682 | ||||||||||
The accompanying notes are an integral part of these consolidated financial statements.
2024 Annual Report — 60
Consolidated Statement of Equity of Canada
Year ended 31 December
| (in millions of Canadian dollars) |
Notes | 2024 | 2023 | |||||||||
| Contributed capital |
25 | 25 | ||||||||||
| Accumulated other comprehensive income (loss) |
||||||||||||
| Fair value reserve balance at beginning of year |
(421) | (900) | ||||||||||
| Other comprehensive income (loss) — fair value |
295 | 479 | ||||||||||
| Fair value reserve balance at end of year |
(126) | (421) | ||||||||||
| Opening insurance finance reserve |
100 | 175 | ||||||||||
| Other comprehensive income (loss) — insurance finance reserve |
(64) | (75) | ||||||||||
| Insurance finance reserve balance at end of year |
36 | 100 | ||||||||||
| Balance at end of year |
(90) | (321) | ||||||||||
| Reserve fund |
||||||||||||
| Balance at the beginning of year |
72 | 17 | ||||||||||
| Net income (loss) |
100 | 55 | ||||||||||
| Balance at end of year |
10 | 172 | 72 | |||||||||
| Retained earnings |
||||||||||||
| Opening retained earnings |
12,787 | 12,644 | ||||||||||
| Net income |
1,394 | 1,255 | ||||||||||
| Other comprehensive income (loss) |
36 | (32) | ||||||||||
| Dividends |
10 | (290) | (1,080) | |||||||||
| Total retained earnings |
13,927 | 12,787 | ||||||||||
| Equity of Canada |
10 | 14,034 | 12,563 | |||||||||
The accompanying notes are an integral part of these consolidated financial statements.
2024 Annual Report — 61
Consolidated Statement of Cash Flows
Year ended 31 December
| (in millions of Canadian dollars) |
Notes | 2024 | 2023 | |||||||||
| Cash flows from (used in) operating activities |
||||||||||||
| Net income |
1,494 | 1,310 | ||||||||||
| Adjustments to determine net cash flows from operating activities |
||||||||||||
| Amortization of premiums and discounts on financial instruments |
(46) | (8) | ||||||||||
| Net (gains) losses on financial instruments |
(96) | 394 | ||||||||||
| Capitalized interest |
14 | (135) | (83) | |||||||||
| Deferred income taxes |
(502) | (241) | ||||||||||
| Depreciation, amortization and impairment of fixed and intangible assets |
41 | 39 | ||||||||||
| Net unrealized gains on investment property |
22 | 2 | (13) | |||||||||
| Changes in operating assets and liabilities |
||||||||||||
| Derivatives |
311 | (193) | ||||||||||
| Accrued interest receivable |
(274) | 35 | ||||||||||
| Due from (to) the Government of Canada |
152 | (230) | ||||||||||
| Accounts receivable and other assets |
4 | 228 | ||||||||||
| Accounts payable and other liabilities |
112 | (135) | ||||||||||
| Income taxes payable/receivable |
(355) | 633 | ||||||||||
| Accrued interest payable |
257 | (32) | ||||||||||
| Insurance contract liabilities |
1,219 | 581 | ||||||||||
| Defined benefit plans |
29 | 7 | ||||||||||
| Unearned premiums and fees |
267 | 172 | ||||||||||
| Other |
(6) | (6) | ||||||||||
| Loans |
14 | |||||||||||
| Repayments |
41,232 | 47,320 | ||||||||||
| Disbursements |
(65,040) | (48,739) | ||||||||||
| Borrowings |
15 | |||||||||||
| Repayments |
(60,303) | (58,227) | ||||||||||
| Issuances |
84,750 | 59,035 | ||||||||||
| 3,113 | 1,847 | |||||||||||
| Cash flows from (used in) investing activities |
||||||||||||
| Investment securities |
||||||||||||
| Sales and maturities |
13,141 | 8,442 | ||||||||||
| Purchases |
(15,810) | (9,741) | ||||||||||
| Foreign currency forward contract maturities |
||||||||||||
| Receipts |
266 | 302 | ||||||||||
| Disbursements |
(403) | (413) | ||||||||||
| Investment property |
22 | |||||||||||
| Additions |
- | - | ||||||||||
| Disposals |
- | 17 | ||||||||||
| Securities purchased under resale agreements |
(250) | (50) | ||||||||||
| Property and equipment and intangible asset acquisitions |
(51) | (34) | ||||||||||
| (3,107) | (1,477) | |||||||||||
| Cash flows used in financing activities |
||||||||||||
| Dividends paid |
10 | (290) | (1,080) | |||||||||
| Change in cash and cash equivalents |
(284) | (710) | ||||||||||
| Cash and cash equivalents |
||||||||||||
| Beginning of year |
1,939 | 2,649 | ||||||||||
| End of year |
1,655 | 1,939 | ||||||||||
| Represented by |
||||||||||||
| Cash |
64 | 106 | ||||||||||
| Cash equivalents |
1,591 | 1,833 | ||||||||||
| 1,655 | 1,939 | |||||||||||
| Supplementary disclosure of cash flows from operating activities |
||||||||||||
| Amount of interest received during the year |
8,708 | 8,040 | ||||||||||
| Amount of interest paid during the year |
8,183 | 7,503 | ||||||||||
| Amount of dividends received during the year |
- | 2 | ||||||||||
| Amount of income taxes paid during the year |
1,358 | 58 | ||||||||||
The accompanying notes are an integral part of these consolidated financial statements.
2024 Annual Report — 62
Notes to Consolidated Financial Statements
Year ended 31 December 2024
| 1. | Corporate Information |
Canada Mortgage and Housing Corporation (CMHC, we, or us) was established in Canada as a Crown corporation in 1946 by the Canada Mortgage and Housing Corporation Act (CMHC Act) to carry out the provisions of the National Housing Act (NHA). We are also subject to Part X of the Financial Administration Act (FAA) by virtue of being listed in Part 1 of Schedule III, wholly owned by the Government of Canada (Government), and an agent Crown corporation. Our National Office is located at 700 Montreal Road, Ottawa, Ontario, Canada, K1A 0P7.
Our mandate, as set out in the NHA, is to promote the construction of new houses, the repair and modernization of existing houses, and the improvement of housing and living conditions. In relation to financing for housing, the NHA’s purpose is to promote housing affordability and choice; to facilitate access to, and competition and efficiency in the provision of, housing finance; to protect the availability of adequate funding for housing; and generally to contribute to the well-being of the housing sector. In addition, we have the following objectives in carrying out any activities related to mortgage insurance and guarantee programs and in administering the Canadian covered bond legal framework: (a) to promote the efficient functioning and competitiveness of the housing finance market; (b) to promote and contribute to the stability of the financial system, including the housing market; and (c) to have due regard to our exposure to loss. We deliver on our mandate through our reportable segments: Housing Programs (HP), Mortgage Insurance (MI) and Mortgage Funding (MF).
Within the Public Accounts of Canada, our annual consolidated net income reduces the Government’s annual deficit; our consolidated retained earnings and accumulated other comprehensive income (AOCI) reduce the Government’s accumulated deficit.
As a Crown corporation, we have been issued the following directives pursuant to Section 89 of the FAA for which we are compliant:
| • | P.C. 2008-1598, requiring due consideration to the personal integrity of those to whom we lend or provide benefits; |
| • | P.C. 2014-1380, to provide a 50:50 current service cost-sharing ratio between employees and employer for pension contributions for all members; and |
| • | P.C. 2015-1106, to align our travel, hospitality, conference and event expenditure policies, guidelines and practices with those of Treasury Board of Canada Secretariat (TBS) in a manner consistent with our legal obligations and to report on the implementation of this directive in our next corporate plan. |
| 2. | Basis of Preparation and Material Accounting Policy Information |
Basis of preparation
Our consolidated financial statements have been prepared in accordance with IFRS Accounting Standards as issued by the International Accounting Standards Board (IASB). We have applied the same accounting policies consistently to all periods presented.
Our consolidated financial statements were approved by the Board of Directors on 19 March 2025.
2024 Annual Report — 63
Measurement basis
Our consolidated financial statements have been prepared on a going concern basis using a historical cost basis except for the following items in the consolidated balance sheet:
| • | Financial assets at fair value through profit or loss (FVTPL) or fair value through other comprehensive income (FVOCI), as well as liabilities at FVTPL, are measured at fair value; |
| • | Investment property is measured at fair value; |
| • | Insurance contract liabilities are measured at current value; and |
| • | Defined benefit assets and liabilities for post-employment benefit plans are recognized at the present value of the defined benefit obligations, net of the fair value of plan assets. |
Functional currency
Our consolidated financial statements are stated in millions of Canadian dollars, unless otherwise indicated, which is our functional currency.
Material accounting policy information
The following summarizes the material accounting policy information we use in the preparation of our consolidated financial statements.
Basis of consolidation
We consolidate our accounts with those of Canada Housing Trust (CHT), as we control its activities as described in Note 4.
Inter-segment balances and transactions have been eliminated.
Foreign currency translation
Monetary assets and liabilities denominated in foreign currencies are translated into Canadian dollars at exchange rates prevailing at the balance sheet date. Exchange gains and losses resulting from the translation of foreign denominated balances are included in net gains (losses) on financial instruments. Purchases and sales of foreign securities and the related income are translated into Canadian dollars at the exchange rates prevailing on the respective settlement dates of the transactions.
Government funding and housing programs expenses
Government funding
Government funding is recognized when there is reasonable assurance that it will be received, and all attached conditions will be complied with. This is generally achieved when the recipient meets specific program criteria which permits us to make the related claim to the Government.
Government funding earned, but not yet received, is included in due from the Government of Canada.
Housing programs expenses
Housing programs expenses are recorded on an accrual basis and those incurred, but not yet paid, are included in accounts payable and other liabilities.
Costs to deliver housing programs are included in operating expenses.
Amounts advanced from us to proponents for which the relevant program expenses have not yet been incurred are recorded in Accounts Receivable and Other Assets.
2024 Annual Report — 64
Mortgage insurance
Insurance contract classification
We accept significant insurance risk in issuing our mortgage insurance contracts as the lender faces uncertainty with regards to potential borrower default on a mortgage and therefore pays a mortgage insurance premium to transfer the insurance risk to us. Our exposure to this risk, which consists of the outstanding mortgage balance less the estimated sales price of the insured property, forms the basis of our coverage units for purposes of recognizing the contractual service margin (CSM).
Self-insurance
For certain housing programs, we receive a premium related to an insurance contract in which we are the lender for a portion of the life of the insured loan. During the period we are the lender, we are self-insuring and therefore, there is no insurance contract as we are not exposed to significant insurance risk. The related premiums are due at the inception of the self-insurance contract and are deferred and included in unearned premiums and fees. The unearned premiums are recognized as revenue and recorded in premiums and fees earned over the period covered by the self-insurance contract using earning factors which reflect historical claim occurrence patterns.
We recognize a provision for incurred claims, in accounts payable and other liabilities, during the self-insurance period. The provision is an estimate of expected claims net of the related expected property sale proceeds, for defaults on insurance contracts that have occurred on or before the balance sheet date. This provision includes claims that have been incurred but not reported (IBNR), claims incurred but not enough reported (IBNER) and claims in process (CIP). The provision takes into consideration the time value of money and includes an explicit provision for adverse deviation. A change in the estimated provision for claims is recorded in self-insurance service expense in the period in which it occurs.
When we are no longer the lender, there is no longer self-insurance, as we accept significant insurance risk from the policyholder at this point. Therefore, the carrying amount in unearned premiums and fees for the self-insurance contract is de-recognized and accounted for as a premium transfer to the newly recognized insurance contract. If the amount of transferred premium is less than the fulfilment cash flows of the insurance contract, a loss is recognized immediately in insurance service expense. If the difference results in a gain, the gain will form part of the CSM which will be earned over the remaining coverage period of the insurance contract.
Recognition
We recognize groups of insurance contracts from the earliest of the date of when the mortgage insurance premium is received or when the contract is reported as in-force by the lender as this represents the earliest point we have a substantive obligation to provide the lender with coverage for insurance risk.
Contract boundary
We measure our groups of insurance contracts based on all cash flows included within the boundary of our insurance contracts. The cash flows which are directly related to fulfilling our insurance contracts include premiums, fees, insurance acquisition cash flows, claims and other insurance service expenses, and estimated borrower judgment recoveries (BJR). Our contract boundary starts when the funds for the mortgage are advanced to the borrower. Our contract boundary ends when the insured mortgage is terminated either through repayment of the outstanding mortgage, when a claim is paid or on certain mortgage modifications. We do not have the ability to re-price our mortgage insurance contracts once they have been written.
2024 Annual Report — 65
Level of aggregation
We aggregate our insurance contracts into portfolios based on similar risks and how we manage them. Our three main product lines, transactional homeowner insurance, portfolio insurance and multi-unit residential insurance, are exposed to the same risk, being borrower default. However, each of our products is managed separately with unique pricing and product designs to achieve business and policy objectives.
Our portfolios are further divided based on expected profitability at inception into three categories:
| • | contracts that, on initial recognition, have no significant possibility of becoming onerous subsequently; |
| • | contracts that are onerous on initial recognition; and |
| • | remaining contracts in the portfolio. |
Each insurance contract group is then further aggregated by quarterly cohort of issue which represents the level at which our recognition and measurement of our accounting policies are applied. For further details on the estimates used to aggregate our insurance contracts see Note 4.
Initial recognition
We use the general measurement model to measure the liability for remaining coverage (LRC) of a group of insurance contracts at initial recognition at current value, as the total of the estimated future fulfilment cash flows that are within the boundary of our insurance contracts and a CSM representing unearned profit to be recognized as service is provided.
The LRC represents our obligation for insured events at the balance sheet date that have not yet occurred, and comprise all remaining expected future cash inflows and cash outflows under our groups of insurance contracts, including any CSM.
The liability for incurred claims (LIC) represents our obligation for insured events that have occurred. This includes insured events that have been incurred but for which claims are in process, claims that are IBNR, claims that are IBNER and expected BJR that are due. At initial recognition, the LIC is expected to be nil, as significant insured events have not occurred.
Fulfilment cash flows
The estimate of fulfilment cash flows is an unbiased probability-weighted estimate adjusted to reflect the time value of money and a risk adjustment for non-financial risk. We will consider all reasonable and supportable information available at the reporting date without undue cost or effort.
The fulfilment cash flows of our insurance contracts include:
Premiums
Mortgage insurance premiums are due at the inception of the mortgage insurance contract and result in a CSM if the premiums are greater than the fulfilment cash flows or an onerous contract (loss at inception) if less than the fulfilment cash flows. Any premium refunds paid in the period reduce the CSM or increase the loss on onerous contracts.
Fees
Application fees recover part or all acquisition costs associated with issuing mortgage insurance contracts related to multi-unit residential loans and are treated similarly to the mortgage insurance premiums at initial recognition.
2024 Annual Report — 66
Insurance acquisition cash flows
Insurance acquisition cash flows consist of:
| • | Policy issuance costs, such as internal salary and personnel costs that are directly attributable to the underwriting of insurance contracts; |
| • | Fees paid to the Government of Canada to compensate for mortgage insurance risks. Fees are payable at a rate of 3.25% of premiums written during the period for all insurance contracts and an additional 0.1% on new portfolio insurance contracts written in the period; and |
| • | an allocation of fixed and variable overheads that relate to salaries and benefits for different internal departments that are directly attributable to the underwriting of our insurance contracts. |
Insurance acquisition cash flows reduce the CSM or increase the loss at inception of the insurance contract liabilities. They are subsequently amortized over the expected coverage period of our insurance contracts using the same coverage units used to recognize the CSM with equal offsetting amounts to insurance revenue and insurance service expense in the period.
We do not recognize a separate asset for any acquisition cash flows as all significant insurance acquisition cash flows are incurred in the same period in which the insurance contracts are issued and realized.
Claims and other insurance service expenses
Our claims and other insurance service expenses consist of:
| • | expected mortgage insurance claims where the insured loan balance, accrued interest and other settlement costs exceed the expected sale price of the insured property; |
| • | claims handling or servicing costs; and |
| • | an allocation of fixed and variable overheads that are directly attributable to fulfilling our insurance contracts. |
The expected claims and other insurance service expenses are included in the fulfilment cash flows of the LRC on initial recognition of a group of insurance contracts and they reduce the CSM or increase the loss on an onerous group of insurance contracts.
Estimated borrower judgment recoveries
We estimate the BJR related to claims paid using historical data and assumptions related to past BJR received. Estimated BJR are included in the fulfilment cash flows of the LRC on initial recognition of a group of insurance contracts and will increase the CSM or reduce the loss on an onerous group of insurance contracts.
Subsequent measurement
We measure the CSM at the end of the period as the unearned profit relating to a group of insurance contracts that has not been recognized as it relates to the future services to be provided.
For a group of insurance contracts, the carrying amount of the CSM at the end of the reporting period equals the carrying amount at the beginning of the period adjusted for:
| • | the effects of new contracts issued in the period; |
| • | interest accreted on the carrying amount of the CSM during the period, measured at the discount rates at initial recognition; |
| • | changes in fulfilment cash flows that relate to future service to the extent that they do not create a loss component or those changes are allocated to existing loss components; and |
| • | the amount recognized as insurance revenue reflecting the coverage provided on our insurance contracts in the period, determined by the allocation of the CSM remaining at the end of the reporting period over the current and future coverage units. |
2024 Annual Report — 67
The changes in fulfilment cash flows relating to future service that adjust the CSM comprise:
| • | changes in estimates of the present value of future cash flows in the LRC, except those relating to the time value of money; and |
| • | changes in the risk adjustment for non-financial risk that relate to future service. |
Adjustments to the CSM, noted previously including the accretion of interest, are measured at the locked-in discount rates determined at initial recognition of the groups of insurance contracts.
At each reporting period, we decrease the fulfilment cash flows of the LRC for expected claims in the period and increase our LIC for our estimate of incurred claims, increasing both our insurance revenue and insurance service expense. The related release of the LRC and the recorded LIC will not match as there are differences between expected claims from the prior reporting period as compared to our estimate for actual incurred claims in the period and due to a lower risk adjustment in our LIC, as the risk of uncertainty of the amount and timing of cash flows is lower.
We measure the carrying amount of a group of insurance contracts at the end of each reporting period as the sum of:
| • | the LRC excluding loss components, comprising fulfilment cash flows related to future service allocated to the group at that date and the CSM of the group at that date; |
| • | the LRC related to the loss components; and |
| • | the LIC that comprises the fulfilment cash flows related to current and past service allocated to the group insurance contracts at that date. |
Changes in the LIC that relate to current or past services are recorded in insurance service expense in the period. For further details on how we determine the LIC see Note 4.
Insurance revenue
The amount of insurance revenue recognized in the period reflects the insurance coverage provided on our insurance contracts in the period.
The insurance revenue to be recognized in the period for a group of insurance contracts is comprised of:
| • | expected incurred claims and other insurance service expenses, excluding any amounts allocated to the loss component of the LRC; |
| • | the change in the risk adjustment for non-financial risk, excluding any amounts allocated to the loss component of the LRC; |
| • | the CSM to be recognized for the coverage provided; and |
| • | the recovery of insurance acquisition cash flows. |
Onerous contracts and loss components
If there is an onerous group of insurance contracts on initial recognition, a loss is immediately recognized in insurance service expense resulting in no CSM for the group and the carrying amount of the insurance contract liability equal to the fulfilment cash flows. A loss component for the LRC is recognized representing the excess of the fulfilment cash flows above the cash inflows.
The loss component is released based on a systematic allocation of the subsequent changes in the fulfilment cash flows to:
| • | the loss component; and |
| • | the LRC, excluding the loss component. |
2024 Annual Report — 68
Subsequent changes in fulfilment cash flows that relate to current service represent the release of expected incurred claims and the release of the risk adjustment for non-financial risk. The loss component is also updated for subsequent changes in the fulfilment cash flows that relate to future service. Changes in fulfilment cash flows that relate to future service can increase, decrease or cause the amount of loss component to be nil, resulting in the emergence of a CSM.
The systematic allocation of subsequent changes to the loss component results in the total amounts allocated to the loss component being equal to zero by the end of the coverage period of groups of insurance contracts. We have defined the systematic allocation as the relative percentage of the loss component at the beginning of the period to the total LRC at the initial discount rate.
Risk adjustments for non-financial risk
We disaggregate changes in the risk adjustment for non-financial risk between insurance revenue and insurance finance expense. The impact of the time value of money is reflected in insurance finance expense. For further details on the estimates and assumptions used to calculate the risk adjustment for non-financial risk see Note 4.
Insurance finance expenses – discount rates
Insurance finance expenses reflect the change in the carrying amount of our groups of insurance contracts arising from the effect of the time value of money and changes in the time value of money.
We disaggregate insurance finance expenses on our insurance contract liabilities between income and other comprehensive income. The impact of changes in discount rates on the value of our insurance contract liabilities is reflected in insurance finance expense, in other comprehensive income, to minimize accounting mismatches between the accounting for financial assets and insurance contract liabilities. The financial assets backing our insurance contract liabilities are primarily measured at fair value through other comprehensive income.
We systematically allocate the total insurance finance expense over the duration of the group of insurance contracts into income using discount rates determined on initial recognition of the group of insurance contracts. For further details on the estimates and assumptions used to determine discount rates see Note 4.
De-recognition and modification of insurance contracts
Insurance contracts are de-recognized when the rights and obligations relating to the insurance contract are extinguished or if the terms are modified in a way that significantly change the measurement of the insurance contract had the new terms always existed. When the de-recognition criteria are met, the initial contract is de-recognized and a new contract based on the modified terms is recognized. If the modification does not result in de-recognition, then the modification is treated as a change in estimates of fulfilment cash flows.
Timely payment guarantees (TPG)
Classification
Financial guarantee contracts are defined as contracts that require the issuer to make specified payments to reimburse the holder for a loss it incurs because a specified debtor fails to make payment when due. We classify the TPG for National Housing Act Mortgage-Backed Securities (NHA MBS) and Canada Mortgage Bonds (CMB) as financial guarantee contracts. Such contracts remain financial guarantee contracts until all rights and obligations are extinguished or expire.
2024 Annual Report — 69
Recognition and measurement
TPG and application fees are initially recognized in unearned premiums and fees at fair value (the premium received). Subsequently, they are measured at the higher of i) the amount initially recognized less the amortization of guarantee and application fee revenue; and ii) the amount of the allowance for expected credit losses (ECL). The fees are recognized into premiums and fees earned on a straight-line basis over the expected life (typically the contractual life) of the related NHA MBS or CMB. All fees are received within five business days after the invoice date.
Government of Canada guarantee fees for risk exposure
We pay guarantee fees to the Department of Finance on an annual basis to compensate for its exposure to the risks arising from the guarantee. These fees are deferred in accounts receivable and other assets when the guarantee is issued, and amortized to operating expenses on a straight-line basis over the period covered by the guarantee. These fees are payable at a rate of 0.075% of CMB issuances.
Financial instruments
Classification and measurement of debt instruments
The classification and measurement of debt instruments are based on the business model for managing the assets and whether contractual cash flows are solely payments of principal and interest (SPPI).
Business model assessment
The business model reflects how we manage assets to generate cash flows, that is, whether the objective is solely to collect contractual cash flows, or to collect both contractual cash flows and cash flows arising from the sale of assets.
We assess our business models at a level that reflects how our financial instruments are managed to achieve our business objectives. This assessment begins at the operating segment level, and where applicable, by sub-portfolios of instruments that are managed together within a particular activity to achieve common business objectives. We perform our business model assessment based on the following main criteria:
| • | Strategic objectives of the business model and how these objectives are carried out in practice; |
| • | How performance of the business model is evaluated and reported to key management personnel; |
| • | The risks that affect the performance of the business model and how we manage those risks. Key risks include market, credit, and liquidity risks as described in detail in Notes 18, 19 and 20 respectively; |
| • | How managers of the business model are compensated; |
| • | The frequency, value and timing of historical sales activity and expectations for future sales activities. |
SPPI Assessment
We assess whether the cash flows of our debt instruments meet the SPPI criteria based on the asset’s contractual terms. For this assessment, we define principal, as the fair value of the asset upon initial recognition and interest, as consideration for the time value of money, the credit risk of the transaction and for other lending risks and costs as well as a profit margin.
Contractual terms that introduce exposure to risk or volatility to the contractual cash flows that are inconsistent with a basic lending agreement do not satisfy the SPPI requirement.
2024 Annual Report — 70
Classification and measurement of financial instruments
We use settlement date accounting for purchases and sales of financial assets and financial liabilities, and we recognize realized gains and losses on sales on a weighted average cost basis. The following table presents a description of our financial instruments along with their classification under IFRS 9 and the criteria for classifying them as such:
| Classification |
Financial Instruments (Activity)1 | Description | Criteria and accounting treatment | |||
| Financial assets at amortized cost |
Cash and cash equivalents (HP, MI, MF)
Securities purchased under resale agreements (Reverse Repurchase Agreements) (HP, MI)
Accrued interest receivable (HP, MI, MF)
Investment securities (HP)
Loans – CMB Program and Insured Mortgage Purchase Program (IMPP) (MF)
Loans – Lending Programs (HP)
Loans (MI) |
Highly liquid investments with a term to maturity of 98 days or less from the date of acquisition that are readily convertible to known amounts of cash and which are subject to an insignificant risk of change in value.
Purchase of securities, typically Government treasury bills or bonds, with the commitment to resell the securities to the original seller at a specified price and future date in the near term.
Interest earned on financial assets, but not yet collected.
Corporate, Federal, Provincial and Sovereign debt instruments.
Amounts due from Canadian financial institutions as a result of the sale of their beneficial interest in NHA MBS to CHT (for the CMB Program) or CMHC (for the IMPP).
Loans not economically hedged within our HP Activity.
Mortgages or loans (workouts) that benefit from the MI-supported default management activities that enable borrowers to work through their financial difficulties.
|
We classify financial assets at amortized cost if we hold them with the objective to collect contractual cash flows and are SPPI.
Initially measured at fair value plus transaction costs and subsequently measured at amortized cost using the effective interest rate method (EIRM), net of an allowance for ECL.
Interest income is recognized using the EIRM in interest income in HP and MF (CMB and IMPP loans), and investment income in MI and MF (cash).
ECL are recognized in net gains (losses) on financial instruments in HP and MI.
Gains and losses arising on derecognition are recognized directly in net gains (losses) on financial instruments, together with foreign exchange gains and losses.
For certain lending program loans originated from 1946 to 1984 through provisions of the NHA, interest rate losses from the loans having lower interest rates than the related borrowings are reimbursed through government funding. In assessing the fair value of these loans at initial recognition, the continued receipt of the government funding in the future is assumed. | |||
1 Denotes in which Activity we hold the instruments: Housing Programs, Mortgage Insurance, or Mortgage Funding.
2024 Annual Report — 71
| Classification |
Financial Instruments (Activity)1 | Description | Criteria and accounting treatment | |||
| Debt instruments at FVOCI |
Cash and cash equivalents (MI, MF)
Investment Securities – debt instruments (MI, MF) |
Highly liquid investments with a term to maturity of 98 days or less from the date of acquisition that are readily convertible to known amounts of cash and which are subject to an insignificant risk of change in value.
Corporate, Federal, Provincial and Sovereign debt instruments. |
We classify financial assets at FVOCI if we hold them with the objective to collect contractual cash flows or to sell the assets and are SPPI.
Initially recognized at fair value plus transaction costs and subsequently measured at fair value. Unrealized gains and losses arising from changes in fair value are recorded in other comprehensive income (OCI) until the financial asset is derecognized at which point, cumulative gains or losses previously recognized in OCI are reclassified from AOCI to net gains (losses) on financial instruments. Unrealized foreign exchange gains (losses) are recognized in net gains (losses) on financial instruments.
Interest income is recognized using the EIRM in investment income.
The cumulative ECL allowance on financial assets held at FVOCI is recorded in OCI and does not reduce the carrying amount of the financial asset. The change in the ECL allowance is recognized in net gains (losses) on financial instruments.
| |||
| Financial assets at FVTPL |
Cash equivalents, loans, investment securities designated at FVTPL (HP)
Derivatives – Interest rate swaps (HP), Foreign Exchange (FX) contracts (MI) and First-Time Home Buyer Incentive (FTHBI) loan derivative (HP)
Investment Securities – Limited partnership units (MI)
Investment Securities – debt instruments (MI)
Loans – (HP, MI) |
For certain portfolios of loans and associated borrowings originated prior to August 2016, the HP Activity uses derivatives to manage refinancing and reinvestment risks, as well as mismatches between the timing of receipts from assets and payments of liabilities. These assets form part of the lending economic hedging structure and are designated at FVTPL.
Interest rate swaps are used in our lending economic hedging structure. Foreign exchange contracts are used to mitigate foreign exchange risks on U.S. dollar-denominated debt instruments. The FTHBI loan derivative is used to recognize the payable to, or receivable from, the Government of Canada when there are underlying loan gains or losses.
Canadian real estate investment trust equity investments. All mandatorily classified at FVTPL.
Certain asset-backed securities whose contractual cash flows do not give rise to cash flows that are SPPI.
Loans including those with interest adjustment clauses, those for which we only expect to recover the value of the underlying collateral, and those that are economically hedged.
|
We classify financial assets at FVTPL if they do not meet the criteria for classification as financial assets at amortized cost, or financial assets at FVOCI.
Includes derivatives or instruments that have been irrevocably designated upon initial recognition as at FVTPL to eliminate or significantly reduce an accounting mismatch that would otherwise arise from not classifying them in this category.
Initially recognized and subsequently measured at fair value. Unrealized gains and losses arising from changes in fair value and gains and losses realized on disposition are recorded in net gains (losses) on financial instruments. Transaction costs are recognized in net gains (losses) on financial instruments as incurred.
Interest income and dividend income are recognized in investment income in MI. Interest income in HP is recognized in interest income.
ECL are not recognized on financial instruments measured at FVTPL. | |||
1 Denotes in which Activity we hold the instruments: Housing Programs, Mortgage Insurance, or Mortgage Funding.
2024 Annual Report — 72
| Classification |
Financial Instruments (Activity)1 | Description | Criteria and accounting treatment | |||
| Financial liabilities at FVTPL |
Borrowings from the Government of Canada – Lending programs (HP) | Borrowings that are economically hedged as part of our lending hedging structure.
We may irrevocably designate a financial liability as at FVTPL upon initial recognition if doing so eliminates or reduces significantly an accounting mismatch, or its performance is evaluated on a fair value basis in accordance with risk management policies.
|
Unrealized gains and losses arising from changes in fair value are recognized in net gains (losses) on financial instruments except for changes in fair value attributable to our own credit risk for financial liabilities designated at FVTPL. These changes are recognized in OCI unless doing so would create an accounting mismatch, in which case, the entire fair value change is presented in net gains (losses) on financial instruments. | |||
| Financial liabilities at amortized cost |
Accrued interest payable (HP, MF)
Borrowings – CMB (MF)
Borrowings from the Government of Canada – Lending Programs (HP)
Borrowings from the Government of Canada – IMPP (MF)
Securities sold under repurchase agreements (MI) |
Interest expense incurred on borrowings and other financial obligations, but not yet paid.
Interest-bearing bullet bonds issued by CHT that we guarantee. See after this table for further details about CMB.
Borrowings incurred to fund loans in the HP Activity that are not part of the lending hedging structure.
Amortizing borrowings incurred to fund loans under the IMPP.
Sale of securities with the commitment to repurchase the securities from the original buyer at a specified price and future date in the near term. The securities sold are pledged as collateral and are presented as investments in the consolidated balance sheet. Proceeds received from these agreements may be used for liquidity purposes or invested in Reverse Repurchase Agreements or cash equivalents for the purpose of generating additional income.
|
Financial liabilities are classified at amortized cost, unless they have been classified at FVTPL.
Initially recognized at fair value plus transaction costs and subsequently measured at amortized cost using the EIRM, with interest expense recorded in interest expense in HP and MF and investment income in MI. | |||
1 Denotes in which Activity we hold the instruments: Housing Programs, Mortgage Insurance, or Mortgage Funding.
Initial measurement of financial instruments
When a financial instrument’s fair value at initial recognition differs from its transaction price, we recognize the resulting gain or loss as follows:
When the instrument’s fair value is determined using significant observable inputs, we immediately recognize the gain or loss in net gains (losses) on financial instruments and subsequently amortize it into interest income, for loans, or interest expense, for borrowings, using the EIRM. This is the case for all funds we borrow from the Government for Lending programs under the Crown Borrowing Program (CBP), as well as certain Lending program loans. See Note 17 for information on the amounts of these gains or losses.
When the instrument’s fair value is determined using significant unobservable inputs, we defer and amortize the gain or loss into net gains (losses) on financial instruments and interest income using the EIRM. This is the case for certain Lending program loans. See Note 17 for information on the amounts of these deferred gains or losses which are recorded within Loans.
2024 Annual Report — 73
Measurement of expected credit losses
Expected credit losses are defined as the difference between all contractual cash flows due in accordance with the contract, and the cash flows that we expect to receive (cash shortfalls), discounted at the original effective interest rate (or credit-adjusted effective interest rate for purchased or originated credit-impaired assets). ECL are the weighted average of expected credit losses determined by evaluating a range of possible outcomes using reasonable, supportable information about past events and current and forecasted future economic conditions.
We have an impairment model to determine the allowance for ECL on our debt securities classified as amortized cost or FVOCI and our financial guarantee contracts. We determine an allowance for ECL at initial recognition of the financial instrument (or the date we become party to a financial guarantee) that is updated at each balance sheet date throughout the life of the instrument.
The ECL allowance is based on the ECL over the life of the financial instrument (lifetime ECL), unless there has been no significant increase in credit risk (SICR) since initial recognition, in which case the ECL allowance is measured at an amount equal to the portion of lifetime ECL that result from default events possible within the next 12 months (12-month ECL). ECL are determined based on three main drivers: probability of default, loss given default and exposure at default.
| • | Probability of default (PD): A point-in-time estimate of the likelihood of default either over the next 12 months (12-month ECL) or over the remaining life of the instrument (lifetime ECL). Our PDs are determined by mapping internal credit ratings to point-in-time PD tables based on statistical models derived from a large data set of publicly traded entities. |
| • | Loss given default (LGD): The percentage of the gross carrying amount of the instrument that will be lost on default at a given point in time. It is determined by taking the difference between contractual cash flows due and those expected to be received, including the realization of collateral, and comparing this value to the gross carrying amount. |
| • | Exposure at default (EAD): The gross carrying amount of the instrument at a given point in time, which is calculated as the present value of the outstanding contractual cash flows using the EIRM. |
The ECL is calculated using a scenario-based approach where, for each scenario, the PD, LGD and EAD are projected for each individual exposure at each cash flow date over the next 12 months (12-month ECL) or remaining life of the instrument (lifetime ECL). The components are multiplied together at each future date and discounted back using the original effective interest rate to the reporting date and summed. A probability-weighted average ECL is then determined across the multiple scenarios. We model all ECL at the individual instrument level.
Significant increase in credit risk
We have established a policy to perform an assessment at each balance sheet date of whether the instrument’s credit risk has increased significantly since initial recognition (or the date we become party to a financial guarantee). Based on this assessment, we group the instruments into the following categories:
| • | Stage 1: Instruments that have not experienced a SICR since initial recognition. ECL are recognized based on 12-month ECL and interest revenue is calculated on the gross carrying amount of the asset; |
| • | Stage 2: Instruments that have experienced a SICR since initial recognition, but are not considered credit impaired. In subsequent periods, if the credit risk of an instrument has improved such that there is no longer a SICR since initial recognition, the ECL allowance will revert to stage 1. ECL are recognized based on lifetime ECL and interest revenue is calculated on the gross carrying amount of the asset; |
| • | Stage 3: Instruments that are considered credit-impaired as one or more events that have a detrimental impact on estimated future cash flows have occurred. ECL are recognized based on lifetime ECL; |
| • | Purchased or originated credit-impaired (POCI) – instruments that are credit impaired on initial recognition. ECL are recognized based on lifetime ECL. |
2024 Annual Report — 74
Interest revenue on stage 3 or POCI financial instruments is calculated based on the net carrying amount of the asset, which is the gross carrying amount, net of the loss allowance.
For instruments that we assess as having low credit risk at the reporting date, we applied the low credit risk exemption (stage 1) and have presumed that credit risk has not increased significantly since initial recognition. We use internal credit ratings based on internal assessments of counterparty creditworthiness at the reporting date to assess whether the instrument has low credit risk. For externally-managed investment portfolios, a credit rating for each instrument is based on ratings available from credit rating agencies. We consider an instrument to have low credit risk when our internal rating is BBB- or higher.
We apply a backstop to all financial instruments for which the counterparty is more than 30 days past due on its contractual payments, whereby we consider the instrument to have experienced a SICR.
We consider an instrument in default for the purpose of measuring ECL, which is fully aligned with the definition of credit-impaired, when it meets the following criteria:
| • | Observable data exists that has a detrimental impact on the estimated future cash flows such as: |
| – | significant financial difficulty of the issuer; |
| – | the granting of a new loan to assist the borrower to work through financial difficulties; |
| – | it becomes probable that the issuer will enter bankruptcy or other financial reorganization, and |
| – | the disappearance of an active market due to financial difficulties. |
| • | Borrower becomes 90 days past due on its contractual payments. |
An instrument is no longer considered impaired when all past due amounts, including interest, have been recovered and it is determined that the principal and interest are fully collectable in accordance with the original contractual terms of the instrument. We write off instruments, either partially or in full, against the related ECL allowance when we judge that there is no realistic prospect of future recovery.
In addition to the 30-day backstop, we apply the following policies in determining whether there has been a SICR on our financial instruments subject to ECL:
Debt instruments at amortized cost / FVOCI
Our credit risk policies restrict the amount of investments in debt instruments that have an internal rating lower than BBB-. All other instruments are presumed to have low credit risk and we have applied the low credit risk exemption (stage 1) on those instruments.
Loans under CMB program and the IMPP
Loans under the CMB program and under the IMPP represent amounts due from Canadian financial institutions as a result of the sale of their beneficial interest in NHA MBS securities to us. The loans are collateralized by the NHA MBS through swap counterparties, as well as associated reinvestment securities in the case of the CMB program only, acquired in the transactions. The NHA MBS, reinvestment assets and swaps represent the sole source of repayment on the loans, and thus directly affect the probability of a default occurring. Therefore, our assessment of SICR is based on the credit risk of these supporting assets. The supporting assets are held in our name and are limited to NHA MBS, which consists of pools of insured mortgages, and reinvestment assets rated R-1 (high) or AAA (under the CMB program only) and swap counterparties with a minimum rating of BBB+ (under the CMB program) or A- (under the IMPP). As such, all loans under the CMB program and the IMPP are presumed to have low credit risk and we have applied the low credit risk exemption (stage 1). We also do not recognize a separate ECL for these loans because the credit risk arising from loans under the CMB program and the IMPP is already reflected in the credit risk of the NHA MBS and CMB TPGs as discussed under the Financial guarantees section.
2024 Annual Report — 75
Housing Programs Activity loans / Mortgage Insurance Activity loans
Loans that are insured under the Mortgage Insurance Activity are presumed to have no credit risk as they are fully insured. Loans with an internal rating of BBB- or higher are presumed to have low credit risk and the low credit risk exemption has been applied (stage 1). These loans consist of those issued to municipalities, as well as loans indemnified by provinces and territories through provisions under Social Housing Agreements (SHA) and loans guaranteed by the Government of Canada, where the credit rating of the province or territory and Government of Canada is considered in the SICR assessment. For loans indemnified by provinces and territories, this credit enhancement is relevant to assessing changes in credit risk since it directly impacts the PD. The province or territory is responsible for collecting loan payments from the borrower and, in turn, makes all payments to us directly in accordance with the contractual terms of the loan on behalf of the borrower. These payments are made to us, irrespective of the borrower’s payment status. For loans guaranteed by the Government of Canada, this credit enhancement is relevant to assessing changes in credit risk as the Government of Canada has explicitly guaranteed all losses on these loans. Any credit loss arising from a deficiency in collecting an amount due from the borrower would be covered by the Government of Canada as they bear all responsibility for a loan loss under this guarantee.
All remaining loans issued under our Housing Programs or Mortgage Insurance activities have not been internally rated and therefore the low credit risk presumption is not used. Our SICR assessment of these loans is primarily based on days past due, as this is a historically reliable indicator of loan credit quality and performance status. Following are the staging criteria:
| • | Stage 1: All current loans to 30 days past due. |
| • | Stage 2: Loans between 30 and 90 days past due. |
| • | Stage 3: Loans more than 90 days past due. Also, a loan that is not past due but has been issued a workout loan to assist with financial difficulties is considered credit impaired irrespective of days past due. |
If exceptional loan payment deferrals are granted, the circumstances under which they are granted are assessed to determine if their impact on days past due should result in a transfer between stages. When deferrals are the result of circumstances outside a borrower’s control, the deferral will not be treated as additional days past due and should not, in itself, result in a stage transfer.
Under the terms of certain construction loans issued by our Housing Programs Activity or workout loans issued by our Mortgage Insurance Activity, there may be a period of time where the loan has been advanced but is not under repayment and therefore days past due cannot be used in the SICR assessment. For these loans that are not under repayment, we assess SICR by applying the following criteria:
| • | Days past due on loans issued by the same borrower; |
| • | Collective assessment by reviewing past due status of borrowers with shared credit risk characteristics; |
| • | Qualitative assessment of specific indicators of the construction project such as: project delays, performance against budget and remaining costs to complete. |
Financial guarantees
Under the NHA MBS program, a financial institution (the “NHA MBS issuer”) creates a pool of insured mortgages and sells the pool to investors. The underlying pool of mortgages is designed to provide sufficient cash flows to fund the NHA MBS. The issuer is obligated to fund any cash flow shortfalls that may arise, thus exposing us to credit risk with the underlying pool of mortgages serving as a credit enhancement. Our assessment of SICR is therefore based on both the credit risk of the issuer and the credit risk of the pool of mortgages underlying the NHA MBS. The pool of mortgages is considered low credit risk since only mortgages that we or approved private mortgage insurers insure are eligible to be pooled in NHA MBS. The credit risk of the issuer is managed through due diligence in approving new issuers, ongoing monitoring of issuer credit quality and program compliance. We have further mitigated issuer credit risk by having been assigned all rights, title and interest in the underlying mortgages so that we have access to principal and interest payments in the event of issuer default.
2024 Annual Report — 76
Under the CMB program, the credit risk exposures are, by design, the CMB loans that are the sole source of funds to fulfill CHT’s CMB obligations. As previously discussed, the NHA MBS that are secured by pools of insured mortgages, reinvestment assets and swaps represent the sole source of repayment on the loans. The SICR assessment for the CMB guarantee is based on the credit risk of these supporting assets, all of which have been assessed as low credit risk.
We have assessed the TPG under both the NHA MBS and CMB programs as having low credit risk and we therefore apply the low credit risk exemption (stage 1).
Forward-looking macroeconomics variables
We have incorporated forward-looking economic information into our ECL by performing the calculation under multiple scenarios resulting in a probability-weighted average ECL based on the weightings of each scenario. We use three sets of economic forecasts for all instruments representing a baseline, upside and downside scenario.
We performed an economic variable selection process to identify the sets of macroeconomic variables that had the highest correlation with our portfolios. This process resulted in using different sets of economic variables depending on the geographic and industry sector of the exposure. The following variables are included: unemployment rates, oil prices, 10-year corporate bond spreads, and equity index values.
All macroeconomic variables are projected over a five-year period, with ECL subsequently reverting to long-run averages. We base our forecasts and scenario weightings on forecasted macroeconomic inputs published by third parties that are reviewed and approved by our Chief Economist.
Financial liabilities at amortized cost
Canada Mortgage Bonds
CMB are interest-bearing bullet bonds issued by CHT that we guarantee. Coupon payments are made semi-annually for fixed rate CMB and quarterly for floating rate CMB. Principal repayments on the bonds are made at maturity. The approved MBS Issuers reimburse CHT for the cost of arranging financing, including the fees paid to underwriters and others for the distribution of CMB. Transaction costs directly attributable to the issuance of CMB, net of reimbursements thereof, are included in the amount initially recognized and amortized to interest expense using the EIRM.
We may purchase and resell CMB in the market for investment purposes. Purchases are treated as retirements of debt with the difference between the purchase price and the carrying value of the CMB being recognized as a gain or loss in net gains (losses) on financial instruments. Subsequent sales are treated as re-issuance of the debt with gains and losses deferred and amortized over the remaining life of the CMB sold. When we hold a CMB to maturity or acquire CMB in the primary market, the related cash flows are excluded from the consolidated statement of cash flows as they are not considered external cash flows to the consolidated entity.
CMB program and IMPP
Loans under the CMB program and under the IMPP represent amounts due from Canadian financial institutions as a result of the sale of their beneficial interest in NHA MBS securities to us. These loans are funded by the issuance of CMB (CMB program) or borrowings from the Government of Canada (IMPP). There are both fixed and floating rate loans in this category. Under the CMB program, principal is due at maturity, and under the IMPP, principal is due monthly (amortizing).
Under these arrangements, substantially all the risks and rewards of the NHA MBS are retained by the issuers through swap agreements with us and CHT. Consequently, the NHA MBS that are secured by pools of insured mortgages, and the reinvestment securities under the CMB program, serve as collateral to the loans and are not recognized in the consolidated balance sheet. This collateral is, however, held in our name and represents the sole source of principal repayments for the loans and as previously discussed the collateral is presumed to have low credit risk. The amount due from the swap counterparties represents the interest earned on the loans and is recognized in interest income.
2024 Annual Report — 77
Investment property
Investment properties are properties held to earn rental income or for capital appreciation, or both. Investment properties are initially recognized at cost plus transaction costs and subsequent to initial recognition, they are measured at fair value. Gains or losses arising from changes in fair value are recognized in other income in the period in which they arise.
Pension and other post-employment benefits
We have a number of benefit arrangements which provide pension and other post-employment benefits to eligible employees. These include a federally regulated pension plan (Pension Plan), an unregistered supplemental pension plan (Supplemental Plan) and other non-pension post-employment defined benefits consisting mainly of life and medical insurance. The Supplemental Plan offers benefits in excess of statutory limits as defined under the Income Tax Act (ITA).
The Pension Plan is subject to the federal Pension Benefits Standards Act, 1985 (PBSA) and its regulations and to the ITA. The Pension Plan is registered with the Office of the Superintendent of Financial Institutions (OSFI) and the Canada Revenue Agency (CRA).
Defined benefits plans
The defined benefit plans include the Pension Plan and the Supplemental Plan as well as the other post-employment benefits (OPEB). The benefits available under both the Pension Plan and the Supplemental Plan are based on length of service and average annual salary.
The net defined benefit liability recognized is the present value of the obligations under the defined benefit plans less the fair value of the assets of those plans. The defined benefit plan assets are limited to the present value of any economic benefits available in the form of reductions in future contributions to these plans.
Net benefit costs of the plans include the current service costs and the interest cost on the defined benefit obligation net of the interest income on the plan assets and the gain or loss on curtailment. Net benefit costs are included in operating expenses.
Remeasurement gains and losses on defined benefit plans include actuarial gains and losses and changes in the return on plan assets (excluding net interest). They are recognized in OCI as incurred and then flow into retained earnings and are not reclassified to profit or loss in subsequent periods.
Income taxes
We are a prescribed federal Crown corporation under Reg. 7100 of the ITA and are subject to federal income tax as a prescribed corporation for purposes of subsection 27(2) of the ITA. We are not subject to provincial income tax. CHT is subject to federal and provincial income taxes on the amount of taxable income for the period and is permitted a deduction for all amounts paid or payable to CHT’s beneficiaries in determining income for tax purposes. As all taxable income was distributed to the beneficiaries, no provision for income taxes has been reflected for CHT.
We use the liability method of accounting for income taxes. Under this method, deferred income tax assets and liabilities are recognized based on the estimated tax effect of temporary differences between the carrying value of assets and liabilities on the financial statements and their respective tax bases. We use substantively enacted income tax rates at the balance sheet date that are expected to be in effect when the asset is realized or the liability is settled. The carrying amount of deferred income tax assets is reviewed at each balance sheet date and reduced to the extent that it is no longer probable that sufficient taxable profit will be available to allow all or part of the deferred income tax asset to be utilized.
2024 Annual Report — 78
Related party transactions
Except for funds borrowed from the Government for Lending programs under the CBP, related party transactions are made on terms equivalent to those that prevail in arm’s length transactions. Funds borrowed under the CBP, which we include in borrowings at amortized cost and borrowings designated at FVTPL, are at below market rates. In turn, this allows us to issue loans at favorable rates, which reduces the Government’s cost to subsidize social housing. Borrowings at below market rates generate gains, which we recognize in net gains (losses) on financial instruments at the borrowing date, as discussed previously under Initial measurement of financial instruments.
| 3. | Current and Future Accounting Changes |
Current accounting changes
There were no new or amended standards issued by the International Accounting Standards Board (IASB) that we adopted during the year.
Future accounting changes
Amendments to the Classification and Measurement of Financial Instruments – Amendments to IFRS 9 and IFRS 7 – effective date of 1 January 2026
In May 2024, the IASB issued amendments to the classification and measurement requirements in IFRS 9 Financial Instruments and IFRS 7 Financial Instruments Disclosures. The objective of the amendments is to address diversity in accounting practice by making the requirements more understandable and consistent. The amendments are required to be implemented by 1 January 2026.
The amendments include changes to classification and measurement requirements under IFRS 9 for the de-recognition of financial liabilities and additional guidance to assess the contractual cash flow characteristics of financial assets with environmental, social and governance (ESG)-linked, non-recourse and contractually linked features. The proposed amendments to IFRS 7 include additional disclosure requirements for investments in equity instruments held at FVOCI and financial instruments with contingent events.
We are currently assessing the impact on our consolidated financial statements.
IFRS 18 Presentation and Disclosure in the Financial Statements – effective date of 1 January 2027
In April 2024, the International Accounting Standards Board (IASB) issued IFRS 18 Presentation and Disclosure in the Financial Statements (IFRS 18), which will replace IAS 1 Presentation of Financial Statements.
The objective of IFRS 18 is to improve how information is communicated in the financial statements, with a focus on information in the Statement of Income and Comprehensive Income. IFRS 18 is required to be implemented by 1 January 2027.
IFRS 18 will include requirements for additional defined subtotals in the statement of income and comprehensive income (classifying the results between operating, investing, and financing), disclosures about management performance measures, and revised requirements for aggregation and disaggregation of information.
We are currently assessing the impact on our consolidated financial statements.
2024 Annual Report — 79
| 4. | Critical Judgments in Applying Accounting Policies and Making Estimates |
Judgment in applying accounting policies
We have made the following judgments, which have the most significant effect on the amounts recognized in our consolidated financial statements.
Consolidation
We apply significant judgment in assessing whether the substance of our relationship with CHT indicates that we control CHT. We guarantee the timely payment of principal and interest on the CMB, and choose when to provide that guarantee. CHT cannot undertake new business (e.g. issue new bonds) without the benefit of a guarantee, and we are currently its only available guarantor. Within that context, we have direct influence over the activities of CHT and can use this influence to manage our exposure to CHT.
Derecognition
In assessing whether transfers of NHA MBS from Issuers to CHT under the CMB program, and to us under the IMPP, qualify for derecognition, significant judgment is applied in determining whether substantially all the risks and rewards of ownership of the NHA MBS have been transferred. We have determined that the issuers of NHA MBS to CHT or to us, fail to meet the derecognition criteria as they retain the risk and rewards of the NHA MBS through swap agreements. As a result, we do not recognize the underlying NHA MBS in the consolidated balance sheet, but rather account for the transfers as loans.
Use of estimates
In preparing our consolidated financial statements, we are required to make estimates that affect the reported amount of revenues, expenses, assets and liabilities, and the accompanying disclosures. The key assumptions concerning the future and other key sources of estimation uncertainty at the reporting date that have a significant risk of causing a material adjustment to the carrying amounts of assets and liabilities within the next financial year are discussed in the following sections. We based our estimates on information available when the consolidated financial statements were prepared. Existing circumstances and assumptions about future developments, however, may change due to market changes or circumstances arising that are beyond our control. Such changes are reflected in the estimate when they occur.
Insurance contract liabilities
The insurance contract liability at 31 December is determined using deterministic cashflow models that consider a range of possible economic conditions. The following assumptions are used when calculating the cash flows within the boundary of our insurance contract liabilities:
Claims frequency
Arrears rate and claim rate
The arrears rate is determined by loans that are more than 90 days past due for our homeowner and portfolio insurance products and 30 days past due for multi-unit insurance products and is a key determinant of future claims. A claim occurs when a borrower has defaulted on the loan and the lender has completed the foreclosure. The arrears and claim rate assumptions are based on our own experience and expectations.
An increase (decrease) in expected arrears or claim rates will increase (decrease) the expected claim cost which will reduce (increase) future profits.
Termination rate
A termination occurs when an insurance contract is no longer in-force and there is no reported claim. Termination rate assumptions are based on historical experience and are adjusted, when appropriate, to reflect revised expectations.
2024 Annual Report — 80
An increase (decrease) in expected termination rates will reduce (increase) the expected claim frequency which will increase (decrease) future profits.
Cure rate
A loan is cured from arrears when the borrower pays all the past due amounts. Cure rate assumptions are based on historical experience and are adjusted, when appropriate, to reflect revised expectations.
An increase (decrease) in expected cure rates will reduce (increase) the expected claim frequency which will increase (decrease) future profits.
Claims severity
Loss given default
LGD represents the estimated net cash outflow when a default occurs and is based on historical experience and adjusted, when appropriate, to reflect revised expectations.
An increase (decrease) in loss given default will increase (decrease) the fulfilment cash flow which will reduce (increase) future expected profits.
Economic conditions (unemployment rate and housing repeat-sales price index)
The economic conditions are non-financial assumptions used to project future claim levels. Changes in these assumptions, which impact both claim frequency and claim severity, could increase or decrease the fulfilment cash flow which will impact future profits. An increase (decrease) in unemployment rate (UR) or a decrease (increase) in the housing repeat-sales price index (RPI) will increase (decrease) claims. Refer to Note 7 for more details on these assumptions.
Determining the LRC and LIC involves the risk that the actual results will deviate, and in certain cases significantly, from the estimates made.
The LIC reflects claims that have been IBNR, CIP, IBNER and reduced by BJR. The estimate for IBNR is based on loans that are reported in arrears and an estimate of loans that are not yet reported in arrears (pure IBNR) at the valuation date and the probability of those loans going to claim without subsequently becoming cured. The CIP are estimated by multiplying the insured loan amounts by the claim severity. The estimate for IBNER is estimated from the payment pattern of the supplementary amounts on open claims. The estimate for BJR is determined based on historical information on BJR received related to claims paid.
The fulfilment cash flows included in the LRC relate to future claims that are derived from simulations that project the lifecycle of mortgages. This includes considerations such as mortgage renewals, prepayments, and variable rate versus fixed rate mortgages. These are subject to a greater degree of uncertainty than the LIC.
Risk adjustment
The risk adjustment for non-financial risk represents the compensation required for bearing the uncertainty of the amount and timing of the cash flows of groups of insurance contracts and covers insurance risk, lapse risk and expense risk. The risk adjustment reflects the amount we would pay to remove the uncertainty that the future cash outflows will exceed our best estimate of our insurance contract liabilities. We have estimated our risk adjustment for non-financial risk using a cost of capital approach for the LRC and the quantile approach for the LIC. The cost of capital approach requires us to estimate the fulfilment cash flows, and the required capital at each future date following regulatory capital requirements. A cost of capital rate is applied to the additional capital requirement in future reporting periods. The cost of capital represents the return required to compensate for exposure to the non-financial risk and is set at 6% per annum. The quantile approach requires us to estimate a distribution of the fulfillment cash flows and select a confidence level that reflects our risk appetite.
2024 Annual Report — 81
We target an overall confidence level for both the LRC and LIC to be within the range of 85%-90%. As at 31 December 2024, the risk adjustment for our insurance contracts corresponds to a 87% confidence level for both the LRC and LIC.
The risk adjustment is reassessed annually during the fourth quarter as part of the year-end valuation process. Throughout the year, we monitor actual claim experience and economic indicators. If evidence justifies a revision before the next scheduled reassessment, adjustments to the risk adjustment may be made accordingly.
Discount rate
Fulfilment cashflows are determined by discounting the expected future cash flows using a bottom-up approach, starting with a risk-free curve and applying an illiquidity premium. The risk-free curve is determined by reference to the Government of Canada yield curve. The illiquidity premium is determined by reference to observable market rates of A-rated and BBB-rated investment grade bonds, plus a constant illiquidity premium factor of 0.5%.
The weighted average discount rates applied for discounting of future cash flows as at 31 December are listed below:
Portfolio duration
| 1-5 years | 5-10 years | 10-15 years | 15-20 years | 20-25 years | over 25 years | |||||||||||||||||||||||||||||||||||||||||||
| 2024 | 2023 | 2024 | 2023 | 2024 | 2023 | 2024 | 2023 | 2024 | 2023 | 2024 | 2023 | |||||||||||||||||||||||||||||||||||||
| Discount rates |
4.0% | 4.9% | 4.5% | 4.8% | 4.9% | 4.8% | 5.1% | 4.9% | 5.1% | 4.9% | 5.0% | 4.9% | ||||||||||||||||||||||||||||||||||||
Coverage units
The CSM is a component of the LRC and represents the unearned profit to be recognized as insurance coverage is provided.
An amount of the CSM by group of insurance contracts is recognized as insurance revenue each quarter reflecting the services provided during the period.
The amount of CSM recognized is determined by:
| • | identifying the coverage units applicable to groups of insurance contracts; |
| • | allocating the CSM at the end of the period equally to each coverage unit provided in the current period and expected to be provided in future periods; and |
| • | recognizing, in insurance revenue, the amount allocated to coverage units provided in the period. |
The number of coverage units in a group is the total coverage expected to be provided by the insurance contracts in the group, determined by considering the quantity of the benefits provided and the expected duration of the coverage. The quantity of benefits expected to be provided to the policyholder at the end of each period is the outstanding mortgage balance, including accrued interest and customary settlement costs, less the estimated sales price of the insured property securing the mortgage. This is calculated based on a historical average LGD (claim severity), given a loan is in arrears. The total coverage units of each group of insurance contracts are reassessed at the end of each reporting period to reflect changes of expected LGD. The coverage units are then allocated based on probability-weighted average duration of each coverage unit provided in the current period and expected to be provided in the future.
Level of aggregation – grouping criteria
Once insurance contracts are aggregated into portfolios based on mortgage insurance products, expected profitability is used to further disaggregate the insurance contracts into those contracts that are onerous, those that have no significant chance of becoming onerous subsequently and a remaining other group of contracts within the portfolio.
2024 Annual Report — 82
To assess expected profitability, the following characteristics are used:
| • | pricing levels (loan-to-value band); |
| • | product type (affordable, market, purchase, refinance, new construction); |
| • | credit score band; |
| • | region or province; and |
| • | property type (standard, student, retirement, supportive, single room). |
This assessment is performed on a quarterly basis.
Mortgage Insurer Capital Adequacy Test
Insurance-in-force (IIF) is a key input in determining our MICAT ratio and is subject to estimation. Due to availability of data, IIF used in the MICAT is the higher of 1) a projection reflecting an estimate of new business, terminations and claims from our most recent previous quarter-end; and 2) our actual IIF as reported by lenders for the previous quarter-end. Changes in underwriting requirements, regulatory environment and market trends can add volatility to our estimate.
As interest rates began to decline, we observed a more rapid decrease in the number of negatively amortizing variable rate mortgage (VRM) loans. This downward trend in VRM loans at maximum amortization is expected to persist in the coming quarters as these loans gradually revert to their original amortization schedules. However, until the number of these loans returns to pre-interest rate increase levels, they will continue to impact our required capital. At the balance sheet date, we estimate the MICAT ratio would be 3% points higher if these VRM loans were not negatively amortizing.
Valuation of pension benefit obligation
The current service cost of the defined benefit pension plan and the present value of the pension obligation are determined based on actuarial valuations. The actuarial valuation involves making various assumptions that may differ from actual developments in the future. These include the determination of the discount rate, mortality rates and inflation. Due to the complexities involved in the valuation and its long-term nature, a defined benefit obligation is highly sensitive to changes in these assumptions. All assumptions are reviewed at least annually.
The assumption most sensitive to change is the discount rate. In determining the appropriate discount rate, we consider the interest rates of Canadian dollar corporate bonds with an ‘AA’ rating and extrapolated as needed along the yield curve to correspond with the expected term of the defined benefit obligation. The mortality rate is based on publicly available Public Sector mortality tables for Canada as we have determined they are representative of our workforce.
In assessing the recoverability of the defined benefit plan assets, we have applied assumptions to determine the maximum future economic benefit available from a reduction in future contributions. This is determined by the difference between the present value of employer current service costs and the present value of the projected employer minimum funding requirements (MFR). In determining the MFR we have applied assumptions around discount rates (5.95% on a going concern basis and 4.25% on a solvency basis per year) and projected future asset returns (6.5% per year).
See Note 24 for more information on assumptions and sensitivity.
Estimation Uncertainty
In the current evolving geopolitical environment, including the potential for financial impact on our business of subsequently enacted trade tariffs, there is currently a heightened level of estimation uncertainty for the Corporation. Subsequent to 31 December 2024, there have been a number of different tariffs and other actions that have been enacted and subsequently revised with the potential for further revisions. Our 2024 financial results are based on information about these market conditions that were reasonably available as at 31 December 2024, and therefore, do not reflect the tariffs and other actions subsequently enacted. Trade tariffs or other actions may impact certain industries more than others and the nature and extent of the trade tariffs and other actions will determine the impact on our financial results.
For our Mortgage Insurance business, tariffs may decrease demand for Canadian products, affecting our gross domestic product, which may in turn lead to volatility in unemployment rates. Additionally, housing starts may decrease, sales of existing homes may fall and so could house prices. Should both unemployment increase and house prices decrease, we
2024 Annual Report — 83
may see additional insurance claims and a higher present value of future claims and a lower contractual service margin. See Note 7 for more information on the concentration risk of our existing book of business.
For the same reasons noted above, we may experience additional volatility in the expected credit losses of our financial assets at amortized cost and fair value through other comprehensive income. See Note 19 for more information on the concentration risk of our investment portfolio.
We are currently assessing the potential impacts of the enacted tariffs and other actions, as well as any subsequent revisions to these tariffs and actions, on our consolidated financial statements. Estimate of these impacts and whether they are material is not yet available. Impacts are expected to be reflected in our financial results in future quarters. We generally expect forward looking volatility in these estimates to be higher than recent quarters and may change from quarter to quarter.
| 5. | Segmented Information |
Our operating segments include Housing Programs, Mortgage Insurance, Mortgage Funding and CHT. As described in Note 1, we have determined our reportable segments to be Housing Programs, Mortgage Insurance and Mortgage Funding.
Our Chief Operating Decision Maker (CODM) is our President and Chief Executive Officer. Our CODM monitors the operating results of the activities separately for the purpose of making decisions about resource allocation and performance assessment. Segment performance is evaluated based on financial and non-financial metrics that are tied to the objectives of each operating segment and may differ by operating segment.
Housing Programs includes Housing and Lending programs which share many similarities and satisfy the same objective of supporting access to affordable housing for Canadians in need. Our CODM allocates resources and assesses performance of the Housing and Lending programs as one. Housing programs are administered either directly by us or by provinces and territories under SHA and the Federal/Provincial/Territorial Housing Partnership Framework. We lend to non-profit and private sectors, First Nations, Métis and Inuit organizations and communities, provinces and municipalities in the delivery of affordable and community housing programs. Housing Programs earns interest income on loans and investments, and receives government funding to operate its housing programs.
Mortgage Insurance provides mortgage insurance for transactional homeowner, portfolio and multi-unit residential loans in all parts of Canada. We operate these programs on a commercial basis with due regard for loss without the need for funding from the Government. Mortgage Insurance revenues are earned from premiums, fees and investment income.
Mortgage Funding provides TPGs of interest and principal of securities issued on the basis of eligible housing loans and on CMB. We provide these guarantees on a commercial basis. Mortgage Funding also includes interests in NHA MBS as a result of acquisitions under the IMPP in 2020.
CHT’s functions include the acquisition of interests in eligible housing loans such as NHA MBS, the issuance of CMB, as well as the purchase of highly rated investments and certain related financial hedging activities.
For the purposes of our segmented reporting, we aggregate Mortgage Funding and CHT (a separate entity) in the Mortgage Funding reportable segment. Accordingly, Mortgage Funding earns revenues from guarantee and application fees, and investment income.
Mortgage Funding and CHT both support our objective of ensuring adequate supply of funds for mortgage lending through mortgage securitization. Through the CMB program in its entirety (including the guarantee by Mortgage Funding) and the IMPP, we contribute to the stability of the financial system by allowing lenders to access funds for residential mortgage lending.
Both segments’ business is generated by market demand for our TPG for mortgage funding through NHA MBS and through CMB issued by CHT.
There are many similarities in the nature of the issuance processes, customers and methods of distribution. CMB are available to both institutional investors and retail investors and can be bought through investment dealers, banks, trust companies, and other types of financial institutions. The guarantee takes effect at issuance.
2024 Annual Report — 84
Corporate overheads and assets are allocated to each operating segment and are included in the amounts presented.
We define a major lender to be one from which we receive premiums, guarantee fees, and application fees amounting to 10% or more of our total premiums and fees received. In 2024, we received amounts totaling $769 million, or 23% of our total premiums and fees received, from two major lenders (2023 – no major lenders). We report these amounts in our Mortgage Insurance and Mortgage Funding Activities; see Note 2 for information on our revenue recognition policies.
For all segments, revenues are attributed to, and assets are located in, Canada.
| Housing Programs Activity |
Mortgage Insurance Activity |
Mortgage Funding Activity |
Eliminations | Total | ||||||||||||||||||||||||||||||||||||
| (in millions) |
2024 | 2023 | 2024 | 2023 | 2024 | 2023 | 2024 | 2023 | 2024 | 2023 | ||||||||||||||||||||||||||||||
| Interest income |
724 | 570 | - | - | 7,317 | 6,514 | (2) | (7) | 8,039 | 7,077 | ||||||||||||||||||||||||||||||
| Interest expense |
(624) | (481) | - | - | (7,308) | (6,505) | 16 | 25 | (7,916) | (6,961) | ||||||||||||||||||||||||||||||
| Net interest income |
100 | 89 | - | - | 9 | 9 | 14 | 18 | 123 | 116 | ||||||||||||||||||||||||||||||
| Insurance revenue |
- | - | 1,087 | 1,004 | - | - | - | - | 1,087 | 1,004 | ||||||||||||||||||||||||||||||
| Insurance service expense |
- | - | (137) | (119) | - | - | - | - | (137) | (119) | ||||||||||||||||||||||||||||||
| Insurance service result |
- | - | 950 | 885 | - | - | - | - | 950 | 885 | ||||||||||||||||||||||||||||||
| Investment income (losses) |
- | - | 660 | 473 | 117 | 90 | (12) | (10) | 765 | 553 | ||||||||||||||||||||||||||||||
| Net gains (losses) on financial instruments |
(66) | (82) | (113) | (126) | (18) | (8) | 3 | 4 | (194) | (212) | ||||||||||||||||||||||||||||||
| Insurance finance expense for contracts issued |
- | - | (263) | (178) | - | - | - | - | (263) | (178) | ||||||||||||||||||||||||||||||
| Net financial result |
(66) | (82) | 284 | 169 | 99 | 82 | (9) | (6) | 308 | 163 | ||||||||||||||||||||||||||||||
| Government funding |
4,606 | 5,494 | - | - | - | - | - | - | 4,606 | 5,494 | ||||||||||||||||||||||||||||||
| Housing programs expenses |
(4,240) | (5,114) | - | - | - | - | - | - | (4,240) | (5,114) | ||||||||||||||||||||||||||||||
| Premiums and fees earned |
- | - | 38 | 33 | 901 | 827 | - | - | 939 | 860 | ||||||||||||||||||||||||||||||
| Operating expenses |
(417) | (405) | (196) | (172) | (65) | (64) | - | - | (678) | (641) | ||||||||||||||||||||||||||||||
| Other income (loss) |
(1) | (2) | (18) | (17) | 9 | 6 | - | - | (10) | (13) | ||||||||||||||||||||||||||||||
| Self-insurance service income (expenses) |
- | - | (2) | 8 | - | - | - | - | (2) | 8 | ||||||||||||||||||||||||||||||
| Income before income taxes |
(18) | (20) | 1,056 | 906 | 953 | 860 | 5 | 12 | 1,996 | 1,758 | ||||||||||||||||||||||||||||||
| Income taxes |
- | - | (263) | (230) | (238) | (215) | (1) | (3) | (502) | (448) | ||||||||||||||||||||||||||||||
| Net income |
(18) | (20) | 793 | 676 | 715 | 645 | 4 | 9 | 1,494 | 1,310 | ||||||||||||||||||||||||||||||
| Other comprehensive income (loss) |
21 | (12) | 204 | 334 | 54 | 61 | (12) | (11) | 267 | 372 | ||||||||||||||||||||||||||||||
| Comprehensive income (loss) |
3 | (32) | 997 | 1,010 | 769 | 706 | (8) | (2) | 1,761 | 1,682 | ||||||||||||||||||||||||||||||
| Total revenues and government funding1 |
4,639 | 5,499 | 1,254 | 1,070 | 1,018 | 924 | 5 | 12 | 6,916 | 7,505 | ||||||||||||||||||||||||||||||
| Less Inter-segment income (loss)2 |
2 | 7 | 9 | 6 | (16) | (25) | 5 | 12 | - | - | ||||||||||||||||||||||||||||||
| External revenues and government funding |
4,637 | 5,492 | 1,245 | 1,064 | 1,034 | 949 | - | - | 6,916 | 7,505 | ||||||||||||||||||||||||||||||
| 1 | Includes net interest income, insurance service result, net financial result, government funding, premiums and fees earned and other income. |
| 2 | Inter-segment income (loss) relates to the following: |
• Housing Programs recognizes interest income from investing in holdings of CMB;
• Mortgage Insurance recognizes investment income from investing in holdings of CMB; and
• Within Mortgage Funding, CHT recognizes interest expense on CMB held by Housing Programs and Mortgage Insurance.
2024 Annual Report — 85
As at 31 December
| Housing Programs Activity |
Mortgage Insurance Activity |
Mortgage Funding Activity |
Eliminations1 | Total | ||||||||||||||||||||||||||||||||||||
| (in millions) |
2024 | 2023 | 2024 | 2023 | 2024 | 2023 | 2024 | 2023 | 2024 | 2023 | ||||||||||||||||||||||||||||||
| Assets |
||||||||||||||||||||||||||||||||||||||||
| Cash and cash equivalents |
1,388 | 1,169 | 262 | 767 | 5 | 3 | - | - | 1,655 | 1,939 | ||||||||||||||||||||||||||||||
| Securities purchased under resale agreements |
950 | 700 | - | - | - | - | - | - | 950 | 700 | ||||||||||||||||||||||||||||||
| Accrued interest receivable |
74 | 79 | 123 | 98 | 921 | 667 | (1) | (1) | 1,117 | 843 | ||||||||||||||||||||||||||||||
| Investment securities: |
||||||||||||||||||||||||||||||||||||||||
| Fair value through profit or loss |
- | - | 57 | 69 | - | - | - | - | 57 | 69 | ||||||||||||||||||||||||||||||
| Fair value through other comprehensive income |
- | - | 19,298 | 16,808 | 4,499 | 3,855 | (510) | (501) | 23,287 | 20,162 | ||||||||||||||||||||||||||||||
| Amortized cost |
3,644 | 3,456 | - | - | - | - | (75) | (227) | 3,569 | 3,229 | ||||||||||||||||||||||||||||||
| Derivatives |
- | - | - | 161 | - | - | - | - | - | 161 | ||||||||||||||||||||||||||||||
| Due from the Government of Canada |
177 | 240 | - | - | - | - | - | - | 177 | 240 | ||||||||||||||||||||||||||||||
| Loans: |
||||||||||||||||||||||||||||||||||||||||
| Fair value through profit or loss |
502 | 494 | 19 | 18 | - | - | - | - | 521 | 512 | ||||||||||||||||||||||||||||||
| Amortized cost |
16,713 | 12,616 | 24 | 38 | 277,791 | 257,996 | - | - | 294,528 | 270,650 | ||||||||||||||||||||||||||||||
| Accounts receivable and other assets |
90 | 176 | 265 | 190 | 121 | 113 | - | - | 476 | 479 | ||||||||||||||||||||||||||||||
| Investment property |
396 | 398 | - | - | - | - | - | - | 396 | 398 | ||||||||||||||||||||||||||||||
| Defined benefit plans asset |
85 | 79 | 107 | 102 | 7 | 6 | - | - | 199 | 187 | ||||||||||||||||||||||||||||||
| Deferred income tax assets |
(106) | - | 511 | - | 16 | - | 2 | - | 423 | - | ||||||||||||||||||||||||||||||
| 23,913 | 19,407 | 20,666 | 18,251 | 283,360 | 262,640 | (584) | (729) | 327,355 | 299,569 | |||||||||||||||||||||||||||||||
| Liabilities |
||||||||||||||||||||||||||||||||||||||||
| Accounts payable and other liabilities |
530 | 440 | 115 | 98 | 48 | 35 | - | - | 693 | 573 | ||||||||||||||||||||||||||||||
| Income taxes payable |
3 | 28 | 204 | 486 | 22 | 31 | - | - | 229 | 545 | ||||||||||||||||||||||||||||||
| Accrued interest payable |
147 | 137 | - | - | 897 | 650 | (1) | (1) | 1,043 | 786 | ||||||||||||||||||||||||||||||
| Derivatives |
70 | 51 | 135 | 4 | - | - | - | - | 205 | 55 | ||||||||||||||||||||||||||||||
| Insurance contract liabilities |
- | - | 8,455 | 7,079 | - | - | - | - | 8,455 | 7,079 | ||||||||||||||||||||||||||||||
| Borrowings: |
||||||||||||||||||||||||||||||||||||||||
| Fair value through profit or loss |
148 | 219 | - | - | - | - | - | - | 148 | 219 | ||||||||||||||||||||||||||||||
| Amortized cost |
22,121 | 17,502 | - | - | 277,791 | 257,996 | (587) | (741) | 299,325 | 274,757 | ||||||||||||||||||||||||||||||
| Defined benefit plans liability |
77 | 77 | 97 | 97 | 6 | 6 | - | - | 180 | 180 | ||||||||||||||||||||||||||||||
| Unearned premiums and fees |
- | - | 383 | 278 | 2,660 | 2,498 | - | - | 3,043 | 2,776 | ||||||||||||||||||||||||||||||
| Deferred income tax liabilities |
- | 139 | - | (71) | - | (33) | - | 1 | - | 36 | ||||||||||||||||||||||||||||||
| 23,096 | 18,593 | 9,389 | 7,971 | 281,424 | 261,183 | (588) | (741) | 313,321 | 287,006 | |||||||||||||||||||||||||||||||
| Equity of Canada |
817 | 814 | 11,277 | 10,280 | 1,936 | 1,457 | 4 | 12 | 14,034 | 12,563 | ||||||||||||||||||||||||||||||
| 23,913 | 19,407 | 20,666 | 18,251 | 283,360 | 262,640 | (584) | (729) | 327,355 | 299,569 | |||||||||||||||||||||||||||||||
| 1 | The balance sheet eliminations remove inter-segment holdings of CMB and inter-segment receivables/payables. |
2024 Annual Report — 86
| 6. | Government Funding and Housing Programs Expenses |
Our activities are presented into the following three core responsibilities.
| • | Assistance for housing needs: encompasses programs where we provide federal funding (primarily contribution based programs) to improve access to affordable housing for Canadians in housing need, including First Nations, Métis and Inuit peoples, Canadians with special or distinct needs, and certain vulnerable groups. |
| • | Financing for housing: encompasses programs whereby we make financing available (primarily loan based programs) for new and existing housing-related initiatives. |
| • | Housing expertise and capacity development: encompasses a variety of programs whereby we support capacity and skills development activities within the housing sector and conduct research and analysis as well as disseminate information on a range of issues that support the housing sector and inform decision making by Government and other sectors. |
The following table presents the amount of government funding, including housing programs expenses and operating expenses incurred to support these programs by core responsibility.
| (in millions) |
2024 | 2023 | ||||||
| Assistance for housing needs |
2,568 | 3,381 | ||||||
| Financing for housing |
1,385 | 1,182 | ||||||
| Housing expertise and capacity development |
879 | 925 | ||||||
| Total |
4,832 | 5,488 | ||||||
| Net change in government funding deferred in the year |
(226) | 6 | ||||||
| Total government funding recognized1 |
4,606 | 5,494 | ||||||
| Operating expenses recovery |
(393) | (386) | ||||||
| Expected credit loss (recovery) |
22 | (13) | ||||||
| Capital assets recovery2 |
5 | 19 | ||||||
| Total housing programs expenses recognized |
4,240 | 5,114 | ||||||
| 1 | Total government funding recognized does not include gains resulting from below market rate funds borrowed under the Crown Borrowing Program, which are recognized in net gains (losses) on financial instruments. These gains totaled $140 million (2023 – $80 million). |
| 2 | Relates to housing programs expenses in which the appropriations are deducted from the carrying amount of the related capital assets. |
The following table presents the change in the due from the Government of Canada account. The outstanding balance as at 31 December 2024 is mainly composed of housing programs expenses incurred but not yet reimbursed.
| (in millions) |
2024 | 2023 | ||||||
| Balance at beginning of the year |
240 | (6) | ||||||
| Total government funding |
4,832 | 5,488 | ||||||
| Government funding received during the year |
(4,885) | (5,483) | ||||||
| Third party remittances owing to the Government of Canada |
(14) | (7) | ||||||
| Balance at end of year before prior/future year adjustments |
173 | (8) | ||||||
| Net change in One-time top-up to the Canada Housing Benefit advances |
24 | 229 | ||||||
| Net change in prior year adjustments |
(20) | 19 | ||||||
| Balance at end of year |
177 | 240 | ||||||
2024 Annual Report — 87
| 7. | Mortgage Insurance |
Mortgage Insurance risk management
We assume the risk of loss from borrower default through mortgage insurance contracts entered into with approved lenders, exposing us to uncertainty surrounding the timing, frequency and severity of claims. Insurance risk management policies are in place to identify, mitigate, report and monitor this risk to ensure activities are managed within our risk appetite, tolerances and risk limits to successfully deliver on our mandate and meet our strategic directions.
We manage our exposure to insurance risk of loss through prudent product design, pricing, insurance underwriting policies, claims payment and default management, reserving, fraud and misrepresentation risk management, market diversification and borrower review and monitoring for the multi-unit, portfolio and transactional homeowner products.
Product design
The development of mortgage insurance products takes into account changing client needs, new legislation and regulations, the evolving economic environment and our mandate to serve Canadians across the country, particularly in those market segments not served or less well-served by the private sector. Product design is based on prudent underwriting practices combined with our goal to ensure that creditworthy borrowers have access to mortgage insurance products that meet their needs.
Pricing
Premiums are set based on projections of claim frequency, claim severity, return on investment, operating expenses, taxes, capital targets, profitability considerations and market demand. In addition, pricing decisions also take into account other considerations related to competition, strategic direction and our public mandate. Pricing risk refers to the potential that these projections and considerations may substantively and persistently differ from actual developments and values in the long term, which could have significant implications for our risk of loss, profitability and achievement of mandate.
At least annually, we conduct a pricing review of our products to: i) ensure they support Canadians in meeting their housing needs for a wide range of housing types and tenures; ii) support the profitability and long-term viability of the Mortgage Insurance Activity; iii) foster competition; iv) support financial stability; and v) be in line with our risk appetite and tolerances.
Insurance underwriting policies
Risks related to underwriting could arise from: i) the lender; ii) the borrower; iii) the property; and/or iv) the market. As a result, we have developed prudent and disciplined underwriting policies and guidelines which set the contractual framework and general obligations with respect to underwriting, provides approved lenders with underwriting criteria for mortgage insurance and also includes policies to obtain the approved lender designation.
In addition, for transactional homeowner products, risks related to insurance for different types of residential properties are assessed using our mortgage insurance risk assessment methodology and a rigorous underwriting and post-approval due diligence process.
In the case of multi-unit underwriting, due to different risk characteristics, applications undergo additional individual in-depth assessments to evaluate borrower, property, market and loan characteristics by our underwriters.
Claims payment and default management
Our Claims Payment Centre supports approved lenders in managing default related to homeowner and small rental loans to reduce risk of default on payment.
2024 Annual Report — 88
Our Insurance Servicing team works with approved lenders for multi-unit residential rental, licensed care or retirement properties in resolving default situations, evaluating workout alternatives and other matters. We consider workouts through effective management of projects in difficulty by following established frameworks.
We actively pursue recoveries, which are amounts expected to be recovered from borrowers to mitigate our potential loss.
Reserving
Reserving risk refers to the risk that insurance liabilities differ significantly from the actual claim payments. We estimate insurance policy liabilities to cover future losses and payments on claims. These policy liabilities are established based on projections of claim frequency, severity and timing, within the context of the economic environment and recent performance indicators such as arrears rates.
Fraud and misrepresentation risk management
Fraud risk management comprises all activities aiming to detect and prevent fraud or misrepresentation and mitigating losses due to fraud or misrepresentation. We mitigate fraud using models to identify mortgage loan applications that have a high probability of containing misrepresentation and taking the appropriate measures upon identification. We maintain specialized underwriting staff to review these claims and, if appropriate, require enhanced due diligence by the lender.
Market diversification
Concentration risk may arise from insurance contracts issued in a particular geographical area where local economic conditions are significantly different from the national average that could expose us to a greater risk of loss. The relative impact of the outcome is mitigated as a result of the distribution of business across different geographic areas. There are no lender or regional limits on business volumes as our mandate is to support Canadians’ housing needs from coast to coast. However, we do monitor the conditions of the housing market and economy in each region of Canada against predetermined risk tolerances in accordance with our Risk Appetite Framework.
The following table sets out the concentration of original loan amount insured during the year:
| 2024 | 2023 | |||||||||||||||||||||||||||||||
| Transactional | Multi-Unit | Transactional | Multi-Unit | |||||||||||||||||||||||||||||
| (in percentages) |
Homeowner | Portfolio | residential | Overall | Homeowner | Portfolio | residential | Overall | ||||||||||||||||||||||||
| Atlantic |
7 | 7 | 7 | 7 | 7 | 7 | 8 | 8 | ||||||||||||||||||||||||
| Quebec |
28 | 16 | 31 | 30 | 25 | 15 | 30 | 27 | ||||||||||||||||||||||||
| Ontario |
26 | 36 | 28 | 28 | 27 | 37 | 29 | 29 | ||||||||||||||||||||||||
| Prairies and Territories |
29 | 24 | 19 | 21 | 30 | 27 | 19 | 23 | ||||||||||||||||||||||||
| British Columbia |
10 | 17 | 15 | 14 | 11 | 14 | 14 | 13 | ||||||||||||||||||||||||
| Canada |
100 | 100 | 100 | 100 | 100 | 100 | 100 | 100 | ||||||||||||||||||||||||
Monitoring
A comprehensive monitoring and quality assurance framework also enables our ongoing rigorous review of business trends, performance and lender compliance in order to make timely adjustments to underwriting and other risk management criteria and processes as needed.
2024 Annual Report — 89
Insurance-in-force
At 31 December 2024, insurance-in-force, which represents the maximum potential total risk exposure of the Mortgage Insurance Activity, totaled $440 billion (2023 – $414 billion). This amount includes $9,646 million (2023 – $6,952 million) in outstanding loan balances from the Lending programs included in the Housing Programs Activity (refer to Note 14). Under Section 11 of the NHA, the total of outstanding insured amounts of all insured loans may not exceed the limit of $800 billion (2023 – $750 billion). Budget 2024 proposed to increase the insurance-in-force limit to $800 billion, which became effective June 2024.
The following table presents the percentage distribution of insurance-in-force by region:
| 2024 | 2023 | |||||||||||||||||||||||||||||||
| Transactional | Multi-Unit | Transactional | Multi-Unit | |||||||||||||||||||||||||||||
| (in percentages) |
Homeowner | Portfolio | residential | Overall | Homeowner | Portfolio | residential | Overall | ||||||||||||||||||||||||
| Atlantic |
7 | 4 | 6 | 6 | 7 | 4 | 6 | 6 | ||||||||||||||||||||||||
| Quebec |
26 | 13 | 30 | 26 | 26 | 13 | 30 | 25 | ||||||||||||||||||||||||
| Ontario |
24 | 44 | 34 | 32 | 24 | 46 | 35 | 33 | ||||||||||||||||||||||||
| Prairies and Territories |
33 | 21 | 16 | 23 | 33 | 20 | 15 | 23 | ||||||||||||||||||||||||
| British Columbia |
10 | 18 | 14 | 13 | 10 | 17 | 14 | 13 | ||||||||||||||||||||||||
| Canada |
100 | 100 | 100 | 100 | 100 | 100 | 100 | 100 | ||||||||||||||||||||||||
Overview of insurance contracts
The following table presents the insurance contract liabilities by portfolio at year end.
| (in millions) |
2024 | 2023 | ||||||
| Insurance contracts |
||||||||
| Transactional homeowner |
3,312 | 3,180 | ||||||
| Portfolio |
103 | 135 | ||||||
| Multi-unit residential |
5,040 | 3,764 | ||||||
| Total insurance contract liabilities |
8,455 | 7,079 | ||||||
Insurance revenue
The following table presents the breakdown of insurance revenue recognized in the year.
| (in millions) |
2024 | 2023 | ||||||
| Amounts relating to changes in the liability for remaining coverage |
||||||||
| CSM recognized for services provided |
692 | 685 | ||||||
| Change in the risk adjustment for non-financial risk |
172 | 130 | ||||||
| Expected incurred claims and other insurance expenses |
172 | 148 | ||||||
| Recovery of insurance acquisition cash flows |
51 | 41 | ||||||
| Total insurance revenue |
1,087 | 1,004 | ||||||
2024 Annual Report — 90
Net financial result
The following table presents the net financial result, specifically, the relationship between the insurance finance expenses and investment returns on assets. The table presents net financial result for our mortgage insurance segment, refer to Note 5 for the segmented net financial result across all segments.
| (in millions) |
2024 | 2023 | ||||||
| Investment income |
660 | 473 | ||||||
| Net gains (losses) on financial instruments |
(113) | (126) | ||||||
| Amounts recognized in other comprehensive income |
338 | 570 | ||||||
| Total investment return |
885 | 917 | ||||||
| Insurance finance expense for contracts issued |
(263) | (178) | ||||||
| Insurance finance expense for contracts issued recognized in other comprehensive income |
(85) | (100) | ||||||
| Total finance expense from insurance contracts |
(348) | (278) | ||||||
| Total net financial result |
537 | 639 | ||||||
| Represented by: |
||||||||
| Amounts recognized in income before income taxes |
284 | 169 | ||||||
| Amounts recognized in OCI before income taxes |
253 | 470 | ||||||
Insurance contracts by remaining coverage and incurred claims
The following tables present the reconciliation of insurance contract liabilities by LRC and LIC.
As at 31 December 2024
| (in millions) |
LRC | LIC | Total | |||||||||
| Insurance contract liabilities at beginning of year |
6,876 | 203 | 7,079 | |||||||||
| Insurance revenue |
||||||||||||
| Contracts under the fair value approach |
(464) | - | (464) | |||||||||
| Other contracts |
(623) | - | (623) | |||||||||
| (1,087) | - | (1,087) | ||||||||||
| Insurance service expense |
||||||||||||
| Incurred claims and other insurance expenses |
- | 193 | 193 | |||||||||
| Amortization of insurance acquisition cash flows |
51 | - | 51 | |||||||||
| Changes to the liabilities for incurred claims |
- | (107) | (107) | |||||||||
| 51 | 86 | 137 | ||||||||||
| Insurance service result |
(1,036) | 86 | (950) | |||||||||
| Total finance expense from insurance contracts |
337 | 11 | 348 | |||||||||
| Total changes in the statement of income and comprehensive income before income taxes |
(699) | 97 | (602) | |||||||||
| Cash flows |
||||||||||||
| Premiums received |
2,155 | - | 2,155 | |||||||||
| Claims and other insurance service expense paid |
- | (49) | (49) | |||||||||
| Insurance acquisition cash flows |
(128) | - | (128) | |||||||||
| Total cash flows |
2,027 | (49) | 1,978 | |||||||||
| Insurance contract liabilities at end of year |
8,204 | 251 | 8,455 | |||||||||
2024 Annual Report — 91
As at 31 December 2023
| (in millions) |
LRC | LIC | Total | |||||||||
| Insurance contract liabilities at beginning of year |
6,229 | 176 | 6,405 | |||||||||
| Insurance revenue |
||||||||||||
| Contracts under the fair value approach |
(526) | - | (526) | |||||||||
| Other contracts |
(478) | - | (478) | |||||||||
| (1,004) | - | (1,004) | ||||||||||
| Insurance service expense |
||||||||||||
| Incurred claims and other insurance expenses |
- | 156 | 156 | |||||||||
| Amortization of insurance acquisition cash flows |
41 | - | 41 | |||||||||
| Changes to the liabilities for incurred claims |
- | (78) | (78) | |||||||||
| 41 | 78 | 119 | ||||||||||
| Insurance service result |
(963) | 78 | (885) | |||||||||
| Total finance expense from insurance contracts |
275 | 3 | 278 | |||||||||
| Total changes in the statement of income and comprehensive income before income taxes |
(688) | 81 | (607) | |||||||||
| Cash flows |
||||||||||||
| Premiums received |
1,465 | - | 1,465 | |||||||||
| Claims and other insurance service expense paid |
- | (54) | (54) | |||||||||
| Insurance acquisition cash flows |
(130) | - | (130) | |||||||||
| Total cash flows |
1,335 | (54) | 1,281 | |||||||||
| Insurance contract liabilities at end of year |
6,876 | 203 | 7,079 | |||||||||
As at 31 December 2024 there were nil loss components (31 December 2023 – nil).
2024 Annual Report — 92
Insurance contracts by measurement components
The following tables present the reconciliation of insurance contract liabilities by measurement component.
As at 31 December 2024
| CSM | ||||||||||||||||||||
| (in millions) |
Present value of future cash flows |
Risk adjustment for non-financial risk |
Contracts under the fair value approach |
Other contracts |
Total | |||||||||||||||
| Insurance contract liabilities at beginning of year |
1,178 | 1,071 | 2,318 | 2,512 | 7,079 | |||||||||||||||
| Changes that relate to current services |
||||||||||||||||||||
| CSM recognized for services provided |
- | - | (301) | (391) | (692) | |||||||||||||||
| Change in the risk adjustment for non-financial risk |
- | (128) | - | - | (128) | |||||||||||||||
| Experience adjustments |
(23) | - | - | - | (23) | |||||||||||||||
| Changes that relate to future services |
||||||||||||||||||||
| Contracts initially recognized in the year |
(1,676) | 329 | - | 1,347 | - | |||||||||||||||
| Changes in estimates that adjust the CSM |
144 | (6) | 73 | (211) | - | |||||||||||||||
| Changes that relate to past services |
||||||||||||||||||||
| Changes to the liabilities for incurred claims |
(71) | (36) | - | - | (107) | |||||||||||||||
| Insurance service result |
(1,626) | 159 | (228) | 745 | (950) | |||||||||||||||
| Total finance expense from insurance contracts |
84 | 92 | 54 | 118 | 348 | |||||||||||||||
| Total changes in the statement of income and comprehensive income before income taxes |
(1,542) | 251 | (174) | 863 | (602) | |||||||||||||||
| Cash flows |
||||||||||||||||||||
| Premiums received |
2,155 | - | - | - | 2,155 | |||||||||||||||
| Claims and other insurance service expense paid |
(49) | - | - | - | (49) | |||||||||||||||
| Insurance acquisition cash flows |
(128) | - | - | - | (128) | |||||||||||||||
| Total cash flows |
1,978 | - | - | - | 1,978 | |||||||||||||||
| Insurance contract liabilities at end of year |
1,614 | 1,322 | 2,144 | 3,375 | 8,455 | |||||||||||||||
2024 Annual Report — 93
As at 31 December 2023
| CSM | ||||||||||||||||||||
| (in millions) |
Present value of future cash flows |
Risk adjustment for non-financial risk |
Contracts under the fair value approach |
Other contracts |
Total | |||||||||||||||
| Insurance contract liabilities at beginning of year |
1,038 | 820 | 2,597 | 1,950 | 6,405 | |||||||||||||||
| Changes that relate to current services |
||||||||||||||||||||
| CSM recognized for services provided |
- | - | (350) | (335) | (685) | |||||||||||||||
| Change in the risk adjustment for non-financial risk |
- | (104) | - | - | (104) | |||||||||||||||
| Experience adjustments |
(18) | - | - | - | (18) | |||||||||||||||
| Changes that relate to future services |
||||||||||||||||||||
| Contracts initially recognized in the year1 |
(1,138) | 195 | - | 943 | - | |||||||||||||||
| Changes in estimates that adjust the CSM1 |
(4) | 100 | 17 | (113) | - | |||||||||||||||
| Changes that relate to past services |
||||||||||||||||||||
| Changes to the liabilities for incurred claims |
(67) | (11) | - | - | (78) | |||||||||||||||
| Insurance service result |
(1,227) | 180 | (333) | 495 | (885) | |||||||||||||||
| Total finance expense from insurance contracts |
86 | 71 | 54 | 67 | 278 | |||||||||||||||
| Total changes in the statement of income and comprehensive income before income taxes |
(1,141) | 251 | (279) | 562 | (607) | |||||||||||||||
| Cash flows |
||||||||||||||||||||
| Premiums received |
1,465 | - | - | - | 1,465 | |||||||||||||||
| Claims and other insurance service expense paid |
(54) | - | - | - | (54) | |||||||||||||||
| Insurance acquisition cash flows |
(130) | - | - | - | (130) | |||||||||||||||
| Total cash flows |
1,281 | - | - | - | 1,281 | |||||||||||||||
| Insurance contract liabilities at end of year |
1,178 | 1,071 | 2,318 | 2,512 | 7,079 | |||||||||||||||
| 1 | We recategorized amounts between contracts initially recognized in the year and changes in estimates that adjust the CSM. This led to a decrease of $54 million to the present value of future cash outflows, a decrease of $57 million to the risk adjustment for non-financial risk, and an increase of $111 million to the CSM for contracts initially recognized in the year. |
Effect of new business recognized in the year
The following table presents effects of insurance contracts initially recognized in the year. There were no new onerous contracts in the year.
| (in millions) |
2024 | 20231 | ||||||
| Estimates of the present value of future cash outflows, excluding insurance acquisition cash flows |
327 | 197 | ||||||
| Estimates of insurance acquisition cash flows |
143 | 114 | ||||||
| Estimate of the present value of future cash outflows |
470 | 311 | ||||||
| Estimate of the present value of future cash inflows |
(2,146) | (1,449) | ||||||
| Risk adjustment for non-financial risk |
329 | 195 | ||||||
| CSM |
1,347 | 943 | ||||||
| 1 | We adjusted, resulting in a decrease of $54 million to the estimate of the present value of future cash outflows, a decrease of $57 million to the estimate of risk adjustment for non-financial risk, and an increase of $111 million to the CSM on initial recognition. |
2024 Annual Report — 94
Contractual service margin
The following table presents when the CSM is expected to be recognized into income in future years.
| (in millions) |
Within 1 year | 1 to 5 years | 5 to 10 years | More than 10 years | ||||||||||||
| Insurance contracts |
698 | 1,889 | 1,338 | 1,594 | ||||||||||||
Sensitivity analysis
The following table presents the sensitivity in the significant assumptions relating to risk. Changes in the assumptions below would have the greatest effect on the measurement of the insurance contract liabilities. The percentage change in the assumptions is applied to a range of existing actuarial modeling assumptions to derive the possible impact on the CSM, income before income taxes and equity of Canada for reasonably possible movements in key loss assumptions with all other assumptions held constant. In practice, changes in some of the assumptions might be correlated, which might magnify or counteract the sensitivities. The relationship of a change in assumption to the change in value may not be linear.
Risk – insurance contracts
| Weighted Average Assumptions |
Change indicator |
Change in assumptions |
Impact on the CSM |
Impact on income before income taxes |
Impact on equity of Canada |
|||||||||||||||||||||||||||||||||||
| (in millions) |
2024 | 2023 | 2024 | 2023 | 2024 | 2023 | 2024 | 2023 | ||||||||||||||||||||||||||||||||
| Loss sensitivity factors |
||||||||||||||||||||||||||||||||||||||||
| Claim frequency1 |
0.8% | 0.7% | Relative | +10% | (125) | (101) | (14) | (10) | (9) | (2) | ||||||||||||||||||||||||||||||
| Relative | -10% | 123 | 106 | 15 | 11 | 10 | 3 | |||||||||||||||||||||||||||||||||
| Claim severity2 |
45.2% | 43.7% | Relative | +10% | (228) | (198) | (37) | (33) | (24) | (14) | ||||||||||||||||||||||||||||||
| Relative | -10% | 228 | 198 | 37 | 33 | 24 | 14 | |||||||||||||||||||||||||||||||||
| Economic sensitivity factors |
||||||||||||||||||||||||||||||||||||||||
| UR3 |
5.9% | 6.3% | Absolute | +1% | (235) | (268) | (21) | (27) | (11) | (5) | ||||||||||||||||||||||||||||||
|
RPI3 |
509 | 534 | Absolute | -10% | (683) | (611) | (51) | (60) | (36) | (23) | ||||||||||||||||||||||||||||||
| 1 | The weighted average assumption includes the weighted average arrears, claims, termination and cure rate. Reflects the probability of a loan going from healthy to claim during its life. |
| 2 | Reflects net claim, including expenses as a percentage of the insured loan amount. |
| 3 | Refers to national ten year average projected rates. |
2024 Annual Report — 95
Claims development
Liability for incurred claims
The following table shows the development of the expected losses on the LIC over a period of time and the estimated ultimate cost of claims for 2020 through 2024 to present the earliest material claim that has arisen and for which there is still uncertainty about the amount and timing of claim payments. The expected claims and claims costs paid are net of expected and actual borrower judgment recoveries received. The information is presented on a default year basis where claims are related to the year in which the insured event occurred and not the year in which the policy was underwritten.
| (in millions) |
2020 | 2021 | 2022 | 2023 | 2024 | Total | ||||||||||||||||||
| Expected losses |
||||||||||||||||||||||||
| Default year |
445 | 220 | 135 | 167 | 214 | |||||||||||||||||||
| One year later |
130 | 87 | 74 | 102 | ||||||||||||||||||||
| Two years later |
60 | 80 | 54 | |||||||||||||||||||||
| Three years later |
45 | 72 | ||||||||||||||||||||||
| Four years later |
38 | |||||||||||||||||||||||
| Total estimate of undiscounted claims |
38 | 72 | 54 | 102 | 214 | 480 | ||||||||||||||||||
| Cumulative actual claim cost payments |
(47) | (58) | (44) | (32) | (2) | (183) | ||||||||||||||||||
| Cumulative expected claim payments (default years from 2020 to 2024) |
(9) | 14 | 10 | 70 | 212 | 297 | ||||||||||||||||||
| Cumulative expected claim payments (default years prior to 2020) |
(38) | |||||||||||||||||||||||
| Effect of discounting |
(8) | |||||||||||||||||||||||
| Liabilities for incurred claims |
- | - | - | - | - | 251 | ||||||||||||||||||
Self-insurance products and other application fees
The following table presents the composition of premiums and fees earned for our self-insurance product and other application fees.
| (in millions) |
2024 | 2023 | ||||||
| Earned premium |
28 | 25 | ||||||
| Earned application fees1 |
10 | 8 | ||||||
| Total |
38 | 33 | ||||||
| 1 | Includes low loan-to-value transactional homeowner applications fees which are earned when received and application fees earned on our self-insurance product. |
2024 Annual Report — 96
The following table presents the changes in the unearned premiums and fees balance for our self-insured products.
| (in millions) |
2024 | 2023 | ||||||
| Balance at beginning of year |
278 | 214 | ||||||
| Premiums and fees deferred on self-insured products in the year |
133 | 90 | ||||||
| Premiums and fees earned on self-insured products in the year |
(28) | (26) | ||||||
| Balance at end of year |
383 | 278 | ||||||
We have recognized a provision for incurred claims on our self-insurance products recognized in note 23, accounts payable and other liabilities.
| 8. | Mortgage Funding |
We guarantee the timely payment of principal and interest of CMB issued by CHT under the CMB program and NHA MBS issued by Approved Issuers on the basis of housing loans under the NHA MBS program and under the IMPP in the event that an issuer is unable to satisfy its obligations under these programs. In that circumstance, we will mitigate our loss by realizing on the collateral securing the obligations, consisting primarily of insured mortgage loans, under each of the programs.
At the balance sheet date, we have not received a claim, nor do we expect to receive a claim, in excess of the unearned guarantee fee on our TPG. As such, no provision in addition to the remaining unearned premium is required.
The following table presents the changes in the unearned TPG fees balance.
| 2024 | 2023 | |||||||||||||||||||||||
| (in millions) |
NHA MBS | CMB | Total | NHA MBS | CMB | Total | ||||||||||||||||||
| Balance at beginning of year |
1,874 | 624 | 2,498 | 1,809 | 581 | 2,390 | ||||||||||||||||||
| TPG and application fees received in the year |
801 | 262 | 1,063 | 740 | 195 | 935 | ||||||||||||||||||
| TPG and application fees earned in the year |
(743) | (158) | (901) | (675) | (152) | (827) | ||||||||||||||||||
| Balance at end of year |
1,932 | 728 | 2,660 | 1,874 | 624 | 2,498 | ||||||||||||||||||
The unearned TPG fees balance relates to the consideration received from customers at inception of the TPG contracts, for which revenue is recognized over the expected life of the security. The expected life of the securities varies with the average expected life being five years (2023 – five years).
Transaction price allocated to the remaining timely payment guarantee
The following table presents the revenue expected to be recognized in future years related to guarantees that are unsatisfied at the balance sheet date.
| (in millions) |
2025 | 2026 | 2027 | 2028 | 2029 | 2030 and thereafter |
||||||||||||||||||
| NHA MBS |
710 | 520 | 319 | 177 | 88 | 118 | ||||||||||||||||||
| CMB |
156 | 132 | 113 | 94 | 71 | 162 | ||||||||||||||||||
2024 Annual Report — 97
Guarantees-in-force
Total guarantees-in-force represents the maximum principal obligation related to TPGs1. Under Section 15 of the NHA, the aggregate outstanding amount of principal guarantees may not exceed $800 billion (2023 – $750 billion).
The following table presents the total guarantees-in-force by program. We do not expect these to result in future cash outflows.
| (in billions) |
2024 | 2023 | ||||||
| NHA MBS |
277 | 254 | ||||||
| CMB2 |
276 | 254 | ||||||
| Total |
553 | 508 | ||||||
| 1 | Exposure excludes the realizable value of the related assets securing the NHA MBS and CMB guaranteed. |
| 2 | Includes $0.6 billion (2023 – $0.7 billion) in investments which are eliminated in the consolidated balance sheet. |
The following table presents the maturity profile of the guarantees-in-force based on principal amount outstanding as at 31 December 2024.
| (in millions) |
NHA MBS guarantees | CMB guarantees | Total | |||||||||
| 2025 |
34,277 | 40,750 | 75,027 | |||||||||
| 2026 |
67,974 | 32,500 | 100,474 | |||||||||
| 2027 |
81,248 | 31,750 | 112,998 | |||||||||
| 2028 |
42,366 | 39,000 | 81,366 | |||||||||
| 2029 |
46,633 | 39,750 | 86,383 | |||||||||
| 2030 and thereafter |
4,089 | 92,750 | 96,839 | |||||||||
| Total |
276,587 | 276,500 | 553,087 | |||||||||
| 9. | Structured Entities |
Canada Housing Trust
CHT was established in 2001 as a special-purpose trust, separate from CMHC. CHT’s functions are limited to the acquisition of interests in eligible housing loans such as NHA MBS, the issuance of CMB, as well as the purchase of highly rated investments and certain related financial hedging activities. The beneficiaries of the Trust, after payment of all obligations, are one or more charitable organizations. Financial information for CHT is presented in the following tables on an unconsolidated basis.
Condensed Balance Sheet
| (in millions) |
2024 | 2023 | ||||||
| Loans – amortized cost |
277,456 | 255,130 | ||||||
| Other assets |
900 | 648 | ||||||
| Total assets |
278,356 | 255,778 | ||||||
| Borrowings – amortized cost |
277,456 | 255,130 | ||||||
| Other liabilities |
900 | 648 | ||||||
| Total liabilities |
278,356 | 255,778 | ||||||
| Total equity of Canada |
- | - | ||||||
2024 Annual Report — 98
Condensed Statement of Income
| (in millions) |
2024 | 2023 | ||||||
| Interest income – loans |
7,283 | 6,460 | ||||||
| Interest expense |
(7,274) | (6,451) | ||||||
| Net interest income |
9 | 9 | ||||||
| Total revenues |
9 | 9 | ||||||
| Operating expenses |
(9) | (9) | ||||||
| Total expenses |
(9) | (9) | ||||||
| Net income |
- | - | ||||||
| 10. | Capital Management |
For capital management, we consider our capital available to be equal to the total equity of Canada less regulatory deductions.
Our primary objective with respect to capital management is to ensure that our commercial operations, being our Mortgage Insurance and Mortgage Funding activities, have adequate capital to deliver their mandate while remaining financially self-sustaining and to follow prudent business practices and guidelines existing in the private sector as appropriate. We voluntarily follow guidelines set out by OSFI.
We perform an Own Risk & Solvency Assessment (ORSA), which is an integrated process that evaluates capital adequacy on both a regulatory and economic capital basis and is used to establish capital targets taking into consideration our strategy and risk appetite. Our ‘Own View’ of capital needs is determined by identifying our risks and evaluating whether or not an explicit amount of capital is necessary to absorb losses from each risk. With this, we also meet the requirements of the CMHC Act and the NHA.
We set an internal target for our Mortgage Insurance Activity and our Mortgage Funding Activity at a level that is expected to cover all material risks. The internal target is calibrated using specified confidence intervals and is designed to provide an early indication of the need to resolve financial problems. Under our capital management policy, we operate at available capital levels above the internal target on all but unusual and infrequent occasions. Accordingly, we have established an operating level for our Mortgage Insurance Activity and our Mortgage Funding Activity in excess of our internal target. The operating level is calibrated using confidence intervals specified by our capital management policy and is designed to provide us with adequate time to resolve financial problems before available capital decreases below the internal target.
In August 2024, our Board of Directors approved maintaining the internal targets and operating levels of 155% and 165% respectively for Mortgage Insurance and 105% and 110% for Mortgage Funding for 2025.
We declare dividends to the Government from our Mortgage Insurance and Mortgage Funding Activities, to the extent there are profits and retained earnings not allocated to reserves, capitalization or to meet our needs for purposes of the NHA, CMHC Act or any other purpose authorized by Parliament relating to housing. In the current year, we declared and paid $290 million in dividends (2023 – $1,080 million dividends declared and paid).
2024 Annual Report — 99
The components of consolidated capital available are presented in the following table.
| (in millions) |
2024 | 2023 | ||||||
| Contributed capital |
25 | 25 | ||||||
| Accumulated other comprehensive income |
(90) | (321) | ||||||
| Reserve fund |
172 | 72 | ||||||
| Appropriated retained earnings |
10,861 | 10,564 | ||||||
| Unappropriated retained earnings1 |
3,066 | 2,223 | ||||||
| Total equity of Canada2 |
14,034 | 12,563 | ||||||
| Less: regulatory deductions |
(187) | (170) | ||||||
| Total capital available |
13,847 | 12,393 | ||||||
| 1 | Unappropriated retained earnings includes retained earnings in excess of our operating level for the Mortgage Insurance and Mortgage Funding Activities. |
| 2 | Equity of Canada includes the impact of eliminations. |
Mortgage Insurance capital
The appropriated retained earnings of the Mortgage Insurance Activity is based on our ORSA. As regulatory capital, based on guidelines developed by OSFI, is higher than our economic capital requirements, we have set our capital targets based on regulatory capital. OSFI’s minimum regulatory capital requirement is 100% of the MICAT. The OSFI Supervisory target is 150% of the minimum capital required. We set an internal target above the Supervisory capital required under OSFI guidelines. The following table presents the components of capital available.
| (in millions, unless otherwise indicated) |
2024 | 2023 | ||||||
| Accumulated other comprehensive income (loss) |
(81) | (271) | ||||||
| Appropriated retained earnings |
9,802 | 9,282 | ||||||
| Appropriated capital1 |
9,721 | 9,011 | ||||||
| Unappropriated capital |
1,556 | 1,269 | ||||||
| Total Mortgage Insurance capital |
11,277 | 10,280 | ||||||
| Less: regulatory deductions |
(187) | (170) | ||||||
| Total Mortgage Insurance capital available |
11,090 | 10,110 | ||||||
| Internal target |
155% | 155% | ||||||
| Operating level |
165% | 165% | ||||||
| Capital available to minimum capital required (% MICAT) |
188% | 185% | ||||||
| 1 | We appropriate retained earnings and AOCI at the operating level of 165% of MICAT. |
2024 Annual Report — 100
Mortgage Funding capital
Mortgage Funding capital is appropriated for the guarantees provided by our NHA MBS and CMB programs. There is no regulatory capital and the appropriated amount of capital is based on our ORSA. At 31 December 2024, economic capital required at the operating level is $2.2 billion which compares to $4.6 billion of assets available (31 December 2023 - $1.8 billion total assets required and $4.0 billion assets available). These amounts exclude assets and liabilities related to IMPP. Unappropriated capital is subject to a minimum liquidity requirement. The liquidity requirement ensures that our investment balance (cash, cash equivalents, investment securities and related accrued interest), along with our other borrowing capabilities, is sufficient to cover the largest exposure to a single counterparty. At 31 December 2024, our investment balance was $4.5 billion ($3.9 billion at 31 December 2023) and the liquidity requirement has resulted in a cap of $0.9 billion to our unappropriated earning. The Board approved an increase of the economic capital required from $2.2 billion to $2.6 billion, effective 1 January 2025, which will be applied prospectively from that date. In 2024 and 2023, the binding constraint is the liquidity requirement.
We do not have separate capital amounts for CHT because the TPG exposure to CMB issued by CHT is covered by the Mortgage Funding capital. Similarly, any exposure to IMPP is covered by Mortgage Funding capital as the NHA MBS loans sold into IMPP form part of the same TPG. The amounts of Mortgage Funding capital held also recognize the risk mitigation provided by mortgage insurers, who are required to hold capital for the underlying mortgage default risk.
The following table presents the components of the capital available.
| (in millions, unless otherwise indicated) |
2024 | 2023 | ||||||
| Accumulated other comprehensive income (loss) |
(49) | (102) | ||||||
| Appropriated retained earnings |
1,059 | 1,282 | ||||||
| Appropriated capital |
1,010 | 1,180 | ||||||
| Unappropriated capital |
926 | 277 | ||||||
| Total Mortgage Funding capital available |
1,936 | 1,457 | ||||||
| Economic capital available to economic capital required (%) |
127% | 109% | ||||||
Housing Programs capital
We maintain a reserve fund pursuant to Section 29 of the CMHC Act., which includes the profits of the Corporation, after providing for all matters, that in the opinion of the Board of Directors, are required to carry out the purposes of the Corporation. The reserve fund is subject to a statutory limit of $240 million (2023 – $240 million). Should we exceed the statutory limit, we would be required to pay the excess to the Government.
Retained earnings comprises all other amounts comprising Housing Programs Equity of Canada that are not in the reserve fund, including unrealized fair value fluctuations as well as remeasurement gains and losses on defined benefit plans. The Housing Programs’ portion of remeasurement gains and losses on defined benefit plans is recorded in retained earnings until it is reimbursed by the Government through government funding for housing programs.
Aside from the reserve fund and retained earnings, we do not hold additional capital for our Housing Programs activities, as they do not present material financial risks for us that we do not already otherwise mitigate (see Note 14).
2024 Annual Report — 101
The following table presents the components of the capital available.
| (in millions) |
2024 | 2023 | ||||||
| Reserve fund1 |
174 | 75 | ||||||
| Retained earnings |
618 | 714 | ||||||
| Total Lending programs capital available |
792 | 789 | ||||||
| 1 | Excludes the impact of eliminations of $2 million (2023 – $3 million). |
| 11. | Fair Value Measurement |
Fair value measurement
We measure certain financial instruments and non-financial assets at fair value in the consolidated balance sheet and disclose the fair value of certain other items. Fair value is determined using a consistent measurement framework.
Fair value is the price that would be received to sell an asset or paid to transfer a liability in an orderly transaction between market participants at the measurement date under current market conditions. The fair value of an asset or a liability is measured using the assumptions that market participants would use when pricing the asset or liability, assuming that market participants act in their economic best interest. Fair value measurement of non-financial assets (i.e. investment property) takes into account a market participant’s ability to generate economic benefits by using the asset in its highest and best use or by selling it to another market participant that would use the asset in its highest and best use. For financial instruments, accrued interest is separately recorded and disclosed.
Fair value hierarchy
The methods used to measure fair value make maximum use of relevant observable inputs and minimize the use of unobservable inputs. Fair value measurements are classified in a fair value hierarchy as Level 1, 2 or 3 according to the observability of the most significant inputs used in making the measurements.
Level 1
Assets and liabilities that are measured based on unadjusted quoted prices in active markets for identical assets or liabilities.
Level 2
Assets and liabilities that are measured based on observable inputs other than Level 1 prices. Level 2 inputs include prices obtained from markets that are not considered sufficiently active, and fair values obtained by discounting expected future cash flows, making maximum use of directly or indirectly observable market data.
Level 3
Assets and liabilities not quoted in active markets that are measured using valuation techniques. Where observable inputs are not available, unobservable inputs are used. For Level 3 assets and liabilities, unobservable inputs are significant to the overall measurement of fair value.
We have processes and controls in place to ensure fair value is reasonably measured. The valuation of financial instruments is performed by the Systems and Analytics Division (SAD) of the Investments and Treasury group. SAD has developed models and methodologies to determine fair value of financial instruments not quoted in active markets which are reviewed and monitored on an ongoing basis. All valuations are subject to independent price verification (IPV) managed by the sector of the Chief Risk Officer. IPV is a process where valuations are independently verified against external market prices and other relevant market data on an ongoing basis.
2024 Annual Report — 102
Generally, the unit of account for a financial instrument is the individual instrument, and valuation adjustments are applied at an individual instrument level, consistent with that unit of account.
For investment property, fair value is determined by independent external property appraisers or our internal appraisers who hold recognized and relevant professional qualifications.
Methods and assumptions
We measure fair value using the following methods and assumptions:
Investment securities
Fixed income securities are valued based on a third-party pricing provider, which uses market data from a variety of sources. Actively traded instruments are valued based on market data such as indicative quotes or trade prices for identical securities. Instruments that are not actively traded are valued based on techniques using other observable inputs, such as spread differentials of similar actively traded securities. Future cash flows of certain floating rate bonds are estimated based on observable implied forward rate curves.
For our private limited partnership and real estate investment trust equity investments, fair value is measured as our share of the partnership’s or trust’s net asset value. In measuring net asset value, the fair value of the partnership’s or trust’s real estate assets is determined at least annually by independent appraisers using the income approach or the market approach, and the fair value of its long-term debt is measured by discounting expected future cash flows.
Loans
Loans are valued by discounting future cash flows using discount rate curves that reflect the collection guarantees provided by provincial, territorial or federal levels of government, to the extent that we have determined the guarantees are integrated with the loans. Inputs into the discounting model are the Government yield curve and spreads derived from assets with comparable financial risks.
Loans issued under the FTHBI are valued by multiplying the carrying amount of the loans by the housing repeat-sales price index. The repeat-sales price index is intended to reflect the increase/decrease in the fair values of the individual properties.
Derivatives
Derivatives consist of over-the-counter interest rate swaps and foreign currency forward contracts. These are valued by discounting estimated future cash flows using observable discount rate curves constructed using benchmark interest rates and foreign exchange rates. Future cash flows for floating rate legs are estimated based on observable implied forward rate curves. An adjustment is made to reflect the credit risk that either counterparty may not be able to fulfil its obligations. Inputs to this adjustment include market-implied default rates and estimated recovery rates, and the adjustment takes into account master netting and collateral arrangements in place.
First Time Home Buyer loan derivatives result from the recognition of a payable to, or receivable from, the Government of Canada when there are underlying loan gains or losses. The value of these derivatives is derived from movement on the repeat-sales price index as discussed above.
2024 Annual Report — 103
Investment property
The fair value of investment property is determined using either the income approach or the market approach, incorporating the highest and best use of the property. Of the total fair value of investment properties, 43% (2023 – 45%) was based on valuations performed by independent valuators and 57% (2023 – 55%) was based on internal valuations during 2024.
The income approach is primarily applied in determining the fair value of rent-producing properties. Under the income approach, fair value is based upon the present value of expected future cash flows of each property using an unobservable discount rate reflective of the characteristics of the property. Future cash flows are estimated using unobservable assumptions about future rental values and vacancy rates.
The market approach is primarily applied in determining the fair value of vacant land. Under the market approach, fair value is based upon market transactions involving comparable property, with adjustments made to reflect the unique aspects of the property being valued.
Borrowings
Borrowings from the Government of Canada are valued by discounting future cash flows using discount rate curves derived from the directly observable yields of our market-traded borrowings (i.e. CMBs).
Comparison of carrying and fair values for financial instruments not carried at fair value
The following table compares the carrying and fair values of financial instruments not carried at fair value. Carrying value is the amount at which an item is measured in the consolidated balance sheet.
| 2024 | 2023 | |||||||||||||||||||||||
| (in millions) |
Carrying value |
Fair value | Fair value over (under) carrying value |
Carrying value |
Fair value | Fair value over (under) carrying value |
||||||||||||||||||
| Financial assets1 |
||||||||||||||||||||||||
| Investments at amortized cost2 |
3,569 | 3,580 | 11 | 3,229 | 3,176 | (53) | ||||||||||||||||||
| Loans at amortized cost3 |
294,528 | 291,141 | (3,387) | 270,650 | 261,936 | (8,714) | ||||||||||||||||||
| Financial liabilities |
||||||||||||||||||||||||
| Borrowings at amortized cost4 |
299,325 | 296,387 | (2,938) | 274,757 | 266,144 | (8,613) | ||||||||||||||||||
| 1 | Does not include cash and cash equivalents of $1,303 million (31 December 2023 – $1,074 million) and securities purchased under resale agreements of $950 million (31 December 2023 – $700 million) carried at amortized cost as the fair value of these financial instruments is equal to their carrying value. |
| 2 | $764 million (31 December 2023 – $444 million) fair value categorized as level 1 and $2,816 million (31 December 2023 – $2,732 million) fair value categorized as level 2. |
| 3 | $282,837 million (31 December 2023 – $255,725 million) fair value categorized as level 2, $8,304 million (31 December 2023 – $6,211 million) fair value categorized as level 3. |
| 4 | $240,490 million (31 December 2023 – $193,908 million) fair value categorized as level 1, $55,897 million (31 December 2023 – $72,236 million) fair value categorized as level 2. |
2024 Annual Report — 104
Fair value hierarchy for items carried at fair value
The following table presents the fair value hierarchy for assets and liabilities carried at fair value in the consolidated balance sheet.
| 2024 | 2023 | |||||||||||||||||||||||||||||||
| (in millions) |
Level 1 | Level 2 | Level 3 | Total | Level 1 | Level 2 | Level 3 | Total | ||||||||||||||||||||||||
| Assets |
||||||||||||||||||||||||||||||||
| Cash equivalents |
||||||||||||||||||||||||||||||||
| Interest bearing deposits with banks |
- | 128 | - | 128 | - | 172 | - | 172 | ||||||||||||||||||||||||
| Federal government issued |
- | 207 | - | 207 | - | 686 | - | 686 | ||||||||||||||||||||||||
| Corporate/other entities |
- | 17 | - | 17 | - | 7 | - | 7 | ||||||||||||||||||||||||
| Total cash equivalents |
- | 352 | - | 352 | - | 865 | - | 865 | ||||||||||||||||||||||||
| Investment securities |
||||||||||||||||||||||||||||||||
| FVTPL |
||||||||||||||||||||||||||||||||
| Debt instruments |
||||||||||||||||||||||||||||||||
| Corporate/other entities |
- | 20 | - | 20 | - | 18 | - | 18 | ||||||||||||||||||||||||
| Equities |
||||||||||||||||||||||||||||||||
| Limited partnership units |
- | - | 37 | 37 | - | - | 51 | 51 | ||||||||||||||||||||||||
| Total at FVTPL |
- | 20 | 37 | 57 | - | 18 | 51 | 69 | ||||||||||||||||||||||||
| FVOCI |
||||||||||||||||||||||||||||||||
| Debt instruments |
||||||||||||||||||||||||||||||||
| Corporate/other entities |
3,774 | 4,345 | - | 8,119 | 2,261 | 5,044 | - | 7,305 | ||||||||||||||||||||||||
| Federal government issued |
7,440 | 3,290 | - | 10,730 | 7,587 | 1,771 | - | 9,358 | ||||||||||||||||||||||||
| Provinces/municipalities |
3,974 | 159 | - | 4,133 | 2,685 | 465 | - | 3,150 | ||||||||||||||||||||||||
| Sovereign and related entities |
258 | 47 | - | 305 | 282 | 67 | - | 349 | ||||||||||||||||||||||||
| Total at FVOCI |
15,446 | 7,841 | - | 23,287 | 12,815 | 7,347 | - | 20,162 | ||||||||||||||||||||||||
| Loans designated at FVTPL |
- | 20 | - | 20 | - | 54 | - | 54 | ||||||||||||||||||||||||
| Loans mandatorily at FVTPL |
- | 12 | 489 | 501 | - | 12 | 446 | 458 | ||||||||||||||||||||||||
| Derivatives |
- | - | - | - | - | 161 | - | 161 | ||||||||||||||||||||||||
| Investment property |
- | - | 396 | 396 | - | - | 398 | 398 | ||||||||||||||||||||||||
| Total assets carried at fair value |
15,446 | 8,245 | 922 | 24,613 | 12,815 | 8,457 | 895 | 22,167 | ||||||||||||||||||||||||
| Liabilities |
||||||||||||||||||||||||||||||||
| Borrowings designated at FVTPL |
- | (148) | - | (148) | - | (219) | - | (219) | ||||||||||||||||||||||||
| Derivatives |
- | (136) | (69) | (205) | - | (8) | (47) | (55) | ||||||||||||||||||||||||
| Total liabilities carried at fair value |
- | (284) | (69) | (353) | - | (227) | (47) | (274) | ||||||||||||||||||||||||
| Net assets at FVTPL |
15,446 | 7,961 | 853 | 24,260 | 12,815 | 8,230 | 848 | 21,893 | ||||||||||||||||||||||||
2024 Annual Report — 105
Transfers between fair value hierarchy levels
For assets and liabilities measured at fair value on a recurring basis, we determine if reclassifications have occurred between levels in the hierarchy by re-assessing categorization at each balance sheet date. Transfers are dependent on internal classification criteria that are based on variables such as observability of prices and market trading volumes considered as at each balance sheet date. Transfers between levels are deemed to occur at the beginning of the quarter in which the transfer occurs. There were $3,269 million of transfers from level 2 to level 1 and $2,476 million of transfers from level 1 to level 2 during the year ended 31 December 2024 (2023 – $2,289 million and $3,067 million, respectively).
Change in fair value measurement for items classified as level 3
The following table presents the change in fair value for items carried at fair value and classified as level 3.
| (in millions) |
Investment securities – FVTPL |
Loans – FVTPL |
Investment property |
Derivatives | Total | |||||||||||||||
| Fair value as at 1 January 2024 |
51 | 446 | 398 | (47) | 848 | |||||||||||||||
| Purchases/issuances |
- | 61 | - | 61 | ||||||||||||||||
| Net gains (losses) in profit or loss1,2 |
(5) | 22 | (2) | (22) | (7) | |||||||||||||||
| Cash receipts on settlements/disposals |
(9) | (40) | - | - | (49) | |||||||||||||||
| Fair value as at 31 December 2024 |
37 | 489 | 396 | (69) | 853 | |||||||||||||||
| Fair value as at 1 January 2023 |
78 | 344 | 402 | (34) | 790 | |||||||||||||||
| Purchases/issuances |
- | 117 | - | - | 117 | |||||||||||||||
| Net gains (losses) in profit or loss1,2 |
- | 13 | 13 | (13) | 13 | |||||||||||||||
| Cash receipts on settlements/disposals |
(27) | (28) | (17) | - | (72) | |||||||||||||||
| Fair value as at 31 December 2023 |
51 | 446 | 398 | (47) | 848 | |||||||||||||||
| 1 | Included in net gains (losses) on financial instruments for investment securities, loans and derivatives; other income for investment property. |
| 2 | Solely relates to unrealized gains for assets held at the end of the respective years. |
2024 Annual Report — 106
Unobservable inputs for items classified as level 3
The valuations of items classified as level 3 use unobservable inputs, changes in which may significantly affect the measurement of fair value. Valuations were based on assessments of the prevailing conditions at 31 December, which may change materially in subsequent periods. The following table presents quantitative information about the significant unobservable inputs used in level 3 fair value measurements for items carried at fair value.
| 2024 | 2023 | |||||||||||||||||||||||
| (in millions) |
Valuation technique |
Unobservable inputs |
Asset fair value |
Weighted average input/range |
Asset fair value |
Weighted average input/range |
||||||||||||||||||
| Investment securities |
||||||||||||||||||||||||
| Equities at FVTPL – Limited partnership units |
|
Share of partnership equity |
|
|
Reported partnership equity |
|
37 | n/a | 51 | n/a | ||||||||||||||
| Loans at FVTPL |
||||||||||||||||||||||||
| MI Activity workout loans |
|
Discounted cash flow |
|
Loss rate | 1 | 77% | 2 | 63% | ||||||||||||||||
| MI Activity mortgage assignments |
Market approach | Value per square foot | 18 | $24-$953 | 16 | $16-$1,408 | ||||||||||||||||||
| HP Activity loans – FTHBI |
Market approach | |
Repeat-sales price index |
|
470 | n/a | 428 | n/a | ||||||||||||||||
| Total loans at FVTPL |
489 | - | 446 | - | ||||||||||||||||||||
| Investment property |
||||||||||||||||||||||||
| HP Activity |
|
Discounted cash flow |
|
|
Estimated rental value per square foot |
|
78 | $16-$693 | 63 | $15-$294 | ||||||||||||||
| Discount rate | - | 6% | - | 4%-6% | ||||||||||||||||||||
| Market approach | Value per square foot | 318 | $6-$525 | 335 | $6-$677 | |||||||||||||||||||
| Total investment property |
396 | - | 398 | - | ||||||||||||||||||||
| FTHBI loan derivative |
Market approach | |
Repeat-sales price index |
|
(69) | n/a | (47) | n/a | ||||||||||||||||
| Total Level 3 items carried at fair value |
853 | - | 848 | - | ||||||||||||||||||||
Level 3 sensitivity analysis
Investment property
For investment property, increases (decreases) in estimated rental value and price per square foot could result in a significantly higher (lower) fair value of the properties. Increases (decreases) in discount rates could result in a significantly lower (higher) fair value.
2024 Annual Report — 107
| 12. | Cash and Cash Equivalents |
The following table provides a breakdown of our cash and cash equivalents:
| 2024 | 2023 | |||||||||||||||||||||||||||||||
| (in millions) |
Amortized cost |
FVOCI | FVTPL | Total | Amortized cost |
FVOCI | FVTPL | Total | ||||||||||||||||||||||||
| Cash |
64 | - | - | 64 | 106 | - | - | 106 | ||||||||||||||||||||||||
| Interest-bearing deposits with banks |
200 | - | 128 | 328 | 805 | - | 172 | 977 | ||||||||||||||||||||||||
| Corporate/other entities |
- | 17 | - | 17 | - | 7 | - | 7 | ||||||||||||||||||||||||
| Federal government issued |
140 | 207 | - | 347 | - | 686 | - | 686 | ||||||||||||||||||||||||
| Provinces/municipalities |
899 | - | - | 899 | 163 | - | - | 163 | ||||||||||||||||||||||||
| Total cash and cash equivalents |
1,303 | 224 | 128 | 1,655 | 1,074 | 693 | 172 | 1,939 | ||||||||||||||||||||||||
We hold the following cash and cash equivalents that are intended for use as part of the respective programs:
| (in millions) |
2024 | 2023 | ||||||
| Affordable Rental Housing Innovation Fund |
31 | 35 | ||||||
| Apartment Construction Loan Program (ACLP) |
657 | 757 | ||||||
| Affordable Housing Fund (AHF) |
577 | 209 | ||||||
| Direct Lending (DL) – Economically Hedged |
128 | 172 | ||||||
| Total |
1,393 | 1,173 | ||||||
2024 Annual Report — 108
| 13. | Investment Securities |
The following tables present the contractual maturity profile and average yield of investment securities.
| Remaining term to maturity | ||||||||||||||||||||||||
| (in millions) | Within 1 year |
1 to 3 years |
3 to 5 years |
Over 5 years |
Total 2024 |
Total 2023 |
||||||||||||||||||
| FVTPL |
||||||||||||||||||||||||
| Fixed income1 |
||||||||||||||||||||||||
| Corporate/other entities |
5 | 14 | 1 | - | 20 | 18 | ||||||||||||||||||
| Total fixed income |
5 | 14 | 1 | - | 20 | 18 | ||||||||||||||||||
| Yield2 |
4.4% | 2.7% | 4.7% | - | 3.2% | 1.7% | ||||||||||||||||||
| Canadian equities |
37 | 51 | ||||||||||||||||||||||
| Yield3 |
0.20% | 2.6% | ||||||||||||||||||||||
| Total at FVTPL |
57 | 69 | ||||||||||||||||||||||
| FVOCI |
||||||||||||||||||||||||
| Fixed income4 |
||||||||||||||||||||||||
| Corporate/other entities |
215 | 1,869 | 2,388 | 3,647 | 8,119 | 7,305 | ||||||||||||||||||
| Federal government issued |
5,295 | 2,897 | 1,479 | 1,059 | 10,730 | 9,358 | ||||||||||||||||||
| Provinces/municipalities |
261 | 775 | 769 | 2,328 | 4,133 | 3,150 | ||||||||||||||||||
| Sovereign and related entities |
39 | 59 | 157 | 50 | 305 | 349 | ||||||||||||||||||
| Total at FVOCI |
5,810 | 5,600 | 4,793 | 7,084 | 23,287 | 20,162 | ||||||||||||||||||
| Yield2 |
3.5% | 2.9% | 3.6% | 3.7% | 3.4% | 3.1% | ||||||||||||||||||
| Amortized cost |
||||||||||||||||||||||||
| Fixed income |
||||||||||||||||||||||||
| Corporate/other entities |
415 | 370 | 120 | - | 905 | 847 | ||||||||||||||||||
| Federal government issued |
60 | - | - | - | 60 | 5 | ||||||||||||||||||
| Provinces/municipalities |
1,066 | 349 | 9 | - | 1,424 | 1,081 | ||||||||||||||||||
| Sovereign and related entities |
431 | 575 | 174 | - | 1,180 | 1,296 | ||||||||||||||||||
| Total at Amortized cost |
1,972 | 1,294 | 303 | - | 3,569 | 3,229 | ||||||||||||||||||
| Yield2 |
3.4% | 3.1% | 3.6% | - | 3.3% | 2.8% | ||||||||||||||||||
| Total |
26,913 | 23,460 | ||||||||||||||||||||||
| 1 | Includes debt securities denominated in U.S dollars with a carrying value of $12 million (31 December 2023 – $11 million). |
| 2 | Represents the weighted-average yield, determined as the weighted average of the effective yields of individual securities. |
| 3 | Represents the average yield, determined by dividing dividend income by average cost in 2024. |
| 4 | Includes debt securities denominated in U.S. dollars with a carrying value of $4,536 million (31 December 2023 – $4,116 million). |
2024 Annual Report — 109
The following table shows the cumulative unrealized gains (losses) on investment securities recorded at fair value.
| 2024 | 2023 | |||||||||||||||||||||||||||||||
| (in millions) | Amortized cost1 |
Gross cumulative unrealized gains |
Gross cumulative unrealized losses |
Fair value |
Amortized cost1 |
Gross cumulative unrealized gains |
Gross cumulative unrealized losses |
Fair value |
||||||||||||||||||||||||
| Debt instruments |
||||||||||||||||||||||||||||||||
| FVTPL2 |
20 | - | - | 20 | 18 | - | - | 18 | ||||||||||||||||||||||||
| FVOCI3 |
23,153 | 549 | (415) | 23,287 | 20,777 | 173 | (788) | 20,162 | ||||||||||||||||||||||||
| Equities |
||||||||||||||||||||||||||||||||
| FVTPL |
44 | 8 | (15) | 37 | 49 | 14 | (12) | 51 | ||||||||||||||||||||||||
| 1 | Amortized cost for equities is weighted-average acquisition cost. |
| 2 | Includes debt securities denominated in U.S dollars with a carrying value of $12 million (31 December 2023 – $11 million). |
| 3 | Includes debt securities denominated in U.S. dollars with a carrying value of $4,536 million (31 December 2023 – $4,116 million). |
Expected credit losses
See Note 19 for further information about the credit quality of our investment securities. At 31 December 2024, all of our debt instruments held at FVOCI and at amortized cost had a 12-month ECL allowance.
The ECL allowance for debt instruments held at FVOCI and amortized cost was $4 million at 31 December 2024 (2023 – $21 million).
We performed a sensitivity analysis by shifting economic scenario weightings to each extreme to assess the ECL impacts on our investment securities at amortized cost and FVOCI. The focus of these analyses is on Stage 1 and Stage 2 exposures, as Stage 3 ECLs do not vary between scenarios. Each scenario has been run independently from the others, and the results represent a simulated impact as follows:
| As at 31 December 2024 | As at 31 December 2023 | |||||||||||||||||||||||
| (in millions) | Weight | Unweighted ECL | Weighted ECL | Weight | Unweighted ECL | Weighted ECL | ||||||||||||||||||
| Optimistic |
15% | 2 | - | 20% | 13 | - | ||||||||||||||||||
| Baseline |
45% | 3 | 4 | 50% | 17 | 21 | ||||||||||||||||||
| Pessimistic |
40% | 6 | - | 30% | 33 | - | ||||||||||||||||||
2024 Annual Report — 110
| 14. | Loans |
The following tables present the contractual maturity profile and average yield of loans based on carrying value.
| Year of maturity | ||||||||||||||||||||||||||||||||
| (in millions) | 2025 | 2026 | 2027 | 2028 | 2029 | 2030 and thereafter |
Total 2024 |
Total 2023 |
||||||||||||||||||||||||
| FVTPL |
||||||||||||||||||||||||||||||||
| Lending programs |
18 | 2 | - | - | - | 482 | 502 | 494 | ||||||||||||||||||||||||
| MI Activity loans |
19 | - | - | - | - | - | 19 | 18 | ||||||||||||||||||||||||
| Total FVTPL |
37 | 2 | - | - | - | 482 | 521 | 512 | ||||||||||||||||||||||||
| Yield |
3.7% | 1.5% | - | - | - | - | 0.3% | 0.4% | ||||||||||||||||||||||||
| Amortized cost |
||||||||||||||||||||||||||||||||
| CMB program loans |
40,901 | 32,496 | 31,809 | 39,142 | 39,809 | 93,299 | 277,456 | 255,130 | ||||||||||||||||||||||||
| Lending programs |
387 | 420 | 468 | 770 | 2,021 | 12,647 | 16,713 | 12,616 | ||||||||||||||||||||||||
| IMPP loans |
335 | - | - | - | - | - | 335 | 2,866 | ||||||||||||||||||||||||
| MI Activity loans |
21 | - | - | - | - | 3 | 24 | 38 | ||||||||||||||||||||||||
| Total amortized cost |
41,644 | 32,916 | 32,277 | 39,912 | 41,830 | 105,949 | 294,528 | 270,650 | ||||||||||||||||||||||||
| Yield |
2.0% | 1.7% | 3.1% | 3.4% | 3.1% | 3.0% | 2.8% | 2.8% | ||||||||||||||||||||||||
| Total |
41,681 | 32,918 | 32,277 | 39,912 | 41,830 | 106,431 | 295,049 | 271,162 | ||||||||||||||||||||||||
2024 Annual Report — 111
The following table presents the cash flows and non-cash changes for loans.
| Cash flows | Non-cash changes | |||||||||||||||||||||||||||||||||||
| (in millions) |
Balance at beginning of year |
Repayments | Disbursements | Fair value changes |
Accretion | ECL | Capitalized interest |
Transfers1 | Balance at end of year |
|||||||||||||||||||||||||||
| 2024 |
||||||||||||||||||||||||||||||||||||
| FVTPL |
||||||||||||||||||||||||||||||||||||
| Lending programs |
494 | (42) | 45 | 23 | - | - | (18) | 502 | ||||||||||||||||||||||||||||
| MI Activity loans |
18 | (15) | 16 | - | - | - | - | 19 | ||||||||||||||||||||||||||||
| Total at FVTPL |
512 | (57) | 61 | 23 | - | - | (18) | 521 | ||||||||||||||||||||||||||||
| Amortized cost |
||||||||||||||||||||||||||||||||||||
| CMB program loans |
255,130 | (37,925) | 60,203 | - | 48 | - | - | - | 277,456 | |||||||||||||||||||||||||||
| Lending programs2 |
12,616 | (693) | 4,776 | (178) | 32 | 7 | 135 | 18 | 16,713 | |||||||||||||||||||||||||||
| IMPP loans |
2,866 | (2,531) | - | - | - | - | - | - | 335 | |||||||||||||||||||||||||||
| MI Activity loans |
38 | (26) | - | - | 11 | 1 | - | - | 24 | |||||||||||||||||||||||||||
| Total amortized cost |
270,650 | (41,175) | 64,979 | (178) | 91 | 8 | 135 | 18 | 294,528 | |||||||||||||||||||||||||||
| Total |
271,162 | (41,232) | 65,040 | (155) | 91 | 8 | 135 | - | 295,049 | |||||||||||||||||||||||||||
| 2023 |
||||||||||||||||||||||||||||||||||||
| FVTPL |
||||||||||||||||||||||||||||||||||||
| Lending programs |
455 | (51) | 101 | 18 | - | - | - | (29) | 494 | |||||||||||||||||||||||||||
| MI Activity loans |
14 | (12) | 16 | - | - | - | - | - | 18 | |||||||||||||||||||||||||||
| Total at FVTPL |
469 | (63) | 117 | 18 | - | - | - | (29) | 512 | |||||||||||||||||||||||||||
| Amortized cost |
||||||||||||||||||||||||||||||||||||
| CMB program loans |
255,903 | (46,040) | 45,225 | - | 42 | - | - | - | 255,130 | |||||||||||||||||||||||||||
| Lending programs2 |
9,807 | (594) | 3,397 | (109) | 5 | (2) | 83 | 29 | 12,616 | |||||||||||||||||||||||||||
| IMPP loans |
3,449 | (583) | - | - | - | - | - | - | 2,866 | |||||||||||||||||||||||||||
| MI Activity loans |
48 | (40) | - | - | 14 | 16 | - | - | 38 | |||||||||||||||||||||||||||
| Total amortized cost |
269,207 | (47,257) | 48,622 | (109) | 61 | 14 | 83 | 29 | 270,650 | |||||||||||||||||||||||||||
| Total |
269,676 | (47,320) | 48,739 | (91) | 61 | 14 | 83 | - | 271,162 | |||||||||||||||||||||||||||
| 1 | Transfers are matured loans that have been renewed where the new loans are no longer part of a portfolio of economically hedged loans and borrowings and therefore classified at amortized cost. |
| 2 | Fair value changes for loans at amortized cost relate to losses recognized immediately upon initial advance of loans issued below market value. |
2024 Annual Report — 112
Credit quality – amortized cost
The following table presents the credit quality of loans at amortized cost, presented separately for those based on 12-month or lifetime ECL. For loans where past due information is used as the primary criteria in assessing SICR, aging of loans past due from contractual due date is presented. For loans where past due information is not the primary criteria used in assessing SICR, credit quality is presented by credit rating category based on our internal credit rating system. Amounts in the table represent the gross carrying amount of the financial asset.
| 2024 | ||||||||||||||||||||||||
| (in millions) | Stage 1: 12-month ECL |
Stage 2: Lifetime ECL (not credit impaired) |
Stage 3: Lifetime ECL (credit impaired) |
POCI | Total | 2023 Total |
||||||||||||||||||
| Days past due: |
||||||||||||||||||||||||
| 0-30 days |
15,834 | - | - | - | 15,834 | 11,546 | ||||||||||||||||||
| 30-90 |
- | 1 | - | - | 1 | - | ||||||||||||||||||
| 90+ |
- | - | 42 | - | 42 | 40 | ||||||||||||||||||
| POCI |
- | - | - | 24 | 24 | 45 | ||||||||||||||||||
| Total gross carrying amount |
15,834 | 1 | 42 | 24 | 15,901 | 11,631 | ||||||||||||||||||
| Internal credit ratings: |
||||||||||||||||||||||||
| AAA |
8 | - | - | - | 8 | 12 | ||||||||||||||||||
| AA- to AA+ |
505 | - | - | - | 505 | 536 | ||||||||||||||||||
| A- to A+ |
328 | - | - | - | 328 | 472 | ||||||||||||||||||
| BBB- to BBB+ |
44 | - | - | - | 44 | 60 | ||||||||||||||||||
| Total gross carrying amount |
885 | - | - | - | 885 | 1,080 | ||||||||||||||||||
| Total |
16,719 | 1 | 42 | 24 | 16,786 | 12,711 | ||||||||||||||||||
| ECL allowance |
(9) | - | (26) | (14) | (49) | (57) | ||||||||||||||||||
| Total, net of ECL allowance |
16,710 | 1 | 16 | 10 | 16,737 | 12,654 | ||||||||||||||||||
| CMB program loans |
- | - | - | - | 277,456 | 255,130 | ||||||||||||||||||
| IMPP loans |
- | - | - | - | 335 | 2,866 | ||||||||||||||||||
| Total loans at amortized cost |
294,528 | 270,650 | ||||||||||||||||||||||
Total undrawn loan commitments outstanding at 31 December 2024 were $10,632 million (2023 – $9,028 million), of which $10,235 million are subject to 12-month ECL (2023 – $8,549 million) and $1 million are commitments outstanding on POCI loans (2023 – $2 million).
The allowance for ECL on undrawn loan commitments, which we record in accounts payable and other liabilities, was $11 million at 31 December 2024 (2023 – $25 million), a decrease of $14 million for the year (2023 – a $10 million increase).
The ECL allowance on our loan portfolio is not materially sensitive to changes in economic inputs or weightings as the majority of the allowance is comprised of loans classified as Stage 3, where ECL does not vary between scenarios.
2024 Annual Report — 113
Sources of guarantee
We are assured collection of principal and accrued interest on 99% (2023 – 99%) of our loans. The sources of guarantee for these loans are provided in the following table.
| 2024 | 2023 | |||||||||||||||||||||||
| (in millions) |
FVTPL | Amortized cost |
Total | FVTPL | Amortized cost |
Total | ||||||||||||||||||
| Provinces and territories through provisions in the SHA |
20 | 768 | 788 | 54 | 953 | 1,007 | ||||||||||||||||||
| Government of Canada through provisions in the NHA |
470 | 1,776 | 2,246 | 428 | 818 | 1,246 | ||||||||||||||||||
| Indigenous Services Canada through Ministerial Loan Guarantees |
- | 1,471 | 1,471 | - | 1,411 | 1,411 | ||||||||||||||||||
| Loans underwritten by our MI Activity |
- | 9,646 | 9,646 | - | 6,952 | 6,952 | ||||||||||||||||||
|
Collateral1 |
- | 277,791 | 277,791 | - | 257,996 | 257,996 | ||||||||||||||||||
| Total guaranteed loans |
490 | 291,452 | 291,942 | 482 | 268,130 | 268,612 | ||||||||||||||||||
| Other Lending programs loans2 |
12 | 3,052 | 3,064 | 12 | 2,482 | 2,494 | ||||||||||||||||||
| MI Activity loans |
19 | 24 | 43 | 18 | 38 | 56 | ||||||||||||||||||
| Total |
521 | 294,528 | 295,049 | 512 | 270,650 | 271,162 | ||||||||||||||||||
| 1 | Represents collateral held for CMB program and IMPP loans, which consists of NHA MBS securities and in the case of the CMB program only, high quality reinvestment assets. |
| 2 | Consists of loans to provincial entities, municipalities and partnerships between governments, non-profits and private sector. Losses on some of these loans would be eligible for partial reimbursement from the Government of Canada. |
2024 Annual Report — 114
| 15. | Borrowings |
The following tables present the contractual maturity profile and average yield of borrowings based on carrying value.
| Year of maturity | ||||||||||||||||||||||||||||||||
| (in millions) |
2025 | 2026 | 2027 | 2028 | 2029 | 2030 and thereafter |
Total 2024 |
Total 2023 |
||||||||||||||||||||||||
| Designated at FVTPL |
||||||||||||||||||||||||||||||||
| Borrowings from the Government of Canada – Lending programs |
128 | 20 | - | - | - | - | 148 | 219 | ||||||||||||||||||||||||
| Yield1 |
1.6% | 1.3% | - | - | - | - | 1.5% | 1.8% | ||||||||||||||||||||||||
| Borrowings at amortized cost |
||||||||||||||||||||||||||||||||
| Canada mortgage bonds |
40,779 | 32,381 | 31,707 | 39,002 | 39,737 | 93,263 | 276,869 | 254,389 | ||||||||||||||||||||||||
| Borrowings from the Government of Canada – Lending programs |
2,854 | 643 | 561 | 696 | 1,925 | 15,442 | 22,121 | 17,502 | ||||||||||||||||||||||||
| Borrowings from the Government of Canada – IMPP |
335 | - | - | - | - | - | 335 | 2,866 | ||||||||||||||||||||||||
| Total borrowings at amortized cost |
43,968 | 33,024 | 32,268 | 39,698 | 41,662 | 108,705 | 299,325 | 274,757 | ||||||||||||||||||||||||
| Yield1 |
2.1% | 1.8% | 3.1% | 3.4% | 3.1% | 3.0% | 2.8% | 2.8% | ||||||||||||||||||||||||
| Total |
44,096 | 33,044 | 32,268 | 39,698 | 41,662 | 108,705 | 299,473 | 274,976 | ||||||||||||||||||||||||
| 1 | Represents the weighted-average yield, determined by applying the weighted-average effective yields of individual fixed rate borrowings and the weighted-average yields-to-reset of floating rate borrowings. |
Borrowings – designated at fair value through profit or loss
Included in this category are medium-term borrowings from the Government taken to fund certain Housing Programs Activity loans originated prior to August 2016. Medium-term debt includes fixed rate notes, with an original term to maturity ranging from two to ten years.
The carrying amount at 31 December 2024 of borrowings – designated at FVTPL is $1 million lower (2023 – $7 million lower) than the contractual amount due at maturity. Our liabilities are backed by the credit of the Government and there is no significant change in value that can be attributed to changes in credit risk.
2024 Annual Report — 115
Borrowings – amortized cost
This category includes borrowings under the CMB program and under the IMPP, as well as short- and medium-term borrowings from the Government taken to fund certain Housing Programs Activity loans, including all those originated after July 2016. Short-term debt, having an original term to maturity less than 365 days, was $2.2 billion at 31 December 2024 (2023 – $939 million). Medium-term debt includes fixed rate notes, with an original term to maturity ranging from two to ten years. The following table presents the cash flows and non-cash changes for borrowings.
| Cash flows | Non-cash changes | |||||||||||||||||||||||||||
| (in millions) |
Balance at beginning of year |
Issuances | Repayments | Fair value changes |
Accretion and other |
Eliminations | Balance at end of year |
|||||||||||||||||||||
| 2024 |
||||||||||||||||||||||||||||
| Designated at FVTPL |
||||||||||||||||||||||||||||
| Borrowings from the Government of Canada – Lending programs |
219 | - | (77) | 6 | - | - | 148 | |||||||||||||||||||||
| Borrowings at amortized cost |
|
|||||||||||||||||||||||||||
| Canada mortgage bonds |
254,389 | 60,193 | (37,765) | - | 48 | 4 | 276,869 | |||||||||||||||||||||
| Borrowings from the Government of Canada – Lending programs |
17,502 | 24,557 | (19,930) | (140) | 132 | - | 22,121 | |||||||||||||||||||||
| Borrowings from the Government of Canada – IMPP |
2,866 | - | (2,531) | - | - | - | 335 | |||||||||||||||||||||
| Total borrowings at amortized cost |
274,757 | 84,750 | (60,226) | (140) | 180 | 4 | 299,325 | |||||||||||||||||||||
| Total |
274,976 | 84,750 | (60,303) | (134) | 180 | 4 | 299,473 | |||||||||||||||||||||
| 2023 |
||||||||||||||||||||||||||||
| Designated at FVTPL |
||||||||||||||||||||||||||||
| Borrowings from the Government of Canada – Lending programs |
374 | - | (162) | 7 | - | - | 219 | |||||||||||||||||||||
| Borrowings at amortized cost |
|
|||||||||||||||||||||||||||
| Canada mortgage bonds |
254,897 | 45,204 | (45,727) | - | 42 | (27) | 254,389 | |||||||||||||||||||||
| Borrowings from the Government of Canada – Lending programs |
15,424 | 13,831 | (11,755) | (80) | 82 | - | 17,502 | |||||||||||||||||||||
| Borrowings from the Government of Canada – IMPP |
3,449 | - | (583) | - | - | - | 2,866 | |||||||||||||||||||||
| Total borrowings at amortized cost |
273,770 | 59,035 | (58,065) | (80) | 124 | (27) | 274,757 | |||||||||||||||||||||
| Total |
274,144 | 59,035 | (58,227) | (73) | 124 | (27) | 274,976 | |||||||||||||||||||||
When we hold CMB to maturity or acquire CMB in the primary market, we exclude the related cash flows from the consolidated statement of cash flows. During the year ended 31 December 2024, we have excluded $160 million (2023 – $313 million) of CMB maturities from repayments in the previous table and from investment securities – sales and maturities in the consolidated statement of cash flows. We have also excluded $10 million (2023 – $21 million) of CMB purchases in the primary market from issuances in the previous table and from investment securities – purchases in the consolidated statement of cash flows.
2024 Annual Report — 116
Borrowing authorities
The Minister of Finance approves our Borrowing Plan annually and establishes limits and parameters for borrowings, namely capital market borrowings and borrowings from the Government in the Housing Programs and Mortgage Funding Activities.
For 2024, the limits on our short-term borrowings outstanding and long-term borrowings issued are $7 billion and $6.5 billion, respectively (2023 – $6.5 billion and $6.5 billion). Actual short-term borrowings outstanding as at 31 December 2024, and long-term borrowings issued in 2024 were $2.2 billion and $4.3 billion, respectively (2023– $939 million and $2.4 billion).
The legislative authority, which is separate from the limits and does not apply to borrowings of CHT, requires that the total indebtedness outstanding at any time, other than to the Government, not exceed $15 billion (2023 – $15 billion). The outstanding principal balance of this indebtedness was nil as at 31 December 2024 (2023 – nil).
| 16. | Derivatives |
Derivatives are financial contracts whose value is derived from movements in one or more underlying securities, rates, indices or other instruments. We use derivatives in conjunction with our risk management activities.
Interest rate swaps are transactions in which two parties exchange interest cash flows on a specified notional amount for a predetermined period based on agreed-upon fixed and floating rates. Notional amounts are not exchanged. The value of these swaps is derived from movements in interest rates. We use them to manage either reinvestment risk or mismatches in the timing of receipts from assets versus payments of liabilities.
Foreign currency forward contracts are over-the-counter contracts in which two parties agree to exchange one currency for another at a specified price for settlement at a future predetermined date. The value of these contracts is derived from movements in foreign exchange and interest rates. We use them to manage currency risk associated with U.S. dollar-denominated debt securities.
FTHBI loan derivatives result from the recognition of a payable to, or receivable from, the Government of Canada when there are underlying loan gains or losses. Upon loan settlement, we will either pay loan gains to, or recover loan losses from, the Government. The value of these derivatives is derived from movement in the fair value of the underlying home values, which affects the fair value of the loans.
The following table provides the notional amounts of the derivative transactions recognized in the consolidated financial statements. Notional amounts, which are off-balance sheet, serve as a point of reference for calculating payments and do not represent the fair value, or the potential gain or loss associated with the credit or market risk of such instruments.
| 2024 | 2023 | |||||||||||||||||||||||||||||||
| Average term to maturity |
Notional amount |
Fair value | Average term to maturity |
Notional amount |
Fair value | |||||||||||||||||||||||||||
| (in millions) | Asset | Liability | Asset | Liability | ||||||||||||||||||||||||||||
| Interest rate swaps |
1 year | 278 | - | 1 | 1 year | 397 | - | 4 | ||||||||||||||||||||||||
| Foreign currency forward contracts |
Within 1 year | 4,479 | - | 135 | |
Within 1 year |
|
4,329 | 161 | 4 | ||||||||||||||||||||||
| First Time Home Buyer loan derivative |
22 years | 467 | - | 69 | 23 years | 428 | - | 47 | ||||||||||||||||||||||||
| Total |
5,224 | - | 205 | 5,154 | 161 | 55 | ||||||||||||||||||||||||||
2024 Annual Report — 117
Credit exposure of derivatives
The following table presents the credit exposure of derivatives by term to maturity. The replacement value is the total current fair value including accrued interest of all outstanding contracts with a positive fair value, after factoring in the impact of master netting agreements. The replacement value represents our maximum derivative credit exposure. Potential future credit exposure represents an estimate of the potential change in the market value of the transaction up to maturity which is calculated in relation to the notional principal of the contracts by applying factors consistent with guidelines issued by OSFI.
Credit risk equivalent is the total of the replacement value and the potential future credit exposure. The risk weighted equivalent is determined by applying a standard OSFI defined measure of counterparty credit risk to the credit equivalent amount.
| Replacement value | 2024 | 2023 | ||||||||||||||||||||||||||||||
| (in millions) | Within 1 year |
1 to 5 years |
Over 5 years |
Potential future credit exposure |
Credit risk equivalent |
Risk- weighted equivalent |
Credit risk |
Risk- weighted equivalent |
||||||||||||||||||||||||
| Derivatives |
- | - | - | 18 | 18 | 4 | 205 | 41 | ||||||||||||||||||||||||
The fair value of the collateral we hold related to our derivatives as at 31 December 2024 was nil (2023 – nil).
| 17. | Financial Instruments Income and Expenses |
Interest income, investment income and interest expense
The following table outlines the total interest income and expense for financial instruments and the investment income recognized in the consolidated statement of income and comprehensive income.
| 2024 | 2023 | |||||||||||||||||||||||
| (in millions) |
Interest Income |
Investment Income |
Interest Expense |
Interest Income |
Investment Income |
Interest Expense |
||||||||||||||||||
| Income and expenses not at FVTPL |
||||||||||||||||||||||||
| Cash equivalents |
66 | 31 | - | 81 | 30 | - | ||||||||||||||||||
| Debt instruments – FVOCI |
- | 734 | - | - | 522 | - | ||||||||||||||||||
| Debt instruments – amortized cost |
106 | - | - | 84 | - | - | ||||||||||||||||||
| Loans – amortized cost |
7,831 | - | - | 6,876 | - | - | ||||||||||||||||||
| Securities purchased under resale agreements |
32 | - | - | 28 | - | - | ||||||||||||||||||
| Borrowings – amortized cost |
- | - | 7,913 | - | - | 6,954 | ||||||||||||||||||
| Total income and expenses not at FVTPL |
8,035 | 765 | 7,913 | 7,069 | 552 | 6,954 | ||||||||||||||||||
| Income and expenses at FVTPL |
||||||||||||||||||||||||
| Debt instruments |
7 | - | - | 12 | - | - | ||||||||||||||||||
| Loans |
1 | - | - | 1 | - | - | ||||||||||||||||||
| Borrowings |
- | - | 3 | - | - | 7 | ||||||||||||||||||
| Derivatives |
(4) | - | - | (5) | - | - | ||||||||||||||||||
| Total income and expenses at FVTPL |
4 | - | 3 | 8 | - | 7 | ||||||||||||||||||
| Total income and expenses before dividend income |
8,039 | 765 | 7,916 | 7,077 | 552 | 6,961 | ||||||||||||||||||
| Dividend income |
- | - | - | - | 1 | - | ||||||||||||||||||
| Total |
8,039 | 765 | 7,916 | 7,077 | 553 | 6,961 | ||||||||||||||||||
2024 Annual Report — 118
Net gains (losses) on financial instruments
The following table presents the net gains (losses) on financial instruments recognized in the consolidated statement of income and comprehensive income.
| (in millions) |
2024 | 2023 | ||||||
| Financial instruments designated at FVTPL |
||||||||
| Loans |
1 | 2 | ||||||
| Borrowings |
(6) | (7) | ||||||
| Total financial instruments designated at FVTPL |
(5) | (5) | ||||||
| Financial instruments mandatorily at FVTPL |
||||||||
| Equity securities |
(5) | - | ||||||
| Derivatives |
(448) | 80 | ||||||
| Loans |
22 | 16 | ||||||
| Total financial instruments mandatorily at FVTPL |
(431) | 96 | ||||||
| Debt instruments held at FVOCI1 |
289 | (231) | ||||||
| Loans — amortized cost2 |
(226) | (150) | ||||||
| Borrowings — amortized cost |
140 | 80 | ||||||
| Expected credit recoveries (losses) on financial assets |
39 | (2) | ||||||
| Total |
(194) | (212) | ||||||
| 1 | Includes foreign exchange gain of $411 million (2023 – loss of $119 million) resulting from translation of U.S. dollar-denominated debt instruments. |
| 2 | Includes losses on loans recognized immediately upon initial advance of $178 million (2023 – $109 million) and the amortization of deferred net losses of $48 million (2023 – $41 million). |
Deferred net losses on financial instruments
The following table presents the deferred net losses on financial instruments for certain Lending program loans not recognized in the consolidated statement of income and comprehensive income.
| (in millions) |
2024 | 2023 | ||||||
| Balance at beginning of the year |
433 | 263 | ||||||
| Deferred net losses on financial instruments in the year |
194 | 211 | ||||||
| Recognized net losses on financial instruments in the year |
(48) | (41) | ||||||
| Balance at end of year |
579 | 433 | ||||||
| 18. | Market Risk |
Market risk is the risk of adverse financial impacts arising from changes in underlying market factors, including interest rates and foreign exchange rates. Despite changes in economic and market conditions, there were no material changes to our assessment and management of market risk in the year ended 31 December 2024.
Interest rate risk
Interest rate risk is the risk that the fair value or future cash flows of a financial instrument or insurance contract held will fluctuate because of changes in market interest rates.
The investment portfolios for the Mortgage Insurance and Mortgage Funding Activities are managed in accordance with their Strategic Asset Allocation (SAA), which limits interest rate risk relative to internal limits and benchmarks.
2024 Annual Report — 119
There is no direct contractual relationship between our financial assets and our insurance contracts. However, we manage net interest rate risk by maintaining an appropriate mix of financial assets which would support the insurance contract liabilities in an economic stress scenario.
The Housing Programs Activity is exposed to interest rate risk when asset and liability principal and interest cash flows have different payment, repricing or maturity dates. Some of our loans contain prepayment and/or repricing options, however our interest rate risk remains minimal in these instances as we have the right to prepay our borrowings from the Government of Canada totaling $22,269 million (2023 – $17,721 million) with minimal penalty, at any time.
We manage interest rate risk in the Housing Programs Activity’s lending programs differently depending on the cash flow characteristics of the program’s loans and when the loans were originated. The interest rate risk is managed in each of the lending programs, as described below.
For certain DL loans originated prior to August 2016 and having a gross carrying amount of $20 million at 31 December 2024 (2023 – $54 million), we use derivatives to manage reinvestment and refinancing risks as well as mismatches in the timing of cash flows between the loans, reinvested principal receipts and borrowings. For DL loans originated after July 2016 and having a gross carrying amount of $1,922 million as at 31 December 2024 (2023 – $2,020 million), we use an asset/liability matching strategy on a portfolio basis whereby we structure our borrowings matching the future obligations to the cash flows to be received on the loans. Under this matching strategy, we do not use derivatives and the term over which we must reinvest principal receipts is significantly reduced. Cumulative cash flow mismatches are limited by policy to $30 million (2023– $30 million).
For the MILP, closed to new loans since 2011, we manage interest rate risk through matching the present value of cash flows of the program’s assets and liabilities. Loans in this program had a gross carrying amount of $428 million at 31 December 2024 (2023 – $534 million).
For the ACLP and AHF programs which have longer-term expected draw schedules, we manage the uncertainty of the timing of loan cash flows and of investment returns earned on borrowed funds by building these factors into our loan pricing. The gross carrying amount of loans in these programs was $12,154 million at 31 December 2024 (2023 – $8,742 million).
For the FTHBI and CGHL programs, which are non-interest bearing loans, we manage interest rate risks through the receipt of government funding for interest costs. Loans under these programs had a gross carrying amount of $1,967 million at 31 December 2024 (2023 – $938 million).
Interest rate risk on other Housing Programs Activity loans of $738 million at 31 December 2024 (2023 – $844 million) is managed through retained earnings in the Equity of Canada.
For loans under the CMB program, we enter into swap agreements with approved financial institution counterparties to manage interest rate risk and prepayment/reinvestment risk, as principal on the liabilities is due at maturity and reinvested. We pay all interest received from the underlying NHA MBS and reinvestment assets to the swap counterparties in exchange for an amount equal to the CMB coupon payments. For loans under the IMPP, we enter into swap agreements to manage interest rate and prepayment risk, as principal on the liabilities is due over time. We pay the effective interest received on the underlying NHA MBS less administration costs to the swap counterparties in exchange for an amount equal to the interest owed on borrowings from the Government of Canada. As a result of these swap agreements, these risks related to the CMB program and IMPP have no net impact on the consolidated statement of income and comprehensive income.
Currency risk
Currency risk is the risk that the fair value or future cash flows of a financial instrument will fluctuate because of changes in foreign exchange rates. We are exposed to currency risk from our holdings of foreign currency denominated investment securities. Our internal policies limit the amount of foreign currency investments and require full hedging of currency risk. We held $4,536 million in FVOCI debt securities denominated in U.S. dollars as at 31 December 2024 (2023 – $4,116 million) and $12 million in FVTPL debt securities denominated in U.S. dollars as at 31 December 2024 (2023 – $11 million).
2024 Annual Report — 120
Our strategy to fully hedge currency risk is to continuously enter into a series of short-term foreign currency forward contracts that have terms up to one year. Under these contracts, we exchange U.S. dollars for Canadian dollars at an exchange rate fixed at the outset of the contract for settlement at a future predetermined date. Given the short-term nature of the forward contracts, hedging of currency risk over the life of the foreign-denominated debt securities will require continued application of our strategy in the future. The exposures presented in the Value at Risk (VaR) table in the next section reflect the mitigating effect of the derivative contracts. Currency risk was assessed as immaterial as at 31 December 2024 (2023 – immaterial) after accounting for derivatives.
Sensitivity analysis
Value at risk
We evaluate market risk for investment securities in the Mortgage Insurance and Mortgage Funding Activities through the use of VaR models. VaR is a statistical technique used to measure the maximum potential loss of an investment portfolio over a specified holding period with a given level of confidence. The VaR for the Mortgage Insurance and Mortgage Funding Activities as at 31 December, calculated with 95% confidence over a 22 business day holding period, is outlined in the following table. VaR is presented separately for individual market risk factors and for the total portfolio. The effect of diversification results from the fact that market risks are not perfectly correlated and, consequently, there is a benefit from investment diversification. The VaR figures are based on one year of historical prices and correlations of bond and equity markets and 26 weeks of volatility.
| Mortgage Insurance | Mortgage Funding | |||||||||||||||
| (in millions) |
2024 | 2023 | 2024 | 2023 | ||||||||||||
| Investment securities: |
||||||||||||||||
| CAD-denominated securities |
163 | 187 | 72 | 78 | ||||||||||||
| USD-denominated securities |
80 | 86 | - | - | ||||||||||||
| Effect of diversification |
(8) | (1) | - | - | ||||||||||||
| Total VaR |
235 | 272 | 72 | 78 | ||||||||||||
Interest rate risk on insurance contracts – Mortgage Insurance
The following table presents the Mortgage Insurance Activity’s exposure to interest rate risk for our insurance contracts. The percentage change in the discount rate is applied to derive the possible impact on other comprehensive income before income taxes and equity of Canada with all other assumptions held constant.
| Change indicator |
Change in assumptions |
Impact on other before income taxes
|
Impact on equity
|
|||||||||||||||||||||
| (in millions) |
2024 |
2023 |
2024 |
2023 |
||||||||||||||||||||
| Discount rate |
Relative | +1% | 185 | 137 | 139 | 103 | ||||||||||||||||||
| Relative | -1% | (209) | (158) | (157) | (119) | |||||||||||||||||||
2024 Annual Report — 121
Interest rate sensitivity – Housing Programs
We evaluate market risk for the Housing Programs Activity portfolio of loans, investments, borrowings and swaps by measuring their sensitivity to changes in interest rates.
For the Housing Programs Activity’s financial instruments designated at FVTPL and derivatives, we assessed the impact of a 200 bps shift in interest rates as immaterial as at 31 December 2024 after accounting for derivatives.
The Housing Programs Activity’s investments, loans and borrowings measured at amortized cost are also exposed to interest rate risk. The net impact of a shift in interest rates on their fair value is presented in the following table.
| 2024 Interest rate shift |
2023 Interest rate shift |
|||||||||||||||
| (in millions) |
-200 bps | +200 bps | -200 bps | +200 bps | ||||||||||||
| Increase (decrease) in fair value of net assets1 |
(840) | 695 | (694) | 572 | ||||||||||||
| 1 | The changes in fair value of net assets resulting from interest rate shifts presented in this table would not be recognized in comprehensive income as the underlying financial instruments are measured at amortized cost. |
| 19. | Credit Risk |
Credit risk is the potential for financial loss arising from failure of a borrower or an institutional counterparty to fulfill its contractual obligations. We are exposed to credit risk from various sources including borrower default through mortgage insurance contracts and institutional counterparty credit risk arising from financial guarantees under the NHA MBS and CMB programs, lending arrangements, fixed income investments and derivative transactions. There has been no significant change in the nature of risks and how we manage them in the year ended 31 December 2024.
A detailed breakdown of credit risk is presented in the following section.
| (in billions) |
2024 | 2023 | ||||||
| Mortgage insurance: insurance-in-force (Note 7) |
440 | 414 | ||||||
| TPGs: guarantees-in-force (Note 8)1 |
553 | 508 | ||||||
| 1 | Includes underlying instruments which are also insured by CMHC included in insurance-in-force. |
For all financial assets other than guarantees or derivatives, the maximum exposure to credit risk is the carrying amount. For derivatives, the maximum exposure to credit risk is indicated in Note 16.
Credit risk associated with mortgage insurance is managed through prudent product design, underwriting and default management practices, and the establishment of adequate capital reserves as described in Notes 7 and 10.
Credit risk associated with TPGs is managed through due diligence in approving NHA MBS Issuers, ongoing monitoring of Issuer credit quality and program compliance, and the requirement that all mortgages supporting the NHA MBS be insured against borrower default. We have further mitigated this risk by having been assigned all rights, title and interest in the underlying mortgages so that we have access to principal and interest payments in the event of issuer default.
Credit risk associated with loans in the Housing Programs Activity is in part mitigated through measures that include loan guarantees from other government entities as described in Note 14. We are assured collection of principal and accrued interest on 99% of our loans.
Under the CMB program, and the IMPP, loans represent amounts due from Canadian financial institutions as a result of the sale of their beneficial interest in NHA MBS securities to us. The loans are collateralized by the NHA MBS and associated reinvestment securities under the CMB program only, acquired in the transactions. The collateral, which is rated R-1 (high) or AAA by at least two rating agencies, is held in our name and represents the sole source of principal repayments for the loans.
2024 Annual Report — 122
Under the CMB program and the IMPP, we are exposed to credit-related counterparty risk in the event of default of swap counterparties. This risk is mitigated by transacting with highly rated swap counterparties and collateralization requirements based on credit ratings. All swap counterparties must have a minimum credit rating of BBB+ (high) (CMB program), or A- (IMPP), or their equivalents, by at least two rating agencies.
The fair value of total loan collateral held under the CMB program was $278,534 million, 100.4% of loan carrying value, as at 31 December 2024 (2023 – $250,488 million, 98.2% of loan carrying value).
The fair value of total loan collateral held under the IMPP was $335 million, 100.0% of loan carrying value, as at 31 December 2024 (2023 – $2,785 million, 97.2% of loan carrying value).
We manage credit risk associated with fixed income investments and derivatives through policies which include minimum counterparty credit ratings and investment portfolio diversification limits by issuer, credit rating, term and by industry sector, and through legal agreements and collateralization requirements for derivatives.
Concentration risk
Concentration risk arises from holdings of financial instruments issued by entities that operate in the same sector or geographic area or engage in similar activities such that they may be affected similarly by changes in economic or other conditions.
The following table presents the concentration of credit risk by sector and geographic region of our investment securities and derivative transactions:
| (in millions) |
2024 | 2023 | ||||||||||||||
| By sector: |
||||||||||||||||
| Federal |
11,628 | 40.8% | 10,655 | 41.9% | ||||||||||||
| Provincial |
6,285 | 22.1% | 4,288 | 16.8% | ||||||||||||
| Financial |
3,863 | 13.6% | 4,253 | 16.7% | ||||||||||||
| Energy and Utilities |
1,365 | 4.8% | 1,123 | 4.4% | ||||||||||||
| Supranational |
1,268 | 4.4% | 1,328 | 5.2% | ||||||||||||
| Industrial |
1,261 | 4.4% | 1,077 | 4.2% | ||||||||||||
| Real estate |
682 | 2.4% | 575 | 2.3% | ||||||||||||
| Consumer goods |
525 | 1.8% | 510 | 2.0% | ||||||||||||
| Communications |
485 | 1.7% | 494 | 1.9% | ||||||||||||
| Technology |
435 | 1.5% | 475 | 1.9% | ||||||||||||
| Other |
707 | 2.5% | 676 | 2.7% | ||||||||||||
| Total1 |
28,504 | 100.0% | 25,454 | 100.0% | ||||||||||||
| By geographic region: |
||||||||||||||||
| Canada |
20,991 | 73.7% | 18,204 | 71.6% | ||||||||||||
| U.S. |
5,157 | 18.1% | 4,874 | 19.1% | ||||||||||||
| Europe |
1,031 | 3.6% | 1,117 | 4.4% | ||||||||||||
| Asia and Pacific |
856 | 3.0% | 797 | 3.1% | ||||||||||||
| Other |
469 | 1.6% | 462 | 1.8% | ||||||||||||
| Total1 |
28,504 | 100.0% | 25,454 | 100.0% | ||||||||||||
| 1 | Total comprised of cash equivalents of $1,591 million (2023 – $1,833 million), investment securities of $26,913 million (2023 – $23,460 million) and derivatives with a positive fair value, net of collateral, of nil (2023 – $161 million). |
2024 Annual Report — 123
Credit quality
The following table presents the credit quality of our cash equivalents and investment securities based on our internal credit rating system. Amounts in the table represent gross carrying amounts.
| Credit Rating1 |
||||||||||||||||||||||||||||||||||||||||||||||||
| 2024 |
2023 |
|||||||||||||||||||||||||||||||||||||||||||||||
| (in millions) |
AAA | AA- to AA+ |
A- to A+ |
BBB- to BBB+ |
Lower than BBB- |
Total | AAA | AA- to AA+ |
A-to A+ |
BBB- to BBB+ |
Lower than BBB- |
Total | ||||||||||||||||||||||||||||||||||||
| Cash equivalents |
365 | 567 | 659 | - | - | 1,591 | 686 | 303 | 844 | - | - | 1,833 | ||||||||||||||||||||||||||||||||||||
| Investment securities2 |
||||||||||||||||||||||||||||||||||||||||||||||||
| FVTPL |
20 | - | - | - | - | 20 | 18 | - | - | - | - | 18 | ||||||||||||||||||||||||||||||||||||
| FVOCI |
11,500 | 4,187 | 4,837 | 2,698 | 65 | 23,287 | 10,199 | 3,708 | 3,765 | 2,421 | 69 | 20,162 | ||||||||||||||||||||||||||||||||||||
| Amortized cost |
1,321 | 1,684 | 564 | - | - | 3,569 | 1,524 | 1,399 | 306 | - | - | 3,229 | ||||||||||||||||||||||||||||||||||||
| 1 | The internal credit ratings are based upon internal assessments of the counterparty creditworthiness. These ratings correspond to those provided by credit rating agencies except in cases where stand-alone ratings exist. A counterparty internal credit rating cannot be higher than the highest stand-alone rating from any of the agencies. A stand-alone rating removes the assumption of government support from the rating. |
| 2 | Includes fixed income investments. |
Derivatives
We limit the credit risk associated with interest rate swaps and foreign currency forward contracts by dealing with counterparties whose credit ratings are in accordance with our Enterprise Risk Management Policies; through the use of International Swaps Derivatives Association (ISDA) master agreements for derivatives; and, where appropriate, through the use of ratings-based collateral thresholds in the Credit Support Annexes (CSA).
ISDA is a master agreement that sets out standard terms that apply to all transactions we entered with the counterparty. The ISDA outlines procedures and calculations of termination costs in the event of default by either party. The ISDA master agreements give us a legally enforceable right to settle all transactions covered by the agreement with the same counterparty on a net basis in the event of default. All derivative counterparties must have a minimum credit rating of A-, or its equivalent, from at least two rating agencies.
The CSA document, included in the ISDA master agreements, regulates the collateral requirements of derivative transactions and the terms under which collateral is transferred to mitigate credit risk. The CSA gives us the right, in the event of default, to liquidate collateral held and apply proceeds received from liquidation against amounts due from the counterparty. Collateral held to offset mark-to-market exposures is not used for any other purpose than to offset such exposure.
Securities purchased under resale agreements
By their nature, these balances have low credit risk given their short terms and are secured by the underlying securities purchased under the agreements and any incremental margin obtained from counterparties.
These transactions are subject to Global Master Repurchase Agreements which set out the standard terms of all repurchase agreements transacted with each counterparty. These agreements give us a legally enforceable right to settle all repurchase transactions with the same counterparty on a net basis in the event of default. These agreements also provide for the posting of margin by the counterparty when our exposure to that entity exceeds a certain ratings-based threshold. Securities held as eligible margin include debt obligations issued by or guaranteed by the Government, including Crown corporations and CHT. Margin securities should not be used for any other purpose than to offset such exposure. In the event of counterparty default, we have the right to liquidate these securities. We held $5 million in margin securities at 31 December 2024 (2023 – $6 million).
2024 Annual Report — 124
Netting arrangements and offsetting of financial assets and financial liabilities
The following tables present the potential effects of the netting arrangements described previously.
Financial assets
| (i) | (ii) | (iii) = (i) - (ii) | (iv) | (v) = (iii) - (iv) |
||||||||||||||||||||
| Gross amount of recognized assets |
Gross offset in the |
Net amount of assets presented in the consolidated balance sheet1 |
Gross amount not offset in the consolidated balance sheet |
Net amount4 |
||||||||||||||||||||
| (in millions) |
Financial instruments2 |
Financial received3 |
||||||||||||||||||||||
| 2024 |
||||||||||||||||||||||||
| Derivatives1 |
1 | - | 1 | (1) | - | - | ||||||||||||||||||
| Securities purchased under resale agreement1 |
950 | - | 950 | - | (956) | - | ||||||||||||||||||
| Total |
951 | - | 951 | (1) | (956) | - | ||||||||||||||||||
| 2023 |
||||||||||||||||||||||||
| Derivatives1 |
162 | - | 162 | (5) | - | 157 | ||||||||||||||||||
| Securities purchased under resale agreement1 |
700 | - | 700 | - | (707) | - | ||||||||||||||||||
| Total |
862 | - | 862 | (5) | (707) | 157 | ||||||||||||||||||
| 1 | Derivatives are carried at fair value. Securities purchased under resale agreements are carried at amortized cost. |
| 2 | Gross amounts of financial instruments not offset in the consolidated balance sheet refers to amounts recorded to derivative liabilities and securities sold under repurchase agreements where we have a legally enforceable right to offset against amounts recorded to derivative assets and securities purchased under resale agreements, on a counterparty-by-counterparty basis, in the event of default of the counterparty. |
| 3 | We have the right, in the event of default, to liquidate and apply financial collateral held against amounts due from counterparties. For derivatives, these amounts represent the fair value of collateral posted by swap counterparties to us. For securities purchased under resale agreements, these amounts represent fair value of margin posted by counterparties and of securities we purchased with the commitment to resell to the counterparty at a future date. |
| 4 | We have no exposure to counterparties in our securities purchased under resale agreements. As such we have included a net exposure of nil. |
Derivative assets, as presented in the previous table, are reconciled to the consolidated balance sheet as follows:
| (in millions) |
2024 | 2023 | ||||||
| Derivative assets presented in offsetting table |
1 | 162 | ||||||
| Less: Accrued interest receivable presented separately in consolidated balance sheet |
(1) | (1) | ||||||
| Derivative asset balance presented in the consolidated balance sheet |
- | 161 | ||||||
2024 Annual Report — 125
Financial liabilities
| (i) | (ii) | (iii) = (i) - (ii) | (iv) | (v) = (iii) - (iv) |
||||||||||||||||||||
|
Gross |
Gross amount |
Net amount of |
Gross amount not offset in the consolidated balance sheet |
Net |
||||||||||||||||||||
| (in millions) |
Financial instruments2 |
Financial collateral pledged3 |
||||||||||||||||||||||
| 2024 |
||||||||||||||||||||||||
| Derivatives1 |
205 | - | 205 | (1) | - | 204 | ||||||||||||||||||
| 2023 |
||||||||||||||||||||||||
|
Derivatives1 |
55 | - | 55 | (5) | - | 50 | ||||||||||||||||||
| 1 | Derivatives are carried at fair value. |
| 2 | Gross amounts of financial instruments not offset in the consolidated balance sheet refers to amounts recorded to derivative assets and securities purchased under resale agreements where we have a legally enforceable right to offset against amounts recorded to derivative liabilities and securities sold under repurchase agreements, on a counterparty-by-counterparty basis, in the event of default of the counterparty. |
| 3 | Represents the fair value of securities we sold to counterparties with our commitment to repurchase from the counterparty at a future date, net of the fair value of any margin posted by our counterparties. |
20. Liquidity Risk
Liquidity risk is the risk that we will encounter difficulty in meeting obligations associated with financial liabilities. Liquidity risk comprises both funding liquidity risk, which is the risk that we will be unable to meet our payment obligations when required due to an inability to borrow or realize on overdraft facilities, and market liquidity risk, which is the risk that we are not able to unwind or offset a particular position without incurring losses because of inadequate market depth or market disruption.
The principal financial obligations exposing us to liquidity risk include, but are not limited to:
| • | the payment of claims incurred by the Mortgage Insurance Activity; |
| • | the need to fulfill the TPGs we have issued if sufficient funds are not available for the payment of principal or interest on NHA MBS or CMB by Approved Issuers or CHT, respectively; and |
| • | payments required by borrowings and derivatives. |
We have a liquidity risk policy which includes appropriate limits and other mitigants to ensure sufficient resources to meet current and projected cash requirements.
The Mortgage Insurance and Mortgage Funding Activities’ investment portfolios are managed to ensure that there is sufficient cash flow to meet projected claims. Sources of liquidity include: fees, premiums, investment income and proceeds from sales and maturities of investments.
Within the NHA MBS and CMB programs, liquidity risk refers to the risk that we may not be able to provide the funding required, in a timely fashion, to satisfy a call on our TPG obligations. As guarantor, we are exposed to the risk of NHA MBS issuer default, CMB program repo and swap counterparty default, impairment of eligible CMB program collateral securities and system or other operational failures. With respect to our TPGs, our policy is to maintain sufficient liquidity to cover the largest exposure to a single counterparty on a given payment date. Cash, the sale of short-term investments, and the sale of investment securities with the commitment to repurchase the securities are liquidity sources that could be utilized to satisfy a call on the TPGs. Additional liquidity sources in the event of an immediate need to fulfill the TPGs include overdraft facilities and a $350 million (2023 – $350 million) line of credit with the Central Paying Agent. The Central Paying Agent acts on CHT’s behalf to carry out certain payment
2024 Annual Report — 126
functions in the CMB program, including collection of monthly payments on NHA MBS purchased and administration and reporting of cash flows. Other policies in place to mitigate liquidity risk include ensuring high credit quality investments as permitted by the CHT trust agreements and swap counterparties and the establishment of maturity monitoring guidelines.
The Housing Programs Activity investment portfolio is managed to ensure that there is sufficient cash flow to meet funding needs in case of contingencies causing operational disruptions, unanticipated needs, and to facilitate use of the CBP. As described in Note 18, for our DL loan portfolios, we either use derivatives to manage mismatches in the timing of cash flows or our asset/liability management strategy to match our future cash inflows with future obligations. Further sources of liquidity associated with our Housing Programs Activity include overdraft facilities and cash and short-term investments in marketable securities. For any additional liquidity requirements, we can access the CBP upon Department of Finance approval as per our borrowing authorities as disclosed in Note 15.
At 31 December 2024, we had $300 million (2023 – $300 million) of overnight overdraft facilities available with our banker, under which we had drawn $6 million (2023 – $4 million).
We also mitigate liquidity risk through the use of ISDA master netting agreements that reduce the amount of cash required to satisfy derivative obligations.
Maturity analysis
The following table presents our undiscounted contractual cash flows payable, including accrued interest, under financial liabilities by remaining contractual maturities; this table therefore cannot be reconciled to the consolidated balance sheet.
| (in millions) |
Up to 1 year |
1 to 2 years |
2 to 3 years |
3 to 4 years |
4 to 5 years |
Over 5 years |
Total 2024 |
|||||||||||||||||||||
| 2024 |
||||||||||||||||||||||||||||
| Accounts payable and other liabilities1 |
275 | 87 | 29 | 27 | 3 | 12 | 433 | |||||||||||||||||||||
| Derivatives |
136 | - | - | - | - | 69 | 205 | |||||||||||||||||||||
| Insurance contract liabilities |
180 | 172 | 187 | 183 | 178 | 1,347 | 2,247 | |||||||||||||||||||||
| Borrowings – designated at FVTPL |
130 | 21 | - | - | - | - | 151 | |||||||||||||||||||||
| Borrowings – amortized cost |
51,908 | 40,391 | 38,768 | 45,214 | 45,908 | 119,983 | 342,172 | |||||||||||||||||||||
| Total |
52,629 | 40,671 | 38,984 | 45,424 | 46,089 | 121,411 | 345,208 | |||||||||||||||||||||
| 1 | Excludes expected credit losses on loan commitments, deferred funding for repayable loans and employee benefits. |
| (in millions) |
Up to 1 year |
1 to 2 years |
2 to 3 years |
3 to 4 years |
4 to 5 years |
Over 5 years |
Total 2023 |
|||||||||||||||||||||
| 2023 |
||||||||||||||||||||||||||||
| Accounts payable and other liabilities1 |
204 | 59 | 12 | 21 | 5 | 11 | 312 | |||||||||||||||||||||
| Derivatives |
7 | 1 | - | - | - | 46 | 54 | |||||||||||||||||||||
| Insurance contract liabilities |
160 | 169 | 163 | 145 | 119 | 958 | 1,714 | |||||||||||||||||||||
| Borrowings – designated at FVTPL |
81 | 130 | 21 | - | - | - | 232 | |||||||||||||||||||||
| Borrowings – amortized cost |
48,848 | 47,592 | 38,100 | 36,393 | 42,884 | 94,151 | 307,968 | |||||||||||||||||||||
| Total |
49,300 | 47,951 | 38,296 | 36,559 | 43,008 | 95,166 | 310,280 | |||||||||||||||||||||
| 1 | Excludes expected credit losses on loan commitments, deferred funding for repayable loans and employee benefits. |
Commitments related to loans and financial guarantees are disclosed in Note 14 and Note 8 respectively.
2024 Annual Report — 127
21. Accounts Receivable and Other Assets
The following table presents the composition of accounts receivable and other assets.
| (in millions) |
2024 | 2023 | ||||||
| Property and equipment |
165 | 150 | ||||||
| Deferred Government of Canada fees |
131 | 113 | ||||||
| Intangible assets |
127 | 130 | ||||||
| Non-current assets held for sale |
25 | 28 | ||||||
| One-time top-up to the Canada Housing Benefit advances1 |
10 | 34 | ||||||
| Other miscellaneous assets |
10 | 15 | ||||||
|
Right-of-use assets |
8 | 9 | ||||||
| Total |
476 | 479 | ||||||
| 1 | We made no advances to CRA during 2024 (2023 – $100 million). $2 million was recollected from proponents in 2024 (2023 – $254 million advanced to proponents) and unused funds totaling $26 million (2023 – $75 million) was returned to the Government via CMHC. |
22. Investment Property
The following table presents the changes in the investment property balance within our Housing Programs segment. Disclosures related to the determination of fair value of investment property are included in Note 11.
| (in millions) |
2024 | 2023 | ||||||
| Balance at beginning of year |
398 | 402 | ||||||
| Disposals |
- | (17) | ||||||
| Net unrealized gains (losses) in net income1 |
(2) | 13 | ||||||
| Balance at end of year |
396 | 398 | ||||||
| 1 | Included in other income. |
The investment property held in the Housing Programs Activity are valued at their highest and best use but its current use differs as these investment properties are used to carry out our social housing mandate rather than maximize economic value.
To support affordable housing we may sell the investment properties below their fair value.
23. Accounts Payable and Other Liabilities
The following table presents the composition of accounts payable and other liabilities.
| (in millions) |
2024 | 2023 | ||||||
| Accrued housing programs expenses |
279 | 167 | ||||||
| Accounts payable and accrued liabilities |
126 | 146 | ||||||
| Other miscellaneous liabilities |
111 | 96 | ||||||
| Affordable Rental Housing Innovation Fund deferred funding |
100 | 100 | ||||||
| Government of Canada fees |
49 | 37 | ||||||
| Self Insured Provision |
18 | 16 | ||||||
| Lease liabilities |
10 | 11 | ||||||
| Total |
693 | 573 | ||||||
2024 Annual Report — 128
24. Pension and Other Post-Employment Benefits
Defined benefit plans
The defined benefit plans include the defined benefit Pension Plan and Supplemental Plan as well as the OPEB plans.
On 1 January 2018, all eligible members were transferred to a new modified defined benefit pension plan. All pension plan modifications applied to service following the implementation date. All benefits earned by employees under the existing plans prior to the implementation date remained unchanged. Our defined benefit Pension Plan requires contributions to be made to a separately administered fund (Pension Fund) whereas the defined benefit Supplemental Plan and the OPEB are unfunded and we pay the benefits directly.
Pursuant to a trust agreement we entered into with the Pension Fund Trustees (the Trustees), they are responsible for the management and administration of the Pension Fund. There are eight Trustees, including our President, one member of our Board of Directors, three members of Senior Management and three Pension Council members (a combination of current and retired employees). The Trustees set investment policies and objectives within the context of the investment philosophy and Risk Appetite Framework established by the Board of Directors and periodically review these policies. The Pension Fund’s Investment Committee assists the Trustees in the investment management of the defined benefit Pension Plan.
The Pension Fund’s SAA policy is based on the principle of diversification of investments among various asset classes relative to the liabilities of the defined benefit Pension Plan. In 2021, the Board of Directors approved a new asset allocation policy, which we expect to have fully implemented by 2026. The SAA under the new policy is 37% public equity, 29% fixed income, 21% real assets, 5% private equity, 3% private debt and 5% US dollar-denominated emerging market debt, on a net asset basis. The policy includes permissible ranges around these percentage weights. Additionally, the policy allows for the use of a modest level of leverage of 25% of net asset value to purchase fixed income assets to reduce the interest rate risk of the portfolio.
The Pension Fund’s investments are subject to credit, liquidity and market risks. The most significant of these risks is asset volatility due to market conditions. For service accrued before 1 January 2018, benefits are indexed to the Consumer Price Index (CPI) in accordance with the Pension Plan rules. For service accrued after 1 January 2018, indexation of the benefits to the CPI are conditional in accordance with the Pension Plan rules and upon approval from the Board of Directors. As such, liabilities that are adjusted to CPI are subject to interest rate risks, inflation risk and changes in the life expectancy of the plan members. The most significant risk is interest rate risk as the present value of the liabilities is calculated using a discount rate set with reference to Canadian AA-rated corporate bond yields. If the Pension Fund assets underperform this yield, the funded position of the defined benefit Pension Plan decreases. Financial risks are managed primarily through the diversification of assets and prudent investment strategies.
The actuarial valuation on a going concern basis of our defined benefit component of the Pension Plan reports a surplus as at 31 December 2024. As a result, we are not required to make going concern special payments. The valuation on a solvency basis, which assumes that the plan is wound up at the valuation date, reports a surplus as at 31 December 2024 and we do not expect to make solvency special payments in 2025.
The next actuarial valuation will be undertaken at 31 December 2025 with the results reported in the 2025 consolidated financial statements.
The defined benefit obligation relating to the defined benefit plans is funded as follows:
| Pension benefit plans |
Other post-employment benefit plans |
|||||||||||||||
| (in millions) |
2024 | 2023 | 2024 | 2023 | ||||||||||||
| Wholly or partially funded |
2,396 | 2,251 | - | - | ||||||||||||
| Wholly unfunded |
91 | 92 | 90 | 93 | ||||||||||||
| Defined benefit obligation |
2,487 | 2,343 | 90 | 93 | ||||||||||||
2024 Annual Report — 129
Defined benefit pension and other post-employment benefit plans
The following tables present information about the defined benefit plans.
| Pension expense included in net income |
||||||||||||||||||||||||||||||||||||
| 2024 (in millions) |
1 Jan 2024 |
Current service cost |
Interest cost/ (income) |
Sub- total included in net income |
Benefits paid |
Remeasurements of the net defined benefit plans |
Employees’ contributions |
CMHC’s contributions |
31 Dec 2024 |
|||||||||||||||||||||||||||
| Pension Plan |
||||||||||||||||||||||||||||||||||||
| Defined benefit obligation |
2,255 | 37 | 101 | 138 | (111) | 89 | 25 | - | 2,396 | |||||||||||||||||||||||||||
| Fair value of plan assets |
(2,442) | - | (108) | (108) | 111 | (128) | (25) | (3) | (2,595) | |||||||||||||||||||||||||||
| Defined benefit plan (asset) |
(187) | 37 | (7) | 30 | - | (39) | - | (3) | (199) | |||||||||||||||||||||||||||
| Supplemental Plan |
||||||||||||||||||||||||||||||||||||
| Defined benefit obligation |
88 | 1 | 4 | 5 | (5) | 3 | - | - | 91 | |||||||||||||||||||||||||||
| Fair value of plan assets |
(1) | - | - | - | 5 | - | - | (5) | (1) | |||||||||||||||||||||||||||
| Supplementary Plan liability |
87 | 1 | 4 | 5 | - | 3 | - | (5) | 90 | |||||||||||||||||||||||||||
| OPEB |
||||||||||||||||||||||||||||||||||||
| Defined benefit obligation |
93 | 1 | 4 | 5 | (3) | (5) | - | - | 90 | |||||||||||||||||||||||||||
| Fair value of plan assets |
- | - | - | - | 3 | - | - | (3) | - | |||||||||||||||||||||||||||
| OPEB liability |
93 | 1 | 4 | 5 | - | (5) | - | (3) | 90 | |||||||||||||||||||||||||||
| Defined benefit plans liability |
180 | 2 | 8 | 10 | - | (2) | - | (8) | 180 | |||||||||||||||||||||||||||
| 1 | The detailed breakdown of remeasurement gains and losses on defined benefit plans included in OCI is found in the following tables. |
2024 Annual Report — 130
| Pension expense included in net income |
||||||||||||||||||||||||||||||||||||
| 2023 (in millions) |
1 Jan 2023 |
Current service cost |
Interest cost/ (income) |
Sub-total included in net income |
Benefits paid |
Remeasurements of the net defined benefit plans |
Employees’ contributions |
CMHC’s contributions |
31 Dec 2023 |
|||||||||||||||||||||||||||
| Pension Plan |
||||||||||||||||||||||||||||||||||||
| Defined benefit obligation |
2,039 | 32 | 101 | 133 | (104) | 162 | 25 | - | 2,255 | |||||||||||||||||||||||||||
| Fair value of plan assets |
(2,257) | - | (113) | (113) | 104 | (137) | (25) | (14) | (2,442) | |||||||||||||||||||||||||||
| Defined benefit plan (asset) |
(218) | 32 | (12) | 20 | - | 25 | - | (14) | (187) | |||||||||||||||||||||||||||
| Supplemental Plan |
||||||||||||||||||||||||||||||||||||
| Defined benefit obligation |
81 | 1 | 4 | 5 | (6) | 8 | - | - | 88 | |||||||||||||||||||||||||||
| Fair value of plan assets |
(1) | - | - | - | 6 | - | - | (6) | (1) | |||||||||||||||||||||||||||
| Supplementary Plan liability |
80 | 1 | 4 | 5 | - | 8 | - | (6) | 87 | |||||||||||||||||||||||||||
| OPEB |
||||||||||||||||||||||||||||||||||||
| Defined benefit obligation |
86 | 1 | 4 | 5 | (3) | 5 | - | - | 93 | |||||||||||||||||||||||||||
| Fair value of plan assets |
- | - | - | - | 3 | - | - | (3) | - | |||||||||||||||||||||||||||
| OPEB liability |
86 | 1 | 4 | 5 | - | 5 | - | (3) | 93 | |||||||||||||||||||||||||||
| Defined benefit plans liability |
166 | 2 | 8 | 10 | - | 13 | - | (9) | 180 | |||||||||||||||||||||||||||
| 1 | The detailed breakdown of remeasurement gains and losses on defined benefit plans included in OCI is found in the following tables. |
2024 Annual Report — 131
The following table presents further detailed information on the various sources of remeasurement in OCI included in the prior table.
| Remeasurement (gains)/losses included in OCI | ||||||||||||||||||||
| (in millions) |
Remeasurement of plan assets (excluding interest income) |
Actuarial changes arising from changes in demographic assumptions |
Actuarial changes arising from changes in financial assumptions |
Actuarial changes arising from plan experience |
Total included in OCI |
|||||||||||||||
| Year ended 31 December 2024 |
||||||||||||||||||||
| Pension Plan |
||||||||||||||||||||
| Defined benefit obligation |
- | 119 | (32) | 2 | 89 | |||||||||||||||
| Fair value of plan assets |
(128) | - | - | - | (128) | |||||||||||||||
| Pension benefit plans liability (asset) |
(128) | 119 | (32) | 2 | (39) | |||||||||||||||
| Supplemental Plan |
||||||||||||||||||||
| Defined benefit obligation |
- | 5 | (1) | (1) | 3 | |||||||||||||||
| Other post-employment benefit plans |
||||||||||||||||||||
| Defined benefit obligation |
- | 2 | (6) | (1) | (5) | |||||||||||||||
| (128) | 126 | (39) | - | (41) | ||||||||||||||||
| Year ended 31 December 2023 |
||||||||||||||||||||
| Pension Plan |
||||||||||||||||||||
| Defined benefit obligation |
- | - | 151 | 11 | 162 | |||||||||||||||
| Fair value of plan assets |
(137) | - | - | - | (137) | |||||||||||||||
| Pension benefit plans liability |
(137) | - | 151 | 11 | 25 | |||||||||||||||
| Supplemental Plan |
||||||||||||||||||||
| Defined benefit obligation |
- | - | 6 | 2 | 8 | |||||||||||||||
| Other post-employment benefit plans |
||||||||||||||||||||
| Defined benefit obligation |
- | - | 6 | (1) | 5 | |||||||||||||||
| (137) | - | 163 | 12 | 38 | ||||||||||||||||
The remeasurement of plan assets is the difference between the actual rate of return on the defined benefit pension plan assets and the expected rate of return based on the discount rate used to measure the obligation at the prior year-end. The actual return on plan assets was $236 million (2023 – $250 million).
2024 Annual Report — 132
The following table presents information on the fair value of the plan assets.
| 2024 | 2023 | |||||||||||||||||||||||||||||||
| (in millions) |
Quoted | Unquoted | Total | % | Quoted | Unquoted | Total | % | ||||||||||||||||||||||||
| Cash |
5 | - | 5 | 0.2% | 6 | - | 6 | 0.2% | ||||||||||||||||||||||||
| Short-term investments1 |
- | 93 | 93 | 3.6% | - | 138 | 138 | 5.6% | ||||||||||||||||||||||||
| Bonds and debentures |
||||||||||||||||||||||||||||||||
| Securities issued or guaranteed by the Government of Canada |
137 | 94 | 231 | 8.9% | 121 | 54 | 175 | 7.2% | ||||||||||||||||||||||||
| Provinces/municipalities |
422 | 65 | 487 | 18.8% | 244 | 108 | 352 | 14.4% | ||||||||||||||||||||||||
| Equities |
||||||||||||||||||||||||||||||||
| Canadian equities |
494 | - | 494 | 19.0% | 470 | - | 470 | 19.2% | ||||||||||||||||||||||||
| Foreign equities |
508 | - | 508 | 19.6% | 463 | - | 463 | 19.0% | ||||||||||||||||||||||||
| Emerging market debt |
76 | 48 | 124 | 4.8% | 60 | 44 | 104 | 4.3% | ||||||||||||||||||||||||
| Private debt |
- | 22 | 22 | 0.8% | - | 16 | 16 | 0.7% | ||||||||||||||||||||||||
| Private Equity |
- | 28 | 28 | 1.1% | - | - | - | 0.0% | ||||||||||||||||||||||||
| Infrastructure |
- | 165 | 165 | 6.3% | - | 177 | 177 | 7.2% | ||||||||||||||||||||||||
| Other real assets |
- | 31 | 31 | 1.2% | - | 29 | 29 | 1.2% | ||||||||||||||||||||||||
| Real return securities2 |
309 | 4 | 313 | 12.0% | 43 | 234 | 277 | 11.3% | ||||||||||||||||||||||||
| Real estate, net of mortgages payable |
- | 371 | 371 | 14.3% | - | 376 | 376 | 15.4% | ||||||||||||||||||||||||
| Securities sold under repurchase agreements |
- | (280) | (280) | (10.8%) | - | (139) | (139) | (5.7%) | ||||||||||||||||||||||||
| Other liabilities net of non-investment assets |
- | 4 | 4 | 0.2% | - | (1) | (1) | 0.0% | ||||||||||||||||||||||||
| Total |
1,951 | 645 | 2,596 | 100.0% | 1,407 | 1,036 | 2,443 | 100.0% | ||||||||||||||||||||||||
| 1 | Includes $93 million or 3.6% (2023 – $121 million or 5.0%) of investments made in securities issued or guaranteed by related parties. |
| 2 | Includes $309 million or 11.9% (2023 – $272 million or 11.1%) of investments made in securities issued or guaranteed by related parties. |
2024 Annual Report — 133
Assumptions
The assets and obligations of the defined benefits were measured for accounting purposes as at 31 December with the following assumptions.
| Pension benefit plans | Other post-employment benefit plans |
|||||||||||||||
| 2024 | 2023 | 2024 | 2023 | |||||||||||||
| Defined benefit obligation |
||||||||||||||||
| Discount rate |
4.7% | 4.6% | 4.7% | 4.6% | ||||||||||||
| Rate of compensation increase |
3.3% | 3.3% | 3.3% | 3.3% | ||||||||||||
| Inflation rate1 |
2.0% | |
2.6% trending to 2.0% |
|
2.0% | |
2.6% trending to 2.0% |
| ||||||||
| Benefit costs |
||||||||||||||||
| Discount rate |
4.6% | 5.1% | 4.6% | 5.1% | ||||||||||||
| Rate of compensation increase |
3.3% | 3.3% | 3.3% | 3.3% | ||||||||||||
| Inflation rate2 |
|
2.6% trending to 2.0% |
|
|
3.5% trending to 2.0% |
|
|
2.6% trending to 2.0% |
|
|
3.5% trending to 2.0% |
| ||||
| Assumed medical cost trend |
||||||||||||||||
| Initial medical cost trend rate |
- | - | 4.7% | 4.8% | ||||||||||||
| Medical cost trend rate declines to3 |
- | - | 4.0% | 4.0% | ||||||||||||
| Year that the rate reaches the ultimate trend rate |
- | - | 2040 | 2040 | ||||||||||||
| Life expectancy of plan members at age 65 |
||||||||||||||||
| Male |
|
Defined Benefit plan: 25 years |
|
|
Defined Benefit plan: 24 years |
|
|
25 years
|
|
|
24 years
|
| ||||
| |
Supplemental Plan: 26 years |
|
|
Supplemental Plan: 24 years |
|
|||||||||||
| Female |
|
Defined Benefit plan: 27 years |
|
|
Defined Benefit plan: 25 years |
|
|
27 years
|
|
|
25 years
|
| ||||
| |
Supplemental Plan: 28 years |
|
|
Supplemental Plan: 26 years |
|
|||||||||||
| 1 | 2023 – 2.6% per year for 2024, and 2.0% per year thereafter. |
| 2 | 2.6% per year for 2024, and 2.0% per year thereafter (2023 – 3.5% per year for 2023, 2.3% per year for 2024, and 2.0% per year thereafter). |
| 3 | Average decrease per year of 0.05% (2023 – 0.05%) |
The discount rates are determined by reference to Canadian AA-rated corporate bonds with terms to maturity approximating the duration of the defined benefit obligation. The weighted average duration of the defined pension benefit obligation is 14 years (2023 – 14 years).
The mortality assumptions used are derived from standard tables published by the Canadian Institute of Actuaries (2014 Public Sector Mortality Table, with 2024 improvement scale).
2024 Annual Report — 134
Sensitivity
The following table shows the impact of changes in the assumptions as at 31 December 2024.
| (in millions) |
Increase (decrease) in defined benefit obligation |
Increase (decrease) in net benefit costs recognized in operating expenses in 2025 |
||||||
| 100 bps increase/decrease in discount rate |
(323)/413 | (28)/30 | ||||||
| 50 bps increase/decrease in rate of compensation increase |
25/(23) | 4/(3) | ||||||
| 25 bps increase/decrease in inflation rate |
74/(70) | 5/(5) | ||||||
| 100 bps increase/decrease in health care costs trend rates |
5/(4) | -/- | ||||||
| One year increase in life expectancy of plan members |
66 | 4 | ||||||
The sensitivity analyses are based on a change in one assumption while holding all other assumptions constant. In practice, this is unlikely to occur and changes in some of the assumptions might be correlated. The method and types of assumptions used in preparing the sensitivity analyses have not changed from the previous year.
Cash flows
In 2025, we expect to make contributions to the defined benefit plans of approximately $6 million (2024 – $13 million).
| 25. | Income Taxes |
The following table presents the components of income tax.
| (in millions) |
2024 | 2023 | ||||||
| Current income tax expense |
1,004 | 714 | ||||||
| Deferred income tax relating to origination and reversal of temporary differences |
(502) | (266) | ||||||
| Total income tax expense included in net income |
502 | 448 | ||||||
| Income tax expense (recovery) on other comprehensive income (loss) |
||||||||
| Net unrealized gains (losses) from FVOCI financial instruments |
59 | 119 | ||||||
| Reclassification of prior years’ net unrealized losses realized in the year in net income |
39 | 40 | ||||||
| Insurance finance income (expense) for insurance contracts issued |
(21) | (25) | ||||||
| Remeasurement gains (losses) on defined benefit plans |
5 | (6) | ||||||
| Total income tax expense (recovery) included in other comprehensive income (loss) |
82 | 128 | ||||||
| Total |
584 | 576 | ||||||
The following is a reconciliation of the statutory tax rate to the effective tax rate.
| (in millions) |
2024 | 2023 | ||||||
| Income before income taxes |
1,996 | 1,758 | ||||||
| Statutory tax rate |
25% | 25% | ||||||
| Income taxes computed at statutory tax rate |
499 | 440 | ||||||
| Permanent differences |
3 | 8 | ||||||
| Income tax expense |
502 | 448 | ||||||
| Effective tax rate |
25% | 25% | ||||||
2024 Annual Report — 135
The statutory tax rate of 25% is comprised of the federal income tax rate of 38% less the general rate reduction of 13%.
The following tables present the tax-effected temporary differences which result in deferred income tax assets and liabilities.
| (in millions) |
As at December 31 2023 |
Change through consolidated net income |
Change through consolidated OCI |
Change through consolidated retained earnings |
As at December 31 2024 |
|||||||||||||||
| Deferred income tax assets |
||||||||||||||||||||
| Insurance contract liabilities |
270 | 360 | 1 | - | 631 | |||||||||||||||
| Self insurance |
31 | 37 | - | - | 68 | |||||||||||||||
| Fair value of financial instruments |
(60) | 107 | (29) | - | 18 | |||||||||||||||
| Net realized losses on borrowings |
13 | (4) | - | - | 9 | |||||||||||||||
| Post-employment benefits |
5 | 4 | (5) | - | 4 | |||||||||||||||
| Total deferred income tax assets |
259 | 504 | (33) | - | 730 | |||||||||||||||
| Deferred income tax liabilities |
||||||||||||||||||||
| Additional policy reserve |
(175) | - | - | (10) | (185) | |||||||||||||||
| Fair value of property related investments |
(90) | 3 | - | - | (87) | |||||||||||||||
| Intangible assets |
(28) | (6) | - | - | (34) | |||||||||||||||
| Other |
(2) | 1 | - | - | (1) | |||||||||||||||
| Total deferred income tax liabilities |
(295) | (2) | - | (10) | (307) | |||||||||||||||
| Net deferred income tax assets (liabilities) |
(36) | 502 | (33) | (10) | 423 | |||||||||||||||
| (in millions) |
As at December 31 2022 |
Change through consolidated net income |
Change through Consolidated OCI |
Change through consolidated retained earnings |
As at December 31 2023 |
|||||||||||||||
| Deferred income tax assets |
||||||||||||||||||||
| Insurance contract liabilities |
3 | 267 | - | - | 270 | |||||||||||||||
| Self insurance |
6 | 25 | - | - | 31 | |||||||||||||||
| Net realized losses on borrowings |
18 | (5) | - | - | 13 | |||||||||||||||
| Post-employment benefits |
(6) | 5 | 6 | - | 5 | |||||||||||||||
| Total deferred income tax assets |
21 | 292 | 6 | - | 319 | |||||||||||||||
| Deferred income tax liabilities |
||||||||||||||||||||
| Additional policy reserve |
(173) | - | - | (2) | (175) | |||||||||||||||
| Fair value of property related investments |
(93) | 3 | - | - | (90) | |||||||||||||||
| Fair value of financial instruments |
10 | (34) | (36) | - | (60) | |||||||||||||||
| Intangible assets |
(29) | 1 | - | - | (28) | |||||||||||||||
| Other |
(6) | 4 | - | - | (2) | |||||||||||||||
| Total deferred income tax liabilities |
(291) | (26) | (36) | (2) | (355) | |||||||||||||||
| Net deferred income tax assets (liabilities) |
(270) | 266 | (30) | (2) | (36) | |||||||||||||||
The deferred income tax assets have been recognized in full as it is probable that taxable profit will be available against which the deductible temporary differences can be utilized.
2024 Annual Report — 136
| 26. | Related Party Transactions |
Our related parties include the Government and its departments, agencies and Crown corporations (in terms of common ownership), key management personnel and their close family members and the Pension Plan.
All material related party transactions and outstanding balances not disclosed elsewhere are disclosed in the following sections.
Transactions or balances between the entities that have been eliminated on consolidation are not reported.
Government of Canada and its departments, agencies and Crown corporations
The following tables summarize income earned and receivable, the total amount invested in instruments issued or guaranteed by the Government and government and related party fees.
| (in millions) |
2024 | 2023 | ||||||
| Income earned and receivable |
||||||||
| Investment income – cash equivalents |
29 | 27 | ||||||
| Investment income – investment securities |
312 | 203 | ||||||
| Interest receivable – investment securities1 |
42 | 34 | ||||||
| Government issued |
||||||||
| Cash equivalents |
347 | 686 | ||||||
| Investment securities |
10,790 | 9,363 | ||||||
| Government and Related Party fees |
||||||||
| One-time top-up to the Canada Housing Benefit – Expense2 |
2 | 49 | ||||||
| Mortgage Funding – Expense |
30 | 30 | ||||||
| Mortgage Insurance – Expense3 |
24 | 18 | ||||||
| Mortgage Funding – Payable |
45 | 34 | ||||||
| Mortgage Insurance – Payable |
74 | 55 | ||||||
| 1 | Included in accrued interest receivable. |
| 2 | $1 million remains payable at year end and is included in accounts payable and other liabilities (2023 – $4 million). |
| 3 | These fees will reduce the CSM on initial recognition and are subsequently amortized over the expected coverage period of our insurance contracts with equal offsetting amounts to insurance revenue and insurance service expense in the period. Included in operating expenses are $1 million of Government of Canada fees for self-insured products (2023 – $1 million). |
In the 2023 Fall Economic Statement, the Government of Canada announced its intention to purchase Canada Mortgage Bonds, beginning in 2024, up to an annual maximum of $30 billion while ensuring that the pace and volume of these purchases are appropriate for market conditions. For 2024, the Government of Canada targeted a total purchase amount of 50% of fixed-rate CMB primary issuances. Of the $60 billion CMB primary issuances in 2024, $58 billion was fixed-rate CMB and $2 billion was floating-rate CMB. The Bank of Canada, in its role as the Government of Canada’s fiscal agent, made purchases of $29 billion in 2024 on the government’s behalf. As Crown corporations, CMHC is related to the Bank of Canada through the Government of Canada.
2024 Annual Report — 137
Key management personnel
The following table presents the compensation of key management personnel, defined as those persons having authority and responsibility for planning, directing and controlling our activities. This includes the Board of Directors and members of the Executive Committee.
| 2024 | 2023 | |||||||||||||||||||||||
| (in thousands) |
Board of Directors |
Executive Committee |
Total | Board of Directors |
Executive Committee |
Total | ||||||||||||||||||
| Short-term benefits |
125 | 5,602 | 5,727 | 122 | 4,158 | 4,280 | ||||||||||||||||||
| Post-employment benefits |
- | 689 | 689 | - | 685 | 685 | ||||||||||||||||||
| Total |
125 | 6,291 | 6,416 | 122 | 4,843 | 4,965 | ||||||||||||||||||
27. Commitments and Contingent Liabilities
Letters of credit
We have $93 million in letters of credit outstanding, as at 1 January 2025, which secure benefits accrued up to 31 December 2017 under the Supplemental Plans (2023 - $92 million as at 1 January 2024).
Other financial obligations
Total estimated remaining contractual financial obligations for our significant arrangements are as follows based on minimum commitment:
| (in millions) |
2025 | 2026 | 2027 | 2028 | 2029 | 2030 and thereafter |
||||||||||||||||||
| Housing programs1 |
2,125 | 2,052 | 1,832 | 707 | 453 | 1,476 | ||||||||||||||||||
| Office rental lease commitments |
2 | 2 | 2 | 2 | 2 | 2 | ||||||||||||||||||
| Technology project and run costs |
116 | 48 | 6 | 5 | 3 | - | ||||||||||||||||||
| Total |
2,243 | 2,102 | 1,840 | 714 | 458 | 1,478 | ||||||||||||||||||
| 1 | Total remaining contractual financial obligations for housing programs extended for periods up to 25 years (2023 – 25 years). |
Legal claims
There are legal claims of $1 million (2023 – $4 million) against us. Due to the uncertainty of the outcome of these claims, no provision for loss has been recorded. We do not expect the ultimate resolution of any of the proceedings to which we are party to have a significant adverse effect on our financial position.
| 28. | Operating Expenses |
The following table presents the composition of operating expenses.
| (in millions) |
2024 | 2023 | ||||||
| Personnel costs |
318 | 290 | ||||||
| Professional services |
145 | 139 | ||||||
| Information and technology costs |
132 | 120 | ||||||
| Depreciation, amortization and impairment of property and equipment and intangible assets |
35 | 34 | ||||||
| Amortization of Government of Canada fees |
31 | 31 | ||||||
| Other administrative goods and services |
17 | 27 | ||||||
| Total operating expenses |
678 | 641 | ||||||
2024 Annual Report — 138
29. Current and Non-Current Assets and Liabilities
The following table presents assets and liabilities we expect to recover or settle within 12 months of the balance sheet date.
| 2024 | 2023 | |||||||||||||||||||||||
| (in millions) |
Within 1 year |
After 1 year |
Total | Within 1 year |
After 1 year |
Total | ||||||||||||||||||
| Assets |
||||||||||||||||||||||||
| Cash and cash equivalents |
1,655 | - | 1,655 | 1,939 | - | 1,939 | ||||||||||||||||||
| Securities purchased under resale agreements |
950 | - | 950 | 700 | - | 700 | ||||||||||||||||||
| Accrued interest receivable |
1,117 | - | 1,117 | 843 | - | 843 | ||||||||||||||||||
| Investment securities: |
||||||||||||||||||||||||
| Fair value through profit or loss |
5 | 52 | 57 | - | 69 | 69 | ||||||||||||||||||
| Fair value through other comprehensive income |
5,810 | 17,477 | 23,287 | 4,217 | 15,945 | 20,162 | ||||||||||||||||||
| Amortized cost |
1,972 | 1,597 | 3,569 | 1,147 | 2,082 | 3,229 | ||||||||||||||||||
| Derivatives |
- | - | - | 161 | - | 161 | ||||||||||||||||||
| Due from the Government of Canada |
27 | 150 | 177 | 118 | 122 | 240 | ||||||||||||||||||
| Loans: |
||||||||||||||||||||||||
| Fair value through profit or loss |
37 | 484 | 521 | 41 | 471 | 512 | ||||||||||||||||||
| Amortized cost |
41,644 | 252,884 | 294,528 | 40,578 | 230,072 | 270,650 | ||||||||||||||||||
| Accounts receivable and other assets |
57 | 419 | 476 | 87 | 392 | 479 | ||||||||||||||||||
| Investment property |
- | 396 | 396 | - | 398 | 398 | ||||||||||||||||||
| Defined benefit plans asset |
18 | 181 | 199 | - | 187 | 187 | ||||||||||||||||||
| Deferred income tax assets |
- | 423 | 423 | - | - | - | ||||||||||||||||||
| 53,292 | 274,063 | 327,355 | 49,831 | 249,738 | 299,569 | |||||||||||||||||||
| Liabilities |
||||||||||||||||||||||||
| Accounts payable and other liabilities |
535 | 158 | 693 | 464 | 109 | 573 | ||||||||||||||||||
| Income taxes payable |
229 | - | 229 | 545 | - | 545 | ||||||||||||||||||
| Accrued interest payable |
1,043 | - | 1,043 | 786 | - | 786 | ||||||||||||||||||
| Derivatives |
136 | 69 | 205 | 8 | 47 | 55 | ||||||||||||||||||
| Insurance contract liabilities |
928 | 7,527 | 8,455 | 871 | 6,208 | 7,079 | ||||||||||||||||||
| Borrowings: |
||||||||||||||||||||||||
| Fair value through profit or loss |
128 | 20 | 148 | 77 | 142 | 219 | ||||||||||||||||||
| Amortized cost |
43,968 | 255,357 | 299,325 | 41,648 | 233,109 | 274,757 | ||||||||||||||||||
| Defined benefit plans liability |
8 | 172 | 180 | 9 | 171 | 180 | ||||||||||||||||||
| Unearned premium and fees |
893 | 2,150 | 3,043 | 821 | 1,955 | 2,776 | ||||||||||||||||||
| Deferred income tax liabilities |
- | - | - | - | 36 | 36 | ||||||||||||||||||
| 47,868 | 265,453 | 313,321 | 45,229 | 241,777 | 287,006 | |||||||||||||||||||
| Net |
5,424 | 8,610 | 14,034 | 4,602 | 7,961 | 12,563 | ||||||||||||||||||
2024 Annual Report — 139

|
|
Legislative framework
CMHC is incorporated under the Canada Mortgage and Housing Corporation Act. As such it is accountable to Parliament through the Minister responsible for CMHC, currently the Minister of Housing, Infrastructure, and Communities. Our legislative framework includes the CMHC Act, the National Housing Act, the National Housing Strategy Act and the Financial Administration Act.
Board of Directors
The Board of Directors is responsible for managing our affairs and the conduct of our business in accordance with applicable legislation and the governing bylaws of CMHC. As steward of the company, the Board:
• sets strategic direction in support of government policies and priorities;
• ensures the integrity and adequacy of company policies, information systems and management practices;
• ensures that principal risks are identified and managed; and
• evaluates and monitors the company’s performance and results.
The Board has a duty to:
• protect the short- and long-term interests of the company;
• safeguard CMHC’s assets; and
• be prudent and professional in fulfilling its duties. |
The Board meets a minimum of five times per year and holds an annual public meeting. To understand the diversity of housing needs of people living in Canada, the Board conducts its meetings across Canada, taking the opportunity to meet with community representatives and housing proponents in the region. In 2024, the Board met in Victoria, Ottawa, Saskatoon and Montreal.
The Board undergoes regular assessments to identify opportunities for enhanced Board performance, development and education. The assessment methodology varies between a self-assessment, and one administered by a third party that examines the functioning and performance of the Board compared to the boards of other Crown corporations and financial institutions.
The Board is made up of diverse, experienced and knowledgeable directors with a variety of perspectives and skills to support the achievement of CMHC’s vision, mission and values. Our Board reflects the Government of Canada’s requirements and goals for diversity, equality and inclusion. |
2024 Annual Report — 140

As of 31 December 2024 Don Iveson Chair of the Board of Directors 11 June 2024 – 10 June 2029 Coleen Volk President and Chief Executive Officer effective 24 June 2024 – 23 June 2029 Kelly Gillis (ex-officio) Deputy Minister, Housing, Infrastructure and Communities effective 26 October 2021 – 31 December 2024 Chris Forbes (ex-officio) Deputy Minister, Department of Finance effective 11 September 2023 Gordon Laing Chair, Audit Committee 12 December 2018 – 02 February 2026 André Hébert Chair, Risk and Resilience Committee 27 February 2019 – 27 February 2027 Christopher Sicotte 23 June 2022 – 22 June 2026 Darlene Hyde 11 June 2024 – 10 June 2027 Laurie LeBlanc 11 June 2024 – 10 June 2028 Heather Tremain 11 June 2024 – 10 June 2027 Raymond M. Williams 11 June 2024 – 10 June 2028 1 vacant position 2024 Annual Report 141
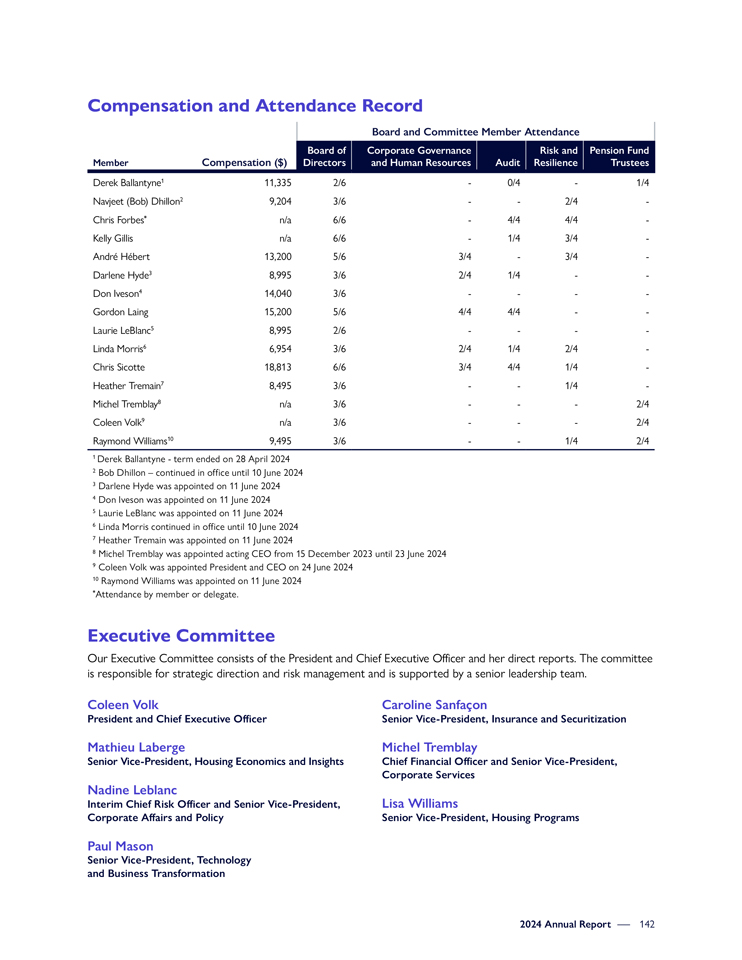
Compensation and Attendance Record Board and Committee Member Attendance Board of Corporate Governance Risk and Pension Fund Member Compensation ($) Directors and Human Resources Audit Resilience Trustees Derek Ballantyne1 11,335 2/6—0/4—1/4 Navjeet (Bob) Dhillon2 9,204 3/6 — 2/4 -Chris Forbes* n/a 6/6—4/4 4/4 -Kelly Gillis n/a 6/6—1/4 3/4 -André Hébert 13,200 5/6 3/4—3/4 -Darlene Hyde3 8,995 3/6 2/4 1/4—-Don Iveson4 14,040 3/6 — —Gordon Laing 15,200 5/6 4/4 4/4 —Laurie LeBlanc5 8,995 2/6 — —Linda Morris6 6,954 3/6 2/4 1/4 2/4 -Chris Sicotte 18,813 6/6 3/4 4/4 1/4 -Heather Tremain7 8,495 3/6 — 1/4 -Michel Tremblay8 n/a 3/6 ——2/4 Coleen Volk9 n/a 3/6 ——2/4 Raymond Williams10 9,495 3/6 — 1/4 2/4 1 Derek Ballantyne—term ended on 28 April 2024 2 Bob Dhillon – continued in office until 10 June 2024 3 Darlene Hyde was appointed on 11 June 2024 4 Don Iveson was appointed on 11 June 2024 5 Laurie LeBlanc was appointed on 11 June 2024 6 Linda Morris continued in office until 10 June 2024 7 Heather Tremain was appointed on 11 June 2024 8 Michel Tremblay was appointed acting CEO from 15 December 2023 until 23 June 2024 9 Coleen Volk was appointed President and CEO on 24 June 2024 10 Raymond Williams was appointed on 11 June 2024 *Attendance by member or delegate. Executive Committee Our Executive Committee consists of the President and Chief Executive Officer and her direct reports. The committee is responsible for strategic direction and risk management and is supported by a senior leadership team. Coleen Volk President and Chief Executive Officer Mathieu Laberge Senior Vice-President, Housing Economics and Insights Nadine Leblanc Interim Chief Risk Officer and Senior Vice-President, Corporate Affairs and Policy Paul Mason Senior Vice-President, Technology and Business Transformation Caroline Sanfaçon Senior Vice-President, Insurance and Securitization Michel Tremblay Chief Financial Officer and Senior Vice-President, Corporate Services Lisa Williams Senior Vice-President, Housing Programs 2024 Annual Report 142
| Management team | Neil Levecque | |
|
Vice-President, Housing Solutions – Multi-Unit | ||
| Luisa Atkinson | ||
|
Vice-President, Housing Operations |
Camille Ringrose | |
|
Deputy Chief Risk Officer | ||
| Caroline Bilodeau | ||
|
Vice-President, People and Culture |
Marie-Anna Murat | |
|
Vice-President, Communications and Marketing | ||
| Mark Chamie | ||
|
Vice-President, Investments and Treasury |
Stéphane Poulin | |
|
Vice-President, Data and Analytics | ||
| André Charbonneau | ||
|
Deputy Chief Financial Officer |
Patricia Roset-Zuppa | |
|
Vice-President, Policy | ||
| Samir Chhelavda | ||
|
Vice-President, Audit and Evaluation |
Carla Staresina | |
|
Vice-President, Commercial Products | ||
| Brett Dietrich | ||
|
Vice-President, Multi-Unit Operations |
Mark Young | |
|
General Counsel | ||
| Amélie Lecompte | ||
|
Chief Information Officer |
2024 Annual Report — 143

On 25 July 2024, the President of the Treasury Board of Canada (TBS) issued guidance to parent Crown Corporations encouraging augmented expenditure disclosures in a manner similar to what is currently disclosed by federal departments and agencies in the Public Accounts of Canada (PA) Vol. III. The Government has encouraged Crown corporations, in instances where it would not be commercially detrimental, to voluntarily disclose expenditure information publicly, preferably in the Annual Report. CMHC has disclosed the information to the extent it is applicable to us. CMHC does not follow the Government of Canada’s chart of accounts, therefore, in some instances, the information provided below is based on CMHC’s closest type of expenditure. The information is provided using a 1 January to 31 December 2024 calendar year the same as our 2024 Annual Report.
Debts, obligations, and claims written off and forgiven
The following presents the number of occurrences we forgave or wrote off as part of our housing program lending activity in 2024.
| Category |
Number of occurrences |
Total amount |
||||||
| Forgiveness1 |
1 | $20,000 | ||||||
| Write-offs2 |
51 | $870,629 | ||||||
|
Waiver3 |
N/A | N/A | ||||||
| 1 | The deletion of a debt that extinguishes the debt and waives the right to reinstate the debt. |
| 2 | An accounting action that reduces the amount of accounts receivable regarding a debt, or a part of a debt, that has been determined to be uncollectible. |
| 3 | Debt deletion involving only the interest and/or administrative charges related to a debt. |
We are not able to provide waiver information in 2024.
2024 Annual Report — 144
Professional and special services
The following presents the total amount of payments in the year for each main classification of services. Amounts reported include payments to CMHC’s related parties.
| Main classification of services |
Total amount spent in 2024 | |||
| Business services |
$117,946,489 | |||
| Informatics services |
$107,471,328 | |||
| Legal services |
$6,252,237 | |||
| Training services |
$2,655,962 | |||
| Other services |
$1,082,792 | |||
| Total |
$235,408,808 | |||
A detailed listing of payments is available below and includes the following:
| • | the total amount spent in the current year; |
| • | the total amount spent for each main classification of services; |
| • | a detailed listing, for each main classification of services, of the payments to an individual or organization aggregating to $100,000 or over. This detail includes the name and location of the payee, together with the total amount paid; |
| • | the total amount and the total number of payees, for each main classification of services, of payments to an individual or organization aggregating to less than $100,000. |
| Vendor name, location and main classification |
Total aggregate payments and amount spent in 2024 | |||
| Intellifi Corporation, Calgary, Alberta |
$63,141,926 | |||
| CMLS Financial Ltd., Toronto, Ontario |
$11,760,629 | |||
| PricewaterhouseCoopers LLP, Ottawa, Ontario |
$8,175,228 | |||
| BGIS Global Integrated Solutions Canada LP, Markham, Ontario |
$6,502,941 | |||
| Canada Revenue Agency, Surrey, British Columbia |
$5,076,565 | |||
| Marsh Canada Limited, Toronto, Ontario |
$2,827,322 | |||
| Allied Universal, Toronto, Ontario |
$2,345,331 | |||
| KPMG LLP, Toronto, Ontario |
$1,677,981 | |||
| LGA Architectural Partners Ltd., Toronto, Ontario |
$1,649,614 | |||
| Traductions Serge Belair Inc, Montréal, Québec |
$1,561,454 | |||
| Evergreen, Toronto, Ontario |
$1,266,346 | |||
| Xerox Canada Limited, Toronto, Ontario |
$1,217,581 | |||
| FNF Canada Company, Mississauga, Ontario |
$1,183,403 | |||
| Ernst & Young LLP, Ottawa, Ontario |
$1,135,825 | |||
| The Right Door Consulting & Solutions Inc., Ottawa, Ontario |
$901,770 | |||
| Nationwide Appraisal Services Inc., Markham, Ontario |
$642,632 | |||
| CSI Consulting Incorporated, Ottawa, Ontario |
$350,472 | |||
| Cofomo, Ottawa, Ontario |
$335,748 | |||
| Mercer (Canada) Limited, Toronto, Ontario |
$316,971 | |||
| Deloitte LLP, Ottawa, Ontario |
$314,517 | |||
| (Continued) | ||||
2024 Annual Report — 145
| Vendor name, location and main classification |
Total aggregate payments and amount spent in 2024 | |||
| Aon Hewitt Incorporated, Toronto, Ontario |
$282,463 | |||
| SI Systems Partnership, Calgary, Alberta |
$230,231 | |||
| Maplesoft Consulting Inc., Ottawa, Ontario |
$208,322 | |||
| Merit Outsourcing Advisors Incorporated, Bracebridge, Ontario |
$192,100 | |||
| RSM Canada Consulting LP, Toronto, Ontario |
$169,025 | |||
| DIVISION 13 SERVICES CONSEILS INC., Montréal, Québec |
$159,102 | |||
| Quarry Consulting Inc., Ottawa, Ontario |
$154,304 | |||
| Goss Gilroy Incorporated, Ottawa, Ontario |
$152,009 | |||
| Sabytel Technologies Inc., Ottawa, Ontario |
$149,499 | |||
| Mindwire, Ottawa, Ontario |
$142,346 | |||
| R.A. Malatest and Associates Limited, Victoria, British Columbia |
$138,969 | |||
| Hill+Knowlton Strategies, Ottawa, Ontario |
$129,337 | |||
| Altis Recruitment & Technology Inc., Ottawa, Ontario |
$126,079 | |||
| Willis Towers Watson, Montréal, Québec |
$114,364 | |||
| RBC Investor and Treasury Services, Montréal, Québec |
$113,594 | |||
| Randstad Canada, Saint-Laurent, Québec |
$111,458 | |||
| GB Travel Canada Company, Toronto, Ontario |
$108,745 | |||
| Strength Tek Fitness and Wellness Consultants, Ottawa, Ontario |
$103,611 | |||
| Kelly Sears Consulting Group Incorporated, Ottawa, Ontario |
$101,850 | |||
| DPRA Canada Inc, Toronto, Ontario |
$101,425 | |||
| Leger Marketing Inc., Montréal, Québec |
$100,909 | |||
| Payments under $100,000 (231 payees) |
$2,472,491 | |||
| Total business services |
$117,946,489 | |||
| Accenture Incorporated, Mississauga, Ontario |
$68,286,892 | |||
| Microsoft Canada Inc., Toronto, Ontario |
$8,097,394 | |||
| Informatica LLC, Toronto, Ontario |
$5,712,158 | |||
| Shared Services Canada, Gatineau, Québec |
$3,753,047 | |||
| Data Century Inc., Toronto, Ontario |
$2,344,242 | |||
| Tagetik North America, New York, New York |
$1,785,707 | |||
| Optiv Canada Federal, Mississauga, Ontario |
$1,523,157 | |||
| Maplesoft Consulting Inc., Ottawa, Ontario |
$1,398,241 | |||
| I4C Consulting Incorporated, Kanata, Ontario |
$1,001,404 | |||
| Iron Mountain Canada Corporation, Gloucester, Ontario |
$819,133 | |||
| SAS Institute (Canada) Incorporated, Toronto, Ontario |
$807,618 | |||
| SAP Canada Incorporated, Toronto, Ontario |
$735,407 | |||
| Wall Street Systems Sweden AB, Stockholm, |
$728,439 | |||
| Techcom Software Solutions Incorporated, Vaughan, Ontario |
$637,975 | |||
| Gartner Canada Company, Toronto, Ontario |
$625,738 | |||
| SiteCore Canada Ltd., Toronto, Ontario |
$589,108 | |||
| SkySparc AB, Stockholm, Sweden |
$561,728 | |||
| (Continued) | ||||
2024 Annual Report — 146
| Vendor name, location and main classification |
Total aggregate payments and amount spent in 2024 | |||
| Eclipsys Solutions Inc., Ottawa, Ontario |
$495,831 | |||
| ESRI Canada Limited, Toronto, Ontario |
$478,308 | |||
| Data Sentinel Inc., Oakville, Ontario |
$463,763 | |||
| Record Point Software USA LLC, Bellevue, Washington |
$416,405 | |||
| PHOS Service dba CDAO Services, St-Lambert, Québec |
$400,416 | |||
| MNP Digital Inc., Ottawa, Ontario |
$311,358 | |||
| IBM Canada Limited, Toronto, Ontario |
$304,461 | |||
| DMTI Spatial Incorporated, Richmond Hill, Ontario |
$298,320 | |||
| S&P Global Market Intelligence, New York, New York |
$278,651 | |||
| Akkodis Canada Inc., Toronto, Ontario |
$270,338 | |||
| Oxford Economics USA Inc., New York, New York |
$268,130 | |||
| Softchoice Corporation, Toronto, Ontario |
$252,183 | |||
| SHI International Corp, Toronto, Ontario |
$238,327 | |||
| Carahsoft Technology Corp., Reston, Virginia |
$185,400 | |||
| Xerox Canada Limited, Toronto, Ontario |
$175,043 | |||
| Professional Quality Assurance Ltd, Fredericton, New Brunswick |
$169,579 | |||
| Yardi Canada Ltd, Santa Barbara, California |
$162,248 | |||
| Tato Recruiting Inc., Ottawa, Ontario |
$157,963 | |||
| Orangutech Inc., Ottawa, Ontario |
$156,347 | |||
| Diligent Board Member Services Incorporated, New York, New York |
$146,315 | |||
| Crimson Hexagon Ltd., Boston, Massachusetts |
$133,138 | |||
| Coveo Solutions Incorporated, Québec, Québec |
$128,356 | |||
| Digicert Ireland Limited, Dublin, Ireland |
$111,297 | |||
| Sandhill Consultants Canada Limited, Ottawa, Ontario |
$107,977 | |||
| Payments under $100,000 (65 payees) |
$1,953,786 | |||
| Total informatics services |
$107,471,328 | |||
| Norton Rose Fulbright Canada LLP, Calgary, AB |
$3,513,634 | |||
| Fasken Martineau DuMoulin LLP, Toronto, Ontario |
$1,047,853 | |||
| Borden Ladner Gervais LLP (BLG), Ottawa, Ontario |
$647,662 | |||
| Nelligan O’Brien Payne LLP, Ottawa, Ontario |
$217,742 | |||
| Lapointe Rosenstein Marchand Melançon S.E.N.C.R.L., Montréal, Québec |
$147,513 | |||
| Gowling WLG (Canada) S.E.N.C.R.L. s.r.l, Ottawa, Ontario |
$123,404 | |||
| MORENCY, SOCIÉTÉ D’AVOCATS S.E.N.C.R.L, Québec, Québec |
$109,225 | |||
| Payments under $100,000 (24 payees) |
$445,204 | |||
| Total legal services |
$6,252,237 | |||
| AFSL Pro Inc., Montreal, QC |
$857,207 | |||
| Korn Ferry Hay Group Ltd., Toronto, Ontario |
$180,348 | |||
| Canadian Management Centre, Toronto, Ontario |
$145,174 | |||
| Groupe Edgenda Inc., Montréal, Québec |
$132,035 | |||
| Calian Ltd., Ottawa, Ontario |
$108,017 | |||
| (Continued) | ||||
2024 Annual Report — 147
| Vendor name, location and main classification |
Total aggregate payments and amount spent in 2024 | |||
| Sher & Associates II Incorporated, North York, Ontario |
$101,684 | |||
| Payments under $100,000 (84 payees) |
$1,131,497 | |||
| Total training services |
$2,655,962 | |||
| Other payments under $100,000 (91 payees) |
$1,082,792 | |||
| Total other services |
$1,082,792 | |||
| Grand Total |
$235,408,808 | |||
Acquisition of land and buildings
The following presents the total amount spent for each main category listed below.
| Main category |
Total amount spent in 2024 | |||
| Acquisition of land |
- | |||
| Acquisition of non-residential buildings |
$5,087,501 | |||
| Acquisition of residential buildings |
- | |||
| Total |
$5,087,501 | |||
The above excludes any acquisitions of land and residential buildings through default management activities in cases of borrower default within our Mortgage Insurance activities.
A listing of contracts related to these main categories is available below and includes the following:
| • | a listing of contracts for each main category above over $250,000 including the name and location of the contractor, a brief description and location of the project, the total amount contracted, the total amount spent in the current year for the main category and the total amount spent to date. |
| Name and location of contractor |
Brief description and province of project |
|
Total amount contracted |
|
|
Total amount spent in 2024 |
|
|
Total amount spent to date |
| ||||
| BGIS Global Integrated Solutions |
Various National office building | $13,904,158 | $3,490,723 | $10,985,186 | ||||||||||
| Canada LP, Ottawa, Ontario |
projects, Ottawa, Ontario | |||||||||||||
| Plaza 1000 Ltd, |
Calgary office fit-up, | $700,828 | $4,816 | $664,774 | ||||||||||
| Calgary, Alberta |
Calgary, Alberta | |||||||||||||
| Complexe 1100 RLO S.E.C., |
Montreal office fit-up, | $1,624,345 | $316,081 | $1,567,720 | ||||||||||
| Montreal, Québec |
Montreal, Québec | |||||||||||||
| GWL Realty Advisors, |
Halifax office fit-up, | $1,532,156 | $1,275,881 | $1,285,167 | ||||||||||
| Halifax, Nova Scotia |
Halifax, Nova Scotia | |||||||||||||
| Total |
$17,761,487 | $5,087,501 | $14,502,847 | |||||||||||
2024 Annual Report — 148
Acquisition of machinery and equipment
The following presents the total amount spent in the year for each main category of machinery and equipment
| Main category |
Total amount spent in 2024 | |||
| Computer-related equipment and software |
$45,770,271 | |||
| Furniture and fixtures |
$743,313 | |||
| Total |
$46,513,584 | |||
Transfer payments
We do not have any payments that meet the definition of transfer payments.
Public debt charges
| Unmatured debt |
Principal outstanding | Weighted average interest rate | Interest charged | |||||||||
| Canada mortgage bonds |
$276,500,000,000 | 2.82% | $7,024,770,022 | |||||||||
We have provided summarized information above for the year ended 31 December 2024. For a complete listing of all Canada mortgage bond (CMB) issuances still outstanding and the applicable interest rate please refer to this link: CMB issuances26. This page is updated as new CMBs are issued or mature throughout the year.
Payments of claims against the Crown and court awards
|
Category |
Number of payments | Total amount | ||||||
| Payment of claims and court awards over $1,000 |
2 | $50,000 | ||||||
| Payment of claims and court awards under $1,000 |
- | - | ||||||
We have withheld the recipient names, the nature of the claims and any court awards from the above due to their sensitivity.
26 https://www.cmhc-schl.gc.ca/professionals/project-funding-and-mortgage-financing/securitization/canada-mortgage-bonds/list-of-outstanding-cht-debt-issues
2024 Annual Report — 149

Arrears rate: The ratio (expressed as a percentage) of all loans that are typically more than 90 days past due to the number of outstanding insured loans.
Borrower defaults: Defaults from the mortgage insurance business occur when a borrower has missed the equivalent of at least one payment as at the reporting date.
Capital available to capital required: Under the mortgage funding activity, the ratio (expressed as a percentage) of capital available to capital required, where capital required is calculated by applying risk factors to asset and liability exposures using a framework developed in accordance with both regulatory and economic capital principles.
Capital available to minimum capital required: Under the Mortgage Insurance activity, the ratio (expressed as a percentage) of capital available to minimum capital required, where capital available is calculated as total equity adjusted for assets with a capital requirement of 100% and minimum capital required is calculated by applying risk factors to investment asset and liability exposures in accordance with guidelines established by the Office of the Superintendent of Financial Institutions.
Combined ratio: This ratio is the combination of the insurance service expense ratio and the operating expense ratio.
Contractual Service Margin (CSM): Represents the expected future profit of our insurance contract liabilities.
Guarantees-in-force: The total guarantees related to the timely payment of principal and interest of National Housing Act Mortgage-Backed Securities for investors in securities issued by approved issuers on the basis of housing loans through the National Housing Act Mortgage-Backed Securities program and the Canada Mortgage Bonds issued by the Canada Housing Trust.
Initial CSM ratio: Represents the estimated embedded profit of premiums received on insurance contracts in the period.
Insurance service expense ratio: Replacing the loss ratio, this metric measures the ratio between insurance service expense over insurance revenues.
Insurance-in-force: The total amount of outstanding loan balances covered by mortgage insurance policies at a specific period in time.
Main estimates: The main estimates present the government’s spending plans for each federal organization and provide items that will be included in an appropriation bill.
Minimum Capital Test (MCT): The minimum capital required, calculated by applying risk factors to the Mortgage Insurance activity’s assets and liabilities using a defined methodology prescribed by the Office of the Superintendent of Financial Institutions.
Mortgage Insurance Capital Adequacy Test (MICAT): The minimum capital required, calculated by applying a risk-based formula defined in the Office of the Superintendent of Financial Institutions Capital Adequacy Requirements Guideline for Canadian mortgage insurance companies.
Non-IFRS financial measures: We use a number of financial measures to assess our performance. Some are not calculated in accordance with International Financial Reporting Standards (IFRS), are not defined by IFRS and do not have standardized meaning that would ensure consistency and comparability with other institutions.
2024 Annual Report — 150
Operating budget ratio: The ratio (expressed as a percentage) of operating budget expenses for all of CMHC’s activities (excluding Canada Housing Trust) during the period to premiums, fees, guarantee and application fees received, net interest income from lending programs and normalized government funding.
Operating expense ratio – mortgage insurance activity: The ratio (expressed as a percentage) of operating expenses during the period to insurance revenue during the period for the mortgage insurance activity.
Operating expense ratio – mortgage funding activity: The ratio (expressed as a percentage) of operating expenses during the period, exclusive of those related to the administration of the covered bond legal framework, to guarantee fees earned during the period.
Return on equity: The annualized net income divided by the average of the beginning and ending equity for the period, used to highlight operating performance.
Return on required equity: The annualized net income, adjusted to remove investment income earned on capital in excess of capital required, divided by the average required capital for the period.
Severity ratio: The ratio (expressed as a percentage) of insurance claims to the original insured loan amount for the claims paid in the period.
Other glossary terms
Affordability/affordable housing: In Canada, housing is generally considered affordable if it costs less than 30% of a household’s before-tax income. Affordable housing can include housing provided by the private, public and non-profit sectors. It also includes all forms of housing tenure: rental, ownership and co-operative ownership, as well as temporary and permanent housing.
Approved issuer: A business organization that, having met the criteria established by CMHC, is approved to issue and administer guaranteed National Housing Act Mortgage-Backed Securities.
Approved lender: A lending institution designated as an approved lender by CMHC under the National Housing Act. Only approved lenders may qualify for CMHC loan insurance.
Canada Housing Trust: The Canada Housing Trust is a special-purpose trust that acquires interests in eligible insured housing loans, such as National Housing Act Mortgage-Backed Securities, and issues Canada Mortgage Bonds. The Canada Housing Trust also purchases highly rated investments and undertakes certain related financial hedging activities. We consolidate the accounts of Canada Housing Trust with our mortgage funding activity. Canada Housing Trust’s assets and liabilities are neither owned by nor held for our benefit. The beneficiaries of the trust, after payment of all obligations, are one or more charitable organizations.
Committed: Committed in this context refers to funding earmarked to support the building or repair of units of whose formal project agreement is still subject to final approvals and conditions, as well as funding for which a formal loan agreement is duly executed and a binding agreement is reached to provide credit under pre-specified terms and conditions.
Core housing need: A household is said to be in core housing need if its housing falls below at least one of the adequacy, affordability or suitability standards and it would have to spend 30% or more of its total before-tax income to pay the median rent of alternative local housing that meets all three housing standards:
| 1. | Adequate housing is reported by their residents as not requiring any major repairs. |
| 2. | Affordable housing has shelter costs equal to less than 30% of total before-tax household income. |
| 3. | Suitable housing has enough bedrooms for the size and composition of its residents, according to National Occupancy Standard (NOS) requirements. |
2024 Annual Report — 151
Financial commitment: Achieved once a formal loan agreement is duly executed and a binding agreement to provide credit under pre-specified terms and conditions is reached.
Forgivable loan: A loan granted by a government or an organization, which the lender agrees to forgive if certain conditions are met by the borrower.
Home retrofits for energy efficiency: When you do an energy-efficiency retrofit on your building, you upgrade its energy-consuming systems. Retrofitting may involve improving or replacing lighting fixtures, ventilation systems or windows and doors, or adding insulation where it makes economic sense. It also means including energy efficiency measures in all your renovation and repair activities.
Housing programs expenses: All activities funded by the government under Assisted Housing and Market Analysis and Research activities.
Lending programs: Under the National Housing Act, and in support of Canada’s National Housing Strategy, we provide loans and contributions to federally subsidized social housing sponsors, First Nations, provinces, territories and municipalities. We also provide non-subsidized housing support loans. Our loan portfolio is comprised of a mix of renewable and non-renewable loans which may be on or off-reserve. Direct Lending is the current borrowing initiative we use to refinance our renewable loans as well as to finance new commitments on-reserve. These loans can be financed at lower interest rates due to our status as a federal Crown corporation. As such, we are able to lower the cost of government assistance required for social housing projects. Direct Lending is operated on a planned break-even basis.
Lived experience: The experience and knowledge gained through direct, first-hand involvement in everyday situations, events and interactions as a result of personally experiencing housing need or homelessness.
Physical risk: Effect of uncertainties related to severe and frequent extreme weather events, as well as chronic changes to the environment due to climate change (e.g., temperature increase, sea level rise), on the achievement of our strategic results.
Rural area: Refers to all land lying outside population centres and the people living within those areas.
Transition risk: Effect of uncertainties associated with efforts to move to a low-carbon economy, including changes to current or future government policies, technological innovations and/or consumer and investor preferences and their impacts on the achievement of our strategic results.
United Nations Declaration on the Rights of Indigenous Peoples (UNDRIP): UNDRIP is a comprehensive statement addressing the human rights of Indigenous peoples. It emphasizes the rights of Indigenous peoples to live in dignity, to maintain and strengthen their own institutions, cultures and traditions, and to pursue their self-determined development, in keeping with their own needs and aspirations.
Vulnerable: People belonging, or perceived to belong, to groups that are in a disadvantaged position or marginalized are often referred to as groups that are made vulnerable. In the case of the National Housing Strategy, priority groups currently defined as vulnerable include survivors (especially women and children) fleeing domestic violence, seniors, Indigenous peoples, people with disabilities, those dealing with mental health and addiction issues, veterans, 2SLGBTQIA+, racialized groups, newcomers (including refugees), individuals and families experiencing homelessness, and young adults.
2024 Annual Report — 152

| (in millions, unless otherwise indicated) |
2024 | 2023 | 2022 (restated)1 | 2021 | 2020 | |||||||||||||||
| Consolidated Results |
||||||||||||||||||||
| Total assets |
327,355 | 299,569 | 297,168 | 300,357 | 300,970 | |||||||||||||||
| Total liabilities |
313,321 | 287,006 | 285,207 | 287,147 | 284,395 | |||||||||||||||
| Total equity of Canada |
14,034 | 12,563 | 11,961 | 13,210 | 16,575 | |||||||||||||||
| Total revenues and government funding2 |
6,916 | 7,505 | 5,587 | 6,296 | 7,951 | |||||||||||||||
| Total expenses (including income taxes)3 |
5,422 | 6,195 | 4,147 | 4,372 | 6,289 | |||||||||||||||
| Net income |
1,494 | 1,310 | 1,440 | 1,924 | 1,662 | |||||||||||||||
| Operating budget ratio |
9.8% | 9.1% | 11.6% | 9.6% | 9.6% | |||||||||||||||
| Housing Programs |
||||||||||||||||||||
| Government funding |
4,606 | 5,494 | 3,408 | 3,668 | 4,892 | |||||||||||||||
| Net income (loss) |
(18) | (20) | 140 | 91 | 68 | |||||||||||||||
| Total equity of Canada |
817 | 814 | 846 | 569 | 332 | |||||||||||||||
| Mortgage Insurance |
||||||||||||||||||||
| Insurance-in-force ($B)4 |
440 | 414 | 399 | 401 | 431 | |||||||||||||||
| Total insured volumes |
85,160 | 66,472 | 62,437 | 53,911 | 76,845 | |||||||||||||||
| Premiums and fees received |
2,289 | 1,557 | 1,675 | 1,802 | 2,009 | |||||||||||||||
| Premiums and fees earned |
38 | 33 | 23 | 1,399 | 1,372 | |||||||||||||||
| Insurance revenue |
1,087 | 1,004 | 867 | - | - | |||||||||||||||
| Claims paid |
45 | 52 | 64 | 139 | 140 | |||||||||||||||
| Insurance claims expense |
- | - | - | (317) | 472 | |||||||||||||||
| Insurance service expense |
137 | 119 | (106) | - | - | |||||||||||||||
| Net income |
793 | 676 | 727 | 1,285 | 1,062 | |||||||||||||||
| Arrears rate |
0.30% | 0.29% | 0.25% | 0.28% | 0.34% | |||||||||||||||
| Loss ratio |
- | - | - | (22.7)% | 34.4% | |||||||||||||||
| Insurance service expense ratio |
12.6% | 11.9% | (12.2)% | - | - | |||||||||||||||
| Operating expense ratio |
18.0% | 17.1% | 20.4% | 23.2% | 22.7% | |||||||||||||||
| Combined ratio |
30.6% | 29.0% | 8.2% | 0.5% | 57.1% | |||||||||||||||
| Initial contractual service margin ratio5 |
62.8% | 65.1% | 71.2% | - | - | |||||||||||||||
| Severity ratio |
27.9% | 29.8% | 29.6% | 31.7% | 30.5% | |||||||||||||||
| Return on equity |
7.4% | 6.7% | 6.9% | 10.3% | 8.4% | |||||||||||||||
| Return on required equity |
8.2% | 7.3% | 8.1% | 14.8% | 10.5% | |||||||||||||||
| Capital available to minimum capital required (% MICAT) |
188% | 185% | 175% | 213% | 234% | |||||||||||||||
| % Estimated outstanding Canadian residential mortgages with CMHC insurance coverage ($) |
19.8% | 19.3% | 19.2% | 24.1% | 26.2% | |||||||||||||||
| Mortgage Funding |
||||||||||||||||||||
| Guarantees-in-force ($B)4 |
553 | 508 | 471 | 461 | 489 | |||||||||||||||
| Securities guaranteed ($B) |
224 | 196 | 187 | 184 | 225 | |||||||||||||||
| Guarantee and application fees received |
1,063 | 935 | 962 | 1,008 | 904 | |||||||||||||||
| Guarantee and application fees earned |
901 | 827 | 756 | 716 | 667 | |||||||||||||||
| Net income |
715 | 645 | 556 | 545 | 530 | |||||||||||||||
| Operating expense ratio |
5.9% | 6.7% | 7.5% | 8.2% | 8.3% | |||||||||||||||
| Return on equity |
42.1% | 46.3% | 39.0% | 24.6% | 20.4% | |||||||||||||||
| Economic capital available to economic capital required6 |
127% | 109% | 149% | 136% | 176% | |||||||||||||||
| % Estimated outstanding Canadian residential mortgages with CMHC securitization guarantee ($) |
24.9% | 23.8% | 22.9% | 24.1% | 29.5% | |||||||||||||||
| 1 | Figures have been restated to reflect the adoption of IFRS 17 effective 1 January 2022. |
| 2 | For 2022, 2023 and 2024, includes net interest income, insurance service result, net financial result, government funding, premiums and fees earned, and other income, to reflect the presentation under IFRS 17. |
| 3 | For 2022, 2023 and 2024, includes housing programs expenses, operating expenses, self-insurance service income, and income taxes, to reflect the presentation under IFRS 17. |
| 4 | Our total exposure is less than the sum of these figures as we insure a portion of the loans included in guarantees-in-force. |
| 5 | The Initial contractual service margin ratio has been updated from previously published reports, resulting in an increase of 2.2% in 2022 and 7.7% in 2023. |
| 6 | In 2023, the capital required in the Mortgage Funding ratio was updated to consider the minimum liquidity target. |
2024 Annual Report — 153

CMHC.ca Canada CMHC SCHL