Pay vs Performance Disclosure - USD ($)
Mar. 31, 2025
Mar. 31, 2024
Mar. 31, 2023
Mar. 31, 2022
Mar. 31, 2021
Mar. 31, 2020
Pay Versus Performance Table
The following table sets forth information concerning the compensation of our NEOs for each of the fiscal years ended March 31, 2021, 2022, 2023, 2024 and 2025, and our financial performance for each such fiscal year:
Value of Initial Fixed $100 Investment Based on: |
||||||||||||||||||||||||||||||||
| Fiscal Year (a)(1) |
Summary Compensation Table Total for PEO (b)(2) |
Compensation Actually Paid to PEO (c)(3) |
Average Summary Compensation Table Total for Non-PEO NEOs (d)(2) |
Average Compensation Actually Paid to Non-PEO NEOs (e)(4) |
Total Stockholder Return (f)(5) |
Peer Group Total Stockholder Return (g)(6) |
Net Income ($M) (h)(7) |
Revenues ($M) (i)(8) |
||||||||||||||||||||||||
| 2024 |
$ | 6,015,053 | $ | 7,583,808 | $ | 2,896,750 | $ | 3,603,891 | $ | 331.02 | $ | 256.20 | $ | 6,033 | $ | 222,818 | ||||||||||||||||
| 2023 |
$ | 3,297,209 | $ | 7,724,540 | $ | 1,547,692 | $ | 3,489,796 | $ | 235.40 | $ | 223.64 | ($ | 11,111 | ) | $ | 145,639 | |||||||||||||||
| 2022 |
$ | 1,941,776 | $ | 1,058,766 | $ | 991,545 | $ | 684,643 | $ | 75.00 | $ | 183.07 | ($ | 35,041 | ) | $ | 105,984 | |||||||||||||||
| 2021 |
$ | 1,926,058 | ($ | 1,917,216 | ) | $ | 900,796 | ($ | 715,679 | ) | $ | 162.41 | $ | 187.81 | ($ | 19,193 | ) | $ | 108,435 | |||||||||||||
| 2020 |
$ | 2,945,308 | $ | 8,014,215 | $ | 1,361,233 | $ | 3,922,615 | $ | 351.82 | $ | 175.83 | ($ | 22,678 | ) | $ | 87,125 | |||||||||||||||
| (1) | Daniel P. McGahn non-PEO NEO for the entirety of fiscal 2024, fiscal 2023, fiscal 2022, fiscal 2021 and fiscal 2020. |
| (2) | Amounts reported in these columns represent (i) the “Total” compensation reported in the Summary Compensation Table for the applicable fiscal year in the case of our PEO, Mr. McGahn, and (ii) the “Total” compensation reported in the Summary Compensation Table for the applicable fiscal year for our non-PEO NEO, Mr. Kosiba. |
| (3) | This figure represents compensation actually paid for our CEO, Mr. McGahn. Compensation actually paid is determined under SEC rules and represents an amount derived from the starting point of the “Total” compensation reported in the Summary Compensation Table for the applicable fiscal year, as adjusted under the methodology prescribed under the relevant rules as shown in the adjustment table below. The amounts shown do not reflect the value of vested compensation actually received by Mr. McGahn during the applicable fiscal year. |
Fiscal 2020 |
Fiscal 2021 |
Fiscal 2022 |
Fiscal 2023 |
Fiscal 2024 |
||||||||||||||||
| Summary Compensation Table Total |
$ | 2,945,308 | $ | 1,926,058 | $ | 1,941,776 | $ | 3,297,209 | $ | 6,015,053 | ||||||||||
| Subtract Grant Date Fair Value of Option Awards and Stock Awards Granted in Fiscal Year |
($ | 1,627,500 | ) | ($ | 1,107,000 | ) | ($ | 1,130,000 | ) | ($ | 1,697,500 | ) | ($ | 4,248,000 | ) | |||||
| Add Fair Value at Fiscal Year-End of Outstanding and Unvested Option Awards and Stock Awards Granted in Fiscal Year |
$ | 4,740,000 | $ | 570,750 | $ | 1,227,500 | $ | 3,377,500 | $ | 3,265,200 | ||||||||||
| Adjust for Change in Fair Value of Outstanding and Unvested Option Awards and Stock Awards Granted in Prior Fiscal Years |
$ | 1,915,279 | ($ | 3,650,920 | ) | ($ | 283,500 | ) | $ | 2,333,756 | $ | 1,852,005 | ||||||||
| Adjust for Fair Value at Vesting of Option Awards and Stock Awards Granted in Fiscal Year That Vested During Fiscal Year |
$ | 0 | $ | 452,538 | $ | 0 | $ | 0 | $ | 0 | ||||||||||
| Adjust for Change in Fair Value as of Vesting Date of Option Awards and Stock Awards Granted in Prior Fiscal Years For Which Applicable Vesting Conditions Were Satisfied During Fiscal Year |
$ | 41,128 | ($ | 108,641 | ) | ($ | 697,010 | ) | $ | 413,575 | $ | 699,550 | ||||||||
| |
|
|
|
|
|
|
|
|
|
|||||||||||
| Compensation Actually Paid |
$ |
8,014,215 |
($ |
1,917,216 |
) |
$ |
1,058,766 |
$ |
7,724,540 |
$ |
7,583,808 |
|||||||||
| |
|
|
|
|
|
|
|
|
|
|||||||||||
| (4) | This figure is the compensation actually paid for our non-PEO NEO, Mr. Kosiba. Compensation actually paid is determined under SEC rules and represents an amount derived from the starting point of the “Total” compensation reported in the Summary Compensation Table for the applicable fiscal year, as adjusted under the methodology prescribed under the SEC’s rules as shown in the table below. The amounts shown do not reflect the value of vested compensation actually received by Mr. Kosiba during the applicable fiscal year. |
Fiscal 2020 |
Fiscal 2021 |
Fiscal 2022 |
Fiscal 2023 |
Fiscal 2024 |
||||||||||||||||
| Summary Compensation Table Total |
$ | 1,361,233 | $ | 900,796 | $ | 991,545 | $ | 1,547,692 | $ | 2,896,750 | ||||||||||
| Subtract Grant Date Fair Value of Option Awards and Stock Awards Granted in Fiscal Year |
($ | 759,502 | ) | ($ | 442,800 | ) | ($ | 510,000 | ) | ($ | 712,950 | ) | ($ | 1,985,400 | ) | |||||
| Add Fair Value at Fiscal Year-End of Outstanding and Unvested Option Awards and Stock Awards Granted in Fiscal Year |
$ | 2,212,006 | $ | 228,300 | $ | 613,750 | $ | 1,418,550 | $ | 1,632,600 | ||||||||||
| Adjust for Change in Fair Value of Outstanding and Unvested Option Awards and Stock Awards Granted in Prior Fiscal Years |
$ | 920,010 | ($ | 1,492,514 | ) | ($ | 142,198 | ) | $ | 1,048,168 | $ | 768,580 | ||||||||
| Adjust for Fair Value at Vesting of Option Awards and Stock Awards Granted in Fiscal Year That Vested During Fiscal Year |
$ | 0 | $ | 151,557 | $ | 0 | $ | 0 | $ | 0 | ||||||||||
| Adjust for Change in Fair Value as of Vesting Date of Option Awards and Stock Awards Granted in Prior Fiscal Years For Which Applicable Vesting Conditions Were Satisfied During Fiscal Year |
$ | 188,867 | ($ | 61,018 | ) | ($ | 268,454 | ) | $ | 188,336 | $ | 291,361 | ||||||||
| |
|
|
|
|
|
|
|
|
|
|||||||||||
| Compensation Actually Paid |
$ |
3,922,615 |
($ |
715,679 |
) |
$ |
684,643 |
$ |
3,489,796 |
$ |
3,603,891 |
|||||||||
| |
|
|
|
|
|
|
|
|
|
|||||||||||
| (5) | Total Stockholder Return (TSR) is cumulative for the measurement periods beginning on March 31, 2020 and ending on March 31 of each of 2025, 2024, 2023, 2022 and 2021, respectively, calculated in accordance with Item 201(e) of Regulation S-K. |
| (6) | The peer group used is the Nasdaq Electronic Component and Equipment Index (the “Peer Group”), as used by our company for purposes of compliance with Item 201(e) of Regulation S-K. |
| (7) | The dollar amounts reported are our company’s net loss reflected in our company’s audited financial statements. |
| (8) | In our company’s assessment, revenue is the financial performance measure that is the most important financial performance measure used by the company in fiscal 2024 to link compensation actually paid to performance. |
| (2) | Amounts reported in these columns represent (i) the “Total” compensation reported in the Summary Compensation Table for the applicable fiscal year in the case of our PEO, Mr. McGahn, and (ii) the “Total” compensation reported in the Summary Compensation Table for the applicable fiscal year for our non-PEO NEO, Mr. Kosiba. |
S-K.
| (3) | This figure represents compensation actually paid for our CEO, Mr. McGahn. Compensation actually paid is determined under SEC rules and represents an amount derived from the starting point of the “Total” compensation reported in the Summary Compensation Table for the applicable fiscal year, as adjusted under the methodology prescribed under the relevant rules as shown in the adjustment table below. The amounts shown do not reflect the value of vested compensation actually received by Mr. McGahn during the applicable fiscal year. |
Fiscal 2020 |
Fiscal 2021 |
Fiscal 2022 |
Fiscal 2023 |
Fiscal 2024 |
||||||||||||||||
| Summary Compensation Table Total |
$ | 2,945,308 | $ | 1,926,058 | $ | 1,941,776 | $ | 3,297,209 | $ | 6,015,053 | ||||||||||
| Subtract Grant Date Fair Value of Option Awards and Stock Awards Granted in Fiscal Year |
($ | 1,627,500 | ) | ($ | 1,107,000 | ) | ($ | 1,130,000 | ) | ($ | 1,697,500 | ) | ($ | 4,248,000 | ) | |||||
| Add Fair Value at Fiscal Year-End of Outstanding and Unvested Option Awards and Stock Awards Granted in Fiscal Year |
$ | 4,740,000 | $ | 570,750 | $ | 1,227,500 | $ | 3,377,500 | $ | 3,265,200 | ||||||||||
| Adjust for Change in Fair Value of Outstanding and Unvested Option Awards and Stock Awards Granted in Prior Fiscal Years |
$ | 1,915,279 | ($ | 3,650,920 | ) | ($ | 283,500 | ) | $ | 2,333,756 | $ | 1,852,005 | ||||||||
| Adjust for Fair Value at Vesting of Option Awards and Stock Awards Granted in Fiscal Year That Vested During Fiscal Year |
$ | 0 | $ | 452,538 | $ | 0 | $ | 0 | $ | 0 | ||||||||||
| Adjust for Change in Fair Value as of Vesting Date of Option Awards and Stock Awards Granted in Prior Fiscal Years For Which Applicable Vesting Conditions Were Satisfied During Fiscal Year |
$ | 41,128 | ($ | 108,641 | ) | ($ | 697,010 | ) | $ | 413,575 | $ | 699,550 | ||||||||
| |
|
|
|
|
|
|
|
|
|
|||||||||||
| Compensation Actually Paid |
$ |
8,014,215 |
($ |
1,917,216 |
) |
$ |
1,058,766 |
$ |
7,724,540 |
$ |
7,583,808 |
|||||||||
| |
|
|
|
|
|
|
|
|
|
|||||||||||
| (4) | This figure is the compensation actually paid for our non-PEO NEO, Mr. Kosiba. Compensation actually paid is determined under SEC rules and represents an amount derived from the starting point of the “Total” compensation reported in the Summary Compensation Table for the applicable fiscal year, as adjusted under the methodology prescribed under the SEC’s rules as shown in the table below. The amounts shown do not reflect the value of vested compensation actually received by Mr. Kosiba during the applicable fiscal year. |
Fiscal 2020 |
Fiscal 2021 |
Fiscal 2022 |
Fiscal 2023 |
Fiscal 2024 |
||||||||||||||||
| Summary Compensation Table Total |
$ | 1,361,233 | $ | 900,796 | $ | 991,545 | $ | 1,547,692 | $ | 2,896,750 | ||||||||||
| Subtract Grant Date Fair Value of Option Awards and Stock Awards Granted in Fiscal Year |
($ | 759,502 | ) | ($ | 442,800 | ) | ($ | 510,000 | ) | ($ | 712,950 | ) | ($ | 1,985,400 | ) | |||||
| Add Fair Value at Fiscal Year-End of Outstanding and Unvested Option Awards and Stock Awards Granted in Fiscal Year |
$ | 2,212,006 | $ | 228,300 | $ | 613,750 | $ | 1,418,550 | $ | 1,632,600 | ||||||||||
| Adjust for Change in Fair Value of Outstanding and Unvested Option Awards and Stock Awards Granted in Prior Fiscal Years |
$ | 920,010 | ($ | 1,492,514 | ) | ($ | 142,198 | ) | $ | 1,048,168 | $ | 768,580 | ||||||||
| Adjust for Fair Value at Vesting of Option Awards and Stock Awards Granted in Fiscal Year That Vested During Fiscal Year |
$ | 0 | $ | 151,557 | $ | 0 | $ | 0 | $ | 0 | ||||||||||
| Adjust for Change in Fair Value as of Vesting Date of Option Awards and Stock Awards Granted in Prior Fiscal Years For Which Applicable Vesting Conditions Were Satisfied During Fiscal Year |
$ | 188,867 | ($ | 61,018 | ) | ($ | 268,454 | ) | $ | 188,336 | $ | 291,361 | ||||||||
| |
|
|
|
|
|
|
|
|
|
|||||||||||
| Compensation Actually Paid |
$ |
3,922,615 |
($ |
715,679 |
) |
$ |
684,643 |
$ |
3,489,796 |
$ |
3,603,891 |
|||||||||
| |
|
|
|
|
|
|
|
|
|
|||||||||||
Relationship between CAP and TSR
Non-PEO
NEO. 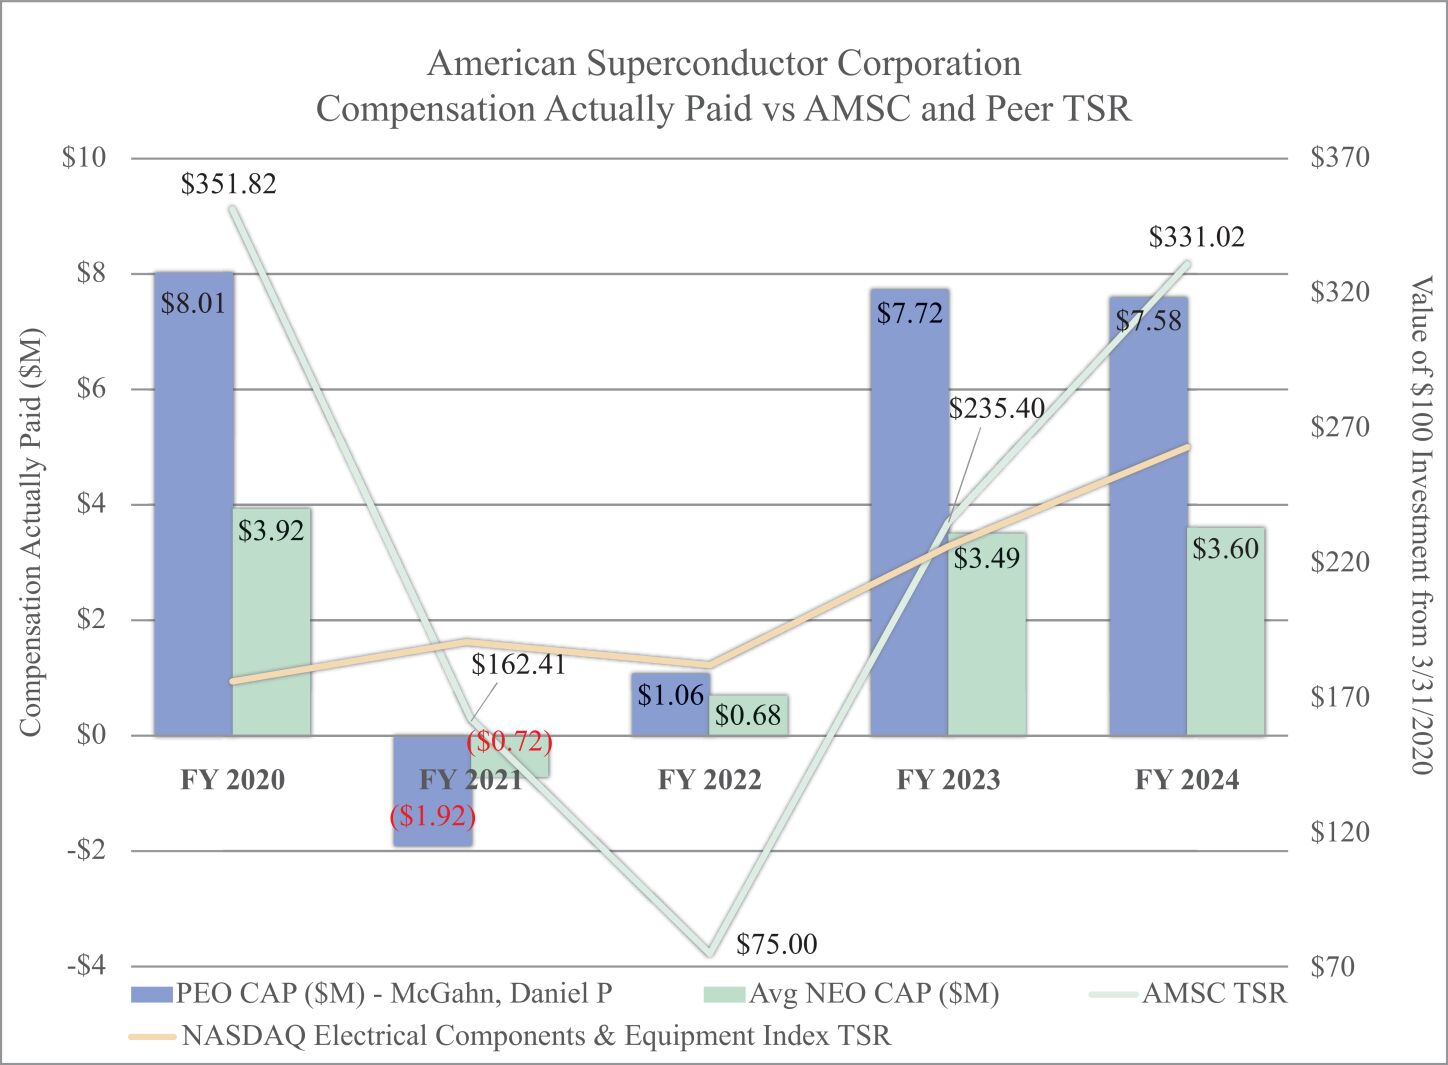
Relationship between CAP and Net Income
Non-PEO
NEO CAP and our Net Income. 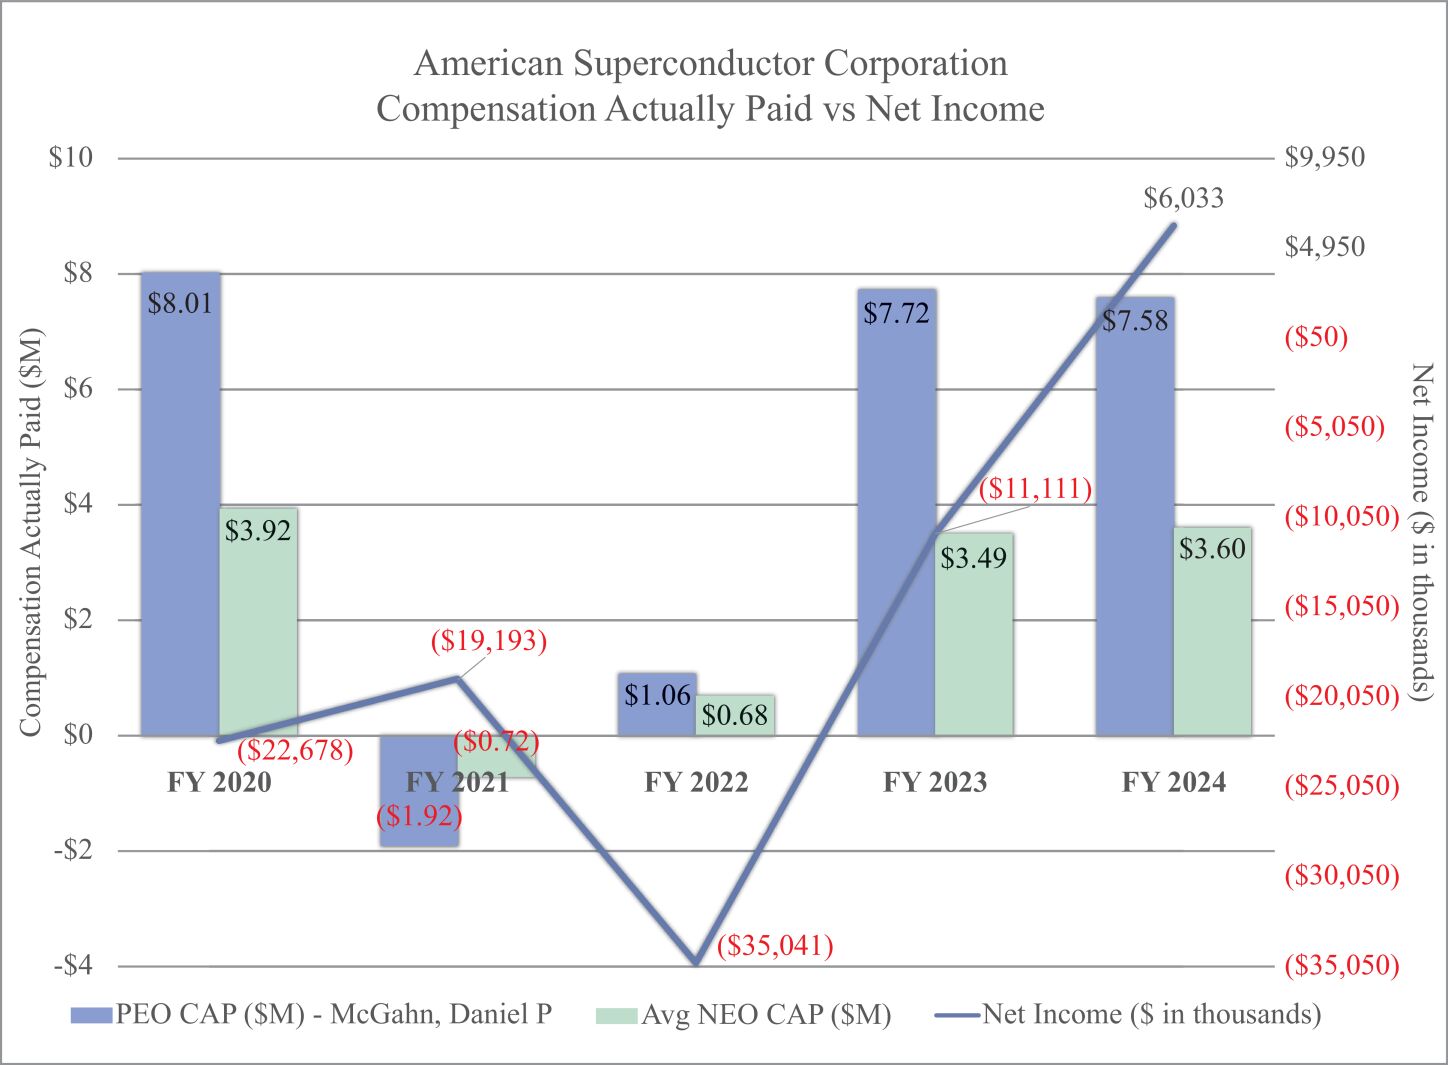
Relationship between CAP and Revenue (our company-selected measure)
Non-PEO
NEO CAP and our company’s revenue. 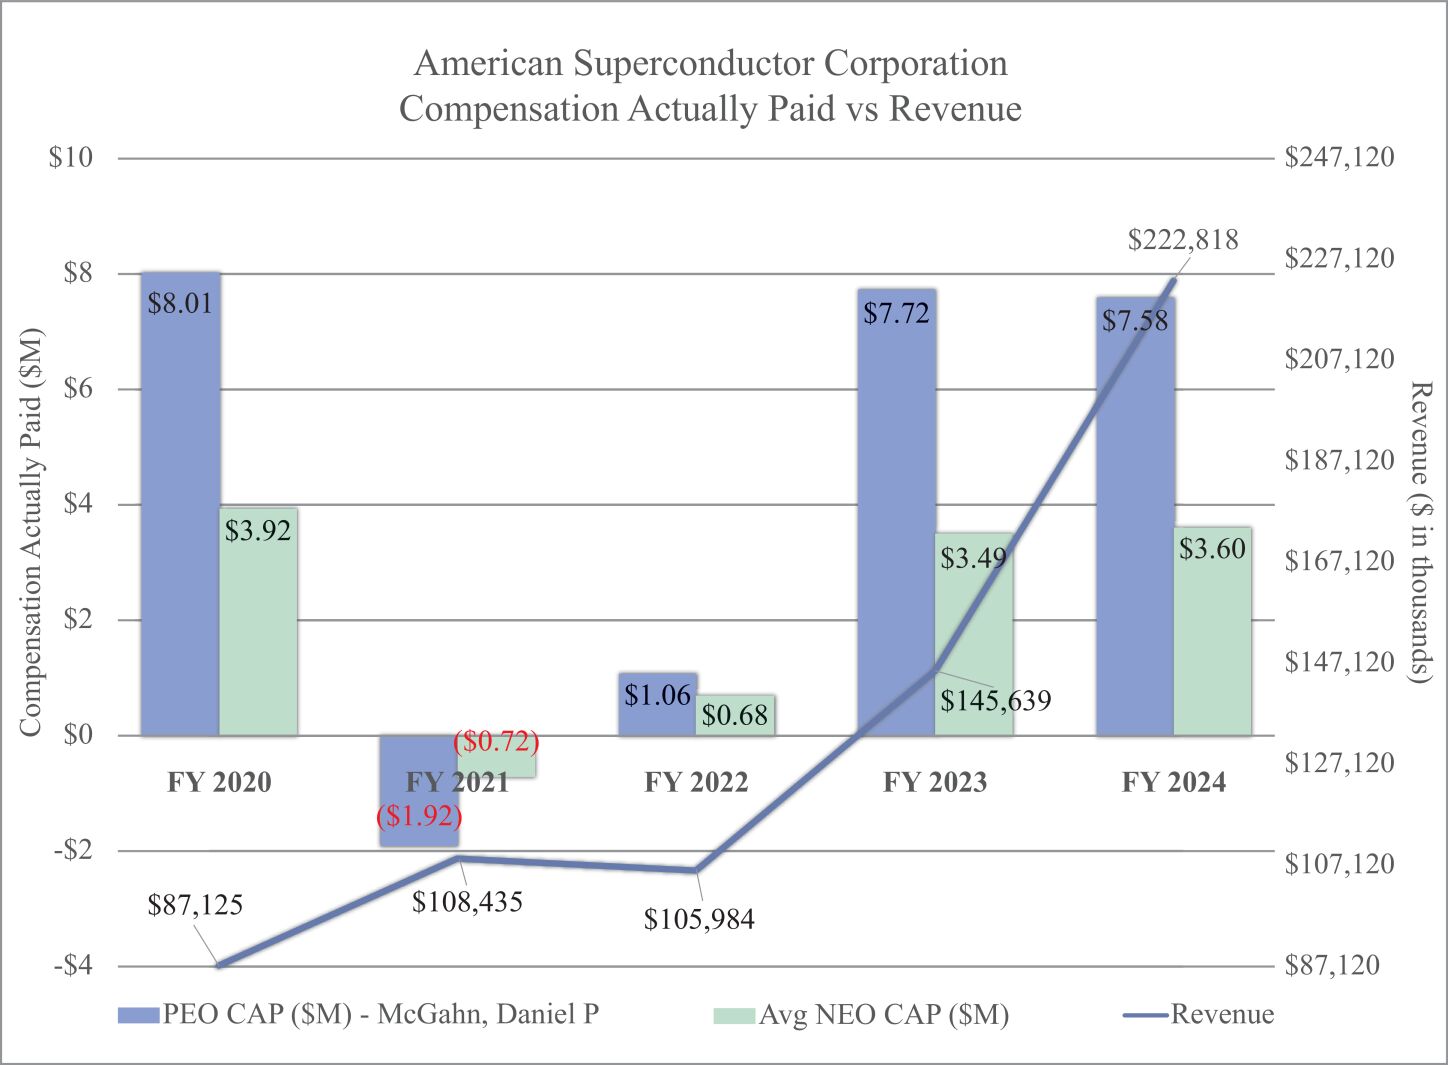
Relationship between CAP and TSR
Non-PEO
NEO. Performance Measures Used to Link Company Performance and CAP
| Revenue |
||
| Operating cash flow |
||
| Operating expenses |
||