Pay vs Performance Disclosure - USD ($)
|
12 Months Ended |
Mar. 31, 2025 |
Mar. 31, 2024 |
Mar. 31, 2023 |
Mar. 31, 2022 |
Mar. 31, 2021 |
| Pay vs Performance Disclosure |
|
|
|
|
|
| Pay vs Performance Disclosure, Table |
| | | | | | | | | | | | | | | | | | | | | | | | | | | | | | | | | | | | | | | | | | | Summary Compensation Table Total for PEO | | Compensation Actually Paid to PEO | Average Summary Compensation Table Total for Non-PEO NEOs
($) | Average Compensation Actually Paid to Non-PEO NEOs
($) | Value of Initial
Fixed $100 Investment Based on: | | Cash Flow From Operations
($K) | Fiscal Year | Vikram Verma | David Sipes
($) | Samuel
Wilson
($) | | Vikram Verma | David
Sipes
($) | Samuel Wilson
($) | Total Shareholder Return
($) | Peer Group Total Shareholder Return
($) | Net Income (Loss)
($K) | | 2025 | — | | — | | 2,240,142 | | | — | | — | | 939,474 | | 952,146 | | 538,241 | | 15.54 | | 206.88 | | (27,212) | | 63,554 | | | 2024 | — | | — | | 4,664,103 | | | — | | — | | 2,216,979 | | 1,711,212 | | 938,524 | | 20.98 | | 201.46 | | (67,592) | | 78,985 | | | 2023 | — | | 5,089,550 | | 5,044,815 | | | — | | (1,816,449) | | 2,935,365 | | 1,839,966 | | 929,226 | | 32.40 | | 159.34 | | (73,143) | | 48,786 | | | 2022 | — | | 6,670,866 | | — | | | — | | (28,882,064) | | — | | 2,757,663 | | (2,549,356) | | 97.82 | | 190.46 | | (175,383) | | 34,680 | | | 2021 | 3,139,200 | | 27,059,115 | | — | | | 10,113,170 | | 40,028,710 | | — | | 2,023,181 | | 5,454,065 | | 252.06 | | 203.27 | | (165,585) | | (14,066) | |
|
|
|
|
|
| Company Selected Measure Name |
cash flow from operations
|
|
|
|
|
| Named Executive Officers, Footnote |
Our PEOs were as follows: (1) Vikram Verma and David Sipes were our PEOs for fiscal 2021; (2) Mr. Sipes was our PEO for fiscal 2022; and (3) Mr. Sipes and Samuel Wilson were our PEOs for fiscal 2023 and (4) Mr. Wilson was our PEO for fiscal 2024 and 2025. Mr. Sipes served as CEO until November 30, 2022, when he was succeeded by Samuel Wilson, who served as interim CEO for the remainder of fiscal 2023 and is currently our permanent CEO.The non-PEO NEOs for each fiscal year shown in the table were as follows: 2021 - Steve Seger, Matthew Zinn, Dejan Deklich, Bryan Martin, Steven Gatoff, Samuel Wilson; 2022 - Dejan Deklich, Stephanie Garcia, Matthew Zinn, Hunter Middleton, Samuel Wilson; 2023 - Kevin Kraus, Matthew Zinn, Laurence Denny, Suzy Seandel and Hunter Middleton; 2024 and 2025 - Kevin Kraus, Laurence Denny, Hunter Middleton and Suzy Seandel.
|
|
|
|
|
| Peer Group Issuers, Footnote |
The peer group used for this data is the S&P Software and Services index, which is the peer group used as the basis of relative TSR measurement in the PSUs granted in fiscal 2023. The comparison assumes $100 was invested for the period starting April 1, 2020, through the end of the listed fiscal year in our common stock and in the S&P Software and Services index, respectively.
|
|
|
|
|
| Adjustment To PEO Compensation, Footnote |
The following are the adjustments made to the summary compensation table totals for fiscal 2025 to determine the amounts shown as compensation actually paid for the PEO and Non-PEO NEOs: | | | | | | | | | | | | | | | | | | | | | | | | | | Samuel Wilson | Non-PEO
NEOs | | (A) Pension Plans—Present Value: Deduct the aggregate change in the actuarial present value of the accumulated benefit under all defined benefit and actuarial pension plans | | | | | | | N/A | N/A | | (B) Pension Plans—Service Costs: Add the aggregate of service cost and prior service cost for all defined benefit and actuarial pension plans | | | | | | | N/A | N/A | | (C) Equity Awards | | | | | | | | | | (1) Deduct the amounts reported in the Summary Compensation Table under “Stock Awards” and “Option Awards”: | | | | | | | (1,692,000) | | (528,750) | | | (i) Add the fair value as of the end of the year of all awards granted during the year that are outstanding and unvested as of the end of the year: | | | | | | | 1,262,478 | | 394,524 | | | (ii) Add the amount equal to the change as of the end of the year (from the end of the prior year) in fair value of any awards granted in any prior year that are outstanding and unvested as of the end of the year: | | | | | | | (609,548) | | (192,970) | | | (iii) Add, for awards that are granted and vest in the same year, the fair value as of the vesting date: | | | | | | | N/A | N/A | | (iv) Add the amount equal to the change as of the vesting date (from the end of the prior year) in fair value of any awards granted in any prior year for which all applicable vesting conditions were satisfied at the end of or during the year: | | | | | | | (238,411) | | (75,956) | | | (v) Subtract, for any awards granted in any prior year that fail to meet the applicable vesting conditions during the year, the amount equal to the fair value at the end of the prior year: | | | | | | | (23,187) | | (10,753) | | | (vi) Add the dollar value of any dividends or other earnings paid on stock or option awards in the year prior to the vesting date that are not otherwise included in the total compensation for the year: | | | | | | | N/A | N/A | | Total | | | | | | | (1,300,668) | | (413,905) | |
|
|
|
|
|
| Non-PEO NEO Average Total Compensation Amount |
$ 952,146
|
$ 1,711,212
|
$ 1,839,966
|
$ 2,757,663
|
$ 2,023,181
|
| Non-PEO NEO Average Compensation Actually Paid Amount |
$ 538,241
|
938,524
|
929,226
|
(2,549,356)
|
5,454,065
|
| Compensation Actually Paid vs. Total Shareholder Return |
|
|
|
|
|
| Compensation Actually Paid vs. Net Income |
|
|
|
|
|
| Compensation Actually Paid vs. Company Selected Measure |
|
|
|
|
|
| Total Shareholder Return Vs Peer Group |
|
|
|
|
|
| Tabular List, Table |
| | | | | | | Measure | Explanation | | Cash Flow From Operations | Cash Flow From Operations represents the cash generated or used by a company's core, day-to-day business activities. | | Relative Total Stockholder Return (TSR) | Measurement of the Company’s total stockholder return as measured by the changes in the Company’s stock price as compared to its peers. |
|
|
|
|
|
| Total Shareholder Return Amount |
$ 15.54
|
20.98
|
32.40
|
97.82
|
252.06
|
| Peer Group Total Shareholder Return Amount |
206.88
|
201.46
|
159.34
|
190.46
|
203.27
|
| Net Income (Loss) |
$ (27,212,000)
|
$ (67,592,000)
|
$ (73,143,000)
|
$ (175,383,000)
|
$ (165,585,000)
|
| Company Selected Measure Amount |
63,554,000
|
78,985,000
|
48,786,000
|
34,680,000
|
(14,066,000)
|
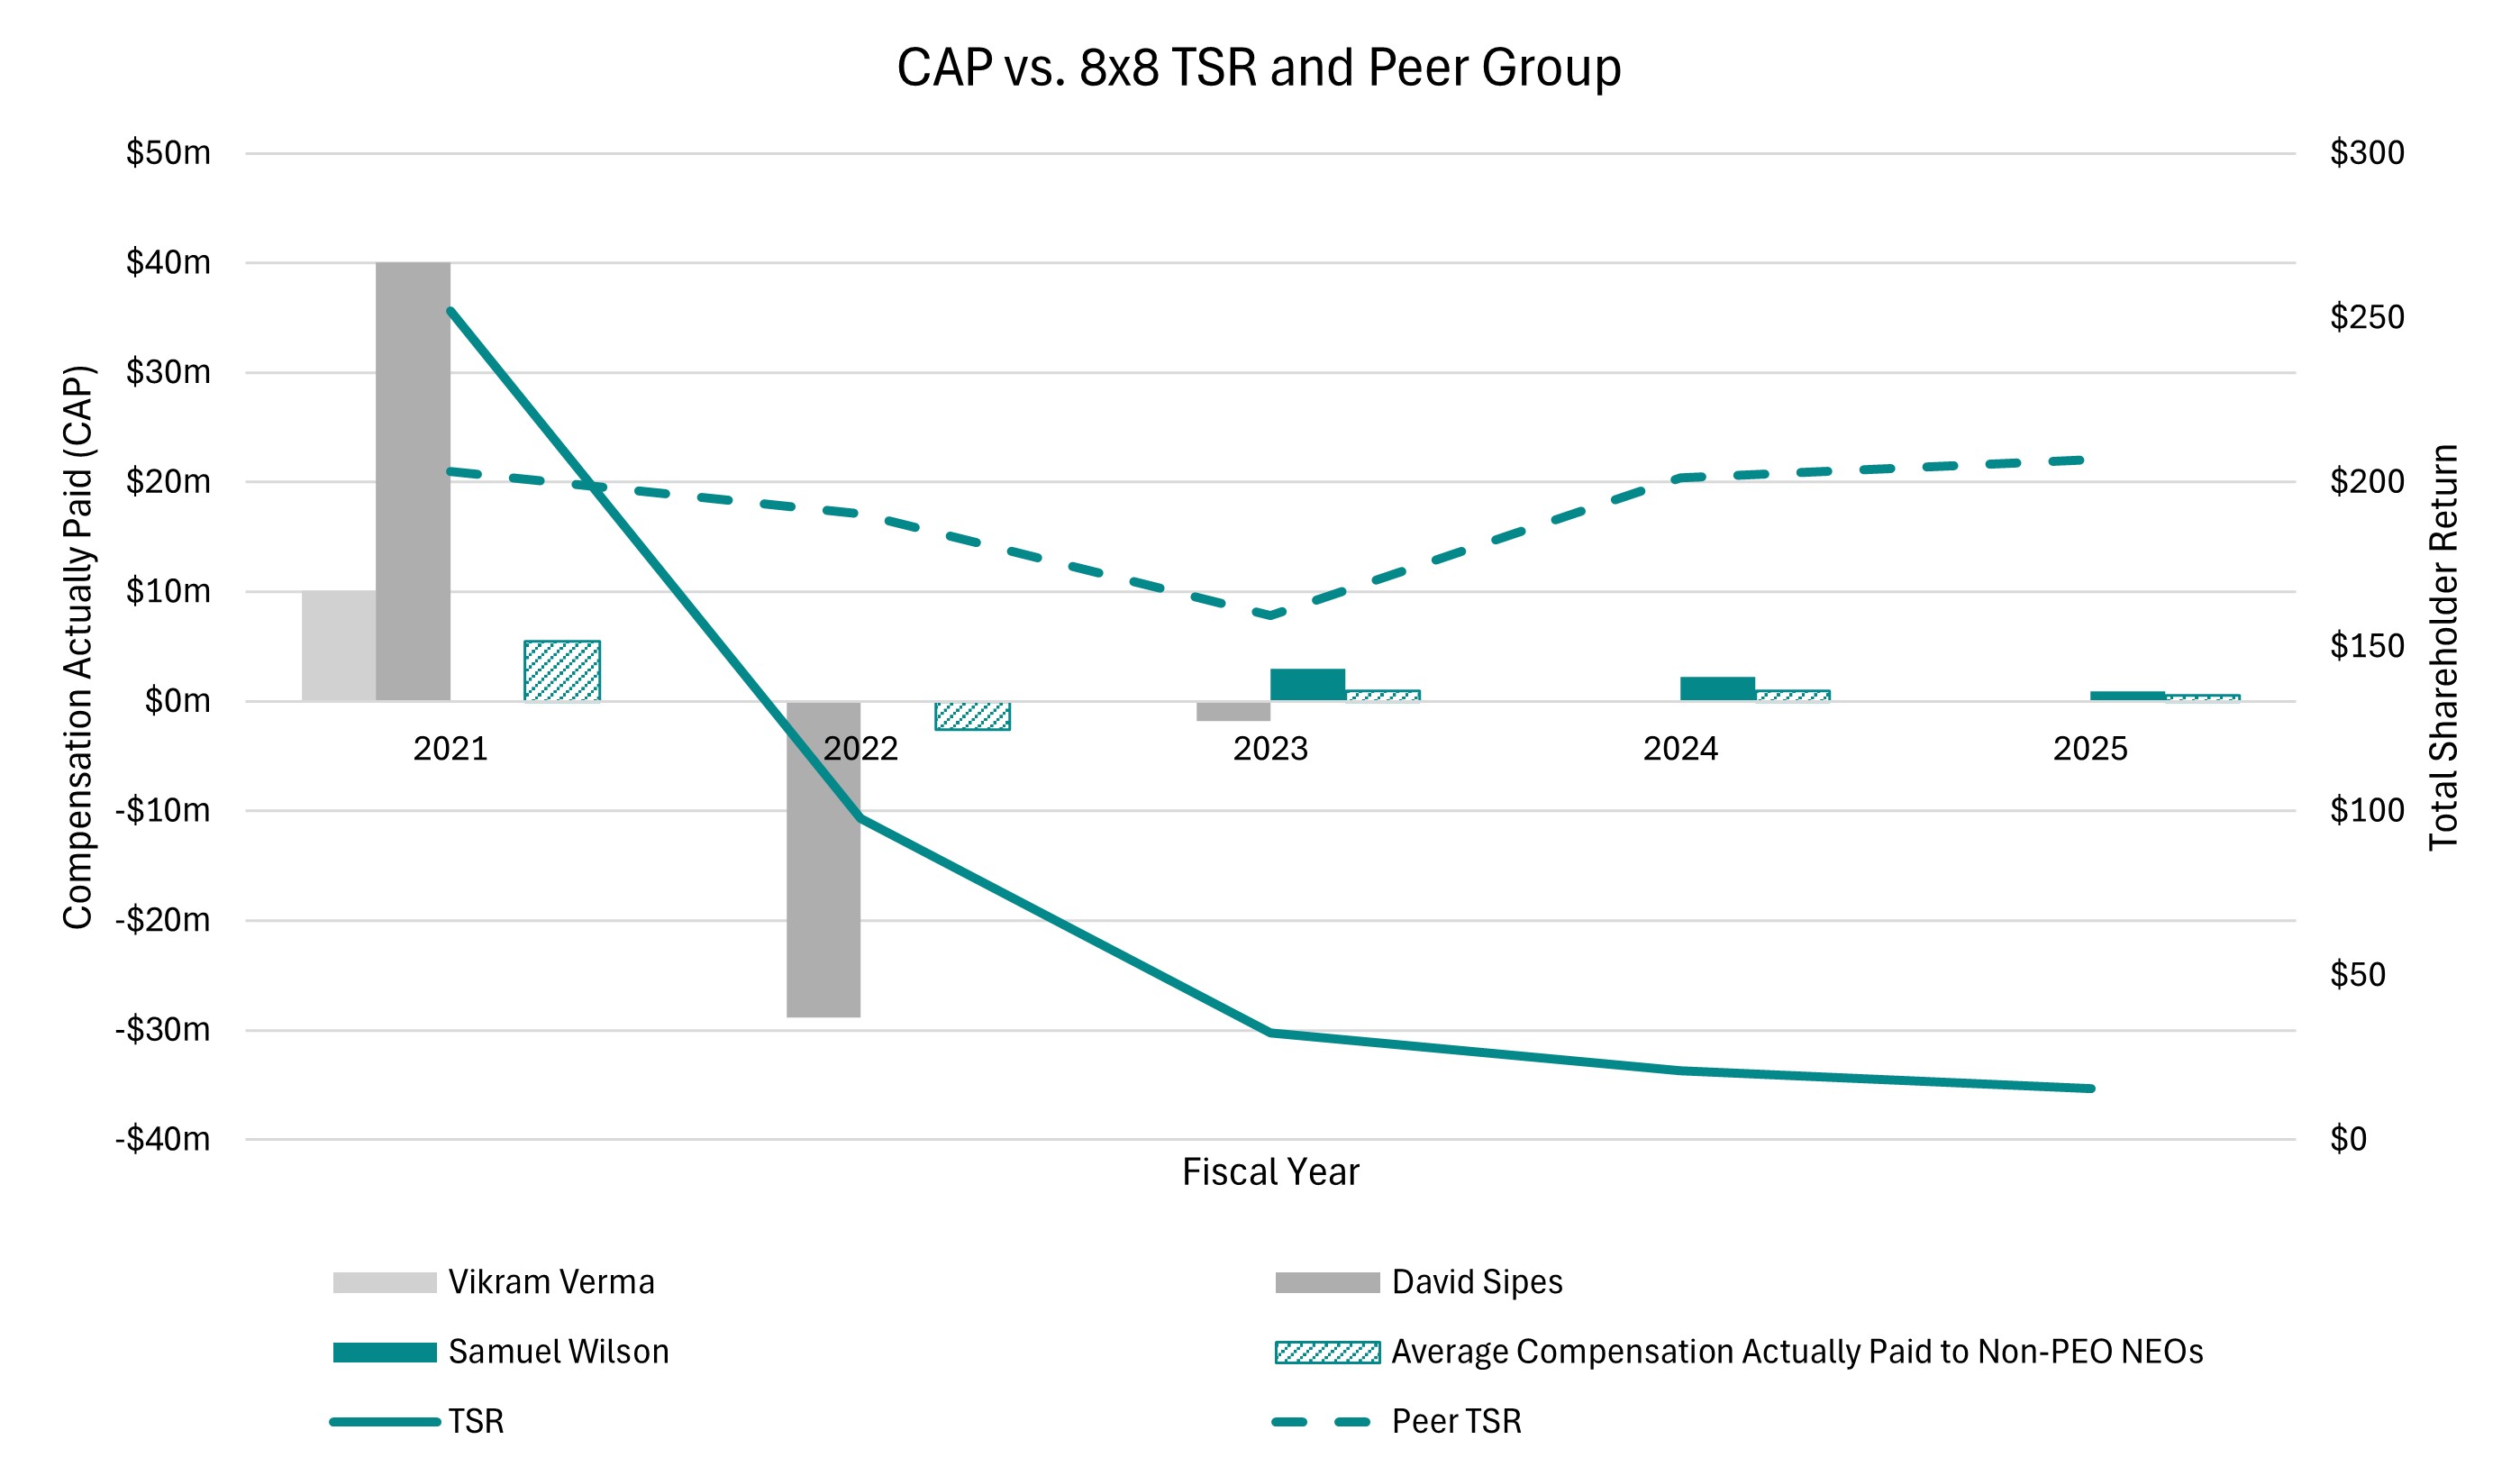
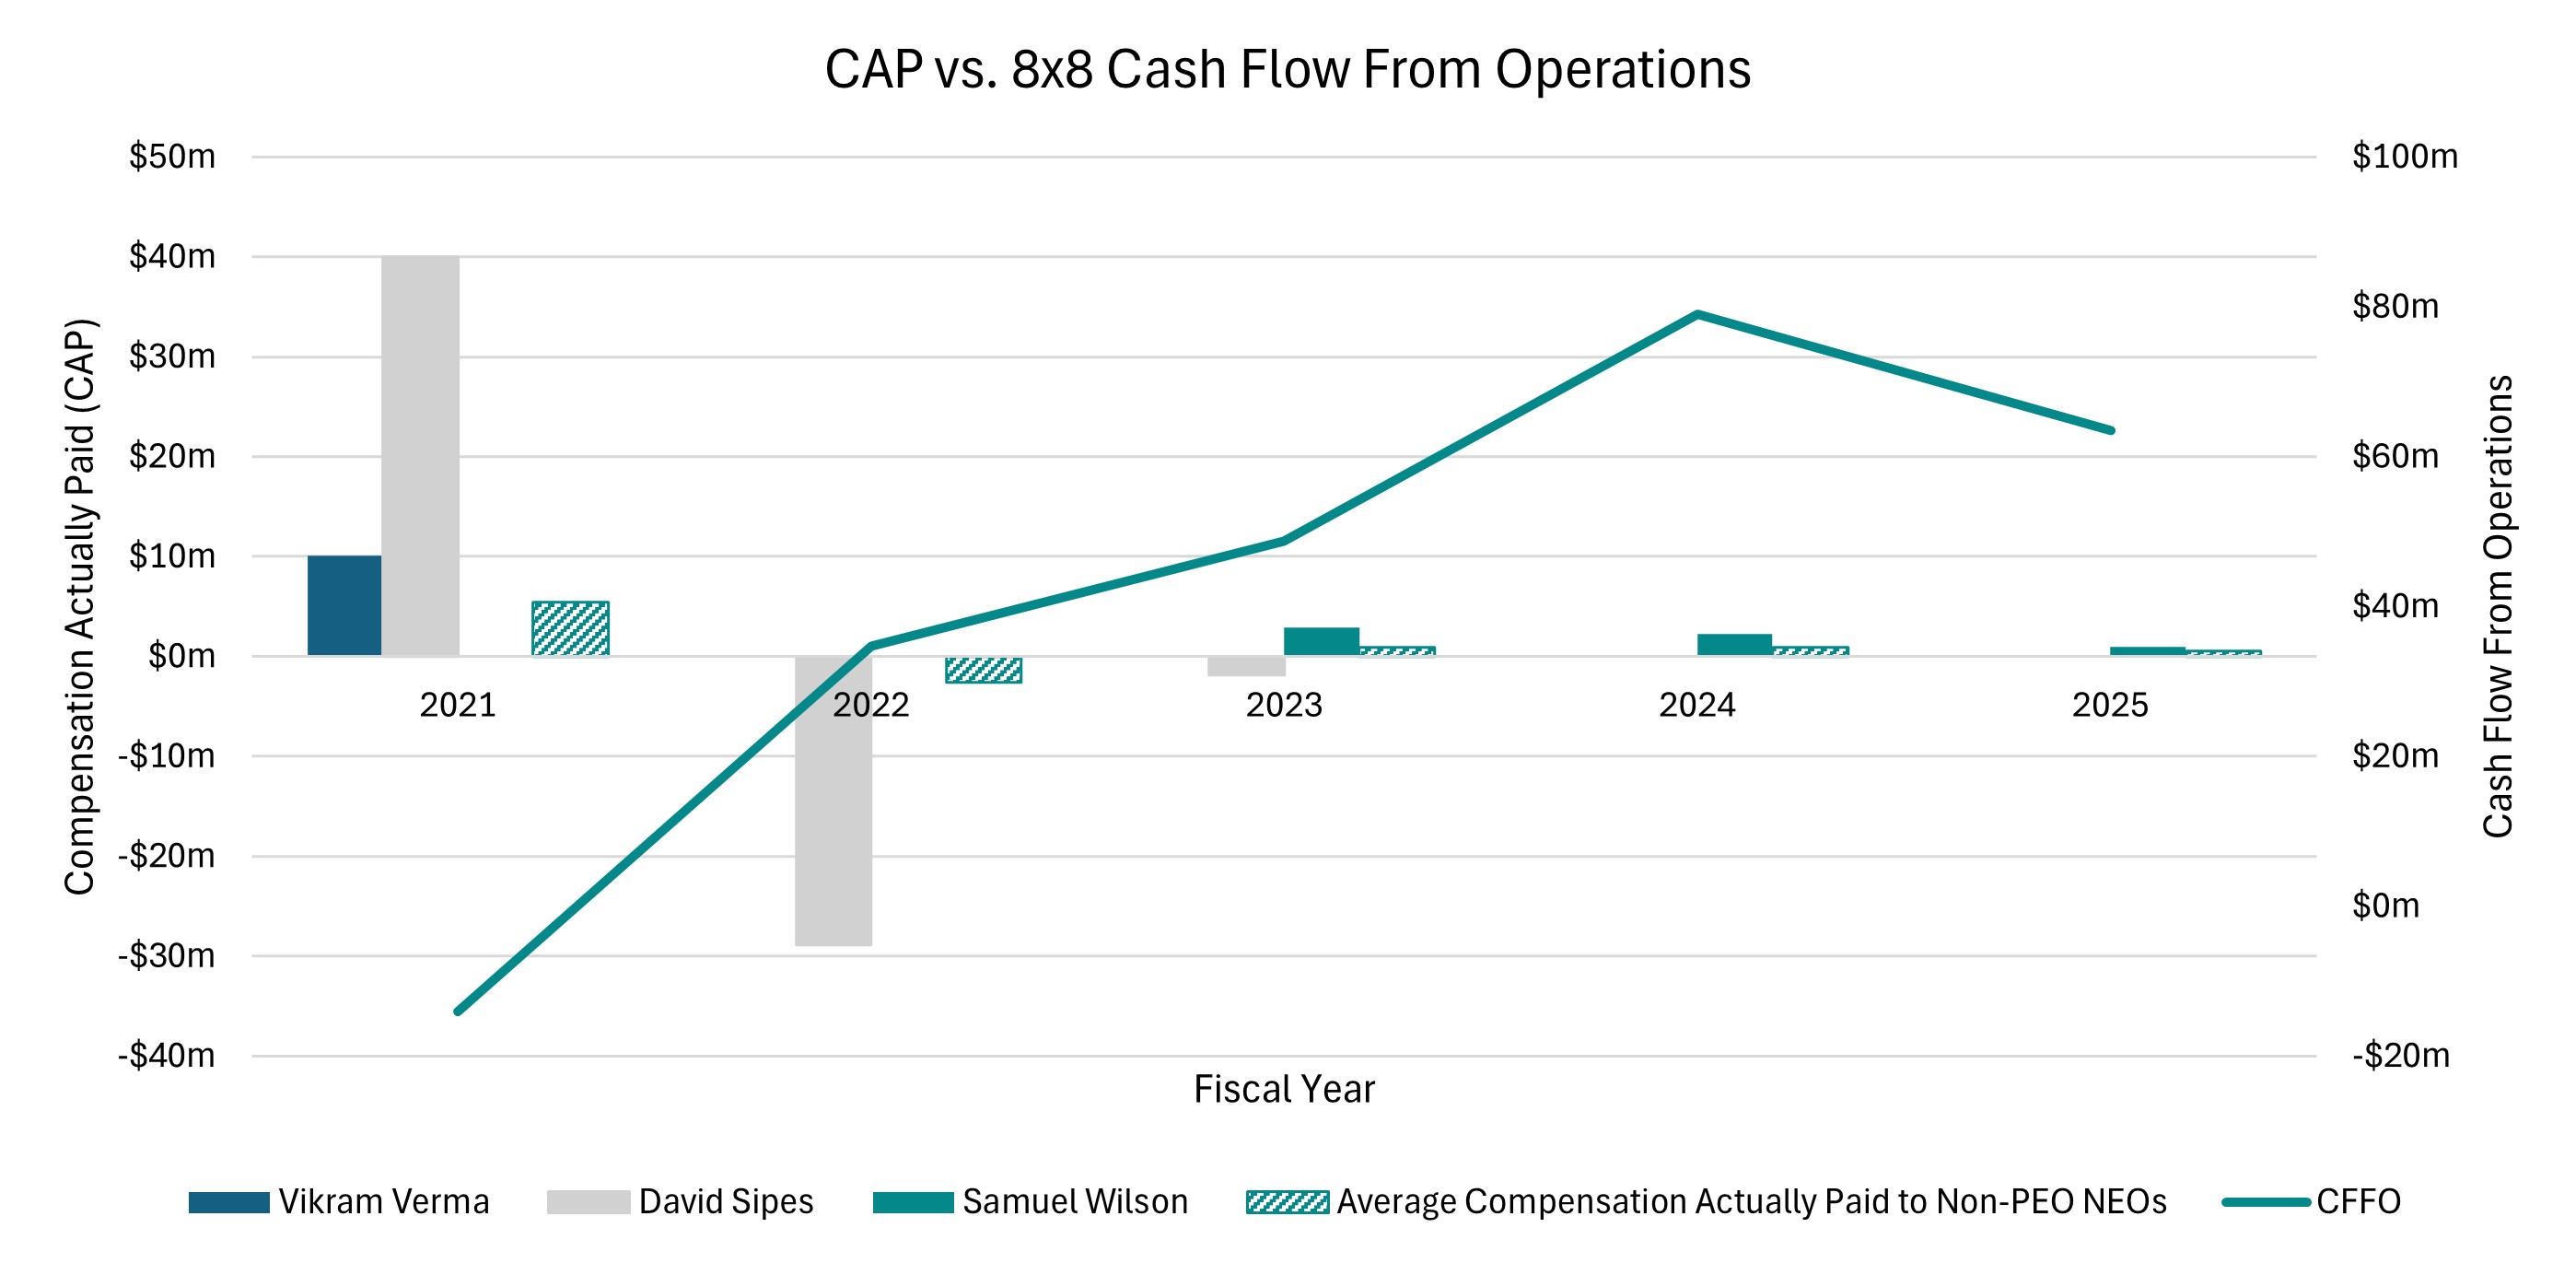
| Additional 402(v) Disclosure |
Equity values are calculated in accordance with FASB ASC Topic 718. In fiscal 2025, the Company suspended its annual cash incentive plan and so our NEOs compensation consisted of base salary, time-based restricted stock units (RSUs), and performance-based restricted stock units (PSUs). As a result, in fiscal 2025, the key performance measures linking 8x8’s performance to compensation actually paid were Relative Total Stockholder Return (TSR) and non-indexed stock price performance for PSUs granted prior to fiscal 2025 and Cumulative Cash Flow From Operations (CFFO) for PSUs granted in fiscal 2025. Even as total compensation for our NEOs dropped in fiscal 2025 due to suspension of the annual cash incentive plan, the charts below illustrate how our compensation programs continue to be designed to maintain strong links between the performance of the Company, the returns earned by our stockholders, and the compensation that is paid to our executives. While 8x8 has delivered strengthened financial performance as measured through cash flow from operations and continued improvements in net income, the positive impact these achievements have had on compensation have been significantly overshadowed by the impact of the negative stockholder returns over this same period in both absolute and relative measurements. This has resulted in either significantly lower, or negative, compensation actually paid to executives for fiscal 2022 - 2025.
|
|
|
|
|
| Measure:: 1 |
|
|
|
|
|
| Pay vs Performance Disclosure |
|
|
|
|
|
| Name |
Cash Flow From Operations
|
|
|
|
|
| Non-GAAP Measure Description |
We determined cash flow from operations to be the most important financial performance measure used to link Company performance to compensation actually paid to our PEOs and Non-PEO NEOs for our fiscal year ended March 31, 2025.
|
|
|
|
|
| Measure:: 2 |
|
|
|
|
|
| Pay vs Performance Disclosure |
|
|
|
|
|
| Name |
Relative Total Stockholder Return (TSR)
|
|
|
|
|
| Vikram Verma [Member] |
|
|
|
|
|
| Pay vs Performance Disclosure |
|
|
|
|
|
| PEO Total Compensation Amount |
$ 0
|
$ 0
|
$ 0
|
$ 0
|
$ 3,139,200
|
| PEO Actually Paid Compensation Amount |
0
|
0
|
0
|
0
|
10,113,170
|
| David Sipes [Member] |
|
|
|
|
|
| Pay vs Performance Disclosure |
|
|
|
|
|
| PEO Total Compensation Amount |
0
|
0
|
5,089,550
|
6,670,866
|
27,059,115
|
| PEO Actually Paid Compensation Amount |
0
|
0
|
$ (1,816,449)
|
$ (28,882,064)
|
$ 40,028,710
|
| PEO Name |
|
|
Mr. Sipes
|
Vikram Verma and David Sipes were our PEOs for fiscal 2021; (2) Mr. Sipes
|
Mr. Sipes
|
| Samuel Wilson [Member] |
|
|
|
|
|
| Pay vs Performance Disclosure |
|
|
|
|
|
| PEO Total Compensation Amount |
2,240,142
|
4,664,103
|
$ 5,044,815
|
$ 0
|
$ 0
|
| PEO Actually Paid Compensation Amount |
$ 939,474
|
$ 2,216,979
|
$ 2,935,365
|
$ 0
|
$ 0
|
| PEO Name |
Mr. Wilson
|
Mr. Wilson
|
Samuel Wilson
|
|
|
| PEO | Samuel Wilson [Member] |
|
|
|
|
|
| Pay vs Performance Disclosure |
|
|
|
|
|
| Adjustment to Compensation, Amount |
$ (1,300,668)
|
|
|
|
|
| PEO | Samuel Wilson [Member] | Aggregate Grant Date Fair Value of Equity Award Amounts Reported in Summary Compensation Table |
|
|
|
|
|
| Pay vs Performance Disclosure |
|
|
|
|
|
| Adjustment to Compensation, Amount |
(1,692,000)
|
|
|
|
|
| PEO | Samuel Wilson [Member] | Year-end Fair Value of Equity Awards Granted in Covered Year that are Outstanding and Unvested |
|
|
|
|
|
| Pay vs Performance Disclosure |
|
|
|
|
|
| Adjustment to Compensation, Amount |
1,262,478
|
|
|
|
|
| PEO | Samuel Wilson [Member] | Year-over-Year Change in Fair Value of Equity Awards Granted in Prior Years That are Outstanding and Unvested |
|
|
|
|
|
| Pay vs Performance Disclosure |
|
|
|
|
|
| Adjustment to Compensation, Amount |
(609,548)
|
|
|
|
|
| PEO | Samuel Wilson [Member] | Change in Fair Value as of Vesting Date of Prior Year Equity Awards Vested in Covered Year |
|
|
|
|
|
| Pay vs Performance Disclosure |
|
|
|
|
|
| Adjustment to Compensation, Amount |
(238,411)
|
|
|
|
|
| PEO | Samuel Wilson [Member] | Prior Year End Fair Value of Equity Awards Granted in Any Prior Year that Fail to Meet Applicable Vesting Conditions During Covered Year |
|
|
|
|
|
| Pay vs Performance Disclosure |
|
|
|
|
|
| Adjustment to Compensation, Amount |
(23,187)
|
|
|
|
|
| Non-PEO NEO |
|
|
|
|
|
| Pay vs Performance Disclosure |
|
|
|
|
|
| Adjustment to Compensation, Amount |
(413,905)
|
|
|
|
|
| Non-PEO NEO | Aggregate Grant Date Fair Value of Equity Award Amounts Reported in Summary Compensation Table |
|
|
|
|
|
| Pay vs Performance Disclosure |
|
|
|
|
|
| Adjustment to Compensation, Amount |
(528,750)
|
|
|
|
|
| Non-PEO NEO | Year-end Fair Value of Equity Awards Granted in Covered Year that are Outstanding and Unvested |
|
|
|
|
|
| Pay vs Performance Disclosure |
|
|
|
|
|
| Adjustment to Compensation, Amount |
394,524
|
|
|
|
|
| Non-PEO NEO | Year-over-Year Change in Fair Value of Equity Awards Granted in Prior Years That are Outstanding and Unvested |
|
|
|
|
|
| Pay vs Performance Disclosure |
|
|
|
|
|
| Adjustment to Compensation, Amount |
(192,970)
|
|
|
|
|
| Non-PEO NEO | Change in Fair Value as of Vesting Date of Prior Year Equity Awards Vested in Covered Year |
|
|
|
|
|
| Pay vs Performance Disclosure |
|
|
|
|
|
| Adjustment to Compensation, Amount |
(75,956)
|
|
|
|
|
| Non-PEO NEO | Prior Year End Fair Value of Equity Awards Granted in Any Prior Year that Fail to Meet Applicable Vesting Conditions During Covered Year |
|
|
|
|
|
| Pay vs Performance Disclosure |
|
|
|
|
|
| Adjustment to Compensation, Amount |
$ (10,753)
|
|
|
|
|