Pay vs Performance Disclosure - USD ($)
Mar. 29, 2025
Mar. 30, 2024
Apr. 01, 2023
Apr. 02, 2022
Apr. 03, 2021
PAY VERSUS PERFORMANCE TABLE
The following table provides information regarding compensation actually paid to our Principal Executive Officers (“PEO”) and
non-PEO
NEOs during the last four fiscal years, as well as total shareholder return, net income and revenue. Year |
Summary Compensation Table Total for PEO Tim Larson ($) (1) |
Compensation Actually Paid to PEO Tim Larson ($) (1) (2) |
Summary Compensation Table Total for PEO Mark Yost ($) (1) |
Compensation Actually Paid to PEO Mark Yost ($) (1) (2) |
Average Summary Compensation Table Total for Non-PEO Named Executive Officers ($) (3) |
Average Compensation Actually Paid to Non-PEO Named Executive Officers ($) (3) (4) |
Value of Initial Fixed $100 Investment Based on: |
Net Income (in thousands) ($) |
Company Selected Measure —Revenue (in thousands) ($) (6) | |||||||||||||||||||||||||||||||||||||||||
Cumulative Total Shareholder Return ($) |
Cumulative Peer Group Shareholder Return ($) (5) | |||||||||||||||||||||||||||||||||||||||||||||||||
2025 |
6,363,206 | 6,891,860 | 1,784,022 | (5,787,784 | ) | 2,304,344 | 2,838,848 | 604.34 | 332.48 | 198,413 | 2,483,448 | |||||||||||||||||||||||||||||||||||||||
2024 |
— | — | 5,672,498 | 4,968,664 | 1,756,948 | 1,609,135 | 542.16 | 416.21 | 146,696 | 2,024,823 | ||||||||||||||||||||||||||||||||||||||||
2023 |
— | — | 8,077,646 | 11,308,701 | 2,807,914 | 3,727,096 | 479.78 | 273.42 | 401,802 | 2,606,560 | ||||||||||||||||||||||||||||||||||||||||
2022 |
— | — | 5,765,742 | 9,156,467 | 2,160,329 | 3,003,454 | 350.00 | 217.54 | 248,044 | 2,207,229 | ||||||||||||||||||||||||||||||||||||||||
2021 |
— | — | 2,635,562 | 7,280,148 | 1,104,635 | 2,446,060 | 288.65 | 269.19 | 84,899 | 1,420,881 | ||||||||||||||||||||||||||||||||||||||||
Year |
Summary Compensation Table Total for PEO Mark Yost ($) |
Less: Grant Date Fair Value of Equity Awards Granted in Fiscal Year ($) |
Plus: Fair Value of Unvested Equity at Fiscal Year-End (Current Year Awards) ($) |
Plus: Increase/(Decrease) in Fair Value of Equity Vested During Fiscal Year ($) |
Plus: Increase/(Decrease) in Fair Value of Unvested Equity at Fiscal Year-End (Prior Year Awards) ($) |
Plus: Increase/(Decrease) in Fair Value at Prior Fiscal Year-End of EquityForfeited during the Current Year |
Compensation Actually Paid to PEO Mark Yost ($) | ||||||||||||||||||||||||||||
2025 |
1,784,022 | — | — | 850,932 | — | (8,422,738 | ) | (5,787,784 | ) | ||||||||||||||||||||||||||
2024 |
5,672,498 | (4,908,968 | ) | 4,908,968 | 96,634 | (800,468 | ) | — | 4,968,664 | ||||||||||||||||||||||||||
2023 |
8,077,646 | (5,822,066 | ) | 6,585,723 | 746,685 | 1,720,714 | — | 11,308,701 | |||||||||||||||||||||||||||
2022 |
5,765,742 | (3,660,296 | ) | 2,908,784 | 2,538,546 | 1,603,691 | — | 9,156,467 | |||||||||||||||||||||||||||
2021 |
2,635,562 | (1,247,012 | ) | 2,278,688 | 916,685 | 2,696,225 | — | 7,280,148 | |||||||||||||||||||||||||||
Year |
Summary Compensation Table Total for PEO Tim Larson ($) |
Less: Grant Date Fair Value of Equity Awards Granted in Fiscal Year ($) |
Plus: Fair Value of Unvested Equity at Fiscal Year-End (Current Year Awards) ($) |
Plus: Increase/(Decrease) in Fair Value of Equity Vested During Fiscal Year ($) |
Plus: Increase/ (Decrease) in Fair Value of Unvested Equity at Fiscal Year-End (Prior Year Awards) ($) |
Plus: Increase/(Decrease) in Fair Value at Prior Fiscal Year- End of Equity Forfeited during the Current Year |
Compensation Actually Paid to PEO Tim Larson ($) | ||||||||||||||||||||||||||||
2025 |
6,363,206 | (5,158,929 | ) | 4,962,056 | 135,545 | 589,982 | — | 6,891,860 | |||||||||||||||||||||||||||
Year |
Average Summary Compensation Table Total for Non-PEO NEOs ($) (3) |
Less: Grant Date Fair Value of Equity Awards Granted in Fiscal Year ($) |
Plus: Average Fair Value of Unvested Equity at Fiscal Year- End (Current Year Awards) ($) |
Plus: Increase/(Decrease) in Fair Value of Equity Vested During Fiscal Year ($) |
Plus: Increase/(Decrease) in Fair Value of Unvested Equity at Fiscal Year-End (Prior Year Awards) ($) |
Plus: Increase/(Decrease) in Fair Value at Prior Fiscal Year-End of Equity Forfeited during the Current Year |
Average Compensation Actually Paid to Non-PEO NEOs ($) | ||||||||||||||||||||||||||||
2025 |
2,304,344 | (1,266,531 | ) | 1,272,960 | 82,983 | 445,092 | — | 2,838,848 | |||||||||||||||||||||||||||
2024 |
1,756,948 | (1,328,377 | ) | 1,328,377 | 62,140 | (209,953 | ) | — | 1,609,135 | ||||||||||||||||||||||||||
2023 |
2,807,914 | (1,618,567 | ) | 1,830,868 | 161,192 | 545,689 | — | 3,727,096 | |||||||||||||||||||||||||||
2022 |
2,160,329 | (1,125,595 | ) | 936,428 | 647,903 | 384,389 | — | 3,003,454 | |||||||||||||||||||||||||||
2021 |
1,104,635 | (383,918 | ) | 701,542 | 276,522 | 747,279 | — | 2,446,060 | |||||||||||||||||||||||||||
(1) |
Reflects compensation amounts reported in the Summary Compensation Table for our current CEO, Tim Larson, and our former CEO, Mark Yost, for the respective years shown. |
(2) |
Adjustments to the Summary Compensation Table Total to arrive at Compensation Actually Paid (“CAP”) for our PEOs are shown below. No adjustments were necessary for defined benefit and pension plans, dividends, or equity awards granted and vested during the same fiscal year. The assumptions used for determining the fair values shown in this table are materially consistent with those used to determine the fair values disclosed as of the grant date of such awards. |
(3) |
Non-PEO NEOs were: Laurie Hough, Joseph Kimmel, Wade Lyall and Laurel Krueger for fiscal 2025; Laurie Hough, Tim Larson, Joseph Kimmel, Wade Lyall in fiscal 2024 and 2023; Laurie Hough, Tim Larson, Joseph Kimmel, Wade Lyall and Robert Spence in fiscal 2022; and Laurie Hough, Joseph Kimmel, Wade Lyall, and Robert Spence in fiscal 2021. |
(4) |
Adjustments to the Summary Compensation Table Total to arrive at CAP for non-PEO NEOs are shown below. No adjustments were necessary for defined benefit and pension plans, dividends, equity awards granted and vested during the same fiscal year, or forfeitures. |
(5) |
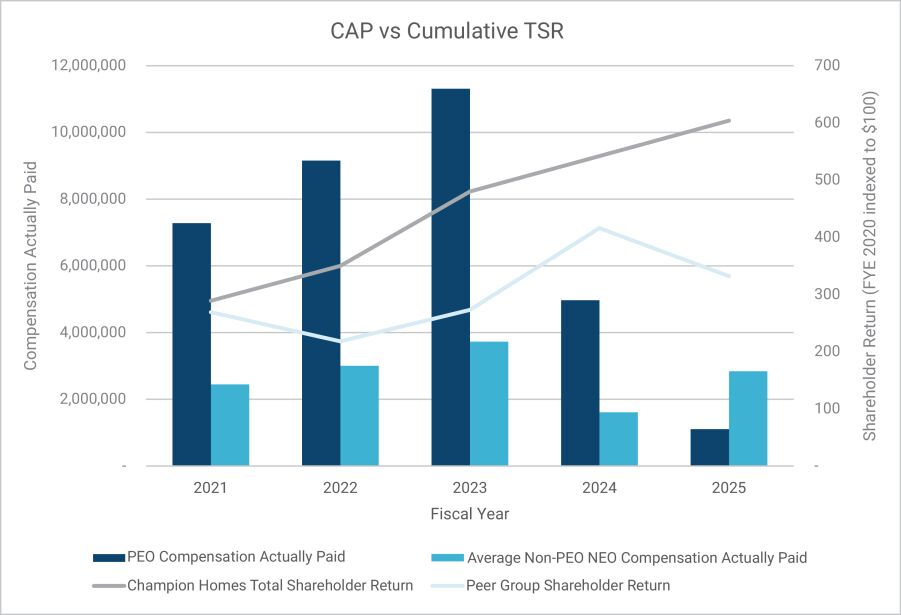
The peer group consists of Beazer Homes USA, Cavco Industries, Century Communities, LGI Homes, MDC Holdings, M/I Homes, Meritage Homes, Quanex Building Products Corp, and Tri Pointe Group, which is the same peer group we use in our fiscal 2025 Annual Report on Form 10-K. The peer group TSR calculation is weighted by market capitalization at the beginning of the applicable period. The comparison assumes $100 was invested for the period starting March 28, 2020, through the end of the listed fiscal year. The below graph illustrates the relationship between our Cumulative TSR and peer group TSR, and the relationship between our CAP and the cumulative TSR for the Company and our peer group. |
(6) |
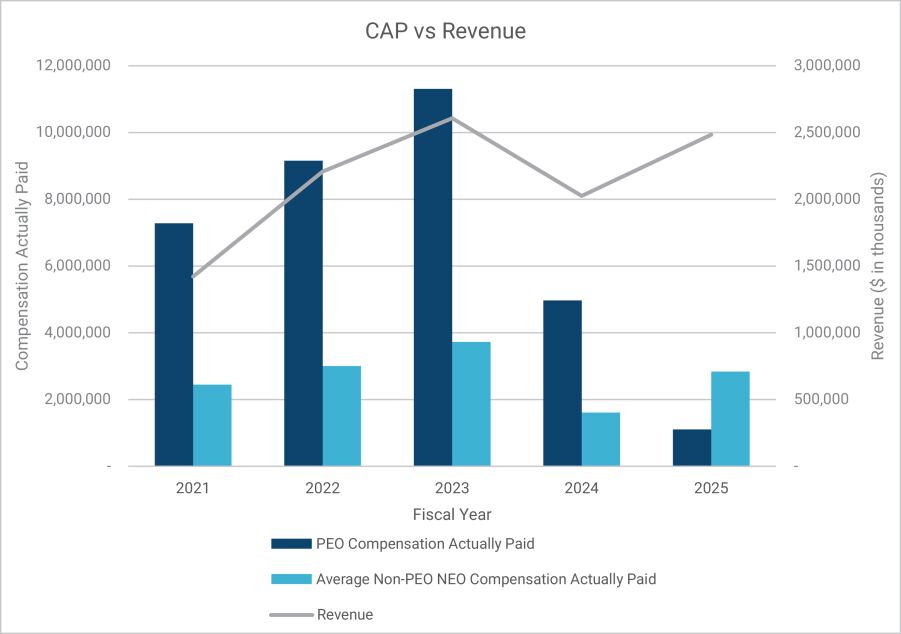
The Company Selected Measure of Revenue reflects net sales from the Company’s consolidated income statements in the Company’s annual reports on Form 10-K for fiscal years 2021 through 2025. |
Non-PEO
NEOs were: Laurie Hough, Joseph Kimmel, Wade Lyall and Laurel Krueger for fiscal 2025; Laurie Hough, Tim Larson, Joseph Kimmel, Wade Lyall in fiscal 2024 and 2023; Laurie Hough, Tim Larson, Joseph Kimmel, Wade Lyall and Robert Spence in fiscal 2022; and Laurie Hough, Joseph Kimmel, Wade Lyall, and Robert Spence in fiscal 2021.
10-K.
(2) |
Adjustments to the Summary Compensation Table Total to arrive at Compensation Actually Paid (“CAP”) for our PEOs are shown below. No adjustments were necessary for defined benefit and pension plans, dividends, or equity awards granted and vested during the same fiscal year. The assumptions used for determining the fair values shown in this table are materially consistent with those used to determine the fair values disclosed as of the grant date of such awards. |
Year |
Summary Compensation Table Total for PEO Mark Yost ($) |
Less: Grant Date Fair Value of Equity Awards Granted in Fiscal Year ($) |
Plus: Fair Value of Unvested Equity at Fiscal Year-End (Current Year Awards) ($) |
Plus: Increase/(Decrease) in Fair Value of Equity Vested During Fiscal Year ($) |
Plus: Increase/(Decrease) in Fair Value of Unvested Equity at Fiscal Year-End (Prior Year Awards) ($) |
Plus: Increase/(Decrease) in Fair Value at Prior Fiscal Year-End of EquityForfeited during the Current Year |
Compensation Actually Paid to PEO Mark Yost ($) | ||||||||||||||||||||||||||||
2025 |
1,784,022 | — | — | 850,932 | — | (8,422,738 | ) | (5,787,784 | ) | ||||||||||||||||||||||||||
2024 |
5,672,498 | (4,908,968 | ) | 4,908,968 | 96,634 | (800,468 | ) | — | 4,968,664 | ||||||||||||||||||||||||||
2023 |
8,077,646 | (5,822,066 | ) | 6,585,723 | 746,685 | 1,720,714 | — | 11,308,701 | |||||||||||||||||||||||||||
2022 |
5,765,742 | (3,660,296 | ) | 2,908,784 | 2,538,546 | 1,603,691 | — | 9,156,467 | |||||||||||||||||||||||||||
2021 |
2,635,562 | (1,247,012 | ) | 2,278,688 | 916,685 | 2,696,225 | — | 7,280,148 | |||||||||||||||||||||||||||
Year |
Summary Compensation Table Total for PEO Tim Larson ($) |
Less: Grant Date Fair Value of Equity Awards Granted in Fiscal Year ($) |
Plus: Fair Value of Unvested Equity at Fiscal Year-End (Current Year Awards) ($) |
Plus: Increase/(Decrease) in Fair Value of Equity Vested During Fiscal Year ($) |
Plus: Increase/ (Decrease) in Fair Value of Unvested Equity at Fiscal Year-End (Prior Year Awards) ($) |
Plus: Increase/(Decrease) in Fair Value at Prior Fiscal Year- End of Equity Forfeited during the Current Year |
Compensation Actually Paid to PEO Tim Larson ($) | ||||||||||||||||||||||||||||
2025 |
6,363,206 | (5,158,929 | ) | 4,962,056 | 135,545 | 589,982 | — | 6,891,860 | |||||||||||||||||||||||||||
(4) |
Adjustments to the Summary Compensation Table Total to arrive at CAP for non-PEO NEOs are shown below. No adjustments were necessary for defined benefit and pension plans, dividends, equity awards granted and vested during the same fiscal year, or forfeitures. |
Year |
Average Summary Compensation Table Total for Non-PEO NEOs ($) (3) |
Less: Grant Date Fair Value of Equity Awards Granted in Fiscal Year ($) |
Plus: Average Fair Value of Unvested Equity at Fiscal Year- End (Current Year Awards) ($) |
Plus: Increase/(Decrease) in Fair Value of Equity Vested During Fiscal Year ($) |
Plus: Increase/(Decrease) in Fair Value of Unvested Equity at Fiscal Year-End (Prior Year Awards) ($) |
Plus: Increase/(Decrease) in Fair Value at Prior Fiscal Year-End of Equity Forfeited during the Current Year |
Average Compensation Actually Paid to Non-PEO NEOs ($) | ||||||||||||||||||||||||||||
2025 |
2,304,344 | (1,266,531 | ) | 1,272,960 | 82,983 | 445,092 | — | 2,838,848 | |||||||||||||||||||||||||||
2024 |
1,756,948 | (1,328,377 | ) | 1,328,377 | 62,140 | (209,953 | ) | — | 1,609,135 | ||||||||||||||||||||||||||
2023 |
2,807,914 | (1,618,567 | ) | 1,830,868 | 161,192 | 545,689 | — | 3,727,096 | |||||||||||||||||||||||||||
2022 |
2,160,329 | (1,125,595 | ) | 936,428 | 647,903 | 384,389 | — | 3,003,454 | |||||||||||||||||||||||||||
2021 |
1,104,635 | (383,918 | ) | 701,542 | 276,522 | 747,279 | — | 2,446,060 | |||||||||||||||||||||||||||
We structure our executive compensation program to award compensation that depends on, and rewards executives on the basis of individual and Company short and long-term performance and thereby fosters a pay-for-performance culture. The Compensation Committee selects the metrics used for both our short-term and long-term incentive awards because it believes they effectively drive financial and operational performance and incentivize our executives to pursue actions that create sustainable shareholder value. The financial performance measures used by the Company for fiscal 2025 to align the compensation actually paid to the Company’s NEOs to Company performance are:
Financial Performance Measures |
Revenue |
Earnings per Share |
Relative Total Shareholder Return |
Single Family Home Completion Market Share |