Exhibit 99.1
 |
Prepared by the following Qualified Persons:
▪ Mathieu Belisle, P.Eng...............BBA Engineering Ltd.
▪ Amanda Fitch, P.Eng................BBA Engineering Ltd.
▪ Sebastien Guido, P.Eng............Alius Mine Consulting Inc.
▪ Philip Clark, P.Eng......................Clean Energy Consulting Inc.
▪ Rob Griffith, P.Eng. ....................Falkirk Environmental Consultants Ltd.
▪ Katherine Mueller, P.Eng..........Falkirk Environmental Consultants Ltd.
▪ Nikolay Sidenko, P.Geo............Falkirk Environmental Consultants Ltd.
▪ Eric Lecomte, P.Eng..................InnovExplo Inc.
▪ Carl Pelletier, P.Geo. ................InnovExplo Inc.
▪ Tessa Scott, P.Geo. ..................InnovExplo Inc.
▪ A. J. MacDonald, P.Eng...........Integrated Sustainability Consultants Ltd.
▪ Jean-François Maillé, P.Eng.....JDS Energy & Mining Inc.
▪ Yapo Allé-Ando, P.Eng.............M.A. O’Kane Consultants Inc.
▪ Rachel Sawyer, P.Eng...............M.A. O’Kane Consultants Inc.
▪ Paul Gauthier, P.Eng.................WSP Canada Inc.
NI 43-101 Technical Report
Feasibility Study for the Cariboo Gold Project
District of Wells, British Columbia, Canada
Prepared for:
Osisko Development Corp.
Effective Date: April 25, 2025
Signature Date: June 11, 2025 |
 |
Osisko Development Corp.
NI 43-101 Technical Report
Feasibility Study for the Cariboo Gold Project |
 |
Date and Signature Page
This technical report is effective
as of the 25th day of April 2025.
| “Signed and sealed on file” |
|
June 11, 2025 |
|
Mathieu Bélisle, P.Eng.
BBA Engineering Ltd. |
|
Date |
| |
|
|
| |
|
|
| “Signed and sealed on file” |
|
June 11, 2025 |
|
Amanda Fitch, P.Eng.
BBA Engineering Ltd. |
|
Date |
| |
|
|
| |
|
|
| “Signed and sealed on file” |
|
June 11, 2025 |
|
Sebastien Guido, P.Eng.
Alius Mine Consulting Inc. |
|
Date |
| |
|
|
| |
|
|
| “Signed and sealed on file” |
|
June 11, 2025 |
|
Philip Clark, P.Eng.
Clean Energy Consulting Inc. |
|
Date |
| JUNE 2025 | BBA Document No.: 3772047-000000-40-ERA-0001-R00 |
| |
Osisko Development Corp.
NI 43-101 Technical Report
Feasibility Study for the Cariboo Gold Project |
|
| “Signed and sealed on file” |
|
June 11, 2025 |
|
Rob Griffith, P.Eng.
Falkirk Environmental Consultants Ltd. |
|
Date |
| |
|
|
| |
|
|
| “Signed and sealed on file” |
|
June 11, 2025 |
|
Katherine Mueller, P.Eng.
Falkirk Environmental Consultants Ltd. |
|
Date |
| |
|
|
| |
|
|
| “Signed and sealed on file” |
|
June 11, 2025 |
|
Nikolay Sidenko, P.Geo.
Falkirk Environmental Consultants Ltd. |
|
Date |
| |
|
|
| |
|
|
| “Signed and sealed on file” |
|
June 11, 2025 |
|
Eric Lecomte, P.Eng.
InnovExplo Inc. |
|
Date |
| JUNE 2025 | BBA Document No.: 3772047-000000-40-ERA-0001-R00 |
| |
Osisko Development Corp.
NI 43-101 Technical Report
Feasibility Study for the Cariboo Gold Project |
|
| “Signed and sealed on file” |
|
June 11, 2025 |
|
Carl Pelletier, P.Geo.
InnovExplo Inc. |
|
Date |
| |
|
|
| |
|
|
| “Signed and sealed on file” |
|
June 11, 2025 |
|
Tessa Scott, P.Geo.
InnovExplo Inc. |
|
Date |
| |
|
|
| |
|
|
| “Signed and sealed on file” |
|
June 11, 2025 |
|
A.J. MacDonald, P.Eng.
Integrated Sustainability Consultants Ltd. |
|
Date |
| |
|
|
| |
|
|
| “Signed and sealed on file” |
|
June 11, 2025 |
|
Jean-François Maillé, P.Eng.
JDS Energy & Mining Inc. |
|
Date |
| JUNE 2025 | BBA Document No.: 3772047-000000-40-ERA-0001-R00 |
| |
Osisko Development Corp.
NI 43-101 Technical Report
Feasibility Study for the Cariboo Gold Project |
|
| “Signed and sealed on file” |
|
June 11, 2025 |
|
Yapo Allé-Ando, P.Eng.
M.A. O'Kane Consultants Inc. |
|
Date |
| |
|
|
| |
|
|
| “Signed and sealed on file” |
|
June 11, 2025 |
|
Rachel Sawyer, P.Eng.
M.A. O'Kane Consultants Inc. |
|
Date |
| |
|
|
| |
|
|
| “Signed and sealed on file” |
|
June 11, 2025 |
|
Paul Gauthier, P.Eng.
WSP Canada Inc. |
|
Date |
| |
|
|
| JUNE 2025 | BBA Document No.: 3772047-000000-40-ERA-0001-R00 |
 |
990 de l’Église Rd, Suite 590,
Québec, QC, G1V 3V7
T +1 418.657.2110
F +1 450.464.0901
BBAconsultants.com
|
CERTIFICATE OF QUALIFIED PERSON
Mathieu Bélisle, P.Eng.
This certificate applies to the NI 43-101 Technical
Report titled “Feasibility Study for the Cariboo Gold Project, District of Wells, British Columbia, Canada” (the “Technical
Report”), prepared for Osisko Development Corp., dated June 11, 2025, and effective as of April 25, 2025.
I, Mathieu Bélisle, P.Eng., as a co-author of the Technical
Report, do hereby certify that:
| 1. | I am a Metallurgist with the firm BBA Engineering Ltd., I am located at 990 route de
l’Église, Suite 590, Québec, QC, G1V 3V7, Canada. |
| 2. | I am a graduate of Laval University, with a Bachelor of Engineering in Metallurgy and Materials in
2002. |
| 3. | I am a member of the Ordre des Ingénieurs du Québec (OIQ 128549), Professional
Engineers of Ontario (PEO 10210546), and the Engineers and Geoscientists of British-Colombia (EGBC 49319). |
| 4. | My relevant experience includes 20 years of experience working for mining operations and engineering
consultants. I have been involved in numerous projects requiring detailed engineering design and produced several studies for the
mining industry. |
| 5. | I have read the definition of “qualified person” set out in the NI 43-101 –
Standards of Disclosure for Mineral Projects (“NI 43-101”) and certify that, by reason of my education, affiliation with
a professional association, and past relevant work experience, I fulfill the requirements to be a qualified person for the
purposes of NI 43-101. |
| 6. | I am independent of the issuer applying all the tests in Section 1.5 of NI 43-101. |
| 7. | I am author and responsible for the preparation of Chapters 13 and 17, and Sections 21.1.4.8,
21.1.5.9, and 21.2.5. I am also co-author for the relevant portions of Chapters 1, 2, 25, 26 and 27 of the Technical Report. |
| 8. | I have not visited the Cariboo Property that is the subject of the Technical Report. |
| 9. | I have prior involvement with the Property that is the subject of the Technical Report as I was a
qualified person for the Preliminary Economic Assessment (“PEA”) report for the Cariboo Gold Project prepared for
Barkerville Gold Mines Ltd. dated August 18, 2019, for the PEA report prepared for Osisko Development Corp. dated May 24,
2022, and for the Feasibility Study report prepared for Osisko Development Corp., dated January 10, 2023 and amended
January 12, 2023. |
| 10. | I have read NI 43-101 and the sections of the Technical Report for which I am responsible have been
prepared following NI 43-101 rules and regulations. |
| 11. | As at the effective date of the Technical Report, to the best of my knowledge, information and
belief, the sections of the Technical Report for which I am responsible contain all scientific and technical information that is
required to be disclosed to make the portions of the Technical Report for which I am responsible not misleading. |
Signed and sealed this 11th
day of June 2025.
| Signed
and sealed on file |
|
| Mathieu
Bélisle, P.Eng. |
|
|
1050 West Pender Street, Suite 800
Vancouver,
BC, V6E 3S7
T +1 604.661.2111
BBAconsultants.com
|
CERTIFICATE OF QUALIFIED PERSON
Amanda Fitch, P.Eng.
This certificate applies to the NI 43-101 Technical
Report titled “Feasibility Study for the Cariboo Gold Project, District of Wells, British Columbia, Canada” (the “Technical
Report”), prepared for Osisko Development Corp., dated June 11, 2025, and effective as of April 25, 2025.
I, Amanda Fitch, P.Eng., as a co-author of the Technical Report, do
hereby certify that:
| 1. |
I
am Regional Director – Mining and Metals Market with the firm BBA Engineering Ltd., I am located at 1050 West Pender Street,
Suite 800, Vancouver, BC V6E 3S7, Canada. |
| |
|
| 2. |
I
am a graduate of McGill University, with a Bachelor of Engineering in Mining in 2010. |
| |
|
| 3. |
I
am a member of the Engineers and Geoscientists of British-Columbia (EGBC 176727), the Ordre des Ingénieurs du Québec
(OIQ 5016750), and the Nevada State Board of Professional Engineers & Land Surveyors (NVBPELS 025156) |
| |
|
| 4. |
My
relevant experience includes 15 years of experience working for engineering consultants, and mining operations. I have been involved
in numerous Preliminary Economic Assessments, Prefeasibility and Feasibility Studies for the mining industry. |
| |
|
| 5. |
I
have read the definition of “qualified person” set out in the NI 43-101 – Standards of Disclosure for Mineral Projects
(“NI 43-101”) and certify that, by reason of my education, affiliation with a professional association, and past relevant
work experience, I fulfill the requirements to be a qualified person for the purposes of NI 43-101. |
| |
|
| 6. |
I
am independent of the issuer applying all the tests in Section 1.5 of NI 43-101. |
| |
|
| 7. |
I
am responsible for the following chapters and sections: 1, 2, 3.2, 18, 18.1, 18.2, 18.2.1, 18.2.1.1, 18.3, 18.3.5, 18.3.5.4, 18.3.6,
18.3.6.7, 18.3.6.9, 18.4, 19, 21, 21.1, 21.1.1, 21.1.2, 21.1.2.1, 21.1.2.2, 21.1.3, 21.1.4, 21.1.4.6, 21.1.4.10, 21.1.4.11, 21.1.5,
21.1.5.6, 21.1.5.7, 21.2, 21.2.1, 21.2.2, 21.2.7, 21.2.8, 22, 25, 26 and 27. |
| |
|
| 8. |
I
have visited the proposed Mine Site Complex in Wells and the Bonanza Ledge site on November 8, 2024. |
| |
|
| 9. |
I
have prior involvement with the property that is the subject of the Technical Report. I was the lead integrating engineer for the
Preliminary Economic Assessment (“PEA”) report for the Cariboo Gold Project prepared for Barkerville Gold Mines Ltd.
dated August 18, 2019, for the PEA report prepared for Osisko Development Corp. dated May 24, 2022, and for the Feasibility
Study report prepared for Osisko Development Corp., dated January 10, 2023 and amended January 12, 2023. |
| |
|
| 10. |
I
have read NI 43-101 and the sections of the Technical Report for which I am responsible have been prepared following NI 43-101 rules and
regulations. |
| |
|
| 11. |
As
at the effective date of the Technical Report, to the best of my knowledge, information and belief, the sections of the Technical
Report for which I am responsible contain all scientific and technical information that is required to be disclosed to make the portions
of the Technical Report for which I am responsible not misleading. |
Signed and sealed this 11th
day of June 2025.
| Signed
and sealed on file |
|
| Amanda Fitch, P.Eng. |
|
 |
Alius Mine Consulting
info@aliusmining.com
www.aliusmining.com
|
CERTIFICATE OF QUALIFIED PERSON
Sebastien Guido, P.Eng., M.Sc.
This certificate applies to the NI 43-101 Technical
Report titled “Feasibility Study for the Cariboo Gold Project, District of Wells, British Columbia, Canada” (the “Technical
Report”), prepared for Osisko Development Corp., dated June 11, 2025, and effective as of April 25, 2025.
I, Sebastien Guido, P.Eng., M.Sc., as a co-author of the Technical
Report, do hereby certify that:
| 1. |
I am a Senior Engineer, Rock Mechanics with Alius Mine Consulting Inc., located at 985 rue du Mont-Saint-Denis, Quebec City, Québec, Canada, G1S 1B4. |
| |
|
| 2. |
I am a graduate of Université Laval (Bachelor of Engineering) in Mining Engineering. I also obtained a Master of Science from the same university. |
| |
|
| 3. |
I am a member of the Ordre des ingénieurs du Québec (OIQ No. 5067847) and Engineers and Geoscientists British Columbia (EGBC No. 53592). |
| |
|
| 4. |
My relevant experience includes ten years in various roles, including a site geotechnical engineer, a consulting engineer and in academia (undergraduate level). I have actively worked as a geotechnical engineer since 2015. |
| |
|
| 5. |
I have read the definition of “qualified person” set out in the NI 43-101 – Standards of Disclosure for Mineral Projects (“NI 43-101”) and certify that, by reason of my education, affiliation with a professional association, and past relevant work experience, I fulfill the requirements to be a qualified person for the purposes of NI 43-101. |
| |
|
| 6. |
I am independent of the issuer applying all the tests in Section 1.5 of NI 43-101. |
| |
|
| 7. |
I am author and responsible for Section 16.2. I am also co-author of the relevant portions of Chapters 1, 2, 25, 26 and 27 of the Technical Report. |
| |
|
| 8. |
I have visited the Cariboo Property that is the subject of the Technical Report, on January 20 and 21, 2025 as part of this current mandate. |
| |
|
| 9. |
I have had prior involvement with the Cariboo Project that is the subject of the Technical Report as I supported the mine during the construction of the Cow Portal, the underground development and bulk sample associated with the Lowhee Zone. I have also supported the mine engineering team at Bonanza Ledge from July 2021 to August 2024. |
| |
|
| 10. |
I have read NI 43-101 and the sections of the Technical Report for which I am responsible have been prepared following NI 43-101 rules and regulations. |
| |
|
| 11. |
As at the effective date of the Technical Report, to the best of my knowledge, information and belief, the sections of the Technical Report for which I am responsible contain all scientific and technical information that is required to be disclosed to make the portions of the Technical Report for which I am responsible not misleading. |
Signed and sealed this 11th
day of June 2025.
| Signed
and sealed on file |
|
| Sebastien Guido, P.Eng., M. Sc. |
|

CERTIFICATE OF QUALIFIED PERSON
Philip Clark, P.Eng.
This certificate applies to the NI 43-101 Technical
Report titled “Feasibility Study for the Cariboo Gold Project, District of Wells, British Columbia, Canada” (the “Technical
Report”), prepared for Osisko Development Corp., dated June 11, 2025, and effective as of April 25, 2025.
I, Philip Clark, P.Eng., as a co-author of the Technical Report, do
hereby certify that:
| 1. |
I am employed as a senior transmission line engineer/VP, Operations with the firm Clean Energy Consulting Inc., located at 640 - 650 West Georgia St, Vancouver, BC V6B 4N8, Canada. |
| |
|
| 2. |
I am a graduate of the University of Canterbury, Christchurch, New Zealand with a Bachelor of Mechanical Engineering (with Honours), 2007. |
| |
|
| 3. |
I am a member of I am a member of Engineers and Geoscientists BC (EGBC), registration #46421 |
| |
|
| 4. |
My relevant experience includes more than 15 years in the areas of transmission lines and power supply. I have been directly involved in all levels of engineering studies from conceptual designs, preliminary economic assessments (PEAs), pre-feasibility studies, feasibility studies, and detailed design on various projects. |
| |
|
| 5. |
I have read the definition of “qualified person” set out in the NI 43-101 – Standards of Disclosure for Mineral Projects (“NI 43-101”) and certify that, by reason of my education, affiliation with a professional association, and past relevant work experience, I fulfill the requirements to be a qualified person for the purposes of NI 43-101. |
| |
|
| 6. |
I am independent of the issuer applying all the tests in Section 1.5 of NI 43-101. |
| |
|
| 7. |
I am author and responsible for the preparation of Section(s) 18.3.6.6, 18.4.2, 21.2.4, and coauthor for the relevant portions of Chapters 1, 2, 25, 26 and 27 of the Technical Report. |
| |
|
| 8. |
I have not visited the Property that is the subject of the Technical Report, as it was not required for the purpose of this mandate. |
| |
|
| 9. |
I have had no prior involvement with the Property that is the subject of the Technical Report. I have read NI 43-101 and the sections of the Technical Report for which I am responsible have been prepared following NI 43-101 rules and regulations. |
| |
|
| 10. |
As at the effective date of the Technical Report, to the best of my knowledge, information and belief, the sections of the Technical Report for which I am responsible contain all scientific and technical information that is required to be disclosed to make the portions of the Technical Report for which I am responsible not misleading. |
Signed and sealed this 11th
day of June 2025.
| Signed
and sealed on file |
|
| Philip Clark, P.Eng. |
|

CERTIFICATE OF QUALIFIED PERSON
Rob Griffith, P.Eng.
This certificate applies to the NI 43-101 Technical
Report titled “Feasibility Study for the Cariboo Gold Project, District of Wells, British Columbia, Canada” (the “Technical
Report”), prepared for Osisko Development Corp., dated June 11, 2025, and effective as of April 25, 2025.
I, Rob Griffith, P.Eng., as a co-author of the Technical Report, do
hereby certify that:
| 1. |
I am a sub-consultant to the firm Falkirk Environmental Consultants Ltd., located at 1199 West Hastings St, Vancouver, BC, V6E 3T5. |
| |
|
| 2. |
I graduated with a bachelor's degree in water resources engineering from the University of Guelph in 2002. |
| |
|
| 3. |
I am a practising member of Engineers and Geoscientists BC (EGBC), licence number 32112. |
| |
|
| 4. |
I have over 20 years of experience in consulting for the mining industry. Relevant experience includes hydrologic and meteorological site characterization, water management planning, hydraulic design, water balance modelling and water quality modelling. |
| |
|
| 5. |
I have read the definition of “qualified person” set out in the NI 43-101 – Standards of Disclosure for Mineral Projects (“NI 43-101”) and certify that, by reason of my education, affiliation with a professional association, and past relevant work experience, I fulfill the requirements to be a qualified person for the purposes of NI 43-101. |
| |
|
| 6. |
I am independent of the issuer applying all the tests in Section 1.5 of NI 43-101. |
| |
|
| 7. |
I am author and responsible for Sections 16.3, 18.3.2 and 20.3.3.1. I am also co-author for the relevant portions of Chapters 1, 2, 25, 26 and 27 of the Technical Report. |
| |
|
| 8. |
I have not visited the Property that is the subject of the Technical Report, as it was not required for the purpose of this mandate. |
| |
|
| 9. |
I have had prior involvement with the Property that is the subject of the Technical Report as I have participated on previous reports titled: |
| |
· |
Bonanza Ledge Mine, Water Balance and Water Quality Model 2022 Update – Round Two, Prepared by Mavin Terra Solutions. Prepared for Barkerville Gold Mines Ltd. December 31, 2022. |
| |
|
|
| |
· |
Bonanza
Ledge Mine, Post Closure Water Balance and Water Quality Model Validation Plan, Prepared by Mavin Terra Solutions. Prepared for Barkerville
Gold Mines Ltd. December 31, 2022. |
| 10. |
I
have read NI 43-101 and the sections of the Technical Report for which I am responsible have been prepared following NI 43-101 rules and
regulations. |
| |
|
| 11. |
As
at the effective date of the Technical Report, to the best of my knowledge, information and belief, the sections of the Technical
Report for which I am responsible contain all scientific and technical information that is required to be disclosed to make the portions
of the Technical Report for which I am responsible not misleading. |
Signed and sealed this 11th
day of June 2025.
| Signed
and sealed on file |
|
| Rob Griffith, P.Eng. |
|
FALKIRK ENVIRONMENTAL CONSULTANTS LTD.
Suite 250, 1199 West Hastings Street,
Vancouver, BC V6E 3T5
T 604.336.6066 |
E info@falkirk.ca | W Falkirk.ca

CERTIFICATE OF QUALIFIED PERSON
Katherine Mueller, P.Eng.
This certificate applies to the NI 43-101 Technical
Report titled “Feasibility Study for the Cariboo Gold Project, District of Wells, British Columbia, Canada” (the “Technical
Report”), prepared for Osisko Development Corp., dated June 11, 2025, and effective as of April 25, 2025.
I, Katherine Mueller, P.Eng., as a co-author of the Technical Report,
do hereby certify that:
| 1. |
I am a Professional Engineer with the firm Falkirk Environmental Consultants Ltd., located at 378 Esplanade E, North Vancouver, BC V7L
1A4. |
| |
| 2. |
I am a graduate of University of Saskatchewan, with a BSc in Engineering. |
| |
| 3. |
I am a practising member of Engineers and Geoscientists BC, membership #40116. |
| |
| 4. |
I have 26 years' experience as an engineer. My relevant experience includes environmental and regulatory compliance management for mining
operations, including comprehensive expertise in environmental assessment and mine permitting in British Columbia. |
| |
| 5. |
I have read the definition of “qualified person” set out in the NI 43-101 – Standards of Disclosure for Mineral Projects
(“NI 43-101”) and certify that, by reason of my education, affiliation with a professional association, and past relevant
work experience, I fulfill the requirements to be a qualified person for the purposes of NI 43-101. |
| |
| 6. |
I am independent of the issuer applying all the tests in Section 1.5 of NI 43-101. |
| |
| 7. |
I am author and responsible for the preparation of Sections 4.6, 4.7, and Chapter 20, except Sections 20.3.1 and 20.3.2. I am also co-author
of the relevant portions of Chapters 1, 2, 25, 26 and 27 of the Technical Report. |
| |
| 8. |
I have visited the Cariboo Property that is the subject of the Technical Report, on June 15 and 16, 2022. |
| |
| 9. |
I have prior involvement with the Property that is the subject of the Technical Report. I was a qualified person for the Preliminary
Economic Assessment report for the Cariboo Gold Project prepared for Osisko Development Corp., dated May 24, 2022, and for the Feasibility
Study report prepared for Osisko Development Corp., dated January 10, 2023 and amended January 12, 2023. |
| |
| 10. |
I have read NI 43-101 and the sections of the Technical Report for which I am responsible have been prepared following NI 43-101 rules and
guidelines. |
| |
| 11. |
As at the effective date of the Technical Report, to the best of my knowledge, information and belief, the sections of the Technical
Report for which I am responsible contain all scientific and technical information that is required to be disclosed to make the portions
of the Technical Report for which I am responsible not misleading. |
Signed and sealed this 11th
day of June 2025.
| Signed and sealed on file |
|
| Katherine Mueller, P.Eng. |
|
FALKIRK
ENVIRONMENTAL CONSULTANTS LTD.
Suite 250,
1199 West Hastings Street, Vancouver, BC V6E 3T5
T 604.336.6066
| E info@falkirk.ca | W Falkirk.ca
CERTIFICATE OF QUALIFIED PERSON
Nikolay Sidenko, P.Geo.
This certificate applies to the NI 43-101 Technical
Report titled “Feasibility Study for the Cariboo Gold Project, District of Wells, British Columbia, Canada” (the “Technical
Report”), prepared for Osisko Development Corp., dated June 11, 2025, and effective as of April 25, 2025.
I, Nikolay Sidenko, P.Geo., as a co-author of the Technical Report,
do hereby certify that:
| 1. |
I am a Principal Geochemist with the firm Falkirk Environmental Consultants Ltd., located at 1199 West Hastings St, Vancouver, BC, V6E
3T5. |
| |
| 2. |
I am a graduate of Novosibirsk State University (Russia) with a Master of Science degree in geochemistry |
| |
| 3. |
I am a practising member of the Association of Professional Engineers and Geoscientists of British Columbia (Member #45969). |
| |
| 4. |
My relevant experience includes 29 years of combined academic and consulting experience in geochemistry of mine waste and acid rock drainage. |
| |
| 5. |
I have read the definition of “qualified person” set out in the NI 43-101 – Standards of Disclosure for Mineral Projects
(“NI 43-101”) and certify that, by reason of my education, affiliation with a professional association, and past relevant
work experience, I fulfill the requirements to be a qualified person for the purposes of NI 43-101. |
| |
| 6. |
I am independent of the issuer applying all the tests in Section 1.5 of NI 43-101. |
| |
| 7. |
I am author and responsible for Section 20.3.1, 20.3.2., 20.3.3.2., and co-author for the relevant portions of Chapters 1, 2, 25,
26 and 27 of the Technical Report. |
| |
| 8. |
I have not visited the property that is the subject of the Technical Report as it was not required for the purpose of this mandate. |
| |
| 9. |
I have had no prior involvement with the property that is the subject of the Technical Report. |
| |
| 10. |
I have read NI 43-101 and the sections of the Technical Report for which I am responsible have been prepared following NI 43-101 rules and
regulations. |
| |
| 11. |
As at the effective date of the Technical Report, to the best of my knowledge, information and belief, the sections of the Technical
Report for which I am responsible contain all scientific and technical information that is required to be disclosed to make the portions
of the Technical Report for which I am responsible not misleading. |
Signed and sealed this 11th
day of June 2025.
| Signed and sealed on file |
|
| Nikolay Sidenko, P.Geo. |
|
FALKIRK ENVIRONMENTAL CONSULTANTS
LTD.
Suite 250, 1199 West
Hastings Street, Vancouver, BC V6E 3T5
T 604.336.6066 |
E info@falkirk.ca | W Falkirk.ca
 |
|
Head Office - Val-d’Or
560, 3e Avenue
Val-d’Or
(Quebec) J9P 1S4 |
| |
|
|
| Quebec Office |
Montreal Office |
Phone: 819.874-0447 |
| 725, boul. Lebourgneuf |
859, boul. Jean-Paul-Vincent |
Toll free: 866.749-8140 |
| Suite 310-12 |
Suite 201 |
Email: info@innovexplo.com |
| Quebec (Quebec) G2J 0C4 |
Longueuil (Quebec) J4G 1R3 |
Website: www.innovexplo.com |
| |
|
|
CERTIFICATE OF QUALIFIED PERSON
Eric Lecomte, P.Eng.
This certificate applies to the NI 43-101 Technical
Report titled “Feasibility Study for the Cariboo Gold Project, District of Wells, British Columbia, Canada” (the “Technical
Report”), prepared for Osisko Development Corp., dated June 11, 2025, and effective as of April 25, 2025.
I, Eric Lecomte, P.Eng., as a co-author of the Technical Report, do
hereby certify that:
| 1. |
I am a Senior Engineer at InnovExplo Inc., 560 3e Avenue, Val-d’Or, Québec, Canada, J9P 1S4. |
| |
| 2. |
I am a graduate from Laval University, Québec, Canada with a Bachelor's degree in Mining Engineering in 1998. |
| |
| 3. |
I am a Professional Engineer registered with the Ordre des ingénieurs du Québec (OIQ Licence: 122047), Professional Engineers
of Ontario (PEO 100574333), and Professional Engineers and Geoscientists of British-Colombia (EGBC 56488). |
| |
| 4. |
I have worked as Mine Engineer for a total of twenty-four (24) years since graduating from university. My expertise was acquired while
working as a mining engineer. During these years, I have occupied different positions, both technical and operational, related to
mining engineering, and this, in underground operations as well as in open pit |
| |
| 5. |
I have read the definition of “qualified person” set out in the NI 43-101 – Standards of Disclosure for Mineral Projects
(“NI 43-101”) and certify that, by reason of my education, affiliation with a professional association, and past relevant
work experience, I fulfill the requirements to be a qualified person for the purposes of NI 43-101. |
| |
| 6. |
I am independent of the issuer applying all the tests in Section 1.5 of NI 43-101. |
| |
| 7. |
I am author and responsible of Chapter 15 and Sections 14.12, 16.1, 16.4, 16.5, 16.8, 16.9, 16.10 and Sections 21.1.4.1, 21.1.5.1, 21.1.5.8,
21.2.3 (except for 21.2.3.10). . I am also co-author for the relevant portions of Chapters 1, 2, 25, 26 and 27 of the Technical Report. |
| |
| 8. |
I have visited the Cariboo Project that is the subject of the Technical Report, on February 25, 2022 and on September 11, 2024. |
| |
| 9. |
I have prior involvement with the property as I was a qualified person for the Preliminary Economic Assessment report for the Cariboo
Gold Project prepared for Osisko Development Corp. and dated May 24, 2022, and the Feasibility Study for the Cariboo Gold Project
dated January 10, 2023, and amended January 12, 2023. |
| |
| 10. |
I have read NI 43-101 and the sections of the Technical Report for which I am responsible have been prepared following NI 43-101 rules and
regulations. |
| |
| 11. |
As at the effective date of the Technical Report, to the best of my knowledge, information and belief, the sections of the Technical
Report for which I am responsible contain all scientific and technical information that is required to be disclosed to make the portions
of the Technical Report for which I am responsible not misleading. |
Signed and sealed this 11th
day of June 2025.
| Signed and sealed on file |
|
| Eric Lecomte, P.Eng. |
|
|
|
Head Office - Val-d’Or
560, 3e Avenue
Val-d’Or
(Quebec) J9P 1S4 |
| |
|
|
| Quebec Office |
Montreal Office |
Phone: 819.874-0447 |
| 725, boul. Lebourgneuf |
859, boul. Jean-Paul-Vincent |
Toll free: 866.749-8140 |
| Suite 310-12 |
Suite 201 |
Email: info@innovexplo.com |
| Quebec (Quebec) G2J 0C4 |
Longueuil (Quebec) J4G 1R3 |
Website: www.innovexplo.com |
| |
|
|
CERTIFICATE OF QUALIFIED PERSON
Carl Pelletier, P.Geo.
This certificate applies to the NI 43-101 Technical
Report titled “Feasibility Study for the Cariboo Gold Project, District of Wells, British Columbia, Canada” (the “Technical
Report”), prepared for Osisko Development Corp., dated June 11, 2025, and effective as of April 25, 2025.
I, Carl Pelletier, P.Geo., as a co-author of the Technical Report,
do hereby certify that:
| 1. |
I am the Director of Mining at InnovExplo Inc., 560 3e Avenue, Val-d’Or, Québec, Canada, J9P 1S4. |
| |
| 2. |
I graduated with a Bachelor’s degree in Geology (B.Sc.) from Université du Québec à Montréal (Montréal,
Québec) in 1992, and I initiated a Master's degree at the same university for which I completed the course program but not the
thesis. |
| |
| 3. |
I am a member of the Ordre des Géologues du Québec (OGQ, no. 384), the Association of Professional Geoscientists of Ontario
(APGO, no. 1713), the Association of Professional Engineers and Geoscientists of British Columbia (APEGBC, no. 43167) and of the Canadian
Institute of Mines (CIM). |
| |
| 4. |
My relevant experience includes a total of 31 years since my graduation from university. My mining expertise has been acquired at the
Silidor, Sleeping Giant, Bousquet II, Sigma-Lamaque and Beaufor mines. My exploration experience has been acquired with Cambior Inc.
and McWatters Mining Inc. I have been a consulting geologist for InnovExplo Inc. since February 2004 where I contributed to multiple
mandates of mineral resources estimation. I have relevant experience in various types of mineral deposits: precious metals (Au, Ag),
base metals (Cu, Zn, Ni), industrial and high technology (graphite, Li, Be, Ta, U, Sc and REE) as well as for different types of operations
(underground and open pit mines). |
| |
| 5. |
I have read the definition of “qualified person” set out in the NI 43-101 – Standards of Disclosure for Mineral Projects
(“NI 43-101”) and certify that, by reason of my education, affiliation with a professional association, and past relevant
work experience, I fulfill the requirements to be a qualified person for the purposes of NI 43-101. |
| |
| 6. |
I am independent of the issuer applying all the tests in Section 1.5 of NI 43-101 |
| |
| 7. |
I am author and responsible for the following Chapters and Sections: 3.1 and 23. I am co-author and share responsibility on Chapters
and Sections 4.1 to 4.5, 5 through 12 and 14 except 14.12. I am also co-author for the relevant portions of Chapters 1, 2, 25, 26 and
27. |
| |
| 8. |
I have visited the Cariboo Project on two different occasions, February 1-4, 2016 and on May 3-12, 2016. |
| |
| 9. |
I have prior involvement with the Property that is the subject of the Technical Report. I was a qualified person for the NI 43-101 Technical
Report for the Cariboo Gold Project and Mineral Resource Estimate (“MRE”) on the Barkerville Mountain Deposit dated May 16,
2017, the NI 43-101 Technical Report and MRE Update for the Cariboo Gold Project dated June 14, 2018, the NI 43-101 Technical Report
and MRE Update for the Cariboo Gold Project dated July 11, 2019, the Preliminary Economic Assessment (“PEA”) report
for the Cariboo Gold Project prepared for Barkerville Gold Mines Ltd. dated August 18, 2019, the PEA report prepared for Osisko
Development Corp. dated May 24, 2022, and the Feasibility Study for the Cariboo Gold Project dated January 10, 2023 and amended
January 12, 2023. |
| |
| 10. |
I have read NI 43-101 and the sections of the Technical Report for which I am responsible have been prepared following NI 43-101 rules and
regulations. |
| |
| 11. |
As at the effective date of the Technical Report, to the best of my knowledge, information and belief, the sections of the Technical
Report for which I am responsible contain all scientific and technical information that is required to be disclosed to make the portions
of the Technical Report for which I am responsible not misleading. |
Signed and sealed this 11th
day of June 2025.
| Signed and sealed on file |
|
| Carl Pelletier, P.Geo. |
|
|
|
Head Office - Val-d’Or
560, 3e Avenue
Val-d’Or
(Quebec) J9P 1S4 |
| Quebec Office |
Montreal Office |
Phone: 819.874-0447 |
| 725, boul. Lebourgneuf |
859, boul. Jean-Paul-Vincent |
Toll free: 866.749-8140 |
| Suite 310-12 |
Suite 201 |
Email: info@innovexplo.com |
| Quebec (Quebec) G2J 0C4 |
Longueuil (Quebec) J4G 1R3 |
Website: www.innovexplo.com |
| |
|
|
CERTIFICATE OF QUALIFIED PERSON
Tessa Scott, P.Geo.
This certificate applies to the NI 43-101 Technical
Report titled “Feasibility Study for the Cariboo Gold Project, District of Wells, British Columbia, Canada” (the “Technical
Report”), prepared for Osisko Development Corp., dated June 11, 2025, and effective as of April 25, 2025.
I, Tessa Scott, P.Geo., as a co-author of the Technical Report, do
hereby certify that:
| 1. |
I am a Senior Resource Geologist with the firm InnovExplo Inc. located at 1245 Brickyard Rd g30, Salt Lake City, UT 84106, USA. |
| |
| 2. |
I am a graduate of Western Washington University with a bachelors in geology. |
| |
| 3. |
I am a practicing member of Engineers and Geoscientists BC, membership #169677. |
| |
| 4. |
My relevant experience includes 14 years as a geologist for mining operations and as a consultant. I have worked on numerous exploration
and mining projects, |
| |
| 5. |
I have read the definition of “qualified person” set out in the NI 43-101 – Standards of Disclosure for Mineral Projects
(“NI 43-101”) and certify that, by reason of my education, affiliation with a professional association, and past relevant
work experience, I fulfill the requirements to be a qualified person for the purposes of NI 43-101. |
| |
| 6. |
I am independent of the issuer applying all the tests in Section 1.5 of NI 43-101. |
| |
| 7. |
I am a co-author and share responsibility for the following Chapters and Sections: 4.1 to 4.5, 5 through 12, and 14 except 14.12. I am
also co-author for the relevant portions of Chapters 1, 2, 25, 26 and 27. |
| |
| 8. |
I have not visited the proposed Mine Site Complex in Wells and the Bonanza Ledge for the purpose of the Technical Report. |
| |
| 9. |
I have prior involvement with the Property that is the subject of the Technical Report. I was the chief resource geologist from 2017
to the end of 2021. I was involved in the 3D modeling and estimation for the NI 43-101 Technical Report and Mineral Resource Estimate
Update for the Cariboo Gold Project dated June 14, 2018, the NI 43-101 Technical Report and Mineral Resource Estimate Update for
the Cariboo Gold Project dated July 11, 2019, and the Preliminary Economic Assessment (“PEA”) report for the Cariboo
Gold Project prepared for Barkerville Gold Mines Ltd. dated August 18, 2019. |
| |
| 10. |
I have read NI 43-101 and the sections of the Technical Report for which I am responsible have been prepared following NI 43-101 rules and
regulations. |
| |
| 11. |
As at the effective date of the Technical Report, to the best of my knowledge, information and belief, the sections of the Technical
Report for which I am responsible contain all scientific and technical information that is required to be disclosed to make the portions
of the Technical Report for which I am responsible not misleading. |
Signed and sealed this 11th
day of June 2025.
| Signed and sealed on file |
|
| Tessa Scott, P.Geo. |
|

CERTIFICATE OF QUALIFIED PERSON
A.J. MacDonald, P.Eng.
This certificate applies to the NI 43-101 Technical
Report titled “Feasibility Study for the Cariboo Gold Project, District of Wells, British Columbia, Canada” (the “Technical
Report”), prepared for Osisko Development Corp., dated June 11, 2025, and effective as of April 25, 2025.
I, A.J. MacDonald, P.Eng., as a co-author of the Technical Report,
do hereby certify that:
| 1. | I am Vice President, Engineering / Senior Technical Specialist
with Integrated Sustainability Consultants Ltd., located at Suite 620 - 1050 West Pender Street, Vancouver BC, V6C 3S7, Canada. |
| 2. | I am a graduate of Queen’s University, Kingston, Canada
(B.Sc., 2005) and Carleton University, Ottawa, Canada (M.A.Sc., 2007). |
| 3. | I am a Professional Engineer, and member of Engineers and Geoscientists
British Columbia, Association of Professional Engineers and Geoscientists of Alberta, Association of Professional Engineers and Geoscientists
of Saskatchewan, Professional Engineers Ontario, Professional Engineers Yukon, Engineers and Geoscientists New Brunswick, Professional
Engineers and Geoscientists of Newfoundland and Labrador, and Nevada Board of Professional Engineers and Land Surveyors. |
| 4. | I have practiced my profession for 19 years. I have been involved
or associated with the mining industry since 2007. I have participated in dozens of mining and other resource sector projects, with a
particular focus on water treatment process engineering, primarily in Western North America. My experience spans all phases of project
delivery including preliminary analysis, conceptual design, detailed design, construction, commissioning and optimization of infrastructure
at industrial water treatment facilities in Canada and around the world. |
| 5. | I have read the definition of “qualified person”
set out in the NI 43-101 – Standards of Disclosure for Mineral Projects (“NI 43-101”) and certify that, by reason of
my education, affiliation with a professional association, and past relevant work experience, I fulfill the requirements to be a
qualified person for the purposes of NI 43-101. |
| 6. | I am independent of the issuer applying all the tests in Section 1.5
of NI 43-101. |
| 7. | I am author and responsible for Sections 18.3.5.2, 18.3.6.4,
21.1.4.5, 21.2.6. I am also co-author for the relevant portions of Chapters 1, 2, 25, 26 and 27 of the Technical Report. |
| 8. | I have not personally visited the Property that is the subject
of the Technical Report, as it was not required for the purpose of this mandate. |
| 9. | I have had prior involvement with the Property that is the subject
of the Technical Report as I have participated as qualified person on the previous report titled NI 43-101 Feasibility Study for the
Cariboo Gold Project prepared for Osisko Development Corp., dated January 10, 2023 and amended January 12, 2023. |
| 10. | I have read NI 43-101 and the sections of the Technical Report
for which I am responsible have been prepared following NI 43-101 rules and regulations. |
| 11. | As at the effective date of the Technical Report, to the best
of my knowledge, information and belief, the sections of the Technical Report for which I am responsible contain all scientific and technical
information that is required to be disclosed to make the portions of the Technical Report for which I am responsible not misleading. |
Signed and sealed this 11th
day of June 2025.
| Signed and sealed on file |
|
| A.J. MacDonald, P.Eng. |
|
 |
900-999, West Hastings St.
Vancouver, BC, V6C 2W2 |
CERTIFICATE OF QUALIFIED PERSON
Jean-François Maillé, P.Eng.
This certificate applies to the NI 43-101 Technical
Report titled “Feasibility Study for the Cariboo Gold Project, District of Wells, British Columbia, Canada” (the “Technical
Report”), prepared for Osisko Development Corp., dated June 11, 2025, and effective as of April 25, 2025.
I, Jean-François Maillé, P.Eng., as a co-author of the Technical Report, do hereby certify that:
| 1. | I am a Project Manager with JDS Energy & Mining Inc.,
located at 900-999, West Hastings St., Vancouver, BC. |
| 2. | I am a graduate of École de Technologie Superieure (ÉTS)
in Montreal, Québec. |
| 3. | I am a member in good standing of the Ordre des ingénieurs
du Québec (OIQ) member #143426. |
| 4. | I have 18 years of experience as a project manager. My relevant
experience includes mining construction and heavy civil projects. |
| 5. | I have read the definition of “qualified person”
set out in the NI 43-101 – Standards of Disclosure for Mineral Projects (“NI 43-101”) and certify that, by reason of
my education, affiliation with a professional association, and past relevant work experience, I fulfill the requirements to be a
qualified person for the purposes of NI 43-101. |
| 6. | I am independent of the issuer applying all the tests in Section 1.5
of NI 43-101. |
| 7. | I am responsible for the following chapters and sections 18.3.1,
18.3.5.3, 18.3.5.5, 18.3.6.1, 18.3.6.2, 18.3.6.3, 18.3.6.5, 18.3.6.8, 18.4.1, 21.1.2.3, 21.1.4.4, 21.1.4.7, 21.1.4.9, 21.1.5.4, 21.1.5.5,
21.3, 24. I am also co-author of the relevant portions of Chapters 1, 2, 25, 26, 27. |
| 8. | I have visited the proposed Mine Site Complex in Wells and the
Bonanza Ledge Site on October 21 and 22, 2024. This site visit was intended as a refresher after having previously carried out field
work at the Bonanza Ledge site from January to September 2021 that is the subject of the Technical Report. |
| 9. | I have prior involvement with the Property that is the subject
of the Technical Report, as I was a qualified person for the NI 43_101 Feasibility Study for the Cariboo Gold Project prepared for Osisko
Development Corp., dated January 10, 2023 and amended January 12, 2023. I have been under contract by Barkerville Gold Mines
Ltd., wholly subsidiary of Osisko Development Corp. since 2021 to perform construction management on site. |
| 10. | I have read NI 43-101 and the sections of the Technical Report
for which I am responsible have been prepared following NI 43-101 rules and guidelines. |
| 11. | As at the effective date of the Technical Report, to the best
of my knowledge, information and belief, the sections of the Technical Report for which I am responsible contain all scientific and technical
information that is required to be disclosed to make the portions of the Technical Report for which I am responsible not misleading. |
Signed and sealed this 11th
day of June 2025.
| Signed and sealed on file |
|
| Jean-François Maillé, P.Eng. |
|

CERTIFICATE OF QUALIFIED PERSON
Yapo Allé-Ando, P.Eng.
This certificate applies to the NI 43-101 Technical
Report titled “Feasibility Study for the Cariboo Gold Project, District of Wells, British Columbia, Canada” (the “Technical
Report”), prepared for Osisko Development Corp., dated June 11, 2025, and effective as of April 25, 2025.
I, Yapo Allé-Ando, P.Eng., as a co-author of the Technical Report, do hereby certify that:
| 1. | I am Professional Engineer with M.A. O’Kane Consultants
Inc., located at 905C Industrial Road 2, V1C 4C9 Cranbrook, British Columbia, Canada. |
| 2. | I am a graduate of École Polytechnique Montréal,
with a Bachelor of Engineering in Engineering Physics in 2001 and of the University of British Columbia with a Master of Applied Science
in Civil Engineering in 2005. |
| 3. | I am a member of Engineers and Geoscientists BC (EGBC 39379),
Engineers Yukon (4146) and Association of Professional and Geoscientists of Alberta (APEGA 320327). |
| 4. | My relevant experience includes over 20 years in the mining
industry with expertise on mine water management and water stewardship, including water strategy, policy, governance frameworks, management
standards, and sustainability development initiatives. My technical expertise includes climate and hydrology studies, infrastructure
design, water balance modelling, and mine water management planning. |
| 5. | I have read the definition of “qualified person”
set out in the NI 43-101 – Standards of Disclosure for Mineral Projects (“NI 43-101”) and certify that, by reason of
my education, affiliation with a professional association, and past relevant work experience, I fulfill the requirements to be a
qualified person for the purposes of NI 43-101. |
| 6. | I am independent of the issuer applying all the tests in Section 1.5
of NI 43-101. |
| 7. | I am author and responsible for Sections 18.2.1.2 and 18.3.3
and 18.3.4. I am also co-author for the relevant portions of Chapters 1, 2, 25, 26 and 27 of the Technical Report. |
| 8. | I have visited the Mine Site Complex and Bonanza Ledge site
on October 2-3, 2024 as part of this current mandate. |
| 9. | I have had no prior involvement with the Property that is the
subject of the Technical Report. |
| 10. | I have read NI 43-101 and the sections of the Technical Report
for which I am responsible have been prepared following NI 43-101 rules and regulations. |
| 11. | As at the effective date of the Technical Report, to the best
of my knowledge, information and belief, the sections of the Technical Report for which I am responsible contain all scientific and technical
information that is required to be disclosed to make the portions of the Technical Report for which I am responsible not misleading. |
Signed and sealed this 11th
day of June 2025.
| Signed and sealed on file |
|
| Yapo Allé-Ando, P.Eng. |
|
M.A. O’Kane Consultants Inc.
CERTIFICATE OF QUALIFIED PERSON
Rachel Sawyer, P.Eng.
This certificate applies to the NI 43-101 Technical
Report titled “Feasibility Study for the Cariboo Gold Project, District of Wells, British Columbia, Canada” (the “Technical
Report”), prepared for Osisko Development Corp., dated June 11, 2025, and effective as of April 25, 2025.
I, Rachel Sawyer, P.Eng., as a co-author of the Technical Report, do
hereby certify that:
| 1. | I am a Professional Engineer with
M.A. O’Kane Consultants Inc., located at 700 – 1000 7th Ave SW, T2P 5L5, Calgary,
Alberta, Canada. |
| 2. | I am a graduate of the University of Saskatchewan, with a Bachelor
of Science in Geological Engineering in 1999. |
| 3. | I am a member of Engineers and Geoscientists BC (EGBC 58041),
Association of Professional Engineers and Geoscientists (APEGA 72617), Engineers Yukon (EY 3858), Professional Engineers Ontario (PEO
100636663), Northwest Territories and Nunavut Association of Professional Engineers and Geoscientists (NAPEG L5747). |
| 4. | My relevant experience includes over 25 years in the mine and
tailings industry in both consulting and directly for the operator. My experience spans from conceptual design through to construction,
operations, and closure of complex mine and tailings earthwork structures. I have led large field teams and integrated planning groups
responsible for the tactical haulage and construction plans through to the strategic life-of-mine plans. |
| 5. | I have read the definition of “qualified person”
set out in the NI 43-101 – Standards of Disclosure for Mineral Projects (“NI 43-101”) and certify that, by reason of
my education, affiliation with a professional association, and past relevant work experience, I fulfill the requirements to be a
qualified person for the purposes of NI 43-101. |
| 6. | I am independent of the issuer applying all the tests in Section 1.5
of NI 43-101. |
| 7. | I am author and responsible for the preparation of Sections
18.2.2 and 18.3.5.1. I am also co-author for the relevant portions of Chapters 1, 2, 25, 26 and 27 of the Technical Report. |
| 8. | I did not personally visit the Cariboo Property that is the
subject of the Technical Report. |
| 9. | I have had prior involvement with the Property that is the subject
of the Technical Report. I was a Qualified Person for the Cariboo Gold Project – Waste Rock Storage Facility Phase 1 Detailed Design
and Specifications prepared for Osisko Development Corp. dated October 23, 2024. |
| 10. | I have read NI 43-101 and the sections of the Technical Report
for which I am responsible have been prepared following NI 43-101 rules and regulations. |
| 11. | As at the effective date of the Technical Report, to the best
of my knowledge, information and belief, the sections of the Technical Report for which I am responsible contain all scientific and technical
information that is required to be disclosed to make the portions of the Technical Report for which I am responsible not misleading. |
Signed and sealed this 11th
day of June 2025.
| Signed and sealed on file |
|
| Rachel Sawyer, P.Eng. |
|
M.A. O’Kane Consultants Inc.
CERTIFICATE OF QUALIFIED PERSON PAUL GAUTHIER, P.Eng.
I, Paul Gauthier, P.Eng, state that:
| (a) | At the effective date of the Technical Report, I was a
Senior Principal Mining Engineer at: |
WSP Canada Inc.
1135, boulevard Lebourgneuf,
Quebec, QC, Canada, G2K 0M5
| (b) | This certificate applies to the technical report titled “Feasibility Study for the Cariboo Gold
Project, District of Wells, British Columbia, Canada” with an effective date of: Aprill 25, 2025 (the “Technical Report”). |
| (c) | I am a “qualified person” for the purposes of National Instrument 43-101 (“NI 43-101”).
My qualifications as a qualified person are as follows. I am a graduate of Laval University with a B. SC in Mining Engineering in 1977
and am registered with Ordre de Ingénieurs du Québec (OIQ #31178), Professional Engineer Ontario (PEO, #100080984) and Professional
Engineer and Geoscientist of BC (#56779). My relevant experience after graduation and over 45 years for the purpose of the Technical Report
includes working in the mining engineering operation departments in different roles for over 45 years in different commodities mines such
as base metal, gold and diamond. I have also managed multiple feasibility studies of simple and complex natures from scoping through feasibility
studies, detailed engineering, and mine development in Canada and USA. |
| (d) | The requirement for a site visit is not applicable to me. |
| (e) | I am responsible for Sections 16.6, 16.7, 21.1.4.2, 21.1.4.3, 21.1.5.2, 21.1.5.3, 21.2.3.10 of the Technical
Report, and co-author for the relevant portions of Chapters 1, 2, 25, 26 and 27. |
| (f) | I am independent of the issuer as described in section 1.5 of NI 43-101. |
| (g) | My prior involvement with the property that is the subject of the Technical Report is as follows. I was
a qualified person for the PEA report prepared for Osisko Development Corp. dated May 24, 2022, and for the Feasibility Study report
prepared for Osisko Development Corp., dated January 10, 2023, and amended January 12, 2023. |
| (g) | I have read NI 43-101 and the part of the Technical Report for which I am responsible has been prepared
in compliance with NI 43-101; and |
| (h) | At the effective date of the Technical Report, to the best of my knowledge, information, and belief, the
parts of Technical Report for which I am responsible, contains all scientific and technical information that is required to be disclosed
to make the Technical Report not misleading. |
Dated in Quebec City, Quebec, this 11th
of June 2025
| Signed and sealed on file |
|
| |
[Professional Seal or Stamp] |
| [Signature of Qualified Person] |
|
| |
|
| |
|
Paul Gauthier, P.Eng. Professional Engineer and Geoscientist of BC
(#56779)
QP Certificate_WSP_GAUTHIER Paul_ODV Cariboo FS 2025_SEDAR+
| |
Osisko Development Corp.
NI 43-101 Technical Report
Feasibility Study for the Cariboo Gold Project |
|
TABLE OF CONTENTS
| 1. |
Summary |
1-1 |
| |
1.1 |
Contributors |
1-3 |
| |
1.2 |
Key Project Outcomes |
1-5 |
| |
1.3 |
Summary of Changes from 2023 Feasibility Study |
1-6 |
| |
1.4 |
Property Description and Ownership |
1-8 |
| |
1.5 |
Geology and Mineralization |
1-9 |
| |
1.6 |
Status of Exploration and Drilling |
1-10 |
| |
1.7 |
Mineral Resource Estimate |
1-11 |
| |
1.8 |
Mineral Reserve Estimate |
1-14 |
| |
1.9 |
Mining Methods |
1-16 |
| |
|
1.9.1 |
Overview |
1-16 |
| |
|
1.9.2 |
Geotechnical Evaluation |
1-16 |
| |
|
1.9.3 |
Hydrogeology |
1-17 |
| |
|
1.9.4 |
Mining Method Description |
1-17 |
| |
|
1.9.5 |
Mine Design |
1-17 |
| |
|
1.9.6 |
Development Schedule |
1-18 |
| |
|
1.9.7 |
Underground Electrical Distribution and Communication |
1-18 |
| |
|
1.9.8 |
Mine Automation and Monitoring Systems |
1-19 |
| |
|
1.9.9 |
Ventilation |
1-19 |
| |
|
1.9.10 |
Production Rate |
1-19 |
| |
|
1.9.11 |
Production Plan |
1-19 |
| |
|
1.9.12 |
Mine Equipment and Personnel |
1-20 |
| |
1.10 |
Underground Infrastructure |
1-21 |
| |
|
1.10.1 |
Underground Materials Handling System |
1-21 |
| |
|
1.10.2 |
Paste Pumping Network |
1-21 |
| |
1.11 |
Mineral Processing and Metallurgical Testing |
1-22 |
| |
1.12 |
Recovery Methods |
1-22 |
| |
1.13 |
Project Infrastructure |
1-23 |
| |
|
1.13.1 |
Waste Management |
1-23 |
| |
|
1.13.2 |
Water Management |
1-23 |
| |
|
1.13.3 |
Water Treatment Plant |
1-24 |
| |
|
1.13.4 |
Water Treatment Conveyance Infrastructure |
1-25 |
| |
|
1.13.5 |
Substation and On-site Distribution |
1-25 |
| |
|
1.13.6 |
Mine Site Infrastructure |
1-25 |
| |
1.14 |
Environmental and Permitting |
1-26 |
| |
|
1.14.1 |
Regulatory Context and Environmental Studies |
1-26 |
| |
|
1.14.2 |
Considerations of Social and Community Impacts |
1-26 |
| |
Osisko Development Corp.
NI 43-101 Technical Report
Feasibility Study for the Cariboo Gold Project |
|
| |
|
1.14.3 |
Mine Reclamation and Closure Plan |
1-27 |
| |
1.15 |
Capital and Operating Costs Estimates |
1-27 |
| |
|
1.15.1 |
Capital Costs |
1-27 |
| |
|
1.15.2 |
Operating Costs |
1-29 |
| |
1.16 |
Project Economics |
1-29 |
| |
1.17 |
Project Schedule and Organization |
1-33 |
| |
1.18 |
Interpretations and Conclusions |
1-34 |
| |
|
1.18.1 |
Risks and Opportunities |
1-35 |
| |
1.19 |
Recommendations |
1-37 |
| 2. |
Introduction |
2-1 |
| |
2.1 |
Barkerville Gold Mines Division |
2-1 |
| |
2.2 |
Basis of Technical Report |
2-1 |
| |
2.3 |
Report Responsibility and Qualified Persons |
2-2 |
| |
2.4 |
Effective Dates and Declaration |
2-5 |
| |
2.5 |
Sources of Information |
2-5 |
| |
|
2.5.1 |
General |
2-5 |
| |
|
2.5.2 |
BBA Engineering Ltd. |
2-6 |
| |
|
2.5.3 |
Alius Mine Consulting Inc. |
2-7 |
| |
|
2.5.4 |
Clean Energy Consulting Inc. |
2-7 |
| |
|
2.5.5 |
Falkirk Environmental Consultants Ltd. |
2-7 |
| |
|
2.5.6 |
InnovExplo Inc. |
2-8 |
| |
|
2.5.7 |
Integrated Sustainability |
2-9 |
| |
|
2.5.8 |
JDS Energy & Mining Inc. |
2-9 |
| |
|
2.5.9 |
M.A. O’Kane Consultants Inc. |
2-10 |
| |
|
2.5.10 |
WSP Canada Inc. |
2-10 |
| |
2.6 |
Site Visits |
2-10 |
| |
2.7 |
Currency, Units of Measurement, and Calculations |
2-13 |
| |
2.8 |
Acknowledgement |
2-13 |
| 3. |
Reliance on Other Experts |
3-1 |
| |
3.1. |
Mineral Tenure and Surface Rights |
3-1 |
| |
3.2. |
Taxation and Royalties |
3-1 |
| 4. |
Property Description and Location |
4-1 |
| |
4.1. |
Mineral Title Status |
4-3 |
| |
4.2. |
Acquisition of the Cariboo Gold Project |
4-7 |
| |
4.3. |
Royalties and Ownership |
4-8 |
| |
4.4. |
Surface Rights Option Agreements |
4-9 |
| |
Osisko Development Corp.
NI 43-101 Technical Report
Feasibility Study for the Cariboo Gold Project |
|
| |
4.5. |
Statutory Obligations |
4-12 |
| |
|
4.5.1. |
Environmental Liabilities |
4-12 |
| |
|
4.5.2. |
Required Permits and Status |
4-12 |
| |
4.6. |
Communication and Consultation with the Community |
4-16 |
| |
|
4.6.1. |
Indigenous Nations |
4-16 |
| |
|
4.6.2. |
Stakeholders |
4-16 |
| 5. |
Accessibility, Climate, Local Resources, Infrastructure and Physiography |
5-1 |
| |
5.1 |
Accessibility |
5-1 |
| |
5.2 |
Infrastructure and Local Resources |
5-1 |
| |
5.3 |
Climate |
5-3 |
| |
5.4 |
Physiography |
5-3 |
| 6. |
History |
6-1 |
| |
6.1. |
Historical Mines |
6-1 |
| |
|
6.1.1. |
Cariboo Gold Quartz Mine |
6-1 |
| |
|
6.1.2. |
Island Mountain Mine (Aurum Mine) |
6-2 |
| |
|
6.1.3. |
Mosquito Creek Mine |
6-2 |
| |
6.2. |
Surface Work Programs |
6-3 |
| |
|
6.2.1. |
Cariboo Gold Quartz Mining Company Ltd. (1968) |
6-3 |
| |
|
6.2.2. |
Wharf Resources Ltd. (1980–1981) |
6-3 |
| |
|
6.2.3. |
Blackberry Gold Resources Inc. (1988) |
6-4 |
| |
|
6.2.4. |
Pan Orvana Resources Inc. (1989–1991) |
6-4 |
| |
|
6.2.5. |
Gold City Mining Corp. (1994–1995) |
6-4 |
| |
6.3. |
International Wayside Gold Mines Ltd. (1999–2014) |
6-5 |
| |
6.4. |
International Wayside Gold Mines Ltd. (1995–2009) |
6-6 |
| |
|
6.4.1. |
1995–1999 Work Programs |
6-6 |
| |
|
6.4.2. |
2000–2009 Work Programs |
6-7 |
| |
6.5. |
Barkerville Gold Mines Ltd. (2010-2014) |
6-11 |
| |
|
6.5.1. |
2010–2011 Work Programs |
6-11 |
| |
|
6.5.2. |
2012 Work Program |
6-12 |
| |
|
6.5.3. |
2013 Work Program |
6-13 |
| |
|
6.5.4. |
2014 Work Program |
6-13 |
| |
6.6. |
Barkerville Gold Mines Ltd. (2015–2022) |
6-13 |
| |
6.7. |
Regional Mineral Claims of the Cariboo Gold Project |
6-16 |
| 7. |
|
Geological Setting and Mineralization |
7-1 |
| |
7.1 |
Introduction and Clarification |
7-1 |
| |
7.2 |
Regional Geological Setting |
7-1 |
| |
|
7.2.1 |
Snowshoe Group Stratigraphy |
7-7 |
| |
Osisko Development Corp.
NI 43-101 Technical Report
Feasibility Study for the Cariboo Gold Project |
|
| |
|
7.2.2 |
Metamorphism |
7-9 |
| |
7.3 |
Property Geology |
7-10 |
| |
|
7.3.1 |
Cariboo Gold Project’s Core Area |
7-10 |
| |
|
7.3.2 |
Proserpine Region |
7-18 |
| |
|
7.3.3 |
Cunningham Region |
7-20 |
| |
|
7.3.4 |
Burns Region |
7-22 |
| |
|
7.3.5 |
Yanks Peak Region |
7-25 |
| |
7.4 |
Structural Geology |
7-27 |
| |
|
7.4.1 |
Deformation 1 |
7-27 |
| |
|
7.4.2 |
Deformation 2 |
7-28 |
| |
|
7.4.3 |
Deformation 3 |
7-28 |
| |
|
7.4.4 |
Deformation 4 |
7-30 |
| |
7.5 |
Mineralization and Alteration |
7-30 |
| |
|
7.5.1 |
Vein-related Mineralization |
7-31 |
| |
|
7.5.2 |
Replacement-style Mineralization |
7-32 |
| |
|
7.5.3 |
Vein-related Alteration |
7-35 |
| |
7.6 |
Age of Mineralization |
7-37 |
| |
7.7 |
Summary of Mineralized Occurrences (MINFILEs) |
7-37 |
| 8. |
Deposit Types |
8-1 |
| |
8.1. |
Orogenic Gold Deposits |
8-1 |
| |
|
8.1.1. |
Vein Deposits |
8-3 |
| |
|
8.1.2. |
Replacement Deposits |
8-6 |
| |
|
8.1.3. |
Shear Zone Deposits |
8-6 |
| 9. |
Exploration |
9-1 |
| |
9.1 |
Program Purpose and Methodology |
9-5 |
| |
|
9.1.1 |
Geologic Mapping |
9-5 |
| |
|
9.1.2 |
Soil Sampling |
9-5 |
| |
|
9.1.3 |
Underground Development |
9-5 |
| |
9.2 |
Program Objectives and Results |
9-8 |
| |
|
9.2.1 |
2015–2019 Geochemical and Mapping Programs |
9-8 |
| |
|
9.2.2 |
2016 Magnetic and VTEM Survey Program |
9-8 |
| |
|
9.2.3 |
2020 Geochemical and Mapping Programs |
9-9 |
| |
|
9.2.4 |
2021 Geochemical and Mapping Programs |
9-10 |
| |
|
9.2.5 |
2024 Underground Development Program |
9-11 |
| 10. |
Drilling |
10-1 |
| |
10.1 |
Drilling Methodology |
10-1 |
| |
10.2 |
Core Logging Procedures |
10-2 |
| |
10.3 |
2015 to 2019 Drilling |
10-3 |
| |
Osisko Development Corp.
NI 43-101 Technical Report
Feasibility Study for the Cariboo Gold Project |
|
| |
10.4 |
2020 Drilling Program |
10-6 |
| |
10.5 |
2021 Drilling Program |
10-8 |
| |
10.6 |
2022 Drilling Program |
10-9 |
| |
10.7 |
2023 Drilling Program |
10-9 |
| |
10.8 |
QP Comments on 2015-2022 Drilling |
10-10 |
| |
10.9 |
QP Comments on Post-2022 Drilling |
10-10 |
| 11. |
Sample Preparation, Analyses, and Security |
11-1 |
| |
11.1 |
Core Handling, Sampling, and Security |
11-1 |
| |
11.2 |
Laboratories Accreditation and Certification |
11-2 |
| |
11.3 |
Sample Preparation and Assay |
11-2 |
| |
|
11.3.1 |
Sample Preparation |
11-2 |
| |
|
11.3.2 |
Gold Assaying |
11-3 |
| |
|
11.3.3 |
Multi-element Assaying |
11-3 |
| |
|
11.3.4 |
Specific Gravity Measurements |
11-3 |
| |
11.4 |
Quality Assurance and Quality Control |
11-3 |
| |
|
11.4.1 |
Certified Reference Materials (Standards) |
11-4 |
| |
|
11.4.2 |
2020 Certified Reference Materials (Standards) Performance |
11-4 |
| |
|
11.4.3 |
2021 Certified Reference Materials (Standards) Performance |
11-5 |
| |
|
11.4.4 |
Blank Samples |
11-7 |
| |
|
11.4.5 |
2020 Blank Samples Performance |
11-7 |
| |
|
11.4.6 |
2021 Blank Samples Performance |
11-8 |
| |
11.5 |
Conclusions |
11-9 |
| 12. |
Data Verification |
12-1 |
| |
12.1. |
Historical Work |
12-2 |
| |
12.2. |
ODV Databases |
12-2 |
| |
|
12.2.1. |
ODV Drill Hole Collar and Downhole |
12-2 |
| |
|
12.2.2. |
Assays |
12-2 |
| |
12.3. |
Mined-out Voids |
12-3 |
| |
12.4. |
ODV Logging, Sampling, and Assaying Procedures |
12-3 |
| |
12.5. |
Mineral Resource Estimation Process |
12-6 |
| |
|
12.5.1. |
Bulk Sample and Drilling Pattern |
12-6 |
| |
12.6. |
Conclusion |
12-7 |
| 13. |
Mineral Processing and Metallurgical Testing |
13-1 |
| |
13.1 |
Sample Selection and Characterization |
13-2 |
| |
|
13.1.1 |
SGS – 2018 |
13-2 |
| |
|
13.1.2 |
SGS – 2020 |
13-7 |
| |
|
13.1.3 |
SGS – 2022 |
13-7 |
| |
Osisko Development Corp.
NI 43-101 Technical Report
Feasibility Study for the Cariboo Gold Project |
|
| |
|
13.1.4 |
Base Met Labs – 2024 |
13-8 |
| |
13.2 |
Comminution Test W |
13-15 |
| |
|
13.2.1 |
SGS – 2018 |
13-15 |
| |
|
13.2.2 |
SGS – 2022 |
13-15 |
| |
|
13.2.3 |
Base Met Labs – 2024 |
13-15 |
| |
13.3 |
Ore Sorting Test Work |
13-20 |
| |
|
13.3.1 |
Steinert – 2018 |
13-20 |
| |
|
13.3.2 |
Tomra – 2020 (Shaft Zone) |
13-26 |
| |
|
13.3.3 |
Steinert – 2022 (Lowhee Zone) |
13-28 |
| |
|
13.3.4 |
Base Met Labs – 2024 |
13-28 |
| |
13.4 |
Gravity Concentration |
13-32 |
| |
|
13.4.1 |
SGS – 2018 |
13-32 |
| |
|
13.4.2 |
SGS – 2021 |
13-32 |
| |
|
13.4.3 |
SGS – 2022 |
13-33 |
| |
|
13.4.4 |
Base Met Labs – 2024 |
13-33 |
| |
13.5 |
Flotation Test Work |
13-37 |
| |
|
13.5.1 |
SGS – 2018 |
13-37 |
| |
|
13.5.2 |
SGS – 2020 (Shaft Zone) |
13-42 |
| |
|
13.5.3 |
Base Met Labs – 2024 |
13-47 |
| |
13.6 |
Leaching Test Work |
13-54 |
| |
13.7 |
Thickening, Filtration, and Rheology |
13-55 |
| |
|
13.7.1 |
Pocock Industrial – 2018 |
13-56 |
| |
|
13.7.2 |
FLSmidth – 2022 (Shaft Zone) |
13-59 |
| |
|
13.7.3 |
SGS – 2022 |
13-63 |
| |
|
13.7.4 |
Metso – 2024 |
13-66 |
| |
13.8 |
Paste Backfill |
13-71 |
| |
|
13.8.1 |
Paste and Solid-Liquid Investigation - Golder – 2019 |
13-71 |
| |
|
13.8.2 |
Feasibility Paste Fill Testing - WSP Golder – 2022 |
13-75 |
| |
|
13.8.3 |
T Engineering – 2024 |
13-81 |
| |
|
13.8.4 |
Backfill Analysis |
13-87 |
| |
13.9 |
Recovery Considerations |
13-88 |
| |
|
13.9.1 |
Ore Sorting |
13-89 |
| |
|
13.9.2 |
Gravity Concentration |
13-89 |
| |
|
13.9.3 |
Flotation |
13-90 |
| |
|
13.9.4 |
Lock Cycle Test |
13-90 |
| 14. |
Mineral Resource Estimates |
14-1 |
| |
14.1 |
Methodology |
14-1 |
| |
14.2 |
Drill Hole Database |
14-3 |
| |
14.3 |
Geological Model |
14-6 |
| |
Osisko Development Corp.
NI 43-101 Technical Report
Feasibility Study for the Cariboo Gold Project |
|
| |
14.4 |
Voids Model |
14-11 |
| |
14.5 |
Compositing |
14-14 |
| |
14.6 |
High-grade Capping |
14-16 |
| |
14.7 |
Density |
14-18 |
| |
14.8 |
Block Model |
14-19 |
| |
14.9 |
Variography and Search Ellipsoids |
14-21 |
| |
14.10 |
Grade Interpolation |
14-22 |
| |
14.11 |
Block Model Validation |
14-24 |
| |
14.12 |
Economic Parameters and Cut-off Grade |
14-28 |
| |
14.13 |
Mineral Resource Classification |
14-29 |
| |
|
14.13.1 |
Cow, Valley, Shaft, Mosquito, KL, Lowhee, and BC Vein Deposits |
14-29 |
| |
|
14.13.2 |
Bonanza Ledge Deposit |
14-31 |
| |
14.14 |
Mineral Resource Estimate |
14-32 |
| 15. |
Mineral Reserve Estimates |
15-1 |
| |
15.1 |
Introduction |
15-1 |
| |
15.2 |
Estimation Procedure |
15-1 |
| |
|
15.2.1 |
Cut-off Grades Calculations |
15-2 |
| |
|
15.2.2 |
Dilution Factor Calculation |
15-3 |
| |
|
15.2.3 |
Mining Losses |
15-4 |
| |
|
15.2.4 |
Stope Shape Optimization |
15-4 |
| |
|
15.2.5 |
ESG Modifying Factors |
15-5 |
| |
15.3 |
Mineral Reserve Statement |
15-6 |
| |
15.4 |
Factors that May Affect the Mineral Reserves |
15-7 |
| 16. |
Mining Methods |
16-1 |
| |
16.1 |
Introduction |
16-1 |
| |
16.2 |
Rock Engineering |
16-2 |
| |
|
16.2.1 |
Geotechnical Field and Test Work Programs |
16-2 |
| |
|
16.2.2 |
Structural Geology |
16-6 |
| |
|
16.2.3 |
Geotechnical Design |
16-6 |
| |
|
16.2.4 |
Ground Support Recommendations |
16-12 |
| |
16.3 |
Mine Hydrogeology |
16-15 |
| |
|
16.3.1 |
Mine Site Area Hydrogeology |
16-15 |
| |
|
16.3.2 |
Groundwater Inflow Predictions – Mine Site Complex Area |
16-15 |
| |
|
16.3.3 |
Limitations of Inflow Predictions |
16-16 |
| |
16.4 |
Underground Mining Method |
16-16 |
| |
|
16.4.1 |
Cut-off Grade Calculation |
16-19 |
| |
|
16.4.2 |
Selection of Economical Material for Life of Mine |
16-19 |
| |
Osisko Development Corp.
NI 43-101 Technical Report
Feasibility Study for the Cariboo Gold Project |
|
| |
16.5 |
Mine Design |
16-20 |
| |
|
16.5.1 |
Development Design |
16-24 |
| |
|
16.5.2 |
Main Infrastructure |
16-24 |
| |
|
16.5.3 |
Level Layout Design |
16-27 |
| |
|
16.5.4 |
Production Stopes |
16-29 |
| |
|
16.5.5 |
Shaft Zone |
16-31 |
| |
|
16.5.6 |
Valley Zone |
16-34 |
| |
|
16.5.7 |
Cow Zone |
16-36 |
| |
|
16.5.8 |
Lowhee Zone |
16-38 |
| |
|
16.5.9 |
Mosquito Zone |
16-40 |
| |
|
16.5.10 |
Mine Dilution and Recovery |
16-42 |
| |
|
16.5.11 |
Mine Physicals |
16-43 |
| |
16.6 |
Underground Material Handling |
16-45 |
| |
|
16.6.1 |
Material Handling Infrastructure |
16-47 |
| |
|
16.6.2 |
Grizzly and Rock Breaker Stations |
16-50 |
| |
|
16.6.3 |
Crushing Circuit |
16-51 |
| |
|
16.6.4 |
Ore Feed Chute |
16-51 |
| |
|
16.6.5 |
Primary Crusher Station |
16-52 |
| |
|
16.6.6 |
Sizing Station |
16-52 |
| |
|
16.6.7 |
Secondary Crushing Station |
16-53 |
| |
|
16.6.8 |
Crushed Ore Silos |
16-53 |
| |
|
16.6.9 |
Loading Station |
16-53 |
| |
|
16.6.10 |
Chutes Under the Silos |
16-54 |
| |
|
16.6.11 |
Transfer Point and Transfer Conveyor |
16-54 |
| |
|
16.6.12 |
Dust Collection |
16-54 |
| |
|
16.6.13 |
Crushing Control System |
16-55 |
| |
|
16.6.14 |
Underground Waste Truck Chute |
16-55 |
| |
|
16.6.15 |
Underground Crushing Electrical Distribution and Communication |
16-56 |
| |
|
16.6.16 |
Fire Detection and Suppression |
16-57 |
| |
16.7 |
Backfill Strategy |
16-57 |
| |
|
16.7.1 |
Underground Distribution System Design Criteria and Mass Balance |
16-57 |
| |
|
16.7.2 |
Underground Paste Fill Network Distribution Description |
16-59 |
| |
|
16.7.3 |
Valley Paste Fill Distribution Network |
16-59 |
| |
|
16.7.4 |
Shaft Paste Fill Distribution Network |
16-60 |
| |
|
16.7.5 |
Cow Paste Fill Distribution Network |
16-61 |
| |
|
16.7.6 |
Mosquito Paste Fill Distribution Network |
16-62 |
| |
|
16.7.7 |
Lowhee Paste Fill Network Distribution |
16-63 |
| |
|
16.7.8 |
Typical Level Paste Fill Distribution Network |
16-63 |
| |
|
16.7.9 |
Flow Model Analysis |
16-64 |
| |
|
16.7.10 |
Paste Pumps |
16-66 |
| |
Osisko Development Corp.
NI 43-101 Technical Report
Feasibility Study for the Cariboo Gold Project |
|
| |
16.8 |
Mine Schedule |
16-68 |
| |
|
16.8.1 |
Mine Sequence Methodology |
16-68 |
| |
|
16.8.2 |
Scheduling Rates |
16-69 |
| |
|
16.8.3 |
Mine Production Schedule |
16-71 |
| |
16.9 |
Mine Services |
16-77 |
| |
|
16.9.1 |
Ventilation |
16-77 |
| |
|
16.9.2 |
Dewatering |
16-84 |
| |
|
16.9.3 |
Historical Working Dewatering |
16-85 |
| |
|
16.9.4 |
General Dewatering Design |
16-85 |
| |
|
16.9.5 |
Water Clarification System |
16-88 |
| |
|
16.9.6 |
Underground Electrical Distribution |
16-90 |
| |
|
16.9.7 |
Underground Mine Equipment |
16-91 |
| |
|
16.9.8 |
Communication Network Automation |
16-92 |
| |
16.10 |
Mine Personnel |
16-93 |
| 17. |
Recovery Methods |
17-1 |
| |
17.1 |
Introduction |
17-1 |
| |
17.2 |
Concentrator Process Design Criteria |
17-1 |
| |
17.3 |
Simplified Flowsheet and General Arrangement |
17-2 |
| |
17.4 |
Underground Crushing and Screening |
17-7 |
| |
|
17.4.1 |
Underground Crushing |
17-7 |
| |
|
17.4.2 |
Vibrating Screen |
17-7 |
| |
17.5 |
Ore Sorting and Tertiary Crushing |
17-7 |
| |
|
17.5.1 |
Ore Sorting Circuit |
17-7 |
| |
|
17.5.2 |
Tertiary Crushing |
17-8 |
| |
17.6 |
Grinding and Primary Gravity Concentration Circuit |
17-8 |
| |
|
17.6.1 |
Sorting Concentrate and Fine Ore Silo |
17-8 |
| |
|
17.6.2 |
Ball Mill |
17-8 |
| |
|
17.6.3 |
Primary Gravity Circuit |
17-9 |
| |
|
17.6.4 |
Primary Grinding Cyclone Cluster |
17-9 |
| |
17.7 |
Flotation, Regrind and Secondary Gravity Concentration |
17-9 |
| |
|
17.7.1 |
Rougher Flotation |
17-9 |
| |
|
17.7.2 |
Regrind Cyclone Cluster |
17-10 |
| |
|
17.7.3 |
Secondary Gravity Concentrator |
17-10 |
| |
|
17.7.4 |
Regrind Mill |
17-10 |
| |
17.8 |
Cleaner Flotation and Cleaner-scavenger Flotation |
17-10 |
| |
|
17.8.1 |
Cleaner Flotation |
17-10 |
| |
|
17.8.2 |
Cleaner-Scavenger Flotation |
17-11 |
| |
|
17.8.3 |
Onstream and Particle Size Analysis |
17-11 |
| |
17.9 |
Concentrate Dewatering |
17-12 |
| |
Osisko Development Corp.
NI 43-101 Technical Report
Feasibility Study for the Cariboo Gold Project |
|
| |
17.10 |
Paste Plant |
17-12 |
| |
|
17.10.1 |
Flotation Tailings Dewatering |
17-12 |
| |
|
17.10.2 |
Paste Production and Distribution |
17-13 |
| |
17.11 |
Gravity Concentrate Refinery |
17-13 |
| |
17.12 |
Water and Air Services |
17-13 |
| |
|
17.12.1 |
Fresh Water Distribution |
17-13 |
| |
|
17.12.2 |
Process Water Distribution |
17-14 |
| |
|
17.12.3 |
Air Distribution |
17-14 |
| |
17.13 |
Reagents Preparation and Distribution Systems |
17-14 |
| |
17.14 |
Concentrator Personnel |
17-15 |
| |
17.15 |
Power, Reagents and Consumables |
17-16 |
| |
|
17.15.1 |
Propane |
17-16 |
| |
|
17.15.2 |
Power |
17-16 |
| |
|
17.15.3 |
Reagents, Cement, and Consumables |
17-16 |
| 18. |
Project Infrastructure |
18-1 |
| |
18.1 |
Overview Description |
18-3 |
| |
18.2 |
Geotechnical Investigations |
18-6 |
| |
|
18.2.1 |
Mine Site Complex |
18-6 |
| |
|
18.2.2 |
Bonanza Ledge |
18-7 |
| |
18.3 |
On-site Infrastructure |
18-7 |
| |
|
18.3.1 |
Surface Mobile Equipment |
18-7 |
| |
|
18.3.2 |
Site Water Management |
18-9 |
| |
|
18.3.3 |
Bonanza Ledge Area Water Management Infrastructure |
18-15 |
| |
|
18.3.4 |
Mine Site Complex Area Water Management Infrastructure |
18-19 |
| |
|
18.3.5 |
Bonanza Ledge Site |
18-22 |
| |
|
18.3.6 |
Mine Site Complex |
18-26 |
| |
18.4 |
Off-site Infrastructure |
18-38 |
| |
|
18.4.1 |
Ballarat Camp |
18-38 |
| |
|
18.4.2 |
Transmission Line |
18-42 |
| 19. |
Market Studies and Contracts |
19-1 |
| |
19.1 |
Market Studies |
19-1 |
| |
19.2 |
Gold Price and Exchange Rate |
19-1 |
| |
19.3 |
Gold Sales |
19-3 |
| |
|
19.3.1 |
Gold Doré |
19-3 |
| |
|
19.3.2 |
Gold Concentrate |
19-3 |
| |
19.4 |
Royalties |
19-4 |
| |
19.5 |
Contracts |
19-4 |
| |
|
19.5.1 |
Gold Doré |
19-4 |
| |
Osisko Development Corp.
NI 43-101 Technical Report
Feasibility Study for the Cariboo Gold Project |
|
| |
|
19.5.2 |
Flotation Concentrate |
19-4 |
| |
|
19.5.3 |
Other Contracts |
19-5 |
| 20. |
Environmental Studies, Permitting, and Social or Community Impact |
20-1 |
| |
20.1 |
Environmental Studies |
20-1 |
| |
|
20.1.1 |
Introduction |
20-1 |
| |
|
20.1.2 |
Climate |
20-2 |
| |
|
20.1.3 |
Air Quality |
20-4 |
| |
|
20.1.4 |
Land Capability and Use |
20-5 |
| |
|
20.1.5 |
Terrain and Soils |
20-6 |
| |
|
20.1.6 |
Vegetation |
20-7 |
| |
|
20.1.7 |
Wildlife and Wildlife Habitat |
20-7 |
| |
|
20.1.8 |
Fisheries and Aquatic Resources |
20-9 |
| |
20.2 |
Environmental Liabilities |
20-10 |
| |
20.3 |
Environmental Management and Monitoring |
20-10 |
| |
|
20.3.1 |
Ore Sorter Waste and Waste Rock Geochemistry |
20-11 |
| |
|
20.3.2 |
Tailings Geochemistry |
20-12 |
| |
|
20.3.3 |
Water Quantity and Quality |
20-12 |
| |
20.4 |
Considerations of Social and Community Impacts |
20-20 |
| |
|
20.4.1 |
Social Setting |
20-20 |
| |
|
20.4.2 |
Engagement and Consultation |
20-21 |
| |
|
20.4.3 |
Indigenous Nations |
20-22 |
| |
|
20.4.4 |
Federal, Provincial and Municipal Governments |
20-22 |
| |
|
20.4.5 |
Public Stakeholders |
20-23 |
| |
20.5 |
Mine Closure Requirements |
20-23 |
| |
|
20.5.1 |
Mine Reclamation and Closure Plan |
20-23 |
| |
|
20.5.2 |
Regulatory Framework |
20-24 |
| |
|
20.5.3 |
Mine Closure Planning Approach |
20-24 |
| |
20.6 |
Permitting and Required Approvals |
20-25 |
| |
|
20.6.1 |
Regulatory Context |
20-25 |
| |
|
20.6.2 |
BC Environmental Assessment Regulations |
20-25 |
| |
|
20.6.3 |
Federal Permits, Approvals, Licences, and Authorizations |
20-26 |
| |
|
20.6.4 |
Provincial Permits, Approvals and Licences |
20-28 |
| |
|
20.6.5 |
Local Government Permits |
20-30 |
| 21. |
Capital and Operating Costs |
21-1 |
| |
21.1 |
Capital Costs |
21-1 |
| |
|
21.1.1 |
Summary |
21-1 |
| |
|
21.1.2 |
Scope and Structure of Capital Cost Estimate |
21-3 |
| |
|
21.1.3 |
Pre-final Investment Decision Capital Costs |
21-7 |
| |
|
21.1.4 |
Initial Capital Costs |
21-7 |
| |
|
21.1.5 |
Sustaining Capital Cost |
21-16 |
| |
Osisko Development Corp.
NI 43-101 Technical Report
Feasibility Study for the Cariboo Gold Project |
|
| |
21.2 |
Operating Costs |
21-22 |
| |
|
21.2.1 |
Summary |
21-22 |
| |
|
21.2.2 |
Basis of Operating Cost Estimate |
21-22 |
| |
|
21.2.3 |
Mining |
21-24 |
| |
|
21.2.4 |
Electrical and Communications |
21-29 |
| |
|
21.2.5 |
Processing |
21-30 |
| |
|
21.2.6 |
Water Treatment |
21-33 |
| |
|
21.2.7 |
Waste & Water Management |
21-34 |
| |
|
21.2.8 |
General and Administration |
21-35 |
| |
21.3 |
Site Personnel Summary – All Areas |
21-37 |
| 22. |
Economic Analysis |
22-1 |
| |
22.1 |
Overview |
22-1 |
| |
22.2 |
Assumptions and Basis |
22-1 |
| |
22.3 |
Metal Production |
22-3 |
| |
22.4 |
Capital Expenditures |
22-4 |
| |
22.5 |
Royalties |
22-4 |
| |
22.6 |
Taxation |
22-5 |
| |
22.7 |
Financial Analysis Summary |
22-6 |
| |
22.8 |
Production Costs |
22-9 |
| |
22.9 |
Value Drivers |
22-11 |
| |
22.10 |
Sensitivity Analysis |
22-12 |
| 23. |
Adjacent Properties |
23-1 |
| 24. |
Other Relevant Data and Information |
24-1 |
| |
24.1 |
Project Execution Plan |
24-1 |
| |
|
24.1.1 |
Introduction |
24-1 |
| |
|
24.1.2 |
Main Project Activities |
24-1 |
| |
|
24.1.3 |
Project Organization |
24-2 |
| |
|
24.1.4 |
Project Development Team |
24-3 |
| |
|
24.1.5 |
Construction Management Team |
24-4 |
| |
|
24.1.6 |
Site Services Team |
24-4 |
| |
|
24.1.7 |
Pre-staffing and Training |
24-5 |
| |
24.2 |
Key Project Execution Activities |
24-5 |
| |
24.3 |
Project Execution Schedule |
24-5 |
| |
|
24.3.1 |
Critical Path |
24-8 |
| |
24.4 |
Labour |
24-8 |
| |
|
24.4.1 |
Construction Labour |
24-8 |
| |
Osisko Development Corp.
NI 43-101 Technical Report
Feasibility Study for the Cariboo Gold Project |
|
| 25. |
Interpretation and Conclusions |
25-1 |
| |
25.1 |
Data Verification and Mineral |
25-1 |
| |
25.2 |
Underground Mining |
25-4 |
| |
|
25.2.1 |
Geotechnical |
25-4 |
| |
|
25.2.2 |
Mine Design and Planning |
25-4 |
| |
|
25.2.3 |
Mine Materials Handling and Paste Distribution System |
25-6 |
| |
25.3 |
Mineral Processing and Metallurgical Testing |
25-7 |
| |
25.4 |
Water Balance |
25-7 |
| |
25.5 |
Water Quality |
25-8 |
| |
25.6 |
Infrastructure |
25-9 |
| |
|
25.6.1 |
Mine Site Complex Operational |
25-9 |
| |
|
25.6.2 |
Water Management Infrastructure |
25-10 |
| |
|
25.6.3 |
Water Treatment Facilities |
25-10 |
| |
|
25.6.4 |
Water Treatment Conveyance Infrastructure |
25-11 |
| |
|
25.6.5 |
Power Supply (Transmission Line and Substation) |
25-11 |
| |
|
25.6.6 |
Waste Rock Storage Facility |
25-11 |
| |
25.7 |
Environmental Studies |
25-12 |
| |
25.8 |
Market Studies and Contracts |
25-12 |
| |
25.9 |
Execution and Construction |
25-13 |
| |
25.10 |
Capital and Operating Costs |
25-13 |
| |
|
25.10.1 |
Indicative Economic Results |
25-15 |
| |
25.11 |
Project Risks and Opportunities |
25-18 |
| |
25.12 |
Conclusion |
25-27 |
| 26. |
Recommendations |
26-1 |
| |
26.1 |
Overview |
26-1 |
| |
26.2 |
Drilling and Geology |
26-1 |
| |
26.3 |
Underground Mining |
26-2 |
| |
|
26.3.1 |
Geotechnical |
26-2 |
| |
|
26.3.2 |
Mine Design and Planning |
26-3 |
| |
|
26.3.3 |
Mine Materials Handling and Paste Distribution |
26-4 |
| |
26.4 |
Mineral Processing and Metallurgical Test Work |
26-4 |
| |
26.5 |
Water Balance |
26-5 |
| |
26.6 |
Water Quality |
26-6 |
| |
26.7 |
Surface Infrastructure |
26-6 |
| |
|
26.7.1 |
Mine Site Operational Infrastructure |
26-6 |
| |
|
26.7.2 |
Water Management Infrastructure |
26-7 |
| |
|
26.7.3 |
Water Treatment Facilities |
26-8 |
| |
Osisko Development Corp.
NI 43-101 Technical Report
Feasibility Study for the Cariboo Gold Project |
|
| |
|
26.7.4 |
Water treatment Conveyance Infrastructure Pumping and Piping Systems |
26-9 |
| |
|
26.7.5 |
Power Supply (Transmission Line and Substation |
26-9 |
| |
|
26.7.6 |
Waste Rock Storage Facility |
26-9 |
| |
26.8 |
Environment and Permitting |
26-9 |
| |
26.9 |
Work Program Budget |
26-10 |
| |
26.10 |
Conclusion |
26-12 |
| 27. |
References |
27-1 |
| |
27.1. |
Mineral Resources and Geology |
27-1 |
| |
27.2. |
Mining Methods |
27-9 |
| |
27.3. |
Mineral Processing and Metallurgical Testing |
27-11 |
| |
27.4. |
Project Infrastructure |
27-12 |
| |
27.5. |
Environmental Studies, Permitting, and Social or Community Impact |
27-12 |
| |
27.6. |
Mine Reclamation and Closure |
27-17 |
| |
27.7. |
Surface Water Management |
27-18 |
| APPENDIX 1: |
|
|
List of Mineral Claims and Leases (as of April 30, 2025) |
|
| APPENDIX 2: |
|
|
List of Placer Claims and Leases (as of April 30, 2025) |
|
| APPENDIX 3: |
|
|
Crown-Granted Mineral Claims (as of April 30, 2025) |
|
| |
Osisko Development Corp.
NI 43-101 Technical Report
Feasibility Study for the Cariboo Gold Project |
|
LIST OF TABLES
| Table 1-1: Report contributors |
1-3 |
| Table 1-2: Comparison of changes from 2023 to 2025 FS |
1-7 |
| Table 1-3: Cariboo Gold Project 2025 FS MRE reported at a 1.8 g/t Au cut-off grade (except for Bonanza Ledge reported at a 3.5 g/t Au cut-off grade) |
1-13 |
| Table 1-4: Cariboo Gold statement of mineral reserves (Effective date: April 10, 2025) |
1-15 |
| Table 1-5: Ore mined per year |
1-20 |
| Table 1-6: Capital cost summary(1) |
1-28 |
| Table 1-7: Operating cost summary |
1-29 |
| Table 1-8: Financial analysis assumptions |
1-30 |
| Table 1-9: Financial analysis results |
1-31 |
| Table 1-10: Key milestones |
1-33 |
| Table 2-1: Qualified persons and areas of report responsibility |
2-3 |
| Table 4-1: Barkerville surface rights option agreements |
4-10 |
| Table 4-2: Provincial permits and approvals potentially applicable to the Project |
4-13 |
| Table 4-3: Federal permits and approvals potentially applicable to the Project |
4-14 |
| Table 6-1: Summary of diamond drilling on the Island Mountain Project from 1999 to 2014 |
6-5 |
| Table 6-2: Summary of diamond drilling on the Cariboo Gold Project from 1995 to 1999 |
6-6 |
| Table 6-3: Summary of diamond drilling on the Cariboo Gold Project from 2000 to 2009 |
6-7 |
| Table 6-4: Summary of diamond drilling on the Cariboo Gold Project from 2010 to 2014 |
6-11 |
| Table 9-1: Surface geochemical samples collected on the Cariboo Gold Project 2015-2019 |
9-8 |
| Table 9-2: 2020 Soil, rock samples and structural station by prospect |
9-10 |
| Table 9-3: 2021 Soil, rock samples and structural station by prospect |
9-11 |
| Table 10-1: Summary of BGM’s 2020 Drilling Program |
10-6 |
| Table 10-2: Summary of BGM’s 2021 Drilling Program |
10-8 |
| Table 10-3: Summary of BGM’s 2022 Drilling Program |
10-9 |
| Table 10-4: Summary of BGM’s 2022 Drilling Program |
10-9 |
| Table 11-1: Results of standards used by ODV for the 2020 Program |
11-4 |
| Table 11-2: Results of standards used by ODV for the 2021 Program |
11-6 |
| Table 11-3: Results of blanks used by ODV for the 2020 Program |
11-7 |
| Table 11-4: Results of blanks used by ODV for the 2021 Program |
11-8 |
| Table 12-1: Results of the independent resampling of material |
12-4 |
| Table 13-1: Summary of metallurgical test work programs |
13-1 |
| Table 13-2: 2018 Material received for LOM composites |
13-4 |
| Table 13-3: 2018 Material received for variability composites |
13-5 |
| |
Osisko Development Corp.
NI 43-101 Technical Report
Feasibility Study for the Cariboo Gold Project |
|
| Table 13-4: Variability composites head assays via SMA and ICP |
13-6 |
| Table 13-5: Recipes of composite samples |
13-7 |
| Table 13-6: Lowhee composite gold content |
13-8 |
| Table 13-7: Composites construction |
13-10 |
| Table 13-8: Head assays |
13-11 |
| Table 13-9: SMA results |
13-12 |
| Table 13-10: Diagnostic leaching results |
13-13 |
| Table 13-11: Leaching and flotation results |
13-14 |
| Table 13-12: SMC Test® results |
13-16 |
| Table 13-13: Parameters derived from the SMC Test® results |
13-16 |
| Table 13-14: HIT test work results |
13-19 |
| Table 13-15: Bond test work results |
13-20 |
| Table 13-16: Ore sorted LOM composites |
13-20 |
| Table 13-17: Ore sorted variability composites |
13-21 |
| Table 13-18: Ore sorting test results – ROM composites |
13-23 |
| Table 13-19: Ore sorting test results – Variability composites |
13-24 |
| Table 13-20: Summary – Average ore sorting recoveries |
13-26 |
| Table 13-21: Lowhee sorting test results |
13-28 |
| Table 13-22: Ore sorting results |
13-31 |
| Table 13-23: E-GRG test results summary – gold and silver |
13-32 |
| Table 13-24: Gravity separation results for Lowhee |
13-33 |
| Table 13-25: E-GRG test Knelson conditions |
13-34 |
| Table 13-26: E-GRG test results summary |
13-34 |
| Table 13-27: Gravity recovery model results |
13-35 |
| Table 13-28: Gravity concentration tests |
13-36 |
| Table 13-29: Flotation test results |
13-37 |
| Table 13-30: Flotation test results – Variability composite fines |
13-38 |
| Table 13-31: Flotation test results – Ore sorter concentrate |
13-41 |
| Table 13-32: Rougher flotation test conditions |
13-42 |
| Table 13-33: Cleaner flotation test conditions |
13-44 |
| Table 13-34: Cleaner flotation test results |
13-45 |
| Table 13-35: Bulk rougher flotation test results summary |
13-46 |
| Table 13-36: Assay results summary – Combined flotation concentrate |
13-46 |
| Table 13-37: LCT results |
13-53 |
| Table 13-38: Belt vacuum filtration test |
13-55 |
| Table 13-39: Sample characterization |
13-56 |
| |
Osisko Development Corp.
NI 43-101 Technical Report
Feasibility Study for the Cariboo Gold Project |
|
| Table 13-40: Recommended high-rate thickener operating parameters |
13-57 |
| Table 13-41: Pressure filtration results and design parameters |
13-59 |
| Table 13-42: As-received sample characteristic summary |
13-59 |
| Table 13-43: Evaluated flocculants |
13-60 |
| Table 13-44: Recommended thickener operating parameters |
13-61 |
| Table 13-45: Vacuum filtration test results |
13-62 |
| Table 13-46: Pressure filtration test results |
13-62 |
| Table 13-47: Rheology sample characterization |
13-63 |
| Table 13-48: Summary of rheology results – Flotation concentrate underflow |
13-64 |
| Table 13-49: Summary of rheology results – CIP detox tailings underflow |
13-65 |
| Table 13-50: 8:1 Blended tails – Dynamic thickening results |
13-66 |
| Table 13-51: 5:1 Blended tails – Dynamic thickening results |
13-67 |
| Table 13-52: 8:1 Blended tails – Belt vacuum filtration results |
13-68 |
| Table 13-53: 5:1 Blended tails – Belt vacuum filtration results summary |
13-68 |
| Table 13-54: 8:1 and 5:1 Blended tails - Belt vacuum filtration results using filter aid |
13-69 |
| Table 13-55: Gold bulk concentrate – Belt vacuum filtration results |
13-69 |
| Table 13-56: 8:1 and 5:1 Blended tails – Pressure filtration results |
13-70 |
| Table 13-57: Tailings particle size distribution |
13-71 |
| Table 13-58: XRD Mineralogical composition |
13-72 |
| Table 13-59: Bingham viscosity and yield stress |
13-74 |
| Table 13-60: Unconfined compressive strength test results |
13-75 |
| Table 13-61: Tailings particle size distribution |
13-76 |
| Table 13-62: XRD mineralogical composition |
13-76 |
| Table 13-63: UCS testing program results – WSP Golder |
13-81 |
| Table 13-64: Samples received |
13-81 |
| Table 13-65: Particle size distribution |
13-82 |
| Table 13-66: Specific gravity of tailings and mixtures |
13-82 |
| Table 13-67: ICP-MS results |
13-83 |
| Table 13-68: XRD results |
13-83 |
| Table 13-69: Water bleed test results |
13-86 |
| Table 13-70: Summary of UCS matrix and test results |
13-87 |
| Table 13-71: Binder content estimate based on the mining plan UCS |
13-88 |
| Table 13-72: Fines bypass enrichment parameters |
13-89 |
| Table 13-73: Ore sorting recovery parameters |
13-89 |
| Table 13-74: Gravity recovery parameters |
13-89 |
| Table 13-75: Flotation recovery parameters |
13-90 |
| |
Osisko Development Corp.
NI 43-101 Technical Report
Feasibility Study for the Cariboo Gold Project |
|
| Table 14-1: Number of drill holes in each database |
14-4 |
| Table 14-2: Summary statistics for the DDH raw gold assays from mineralized veins |
14-14 |
| Table 14-3: Summary statistics for the DDH raw gold assays from dilution halos |
14-15 |
| Table 14-4: Summary statistics for capped gold composites from mineralized veins |
14-15 |
| Table 14-5: Summary statistics for capped gold composites from dilution halos |
14-16 |
| Table 14-6: Bulk density by mineralized zone |
14-18 |
| Table 14-7: Block model properties |
14-20 |
| Table 14-8: Mineralized veins gold grade estimation parameters |
14-23 |
| Table 14-9: Dilution halo gold grade estimation parameters |
14-24 |
| Table 14-10: Input parameters used to calculate the U/G cut-off grade |
14-28 |
| Table 14-11: Input parameters used to calculate the U/G cut-off grade for Bonanza Ledge |
14-28 |
| Table 14-12: Cariboo Gold Project 2025 FS MRE reported at a 1.8 g/t Au cut-off grade (except for Bonanza Ledge reported at a 3.5 g/t Au cut-off grade) |
14-32 |
| Table 14-13: Cut-off grade sensitivity analysis on gold for the Cow, Valley, Shaft, Mosquito, BC Vein, KL and Lowhee deposits of the Cariboo Gold Project |
14-34 |
| Table 14-14: Cut-off grade sensitivity analysis on gold for the Bonanza Ledge deposit |
14-34 |
| Table 15-1: Cut-off grade calculation parameters |
15-3 |
| Table 15-2: Stope shape optimization parameters |
15-4 |
| Table 15-3: Summary of ESG modifying factors relevant to Mineral Reserve Estimation |
15-5 |
| Table 15-4: Cariboo Gold Statement of Mineral Reserves |
15-6 |
| Table 16-1: Unconfined compressive strength test results from 2021 field program |
16-4 |
| Table 16-2: Limited unconfined compressive strength test results from 2021 field program |
16-4 |
| Table 16-3: Unconfined compressive strength estimates extrapolated from 2018 and 2021 TCS tests |
16-5 |
| Table 16-4: Summary of rock mass properties for each qualitative geotechnical classification |
16-7 |
| Table 16-5: Summary of stope performance back-analysis at Bonanza Ledge Mine |
16-8 |
| Table 16-6: Stope dimensions and dilution estimates |
16-9 |
| Table 16-7: Comparison of proposed and actual (design) stope strike lengths |
16-10 |
| Table 16-8: Minimum crown pillar thickness |
16-10 |
| Table 16-9: Ground support recommendations for mine portals |
16-13 |
| Table 16-10: Ground support recommendations for lateral and vertical development |
16-13 |
| Table 16-11: Ground support recommendations for stopes |
16-14 |
| Table 16-12: Total predicted groundwater inflow to the existing and new underground workings |
16-15 |
| Table 16-13: MSO input parameters |
16-20 |
| Table 16-14: Lateral development dimensions and cost category |
16-24 |
| Table 16-15: Lateral development of waste by zone |
16-44 |
| |
Osisko Development Corp.
NI 43-101 Technical Report
Feasibility Study for the Cariboo Gold Project |
|
| Table 16-16: Summary of total lateral development in ore |
16-44 |
| Table 16-17: Summary of total recovered production tonnes by zone |
16-44 |
| Table 16-18: Underground distribution system design criteria |
16-57 |
| Table 16-19: Mass balance |
16-58 |
| Table 16-20: Summary of the pipe lengths by zone in metres |
16-64 |
| Table 16-21: Slump and pumping summary |
16-66 |
| Table 16-22: Schedule development rates |
16-70 |
| Table 16-23: Summary of production rate tasks |
16-71 |
| Table 16-24: Annual mine production plan by zone |
16-73 |
| Table 16-25: Annual lateral development by zone (metres per year) |
16-75 |
| Table 16-26: Consolidated mine plan overview – Cariboo Gold Project |
16-76 |
| Table 16-27: List of mobile equipment |
16-77 |
| Table 16-28: Main fans and heaters specifications |
16-78 |
| Table 16-29: Estimated specific dewatering requirements per zone |
16-86 |
| Table 16-30: Underground workforce per rotation - Distribution in time |
16-94 |
| Table 17-1: Process design criteria |
17-1 |
| Table 17-2: Concentrator personnel |
17-15 |
| Table 17-3: Consumption of reagents and consumables |
17-16 |
| Table 18-1: Rental equipment to support construction |
18-7 |
| Table 18-2: List of Equipment for Operations |
18-8 |
| Table 18-3: MSC pipeline pathways summary |
18-35 |
| Table 18-4: Peak power demand by area |
18-35 |
| Table 19-1: Pricing and exchange rate assumptions |
19-2 |
| Table 19-2: Significant project contracts and agreements |
19-5 |
| Table 20-1: Summary of climate statistics |
20-3 |
| Table 20-2: Summary of climate change predictions |
20-4 |
| Table 20-3: Water balance model input assumptions |
20-14 |
| Table 20-4: Mill water balance |
20-15 |
| Table 20-5: Water balance model results for water treatment plants |
20-15 |
| Table 20-6: Regulations supporting the BC Environmental Assessment Act (2018)(1) |
20-26 |
| Table 20-7: Federal permits and approvals applicable to the proposed Project |
20-27 |
| Table 20-8: Provincial permits and approvals applicable to the proposed Project |
20-28 |
| Table 21-1: Project capital cost summary (1)(2) |
21-2 |
| Table 21-2: Estimate responsibilities by WBS |
21-4 |
| Table 21-3: Blended rates per discipline |
21-6 |
| Table 21-4: Labour productivity loss ratio |
21-7 |
| |
Osisko Development Corp.
NI 43-101 Technical Report
Feasibility Study for the Cariboo Gold Project |
|
| Table 21-5: Project initial capital cost summary |
21-8 |
| Table 21-6: Underground mine initial capital costs (Area 200) |
21-8 |
| Table 21-7: Underground materials handling initial capital costs (Area 290) |
21-9 |
| Table 21-8: Waste and water infrastructure initial capital costs (Area 300) |
21-10 |
| Table 21-9: Mine Site Complex WTP – Capital cost estimate (Area 300) |
21-11 |
| Table 21-10: Electrical and communication initial capital costs (Area 400) |
21-12 |
| Table 21-11: Surface infrastructure initial capital costs (Area 500) |
21-13 |
| Table 21-12: Process plant initial capital costs (Area 600) |
21-14 |
| Table 21-13: Construction indirect costs (Area 700) |
21-15 |
| Table 21-14: Capitalized initial capital costs (Area 980) |
21-16 |
| Table 21-15: Project sustaining capital cost summary |
21-17 |
| Table 21-16: Sustaining capital costs by year summary ($M) |
21-18 |
| Table 21-17: Underground sustaining capital costs – Area 200 |
21-19 |
| Table 21-18: Waste and water infrastructure sustaining capital costs – Area 300 |
21-20 |
| Table 21-19: Surface infrastructure sustaining capital costs |
21-20 |
| Table 21-20: Operating cost summary |
21-22 |
| Table 21-21: Operating cost estimate responsibilities |
21-23 |
| Table 21-22: General rate and unit cost assumptions |
21-24 |
| Table 21-23: Mining operating cost |
21-25 |
| Table 21-24: Material handling and crushing operating cost |
21-29 |
| Table 21-25: Electrical costs |
21-30 |
| Table 21-26: Mill operating costs |
21-31 |
| Table 21-27: Reagents and cement costs |
21-32 |
| Table 21-28: Bonanza Ledge WTP – Annual operating cost summary |
21-34 |
| Table 21-29: MSC WTP – Annual operating cost summary |
21-34 |
| Table 21-30: Waste and water management operating cost |
21-35 |
| Table 21-31: General and administrative costs by activity |
21-37 |
| Table 21-32: Peak labour by discipline for Construction and LOM |
21-39 |
| Table 22-1: Financial model parameters |
22-2 |
| Table 22-2: Financial analysis summary (pre-tax and after-tax) |
22-6 |
| Table 22-3: Summary of the Project cash flow financial model |
22-7 |
| Table 22-4: Production cost summary |
22-10 |
| Table 22-5: NPV ($M) sensitivity results (after-tax) for metal price and exchange rate variations |
22-12 |
| Table 22-6: IRR sensitivity results (after-tax) for metal price and exchange rate variations |
22-12 |
| |
Osisko Development Corp.
NI 43-101 Technical Report
Feasibility Study for the Cariboo Gold Project |
|
| Table 22-7: NPV ($M) sensitivity results (after-tax) for capital (LOM) and operating costs variations |
22-13 |
| Table 22-8: IRR sensitivity results (after-tax) for capital (LOM) and operating costs variations |
22-13 |
| Table 22-9: NPV sensitivity results (after-tax) for discount rate |
22-13 |
| Table 24-1: Project key milestones (preliminary) |
24-5 |
| Table 25-1: Cariboo Gold Project 2025 FS MRE reported at a 1.8 g/t Au cut-off grade |
25-2 |
| Table 25-2: Cariboo Gold Statement of Mineral Reserves, effective date of April 10, 2025 |
25-5 |
| Table 25-3: Average Gold Recovery and Process Step |
25-7 |
| Table 25-4: Capital cost summary (1)(2) |
25-14 |
| Table 25-5: Operating cost summary |
25-15 |
| Table 25-6: Financial analysis summary (pre-tax and after-tax) |
25-16 |
| Table 25-7: Project risks (preliminary risk assessment) |
25-19 |
| Table 25-8: Project opportunities |
25-24 |
| Table 26-1: Work program budget |
26-10 |
LIST OF FIGURES
| Figure 1-1: Mine Site surface and underground footprint |
1-2 |
| Figure 1-2: Capital cost distribution over LOM |
1-28 |
| Figure 1-3: Sensitivity of the net present value (after-tax) to financial variables |
1-32 |
| Figure 1-4: Sensitivity of the internal rate of return (after-tax) to financial variables |
1-32 |
| Figure 4-1: Location of the Cariboo Gold Project |
4-2 |
| Figure 4-2: Mineral title and ownership map for the Cariboo Gold Project |
4-4 |
| Figure 4-3: Placer tenure ownership map for the Cariboo Gold Project |
4-5 |
| Figure 4-4: Map of Crown-granted mineral claims on the Cariboo Gold Project |
4-6 |
| Figure 5-1: Access to the Cariboo Gold Project |
5-2 |
| Figure 5-2: Aerial view of the town of Wells looking east |
5-5 |
| Figure 7-1: BCGS bedrock geology of the Cariboo Gold Project area |
7-3 |
| Figure 7-2: A) Morphogeological belts of the Canadian Cordillera with the northern (N) |
7-4 |
| Figure 7-3: Lithospheric-scale cross-section of the southern Cordilleran Lithoprobe transect |
7-5 |
| Figure 7-4: Tectonic architecture of the Cariboo Gold District |
7-6 |
| Figure 7-5: Stratigraphic interpretations of the Snowshoe Group |
7-7 |
| Figure 7-6: Barkerville terrane nappe model |
7-9 |
| Figure 7-7: Simplified BC Hanging-wall tectonostratigraphy for the Island, Cow, |
7-12 |
| Figure 7-8: Select rock-types observed on the Cariboo Gold Project |
7-13 |
| Figure 7-9: Detailed tectonostratigraphic facies model for Island and Cow Mountains |
7-14 |
| |
Osisko Development Corp.
NI 43-101 Technical Report
Feasibility Study for the Cariboo Gold Project |
|
| Figure 7-10: Detailed tectonostratigraphic facies model for Barkerville Mountain |
7-15 |
| Figure 7-11: Geologic map of the core Cariboo Gold Project area |
7-16 |
| Figure 7-12: Vertical strike-perpendicular (left) and down-plunge strike-parallel (right) |
7-18 |
| Figure 7-13: Proserpine interpreted geology map |
7-19 |
| Figure 7-14: Cariboo-Hudson mine area geology within the Cunningham Region |
7-20 |
| Figure 7-15: Cariboo-Hudson mine area cross-section |
7-21 |
| Figure 7-16: Simplified tectonostratigraphy for the Cunningham region |
7-22 |
| Figure 7-17: Simplified Burns prospect stratigraphy |
7-23 |
| Figure 7-18: Burns Region geologic interpretation map |
7-24 |
| Figure 7-19: Yanks Peak geologic interpretation map |
7-26 |
| Figure 7-20: Relative orientation of variable structures arising from polyphase deformation |
7-27 |
| Figure 7-21: Deformation phases and associated fabrics on the Cariboo Gold Project |
7-29 |
| Figure 7-22: To scale schematic strike parallel Barkerville Mountain section illustrating |
7-29 |
| Figure 7-23: Mineralization styles observed on the Cariboo Gold Project |
7-33 |
| Figure 7-24: Mineralization styles observed on the Cariboo Gold Project |
7-34 |
| Figure 7-25: Schematic vertical section (looking NE) of vein alteration observed at the Project |
7-35 |
| Figure 7-26: Vein-related alteration styles at the Cariboo Gold Project |
7-36 |
| Figure 7-27: Compilation plot of 39Ar/40Ar age data from white mica in veins |
7-37 |
| Figure 8-1: Tectonic settings of gold-rich epigenetic mineral deposits |
8-2 |
| Figure 8-2: Model for the formation of vertical AXPL veins in the hinges of F3 folds |
8-4 |
| Figure 8-3: Composite model of the mineralization styles on the Cariboo Gold Project |
8-5 |
| Figure 8-4: a) Formation of structural traps in F2 hinges as L-Tectonites; |
8-6 |
| Figure 9-1: Barkerville’s mineral prospects of the Cariboo Region |
9-3 |
| Figure 9-2: Barkerville and Lightning Creek Trend showing BC Minfile prospects |
9-4 |
| Figure 9-3: Cariboo Regional mapping and rock sampling overview from 2015 to 2021 |
9-6 |
| Figure 9-4: Cariboo Regional soil sampling overview from 2016 to 2021 |
9-7 |
| Figure 10-1: Cariboo Gold Project Diamond Drilling Program Overview |
10-11 |
| Figure 10-2: Island Mountain Drilling Program 2015–2021 |
10-12 |
| Figure 10-3: Cross-section of Shaft Zone diamond drill holes with gold assay highlights |
10-13 |
| Figure 10-4: Cow Mountain Drilling Program 2015–2021 |
10-14 |
| Figure 10-5: Cross-section of Cow Mountain diamond drill holes with gold assay highlights |
10-15 |
| Figure 10-6: Barkerville Mountain Drilling Program 2015–2022 |
10-16 |
| Figure 10-7: Cross-section of Barkerville Mountain diamond drill holes |
10-17 |
| Figure 10-8: Proserpine Mountain Drill Program 2015–2021 |
10-18 |
| Figure 10-9: Cross-section of Proserpine Mountain diamond drill holes |
10-19 |
| |
Osisko Development Corp.
NI 43-101 Technical Report
Feasibility Study for the Cariboo Gold Project |
|
| Figure 10-10: Cross-section of Cow portal geotechnical drill holes with lithology |
10-20 |
| Figure 11-1: Example of results for standard OREAS 219 for the 2020 Program |
11-5 |
| Figure 11-2: Example of results for standard OREAS 237 for the 2021 Program |
11-6 |
| Figure 11-3: Results of blanks for the 2020 Program |
11-8 |
| Figure 11-4: Results of blanks for the 2021 Program |
11-9 |
| Figure 12-1: Site visit including core review (November 2021) |
12-5 |
| Figure 12-2: Plan view, continuity of AXPL veins |
12-7 |
| Figure 13-1: 2018 Sample locations – Plan view |
13-3 |
| Figure 13-2: 2018 Sample locations – Section view |
13-4 |
| Figure 13-3: 2024 Sample locations – Plan view |
13-9 |
| Figure 13-4: 2024 Sample locations – Section view |
13-9 |
| Figure 13-5: Frequency distribution of A*b in the JKTech database |
13-17 |
| Figure 13-6: Frequency distribution of A*b in the JKTech database |
13-18 |
| Figure 13-7: Ore sorting mass-recovery curves |
13-25 |
| Figure 13-8: Sample preparation flow diagram |
13-27 |
| Figure 13-9: XRT Scan (Shaft 1A sample) |
13-29 |
| Figure 13-10: Gold and sulphur recovery vs mass recovery |
13-30 |
| Figure 13-11: E-GRG flowsheet schematic |
13-33 |
| Figure 13-12: Gold recovery flotation kinetics |
13-39 |
| Figure 13-13: Impact of flotation time on mass pull and gold recovery |
13-40 |
| Figure 13-14: Flotation time vs gold recovery – Blend 1 |
13-42 |
| Figure 13-15: Flotation time vs gold recovery – Blend 2 |
13-43 |
| Figure 13-16: Flotation time vs gold recovery – Blend 3 |
13-43 |
| Figure 13-17: Effect of particle size on gold and sulphur recoveries – Rougher flotation |
13-48 |
| Figure 13-18: Gold head grade vs recovery – Rougher flotation |
13-49 |
| Figure 13-19: S head grade vs mass pull – Rougher flotation |
13-49 |
| Figure 13-20: Effect of regrind size – Cleaner flotation |
13-50 |
| Figure 13-21: Reagent optimization – Cleaner flotation |
13-51 |
| Figure 13-22: Head grade vs recovery – Cleaner flotation on sorted samples |
13-52 |
| Figure 13-23: Yield value vs percent solids |
13-58 |
| Figure 13-24: Settling rate vs Flocculant dosage |
13-60 |
| Figure 13-25: Yield stress vs solids density – Flotation concentrate underflow |
13-64 |
| Figure 13-26: Yield stress vs solids density – CIP detox tailings underflow |
13-65 |
| Figure 13-27: Solid content vs slump |
13-72 |
| Figure 13-28: Yield stress vs solids density |
13-73 |
| Figure 13-29: Water bleed and yield stress vs time |
13-73 |
| |
Osisko Development Corp.
NI 43-101 Technical Report
Feasibility Study for the Cariboo Gold Project |
|
| Figure 13-30: Plug depth vs yield stress |
13-74 |
| Figure 13-31: Solid content vs slump |
13-77 |
| Figure 13-32: Static yield stress vs solids density |
13-77 |
| Figure 13-33: Water bleed and yield stress vs time |
13-78 |
| Figure 13-34: Pipeline yield stress vs solids density |
13-79 |
| Figure 13-35: Estimated pressure losses in 6" SCH 80 pipeline |
13-79 |
| Figure 13-36: Estimated pressure losses in 6" SCH 40 pipeline |
13-80 |
| Figure 13-37: Uncemented sample - solid content vs slump |
13-84 |
| Figure 13-38: Static yield stress vs solid density |
13-85 |
| Figure 13-39: Dynamic yield stress vs solid density |
13-85 |
| Figure 13-40: Dynamic viscosity vs solid density |
13-86 |
| Figure 14-1: Surface plan view of the validated DDH used to in the 2025 FS MRE |
14-5 |
| Figure 14-2: Surface plan view of the validated Bonanza Ledge DDH for the 2025 FS MRE |
14-6 |
| Figure 14-3: Mineralized solids of the Cow, Valley, Shaft, Mosquito, Lowhee, BC Vein, |
14-8 |
| Figure 14-4: Example of data used for the 3D Shaft deposit model |
14-9 |
| Figure 14-5: Plan view section of the Lowhee AXPL Veins and surrounding 5 m dilution halo |
14-9 |
| Figure 14-6: Isometric view of the BC Vein and KL deposit models, and the AXPL-LP |
14-10 |
| Figure 14-7: Isometric view of the BC Vein, Bonanza Ledge, and KL deposit models |
14-10 |
| Figure 14-8: Bulk sample at Lowhee and development (blue) with the previous development (grey) |
14-12 |
| Figure 14-9: Plan and longitudinal view of the 5-m buffer voids for Cow Mountain and Island Mountain |
14-13 |
| Figure 14-10: Longitudinal view of the 5-m buffer voids for the
BC Vein, Bonanza Ledge, and KL deposits |
14-14 |
| Figure 14-11: Indicator variograms for the Shaft deposit |
14-17 |
| Figure 14-12: Grade log histogram and probability plot for the Shaft deposit |
14-17 |
| Figure 14-13: Variogram models of gold grade for the Cow deposit |
14-21 |
| Figure 14-14: Validation of the Valley block model, comparing drill hole composites |
14-25 |
| Figure 14-15: Shaft model validation using three or five-direction swath plots |
14-27 |
| Figure 14-16: Example of a clipping boundary for classification |
14-30 |
| Figure 14-17: Longitudinal view showing the classified Mineral Resources |
14-31 |
| Figure 16-1: Plan view showing collar locations of 2018 and 2021 geotechnical drill holes for the Project |
16-3 |
| Figure 16-2: Existing underground workings and completed bulk sample – Section view looking NE |
16-11 |
| Figure 16-3: Longitudinal longhole retreat - Mining cycle |
16-17 |
| Figure 16-4: Two-pass variant of the longitudinal longhole stoping |
16-18 |
| |
Osisko Development Corp.
NI 43-101 Technical Report
Feasibility Study for the Cariboo Gold Project |
|
| Figure 16-5: Plan view of main mining zones |
16-21 |
| Figure 16-6: Cariboo Gold Project – Longitudinal section looking north |
16-23 |
| Figure 16-7: Location of Cariboo ramp, crusher facilities and Shaft ore silos |
16-25 |
| Figure 16-8: Location of crushing facility and conveyor |
16-26 |
| Figure 16-9: Plan view of typical level layout |
16-27 |
| Figure 16-10: General arrangement truck loading and unloading |
16-29 |
| Figure 16-11: Typical drilling pattern - Valley Zone – Plan view |
16-30 |
| Figure 16-12: Typical drilling configuration for Valley Zone, side view |
16-31 |
| Figure 16-13: Longitudinal section of Shaft Zone looking north |
16-32 |
| Figure 16-14: Perspective view of Shaft Zone showing traversing fault structures, looking north |
16-33 |
| Figure 16-15: Longitudinal section of Valley Zone looking north |
16-34 |
| Figure 16-16: View of Valley Zone showing traversing fault structures, looking north |
16-35 |
| Figure 16-17: Longitudinal section of Cow Zone looking north |
16-36 |
| Figure 16-18: Perspective view of Cow Zone looking northeast showing fault structures |
16-37 |
| Figure 16-19: Longitudinal section of Lowhee Zone looking north |
16-38 |
| Figure 16-20: Perspective view of Lowhee Zone looking northeast showing fault structures |
16-39 |
| Figure 16-21: Longitudinal section of Mosquito Zone looking north |
16-40 |
| Figure 16-22: Perspective view of Mosquito Zone looking northeast showing fault structure |
16-41 |
| Figure 16-23: Internal dilution strategy for stopes |
16-42 |
| Figure 16-24: Ore and waste handling flowsheet |
16-46 |
| Figure 16-25: Underground crushing facilities flowsheet |
16-48 |
| Figure 16-26: Underground waste circuit flowsheet |
16-49 |
| Figure 16-27: Underground grizzly and rock breaker station |
16-50 |
| Figure 16-28: Underground crushing system circuit |
16-51 |
| Figure 16-29: Plan view underground closed loop crushing station |
16-52 |
| Figure 16-30: Underground loading station |
16-53 |
| Figure 16-31: Transfer point and transfer conveyor plan view |
16-54 |
| Figure 16-32: Underground ore sorter waste truck chute |
16-55 |
| Figure 16-33: Underground paste fill route |
16-59 |
| Figure 16-34: Paste Fill distribution network for upper part of Valley and in route for Shaft and Cow |
16-59 |
| Figure 16-35: Pipe routing for upper and lower part of Shaft and lower part of Valley |
16-60 |
| Figure 16-36: Cow paste fill network and booster station location |
16-61 |
| Figure 16-37: Mosquito paste fill network distribution |
16-62 |
| Figure 16-38: Lowhee paste fill network distribution |
16-63 |
| |
Osisko Development Corp.
NI 43-101 Technical Report
Feasibility Study for the Cariboo Gold Project |
|
| Figure 16-39: Typical paste fill-level distribution network |
16-64 |
| Figure 16-40: Booster station (two pumps shown) |
16-67 |
| Figure 16-41: Mining plan by areas long section |
16-68 |
| Figure 16-42: Annual mined ore tonnag e and grade |
16-72 |
| Figure 16-43: Mine plan by sector |
16-72 |
| Figure 16-44: Annual ore mined by zone |
16-74 |
| Figure 16-45: Distribution of ore tonnage between development and production |
16-75 |
| Figure 16-46: Ventilation layout LOM |
16-80 |
| Figure 16-47: Ramp development Shaft/Valley layout |
16-81 |
| Figure 16-48: Drop raise ventilation on levels |
16-82 |
| Figure 16-49: Production level auxiliary ventilation with drop raises |
16-83 |
| Figure 16-50: Production level ventilation layout without drop raises |
16-83 |
| Figure 16-51: Flooded historic workings and estimated water level |
16-84 |
| Figure 16-52: Typical sump using the Wilson sump principle |
16-86 |
| Figure 16-53: Typical drawing for the tank on skid and technoprocess pump |
16-87 |
| Figure 16-54: Typical water management flow sheet (Valley Zone) |
16-88 |
| Figure 16-55: Mudwizard system schematic |
16-89 |
| Figure 16-56: Schematic of a standard mine communications system |
16-93 |
| Figure 17-1: Process simplified flowsheet |
17-3 |
| Figure 17-2: Cariboo Project GA (western view) |
17-4 |
| Figure 17-3: Cariboo Project GA (southern view) |
17-5 |
| Figure 17-4: Cariboo Project GA (top view) |
17-6 |
| Figure 18-1: Mine Site surface and underground footprints |
18-2 |
| Figure 18-2: Cariboo Gold Project Mine Site Complex general arrangement |
18-5 |
| Figure 18-3: Flow Diagram – Water Management Stage 1 |
18-11 |
| Figure 18-4: Flow Diagram – Water Management Stage 2 |
18-12 |
| Figure 18-5: Bonanza Ledge – Water Management Stage 1 |
18-13 |
| Figure 18-6: Bonanza Ledge – Water Management Stage 2 |
18-14 |
| Figure 18-7: Mine Site Complex – Water Management Stage 2 |
18-15 |
| Figure 18-8: Bonanza Ledge Site water management infrastructure layout |
18-17 |
| Figure 18-9: Mine Site Complex water management infrastructure layout |
18-20 |
| Figure 18-10: Layout plan showing the WRSF location |
18-23 |
| Figure 18-11: Proposed Bonanza Ledge pipeline pathways |
18-25 |
| Figure 18-12: Preliminary office and mine dry layouts |
18-29 |
| Figure 18-13: Preliminary air intake locations |
18-31 |
| Figure 18-14: MSC pipeline pathways |
18-34 |
| |
Osisko Development Corp.
NI 43-101 Technical Report
Feasibility Study for the Cariboo Gold Project |
|
| Figure 18-15: Proposed Ballarat camp expansion |
18-41 |
| Figure 19-1: Historical monthly gold price (USD/oz) |
19-2 |
| Figure 20-1: WBM results for Bonanza Ledge WTP and Mine Site Complex WTP |
20-16 |
| Figure 20-2: Environmental design storm event: rainfall + snowmelt adjusted for climate change |
20-17 |
| Figure 20-3: WBM results for the EDF, base case mine groundwater inflow single model realization |
20-18 |
| Figure 21-1: Overall Cariboo Gold Project capital cost profile |
21-2 |
| Figure 21-2: Overall construction Project labour S-Curve |
21-38 |
| Figure 22-1: Annual and cumulative gold production |
22-3 |
| Figure 22-2: Overall Cariboo Gold Project capital cost profile |
22-4 |
| Figure 22-3: Life of mine cash flow projection (cumulative, pre-tax and after-tax) |
22-9 |
| Figure 22-4: Main value drivers (discounted at 5%) |
22-11 |
| Figure 22-5: Sensitivity of the net present value (after-tax) to financial variables |
22-14 |
| Figure 22-6: Sensitivity of the internal rate of return (after-tax) to financial variables |
22-15 |
| Figure 23-1: Adjacent properties |
23-2 |
| Figure 24-1: Ballarat Camp lodging requirements (by department) |
24-9 |
| Figure 25-1: Sensitivity of the net present value (after-tax) to financial variables |
25-17 |
| Figure 25-2: Sensitivity of the internal rate of return (after-tax) to financial variables |
25-17 |
| |
Osisko Development Corp.
NI 43-101 Technical Report
Feasibility Study for the Cariboo Gold Project |
|
List of Abbreviations and Units
of Measurement
| Abbreviation |
Description |
| $ or CAD |
Canadian dollar |
| $/oz |
dollars per ounce |
| $/t |
dollars per tonne |
| % |
percent |
| ¢/kWh |
cents per kilowatt hour |
| °C |
degrees Celsius |
| µm |
micron |
| 3D |
three dimensional |
| A |
ampere |
| AACE |
American Association of Cost Engineers |
| AAS |
atomic absorption spectroscopy |
| ABA |
acid-base accounting |
| ADSS |
all-dielectric self-supporting |
| Ag |
silver |
| Ai |
abrasion index |
| AIS |
air insulated switchgear |
| AISC |
all-in sustaining cost |
| Al |
aluminum |
| Al2O3 |
aluminium oxide |
| Alius |
Alius Mining Consulting Ltd. |
| ALR |
Agricultural Land Reserve |
| ALS |
ALS Minerals |
| ARD |
acid rock drainage |
| As |
Arsenic |
| ASG |
apparent specific gravity |
| ATV |
all-terrain vehicle |
| Au |
gold |
| Au-in soil |
gold-in-soil |
| AXPL |
axial planar |
| Ba |
barium |
| Bar |
unit of pressure equal to 100,000 Pa (100 kPa) |
| Base Met Labs |
Base Metallurgical Laboratories Ltd. |
| BBA |
BBA Engineering Ltd. |
| BC |
British Columbia statutory |
| BCEAA |
British Columbia Environmental Assessment Act |
| |
Osisko Development Corp.
NI 43-101 Technical Report
Feasibility Study for the Cariboo Gold Project |
|
| Abbreviation |
Description |
| BCMWRPRC |
British Columbia Mine Waste Rock Pile Research Committee |
| BCSC |
British Columbia Securities Commission |
| BGM |
Barkerville Gold Mines Ltd. |
| BH |
borehole |
| BL |
Bonanza Ledge |
| BM |
Barkerville Mountain |
| BM-CM-IM |
Barkerville Mountain-Cow Mountain-Island Mountain |
| BMPs |
Best Management Practices |
| BOM |
bill of material |
| BWi |
Bond work index |
| C |
carbon |
| CA |
channel aggregation |
| CAA |
Caribou Assessment Area |
| CAC |
criteria air contaminants |
| CAM |
Chlumsky, Armbrust and Meyer LLC |
| CaO |
calcium oxide (lime) |
| CAPEX |
capital expenditure |
| CB |
cable bolt |
| CCLUP |
Cariboo Chilcotin Land Use Plan |
| CDC |
Conservation Data Centre |
| Ce |
cerium |
| CEC |
Clean Energy Consulting Inc. |
| CEMP |
Construction Environmental Management Plan |
| CFM |
cubic feet per minute |
| CGL |
conglomerate |
| CIM |
Canadian Institute of Mining, Metallurgy and Petroleum |
| CIP |
carbon-in-pulp |
| Cl |
chloride |
| CLMV |
Calcareous Mafic Volcaniclastic |
| CLSI |
calcareous siltstone |
| CLSS |
calcareous sandstone |
| cm |
centimetre |
| CM |
Cow Mountain |
| cm3 |
cubic centimetre |
| CMS |
Cavity Monitoring System |
| CMT |
Construction Management Team |
| CN |
cyanide |
| |
Osisko Development Corp.
NI 43-101 Technical Report
Feasibility Study for the Cariboo Gold Project |
|
| Abbreviation |
Description |
| Co |
cobalt |
| CoG |
cut-off grade |
| Conc. |
concentrate |
| COO |
Chief Operating Officer |
| COPC |
constituent of potential concern |
| CPT |
cone penetration test |
| Cr |
chromium |
| CRD |
Cariboo Regional District |
| CRM(s) |
certified reference material(s) |
| CSA |
Canadian Standards Association |
| CSI |
carbonaceous siltstone |
| CTO |
cease trade order |
| Cu |
copper |
| CWi |
Crusher Work index |
| CZ |
Cow Zone |
| d |
day (24 hours) |
| Datamine |
Datamine StudioTM RM Pro 1.11.300.0 |
| DDH |
diamond drill hole |
| deg or ° |
angular degree |
| DFO |
Department of Fisheries and Oceans |
| DMR |
digital mobile radio |
| DRIPA |
BC’s Declaration on the Rights of Indigenous Peoples Act |
| DRP |
Decommissioning and Closure Plan |
| DSO |
Deswik Stope Optimizer |
| DTH |
down the hole |
| DWi |
DWI = Drop Weight index |
| EA |
Environmental Assessment |
| EAC |
Environmental Assessment Certificate |
| EAO |
Environmental Assessment Office |
| EBA |
EBA Engineering Consultants Ltd. |
| EBIT |
earnings before interest and tax |
| ECCC |
Environment and Climate Change Canada |
| EDF |
Environmental Design Flood |
| EGBC |
Engineers & Geoscientists British Columbia |
| E-GRG |
extended gravity recoverable gold test |
| EL |
elevation |
| ELOS |
estimated linear overbreak and sloughing |
| |
Osisko Development Corp.
NI 43-101 Technical Report
Feasibility Study for the Cariboo Gold Project |
|
| Abbreviation |
Description |
| EMA |
Environmental Management Act |
| EMLI |
BC Ministry of Energy, Mines and Low Carbon Innovation |
| ENV |
Ministry of Environment and Parks |
| EOH |
end of hole |
| EPCM |
Engineering, Procurement, Construction Management |
| ERT |
Emergency Response Team |
| ESS |
electrical substation |
| et al. |
et alla (and others) |
| EXT |
extensional |
| F80 |
80% passing - feed size |
| FA |
fire assay |
| FAAS |
Flame Atomic Absorption Spectroscopy |
| Falkirk |
Falkirk Environmental Consultants Ltd. |
| FCF |
Free Cash Flow |
| Fe |
iron |
| Fe2O3 |
iron (III) oxide |
| FEC |
Falkirk Environmental Consulting |
| FIDQ |
Fish Inventories Data Queries (Fisheries Information Data Queries) |
| FIFO |
fly-in fly-out |
| FLNRORD |
Forests, Lands, Natural Resource Operations, and Rural Development |
| FMR |
flood management reservoir |
| FoS |
factor of safety |
| FS |
Feasibility Study |
| FSR |
forest service road |
| ft or ’ |
feet (12 inches) |
| FW |
footwall |
| g |
gram |
| G&A |
general and administration |
| GA |
general arrangement |
| GAC |
granular activated carbon |
| GEMS |
GEOVIA GEMSTM software v.6.7 |
| Geoex |
Geoex Ltd. |
| GHG |
Green House Gas |
| GHz |
gigahertz |
| Gold City Mining |
Gold City Mining Corp. |
| Golden Cariboo |
Golden Cariboo Resources Ltd. |
| Golder |
Golder Associated Ltd. |
| |
Osisko Development Corp.
NI 43-101 Technical Report
Feasibility Study for the Cariboo Gold Project |
|
| Abbreviation |
Description |
| GPa |
gigapascal |
| Gpr |
grams per revolution |
| h |
hour (60 minutes) |
| h/day |
hour per day |
| ha |
hectare |
| HADD |
harmful alteration, disruption, or destruction |
| HCT |
humidity cell test |
| HDPE |
high-density polyethylene |
| HDS |
High-Density Sludge |
| HIT |
Hardness Index Test |
| HMI |
human-machine interface |
| hp |
horsepower |
| HQ |
HQ - drill core diameter (63.5 millimetres) |
| HSE |
health, safety and environment |
| HSRC |
Health, Safety, and Reclamation Code |
| Hudson Bay |
Hudson Bay Mining and Smelting Co. Ltd. |
| HVAC |
heating, ventilation, and air conditioning |
| HW |
hanging wall |
| Hy-Tech |
Hy-Tech Drilling Ltd. |
| I/O |
input/output |
| IBA |
Impact Benefit Agreement |
| ICP |
inductively coupled plasma |
| ICP-MS |
inductively coupled plasma mass spectroscopy |
| ID |
identification |
| ID2 |
inverse distance squared |
| IDF |
Inflow Design Flood |
| IEC |
International Electrotechnical Commission |
| IFA |
Issued for Approval |
| IFC |
Issue for Construction |
| IGM |
Island Mountain Gold Mines Ltd. |
| IHA |
Interior Health Authority |
| IM |
Island Mountain |
| in or ” |
inch |
| InnovExplo |
InnovExplo Inc. |
| IOT |
Integrated Operations Team |
| IP |
induced polarization |
| IRR |
internal rate of return |
| |
Osisko Development Corp.
NI 43-101 Technical Report
Feasibility Study for the Cariboo Gold Project |
|
| Abbreviation |
Description |
| IRS |
intact rock strength |
| IS |
Integrated Sustainability Consultants Ltd. |
| ISO |
International Organization for Standardization |
| IT |
information technology |
| IWAs |
Important Wildlife Areas |
| IWGM |
International Wayside Gold Mines Ltd. |
| JDS |
JDS Energy & Mining Inc. |
| JPA |
Joint Permit Application |
| K |
potassium |
| K2O |
potassium oxide |
| K80 |
80% passing – particle size |
| KCB |
Klohn Crippen Berger Consultants |
| KCC |
KCC Geoconsulting Inc. |
| kcfm |
kilowatt cubic foot per minute |
| kg |
kilogram |
| kgD.S |
kilogram dry solid |
| KL |
KL Zone (deposit) separately |
| km |
kilometre |
| kN |
kilonewton |
| koz |
thousand ounces |
| kPa |
kilopascal |
| kt |
kilotonne |
| kV |
kilovolt |
| kW |
kilowatt |
| kWh |
kilowatt hour |
| L |
litre |
| La |
lanthanum |
| lb |
pound(s) |
| LBMA |
London Bullion Market Association |
| LCT |
locked cycle test |
| LeapFrog |
LeapFrog GEOTM v.2021.2.4 |
| LECO |
A type of elemental analyzer |
| LHD |
load-haul-dump (scooptram) |
| Li |
lithium |
| LOM |
life of mine |
| LOO |
License of Occupation |
| LP |
layer parallel |
| |
Osisko Development Corp.
NI 43-101 Technical Report
Feasibility Study for the Cariboo Gold Project |
|
| Abbreviation |
Description |
| LPG |
Liquified petroleum gas |
| LPT |
large penetration testing |
| LSA |
local study area |
| LST |
limestone |
| LST |
limestone |
| LTE |
long-term evolution |
| m |
metre |
| M |
million |
| m2 |
square metre |
| m3 |
cubic metre |
| m3/day |
cubic metres per day |
| m3/s/kW |
cubic metres per second per kilowatt |
| Ma |
mega annum (million years) |
| masl |
metres above sea level |
| MBBR |
moving bed biofilm reactor |
| Mbps |
Megabits per second |
| MBR |
membrane biological reactor |
| MC |
Mosquito Creek |
| MCC |
Motor Control Centre |
| MCM |
Mining and Critical Minerals |
| MD&A |
Management Discussion and Analysis |
| mesh |
US Mesh |
| Mg |
magnesium |
| mg |
milligram |
| MgO |
magnesium oxide |
| Mi |
ore work index (includes Mia, Hih and Mic) |
| Mia |
coarse ore work index |
| MIBC |
methyl isobutyl carbinol |
| Mic |
Crushing ore work index |
| Mih |
HPGR ore work index |
| Min |
minimum |
| min |
minute (60 seconds) |
| MINFILE |
Mineral Inventory of BC |
| ML |
metal leaching |
| ml |
millilitre |
| MLARD |
Metal Leaching and Acid Rock Drainage |
| mm |
millimetre |
| |
Osisko Development Corp.
NI 43-101 Technical Report
Feasibility Study for the Cariboo Gold Project |
|
| Abbreviation |
Description |
| MnO |
manganese(II) oxide |
| MOF |
Ministry of Forests |
| Mosquito Creek Gold |
Mosquito Creek Gold Mining Company Ltd. |
| MOTI |
Ministry of Transportation and Infrastructure |
| Moz |
million ounces |
| MPa |
megapascal |
| mPa |
millipascal |
| mPa.s |
Millipascal-second |
| MRE |
Mineral Resource Estimate |
| MRMR |
Mineral Resources and Mineral Reserves |
| M-S |
mesh-strap |
| MSC |
Mine Site Complex |
| msl |
mean sea level |
| MSO |
Minable Shape Optimiser® |
| Mt |
million tonnes |
| MTO |
material take off |
| MVA |
mega volt ampere |
| MW |
megawatt |
| MX |
mineral exploration (permit) |
| MZ |
Mosquito Zone |
| Na |
sodium |
| Na2O |
sodium oxide |
| NaCN |
sodium cyanide |
| NE |
northeast |
| Newmont |
Newmont Mining Corporation |
| NF |
nanofiltration |
| NHA |
Northern Health Authority |
| Ni |
nickel |
| NI 43-101 |
National Instrument 43-101 |
| NN |
nearest neighbour |
| No. or # |
number |
| NO2 |
nitrogen dioxide |
| NPAG |
non-potentially acid generating |
| NPC |
Natal Portland Cement |
| NPV |
net present value |
| NQ |
NQ - drill core diameter (47.6 millimetres) |
| NS |
no sample |
| |
Osisko Development Corp.
NI 43-101 Technical Report
Feasibility Study for the Cariboo Gold Project |
|
| Abbreviation |
Description |
| NSR |
net smelter return |
| NYSE |
New York Stock Exchange |
| Ø |
diameter |
| O&M |
Operation and Maintenance |
| O/S |
oversize |
| ODV or the Company |
Osisko Development Corp. |
| OGR |
Osisko Gold Royalties Ltd. |
| OK |
ordinary kriging |
| Okane |
M.S. O’Kane Consultants Inc. |
| OPEX |
operational expenditure |
| OREAS |
Ore Research and Exploration Pty Ltd. |
| OSC |
ore sorter concentrate |
| oz |
troy ounce |
| P2O5 |
phosphorus pentoxide |
| P80, P80 |
80% passing - product size |
| Pa |
pascal |
| Pa.s |
pascal-second |
| PAG |
potentially acid generating |
| Pan Orvana |
Pan Orvana Resources Inc. |
| PAX |
potassium amyl xanthate |
| Paycore |
Paycore Drilling |
| Pb |
lead |
| PD |
positive displacement |
| PDT |
project development team |
| PEA |
preliminary economic assessment |
| Peregrine |
Peregrine Petroleum Ltd. |
| PFS |
pre-feasibility study |
| pH |
potential of hydrogen |
| PLC |
programmable logic controller |
| PoC |
Push-to-talk Over Cellular |
| PPE |
personal protective equipment |
| ppm |
parts per million |
| PQ |
PQ – drill core diameter (85.0 millimetres) |
| PSD |
particle size distribution |
| psi |
pounds per square inch |
| Q1, Q2, Q3, Q4… |
first, second, third, forth… quarter |
| |
Osisko Development Corp.
NI 43-101 Technical Report
Feasibility Study for the Cariboo Gold Project |
|
| Abbreviation |
Description |
| QA/QC |
quality assurance / quality control |
| QEMSCAN |
quantitative evaluation of materials by scanning electron microscopy |
| QP(s) |
qualified person(s) |
| QR |
Quesnel River |
| QR Mill |
Quesnel River Mill |
| QSRMP |
Quesnel Sustainable Resource Management Plan |
| R&D |
research and development |
| RB |
rebar |
| RCP |
Reclamation and Closure Plan |
| RFP |
request for proposal |
| RLCE |
Reclamation Liability Cost Estimate |
| RMR |
rock mass rating |
| RO |
Reverse Osmosis |
| ROM |
run of mine |
| rpm |
rotations per minute |
| RQD |
rock quality designation |
| RSA |
regional study area |
| RWi |
Road Work index |
| s |
second |
| S |
sulphur |
| SARA |
Species at Risk Act |
| SC |
shotcrete |
| SCP |
Sediment Control Pond |
| SCSE |
SAG Circuit Specific Energy |
| SD |
standard deviation |
| SDM |
Statutory Decision Maker |
| Se |
selenium |
| SEDAR+ |
System for Electronic Document Analysis and Retrieval |
| SG |
specific gravity |
| SGS |
Société Générale de Surveillance |
| SI |
siltstone |
| SiO2 |
silica dioxide |
| SMA |
Screen metallic analysis |
| Snowden |
Snowden Mining Industry Consultants Pty |
| SOP |
standard operating procedure |
| SP |
self-potential |
| Sr |
strontium |
| |
Osisko Development Corp.
NI 43-101 Technical Report
Feasibility Study for the Cariboo Gold Project |
|
| Abbreviation |
Description |
| SRK |
SRK Consulting (Canada) Inc. |
| SS |
sandstone |
| SST |
site services team |
| st |
short ton (2,000 lb) |
| Supervisor |
Datamine Supervisor v.8.14.3 |
| SZ |
Shaft Zone |
| t |
tonne (1,000 kg) (metric ton) |
| t CO2eq |
Tonnes of carbon dioxide equivalent |
| t CO2eq |
tonne carbon dioxide equivalent |
| Talisker |
Talisker Exploration Services Inc. |
| TCC |
total cash cost |
| TCS |
triaxial compressive strength |
| TiO2 |
titanium dioxide |
| TL |
Transmission Line |
| TOC |
total organic carbon |
| tpd |
tonnes per day |
| tph |
tonnes per hour |
| TSF |
tailings storage facility |
| TSS |
total suspended solids |
| TSX |
Toronto Stock Exchange |
| TSXV |
TSX Venture Exchange |
| U |
uranium |
| U/F |
underflow |
| U/G |
underground |
| U/S |
undersize |
| UCS |
uniaxial or unconfined compressive strength |
| UDS |
underground distribution system |
| UF |
ultrafiltration |
| U-Pb |
uranium-lead (dating) |
| USD |
United States dollar (example of use: USD 2.5M) |
| USWG |
United States Water Gallon |
| UTM |
Universal Transverse Mercator |
| UWR |
Ungulate Winter Range |
| V |
vanadium |
| V |
volt |
| VCs |
valued components |
| VLF-EM |
very-low-frequency electromagnetic |
| |
Osisko Development Corp.
NI 43-101 Technical Report
Feasibility Study for the Cariboo Gold Project |
|
| Abbreviation |
Description |
| vs |
versus |
| VWP |
vibrating wire piezometer |
| VZ |
Valley Zone |
| w/w |
weight per weight |
| WAN |
wide area network |
| WBM |
water balance model |
| WBS |
work breakdown structure |
| Wells |
District of Wells |
| WGC |
World Gold Council |
| WHA |
Wildlife Habitat Area |
| WLRS |
Ministry of Water, Land, and Resource Stewardship |
| WMP |
water management plan |
| WQM |
water quality model |
| WRSF |
waste rock storage facility |
| WSP |
WSP Canada Inc. |
| wt% |
percentage by weight |
| wt% solids |
percent solids by weight |
| WTP |
water treatment plant |
| WTS |
water treatment system |
| WWM |
welded wire mesh |
| XRD |
X-ray diffraction |
| XRT |
X-ray transmission |
| y |
year (365 days) |
| Zn |
zinc |
| Zr |
zirconium |
| |
Osisko Development Corp.
NI 43-101 Technical Report
Feasibility Study for the Cariboo Gold Project |
|
This NI 43-101 Technical Report Feasibility Study
(“FS”) for the Cariboo Gold Project (the “Project”) (the “Report”) was prepared and compiled by BBA
Engineering Ltd. at the request of Osisko Development Corp. (“ODV”). The Project is an advanced stage gold exploration project
located in the historic Wells-Barkerville mining camp, in the District of Wells (“Wells”), British Columbia (“BC”),
Canada. The purpose of this Report is to summarize the results of the FS for the Project in accordance with the guidelines of the Canadian
Securities Administrators National Instrument 43-101 (“NI 43-101”) and Form 43-101F1.
This Report was prepared based on contributions
from several independent consulting firms including BBA Engineering Ltd. (“BBA”), InnovExplo Inc. (“InnovExplo”),
WSP Canada Inc. (“WSP”), JDS Energy & Mining Inc. (“JDS”), Falkirk Environmental Consultants Ltd. (“Falkirk”), Integrated
Sustainability Consultants Ltd. (“IS”), M.A. O’Kane Consultants Inc. (“Okane”), Alius Mine Consulting Inc.
(“Alius”), and Clean Energy Consulting Inc. (“CEC”). This Study provides a base case assessment for developing
the Cariboo Gold deposit as an underground mine with a Services Building, including a concentrator located at the Mine Site Complex (“MSC”)
at Wells, and a new water treatment plant (“WTP”).
The Project is designed for one phase, for a total
mine life of 10 years, a concentrator is designed to have a capacity of 4.900 tpd, and a new WTP will be built at the MSC. The waste rock
storage facility (“WRSF”) will be located at Bonanza Ledge. The Mine Site consists of the MSC and Bonanza Ledge. The Mine
Site surface and underground footprints are shown in Figure 1-1.
| |
Osisko Development Corp.
NI 43-101 Technical Report
Feasibility Study for the Cariboo Gold Project |
|
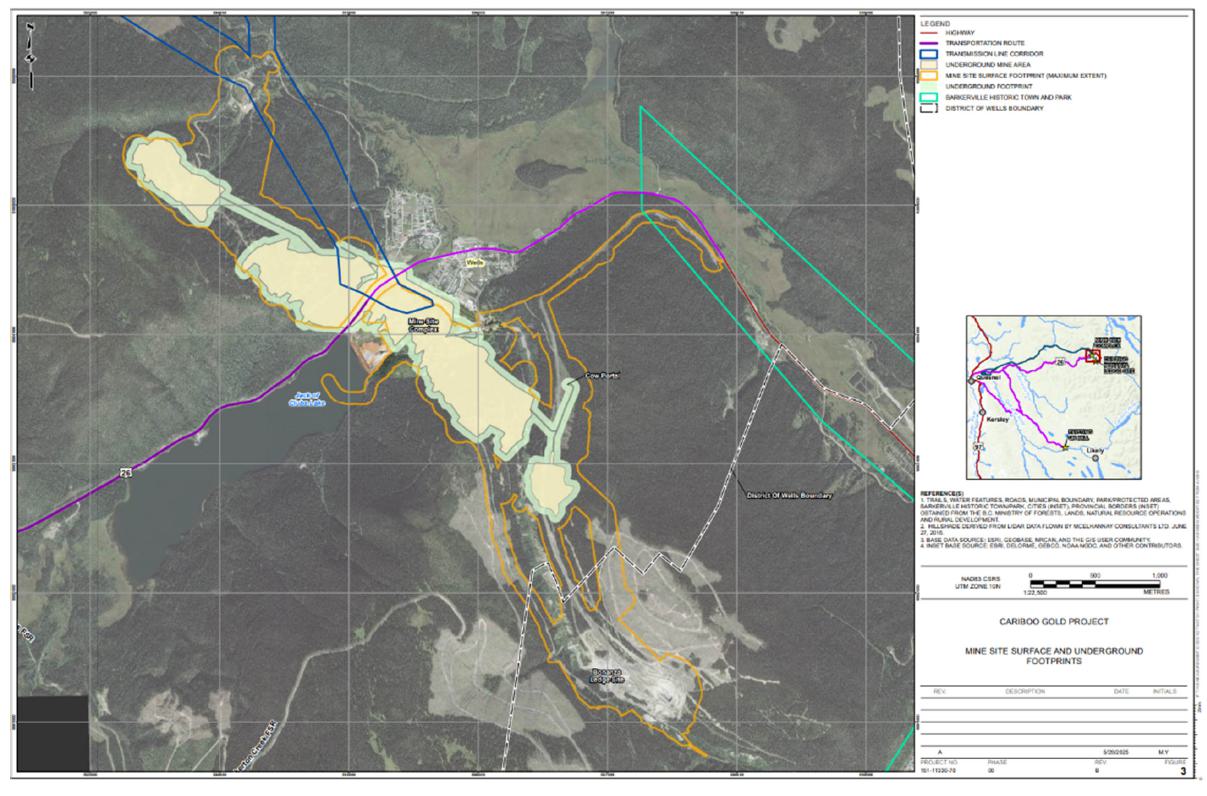
Figure 1-1: Mine Site surface
and underground footprint
| |
Osisko Development Corp.
NI 43-101 Technical Report
Feasibility Study for the Cariboo Gold Project |
|
All monetary units in the Report are in Canadian
dollars (“CAD” or “$”), unless otherwise specified. Costs are based on second quarter (Q2) 2025 dollars. Quantity
and grades are rounded to reflect that the reported values represent approximations.
The major FS contributors and their respective
areas of responsibility are presented in Table 1-1.
Table 1-1: Report contributors
| Qualified
Person |
General
Overview of Responsibilities |
| BBA
Engineering Ltd. (“BBA”) |
|
■ Mathieu
Bélisle, P.Eng.
■ Amanda
Fitch, P.Eng. |
■ Metallurgical
test work analysis, processing plant design;
■ Process
plant capital and operating costs;
■ Electrical
and IT infrastructure design and costs for the process plant only;
■ Market
studies section and contracts;
■ General
and administration operating costs;
■ Financial
analysis and overall NI 43-101 integration. |
| InnovExplo
Inc. (“InnovExplo”) |
|
■ Carl
Pelletier, P.Geo.
■ Tessa
Scott, P.Geo.
■ Eric
Lecomte, P.Eng. |
■ Current
and historical geology, exploration, drilling, sample preparation and QA/QC, and data verification;
■ Geological
modelling and mineral resource estimate;
■ Mineral
reserves estimate;
■ Underground
mine design, mine services (ventilation, dewatering, underground electrical distribution, mine equipment, underground communication network),
production scheduling, mine personnel, underground capital costs and operating costs;
■ Historical
data review;
■ Capital
and operating costs for the underground mine (production, development, and services). |
| WSP
Canada Inc. (“WSP”) |
■ Paul Gauthier, P.Eng.
|
■ Underground
material handling systems;
■ Backfill
strategy, design of distribution system underground, flow model analysis, paste piping and pumps, booster stations;
■ Capital
and operating costs for the underground material handling and paste fill system. |
| |
Osisko Development Corp.
NI 43-101 Technical Report
Feasibility Study for the Cariboo Gold Project |
|
| Qualified
Person |
General
Overview of Responsibilities |
| JDS
Energy & Mining Inc. (“JDS”) |
| ■ Jean-François Maillé, P.Eng. |
■ Surface
mobile equipment selection;
■ Water
treatment conveyance infrastructure design (pumping and pipelines);
■ Fuel
storage and distribution;
■ Site
preparation and road designs;
■ Ancillary
facilities including office complex and dry, air intake raises, ERT garage, sewage treatment, potable water treatment, Ballarat Camp;
■ Construction
and execution schedule;
■ Construction
personnel;
■ Capital
and operating costs associated to listed site infrastructure, water and waste management, and indirect capital cost estimation. |
| Falkirk
Environmental Consultants Ltd. |
|
■ Katherine
Mueller, P. Eng.
■ Rob
Griffith, P.Eng.
■ Nikolay
Sidenko, P.Geo. |
■ Environmental
studies;
■ Environmental
liabilities;
■ Management
and monitoring;
■ Water
quantity and quality;
■ Hydrogeology
input to underground mine design;
■ Geochemistry;
■ Considerations
of Social and Community Impacts;
■ Mine
Closure requirements;
■ Permitting
and required approvals. |
| Integrated
Sustainability |
| ■ A.J. MacDonald, P.Eng. |
■ Water
treatment design and strategy (for Bonanza Ledge and new MSC);
■ Capital
and operating costs for the water treatment at the Site. |
| M.A.
O’Kane Consultants Inc. (Okane) |
|
■ Yapo
Allé-Ando, P.Eng.
■ Rachel
Sawyer, P.Eng. |
■ Water
management infrastructure strategy and design (Bonanza Ledge and MSC);
■ Waste
rock storage facility strategy and design (Bonanza Ledge). |
| Alius
Mine Consulting Inc. (Alius) |
| ■ Sebastien Guido, P.Eng. |
■ Rock
mass characterization and rock mechanics input to underground mine design and ground control;
■ Underground
support recommendations. |
| Clean
Energy Consulting Inc. (CEC) |
| ■ Philip Clark, P.Eng. |
■ Site
electrical distribution and transmission line engineering;
■ Substation
design (MSC);
■ Initial
capital cost estimate for transmission line and substation (leading to preliminary financing agreement). |
| |
Osisko Development Corp.
NI 43-101 Technical Report
Feasibility Study for the Cariboo Gold Project |
|
The reader is advised that the results of the
FS summarized in this Report are intended to provide an initial, high-level review of the Project and potential design options. The FS
has been updated from the 2023 version (“2023 FS”) with key changes tabulated in Section 1.3. The FS mine plan and economic
model include numerous assumptions. Only Measured and Indicated Mineral Resources are used as the basis for estimating Proven and Probable
Reserves, and have been used in the economic analysis as defined by Canadian Securities Administrators' NI 43 101 in FS studies.
The following list details the key Project outcomes
of the Report:
| ■ | Robust returns with base case after-tax net present value (“NPV”)
at 5% rate of $943 million (“M”), unlevered after-tax internal rate of return (“IRR”) of 22.1% and payback1
of 2.8 years at $2,400 per ounce (“$/oz”) gold price assumption. Using spot gold price of $3,300/oz, NPV5% improves to $2,066M, IRR
38.0%, and payback1 of 1.6 years; |
| ■ | Cariboo Gold Mineral Resources: 17.38 million tonnes (“Mt”)
at 2.88 grams per tonne (“g/t”) gold (“Au”) (Measured and Indicated) and 18.77 Mt
at 3.09 g/t Au (Inferred), exclusive of Mineral Reserves; |
| ■ | Total Proven and Probable Mineral Reserve: 17.81 Mt at 3.62 g/t Au average
diluted gold grade; |
| ■ | Process recovery of 92.6%; |
| ■ | Average annual production of ~190,000 ounces (“oz”) of gold over
a 10-year mine life (202,000 oz in the first 5 years), totalling 1.918 million ounces (“Moz”) of gold over life of mine
(“LOM”); |
| ■ | First gold anticipated in the second half of Year -1, following 24 months
of construction and 6 months of pre-production; |
| ■ | Average total cash cost (“TCC”) of USD 947/oz and All-in
Sustaining Costs (“AISC”) of USD 1,157/oz over the LOM, placing the Project within the lower half of the global cost
curve for gold mines2; |
| ■ | Average base case LOM annual Free Cash Flow (“FCF”) of $158M
($296M per year in the first 5 years); |
| ■ | Improved single-phase build over 24 months and direct ramp-up to 4,900 tonnes
per day (“tpd”) with total initial capital cost of $881M and sustaining capital of $525M over the LOM; |
| ■ | Reclamation costs of approximately $135M, and a salvage value of approximately
$36M; |
1
Payback is calculated from commercial production, which is defined as the achievement of reaching a minimum of 30 consecutive days
of operations during which the mill operated at an average of 60% of nameplate throughput of 4,900 tpd.
2
Based on S&P's Global Market Intelligence, Metals & Mining, 2024 global gold cost curve for TCC and AISC.
| |
Osisko Development Corp.
NI 43-101 Technical Report
Feasibility Study for the Cariboo Gold Project |
|
| ■ | Operating costs (total) of $110.7 per tonne mined; |
| ■ | LOM taxes and duties of $640.1M and royalties of $292M; |
| ■ | Streamlined processing facilities into a single location and improved flowsheet
design with incorporation of a gravity circuit and production of higher-grade concentrate product; |
| ■ | Strong support for local employment with up to 613 direct jobs created during
peak construction and 525 permanent jobs during operations; |
| ■ | Significant opportunities to potentially enhance Project economics and extend
mine life through conversion of Mineral Resources adjacent to Mineral Reserves through infill drilling. |
| 1.3 | Summary of Changes from 2023 Feasibility Study |
The 2025 FS incorporates several important improvements
and de-risking initiatives over the 2023 FS that better position the Project from an execution, financing, and operational perspective.
Notable changes include:
| ■ | Accelerated Development Sequence: Single-phase construction and ramp
up directly to nameplate capacity of 4,900 tpd, which increases the LOM average gold production profile by 16% to 190,000 oz per year,
and 202,000 oz per year in the first 5 years. |
| ■ | Streamlined Processing: A single milling facility at the Mine Site
reduces the need (as had been previously contemplated) to transport flotation concentrate 116 kilometres (“km”) to the Quesnel
River Mill (“QR Mill”). This reduces capital and operating costs by consolidating operations into one location. |
| ■ | Improved Flowsheet Design: Updated metallurgical studies and testing
has resulted in the addition of a gravity circuit which, combined with a rougher and cleaner flotation circuit, resulted in overall project
gold recovery of 92.6% and the production of ~66 tpd higher-grade concentrate product (versus 590 tpd in 2023 FS Phase 21)
averaging ~133 grams per tonne (“g/t”) Au (versus 28 g/t Au in 2023 FS Phase 2). Approximately 46% of gold is expected to
be recovered by gravity. |
| ■ | Underground Mine Design: Increased average stope size by ~60% compared
to the 2023 FS, significantly reducing the total number of stopes required to achieve average daily throughput. Optimization of the geotechnical
design of the mined stopes, supported by recent trial mining, allows for more operational flexibility of underground operations. |
| ■ | Mineral Reserves: Probable Mineral Reserves remained largely unchanged,
increasing slightly to 2.071 Moz Au (17.8 Mt grading 3.62 g/t Au). |
| ■ | Permitted: Project design and sequencing proposed in the 2025 FS is
aligned with the BC Mines Act and Environmental Management Act permits obtained in Q4 2024. |
1 Phase 1: 2023 FS 1,500 tpd operation
Phase 2: 2023 FS 49,00 tpd operation
| |
Osisko Development Corp.
NI 43-101 Technical Report
Feasibility Study for the Cariboo Gold Project |
|
Table 1-2: Comparison of
changes from 2023 to 2025 FS
| Category |
Concept and
Engineering
2023 FS |
Changes in Concept
and Engineering
2025 Updated
FS |
| Mineral Resource |
■ No
depletion of Lowhee Bulk Sample and development |
■ No
change on Main CGP site
■ Depletion
of Lowhee Bulk Sample and development |
| Cut-off Grade |
■ Resource
cut-off grade of 2.0 g/t Au |
■ Resource cut-off grade is now 1.8 g/t Au) |
| Mineral Reserve |
■ Reserve
production cut-off grade of 2.3 g/t Au |
■ Reserve production cut-off grade is now 2.0 g/t Au |
| Mining Methodology |
■ Average
stope size of 3,490 t |
■ Average stope size of 5,577 t |
| Mine Plan |
■ Two-phased
approach for mine plan (2023 FS Phase 1 and Phase 2) |
■ One-phase
approach for mine plan, ramping up to 4,900 tpd in under 3 years |
| Mineral Processing Concept |
■ Two-phase
first 3 years at 1,500 tph, ramp-up to 4,900 tpd in Year 4
■ Two
processing sites: Quesnel River Mill and Wells MSC |
■ No
phase approach direct production at 4,900 tpd
■ One
processing site at the Wells MSC |
| Mineral Processing Methodology |
■ Ore
sorter, flotation and leaching |
■ No
leaching
■ Addition
of a gravity recovery circuit
■ Addition
of flotation cleaning circuit
■ Sell
flotation concentrate to smelter |
| Metallurgical Recovery |
■ Average
recovery of 92.0% |
■ Average recovery of 92.6% |
| Waste Rock Storage |
■ Design
not adapted for progressive closure and reclamation |
■ Configuration
of the WRSF structure (maximizing storage, increased volume and footprint), ready for closure |
| Water Balance / Water Treatment |
■ Two
water treatment plants: one at Bonanza Ledge and another at MSC for LOM |
■ One
water treatment plant with larger capacity at MSC to manage Bonanza Ledge and MSC contact water during most LOM
■ Larger
amount to treat at Bonanza Ledge due to increased footprint area of WRSF |
| Water Management |
■ Bonanza
Ledge contact water treated and released at Bonanza Ledge |
■ Bonanza
Ledge contact water is conveyed to MSC for treatment after construction |
| Underground Materials Handling Systems |
■ Primary
Jaw Crusher and Secondary Cone Crusher |
■ Primary
Jaw Crusher and modified secondary crusher to a second jaw, to reduce fine production and increase ore sorting throughput |
| |
Osisko Development Corp.
NI 43-101 Technical Report
Feasibility Study for the Cariboo Gold Project |
|
| Category |
Concept and
Engineering
2023 FS |
Changes in Concept
and Engineering
2025 Updated
FS |
| Surface Electrical |
■ 69 kV
power line connecting BC Hydro’s Barlow Substation to the MSC 69 kV/13.8 kV substation |
■ The
transmission line and substation to provide required electrical power at 69 kV based on availability at the Barlow Substation. The
line and onsite substation will be designed to accommodate a future load case of 138 kV |
| Permitting |
■ BC
Environmental Assessment (“EA”) process was underway to assess the Project |
■ EA
certificate has been granted
■ Mines
Act permit issued
■ Environmental
Management Act permits issued
■ Minor
amendment to existing approvals to authorize water treatment changes will be pursued |
| Environmental |
■ Robust
environmental baseline studies were completed in support of EA and permitting requirements |
■ No major updates |
| Communities |
■ Engagement
with communities was well-established throughout the Project planning process |
■ Revised
MSC Layout following extended discussions with the community |
| 1.4 | Property Description and Ownership |
The Project is located in the historic Wells-Barkerville
mining camp of BC and extends for approximately 60 km from northwest to southeast.
The Project falls within the Cariboo Regional
District (“CRD”), a division of the local government system in BC. The main towns in the Project area are the District of
Wells (“Wells”) and Barkerville Historic Town & Park. Wells is situated 74 km east of Quesnel, approximately
115 km southeast of Prince George, and approximately 500 km north of Vancouver.
ODV’s land holdings consist of 384 mineral
titles totalling 142,885.12 hectares (“ha”) in one contiguous property block known as the Cariboo Main Block. The reader is
reminded that the land holdings are registered in the names of Barkerville Gold Mines Ltd. (“BGM”) and will be referred to
as such in the following sections. These mineral titles include mineral claims, mineral leases, placer claims, and placer leases.
BGM holds 100% of interest in 62 Cariboo Main
Block placer titles, and the mineral lease #1105995. BGM holds 100% of interest in 366 of the 384 Cariboo Main Block mineral and placer
claims and placer leases. A total of 17 mineral claims are jointly owned with other companies and individuals: BGM holds 97.5% of interest
in six mineral claims, 85% of interest in two mineral claims, and 50% interest in the other nine mineral claims.
| |
Osisko Development Corp.
NI 43-101 Technical Report
Feasibility Study for the Cariboo Gold Project |
|
The Project also contains 546 private land parcels
from Crown-granted mineral claims (3,330.20 ha) that overlap many of the mineral titles, where BGM is the registered owner on title
of the surface and/or undersurface rights to the parcels. A net smelter return (“NSR”) royalty of 5% payable to Osisko Gold
Royalties Ltd. (“OGR”) is the only royalty that applies to the mineral resource area of the Project.
| 1.5 | Geology and Mineralization |
The Project lies within the Kootenay Terrane of
the Omineca Tectonic Belt in the south-central Canadian Cordillera. The Omineca rocks were complexly deformed by Middle Jurassic to Early
Tertiary compressional tectonics, and by Tertiary transtension and extension. The Kootenay Terrane in the vicinity of the Project is subdivided
into the eastern Cariboo and western Barkerville subterranes. The Cariboo Subterrane is juxtaposed on the Barkerville Subterrane by the
east-dipping Pleasant Valley Thrust.
The Snowshoe Group, central to the Barkerville
Subterrane, hosts the Project.
The Barkerville and Cariboo Subterranes comprise
metamorphosed equivalents of continent-derived siliciclastic protoliths with interlayered marble units and granitic orthogneiss. The subterranes
are pericratonic in character and are thought to have formed near the current western margin of Laurentia. Various authors suggest that
both Barkerville and Cariboo Subterranes share the same tectostratigraphic position and depositional environment.
The principal gold-producing areas in the Barkerville
Subterrane are hosted in rocks metamorphosed to lower-greenschist facies (sub-biotite isograd); amphibolite-facies rocks are locally found
on the Project but are not associated with any significant mineralization. The S1 and S2 fabrics are defined by phyllosilicate minerals
(sericite and chlorite); they generally define foliation suggesting that peak metamorphic temperature coincided with the formation of
cleavage.
Lode-gold mineralization in the Wells-Barkerville
mining camp (Cariboo Gold District) shares many characteristics with an orogenic gold deposit model. Gold mineralization is associated
with orogenic silica-carbonate-sericite-pyrite stable fluids moving along secondary permeability controlled by metamorphic fabrics, vein
arrays, faults, lithologic contacts, and rheological contrasts.
| |
Osisko Development Corp.
NI 43-101 Technical Report
Feasibility Study for the Cariboo Gold Project |
|
Deposit types on the Project consist of vein and
replacement-type mineralization grouped into five inter-related styles: 1) Fault-fill breccia veins subparallel to foliation (S1),
hosted in carbonaceous mudstone; 2) Vertical northeast-trending extensional (axial planar) veins dominantly hosted in sandstone units
in S3 cleavages; 3) Fractured moderately dipping east-northeast-trending shear veins, hosted in sandstone units; 4) Gold bearing
sulphide replacements hosted in fold hinges of calcareous sandstone units; and 5) Gold-bearing sulphide replacement mineralization
hosted in fault-bounded calcareous siltstone units.
| 1.6 | Status of Exploration and Drilling |
ODV’s exploration team executed a systematic
methodology to the exploration program on the Project. The program included geological mapping, channel, soil, underground sampling, and
diamond drilling.
The exploration team has continued its geological
mapping across the Project’s area to identify lithologic contacts, define alterations and geochemical signatures, record micro-
and macro-scale structural data, and to collect select rock samples. The targeted deposit types within the Project are structurally and/or
geochemically controlled, thus the mapping data continues to play a vital role in refining the geologic model of the area and defining
mineralized zones.
The objectives for the 2020 and 2021 diamond drilling
programs were to test new brownfields targets adjacent to known deposits, infill high-grade vein corridors modelled from the 2019 Preliminary
Economic Assessment (“PEA”) classified as Inferred and explore the depth potential of known deposits.
The focus of the 2022 diamond drilling program
was the infill of a proposed underground bulk-sampling area, the continued category conversion from Inferred to Indicated status of modelled
vein corridors, and the delineation of additional vein corridors.
The objective of the 2023 program was to provide
geotechnical information along the proposed underground development towards a bulk sample area to aid with safe and productive extraction
methods. The Cow portal geotechnical drill holes enabled the identification of faults, rock mass designation testing, lithologic contacts,
rock mass abrasiveness, and Metal Leaching (“ML”) and Acid Rock Drainage (“ARD”) hazards, to aid in the planning
for underground development towards the Lowhee Zone bulk sample.
| |
Osisko Development Corp.
NI 43-101 Technical Report
Feasibility Study for the Cariboo Gold Project |
|
The objective of the 2024 underground development
program was to access the mineralization at the Lowhee deposit for the eventual extraction and analysis of a 10,000 tonne (“t”)
bulk sample. The Cow portal construction was completed in Q4 2021. During Q1 2024, the Company commenced development of the underground
ramp from the existing Cow portal into the Project's mineral deposit at the Lowhee Zone. The development has been completed, and bulk
sample taken to assess mineability was in line with the FS parameters. A further ~150 metres (“m”) of development has
advanced on the 1,260-elevation level, cross-cutting the vein corridors Mapping and structural analysis of the development has confirmed
the local geological model. Data collection, analysis and interpretation from the bulk sample are pending
as of the effective date of the Report.
| 1.7 | Mineral Resource Estimate |
The 2025 FS Mineral Resource Estimate (“MRE”)
for the Project, effective April 22, 2025, encompasses resources for the deposits of Cow Mountain (Cow Zone and Valley Zone), Island
Mountain (Shaft Zone and Mosquito Zone), and Barkerville Mountain (Lowhee Zone, KL Zone, BC Vein Zone, and the Bonanza Ledge Zone).
There have been no changes for the resource estimation
as previously reported in the 2022 FS MRE, however, there has been mining depletion for Lowhee and changes to the cut-off grade assumptions.
The silver (“Ag”) has been removed
from the 2025 MRE due to limited supporting data and the estimated ounces were not material.
The 2022 FS MRE for Cow, Valley, Mosquito, Shaft,
KL, Lowhee, and BC vein was prepared by Daniel Downton, P.Geo., of Osisko Development Corp. (“ODV”). The Bonanza Ledge deposit
remained unchanged.
The Lowhee Zone is depleted by the underground
workings and the bulk sample stope. As mineralization is present in the walls of the bulk sample, a 5 m buffer has not been added
as there is still mining potential. Both the underground workings and bulk sample are current as of the end of January 2025.
The depletion was reviewed and validated by Carl
Pelletier, P.Geo., and Tessa Scott, P.Geo., both of InnovExplo Inc. (“InnovExplo”), using all available information.
The 2025 FS MRE covers all the deposits in
the Cow-Island-Barkerville Mountain Corridor. The Mineral Resource area for the Cow/Island segment covers a strike length of 3.7 km
and a width of approximately 700 m, down to a vertical depth of 600 m below surface. The estimate for the Barkerville segment
covers a strike length of 3 km and a width of approximately 700 m, down to a vertical depth of 500 m below surface.
| |
Osisko Development Corp.
NI 43-101 Technical Report
Feasibility Study for the Cariboo Gold Project |
|
Two diamond drill hole databases cover the Project:
Bonanza Ledge and BM-CM-IM (Barkerville Mountain including the BC Vein, KL, and Lowhee deposits, Cow Mountain including the Cow and Valley
deposits, and Island Mountain including the Shaft and Mosquito deposits). These databases were filtered by deposit (Cow, Shaft, Valley,
Mosquito, BC Vein, KL, or Lowhee) before the work in Datamine. A subset of drill holes was used to generate the 2022 FS MRE database for
each deposit, as follows:
| ■ | The Cow deposit contains 1,219 validated drill holes; |
| ■ | The Valley deposit contains 254 validated drill holes; |
| ■ | The Shaft deposit database contains 1,010 validated drill holes; |
| ■ | The Mosquito deposit contains 841 validated drill holes; |
| ■ | The Lowhee deposit contains 158 validated drill holes; |
| ■ | The BC Vein and KL Zone deposits contain 420 validated drill holes. |
The qualified persons (“QPs”) reviewed
and validated the resource estimation process followed by ODV, including all parameters, geological interpretation, basic statistics,
variography, interpolation parameters, block model construction, scripts that run the model, volumetric report, and the validation process.
Historical work subject to verification consisted
of the holes used for the 2022 PEA MRE (Hardie et al., 2022). Basic cross-check routines were performed between the current ODV Databases
and the previously validated database for the 2022 PEA MRE.
The QPs were granted access to the assay certificates
for all holes in the 2021 drilling programs. Assays were verified for 5% of the drill holes. No discrepancies were found.
Overall, the QPs data verification demonstrates
that the data, protocols, and estimation process for the Project are acceptable. The QPs consider the ODV databases to be valid and of
sufficient quality to be used for the MRE herein.
A total of 482 geological solids were created
for the deposits and remain unchanged from the 2022 FS.
A solid representing a 5 m halo surrounding
the axial planar (“AXPL”) vein corridors was also created for each of the Mosquito, Shaft, Valley, Cow, Lowhee, and KL deposits.
These were created to limit and provide a halo of dilution around the AXPL mineralized veins.
The classification is unchanged since the 2022 FS
MRE. The MRE was classified as Measured, Indicated, and Inferred Mineral Resources based on data density, search ellipse criteria,
drill hole density, and interpolation parameters. The 2025 FS MRE is considered to be reliable and based on quality data and geological
knowledge. The MRE follows the 2014 CIM Definition Standards on Mineral Resources and Reserves and the 2019 CIM Best Practice Guidelines.
| |
Osisko Development Corp.
NI 43-101 Technical Report
Feasibility Study for the Cariboo Gold Project |
|
Table 1-3 displays the results from the 2025
FS MRE, exclusive of the reserves, for the Project for all eight deposits: Cow, Valley, Shaft, Mosquito, KL, Lowhee, BC Vein, and Bonanza
Ledge.
Table 1-3: Cariboo Gold
Project 2025 FS MRE reported at a 1.8 g/t Au cut-off grade
(except for Bonanza Ledge reported at a 3.5 g/t Au cut-off grade)
| Category
|
Deposit
|
Tonne |
Au
Grade |
Au
Ounce |
| '000 |
(Au g/t) |
'000 |
| Measured |
Bonanza Ledge |
47 |
5.06 |
8 |
| Indicated |
Bonanza Ledge |
32 |
4.02 |
4 |
| BC Vein |
1,057 |
3.00 |
102 |
| KL |
527 |
2.80 |
47 |
| Lowhee |
1,333 |
2.76 |
118 |
| Mosquito |
1,553 |
2.96 |
148 |
| Shaft |
6,121 |
2.92 |
575 |
| Valley |
2,718 |
2.70 |
236 |
| Cow |
3,991 |
2.91 |
374 |
| Total Indicated Mineral Resources |
17,332 |
2.88 |
1,604 |
| Total Measured & Indicated |
17,380 |
2.88 |
1,612 |
| Inferred |
BC Vein |
596 |
3.17 |
61 |
| KL |
2,514 |
2.53 |
205 |
| Lowhee |
486 |
3.01 |
47 |
| Mosquito |
1,883 |
3.08 |
186 |
| Shaft |
7,457 |
3.44 |
826 |
| Valley |
2,470 |
3.01 |
239 |
| Cow |
3,368 |
2.78 |
301 |
| Total Inferred Mineral Resources |
18,774 |
3.09 |
1,864 |
Mineral Resource Estimate notes:
| 1. | The independent and QPs for the Mineral Resources estimates, as defined by NI 43-101, are Carl Pelletier,
P.Geo., and Tessa Scott, P.Geo. of InnovExplo Ltd. The effective date of the 2025 FS MRE is April 22, 2025. |
| 2. | These Mineral Resources, exclusive of the reserves, are not Mineral Reserves as they do not have demonstrated
economic viability. |
| 3. | The MRE follows the 2014 CIM Definition Standards on Mineral Resources and Reserves and the 2019 CIM Estimation
of Mineral Resources and Mineral Reserves Best Practice Guidelines. |
| 4. | A total of 481 vein zones were modelled for the Cow Mountain (Cow and Valley), Island Mountain (Shaft
and Mosquito), Barkerville Mountain (BC Vein, KL, and Lowhee) deposits and one gold zone for Bonanza Ledge. A minimum true thickness
of 2.0 m was applied, using the gold grade of the adjacent material when assayed or a value of zero when not assayed. |
| |
Osisko Development Corp.
NI 43-101 Technical Report
Feasibility Study for the Cariboo Gold Project |
|
| 5. | The estimate is reported for a potential underground scenario at a cut-off grade of 1.8 g/t Au, except
for Bonanza Ledge at a cut-off grade of 3.5 g/t Au. The cut-off grade for the Cow, Valley, Shaft, Mosquito, BC Vein, KL, and Lowhee deposits
was calculated using a gold price of USD 2,400/oz; a USD:CAD exchange rate of 1.35; an underground mining cost of $66.3/t; a processing
and transport cost of $30.80/t; a G&A plus Environmental cost of $22.40/t; and a sustaining CAPEX cost of $45.6/t. No changes have
been applied for the Bonanza Ledge. The cut-off grade for the Bonanza Ledge deposit was calculated using a gold price of USD 1,700/oz;
a USD:CAD exchange rate of 1.27; a global mining cost of $79.13/t; a processing and transport cost of $65.00/t; and a G&A plus Environmental
cost of $51.65/t. The cut-off grades should be re-evaluated in light of future prevailing market conditions (metal prices, exchange rate,
mining cost, etc.). |
| 6. | Density values for Cow, Shaft, Lowhee, and BC Vein were estimated using the ID2 interpolation
method, with a value applied for the non-estimated blocks of 2.80 g/cm3 for Cow, 2.78 g/cm3 for Shaft, 2.74
g/cm3 for Lowhee, and 2.69 g/cm3 for BC Vein. Median densities were applied for Valley (2.81 g/cm3),
Mosquito (2.79 g/cm3), and KL (2.81 g/cm3). A density of 3.20 g/cm3 was applied for
Bonanza Ledge. |
| 7. | A four-step capping procedure was applied to composited data for Cow (3.0 m), Valley (1.5 m),
Shaft (2.0 m), Mosquito (2.5 m), BC Vein (2.0 m), KL (1.75 m), and Lowhee (1.5 m). Restricted search ellipsoids ranged
from 7 to 50 g/t Au at four different distances ranging from 25 m to 250 m for each deposit. High-grades at Bonanza
Ledge were capped at 70 g/t Au on 2.0 m composited data. |
| 8. | The gold Mineral Resources for the Cow, Valley, Shaft, Mosquito, BC Vein, KL, and Lowhee vein zones
were estimated using Datamine StudioTM RM 1.9 software using hard boundaries on composited assays. The OK method was used to
interpolate a sub-blocked model (parent block size = 5 m x 5 m x 5 m). Mineral Resources for Bonanza Ledge were estimated using GEOVIA
GEMSTM 6.7 software using hard boundaries on composited assays. The OK method was used to interpolate a block model (block
size = 2 m x 2 m x 5 m). |
| 9. | Results are presented in situ. Ounce (troy) = metric tons x grade / 31.10348. Calculations used metric
units (metres, tonnes, g/t). The number of tonnes was rounded to the nearest thousand. Any discrepancies in the totals are due to rounding
effects. Rounding followed the recommendations as per NI 43-101. |
| 10. | The QPs responsible for this section of the technical report are not aware of any environmental, permitting,
legal, title, taxation, socio-economic, marketing, political, or other relevant factors that could materially affect the MRE. |
| 1.8 | Mineral Reserve Estimate |
The Mineral Reserves for the Project have been
estimated in accordance with the 2014 CIM Definition Standards and the 2019 CIM Best Practices Guidelines, as required by NI 43-101. The
reserves are derived from Measured and Indicated Mineral Resources and exclude any contribution from Inferred Mineral Resources. Estimations
consider mining recovery, dilution, and economic viability, based on current cost and pricing assumptions.
The reserve estimate is based on the resource
block model dated September 8, 2022. Stope optimization and economic filtering were performed using cut-off grades that reflect total
costs, recovery rates, and gold pricing assumptions. Internal and external dilution, mining losses, and method-specific recovery factors
were integrated into the reserve calculations. Stope shape optimization was completed using Deswik Stope Optimizer software, and ESG modifying
factors were reviewed to ensure alignment with current standards and permitting status.
| |
Osisko Development Corp.
NI 43-101 Technical Report
Feasibility Study for the Cariboo Gold Project |
|
A summary of Mineral Reserves Estimate is illustrated
in the Table 1-4.
Table 1-4: Cariboo Gold statement
of mineral reserves (Effective date: April 10, 2025)
| Category |
Tonnage |
Grade |
Contained Gold |
| (t) |
Au (g/t) |
(oz) |
| Proven |
| - |
- |
- |
- |
| Probable |
| Cow |
3,999,971 |
3.35 |
430,548 |
| Valley |
3,238,636 |
3.59 |
374,058 |
| Shaft |
8,548,295 |
3.72 |
1,021,599 |
| Mosquito |
1,105,370 |
3.94 |
140,102 |
| Lowhee |
923,162 |
3.52 |
104,491 |
| Total Proven & Probable |
17,815,435 |
3.62 |
2,070,798 |
Mineral Reserve Estimate notes:
| 1. | The QP for the Mineral Reserve Estimate is Eric Lecomte, P.Eng. (InnovExplo, a subsidiary of Norda Stelo). |
| 2. | The Mineral Reserve Estimate has an effective date of April 10, 2025. |
| 3. | Estimated at USD 1,915/oz Au using an exchange rate of USD 1.32:CAD 1.00, variable cut-off value from 1.70 g/t to 2.0 g/t
Au. |
| 4. | Mineral Reserves include both internal and external dilution along with mining recovery. The average external dilution is estimated
to be 10.1%. The average mining recovery factor is 91.3% to account for mineralized material left in each block in the margins of the
deposit. |
| 5. | Metallurgical recovery is assumed to be 92.1% |
| 6. | The cut-off grade incorporates assumptions for mining cost ($54.19/t), processing cost ($30.53/t), sustaining capital ($25.63/t),
G&A and environment ($16.85/t), royalties (5%) and refining cost (USD 5.00/t). |
| 7. | Mineral Reserve tonnage and mined metal have been rounded to reflect the accuracy of the estimate and numbers may not add due to rounding. |
| 8. | Stope dimensions, mining sequences, and extraction methods were designed according to geotechnical classification and operational
constraints. |
| 9. | ESG considerations, including existing permits, tailings management (underground paste backfill), and community agreements, have been
factored into the reserve classification. |
The reserve estimate confirms the economic viability
of the under current assumptions and supports the ongoing development and planning of mining operations.
| |
Osisko Development Corp.
NI 43-101 Technical Report
Feasibility Study for the Cariboo Gold Project |
|
The Project consists of three main zones (Cow,
Shaft, and Valley) with two smaller satellite zones (Lowhee and Mosquito). The rate of exploitation of each deposit will change over time,
while the overall steady state production rate of 4,900 tpd is expected to be met by the first half of Year 1 and will be maintained until
Year 10, before decreasing. The LOM production plan represents a 10-year mine life.
The selected mining method is mainly long hole
longitudinal retreat with some stopes using a modified long hole longitudinal retreat method or transverse. Primary materials handling
fleet will be comprised of 10 t scooptram Load Haul Dump (“LHD”) and 51 t haul trucks.
Stope production is set to begin in the second
half of Year -1 and progressively ramp up until full production of 4,900 tpd is achieved in Q2 Year 1. Underground mine life is set to
last until the first half of Year 10.
| 1.9.2 | Geotechnical Evaluation |
Geotechnical characterization for the Project
was undertaken through two core logging campaigns conducted in 2018 and 2021, complemented by laboratory testing. The results supported
the development of a geotechnical classification system (Classes 1 to 5), each with corresponding stope design guidelines. The classification
ranges from Class 1, representing the most competent ground conditions, to Class 5, representing the least competent ground.
Classes 1 through 4 are considered suitable for open stoping, whereas Class 5 requires a cut-and-fill mining approach.
Approximately 95% of the planned stopes were assigned
a geotechnical class. For design purposes, a single representative class was selected for each vein corridor, based on the class associated
with the median stope tonnage. Classes 1 to 3 were designed using industry-accepted empirical methods. To validate the proposed stope
design guidelines for Classes 3L and 4, a back-analysis was conducted using stope performance data from the Bonanza Ledge Mine. This analysis
compared planned versus actual stope geometries for 21 stopes, using data from Cavity Monitoring System (“CMS”) surveys. The
rock mass quality of these stopes was also compared with that of the Cariboo Gold Project to confirm the relevance of the back-analysis
results.
Typical stope dimensions are approximately 30
m in height (floor-to-floor). For longitudinal stopes with widths less than 8 m, the strike length ranges from 15 to 25 m, depending on
the geotechnical class. Higher classes were assigned increasing dilution factors, and reduced geotechnical recovery was applied to Class 4
areas.
| |
Osisko Development Corp.
NI 43-101 Technical Report
Feasibility Study for the Cariboo Gold Project |
|
A hydrogeological investigation program was completed
to provide key groundwater related inputs to the FS, namely, to estimate potential mine dewatering rates, to understand further the regional
groundwater flow regime, and to characterize potential impacts of mine dewatering on groundwater and surface water systems.
| 1.9.4 | Mining Method Description |
The long hole mining method
was primarily selected due to the sub vertical geometry of mineralized vein corridors and the relatively lower cost. This method involves
driving two drifts longitudinally along the mineralized vein corridors to define a stope. The top access serves as a drilling platform
while the bottom access allows for mucking of drilled then blasted material. Once empty, these stopes are then backfilled with paste fill.
Stopes are mined retreating towards the access. This method allows for simultaneous mining of stopes along different vein corridors as
well as along the same corridor if a pillar exists between active levels. A few mining horizons will include some stopes using transversal
long-hole stoping. This decision was driven by the average vein width, contained metal (value), and ground conditions.
The minimum designed stope
width for all zones is 3.7 m and the sill-to-sill stope height for all zones is 30 m. The maximum permissible strike length
(the distance along strike that can be mined before backfilling is required) is a function of geotechnical constraints and differs by
zone.
There will be two portals providing access to
the underground ramps as well as one portal to connect the underground incline conveyor to the processing plant. The Cow portal, already
excavated, will serve as the initial access point to develop the underground zones during the early stages of the Project. The Valley
portal will be brought into service in parallel with development toward the Shaft Zone. Once established, it will serve as the primary
production access due to its strategically central location within the deposit. A portal for the conveyor access will be developed simultaneously
and ready for conveyor install prior to commissioning of the process plant.
The zones are accessed via main ramps connected
to haulage drifts, with each zone featuring its own internal ramp system. The Mosquito Zone, located farther west, is connected to the
Shaft Zone by a 1,083 m long haulage drift.
| |
Osisko Development Corp.
NI 43-101 Technical Report
Feasibility Study for the Cariboo Gold Project |
|
Mining in each zone will primarily use the longitudinal
retreat longhole method. A few marginal stopes, either too wide or located in low-competency ground, will be mined using the transverse
method or a modified version of the longitudinal longhole method. Sublevels are spaced at 30 m (sill to sill), and mined stopes will generally
be backfilled with paste fill. Stope strike lengths will vary by zone based on individual geotechnical assessments. Each zone is capped
with a crown pillar—22 m for Cow and Lowhee, 32 m for Mosquito and Shaft, and 25 m for Valley—with depth varying according
to local geological conditions.
| 1.9.6 | Development Schedule |
The development schedule has been created with
a combination of traditional Jumbo development and Roadheaders. The Roadheaders are scheduled to provide a lateral advance of 200 m
per month in single heading conditions and will be concentrated on the ramps. Jumbo equipment is expected to achieve an average lateral
development rate ranging from 244 m to 292 m per month per Jumbo crew, depending on the type of excavation, when multiple active
headings are available simultaneously.
Initial development will be carried out by contractors
at the start of the Project. ODV will gradually assume development responsibilities beginning in Year -2 and is expected to fully take
over all development activities by Year 1.
| 1.9.7 | Underground Electrical Distribution and Communication |
Power is supplied at 13.8 kilovolt (“kV”)
and stepped down to 600 volt (“V”) and 1,000 V using dual-output substations. Two feeders from the Cow and Valley portals
will distribute power to underground levels, ensuring redundancy and load balancing.
Fixed equipment such as fans, pumps, and chargers
will operate at 600 V, while mobile mining equipment like Jumbos and bolters will use 1,000 V. Auxiliary services including lighting,
heating, ventilation and air conditioning (“HVAC”), and controls will be powered at 120/208 V. The electrical design includes
single-line diagrams, load lists, and bills of material, and complies with all applicable codes and standards.
The load list reflects a high but reasonable level
of mining activity and will be refined as the production plan advances. Mobile substations rated between 1 mega volt ampere (“MVA”)
and 2 MVA are planned for each level, with flexibility to adjust quantities and reuse units based on mine development progress.
| |
Osisko Development Corp.
NI 43-101 Technical Report
Feasibility Study for the Cariboo Gold Project |
|
| 1.9.8 | Mine Automation and Monitoring Systems |
The mine’s automation strategy includes
teleoperated LHD mucking from stopes and loading bays, with transitional ore storage in re-muck areas. Loading bays on access levels will
separate teleoperated from manually operated equipment, ensuring regulatory compliance while enabling remote loading operations. On levels
without a loading bay, fully automated mucking will be secured through physical barriers restricting access to other vehicles in the affected
area. The communication network structure, the integration of the original equipment manufacturer’s automation system, and the LHD
units—already equipped with the necessary automation options—will enable autonomous operation. It is assumed that one operator
will remotely control two LHDs during the automation period. Starting in Year 2, autonomous mucking is expected to account for approximately
30% of stope production over a 12-hour shift, assuming optimal operating conditions.
The ventilation system has been designed to comply
with British Columbia regulations. The airflow required to ventilate diesel engines was compiled using a 0.06 cubic metres per second
per kilowatt (“m3/s/kW”) rate.
The system will be comprised of four independent
intake fresh air raises, one exhaust raise and remaining exhaust through the main ramps and the Cow portal. The total estimated airflow
required to meet production is 1,255 kilo cubic feet per minute (“kcfm”) (592 m3/s).
Project development will begin in Year -3, and
the total ore production rate will ramp up until reaching the nominal full production target of 4,900 tpd in the first half of Year 1,
with each zone contributing a different ratio to production over time.
The LOM has a 10-year mine life at average production
rates of 4,900 tpd. Production ramp-up to a steady state of 4,900 tpd will be achieved by the second half of Year 1. The different
zones were divided into three distinct sectors: South (Valley Upper, Cow and Lowhee zones), North (Mosquito and Upper Shaft zones) and
Deep (Lower Shaft and Valley zones), each production sector to contribute to a third of the nominal production. The overall mine plan
comprises 17.8 Mt of ore mined at an average grade of 3.6 g/t of Au. The mine will produce 8.0 Mt of waste from the development over LOM.
| |
Osisko Development Corp.
NI 43-101 Technical Report
Feasibility Study for the Cariboo Gold Project |
|
Table 1-5: Ore mined per
year
| Year |
Unit |
-3 |
-2 |
-1 |
1 |
2 |
3 |
4 |
| Lowhee |
t |
1,662 |
33,552 |
134,696 |
561,937 |
186,025 |
5,290 |
- |
| g/t |
1.86 |
4.33 |
3.75 |
3.60 |
3.02 |
2.35 |
- |
| Cow |
t |
- |
- |
8,226 |
56,670 |
238,925 |
251,626 |
327,103 |
| g/t |
- |
- |
3.78 |
4.31 |
4.22 |
3.86 |
3.61 |
| Valley |
t |
- |
2,541 |
52,207 |
164,253 |
228,149 |
246,371 |
434,465 |
| g/t |
- |
3.12 |
3.23 |
3.51 |
4.02 |
3.26 |
3.97 |
| Shaft |
t |
- |
7,123 |
224,669 |
912,205 |
1,135,506 |
1,285,713 |
1,025,358 |
| g/t |
- |
2.28 |
4.16 |
3.95 |
4.37 |
4.04 |
4.07 |
| Mosquito |
t |
- |
- |
- |
- |
- |
- |
- |
| g/t |
- |
- |
- |
- |
- |
- |
- |
| Total |
t |
1,662 |
43,216 |
419,798 |
1,695,065 |
1,788,605 |
1,788,999 |
1,786,926 |
| g/t |
1.86 |
3.92 |
3.90 |
3.80 |
4.16 |
3.91 |
3.96 |
| Year |
Unit |
5 |
6 |
7 |
8 |
9 |
10 |
11 |
| Lowhee |
t |
- |
- |
- |
- |
- |
- |
- |
| g/t |
- |
- |
- |
- |
- |
- |
- |
| Cow |
t |
322,541 |
359,549 |
576,463 |
691,972 |
538,224 |
586,986 |
41,686 |
| g/t |
3.00 |
3.44 |
3.31 |
3.35 |
3.06 |
2.91 |
4.18 |
| Valley |
t |
324,296 |
514,527 |
391,930 |
247,930 |
379,470 |
227,805 |
24,690 |
| g/t |
3.44 |
3.53 |
3.99 |
3.52 |
3.45 |
3.06 |
2.51 |
| Shaft |
t |
1,136,946 |
609,051 |
465,999 |
513,554 |
769,117 |
457,916 |
5,138 |
| g/t |
3.44 |
3.18 |
3.20 |
3.12 |
3.27 |
3.09 |
3.43 |
| Mosquito |
t |
9,593 |
300,000 |
354,087 |
335,115 |
106,575 |
- |
- |
| g/t |
3.47 |
4.30 |
3.69 |
3.86 |
4.06 |
- |
- |
| Total |
t |
1,793,375 |
1,783,128 |
1,788,480 |
1,788,572 |
1,793,387 |
1,272,706 |
71,515 |
| g/t |
3.36 |
3.52 |
3.50 |
3.40 |
3.29 |
3.00 |
3.55 |
| 1.9.12 | Mine Equipment and Personnel |
The selection of mining equipment was guided by
key criteria to ensure equipment was suited to support a steady-state production rate of 4,900 tpd, with allowances for critical spares.
All development activities will be carried out by contractors using their own equipment, except for the Roadheaders, which will be supplied
by the Project. ODV will progressively take over the development with new equipment, aiming for full in-house development operations by
early Year 1. Production is scheduled to begin in mid Year -1, with ODV gradually integrating its own equipment fleet based on operational
requirements.
| |
Osisko Development Corp.
NI 43-101 Technical Report
Feasibility Study for the Cariboo Gold Project |
|
The selected equipment fleet includes six two-boom
Jumbos, two Sandvik Roadheaders for decline development, 17 diesel 51 t trucks for ore and waste haulage (including two temporary
rentals), and 10 t LHDs for mucking and backfilling. Stoping activities will be carried out using three top hammer drills and three
down-the-hole drills.
The mine will operate continuously year-round
with three roster systems in place for office and hourly workers. During full production, an average of up to 169 underground mining employees
per rotation will be required to support operations and maintenance in Wells.
| 1.10 | Underground Infrastructure |
| 1.10.1 | Underground Materials Handling System |
A major piece of underground infrastructure of
the Project is the underground crushing system. This crusher is located below in the Cow Zone in a location that has been identified as
geotechnically favourable for long-term infrastructure. Ore will be brought to the crusher by underground trucks from all mining zones.
Ore will ultimately be brought to surface using
an underground conveyor to be pre-concentrated by sorting and flotation. The material rejected by the sorter will be transferred back
underground using a waste pass raise and then it will either be used as backfill material or hauled to the Bonanza Ledge WRSF using the
underground trucks.
The mine will include haulage drifts connecting
the five separate zones, an underground garage, mine water pumping stations and two paste pumping stations. The Valley portal will provide
access for material and the labour force.
| 1.10.2 | Paste Pumping Network |
The mine will be equipped with a paste network
in order to dispose of the flotation tailings and facilitate underground mining.
The network will originate on surface, inside
the processing plant where paste pumps will initially send the paste underground through a borehole. From there paste will be redistributed
through a vertical and horizontal pipe network spanning all levels and all zones. Two underground booster stations will be required, one
in Shaft, to allow the paste to reach the higher level of the zones and the satellite Mosquito Zone. One in the ramp between Cow and Lowhee
Zone, to allow the paste to reach the Lowhee Zone.
The network will be installed and maintained by
a dedicated team, as the underground infrastructure is developed.
| |
Osisko Development Corp.
NI 43-101 Technical Report
Feasibility Study for the Cariboo Gold Project |
|
| 1.11 | Mineral Processing and Metallurgical Testing |
The test programs were carried out between 2018
and 2025 under the supervision of ODV and BBA, with contributions from multiple laboratories including Société Générale
de Surveillance (“SGS”), Base Met Labs, AMTEL, and Metso.
The key findings include the following: Ore sorting
technologies such as X-ray transmission (“XRT”) and laser sensors achieved gold recoveries of 87–97% with mass pulls
of 30–65%, and optimization through laser scavenging improved recovery but increased mass pull. Gravity concentration tests showed
gravity recoveries ranging from 20% to 55% depending on the zone, with bulk composite gravity recovery averaging around 45%.
Comminution tests, including Bond Work Index (“BWi”)
and Abrasion Index (“Ai”) tests, categorized the ore as medium-hard to moderately abrasive, with additional hardness profiling
provided by SMC Test® and Hardness Index Test (“HIT”) tests.
Flotation tests, including rougher and cleaner
flotation, achieved gold recoveries greater than 98%, with cleaner flotation performance being sensitive to grind size and regrinding.
Cyanide leach tests showed gold recoveries of 92–96%, while silver recoveries were more variable, ranging from 44–77%.
Thickening, filtration, and rheology tests identified
multiple effective flocculants, with MF10 and SNF913-SH being the most effective, and belt vacuum and pressure filtration achieving cake
moistures of 8–20%, supporting paste backfill design. Paste backfill feasibility was confirmed through multiple campaigns, with
unconfined compressive strength (“UCS”) tests showing strength increases with binder content and curing time, and optimal
binder content estimated at 4% over the mine life.
Overall gold recovery over the LOM is expected
to be 92.6%. The recovery modelling integrated ore sorting, gravity, and flotation.
The Project will ramp up to a processing capacity
of 4,900 tpd. The process includes underground crushing and conveyance to surface for ore sorting, grinding, gravity concentration, flotation,
and tailings dewatering, with all mill tailings returned underground as paste backfill. Gravity concentrate is refined on-site into doré
bars, while flotation concentrate is shipped offsite.
The ore is crushed underground and conveyed to
the surface, where it is screened. Approximately 30% of the material bypasses ore sorting and goes directly to the fine ore silo. The
remaining 70% is sorted using two ore sorters. The concentrate from sorting is crushed further and combined with fines before being sent
to the grinding circuit.
| |
Osisko Development Corp.
NI 43-101 Technical Report
Feasibility Study for the Cariboo Gold Project |
|
Grinding is performed in a ball mill, reducing
the ore to a P80 of 190 microns (“µm”). The circuit includes primary gravity concentration, which recovers
a portion of gold. The remaining material is processed through flotation, including rougher, regrind, and cleaner stages. The regrind
mill reduces particle size to 25 µm to improve liberation. Secondary gravity concentration is also employed, and the combined gravity
concentrates are refined into doré.
Flotation concentrate is thickened and filtered
before shipment. Tailings undergo a similar dewatering process and are mixed with cement use as paste backfill underground.
The concentrator will employ 84 personnel across
operations, maintenance, and technical roles. Estimated annual propane consumption is 1.2 million litres (“L”), and the plant’s
power demand is 8.2 megawatts (“MW”). Reagent and consumable usage is based on lab test data, with specific consumption
rates provided for each material.
| 1.13 | Project Infrastructure |
A waste rock storage facility (“WRSF”)
with an elevation of 1,533 m and a capacity for approximately 7,940,000 cubic metres (“m3”) of waste rock
storage will be built in the northern limits of the Bonanza Ledge property. The WRSF is designed to have slopes of 3H:1V with inclusion
of working benches to manage erosion. This results in an overall slope of 3.3H:1V which will allow for lower bench slopes to be progressively
reclaimed while upper lifts of the WRSF are being built. This will reduce the need for rehandling at closure to accommodate the closure
design of the potentially acid generating (“PAG”) WRSF. Prior to construction, removal of existing PAG waste rock and overburden
stockpiled materials will be carried out.
Overall, the water infrastructure at the MSC and
Bonanza Ledge areas is designed to support the water management strategy and achieve the following objectives:
| ■ | Intercept and divert non-contact runoff: Wherever practical, non-contact
water will be collected and conveyed for discharge downstream of the mining areas, to the receiving environment. |
| ■ | Manage contact water: collect contact water through a system of channels,
culverts, French drains and sumps, and convey it to Sediment Control Ponds (“SCP”). Contact water is conveyed to the MSC SCP
where treated and then reused to supply freshwater at the mill, with the remaining unused treated effluent being discharged directly to
the Jack of Clubs Lake via a diffuser. |
| |
Osisko Development Corp.
NI 43-101 Technical Report
Feasibility Study for the Cariboo Gold Project |
|
Where possible, existing water management infrastructure
will be reused and upgraded, as needed, to meet the Project design basis requirements.
At the Bonanza Ledge area, the water management
system is designed to pump and temporarily store excess water from extreme flood events in the flood management reservoir (“FMR”),
located underground. This system is intended to be used in emergency situations, when water accumulating at site exceeds Bonanza Ledge
area water storage capacity. Water stored temporarily in the FMR is then pumped to the water treatment plant for treatment and discharge
to the receiving environment.
| 1.13.3 | Water Treatment Plant |
Water treatment infrastructure is a foundational
element of the Project’s environmental and operational planning. Two facilities have been designed to manage contact water and mine
dewatering flows throughout the life of the Project: a temporary plant at Bonanza Ledge and a permanent facility at the MSC. Each system
aligns with the phased development approach and is tailored to the site’s specific hydrological, climatic, and regulatory conditions.
The Bonanza Ledge WTP will support initial construction
and early underground development activities during Stage 1 (construction). This interim system includes chemical precipitation using
barium hydroxide, clarification, and multimedia filtration, followed by advanced membrane treatment. The membrane system features ultrafiltration
(“UF”) and nanofiltration (“NF”) or reverse osmosis (“RO”), with NF currently favored to avoid the
need for post-treatment remineralization. A separate, small-scale Moving Bed Biofilm Reactor (“MBBR”) is also in operation
at Bonanza Ledge to supplement nitrogen removal; however, it is not integrated into the main plant flow or design capacity. The Bonanza
Ledge WTP is scheduled for decommissioning upon full commissioning of the MSC facility.
The MSC WTP, scheduled for activation in Stage
2 (operation), will serve as the primary long-term treatment system. With a design flow of up to 800 m³/h, it incorporates High-Density
Sludge (“HDS”) precipitation for metals and solids removal, biological treatment using MBBRs for nitrogen species, and polishing
filtration. Treated water will be reused within site operations where feasible, with surplus volumes discharged to Jack of Clubs Lake
via a submerged diffuser system. The MSC WTP is designed to remain in operation through closure and into post-closure care, supporting
ongoing compliance and water quality management.
Both treatment systems are engineered to accommodate
extreme climatic conditions, including cold weather and seasonally variable flows. Design features such as redundant pumping capacity,
heat tracing, and modular construction support resilience and reliability. The water treatment program is fully integrated within the
Project’s site-wide water management strategy and is critical to achieving environmental discharge objectives and sustaining mine
operations.
| |
Osisko Development Corp.
NI 43-101 Technical Report
Feasibility Study for the Cariboo Gold Project |
|
| 1.13.4 | Water Treatment Conveyance Infrastructure |
The Project will utilize pump stations and pipe
systems to meet the water treatment conveyance requirements. The pumping stations and pipeline systems are designed to transfer water
directly or indirectly to the water treatment plants from water storage infrastructure. Pump stations will consist of a range of submersible
and centrifugal pumps, varying in size and capacity. These pumps were sized to meet site-specific flow rate and pressure requirements.
Larger pumps were utilized for high volume fluid transfer and dewatering operations, while smaller units provided precise control in lower-demand
areas. This approach allowed for efficient, scalable pumping solutions adaptable to seasonal flow conditions forecasted. A wide range
of High-Density Polyethylene (“HDPE”) pipe diameters and pressure ratings were utilized to match the varying flow rate and
pressure requirements across the different pipeline systems. Pipe sizes were selected based on hydraulic performance criteria, ensuring
optimal flow velocity and minimal head loss, while pressure classes were chosen to withstand the specific operating conditions of each
pipeline segment. This approach ensured reliability, efficiency, and long-term durability of the piping network under diverse service
demands.
| 1.13.5 | Substation and On-site Distribution |
The transmission line and Mine Site substation
will provide the required electrical power at 69 kV, based on what is available at the Barlow Substation. The Mine Site substation
will be designed to 138 kV to accommodate future loads but will initially operate at 69 kV. The transmission line will require
a step-up substation to meet the future case.
| 1.13.6 | Mine Site Infrastructure |
The MSC will include the following
infrastructure:
| ■ | Access roads, bridge, parking lots, security gate; |
| ■ | Mine surface infrastructure inclusive of portal, mine ventilation and heating
infrastructure; |
| ■ | Office complex including office space and mine dry facilities; |
| ■ | Surface water management infrastructure; |
| ■ | MSC WTP and treated effluent discharge through an effluent diffuser; |
| ■ | 69 kV to 13.8 kV electrical substation; |
| ■ | Fuel systems (diesel and gas storage and distribution); |
| ■ | Raw water well and potable water treatment plant and distribution system; |
| ■ | Sewage Treatment system; |
| ■ | Bridge to allow access to the MSC area. |
| |
Osisko Development Corp.
NI 43-101 Technical Report
Feasibility Study for the Cariboo Gold Project |
|
| 1.14 | Environmental and Permitting |
| 1.14.1 | Regulatory Context and Environmental Studies |
Environmental baseline studies and modelling for
the Project have been undertaken in the following areas: air quality, terrain and soils, vegetation, wildlife and wildlife habitat, climate
and physiography, fisheries and aquatic resources, surface water, and groundwater. In addition, ODV has established environmental monitoring
plans for a suite of valued components to respond to regulatory requirements and best management practices for the Project.
The Project is composed of three main components:
| ■ | The Mine Site, including the Mine Site Complex, and the Bonanza Ledge Site
(together referred to as the “Mine Site”); |
| ■ | The Transportation Route; |
The Project received an Environmental Assessment
Certificate (“EAC”), Certificate #M23-01, on October 10, 2023, and Schedule B of the certificate lays out the conditions
of the approval under 22 separate sections. The Mines Act permit, M-247, was received on November 20, 2024 and the Environmental
Management Act permits, PE-17876 for Bonanza Ledge and PE-111511 for the MSC, were received on December 11, 2024.
The permitting process for the Transmission Line
is being overseen by the Ministry of Water, Land and Resource Stewardship who is running a coordinated process for all authorizations
required for the Transmission Line. The permits required to authorize the construction of the Transmission Line are anticipated to be
granted in 2025.
Amendments to the EAC and other permits will be
required to authorize changes in the Project described in Chapter 1.
| 1.14.2 | Considerations of Social and Community Impacts |
Since 2016, ODV has been undertaking meaningful
and transparent engagement with Indigenous nations, the public, local community members, provincial and local government agencies and
other stakeholders, and this engagement is ongoing. Relationships have been developed and maintained with three Participating Indigenous
nations, Lhtako Dené Nation, Xatśūll First Nation, Williams Lake First Nation, and ODV intends to continue building
on these relationships through all phases of the Project.
| |
Osisko Development Corp.
NI 43-101 Technical Report
Feasibility Study for the Cariboo Gold Project |
|
| 1.14.3 | Mine Reclamation and Closure Plan |
ODV has prepared various Reclamation and Closure
Plans (“RCP”) for the Project to detail how the sites will be reclaimed to a safe, stable, and non-polluting condition. Detailed
RCPs were provided in support of the Mines Act application which received approval in late 2024. RCPs will continue to be updated
as mine plans evolve, regulatory guidelines change, and in accordance with permit requirements. The Project footprint has been divided
into Master Areas to reflect disturbance type and proposed end land use. Detailed closure and reclamation prescriptions have been provided
to the regulators for each Master Area.
| 1.15 | Capital and Operating Costs Estimates |
The total initial capital costs for the Project
are estimated to be $881M. The total sustaining capital cost is estimated to be $525M. These estimates include the addition of certain
contingencies and indirect costs. The cumulative LOM capital expenditure (“CAPEX”), including initial and sustaining capital
is estimated to be $1,406M. The Project’s site reclamation and closure costs are estimated at about $135M and its salvage value
is expected to be about $36M.
The overall capital cost estimate developed in
this FS generally meets the American Association of Cost Engineers (“AACE”) Class 3 requirements. The capital cost estimate
was compiled using a mix of quotations and budgetary quotations, database costs, and database factors. Items such as sales taxes, land
acquisition, permitting, licensing, feasibility studies, and financing costs are not included in the cost estimate.
| |
Osisko Development Corp.
NI 43-101 Technical Report
Feasibility Study for the Cariboo Gold Project |
|
Table 1-6: Capital cost
summary(1)
| Area |
Cost area description |
Initial Capital
Cost ($M) |
Sustaining
Capital Cost ($M) |
Total Cost
($M) |
| 000 |
Surface Mobile Equipment |
-- |
-- |
-- |
| 200 |
Underground Mine |
313 |
397 |
710 |
| 300 |
Water and Waste Management |
98 |
24 |
123 |
| 400 |
Electrical and Communication |
19 |
0 |
19 |
| 500 |
Surface Infrastructure |
42 |
1 |
43 |
| 600 |
Process Plant - Wells |
180 |
0 |
180 |
| 700 |
Construction Indirect Costs |
95 |
0 |
95 |
| 999 |
Contingency (16.5%) |
72 |
4 |
76 |
| |
Total |
819 |
426 |
1,246 |
| - |
Pre-production Revenue |
-150 |
0 |
-150 |
| - |
Pre-production Operating Costs |
212 |
0 |
212 |
| - |
Salvage Value |
0 |
-36 |
-36 |
| - |
Site Reclamation and Closure |
0 |
135 |
135 |
| |
Project Total |
881 |
525 |
1,406 |
| (1) | Numbers may not add up due to rounding. |
All capital costs for the Project have been distributed
against the development schedule to support the economic cash flow model
Figure 1-2 presents the planned annual and
cumulative LOM capital cost profile.

Figure 1-2: Capital cost
distribution over LOM
| |
Osisko Development Corp.
NI 43-101 Technical Report
Feasibility Study for the Cariboo Gold Project |
|
The operating cost estimate was based on multiple
sources, such as budget quotations, in-house data, and ODV’s projected salary chart. The operating cost expenditure (“OPEX”)
estimate is based on a combination of experience, reference projects, quotes, and budgetary quotes and factors appropriate for an FS study.
The target accuracy of the operating costs is ±15%. No cost escalation or contingency has been included within the operating cost
estimate.
The average operating cost over the 10-year mine
life is estimated to be $110.7 per tonne mined. Total LOM and unit operating cost estimates are summarized and shown on a percentage basis
in Table 1-7. Mining costs are presented inclusive of costs related to the paste fill binder costs (i.e., underground). Processing
costs are presented inclusive of the surface paste fill plant operating costs (i.e., surface).
Table 1-7: Operating cost
summary
| Area |
Cost Area Description(1) |
LOM unit cost ($/t processed) |
LOM ($M) |
Annual average cost ($M/year) |
Average LOM ($/oz) |
OPEX (%) |
| 200 |
Underground mining |
62.3 |
1,080 |
98 |
570 |
56 |
| 300 |
Water and waste management |
5.0 |
86 |
8 |
45 |
4 |
| 400 |
Electrical transmission line |
4.9 |
86 |
8 |
45 |
4 |
| 600 |
Processing |
23.2 |
403 |
37 |
213 |
21 |
| 800 |
General and administration |
15.4 |
266 |
24 |
141 |
14 |
| |
Total |
110.7 |
1,921 |
175 |
1,014 |
100% |
| (1) | Underground mining, Water and Waste Management, Processing and G&A operating cost do not include a
portion of the expenditures which have been capitalized – refer to Section 21.1.4.10. |
It is anticipated that 525 employees (staff and
labour) will be required during the peak of operations. See Section 21 for detailed peak labour list.
The economic assessment of the Project was carried
out using a discounted cash flow approach on a pre-tax and after-tax basis, based on consensus equity research on long-term commodity
price projections in United States dollars and cost estimates in the currency in which they are incurred. An exchange rate of USD 0.74
per CAD 1.00 was assumed to convert United States Dollar (“USD”) projections and particular components of the capital cost
estimates into Canadian Dollars (“CAD”). The base case gold price is USD 2,400 per ounce (“USD/oz”). No provision
was made for the effects of inflation. Current Canadian tax regulations were applied to assess the corporate tax liabilities, while the
most recent provincial regulations were applied to assess the British Columbia mining and carbon tax liabilities.
| |
Osisko Development Corp.
NI 43-101 Technical Report
Feasibility Study for the Cariboo Gold Project |
|
The economic analysis presented in this section
contains forward-looking information with regards to the Mineral Resource Estimates, commodity prices, exchange rates, proposed mine production
plan, projected recovery rates, operating costs, construction costs, and project schedule. The results of the economic analysis are subject
to several known and unknown risks, uncertainties, and other factors that may cause actual results to differ materially from those presented
here.
Osisko Gold Royalties retains a 5.0% net smelter
return royalty on the Project.
The input parameters used, and results of the
financial analysis are presented in Table 1-8, and the financial analysis summary is presented in Table 1-9.
The pre-tax base case financial model resulted
in an IRR of 26.5% and a NPV of $1,371.4M using a 5% discount rate. The pre-tax payback period after start of operations is 2.6 years.
On an after-tax basis, the base case financial
model resulted in an IRR of 22.1% and a NPV of $943.5M using a 5% discount rate. The after-tax payback period after start of operations
is 2.8 years.
The AISC including royalties over the LOM are
USD1,157/oz.
Table 1-8: Financial analysis
assumptions
| Description |
Unit |
Value |
| Long Term Gold Price |
USD/oz |
2,400 |
| Exchange Rate |
USD:CAD |
0.74 |
| Discount Rate |
% |
5.0 |
| Mine Life |
year |
10 |
| Total Ore Mined |
Mt |
17.8 |
| Average Gold Grade |
g/t |
3.62 |
| Overall Gold Metallurgical Recovery |
% |
92.6 |
| Gold Recovered in Doré |
koz |
884.0 |
| Gold Recovered in Flotation Concentrate |
koz |
1,033.5 |
| Flotation Concentrate Produced |
kt |
240.8 |
| Underground Mining Operating Cost |
$/t |
62.25 |
| Processing Operating Cost |
$/t |
23.21 |
| |
Osisko Development Corp.
NI 43-101 Technical Report
Feasibility Study for the Cariboo Gold Project |
|
| Description |
Unit |
Value |
| Waste and Water Management Operating Cost |
$/t |
4.97 |
| Electrical Transmission Line Operating Cost |
$/t |
4.93 |
| General and Administrative Operating Cost |
$/t |
15.36 |
| Total Operating Cost |
$/t |
110.73 |
| Royalties |
% NSR |
5.0 |
| Initial Capital Cost |
$M |
880.8 |
| Sustaining Capital Cost |
$M |
426.1 |
| Reclamation Cost |
$M |
134.8 |
| Salvage Value |
$M |
-36.0 |
Table 1-9: Financial analysis
results
| Description |
Unit |
Value |
| Pre-tax |
Net Present Value (0% discount rate) |
$M |
2,216.1 |
| Net Present Value (5% discount rate) |
$M |
1,371.4 |
| Internal Rate of Return |
% |
26.5 |
| Simple Payback Period |
year |
5.6 |
| Payback Period (after start of operations) |
year |
2.6 |
| After-tax |
Net Present Value (0% discount rate) |
$M |
1,577.4 |
| Net Present Value (5% discount rate) |
$M |
943.5 |
| Internal Rate of Return |
% |
22.1 |
| Simple Payback Period |
year |
5.8 |
| Payback Period (after start of operations) |
year |
2.8 |
A financial sensitivity analysis was conducted
on the Project’s after tax NPV and IRR using the following variables: capital cost (pre-production and sustaining) operating costs,
USD:CAD exchange rate, and the price of gold.
| |
Osisko Development Corp.
NI 43-101 Technical Report
Feasibility Study for the Cariboo Gold Project |
|
The graphical representations of the financial
sensitivity analysis on NPV and IRR are depicted in Figure 1-3 and Figure 1-4. The sensitivity analysis reveals that the USD:CAD
exchange rate and gold price have the most significant influence on both NPV and IRR compared to the other parameters, based on the range
of values evaluated. After the USD:CAD exchange rates and gold price, NPV was most impacted by changes in operating costs and then, to
a lesser extent, capital costs. After the USD:CAD exchange rate and gold price, the Project’s IRR was most impacted by variations
in capital costs and to a lesser extent, by the operating costs. Overall, the NPV of the Project is positive over the range of values
used for the sensitivity analysis.
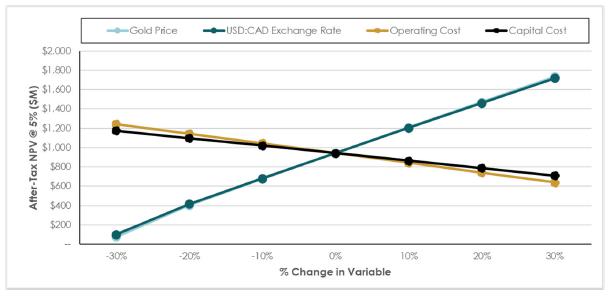
Figure 1-3: Sensitivity
of the net present value (after-tax) to financial variables
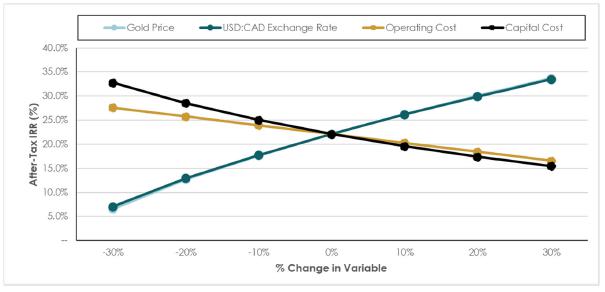
Figure 1-4: Sensitivity
of the internal rate of return (after-tax) to financial variables
| |
Osisko Development Corp.
NI 43-101 Technical Report
Feasibility Study for the Cariboo Gold Project |
|
| 1.17 | Project Schedule and Organization |
The Project will be developed by ODV. Construction
activities have been broken out to be carried out prior to construction to support infrastructure upgrades allowing for water treatment
and conveyance. Construction and pre-production will occur over a total of 30-months, commencing Q3 Year -3 with completion expected to
be achieved Q2 Year -1. Final product of construction will be a 4,900 tpd concentrator building with supporting infrastructures producing
gold flotation concentrate and doré, which will be transported to port to ship.
The Project’s organization and construction
execution philosophy benefits from certain existing facilities, expansion of the Ballarat camp, and experience gained with the current
operations at the Bonanza Ledge site.
The Integrated Owner’s Team has the personnel
and experience to bring the Project from exploration through production. All upcoming Project activities, including detailed engineering,
procurement, pre-production, and construction will be under the direction of the Vice-President Project Development of ODV.
Preconstruction activities allow for early works
to be completed while utilizing the existing Ballarat camp infrastructure with a current capacity of 76 beds. Before construction ramps
up, the camp will be expanded with additional dorm units increasing capacity to 264 beds.
The major Project activity milestones are presented
in Table 1-10.
Table 1-10: Key milestones
| Activity |
Months
from start of
construction |
| Main Construction Permits |
COMPLETE |
| Construction Start – Surface & Underground |
0 months |
| Earthworks Completed |
10 months |
| Process Plant Mill Building |
24 months |
| Underground Crushing Completed |
24 months |
| First Ore & Process Plant C3 |
24 months |
| Full Production Reached |
34 months |
| 69 kV/138 kV Powerline |
19 months |
| 69 kV/138 kV Substation |
19 months |
| Crusher Stations |
24 months |
| First Production Stoping |
24 months |
| |
Osisko Development Corp.
NI 43-101 Technical Report
Feasibility Study for the Cariboo Gold Project |
|
| 1.18 | Interpretations and Conclusions |
This FS was prepared by BBA and other experienced
consultants for ODV to demonstrate the economic viability of developing the Project resources as an underground mine, with a new processing
plant facility at the MSC. This Report provides a summary of the results and findings from each major area of investigation. Standard
industry practices, equipment, and processes were used. To date, the QPs are not aware of any unusual or significant risks or uncertainties
that could materially affect the reliability or confidence in the Project based on the information available or as discussed in this Report.
The results of the Report indicate that the proposed
Project has technical and financial merit using the base case assumptions. The QPs consider the FS results sufficiently reliable and recommend
that the Project be advanced to next stage of development through the initiation of detailed engineering.
The following conclusions are based on the QPs
detailed review of all pertinent information:
| ■ | The results demonstrate the geological and grade continuities for all eight
gold deposits in the Cow-Island-Barkerville Mountain Corridor. |
| ■ | In underground scenario, the Project contains an estimated Measured Mineral
Resource of 8,000 oz of gold, an Indicated Mineral Resource of 1,604,000 ounces, and an Inferred Mineral Resource of 1,864,000 oz.
These Mineral Resources are exclusive of the Reserves. |
| ■ | The Mineral Resource Estimates have not been updated since the 2022 FS MRE
as there has been no new drilling; however, there has been mining depletion for Lowhee and changes to the cut-off grade assumptions. |
| ■ | The LOM has a 10-year mine life at maximum production rates of 4,900 tpd.
Production ramps-up to steady state of 4,900 tpd is achieve by Q2 Year 1. |
| ■ | The Project mine layout demonstrates a development intensive stope access
requirement and therefore has a high development metre per tonne of mineralized material ratio. These factors may pose a challenge to
successful implementation of the mine plan given the restrictive geotechnical parameters and intrinsically lower productivities of the
mining method. However, through diligent planning and adherence to proper work procedures, sufficient active headings and stoping areas
should meet daily production requirements. |
| ■ | The Project process plant is designed with a comprehensive and integrated
flowsheet that emphasizes efficiency, recovery, and environmental responsibility. From underground crushing to doré production,
each stage of the process is engineered to maximize gold recovery while minimizing waste and environmental impact. The use of advanced
ore sorting, gravity concentration, and flotation technologies ensures high recovery rates, while the paste backfill system supports sustainable
tailings management. Based on the test work results and the proposed mining plan at the time, the overall projected Au recovery is 92.6%. |
| |
Osisko Development Corp.
NI 43-101 Technical Report
Feasibility Study for the Cariboo Gold Project |
|
| ■ | Overall, the water infrastructure at the MSC and Bonanza Ledge areas supports
the site’s water management strategy and achieves the following objectives: |
| - | Intercept and divert non-contact runoff; |
| - | Collect and manage contact water through water treatment. |
| ■ | WTP configurations account for highly variable seasonal flows, challenging
influent chemistry (including metals and nitrogen species), and resilience to extreme cold and storm events. Features such as redundant
pumping, heat tracing, storage capacity, and process flexibility are built into both facilities to ensure compliance and continuity of
operations. The water treatment strategy is fully integrated with the broader site water management system, and key performance objectives
include meeting provincial discharge limits, minimizing reagent usage, and ensuring long-term environmental protection during post-closure
monitoring and care. |
| ■ | The environmental baseline work completed to date, in addition to ongoing
environmental monitoring requirements in the EAC, Mines Act Permit, and Environmental Management Act Permits, is sufficient
to support this FS update. |
| ■ | The information and assumptions used in the design of the MSC, and Bonanza
Ledge are sufficient to support a FS. Further work is underway and recommended to support subsequent detailed engineering phase. |
| ■ | The total capital costs (initial and sustaining) for the Project were estimated
at $1,406M, and the average operating costs over the 10-year mine life is estimated to be $110.7/t mined. The AISC including royalties
over the LOM are USD $1,157/oz. |
| ■ | The financial analysis performed as part of this revised FS using the base
case assumptions results in an after-tax NPV 5% of $943M and an internal rate of return of 22.1% (base case exchange rate of 0.74 CAD
for 1.00 USD). The average base case LOM FCF of $158M and the payback period after start of commercial production is 2.8 years. |
The QPs consider the FS to be reliable, thorough,
based on quality data, reasonable hypotheses, and parameters compliant with NI 43-101 requirements and CIM Definition Standards.
| 1.18.1 | Risks and Opportunities |
An analysis of the results of the investigations
has identified a series of risks and opportunities associated with each of the technical aspects considered for the development of the
Project.
| |
Osisko Development Corp.
NI 43-101 Technical Report
Feasibility Study for the Cariboo Gold Project |
|
Potential Risks
The most significant potential risks associated
with the Project are:
| ■ | The planned daily mining production rate may be difficult to achieve due
to geological continuity issues, geotechnical issues, possible interaction of equipment, automation constraints, and other potential slowdowns
resulting in a longer mining cycle time; |
| ■ | Risks related to paste backfill, including: |
| - | Unrecorded historical workings may be encountered, leading to delays and higher paste fill costs; |
| - | Paste backfilling of old voids takes longer than planned, delaying development; |
| - | Insufficient void is available underground for paste backfill, risking use of contingency void storage, and at a worst case, plant
shutdown until emergency storage plan takes effect. |
| ■ | Ground conditions may be worse than anticipated, leading to dilution, lower
grades, and delays; |
| ■ | Greater water inflow than anticipated leading to an increase in water pumping
and treatment capital and operational costs; |
| ■ | The underground mine water quality is not represented by groundwater samples
collected from deep mine workings, and then the influent predictions may not be representative, and the water treatment design may need
to be re-evaluated; |
| ■ | The ore sorter mass pull is lower than the design value. The amount of ore
sorter waste sent to underground will then increase, requiring increased use of void space, leading to the requirement to drop the overall
recovery; |
| ■ | Ammonia and Nitrate concentration fluctuations for the WTP causing potential
starvation of the biological community in the MBBR; |
| ■ | The inability to locate an appropriate borrow source for aggregate material
near the Mine Site could increase the construction cost and environmental impact of the Project due to transporting the material over
a greater distance; |
| ■ | Risk of load exceeding the allowance, mitigated by power factor correction
and scalable distribution equipment; |
| ■ | Schedule risk related to amended permit- changes proposed to the project
will require amendments to existing certificates and permits. Timelines for regulatory processes may be lengthy and could impact construction
and operational schedule targets. Several of the previous noted risks are common to most mining projects, many of which may be mitigated,
at least to some degree, with adequate engineering, planning, and pro-active management. |
| |
Osisko Development Corp.
NI 43-101 Technical Report
Feasibility Study for the Cariboo Gold Project |
|
Key Opportunities
There are several opportunities that could improve
the economics, timing, and/or permitting potential of the Project. The key opportunities that have been identified at this time are as
follows:
| ■ | Surface and underground definition diamond drilling resulting in potential
to upgrade Inferred resources to the indicated category; |
| ■ | The planned processing plant and surface infrastructure design have been
strategically optimized to accommodate potential future expansion options. |
| ■ | Assessing the economic viability of extracting ore from geotechnical Class 5
category using a selective mining method, such as cut-and-fill leading to increase in Project value; |
| ■ | Dispose of rougher flotation tailings co-mingled with the ore sorter and
development waste on surface increasing flexibility and recovery; |
| ■ | Addition of a step-up substation to allow the transmission line to expand
to 138 kV to access more load for potential expansion; |
| ■ | Opportunity to blend contract for scopes of similar disciplines of work in
the request for proposal (“RFP”) process. |
Based on the results of the 2025 FS, the QPs recommend
that the Project move to an advanced phase of development, which would involve detailed engineering and that Project execution activities
commence at ODV’s discretion to ensure construction readiness.
It is also recommended that ODV do additional
work on the regional and local exploration to define potential expansions to the project footprint, and covert internal inferred resources
to extend LOM. The proposed work budget includes regional surface drilling and local infill drilling from underground. The budget amounts
to approximately $55M.
| |
Osisko Development Corp.
NI 43-101 Technical Report
Feasibility Study for the Cariboo Gold Project |
|
This NI
43-101 Technical Report (the “Report”) Feasibility Study for the Cariboo Gold Project (the “Project”) was
prepared and compiled by BBA Engineering Ltd. at the request of Osisko Development Corp. (“ODV”). The purpose of this Report
is to summarize the results of the 2025 Feasibility Study (“FS”) for the Project in accordance with the guidelines of the
Canadian Securities Administrators National Instrument 43-101 (“NI 43-101”) and Form 43-101F1. BBA is an independent
engineering consulting firm headquartered in Mont-Saint-Hilaire, Québec with mining groups based in Montréal, Vancouver,
Toronto, and Sudbury. The Vancouver team led the overall integration of this Report. This Report was prepared under ODV’s Manager
– Technical Services, Victor Gauthier P.Eng., and the ODV team, based on contributions from several independent consulting firms,
including BBA Engineering Ltd. (“BBA”), InnovExplo Inc. (“InnovExplo”), WSP Canada Inc. (“WSP”),
JDS Energy & Mining Inc. (“JDS”), Falkirk Environmental Consultants Ltd. (“Falkirk”), Integrated
Sustainability Consultants Ltd. (“IS”), M.A. O’Kane Consultants Inc. (“Okane”), Alius Mine Consulting
Inc. (“Alius”), and Clean Energy Consulting Inc. (“CEC”).
| 2.1 | Barkerville Gold Mines Division |
Barkerville Gold Mines Division (“BGM”)
is a 100%-owned subsidiary of ODV, focused on the development of over 2,000 square kilometres (“km2”) of mineral
tenures in the Cariboo Mining District in British Columbia (“BC”), Canada. The land holdings consist of a 67 kilometre (“km”)
long and 25 km wide belt that contains historically-producing mines, including Mosquito Creek Mine, Aurum Mine, and Cariboo Gold Quartz
Mine. The current resource development is focused on the Island Mountain, Cow Mountain, and Barkerville Mountain corridor (collectively,
the “Cow-Island-Barkerville Mountain Corridor”), where gold had been extracted from both pyrite replacement and quartz vein
ores.
| 2.2 | Basis of Technical Report |
The following Report presents the results of the
FS for the development of the Project. As of the date of this Report, ODV is a North American mine development company with a focus towards
becoming a mid-tier gold miner with opportunities for immediate production. ODV is listed on the TSX Venture Exchange ("TSXV")
and the New York Stock Exchange (“NYSE”) under the symbol "ODV" with its head office situated at:
1100, av des Canadiens-de-Montréal
Suite 300, P.O. Box 211
Montréal, QC H3B 2S2
| |
Osisko Development Corp.
NI 43-101 Technical Report
Feasibility Study for the Cariboo Gold Project |
|
This Report, titled, “NI 43-101 Technical
Report Feasibility Study for the Cariboo Gold Project” and effective as of April 25, 2025, was prepared following the guidelines
of NI 43-101 and in conformity with the guidelines of the Canadian Institute of Mining, Metallurgy and Petroleum (“CIM”)
Standards on Mineral Resources and Reserves (“CIM Definition Standards”).
| 2.3 | Report Responsibility and Qualified
Persons |
The following individuals, by virtue of their
education, experience, and professional association, are considered qualified persons (“QPs”) as defined in the NI 43-101
and are members in good standing of appropriate professional institutions:
| Mathieu Bélisle, P.Eng. |
BBA Engineering Ltd. (BBA) |
| Amanda Fitch, P.Eng. |
BBA Engineering Ltd. (BBA) |
| Sebastien Guido, P.Eng. |
Alius Mine Consulting Inc. (Alius) |
| Philip Clark, P.Eng. |
Clean Energy Consulting Inc. (CEC) |
| Rob Griffith, P.Eng. |
Falkirk Environmental Consultants Ltd. (Falkirk) |
| Katherine Mueller, P.Eng. |
Falkirk Environmental Consultants Ltd. (Falkirk) |
| Nikolay Sidenko, P.Geo. |
Falkirk Environmental Consultants Ltd. (Falkirk) |
| Eric Lecomte, P.Eng. |
InnovExplo Inc. (InnovExplo) |
| Carl Pelletier, P.Geo. |
InnovExplo Inc. (InnovExplo) |
| Tessa Scott, P.Geo. |
InnovExplo Inc. (InnovExplo)) |
| A.J. MacDonald, P.Eng. |
Integrated Sustainability Consultants Ltd. (IS) |
| Jean-François Maillé, P.Eng. |
JDS Energy & Mining Inc. (JDS) |
| Yapo Allé-Ando, P.Eng. |
M.A. O’Kane Consultants Inc. (Okane) |
| Rachel Sawyer, P.Eng. |
M.A. O’Kane Consultants Inc. (Okane) |
| Paul Gauthier, P.Eng. |
WSP Canada Inc. (WSP) |
The preceding QPs have contributed to the writing
of this Report and have provided QP certificates, included at the beginning of this Report. The information contained in the certificates
outlines the sections in this Report for which each QP is responsible. Each QP has also contributed figures, tables, and portions of Chapter 1
(Summary), Chapter 2 (Introduction), Chapter 25 (Interpretation and Conclusions), Chapter 26 (Recommendations), and Chapter 27 (References).
Table 2-1 outlines the responsibilities for the various sections of the Report and the name of the corresponding qualified person.
| |
Osisko Development Corp.
NI 43-101 Technical Report
Feasibility Study for the Cariboo Gold Project |
|
Table 2-1: Qualified persons
and areas of report responsibility
| Chapter |
Description |
Qualified
Person |
Company |
Comments
and exceptions |
| 1. |
Summary |
A. Fitch |
BBA |
All QPs contributed based on their respective scope of work and the Chapters/Sections under their responsibility. |
| 2. |
Introduction |
A. Fitch |
BBA |
All QPs contributed based on their respective scope of work and the Chapters/Sections under their responsibility. |
| 3. |
Reliance on other Experts |
A. Fitch |
BBA |
Section 3.2 |
| C. Pelletier |
InnovExplo |
Section 3.1 |
| 4. |
Project Property Description and Location |
C. Pelletier
T. Scott |
InnovExplo |
Sections 4.1 to 4.5 |
| K. Mueller |
Falkirk |
Section 4.6 and 4.7 |
| 5. |
Accessibility, Climate, Local Resource, Infrastructure and Physiography |
C. Pelletier
T. Scott |
InnovExplo |
All of Chapter 5 |
| 6. |
History |
C. Pelletier
T. Scott |
InnovExplo |
All of Chapter 6 |
| 7. |
Geological Setting and Mineralization |
C. Pelletier
T. Scott |
InnovExplo |
All of Chapter 7 |
| 8. |
Deposit Types |
C. Pelletier
T. Scott |
InnovExplo |
All of Chapter 8 |
| 9. |
Exploration |
C. Pelletier
T. Scott |
InnovExplo |
All of Chapter 9 |
| 10. |
Drilling |
C. Pelletier
T. Scott |
InnovExplo |
All of Chapter 10 |
| 11. |
Sample Preparation, Analyses and Security |
C. Pelletier
T. Scott |
InnovExplo |
All of Chapter 11 |
| 12. |
Data Verification |
C. Pelletier
T. Scott |
InnovExplo |
All of Chapter 12 |
| 13. |
Mineral Processing and Metallurgical Testing |
M. Bélisle |
BBA |
All of Chapter 13 |
| 14. |
Mineral Resource Estimate |
C. Pelletier
T. Scott |
InnovExplo |
All of Chapter 14, except for Section 14.12 |
| E. Lecomte |
InnovExplo |
Section 14.12 |
| 15. |
Mineral Reserve Estimate |
E. Lecomte |
InnovExplo |
All of Chapter 15 |
| 16. |
Mining Methods |
E. Lecomte |
InnovExplo |
Sections 16.1, 16.4, 16.5, 16.8, 16.9, and 16.10 |
| R. Griffith |
Falkirk |
Section 16.3 |
| S. Guido |
Alius |
Section 16.2 |
| P. Gauthier |
WSP |
Sections, 16.6, 16.7 |
| 17. |
Recovery Methods |
M. Bélisle |
BBA |
All of Chapter 17 |
| |
Osisko Development Corp.
NI 43-101 Technical Report
Feasibility Study for the Cariboo Gold Project |
|
| Chapter |
Description |
Qualified
Person |
Company |
Comments
and exceptions |
| 18. |
Project Infrastructure |
A. Fitch |
BBA |
Sections 18, 18.1, 18.2, 18.2.1, 18.2.1.1, 18.3, 18.3.5, 18.3.5.4, 18.3.6, 18.3.6.7, 18.3.6.9, 18.4 |
| P. Clark |
CEC |
Sections 18.3.6.6, 18.4.2 |
| R. Sawyer |
Okane |
Sections 18.2.2, 18.3.5.1 |
| Y. Allé-Ando |
Okane |
Sections 18.2.1.2, 18.3.3, 18.3.4 |
| A. MacDonald |
IS |
Sections 18.3.5.2, 18.3.6.4 |
| J.-F. Maillé |
JDS |
Sections 18.3.1, 18.3.5.3, 18.3.5.5, 18.3.6.1, 18.3.6.2, 18.3.6.3, 18.3.6.5, 18.3.6.8, 18.4.1 |
| R. Griffith |
Falkirk |
Section 18.3.2 |
| 19. |
Market Studies and Contracts |
A. Fitch |
BBA |
All of Chapter 19 |
| 20. |
Environmental Studies, Permitting, and Social or Community Impact |
K. Mueller |
Falkirk |
All of Chapter 20, except for 20.3.1 and 20.3.2 |
| R. Griffith |
Falkirk |
Section 20.3.3.1 |
| N. Sidenko |
Falkirk |
Sections 20.3.1, 20.3.2, 20.3.3.2 |
| 21. |
Capital and Operating Costs |
A. Fitch |
BBA |
Sections 21, 21.1, 21.1.1, 21.1.2, 21.1.2.1, 21.1.2.2, 21.1.3, 21.1.4, 21.1.4.6, 21.1.4.10, 21.1.4.11, 21.1.5, 21.1.5.6, 21.1.5.7, 21.2, 21.2.1, 21.2.2, 21.2.7, 21.2.8 |
| M. Bélisle |
BBA |
Sections 21.1.4.8, 21.1.5.9, 21.2.5 |
| P. Gauthier |
WSP |
Sections 21.1.4.2, 21.1.4.3, 21.1.5.2, 21.1.5.3, 21.2.3.10 |
| E. Lecomte |
InnovExplo |
Sections 21.1.4.1, 21.1.5.1, 21.1.5.8, 21.2.3 (except for 21.2.3.10) |
| A.J. MacDonald |
IS |
Sections 21.1.4.5, 21.2.6 |
| J-F. Maillé |
JDS |
Sections 21.1.2.3, 21.1.4.4, 21.1.4.7, 21.1.4.9, 21.1.5.4, 21.1.5.5, 21.3 |
| P. Clark |
CEC |
Sections 21.2.4 |
| 22. |
Economic Analysis |
A. Fitch |
BBA |
All of Chapter 22 |
| 23. |
Adjacent Properties |
C. Pelletier |
InnovExplo |
All of Chapter 23 |
| 24. |
Other Relevant Data and Information |
J.-F. Maillé |
JDS |
All of Chapter 24 |
| 25. |
Interpretation and Conclusions |
A. Fitch |
BBA |
All QPs contributed based on their respective scope of work and the Chapters/Sections under their responsibility. |
| 26. |
Recommendations |
A. Fitch |
BBA |
All QPs contributed based on their respective scope of work and the Chapters/Sections under their responsibility. |
| 27. |
References |
A. Fitch |
BBA |
All QPs contributed based on their respective scope of work and the Chapters/Sections under their responsibility. |
| |
Osisko Development Corp.
NI 43-101 Technical Report
Feasibility Study for the Cariboo Gold Project |
|
| 2.4 | Effective Dates and Declaration |
The overall effective date of the Report is April 25,
2025.
The Report has several effective dates for information:
Effective date of the Cariboo Gold
Project Mineral Resource Estimate: April 22, 2025;
Effective date of the Cariboo Gold
Project Mineral Reserve Estimate has an effective date of April 10, 2025;
Date of the financial analysis closure:
April 25, 2025.
This Report was prepared as a National Instrument
43-101 Standards of Disclosure for Mineral Projects Technical Report for ODV by QPs, collectively the “Report Authors”. The
quality of information, conclusions, and estimates contained herein is consistent with the level of effort involved in the Report Authors’
services, based on i) information available at the time of preparation; ii) data supplied by outside sources; and iii) the
assumptions, conditions, and qualifications set forth in this Report. This Report is intended for use by ODV, subject to the terms and
conditions of its respective contracts with the Report Authors, and relevant securities legislation.
The contract allows ODV to file this Report as
a Technical Report with Canadian Securities Regulatory Authorities pursuant to National Instrument 43-101. Except for the purposes legislated
under provincial securities law, any other uses of this Report by any third party is at that party’s sole risk. The responsibility
for this disclosure remains with ODV. The user of this document should ensure that this is the most recent Technical Report for the property
as it is not valid if a new Technical Report has been issued.
| 2.5 | Sources of Information |
This Report is based in part on internal company
reports, maps, published government reports, company letters and memoranda, and public information, as listed in Chapter 27 (References)
of this Report.
Sections from reports authored by other consultants
may have been directly quoted or summarized in this Report and are so indicated, where appropriate.
| |
Osisko Development Corp.
NI 43-101 Technical Report
Feasibility Study for the Cariboo Gold Project |
|
This FS has been completed using available information
contained in, but not limited to, the following reports, documents, and discussions:
Technical discussions with ODV personnel;
QPs’ personal inspection of
the Project site(s);
Reports of mineralogical, metallurgical,
and grindability characteristics of the Island Mountain, Cow Mountain, and Barkerville Mountain deposits, and Bonanza Ledge Site, conducted
by industry recognized metallurgical testing laboratories on behalf of ODV;
The Project resource block model and
estimate provided by InnovExplo, which are effective as of April 22, 2025;
The Project received an Environmental
Assessment Certificate (“EAC”), Certificate #M23-01, on October 10, 2023, and Schedule B of the certificate lays out
the conditions of the approval under 22 separate sections. The Mines Act permit, M-247, was received on November 12, 2024
and the Environmental Management Act permits, PE-17876 for Bonanza Ledge and PE-111511 for the Mine Site Complex, were received
on December 12, 2024.
Internal and commercially available
databases and cost models;
Various reports covering site hydrology,
hydrogeology, geotechnical, and geochemistry;
Various reports covering site physical
and biological environment;
Internal unpublished reports received
from ODV;
Additional information from public
domain sources.
The QPs have no known reason to believe that any
of the information used to prepare this Report and evaluate the Mineral Resources presented herein is invalid or contains misrepresentations.
The Report Authors have sourced the information
for this Report from the collection of documents listed in Chapter 27 (References).
| 2.5.2 | BBA Engineering Ltd. |
The following individuals provided specialist
input to Mathieu Belisle, QP:
Helin Girgin (BBA), Denise Nunes (BBA)
and Gabrielle Murphy (BBA) provided data analysis and interpretation of the metallurgical test work (Chapter 13), as well as inputs for
the development of the process plant operating cost estimate in Chapter 21 (Capital and Operating Costs).
Amaru Humala (BBA) provided capital
estimation development.
| |
Osisko Development Corp.
NI 43-101 Technical Report
Feasibility Study for the Cariboo Gold Project |
|
The following individuals provided specialist
input to Amanda Fitch, QP:
Amaru Humala (BBA) provided capital
estimation development;
Claude Catudal (BBA) prepared the
Monte Carlo contingency model and simulation for the Capital Direct costs (excluding the underground mine), and Capital Indirect costs;
Colin Hardie (BBA) provided advisory
services and review for the financial cash flow model;
Alexandre Burelle (Evomine) provided
the financial cash flow model, sensitivity analysis, and support in Chapter 22 content.
| 2.5.3 | Alius Mine Consulting Inc. |
The following individuals provided specialist
input to Sebastien Guido, QP:
Emmanuel Brouillard (Alius) and Guillaume
Debellefeuille (Alius) conducted the back-analysis of the Bonanza Ledge Mine stopes, provided by Victor Gauthier (ODV) and Philippe MacKay
(formerly ODV).
Victor Gauthier (ODV) also supplied
data for previously unclassified stopes, enabling their geotechnical classification.
Sébastien Tanguay (InnovExplo)
provided mine design (development and stopes) for review purposes.
Emmanuel Brouillard (Alius) compiled
and organized core box photographs near stopes historically classified by SRK, to support review and QA/QC efforts.
| 2.5.4 | Clean Energy Consulting Inc. |
The following individuals provided specialist
input to Philip Clark, QP:
Michael Atkinson (CEC) provided input
on the design of the substation.
Jiwoo Heo (CEC) provided input on
the design of the transmission line, and visited the site July 19-21, 2023, to discuss and review proposed transmission line crossings
and substation location.
| 2.5.5 | Falkirk Environmental Consultants Ltd. |
The following individuals provided input to Katherine
Mueller, QP:
Kelsey Dodd (ODV) provided information
on indigenous and community engagement.
| |
Osisko Development Corp.
NI 43-101 Technical Report
Feasibility Study for the Cariboo Gold Project |
|
The following individuals provided input to Nikolay
Sidenko, QP:
Kelsey Dodd (ODV) provided water quality
monitoring records.
Victor Gauthier (ODV) provided mine
plan inputs including volumes of mine workings and tonnages of mine waste.
Rob Griffith (Falkirk) modelled and
provided flows for different water quality streams
The following individuals provided input to Rob
Griffith, QP:
Victor Gauthier (ODV) provided mill
water balance flow rates.
Victor Gauthier (ODV) provided the
Mine Site Complex (“MSC”) Sediment Control Pond (“SCP”) storage capacity.
Knight Piésold designed the
SCP at the Bonanza Ledge Site.
M.A. Okane provided the waste rock
storage facility (“WRSF”) footprint and layout of water management infrastructure.
Victor Gauthier (ODV) provided the
drainage area divide under the proposed WRSF that will be defined by the slope of the underlying liner.
Victor Gauthier (ODV) provided historical
record of the water treatment plant (“WTP”) and underground dewatering flow rates at Bonanza Ledge.
Underground dewatering flow rates
were adopted from the results of the 2023 hydrogeological modelling study by WSP.
The following individuals provided specialist
input to Eric Lecomte, QP:
Sébastien Tanguay (InnovExplo),
Yness El Rakka (InnovExplo) and Constant Noutchogwe (InnovExplo) provided the design for underground workings and scheduled mine plan.
Laurent Tangni (Meglab) provided the
underground electrical design and cost estimates for related materiel and electrical charge. She also provided electrical sections of
Chapter 16.
Arianne Couture (Technosub) provided
the underground dewatering design, cost estimates for related materials, and the dewatering sections of Chapter 16.
Robert Hamilton (Independent external
consultant) provided the mobile equipment rebuild schedule and related personnel and material cost estimates for the major maintenance
of mobile fleet. He also contributed to the yearly operating hours.
Hugo Della Sbarba (Dello Ventilation)
provided the ventilation design, underground heating demand, cost estimates, and hardware requirements. He also provided ventilation sections
of Chapter 16.
| |
Osisko Development Corp.
NI 43-101 Technical Report
Feasibility Study for the Cariboo Gold Project |
|
| 2.5.7 | Integrated Sustainability |
The following individuals provided specialist
input to A.J. MacDonald, QP:
Nikolay Sidenko and Jacob Maclaine
(Falkirk) provided Water Quality Model Data and design input for the MSC WTP.
Rob Griffith (Falkirk) provided Water
Balance Model Data and design input for the MSC WTP.
Mohammed Awad (IS) directed the development
of the preliminary process designs for the MSC WTP.
Ingo Gloge (IS) directed the development
of the cost estimates for the Bonanza Ledge and MSC WTP.
| 2.5.8 | JDS Energy & Mining Inc. |
The following individuals provided
specialist input to Jean-François Maillé, QP:
Alex Simister (JDS) provided first
principle costing for bulk earthworks preparation for the Bonanza Ledge WRSF and SCP; MSC preparation/roads/berms; water management infrastructure;
MSC WTP.
Material take-off (“MTO”)
for the MSC water management infrastructure, Bonanza Ledge pit remediation, were provided by Yapo Allé-Ando (Okane)
MTO for the Bonanza Ledge SCP and
WRSF underdrain system were provided by Mark Alban (Knight Piésold).
Samir Dekhili (JDS) provided cost
estimates for the Construction Indirects.
Ishan Fechter (JDS) provided costing
for raw water wells, sewage treatment plant, camp fire protection, permanent offices and dry facility, Emergency Response Team (“ERT”)
garage upgrades, Ballarat camp upgrades, and gate houses.
Kevin Kerr (JDS) provided costing
for water treatment conveyance infrastructure from pump, and pipeline sizing basis were provided by Sébastien Provencher (Technosub).
Alex Burkinshaw (Surespan) provided
pricing for the Willow River bridge installation.
Aleicia Sharpe (WSP) provided installation
pricing for the effluent water discharge diffuser.
MTOs used for the budgetary request
for proposal (“RFP”) process for the concentrator building were provided by Amaru Humala (BBA). Pricing was sourced through
a formal budgetary RFP process with respective contractors specializing in the respective disciplines: architectural steel; structural
steel; piping; concrete; and mechanical equipment.
| |
Osisko Development Corp.
NI 43-101 Technical Report
Feasibility Study for the Cariboo Gold Project |
|
| 2.5.9 | M.A. O’Kane Consultants
Inc. |
The following individuals provided specialist
input to Yapo Allé-Ando, QP:
Ismail Ouchebri (Okane) provided design
inputs for the Bonanza Ledge and MSC surface water management system.
Hal Cooper (Okane) provided MTOs for
the surface water management infrastructure for Bonanza Ledge and MSC.
WSP provided the diffuser design for
Okane to review.
Knight Piésold designed the
SCP at the Bonanza Ledge Site.
The following individuals provided specialist
input to Rachel Sawyer, QP:
Hal Cooper (Okane) provided MTOs and
footprint for the WRSF design layout.
Alex Nguyen (Okane) competed the stability
analysis of the WRSF at Bonanza Ledge.
The following individuals provided specialist
input to Paul Gauthier, QP:
Robert Bradley and Steven Wagstaff
(WSP) provided the underground paste fill network distribution design and capital and operating costs.
Razel Laspinas and Shota Nakaska (WSP)
provided the underground material handling mechanical design and capital and operating costs.
T Engineering provided technical
data for the design of the underground paste fill distribution.
All of the individuals mentioned above who have
provided input are not considered QPs for the purposes of this NI43-101.
The following bulleted list describes which QPs
visited the Mine Site, the date of the visit, and the general objective of the visit:
Amanda Fitch (BBA) visited
the proposed MSC in Wells and the Bonanza Ledge site on November 8, 2024. The site visit was performed as an overall integrating
QP to observe the existing infrastructure on site and the proposed site for development.
Katherine Mueller (Falkirk)
visited the site between June 15 and June 16, 2022, to discuss all the environmental management, compliance, and water management
activities on site as it related to the current and future permitting requirements for the Project.
| |
Osisko Development Corp.
NI 43-101 Technical Report
Feasibility Study for the Cariboo Gold Project |
|
Eric Lecomte (InnovExplo) visited
the site on February 25, 2022. This first visit included a review of the proposed MSC location in the District of Wells and an inspection
of the Bonanza Ledge Site. The primary objective was to evaluate surface and underground site conditions, including a visual assessment
of ground conditions and excavation behaviour at Bonanza Ledge. A second visit was conducted on September 11, 2024, with a primary
focus on the Cow portal ramp. The inspection aimed to assess current ground conditions and excavation behaviour specific to the ramp area.
Discussions were held with site personnel regarding the operational performance of the Roadheader used for ramp development, including
its productivity, ground response, and cycle time performance.
Carl Pelletier (InnovExplo)
conducted a site visit from February 1 to 4, 2016, and from May 3 to 12, 2016. The first visit included the Bonanza Ledge pit,
the Cow Mountain area, and the Island Mountain area. The second involved a visit to the core logging facilities and several drill hole
collars. While on site, selected core intervals from the Barkerville Mountain and Cow Mountain deposits were reviewed, an independent
resampling program of said core was performed, and the Project databases were verified.
Jean-Francois Maillé (JDS)
visited the proposed MSC and Bonanza Ledge sites on October 21 and 22 2024. This site visit was intended as a refresher after having
previously carried out field work at the Bonanza Ledge site from January to September 2021.
Yapo Allé-Ando (Okane)
visited the MSC and Bonanza Ledge site on October 2-3, 2024, to conduct a review of the site layout as it pertains to existing and
planned surface water management infrastructure.
Sebastien Guido (Alius) visited
the Project on January 20–21, 2025. The first day included an underground tour of all developed workings, from the Cow portal
to the Lowhee bulk sample area. Ground conditions were visually assessed throughout, including the location of the ramp crossing a local
fault. Discussions were held with the engineering team regarding the bulk sample stope. A brief visit to the core logging facilities was
also conducted, accompanied by an ODV geologist. The second day focused on a detailed review of the core logging facilities, including
an in-depth assessment of the ODV geotechnical core logging procedure.
As of the effective date of this Report, the following
QPs have not visited the Project Site as per justification:
Mathieu Bélisle’s (BBA)
scope of work focused on the development of the process plant, which was based on test work data received from the metallurgical program
and laboratories. There is no existing infrastructure at the MSC for the proposed process plant, therefore a site visit was not required
for this Study.
| |
Osisko Development Corp.
NI 43-101 Technical Report
Feasibility Study for the Cariboo Gold Project |
|
Paul Gauthier (WSP) did not visit
the site; however, he relied upon a senior engineer from WSP, involved earlier in the Project, who visited the site and gathered information
required to achieve the work for the underground material handling and paste fill underground network distribution.
Tessa Scott (InnovExplo) did not visit
the site for this Study. Tessa was the chief resource geologist from 2017 to the end of 2021. Tessa was involved in a prior site visit
to gather information to verify the data supporting the resource estimation. An additional site visit was not necessary.
Philip Clark (CEC) did not visit the
site. The site and design team visited the site on Philip’s behalf in the summer 2023 and obtained all necessary information for
the design presented in this 2025 FS.
Rachel Sawyer (Okane) did not visit
the site; however, she relied upon a senior engineer from Okane who visited the Bonanza Ledge Site on October 2-3, 2024 to view existing
conditions within the WRSF footprint under her direct supervision.
A.J. MacDonald’s (IS) scope
of work focused on the development of the WTP design, which was based on water quality and balance Model data provided by the Project
team. AJ is satisfied that the information made available to him was sufficient to fulfill his responsibilities and believes that a site
visit would not have materially changed the conclusions or outcomes of his work.
Rob Griffith’s (Falkirk) scope
of work was focused on the development of the water balance model, which was based on information and data provided by the Project team,
including site characterization reports, topographic surveys, climate data, and engineering designs. Rob is satisfied that the information
made available to him was sufficient to fulfill his responsibilities and believes that a site visit would not have materially changed
the conclusions or outcomes of his work.
Nikolay Sidenko’s (Falkirk)
scope of work was focused on the development of the water quality model, which was based on information and data provided by the Project
team, including site characterization reports, water quality monitoring data, geochemical data, and engineering designs. Nikolay is satisfied
that the information made available to him was sufficient to fulfill his responsibilities and believes that a site visit would not have
materially changed the conclusions or outcomes of his work.
| |
Osisko Development Corp.
NI 43-101 Technical Report
Feasibility Study for the Cariboo Gold Project |
|
| 2.7 | Currency, Units of Measurement,
and Calculations |
Unless otherwise specified or noted, the units
used in this Report are metric. Every effort has been made to clearly display the appropriate units being used throughout this Report,
which comprise:
Currency is in Canadian dollars (“CAD”
or “$”);
All ounce units are reported in troy
ounces, unless otherwise stated:
1 oz (troy) = 31.1 grams (“g”) = 1.1 ounce (“oz”) (Imperial);
All metal prices are expressed in
United States dollars (“USD”);
A CAD to USD exchange rate of 0.74
USD for 1.00 CAD was used;
All cost estimates have a base date
of the second quarter (“Q2”) of 2025.
This Report includes technical information that
required subsequent calculations to derive subtotals, totals, and weighted averages. Such calculations inherently involve a degree of
rounding and consequently introduce a margin of error. Where these occur, the QPs consider them immaterial.
BBA and the other study contributors would like
to acknowledge the general support provided by the following personnel during this assignment:
The Project benefitted from the specific input
of Alexandre Burelle, Brandon Ott, Chris Martin, Dan Downton, Dave Rouleau, Eric Tremblay, Eryn Doyle, Frederic Doyon, Jessica Shaw, Jody
Laing, Kate Sloan, Kelsey Dodd, Manon Dussault, Matt Carter, Mary Norman, Philippe Mackay, Stephen Quin.
| |
Osisko Development Corp.
NI 43-101 Technical Report
Feasibility Study for the Cariboo Gold Project |
|
| 3. | Reliance on Other Experts |
The QPs have relied on reports, information sources,
and opinions provided by outside experts and Osisko Development Corp. related to the Cariboo Gold Project’s mineral rights, surface
rights, property agreements, royalties, and tax matters.
As of the date of this FS report, ODV indicates that there are no known or potential litigations that could affect the
Project.
A draft copy of the Report has been reviewed for
factual errors by ODV. Any changes made as a result of these reviews did not involve any alteration to the conclusions made. Hence, the
statements and opinions expressed in this document are given in good faith and in the belief that such statements and opinions are neither
false nor misleading at the date of this Report.
| 3.1. | Mineral Tenure and Surface Rights |
ODV supplied information about mining titles,
option agreements, environmental liabilities, permits, and First Nations negotiations. Carl Pelletier and Tessa Scott, QPs, of InnovExplo
consulted British Columbia’s internet-based electronic mineral titles administration system (Mineral Titles Online) (https://www.mtonline.gov.bc.ca/mtov/home.do)
for the latest status regarding ownership and mining titles. Although the QP has reviewed the option agreements and available claim status
documents, the QP is not qualified to express any legal opinion with respect to the property titles, current ownership, or possible litigation.
A description of such agreements, the property, and ownership thereof is provided for general information purposes only. In this regard,
the QP has relied on information provided by ODV.
This information is used in Chapter 4 of the Report.
The information is also used in support of the Mineral Resource Estimate in Chapter 14.
| 3.2. | Taxation and Royalties |
Amanda Fitch, QP, from BBA has relied on ODV for
guidance on applicable taxes, royalty agreements, and other government levies or interests, applicable to potential revenue or income
from the Project. This information is used in Chapter 19 (Market Studies and Contracts) and Chapter 22 (Economic Analysis) of the Report.
| |
Osisko Development Corp.
NI 43-101 Technical Report
Feasibility Study for the Cariboo Gold Project |
|
| 4. | Property Description and Location |
The Cariboo Gold Project is in the historic
Wells-Barkerville mining camp of British Columbia and extends for approximately 60 kilometres (“km”) from northwest
to southeast.
The Project falls
within the Cariboo Regional District (“CRD”), a division of the local government system in British Columbia (“BC").
The main towns in the Project area are the District of Wells (“Wells”) and Barkerville Historic Town & Park. Wells
is situated 74 km east of Quesnel, approximately 115 km southeast of Prince George, and approximately 500 km north of Vancouver (Figure 4-1).
The coordinates
of the centre of the Project are 121°34'17"W and 53°03'42"N (UTM coordinates: 595745E and 5880080N, NAD 83, Zone
10). The Project lies on NTS maps sheets 93A/12/13/14, 93G/08 and 93H/03/04/05.
| |
Osisko Development Corp.
NI 43-101 Technical Report
Feasibility Study for the Cariboo Gold Project |
|
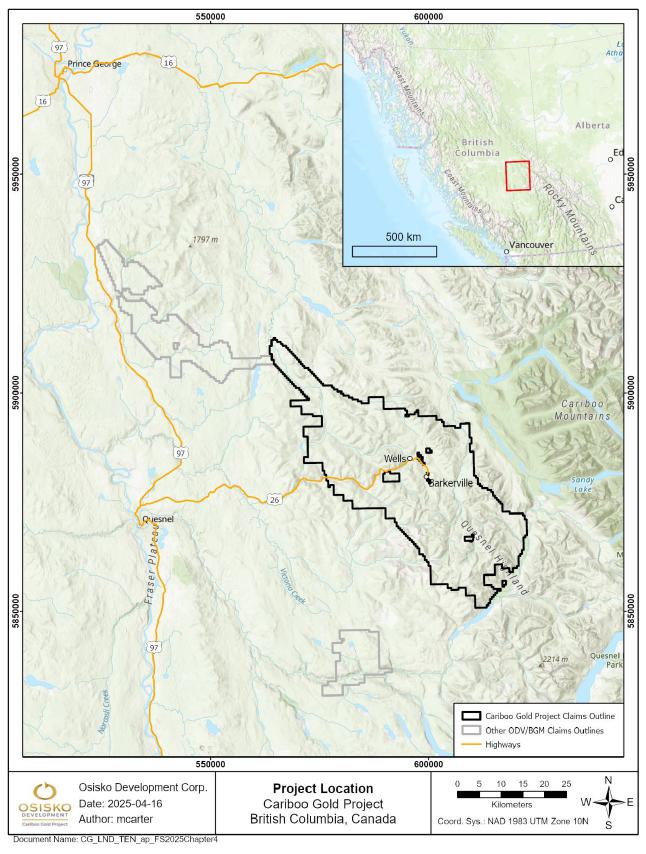
Figure 4-1: Location
of the Cariboo Gold Project
| |
Osisko Development Corp.
NI 43-101 Technical Report
Feasibility Study for the Cariboo Gold Project |
|
Osisko Development
Corp. supplied all mineral title maps and tables. ODV’s Barkerville Gold Mines Division Free Miner Certificate number is
110263668 and their Mineral Title Branch Client ID is 104256. The QPs verified the status of all mineral titles using Mineral Titles Online,
BC’s internet-based electronic mineral titles administration system.
ODV’s land holdings consist of 384 mineral
titles totalling 142,885.12 hectares (“ha”) in one contiguous property block known as the Cariboo Main Block. The reader is
reminded that the land holdings are registered in the names of Barkerville Gold Mines Ltd. (“BGM”) and will be referred to
as such in the following sections. These mineral titles include mineral claims, mineral leases, placer claims, and placer leases. Whereas
BGM is a wholly owned subsidiary of ODV, these titles grant ODV the rights to explore for metal ores in bedrock or talus rock, including
rock and other materials from mine tailings, dumps, and previously mined deposits of minerals, as set out in the Mineral Tenure Act. The
breakdown according to type of mineral title is as follows:
Cariboo Main Block:
384 mineral titles (142,885.12 ha):
| ■ | 321 mineral claims totalling 135,731.20 ha (Figure 4-2); |
| ■ | 49 placer claims totalling 4,602.98 ha (Figure 4-3); |
| ■ | 13 placer leases totalling 2,395.74 ha (Figure 4-3); |
| ■ | 1 mineral lease (#1105995) totalling 155.20 ha (Figure 4-2). |
BGM holds 100% of
interest in 62 Cariboo Main Block placer titles, and the mineral lease #1105995. BGM holds 100% of interest in 366 of the 384 Cariboo
Main Block mineral and placer claims and placer leases. A total of 17 mineral claims are jointly owned with other companies and individuals:
BGM holds 97.5% of interest in six mineral claims, 85% of interest in two mineral claims, and 50% interest in the other nine mineral claims.
A map showing mineral
title distribution and ownership is presented in Figure 4-2.
The Project also
contains 546 private land parcels from Crown-granted mineral claims (3,330.20 ha) that overlap many of the mineral titles, where
BGM is the registered owner on title of the surface and/or undersurface rights to the parcels (Figure 4-4).
| |
Osisko Development Corp.
NI 43-101 Technical Report
Feasibility Study for the Cariboo Gold Project |
|
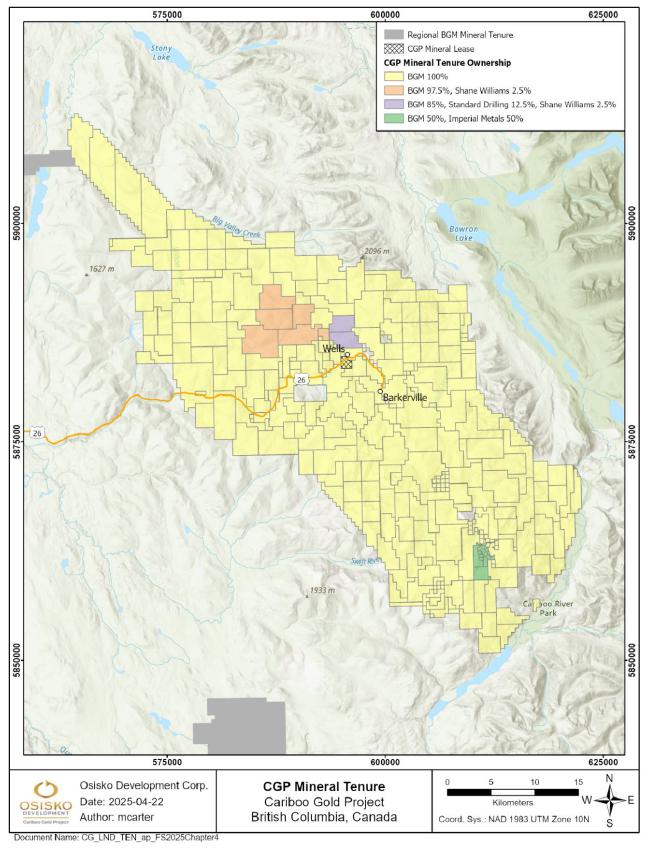
Figure 4-2: Mineral
title and ownership map for the Cariboo Gold Project
| |
Osisko Development Corp.
NI 43-101 Technical Report
Feasibility Study for the Cariboo Gold Project |
|
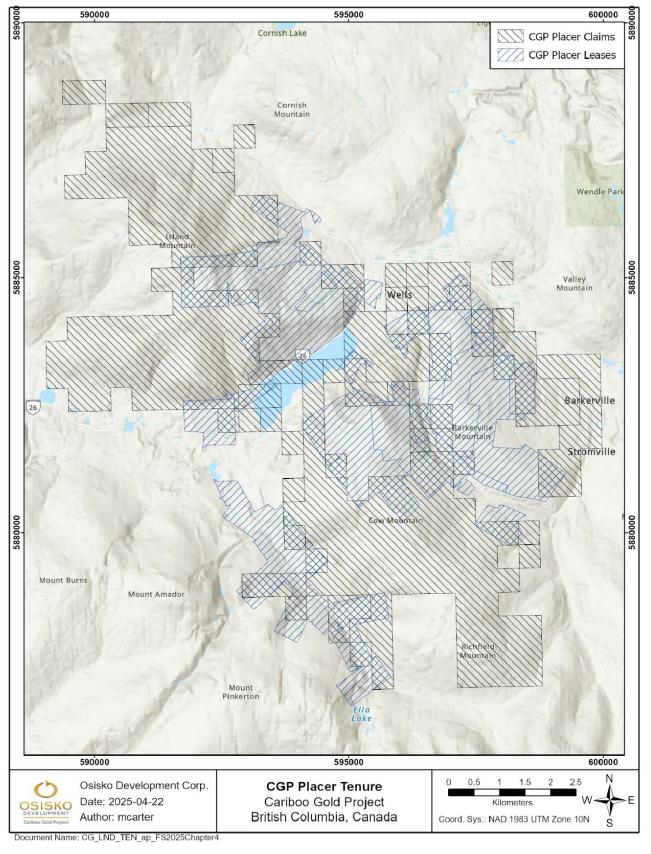
Figure 4-3: Placer
tenure ownership map for the Cariboo Gold Project
| |
Osisko Development Corp.
NI 43-101 Technical Report
Feasibility Study for the Cariboo Gold Project |
|
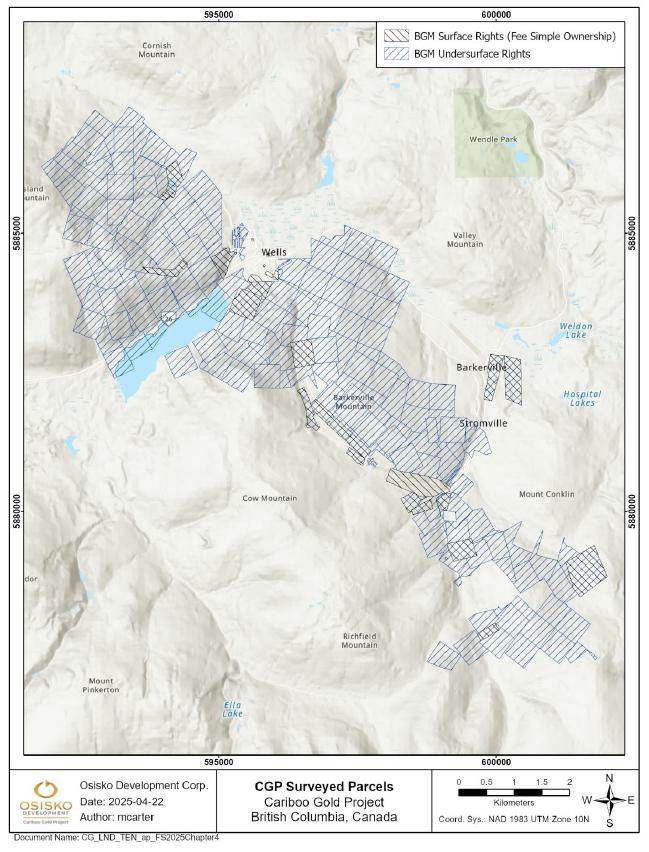
Figure 4-4: Map of
Crown-granted mineral claims on the Cariboo Gold Project
| |
Osisko Development Corp.
NI 43-101 Technical Report
Feasibility Study for the Cariboo Gold Project |
|
All placer claims,
leases, and 304 out of 321 mineral claims within the Cariboo Main Block are registered in the name of BGM. The remaining 17 mineral claims
are registered jointly with various other companies and individuals. All mineral titles held entirely or partially by BGM are in good
standing according to the Mineral Titles Online database as of April 30, 2025 (Mineral Titles Online, 2025).
There are no known significant factors or risks
that may affect access, title, or the right or ability to perform work on the Project.
The Project is subject to various royalties, agreements,
and encumbrances, as discussed below. A detailed list of mineral titles, ownership, royalties, and expiration dates is provided in Appendices
1, 2, and 3.
| 4.2. | Acquisition of the Cariboo Gold Project |
BGM began acquiring land in Wells, BC and surrounding
areas in the Cariboo Regional District in 1994. Under an option agreement dated October 4, 1994 (the “Cariboo Option Agreement”),
BGM was granted an option to acquire a 50% interest in the Cariboo Gold Quartz Property in the Cariboo Gold District. In 2009, BGM completed
the consolidation of the land package by acquiring contiguous projects belonging to Island Mountain Gold Mines Ltd. (“IGM”)
and Golden Cariboo Resources Ltd. (“Golden Cariboo”), both related parties to BGM and listed on the TSX Venture Exchange.
On May 12, 1999, BGM optioned to IGM a 50%
interest in the Island Mountain / Aurum Gold Mine and the properties belonging to Mosquito Creek Gold Mining Company Limited. That option
was then renegotiated in October 2004. In January 2006, BGM agreed to buy back the 50% interest in the optioned lands and purchase
all of IGM’s land holdings northwest of Wells, BC. This was approved by the TSX Venture Exchange on May 2, 2006.
To finalize the consolidation of the major land
holdings in the Cariboo Gold District, BGM acquired all of the lands controlled by Golden Cariboo that lay along strike of the known mineralized
trend for some 25 km from Barkerville Historic Town and Park, southeast of the Cariboo Hudson Mine. The acquisition of Golden Cariboo’s
mineral tenure holdings was approved by the TSX Venture Exchange on April 9, 2009, resulting in BGM’s land tenure extending
60 km and encompassing the majority of the known strike length of the Barkerville Gold Belt.
Since 1994, BGM has acquired many mineral titles
by staking and through agreements with other owners of titles within the Cariboo Gold District. Several claim groups are subject to net
smelter return (“NSR”) royalties (see Appendices 1, 2, and 3 for details).
Surface and undersurface
rights to Crown Granted surveyed land parcels within the Project have also been acquired by BGM as per Table 4-1.
| |
Osisko Development Corp.
NI 43-101 Technical Report
Feasibility Study for the Cariboo Gold Project |
|
| 4.3. | Royalties and Ownership |
On November 30,
2015, Barkerville entered into a letter agreement with Osisko Gold Royalties Ltd. (“OGR”) whereby OGR agreed to purchase
32 million common shares of BGM (the “Private Placement”) and a 1.5% NSR royalty on the Project (the “Royalty Financing”).
Pursuant to the Private Placement, OGR agreed to acquire 32 million flow-through common shares of BGM at a price of $0.32 per share, for
total proceeds to BGM of $10,240,000. Following the Private Placement, OGR expected to have ownership over 47,625,000 common shares of
BGM, representing approximately 19.9% of the issued and outstanding BGM shares.
OGR also agreed
to acquire a 1.5% NSR royalty on the Project for a cash consideration of $25M. As part of the Royalty Financing, OGR
and BGM also agreed to negotiate a gold stream agreement (“Gold Stream Agreement”) following the completion by BGM of a feasibility
study on the Project. According to the terms, following a 60-day negotiation period, if OGR and BGM had not entered into a Gold Stream
Agreement, BGM would either grant a right to OGR to purchase an additional 0.75% NSR royalty for consideration of $12.5M or make
a payment of $12.5M to OGR.
On March 27, 2017, BGM announced it had entered
into a letter agreement with OGR whereby OGR agreed to purchase an additional 0.75% NSR royalty on the Project for a cash consideration
of $12.5M (paid). At the time, OGR owned a total NSR royalty of 2.25% on all mineral claims and leases, placer claims and leases
and crown-granted mineral claims held by BGM. The grant of the additional royalty would cancel OGR’s royalty right, which was granted
pursuant to the investment agreement between OGR and BGM dated February 5, 2016; however, OGR would retain a right of first refusal
relating to any gold stream offer received by BGM with respect to the Project.
On September 5, 2018, BGM entered into the
Second Amended and Restated Royalty Purchase Agreement, whereby OGR purchased an additional 1.75% NSR royalty on the Cariboo Gold Project
for a cash consideration of $20M (paid), with an option for OGR to purchase an additional 1.0% NSR royalty for $13M, to
bring the Cariboo NSR to 5.0%.
On September 23, 2019, BGM and OGR
entered into a definitive agreement, pursuant to which OGR acquired all of the issued and outstanding common shares of BGM that it
did not already own by way of a plan of arrangement (the "Arrangement"). Under the terms of the Arrangement, each
shareholder of BGM (excluding OGR) received 0.0357 (the "Exchange Ratio") of a common share of OGR for each share of BGM
held. The Exchange Ratio implied a consideration of $0.58 per BGM share, based on the closing price of OGR shares on the Toronto
Stock Exchange ("TSX") on September 20, 2019. The Exchange Ratio implied an equity value of approximately $338M on a fully diluted in-the-money basis, inclusive of BGM shares held by OGR.
| |
Osisko Development Corp.
NI 43-101 Technical Report
Feasibility Study for the Cariboo Gold Project |
|
On November 21,
2019, the Arrangement became effective at 12:01 a.m. (Pacific Standard Time), and resulted in BGM becoming a wholly owned
subsidiary of OGR.
On October 5,
2020, OGR announced a spin out of mining assets, and the creation of ODV, and exercised the 1.0% NSR purchase option on the Project, bringing
the total royalty held by OGR on the Project to 5.0%. The Project is now operated by ODV (formerly Barolo Ventures Corp.), with
BGM now a wholly owned subsidiary of ODV. BGM no longer trades publicly on the TSX or any other stock exchange, pursuant to the earlier
definitive agreement dated September 23, 2019, and the Arrangement whereby all of the issued and outstanding shares of BGM were acquired
by OGR. ODV trades publicly under the symbol ODV on the TSX and the NYSE.
OGR’s 5.0% NSR royalty is the only royalty
that applies to the mineral resource area of the Project.
| 4.4. | Surface Rights Option Agreements |
Table 4-1
lists properties where BGM owns the surface rights as well as the underlying option agreements under which the properties were acquired.
| |
Osisko Development Corp.
NI 43-101 Technical Report
Feasibility Study for the Cariboo Gold Project |
|
Table 4-1: Barkerville
surface rights option agreements
| Pid |
Cg
# |
District
Lot |
Fee
Simple
Owner |
Title
# |
Agreement
Name |
Vendee |
Vendor |
| 008-218-803 |
5313/624
(U), 5763/628 (S) |
10518 |
BARKERVILLE
GOLD MINES LTD. |
CA3393918 |
Island
Mountain & Mosquito Creek Properties (MCG - IWG) |
International
Wayside Gold Mines Ltd. |
Mosquito
Consolidated Gold Mines |
| 008-801-908 |
35/36
(B), 2672/597 (U) |
93 |
BARKERVILLE
GOLD MINES LTD. |
CA3322180 |
Wells
- Barkerville Cariboo Claims |
Mosquito
Creek Gold Mining Company Ltd. |
Wharf
Resources Ltd. / Peregrine Petroleum Ltd. |
| 004-056-582 |
41F/34 |
41F |
BARKERVILLE
GOLD MINES LTD. |
BB1960681 |
Myrtle-Proserpine
Property (Newmont - GC) |
Gold
City Mining Corp. |
Newmont
Exploration Inc. |
| 004-056-710 |
1F/34 |
1F |
BARKERVILLE
GOLD MINES LTD. |
CA6623323 |
Williams
Creek Crown Grants |
Barkerville
Gold Mines Ltd. |
Williams
Creek Gold |
| 004-056-736 |
1B/35 |
1B |
BARKERVILLE
GOLD MINES LTD. |
CA6623292 |
Derrien
Road Access Agreement |
Charls
Derrien |
Barkerville
Gold Mines Ltd. |
| 004-056-752 |
32F/34 |
32F |
BARKERVILLE
GOLD MINES LTD. |
CA4347922 |
Williams
Creek Crown Grants |
Barkerville
Gold Mines Ltd. |
Williams
Creek Gold |
| 004-056-787 |
4B/35 |
4B |
BARKERVILLE
GOLD MINES LTD. |
CA4347919 |
Derrien
Road Access Agreement |
Charls
Derrien |
Barkerville
Gold Mines Ltd. |
| 004-078-543 |
2F/34 |
2F |
BARKERVILLE
GOLD MINES LTD. |
CA3322186 |
Blackbull &
Camusa Crown Grants |
International
Wayside Gold Mines Ltd. |
Grand
Lowhee Mining Co. Ltd. |
| 004-078-560 |
42F/34 |
42F |
BARKERVILLE
GOLD MINES LTD. |
CA332187 |
Blackbull &
Camusa Crown Grants |
International
Wayside Gold Mines Ltd. |
Grand
Lowhee Mining Co. Ltd. |
| 004-078-578 |
17F/34 |
17F |
BARKERVILLE
GOLD MINES LTD. & GOLDEN CARIBOO RESOURCES LTD. |
CA3322185 |
Xmas
Crown Grants |
International
Wayside Gold Mines Ltd. and Golden Cariboo Resources Ltd. |
P.
Wright Contracting Ltd. |
| 004-078-608 |
35F/34 |
35F |
BARKERVILLE
GOLD MINES LTD. |
CA5682814 |
35F
St George Crown Grant |
Barkerville
Gold Mines Ltd. |
Prairie
Flower Company Inc. |
| 004-078-632 |
5F/34 |
5F |
BARKERVILLE
GOLD MINES LTD. |
FB503371 |
Derrien
Road Access Agreement |
Charls
Derrien |
Barkerville
Gold Mines Ltd. |
| 004-086-627 |
2B/35 |
2B |
BARKERVILLE
GOLD MINES LTD. |
CA3393199 |
Wells
- Barkerville Cariboo Claims |
Mosquito
Creek Gold Mining Company Ltd. |
Wharf
Resources Ltd. / Peregrine Petroleum Ltd. |
| 004-086-872 |
20F/34 |
20F |
BARKERVILLE
GOLD MINES LTD. |
PT5233,
PC16246 |
Island
Mountain & Mosquito Creek Properties (MCG - IWG) |
International
Wayside Gold Mines Ltd. |
Mosquito
Consolidated Gold Mines |
| 004-086-902 |
30F/34 |
30F |
BARKERVILLE
GOLD MINES LTD. |
PT5234,
PC16247 |
Island
Mountain & Mosquito Creek Properties (MCG - IWG) |
International
Wayside Gold Mines Ltd. |
Mosquito
Consolidated Gold Mines |
| 004-087-054 |
39F/34 |
39F |
BARKERVILLE
GOLD MINES LTD. |
PT5232,
PC16245 |
Island
Mountain & Mosquito Creek Properties (MCG - IWG) |
International
Wayside Gold Mines Ltd. |
Mosquito
Consolidated Gold Mines |
| 004-087-097 |
38F/34 |
38F |
BARKERVILLE
GOLD MINES LTD. |
PT5235,
PC16248 |
Island
Mountain & Mosquito Creek Properties (IWG - IMG) |
Island
Mountain Gold Mines Ltd. |
International
Wayside Gold Mines Ltd. |
| 014-385-643 |
5436/625 |
7795 |
BARKERVILLE
GOLD MINES LTD. |
CA3322188 |
P
Wright Mosquito Crown Grants |
International
Wayside Gold Mines Ltd. |
P.
Wright Contracting Ltd. |
| 014-385-686 |
5439/625 |
7798 |
BARKERVILLE
GOLD MINES LTD. |
CA3322189 |
Wells
- Barkerville Cariboo Claims |
Mosquito
Creek Gold Mining Company Ltd. |
Wharf
Resources Ltd. / Peregrine Petroleum Ltd. |
| 014-385-741 |
535/92 |
318 |
BARKERVILLE
GOLD MINES LTD. |
CA3322182 |
Wells
- Barkerville Cariboo Claims |
Mosquito
Creek Gold Mining Company Ltd. |
Wharf
Resources Ltd. / Peregrine Petroleum Ltd. |
| 014-385-759 |
4614/617
(S), 35/36 (B) |
92 |
BARKERVILLE
GOLD MINES LTD. |
CA3322179 |
Cariboo
Gold Quartz Property |
International
Wayside Gold Mines Ltd. |
Mosquito
Consolidated Gold Mines Ltd. |
| 014-982-013 |
35/36 |
94 |
BARKERVILLE
GOLD MINES LTD. |
CA3322181 |
Cariboo
Gold Quartz Property |
International
Wayside Gold Mines Ltd. |
Mosquito
Consolidated Gold Mines Ltd. |
| 015-289-681 |
385/674 |
10467 |
BARKERVILLE
GOLD MINES LTD. |
CA4347921 |
Williams
Creek Crown Grants |
Barkerville
Gold Mines Ltd. |
Williams
Creek Gold |
| 014-385-732 |
2517/101 |
391 |
BARKERVILLE
GOLD MINES LTD. |
CA3322183 |
P
Wright Mosquito Crown Grants |
International
Wayside Gold Mines Ltd. |
P.
Wright Contracting Ltd. |
| 006-787-592 |
4215/55 |
131 |
BARKERVILLE
GOLD MINES LTD. |
CA3322184 |
12422
Barkerville Hwy
(Parcel B Block 7 DL 131) |
International
Wayside Gold Mines Ltd. |
Kenneth
James Pollock and Dianne Lee Verne Pollock |
| 026-025-906 |
2517/101 |
391 |
BARKERVILLE
GOLD MINES LTD. |
BB1991819 |
Barkerville
Apartments (Lot 1 DL 391) |
Barkerville
Gold Mines Ltd. |
Standard
Drilling & Engineering Ltd. |
| 017-589-517 |
2517/101 |
391 |
BARKERVILLE
GOLD MINES LTD. |
CA4545743 |
LV
Fuel Tank Lot (Lot 1 DL 391) & Lot 2 DL 391 |
Barkerville
Gold Mines Ltd. |
Pete
Wright (017-589-517) |
| 018-685-056 |
1036/97 |
289 |
BARKERVILLE
GOLD MINES LTD. |
CA6190280 |
4270
Sanders Ave (Community Relations Office) |
Barkerville
Gold Mines Ltd. |
Dennis
Wayne Manuel |
| 005-537-541 |
5313/624
(U), 5763/628 (S) |
10518 |
BARKERVILLE
GOLD MINES LTD. |
CA8578737 |
4192
Davies Rd. (House Purchase) |
Barkerville
Gold Mines Ltd. |
Robin
Sharpe |
| |
Osisko Development Corp.
NI 43-101 Technical Report
Feasibility Study for the Cariboo Gold Project |
|
| Pid |
Cg
# |
District
Lot |
Fee
Simple
Owner |
Title
# |
Agreement
Name |
Vendee |
Vendor |
| 006-773-931 |
1036/97 |
289 |
BARKERVILLE
GOLD MINES LTD. |
CA9231853 |
4206 &
4215 Margaret Ave |
Barkerville
Gold Mines Ltd. |
Kelsey
Dodd |
| 009-497-463 |
2517/101 |
391 |
BARKERVILLE
GOLD MINES LTD. |
CA6851547 |
Merrick
Wells Lots |
Barkerville
Gold Mines Ltd. |
Estate
of Douglas Warren Merrick |
| 018-847-340 |
1036/97 |
289 |
BARKERVILLE
GOLD MINES LTD. |
BX36213 |
Merrick
Wells Lots |
Barkerville
Gold Mines Ltd. |
Estate
of Douglas Warren Merrick |
| 013-100-572 |
2517/101 |
391 |
BARKERVILLE
GOLD MINES LTD. |
CA6670546 |
Merrick
Wells Lots |
Barkerville
Gold Mines Ltd. |
Estate
of Douglas Warren Merrick |
| 013-778-366 |
1036/97 |
289 |
BARKERVILLE
GOLD MINES LTD. |
CA9229300 |
4206 &
4215 Margaret Ave |
Barkerville
Gold Mines Ltd. |
Kelsey
Dodd |
| 018-328-288 |
1036/97 |
289 |
BARKERVILLE
GOLD MINES LTD. |
CA8802577 |
Blair
Ave Subdivided Lots (House Purchase) |
Barkerville
Gold Mines Ltd. |
Sharon
Brown |
| 019-113-854 |
2517/101 |
391 |
BARKERVILLE
GOLD MINES LTD. |
CA6881775 |
Merrick
Wells Lots |
Barkerville
Gold Mines Ltd. |
Estate
of Douglas Warren Merrick |
| 023-677-007 |
4215/55 |
131 |
BARKERVILLE
GOLD MINES LTD. |
PM47667 |
Cariboo
RV Park |
Barkerville
Gold Mines Ltd. |
Joy
Stepan |
| 018-856-870 |
4215/55 |
131 |
BARKERVILLE
GOLD MINES LTD. |
CA801713 |
12438
Barkerville Hwy (Hubs Motel Purchase) |
Barkerville
Gold Mines Ltd. |
Harald
Dietrich Andreesen and Dianne Elaine Andreesen |
| 015-300-226 |
2099/1091 |
12634 |
BARKERVILLE
GOLD MINES LTD. |
CA2741385 |
Lightning
Hotel / Stanley Road |
Barkerville
Gold Mines Ltd. |
Karen
Olsen |
| 024-954-527 |
3417/306 |
363 |
BARKERVILLE
GOLD MINES LTD. |
FB488576 |
Bowron
Lake Cabin |
Barkerville
Gold Mines Ltd. |
Pete
Wright |
| 031-410-821 |
1036/97 |
289 |
BARKERVILLE
GOLD MINES LTD. |
CA9059927 |
Blair
Ave Subdivided Lots (House Purchase) |
Barkerville
Gold Mines Ltd. |
Sharon
Brown |
| 031-410-812 |
1036/97 |
289 |
BARKERVILLE
GOLD MINES LTD. |
CA9505757 |
Blair
Ave Subdivided Lots (House Purchase) |
Barkerville
Gold Mines Ltd. |
Sharon
Brown |
| |
Osisko Development Corp.
NI 43-101 Technical Report
Feasibility Study for the Cariboo Gold Project |
|
| 4.5. | Statutory Obligations |
Environmental reclamation security or bonds are
required to be posted for all areas where mining or exploration disturbance has been approved. The permittee also maintains regular water,
environmental, and wildlife monitoring activities as part of their permitting requirements within the Project area.
| 4.5.1. | Environmental Liabilities |
Environmental liabilities associated with the
development and operation of the Project must be addressed for all activities and disturbances associated with the proposed operations
through active management and reclamation/closure of the Project sites as the operation winds down. The permittee is also required to
provide reclamation liability security bonds that are set at a level that reflect outstanding reclamation, environmental and closure obligations
associated with the site. The amount of security may be increased or decreased based on the mine’s actual reclamation liability
at any point in time, including decreases as progressive reclamation is completed.
A site-specific Closure and Reclamation Plan (“RCP”)
for the Mine Site Complex, located at Wells, was submitted to the BC Ministry of Mining and Critical Minerals (“MCM”), in
accordance with the application requirements for a Mines Act permit pursuant to the Mines Act (Government of BC, 1996),
and Parts 10.6 and 10.7 of the revised Health, Safety, and Reclamation Code (“HSRC”) for Mines in British Columbia (EMLI,
2021).
The Mines Act Permit M-247 required an
initial reclamation security bond of $32,500,000 be posted to the BC Ministry of Finance by February 28, 2025. Additional incremental
reclamation security bonding of up to $157,900,000 is also required, as per the schedule and triggers defined in the Permit. Incremental
bonding is only to be paid in the event a triggering activity occurs. It is anticipated that some of the incremental bonding triggers
may be amended through future permit amendment processes to align with the updated project. This bond can be progressively recovered pending
satisfactory completion of reclamation and closure objectives.
| 4.5.2. | Required Permits and Status |
The Project was
subject to a provincial environmental assessment (“EA”) as it exceeded the following threshold under the Reviewable Projects
Regulation (Government of BC, 2019b, BC Reg. 243/2019): “A new mine facility that, during operations, will have
a production capacity of >75,000 tonnes/year of mineral ore”. The Environmental Assessment Certificate (“EAC”)
for the Project was received on October 10, 2023. It is expected that an amendment to the certificate will be required for the changes
discussed in this study update. Consultation with the BC Environmental Assessment Office will confirm the requirements and process for
the amendment.
| |
Osisko Development Corp.
NI 43-101 Technical Report
Feasibility Study for the Cariboo Gold Project |
|
ODV filed a Joint Permit Application (“JPA”)
for the Project in 2023, which was reviewed through a coordinated process under the Mines Act and Environmental Management Act.
Mines Act Permit M-247, encompassing the Mine Site (Mine Site Complex, and Bonanza Ledge) was issued November 20, 2024, and
the Environmental Management Act (“EMA”) permits PE-17876 for discharge to Lowhee Creek and PE-111511 for discharge
to Jack of Clubs Lake were issued on December 11, 2024. The Licence of Occupation to facilitate the construction of the Transmission
Line is expected to be issued in 2025.
In BC, changes to mining operations that are a
substantial departure from the approved activities require an amendment to the associated Mines Act permit. For example, changes
to the Permitted Mine Area, substantial changes to waste management, or an increase to the production rate. Changes to the EMA effluent
discharge permit will be required if there are changes to the discharge quality, quantity, or location. Discussions with provincial regulators
will provide clarity whether the changes proposed in this study update will require amendments, and the process and timelines to consider.
Activities that have been approved can still proceed during the amendment process.
A comprehensive
list of the permits required or in place for the Project is included in Table 4-2.
Table 4-2: Provincial
permits and approvals potentially applicable to the Project
| Permit
/ Approval |
Responsible
Agencies |
Provincial
Statute |
| Mines Act Permit |
BC Ministry of Mining and Critical Minerals (“MCM”) |
Mines Act |
| Effluent Discharge Permit |
BC Ministry of Environment and Parks (“ENV”) |
Environmental Management Act |
| Mineral Lease |
BC MCM, Mineral Titles Branch |
Mineral Tenure Act |
| Emissions Discharge Permit |
ENV |
Environmental Management Act |
| Refuse Permit and Waste Storage Approval |
ENV |
Environmental Management Act |
| Heritage Conservation Act Permit |
Ministry of Forests (“MOF”), Archaeology Branch |
Heritage Conservation Act |
| Heritage Conservation Act Concurrence letters |
MOF, Archaeology Branch |
Heritage Conservation Act |
| License of Occupation |
Ministry of Water, Land, and Resource Stewardship (“WLRS”) |
Land Act |
| Statutory Right of Way |
WLRS |
Land Act |
| Wildlife Act Permit |
WLRS, Resource Stewardship Division |
Wildlife Act |
| Sewer System Regulation Approval |
BC Ministry of Health, Interior Health Authority (“IHA”), Northern Health Authority (“NHA”) |
Public Health Act |
| |
Osisko Development Corp.
NI 43-101 Technical Report
Feasibility Study for the Cariboo Gold Project |
|
| Permit
/ Approval |
Responsible
Agencies |
Provincial
Statute |
| Construction Permit for a Potable Water Well |
BC Ministry of Health, NHA |
Drinking Water Protection Act |
| Water System Construction Permit |
BC Ministry of Health, NHA |
Drinking Water Protection Act |
| Drinking Water System Operations Permit |
BC Ministry of Health, NHA |
Drinking Water Protection Act |
| Short Term Use of Water Permit Water Sustainability Act Section 10 |
WLRS, Water Stewardship Branch |
Water Sustainability Act |
| Change Approval (for changes in and about a stream), Water Sustainability Act Section 11 |
WLRS, Water Stewardship Branch |
Water Sustainability Act |
| Water Licence (diversion, storage, and use of water) Water Sustainability Act Sections 7 and 9 (Government of BC, 2014) |
WLRS, Water Stewardship Branch |
Water Sustainability Act |
| Licences to Cut and Special Use Permit |
MOF, Forest Tenures Branch |
Forest Act |
| Industrial Access Permit |
BC Ministry of Transportation and Infrastructure (“MOTI”) |
Transportation Act |
| Permit for regulated activities |
Ministry of Health |
Public Health Act |
| Explosives Magazine Storage and Use Permit |
MCM |
Mines Act |
In addition to provincial permitting and licence
requirements, several federal authorizations are required related to specific activities in support of the Project.
Table 4-3: Federal
permits and approvals potentially applicable to the Project
| Permit
/ Approval |
Responsible
Agencies |
Federal
Statute |
Project
Activity / Regulatory Context |
| Fisheries Act Authorization |
Fisheries and Oceans Canada (“DFO”) |
Fisheries Act |
No person shall carry on any work, undertaking, or activity other than
fishing that results in the death of fish.
No person shall carry on any work, undertaking, or activity that results
in the harmful alteration, disruption, or destruction (“HADD”) of fish habitat.
If the death of fish or a HADD cannot be avoided during any part of
the Project, an Authorization under Section 35 may be required. |
| Migratory Birds Convention Act Authorization |
Environment and Climate Change Canada (“ECCC”) |
Migratory Birds Convention Act |
Deposit of substances harmful to migratory birds or vegetation clearing
for the Project during the migratory bird nesting season as outlined by ECCC (May 1 to July 15, Zone A4)
Permits may be issued to eliminate dangerous conditions or damage to
property caused by migratory birds or their nests. |
| |
Osisko Development Corp.
NI 43-101 Technical Report
Feasibility Study for the Cariboo Gold Project |
|
| Permit
/ Approval |
Responsible
Agencies |
Federal
Statute |
Project
Activity / Regulatory Context |
| Navigation Protection Program Notification and/or Approval |
Transport Canada |
Canadian Navigable Waters Act |
Notification and information to the Minister for works that are in,
on, over, under, through or across any navigable water.
Application for approval from the Minister is required for works (other
than minor works) that are in, on, over, under, through or across any navigable water and that may interfere with navigation. |
| Species at Risk Act Authorizations (if required |
ECCC, DFO, and Parks Canada |
Species at Risk Act (“SARA”) |
The Competent Minister may issue a SARA permit authorizing activity that will affect a listed wildlife species, any part of its critical habitat, or the residences of its individuals. |
| Explosive Licences and Permits |
Natural Resources Canada |
Explosives Act |
Explosive Licence required for factories and magazines.
Explosive Permit required for vehicles used for the transportation
of explosives. |
| Transportation of Dangerous Goods Permits |
Transport Canada |
Transportation of Dangerous Goods Act |
Addresses the classification, documentation, marking, means of containment, required training, emergency response, accidental release, protective measures, and permits required for the transportation of dangerous goods by road, rail, or air. |
The Project facilities include areas within the jurisdictions
of the CRD and the District of Wells, for the Mine Site specifically. Both jurisdictions have passed bylaws that may pertain to Project
activities/operations and property ownership or business operations, including:
| ■ | CRD Invasive Plant Management Regulation Bylaw, No. 4949, 2015, regarding
the management of invasive plants; |
| ■ | CRD Untidy and Unsightly Premises Regulatory Bylaw, No. 4628, regarding
the management of untidy/unsightly properties; |
| ■ | District of Wells Noise Control Bylaw, No. 93, 2018 limiting hours of
noise during operations/construction; |
| ■ | District of Wells Traffic and Streets Bylaw, No. 68, addressing traffic,
and providing load and size restrictions. |
Other Wells bylaws are applicable to utility connections
and municipal service fees related to property development (water, sewer, garbage). These bylaws would be addressed through direct applications
with the District of Wells.
| |
Osisko Development Corp.
NI 43-101 Technical Report
Feasibility Study for the Cariboo Gold Project |
|
| 4.6. | Communication and Consultation with the Community |
ODV is committed to ongoing engagement and consultation
with Indigenous nations that may have an interest in the Project. ODV initiated discussions in 2016, and engagement and consultation activities
are ongoing and will continue through the life of the Project. Engagement activities have included meetings, presentations, site tours,
written correspondence, emails, and telephone conversations with leaders and representatives of Indigenous nations. ODV will continue
to consult Indigenous nations to better understand how the Project may affect past or current Indigenous practices, traditions, and customs,
and how measures may be incorporated into the Project to avoid, mitigate or otherwise address potential effects.
Provincial regulators stipulated the level of
engagement for each Indigenous nation in the Project area. Based on strength of claim, proximity to Project components, and nation-specific
requests to participate, the following three nations were confirmed as Participating Indigenous nations:
| ■ | Williams Lake First Nation (T’exelc). |
The Tŝilhqot’in National Government
and Nazko First Nation continue to be at the notification level of engagement and are sent Project updates and documents as relevant.
The EAC mandates the development of several management
plans to address the management of Project effects, including an Indigenous Partnership Plan. The Indigenous Partnership Plan is intended
to address the ongoing involvement of the Participating Indigenous nations in activities related to the Project and operations.
ODV is dedicated to open communication and
meaningful consultation with a range of stakeholders. This includes members of the general public, local, regional, provincial, and
federal government elected officials and staff, community organizations, recreational groups, authorization holders, landowners,
resource users, permanent and temporary residents of the District of Wells, and others.
| |
Osisko Development Corp.
NI 43-101 Technical Report
Feasibility Study for the Cariboo Gold Project |
|
Stakeholder engagement began in 2016 and will
continue through the life of the Project. Engagement initially focused on the District of Wells and introducing the Project to the residents
of Wells. Engagement with stakeholders to date has primarily been via public meetings, community workshops, one-on-one meetings, and small
group tours. Additionally, engagement has included meetings with the Cariboo Regional District, the Fraser-Fort George Regional District,
Quesnel, Williams Lake, and Prince George mayors and councils, and chambers of commerce.
The EAC requires the development of several management
plans, including a Community Involvement Plan, to assist with managing Project effects. This plan is intended to address the mechanisms
of ongoing community engagement related to the Project and operations.
| |
Osisko Development Corp.
NI 43-101 Technical Report
Feasibility Study for the Cariboo Gold Project |
|
| 5. | Accessibility, Climate, Local Resources, Infrastructure and Physiography |
Wells is a mining town with a rich history of
mineral exploration and production and is also a regional centre and tourist attraction for artists and outdoor enthusiasts. ODV maintains
and fosters relationships with the community through public and stakeholder meetings (see Section 4.7), and through recruiting employees
and sponsoring community events. The city of Quesnel, with a population of 23,000, is located 74 km to the east of Wells. It has an airport
and can provide the goods and services that ODV requires. Williams Lake and Prince George are the nearest other major transportation and
logistical hubs in the federal electoral district of Cariboo–Prince George, located 193 km and 115 km from Wells, respectively.
The following descriptions of the accessibility,
climate, local resources, infrastructure, and physiography for the Cariboo Gold Project and the Cariboo Gold District are taken and modified
from Georges et al. (2013) and Dzick (2015).
The Project is located in Wells, BC, approximately
74 km east of the City of Quesnel and 120 km southeast of the City of Prince George. The Project is accessible via paved Highway
26, which branches off Provincial Highway 97 at Quesnel (Figure 5-1). An extensive network of gravel roads provides access throughout
the area of the Project, including roads maintained by the BC Forest Service and old mine exploration roads and trails. These roads are
also used as part of an extensive winter snowmobile trail system. ODV’s Project offices and related facilities are in the town of
Wells.
| 5.2 | Infrastructure and Local Resources |
The Project is located
within the Cariboo Regional District of British Columbia, with the closest major city being Quesnel acting as the primary supply and service
centre for natural resource industries and has the closest regional hospital. Within 120 km are located the main regional cities
of Williams Lake and Prince George, which together have a population of over 100,000, including skilled mining and industrial workers.
Figure 5-1 shows an overview of the region and the Project.
The Project has access to sufficient power and
water to support a mining operation. Canadian National Railway provides rail access from Quesnel to the Port of Vancouver.
| |
Osisko Development Corp.
NI 43-101 Technical Report
Feasibility Study for the Cariboo Gold Project |
|
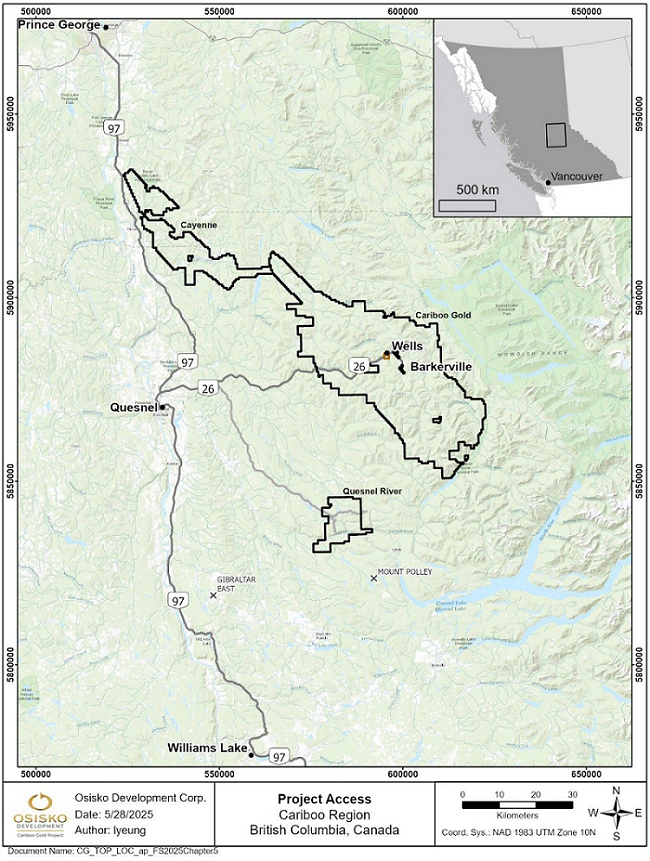
Figure 5-1: Access
to the Cariboo Gold Project
| |
Osisko Development Corp.
NI 43-101 Technical Report
Feasibility Study for the Cariboo Gold Project |
|
ODV has sufficient surface rights in the Project
area for mineral exploration and development operations. These rights are generally conveyed by ODV’s Crown-granted mineral claims
or by specific permits, such as those related to tailings and waste disposal areas, or water and timber use, and the mineral lease that
was applied for November 29, 2021 and was granted on July 13, 2023.
Currently, local resources include
single-phase 7.2 kilovolt (“kV”) power, potable water from the District of Wells public works (supplying roughly
985,000 litres (“L”) per day to the town), local sewage treatment, waste disposal sites, and high-speed internet
and telecommunication services, including a communication tower maintained by Telus and radio repeater stations maintained by ODV
for use by company personnel and site contractors. The Project infrastructure includes a planned upgrade to the potable water supply
and the construction of a Transmission Line, connecting to the Barlow Creek Substation and terminating at the Mine Site Complex in
Wells.
ODV completed an assessment of the Project areas
and have determined availability for waste disposal at Bonanza Ledge and a location for the processing plant at the Mine Site Complex.
Further information on this infrastructure can be found in Chapter 18 (Project Infrastructure).
ODV holds seven water licences: one for Willow
River, three at the QR Mill, one at the Ballarat temporary work camp, one unused licence on Island Mountain, and one for a well at the
geological compound and field offices at Lowhee Creek. The climate allows for year-round mining operations, and there is enough readily
available water to conduct diamond drilling.
The Cariboo Region experiences a dry continental
climate due to the coastal mountains influencing the westerly flow of winds and moisture coming from the Pacific Ocean. The climate at
the site is characterized by relatively cold winters and mild summers. The annual precipitation is moderate and there is comparatively
little variation over the year in monthly precipitation. The Project can operate 365 days a year. The mean 24-hour temperature at Wells-Barkerville
at an elevation of approximately 1,256 m (4,121 ft) is -9.2 °C in January and 12.3 °C in July.
The topography in the Project area is mountainous
(Figure 5-2), rising from a low point of approximately 1,190 metres above sea level (“masl”) in the incised river
valleys around Wells and Barkerville Historic Town and Park, to a peak of 2,060 masl at Roundtop Mountain, located 25 km south of
Wells. Mount Proserpine, 11 km south of the town, summits at 1,830 masl.
| |
Osisko Development Corp.
NI 43-101 Technical Report
Feasibility Study for the Cariboo Gold Project |
|
Mountain summits are generally rounded, reflecting
the passage of continental ice sheets during the Pleistocene Epoch. Pleistocene glacial till and clay are widespread. Moderately drained
and well-drained morainal and colluvial materials dominate at higher elevations. Valley bottoms are overlain by very poorly drained organic
deposits or moderately drained fluvial sands adjacent to Willow River, downstream of Jack of Clubs Lake, lower Lowhee Creek and Willow
River. Ice direction is generally to the northwest near Wells, and glacial till is the most widespread surficial deposit in the area.
The relatively small drainage basins of Jack of
Clubs Lake and Williams Creek converge at Wells and together compose the upper headwaters of Willow River. They represent a combined catchment
area of approximately 100 km2 at the southern extremity of the Willow River Basin and together embody roughly 3% of the
total area of the basin. Willow River flows into Fraser River east of Prince George.
The area is well forested, and the mountains are
typically covered with subalpine forests, except near their peaks. Vegetation is dominated by Engelmann Spruce (Picea engelmann), Lodgepole
Pine (Pinus contorta var. latifolia) and Subalpine Fir (Abies lasiocarpa), accompanied by alders and other deciduous varieties on lower
wetter slopes flanking river valleys. Prominent in the subalpine flora is the shrub Rhododendron albiflorum. Bedrock exposure is poor,
except along creeks, ridgelines, and logging roads.
| |
Osisko Development Corp.
NI 43-101 Technical Report
Feasibility Study for the Cariboo Gold Project |
|
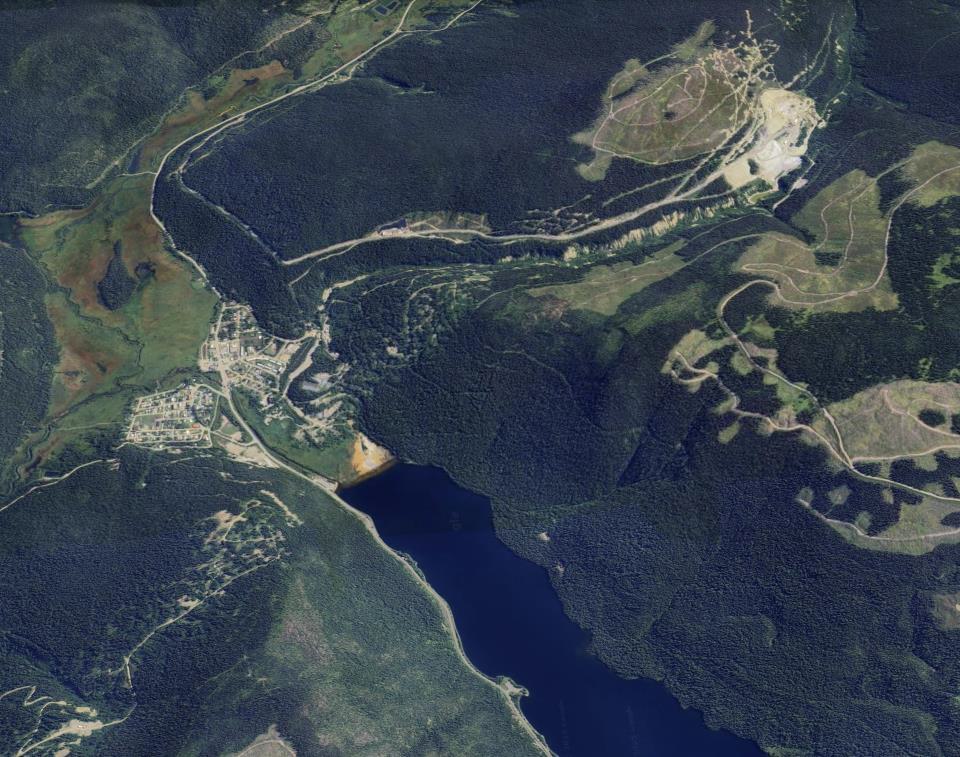
Figure 5-2:
Aerial view of the town of Wells looking east
Photograph looking east from above Island Mountain. Mount Murray (left) and Mt. Waverly
(right) are the highest peaks in the distance, with the Cariboo Mountains beyond. Island Mountain forms the foreground with Valley Mountain
to the left and Cow Mountain to the right, on the south side of the town of Wells (centre). Barkerville Mountain is located beyond Cow
Mountain to the right of the photo. The southeastern part of Wells is built on a fan of placer tailings that issued from Lowhee Creek
(right) into Jack of Clubs Lake (bottom right). (Photo from Google Earth, 2025).
| |
Osisko Development Corp.
NI 43-101 Technical Report
Feasibility Study for the Cariboo Gold Project |
|
The Cariboo Gold Project is situated within the
Cariboo Gold Belt, a producer of gold that has had a history of mining dating from the Cariboo gold rush in the 1860’s. The Project
area contains several historical mines, including the Cariboo Gold Quartz Mine, Aurum Mine/Island Mountain Mine, and Mosquito Creek Mine.
The extensive history of the district’s
placer gold deposits will not be discussed as it is not relevant to this Report other than to comment that the gold rush was the largest
in Canadian history, drew a large number of people to the area, which eventually led to the discovery of hard rock gold deposits in the
area.
Historical mineral resource estimates from this
section are superseded by those reported in Chapter 14 of this Report.
| 6.1.1. | Cariboo Gold Quartz Mine |
Fred Wells purchased the Rainbow claim group from
A.W. Sanders and formed Cariboo Gold Quartz Mining Company Ltd. (“Cariboo Gold Quartz Mining”) in 1927. The Cariboo Gold Quartz
Mine operated from 1927 to 1959 at Cow Mountain.
In October 1942, gold mining was classified
as a non-war industry by the federal government and received no priority for labour or supplies. As a result, gold mines in British Columbia
were unable to hire replacement labour for the duration of the war. The mining operation never recovered from the loss of revenue caused
by a 50% reduction in production and the depletion of reserves in the absence of exploration drilling and only minor development during
this period.
Following the purchase of the Island Mountain
Mine in 1954, Cariboo Gold Quartz Mining focused on developing higher grade pyrite-type replacement mineralization.
The Cariboo Gold Quartz Mine closed on August 31,
1959.
In 1959, in its 33rd Annual Report, Cariboo Gold
Quartz Mining reported historical reserves scattered in 51 remnants through 13 levels and across a distance of 10,500 feet (“ft”)
(3,200 m).
These “reserves” are historical
in nature and should not be relied upon. It is unlikely that they comply with current NI 43-101 requirements or follow Canadian Institute
of Mining (“CIM”) Definition Standards, and their relevance and reliability have not been verified. They are included in this
section for illustrative purposes only and should not be disclosed out of context.
| |
Osisko Development Corp.
NI 43-101 Technical Report
Feasibility Study for the Cariboo Gold Project |
|
The Cariboo Gold Quartz Mill continued processing
mineralized material from the Aurum Mine on Island Mountain until March 1967. During the period between 1933 and 1967, a total of
1,951,944 metric tonnes (“t”) of mineralized material was mined, yielding 863,307 ounces (“oz”) of gold and
91,652 oz of silver (MINFILE number 093H 019). The average recovery during that period was 95.3%.
| 6.1.2. | Island Mountain Mine (Aurum Mine) |
In 1925, C.J. Seymour Baker acquired the original
five Crown-granted mineral claims (later known as the Aurum Group), which was worked until 1932.
In 1932, Newmont Mining Corporation (“Newmont”)
acquired the Aurum Group and eight adjacent claims to form Island Mountain Mines Company Ltd.
Milling commenced in 1934 at a rate of 50 short
tons (“st”) per day and reached a peak of 149 st/d in 1941. Quartz-type mineralization in diagonal vein structures and
pyrite-type mineralization in the Aurum limestone unit were both extracted. The mine was developed over a strike length of 4,500 ft
(1,371.6 m). After 1945, no further exploration or development was carried out west of the Aurum Fault, and in 1952 the mine suspended
active exploration and development.
Under Newmont’s ownership, production from
the mine was 770,093 st (699,536 t), from which 333,705 oz of gold and 48,130 oz of silver were recovered (MINFILE
number 093H 006). The mill also recovered 531 lb of zinc and 134 lb of lead.
Cariboo Gold Quartz Mining purchased the mine
and equipment from Newmont in 1954 for a sum of $305,000. Underground workings extending northwest from the Island Mountain Mine into
the Mosquito Group are formally known as the Aurum Mine. The Cariboo Gold Quartz Mine and Island Mountain Mine do not connect below Jack
of Clubs Lake.
| 6.1.3. | Mosquito Creek Mine |
Andrew H. Jukes, of Calgary, acquired the Mosquito
Creek claim group and formed Mosquito Creek Gold Mining Company Ltd. (“Mosquito Creek Gold”) in 1971 to explore the ground
above the Aurum Mine. Surface exploration drilling and underground development from 1971 to 1975 were financed by a joint venture agreement
with the Home Oil Company Ltd. of Calgary. They conducted an extensive surface and underground exploration and development program on
the property. In 1975, Mosquito Creek Gold purchased all of Home Oil Company’s interests in the property. Subsequently, Peregrine
Petroleum Ltd. (“Peregrine”) entered into a joint venture agreement with Mosquito Creek
Gold, whereby it ultimately earned a 50% working interest in the property.
| |
Osisko Development Corp.
NI 43-101 Technical Report
Feasibility Study for the Cariboo Gold Project |
|
A total of 27,384 oz of gold were recovered
from 86,248 t of mostly pyrite-type mineralization milled during the main production period (1980 to 1983). The operation failed
due to low initial reserves and a low discovery rate of new resources. The latter was the result of insufficient development at depth
and northwest of the Mosquito Fault.
In 1984, Hudson Bay Mining and Smelting Co. Ltd.
(“Hudson Bay”) optioned the property but dropped it after earning a 10% interest. Hudson Bay sold its interest back to Mosquito
Creek Gold, and Peregrine sold its 50% interest to Mosquito Creek Gold.
In 1986, the property was optioned by Hecla Mining
Company of Canada Ltd. who conducted underground exploration work and then dropped their interest in the company.
Mining operations were intermittent until 1987
when Mosquito Creek Gold became Mosquito Creek Consolidated Gold Mines Ltd. After the gold prices dropped, and new ore became hard to
find, the mine closed in 1987. During the period between 1980 and 1987, a total of 92,826 t of mineralized material were mined from which
35,054 oz of gold and 9,750 oz of silver were recovered (MINFILE number 093H 010).
In 1988, Lyon Lake Mines Ltd. optioned the property
and earned a 50% interest after performing underground exploration.
| 6.2. | Surface Work Programs |
| 6.2.1. | Cariboo Gold Quartz Mining Company Ltd. (1968) |
In 1968, Dolmage Campbell and Associates Ltd.
carried out 5 km of bulldozer trenching on behalf of Cariboo Gold Quartz Mining.
A total of 17 trenches, approximately 2 m
to 2.5 m deep, were excavated across the Baker-Rainbow contact over a strike length of 1.6 km on Island Mountain. Pyritic mineralization,
6 m long by 1 m wide, was discovered in Trench J (Campbell 1969).
| 6.2.2. | Wharf Resources Ltd. (1980–1981) |
In 1972, Cariboo Gold Quartz Mining amalgamated
with Coseka Resources Ltd. to form a company with the name of the latter. In April 1973, Wharf Resources Ltd. (formerly Plateau Metals
and Industries) amalgamated with French Exploration Ltd. (a wholly owned subsidiary of Coseka Resources).
Wharf Resources carried out surface drilling programs
in 1980 and 1981 to search for near-surface mineralization on the Cariboo and Island Mountain claim groups. A total of 7,010 m of
percussion drilling and 1,219 m of diamond drilling were completed in 1980 and 1981 (Bolin, 1984).
| |
Osisko Development Corp.
NI 43-101 Technical Report
Feasibility Study for the Cariboo Gold Project |
|
| 6.2.3. | Blackberry Gold Resources Inc. (1988) |
In 1987, Blackberry Gold Resources Inc. completed
several work programs on the ARCH 1-4 claim group located on Cow Mountain and Richfield Mountain. The objective of the work was to discover
gold mineralization associated with the system of north-striking fault structures. Very-low-frequency electromagnetic (“VLF-EM”)
geophysical surveys were used to define conductors inferred to be the strike extension of major faults on the Cariboo Group of Crown-granted
mineral claims. Four strong conductive trends were tested along six fences of percussion drill holes for a total of 2,424 m of drilled
in 79 holes. This was followed by 2,465 m of diamond drilling in 19 holes.
| 6.2.4. | Pan Orvana Resources Inc. (1989–1991) |
On July 12, 1985, Mosquito Creek Gold purchased
the Cariboo and Island Mountain claim groups from Wharf Resources Ltd. Pan Orvana Resources Inc. (“Pan Orvana”) signed the
Cariboo Gold Option Agreement on May 20, 1988, obtaining the right to earn a 50% interest in the Cariboo Group, but terminated the
agreement in 1991 without exercising the option.
Pan Orvana excavated 20 surface trenches, drilled
four holes, and conducted ground geophysical surveys, geochemical sampling programs, and geological mapping.
| 6.2.5. | Gold City Mining Corp. (1994–1995) |
In 1994 and 1995, Gold City Mining Corp. (“Gold
City Mining”) assembled a large land position consisting of 13,000 ha of mineral titles between Mount Tom and the Cariboo Hudson
Mine to form the Welbar Gold Project.
Doing so involved seven option agreements, including
one that covered the Mosquito Creek, Island Mountain, and Cariboo claim groups. The latter was subject to the Cariboo Option Agreement
between Mosquito Creek Consolidated Gold Mines Ltd. and International Wayside Gold Mines Ltd.
lntera Information Technologies Corp. flew a synthetic
aperture radar survey in July 1995. DIGHEM I Power completed a regional airborne radiometric-Mag-EM survey of 1,280 line-km,
as well as trenching and diamond drilling on some of their properties, including one drill hole on the Mosquito Creek Group.
From October 1 to November 30, 1995,
Gold City Mining conducted a 13-hole (1,865 m) diamond drilling program on the Cariboo-Hudson Property (Chapman, 1996a).
Gold City Mining optioned the Cariboo-Hudson Property
from Cathedral Gold Corp. in 1994.
| |
Osisko Development Corp.
NI 43-101 Technical Report
Feasibility Study for the Cariboo Gold Project |
|
In November 1995, Gold City Mining sunk four
diamond drill holes (560 m) on the Williams Creek Property (Chapman, 1996b). That same month, Gold City Mining drilled two holes
(390 m) on the Island Mountain Property (Chapman, 1997).
| 6.3. | International Wayside Gold Mines Ltd. (1999–2014) |
Table 6-1
summarizes the work conducted by International Wayside Gold Mines Ltd. (“IWGM”) on the Island Mountain Project between 1999
and 2014, as documented in Pickett (2000; 2001; 2002; 2003), Pautler (2003; 2004), Johnson (2005), Moore (2006), Yin and Daignault (2007)
and Yin (2011), as well as Management Discussion and Analysis reports (“MD&A”) from Island Mountain Gold Mines Ltd. (“IGM”), IWGM,
and Barkerville Gold Mines Ltd. (“BGM”).
Table 6-1: Summary
of diamond drilling on the Island Mountain Project from 1999 to 2014
| Year |
Zone/Area |
Surface Diamond Drilling |
| (drill hole) |
(m) |
| 1999 |
Footwall of the West Fault |
10 |
902.2 |
| 2000 |
Northwest of the Mosquito Creek Mine |
10 |
1,750.5 |
| 2001 |
Gold-in-soil Anomaly |
2 |
367.3 |
| Favourable Stratigraphy |
1 |
183.8 |
| Kutney Zone |
4 |
672.7 |
| 2002 |
Gold-in-soil Anomaly and IP Anomaly |
2 |
191.7 |
| Gold-in-soil Anomaly |
2 |
210.3 |
| 2003 |
2003 Trenching Program |
13 |
1,397.5 |
| 2004 |
Snapjack Zone |
3 |
303.9 |
| Teapot Vein |
3 |
555.0 |
| 2005 |
Snapjack Zone |
9 |
906.1 |
| Southern Soil Anomaly |
4 |
780.3 |
| Channel Sample Anomaly |
2 |
202.1 |
| 2006–2009 |
No Drilling |
0 |
0.0 |
| 2010 |
Reconnaissance Exploration |
1 |
178.6 |
| 2011–2014 |
No Drilling |
0 |
0.0 |
| Total |
66 |
8,602.0 |
| |
Osisko Development Corp.
NI 43-101 Technical Report
Feasibility Study for the Cariboo Gold Project |
|
| 6.4. | International Wayside Gold Mines Ltd. (1995–2009) |
The following descriptions cover the history of
exploration work conducted by IWGM on the Cariboo Gold Quartz Project between 1995 and 2009 and are taken from Lord and Reid (1997), Reid
(1999), Hall (1999), Lord and Hall (2001), Walton (2002a; 2002b; 2003a; 2003b), Gates et al. (2005), Duba (2005), Daignault and Moore
(2006), Sandefur and Stone (2006), Yin and Daignault, (2007; 2008), Brown (2009), Fier et al. (2009), and Yin (2010a; 2010b). The text
retains the references therein.
| 6.4.1. | 1995–1999 Work Programs |
During that 1995 to 1999 period, IWGM worked
the Project area continuously starting May 1, 1995. Most of the work was carried out on the main mine trend, either from the surface
or underground from the 1200 level adit.
In 1998 and 1999,
a secondary target, the BC Vein, was explored over a strike length of 384 m by 31 surface drill holes totalling 2,245.2 m.
The goal of this program was to find high-grade shoots of the kind located by Cariboo GoId Quartz Mining in the 1940s. Table 6-2
summarizes IWGM’s drilling on the Project between 1995 and 1999.
In the summer of 1997, IWGM carried out a
geochemical and prospecting program to find new mineralized showings and generate targets for further exploration. The geochemical surveys
yielded 1,079 soil samples, 59 stream sediment samples, and 121 rock samples.
Table 6-2: Summary
of diamond drilling on the Cariboo Gold Project from 1995 to 1999
| Year |
Zone |
Surface
Diamond Drilling |
Underground
Diamond Drilling |
Underground
Percussion Drilling |
| (drill
hole) |
(m) |
(drill
hole) |
(m) |
(drill
hole) |
(m) |
| 1995 |
Rainbow |
17 |
844.0 |
12 |
496.5 |
6 |
96.9 |
| 1996 |
Rainbow |
8 |
424.0 |
5 |
157.6 |
38 |
867.8 |
| Pinkerton |
5 |
385.3 |
- |
- |
25 |
998.5 |
| 1997 |
Rainbow |
20 |
1,617.6 |
- |
- |
- |
- |
| Pinkerton |
17 |
1,359.4 |
- |
- |
9 |
481.5 |
| Sanders |
2 |
170.1 |
- |
- |
33 |
2,023.6 |
| 1998 |
Pinkerton |
- |
- |
- |
- |
5 |
307.2 |
| Sanders |
2 |
157.9 |
- |
- |
19 |
964.4 |
| Butts |
2 |
146.0 |
- |
- |
- |
- |
| BC Vein |
13 |
846.7 |
- |
- |
- |
- |
| 1999 |
BC Vein |
18 |
1,398.4 |
- |
- |
- |
- |
| Total |
104 |
7,349.4 |
17 |
654.1 |
135 |
5,739.9 |
| |
Osisko Development Corp.
NI 43-101 Technical Report
Feasibility Study for the Cariboo Gold Project |
|
| 6.4.2. | 2000–2009 Work Programs |
IWGM carried out
extensive work from 2000 to 2009. Table 6-3 summarizes the drilling by year and area of interest.
Table 6-3: Summary
of diamond drilling on the Cariboo Gold Project from 2000 to 2009
| Year |
Zone/Area |
Surface
Diamond Drilling |
Underground
Diamond Drilling |
| (drill
hole) |
(m) |
(drill
hole) |
(m) |
| 2000 |
BC Vein |
48 |
6,227.4 |
- |
- |
| Bonanza Ledge |
| 2001 |
BC Vein |
22 |
5,145.9 |
- |
- |
| Bonanza Ledge |
| Cow Mountain |
3 |
653.8 |
- |
- |
| 2002 |
BC Vein |
18 |
3,394.0 |
- |
- |
| Bonanza Ledge |
| Myrtle Property |
5 |
1,206.1 |
- |
- |
| 2003 |
Bonanza Ledge |
26 |
3,037.3 |
3 |
203.3 |
| Myrtle Property |
4 |
781.5 |
- |
- |
| 2004 |
Bonanza Ledge |
60 |
7,788.6 |
73 |
5,974.1 |
| Bonanza Ledge – engineering |
17 |
1,899.5 |
- |
- |
| Myrtle Property |
5 |
861.4 |
- |
- |
| Goldfinch Target |
6 |
826.6 |
- |
- |
| Groundwater monitoring well holes |
2 |
120.1 |
- |
- |
| 2005 |
Lowhee Creek |
23 |
4,422.4 |
- |
- |
| Black Bull |
3 |
474.9 |
- |
- |
| 2006 |
Mucho Oro |
31 |
4,682.1 |
- |
- |
| 2007 |
Cow Mountain |
15 |
1,463.6 |
- |
- |
| 2008 |
Goldfinch and Bonanza Ledge |
10 |
1,762.1 |
- |
- |
| 2009 |
Cow Mountain |
11 |
1,900.2 |
- |
- |
| Lowhee Creek |
2 |
329.8 |
- |
- |
| Bonanza Ledge |
18 |
1,781.5 |
- |
- |
| Groundwater monitoring well holes |
7 |
362.7 |
- |
- |
| Total |
336 |
49,121.5 |
76 |
6,177.4 |
| |
Osisko Development Corp.
NI 43-101 Technical Report
Feasibility Study for the Cariboo Gold Project |
|
| 6.4.2.1. | 2000 Work Program |
On March 23, 2000, IWGM announced the
discovery of a new mineralized zone while drilling the BC Vein. The type of mineralization encountered had not previously been identified
in the region. The new zone was named the Bonanza Ledge Zone.
Subsequent geochemical, geophysical, and diamond
drilling programs explored the Bonanza Ledge and BC Vein zones to look for new Bonanza Ledge-type targets away from the initial discovery.
The work program consisted of 48 drill holes for 6,227.4 m and focused on area adjacent to the BC Vein. Surface exploration,
completed mainly between August and October 2000, included geological mapping, prospecting, 44.2 line-km of soil sampling (2,400
samples on cut grid lines, spacing of 61 m by 15.2 m), and 32.9 line-km of ground geophysical surveys, including self-potential
(“SP”), Induced Polarization (“IP”), VLF-EM, and ground Mag surveys. To provide an accurate topographic base
map for IWGM’s claims, an aerial photographic survey was flown in August and September 2000, covering its full extent.
Historical mineral resource estimates from this period are superseded by those reported herein. They are described in detail in a previous
technical report (Beausoleil and Pelletier, 2018) available on SEDAR+.
In 2000, IWGM hired an independent consultant,
R.G. Simpson (P.Geo.), to review the Cow Mountain data and the 1999 Resource (Dykes, 1999). Simpson estimated an Inferred resource
(see IWGM’s 2000 AIF) for Cow Mountain and following the recommendations from Simpson, another MRE was completed by G.H. Giroux
in 2000 (Giroux, 2000).
| 6.4.2.2. | 2001 Work Program |
The program in 2001 included diamond drilling,
20 line-km IP survey along 22 lines on Cow Mountain, 24.3 line-km of SP surveying, and 7.2 line-km of brushing out of lines for the IP
survey on 11 lines.
| 6.4.2.3. | 2002 Work Program |
Diamond drilling was carried out in 2002, along
with a mineral resource estimate by Giroux Consulting (the “2002 Estimate”; Giroux, 2002).
| |
Osisko Development Corp.
NI 43-101 Technical Report
Feasibility Study for the Cariboo Gold Project |
|
| 6.4.2.4. | 2003 Work Program |
The 2003 work program involved 70 m of trenching
in six trenches. The work concentrated on the Bonanza Ledge Zone, the adjacent Myrtle Group, and the Sanders Zone. The program also included
surface and underground drilling. Historical mineral resource estimates from this period are superseded by those reported herein. They
are described in detail in a previous technical report (Beausoleil and Pelletier, 2018) available on SEDAR+.
In 2003, an independent preliminary economic assessment
(“PEA”) completed by DJP Consultants Ltd. (Pow, 2003) concluded that there were sufficient reserves to supply an on-site
processing plant using open pit mining methods.
This “PEA” is historical in
nature and should not be relied upon. In 2003, it was compliant with NI 43101 requirements. Since 2003, more drilling has been added,
and more geological information has become available. Additionally, the assumptions for the cut-off grade calculations, as well as the
estimated capital and operating costs, are likely to have changed since 2003. Consequently, the DJP Consultants Ltd. PEA cannot be considered
as current. It is included in this section for illustrative purposes only and should not be disclosed out of context.
| 6.4.2.5. | 2004 Work Program |
The work program in 2004 focused mainly on the
Bonanza Ledge Zone. The Bonanza Ledge Zone was drilled from the surface and underground.
Underground development at Bonanza Ledge started
in late 2003 and continued into 2004.
Exploration activities also included underground
and surface drilling, geological mapping, trenching, a soil grid extension, and channel sampling along road exposures.
| 6.4.2.6. | 2005 Work Program |
In March 2005, 10,000 dry tonnes of concentrate
from Bonanza Ledge were shipped via CN Rail to Noranda Inc.’s smelter in Rouyn-Noranda, Québec, for refining into gold bullion.
IWGM received net proceeds before royalties of $1,505,720 for 5,200 oz recovered post-milling from the Bonanza Ledge bulk sample
collected in 2004.
The exploration program included surface drilling,
surface mapping, and sampling.
A gravity geophysical survey was planned to cover
the Bonanza Ledge and Lowhee Creek areas. The survey was initiated in November 2005 but only covered the grid on the Bonanza Ledge
deposit.
| |
Osisko Development Corp.
NI 43-101 Technical Report
Feasibility Study for the Cariboo Gold Project |
|
| 6.4.2.7. | 2006 Work Program |
The work program in 2006 consisted of surface drilling, prospecting,
surface mapping, and sampling.
IWGM retained Chlumsky, Armbrust and Meyer LLC
(“CAM”) of Lakewood, Colorado to prepare a public PEA (the “2006 PEA”). Prior to the 2006 PEA, CAM and
Minefill Services Inc. had completed an internal “scoping study” for IWGM on the Bonanza Ledge Zone. CAM advanced this internal
study to comply with NI 43-101 standards. The study used the 2002 Estimate of Giroux (2002).
IWGM intended to process the material mined from
Bonanza Ledge at a nearby facility, in particular, the Quesnel River Mill (“QR Mill”) facility belonging to Cross Lake Minerals.
Testing showed good amenability to cyanidation with recoveries ranging from 93% to 97%. These recoveries were attained rapidly, with 98%
of the recovery occurring in the first six hours of the 72-hour leach.
| 6.4.2.8. | 2007–2008 Work Programs |
The work programs in 2007 and 2008 consisted of
surface drilling. In 2007, 1,463.54 m were drilled on Cow Mountain in 15 holes to test the Rainbow and Sanders zones. In 2008, 1,762.07 m
were drilled in 10 holes to further define the Bonanza Ledge Zone and test the adjacent Goldfinch Target.
| 6.4.2.9. | 2009 Work Program |
Surface drilling was conducted during the 2009
work program.
In 2009, an NI 43-101 technical report was prepared
(Brown, 2009). It addressed the geology and exploration history for gold on properties in the IWGM land package comprising the Project.
The scope of the technical report included an update and compilation of recent exploration activities completed by IWGM on the land tenure
of the Project from 2006 to 2008. This Report built on previous technical reports that outlined gold mineral resources contained in the
Project area, with mineral resource calculations specific to the Cow Mountain area (Giroux, 2006) and the Bonanza Ledge Zone area (Sandefur
and Stone, 2006).
A pre-feasibility study (“PFS”) was
prepared for the Bonanza Ledge Project by EBA Engineering Consultants Ltd. (“EBA”) of Vancouver, British Columbia, and several
independent professionals and consultants. The study used the mineral resource and mineral reserve evaluation (the “2009 Estimate”)
of Mintec Inc. of Tucson, Arizona, as the basis of its economic analysis. The PFS was an update of the previously disclosed mineral resource
(Sandefur and Stone, 2006). An NI 43-101 technical report was prepared by EBA.
| |
Osisko Development Corp.
NI 43-101 Technical Report
Feasibility Study for the Cariboo Gold Project |
|
| 6.5. | Barkerville Gold Mines Ltd. (2010-2014) |
The following description of work conducted by
BGM on the Project between 2010 and 2014 is taken from Yin (2011; 2013), Georges (2012), Georges et al. (2013), Dzick (2015), Layman (2015),
and BGM’s MD&A reports. The text retains the references therein.
Table 6-4
outlines the drilling on the Project from 2010 to 2014.
Table 6-4: Summary
of diamond drilling on the Cariboo Gold Project from 2010 to 2014
| Year |
Zone/Area |
Surface
Diamond Drilling |
| (drill
hole) |
(m) |
| 2010 |
Bonanza Ledge |
17 |
2,918.2 |
| Cow Mountain |
45 |
5,792.3 |
| Island Mountain |
1 |
178.6 |
| 2011 |
Pit Vein Zone |
10 |
1,045.2 |
| BC Vein |
30 |
9,284.6 |
| Bonanza Ledge (ARD samples) |
5 |
943.1 |
| Cow Mountain |
163 |
43,410.6 |
| Stouts Gulch and Myrtle Property |
2 |
212.2 |
| Groundwater monitoring well holes |
21 |
3,019.9 |
| 2012 |
Cow Mountain |
14 |
2,753.2 |
| 2013 |
No drilling |
0 |
0 |
| 2014 |
Cow Mountain |
10 |
4,142.2 |
| Total |
318 |
73,700.1 |
| 6.5.1. | 2010–2011 Work Programs |
Surface trenching and sampling work were completed
in 2010. A total of 175 samples were collected from 18 channels. The channels were spaced approximately 6 m apart along a 125 m
long trench.
The work program in 2011 included surface drilling
and trenching. A total of 66 channel samples were collected from the trenches.
| |
Osisko Development Corp.
NI 43-101 Technical Report
Feasibility Study for the Cariboo Gold Project |
|
All historical estimates are superseded by the
current MRE reported in Chapter 14 of this Report.
On June 28, 2012, BGM announced a public
MRE for the Gold Quartz open pit model on Cow Mountain (the “Gold Quartz Estimate”) and the geological potential of the 6.4 km
Cow–Island–Barkerville Mountain Corridor (BGM news release of June 28, 2012). Geoex Ltd. (“Geoex”) prepared
the independent estimate. The announcement of the estimate led to a request for a supporting technical report within 45 days from the
BC Securities Commission (“BCSC”) and initiated a request for further information from the Geoex QP (Peter T. George). The
BCSC was provided with a draft technical report. Upon review of the draft technical report, the BCSC expressed concerns about certain
methods, parameters, and assumptions used to estimate the mineral resources and potential exploration targets at Cow Mountain, as well
as the estimates themselves. The final version of the NI 43-101 technical report was filed on SEDAR+ on August 13, 2012 (Georges,
2012).
On August 14, 2012, the BCSC issued a cease
trade order (“CTO”) against BGM, stating that the report was not in the required form under NI 43-101 (BGM press release of
August 15, 2012). BGM was advised that the CTO would remain in place until BGM filed an NI 43-101 report acceptable to the BCSC,
addressing all technical disclosure concerns.
On October 19, 2012, BGM retained Snowden
Mining Industry Consultants Pty (“Snowden”) to review the report in question and help satisfy the CTO conditions. On November 5,
2012, BGM provided an additional update on its technical review. As requested by Snowden, 14 twin holes had been drilled on Cow Mountain
between September 22, 2012 and October 14, 2012 (drill holes CM12-01A to CM12-09C), for a total of 2,759.4 m. The total
meterage included five drill holes that had to be abandoned after hitting shafts and/or underground workings before reaching their target.
Channel samples were also collected from the 2012 trenches on Cow Mountain. This data was used to verify the results of the report in
question.
During its review of the NI 43-101 report,
Snowden examined historical samples not included in the original Gold Quartz Estimate. Snowden recommended that these samples be included
in the ongoing MRE for Cow Mountain after being validated. The Gold Quartz Estimate was based on a database containing 619 drill holes.
About 2,142 holes had been drilled on the property of which more than 1,464 had been verified by Mintec.
In July 2012, BGM received an amendment to
Mines Act Permit M-198 for the QR Mill to allow the custom milling of up to 300,000 t of mineralized material from the Bonanza
Ledge Mine, as well as the disposal of associated mine tailings in the QR Main Zone Pit. In December 2012, BGM received an amended
Environmental Management Act Permit, PE-17876, to allow effluent discharge associated with active mining at Bonanza Ledge.
| |
Osisko Development Corp.
NI 43-101 Technical Report
Feasibility Study for the Cariboo Gold Project |
|
In June 2013, BGM filed an NI 43-101 technical
report to present and support the updated MRE for Cow Mountain (the “2013 Estimate”; Georges et al., 2013). As part of
the mandate, Snowden assisted Geoex and BGM in the review and audit of the data validation and verification aspects of the Cow Mountain
data, the determination of the most appropriate estimation method for Cow Mountain, and the preparation of the independent MRE for the
Cow Mountain area.
The 2013 estimate was reported at a range
of cut-off grades for the Indicated and Inferred categories (Georges et al., 2013). No Measured mineral resources were estimated.
On July 15, 2013, the BCSC Rescinded the
CTO issued on August 14, 2012. On October 9, 2013, common shares of BGM resumed trading on the Toronto Stock Exchange (“TSX:V”).
To satisfy some of the recommendations of the
last technical report (Georges et al., 2013), BGM reviewed core sampling records for all drill holes in the Cow Mountain mineral resource
model. A core sampling and assaying program was conducted to provide assays for any previously unsampled drill core intervals. The infill
sampling program (55,698.6 m) was conducted on 250 holes drilled in 2007, 2009, 2010, and 2011 on Cow Mountain (BGM press release
of January 20, 2014). The program was completed in January 2014. Available reject samples for all the Cow Mountain drill holes
were shipped to Acme Labs for fire assay–metallic screen analysis. In total, 25,280 samples were sent to Acme Labs.
BGM conducted surface drilling in 2014.
In March 2014, BGM announced the commencement
of operations at the Bonanza Ledge Mine under Mines Act permit M-238. The first production blast was on March 12, 2014. Over
the course of the year, BGM milled 53,090 t of mineralized material at an average head grade of 6.23 g/t Au and a recovery
rate of 90%. The average net operating cost was $1,669 per ounce.
| 6.6. | Barkerville Gold Mines Ltd. (2015–2022) |
All exploration and drilling results from 2015–2022
are summarized in Chapters 9 and 10. Production and historical mineral resource estimates are summarized below.
For the purposes of this Report, Barkerville Gold
Mines Ltd., as it operated from 2015–2021, will be referred to as Osisko Development Corp. (“ODV”). Current ODV management
has been in place since 2015 and on November 21, 2019, Osisko Gold Royalties acquired the Cariboo Gold Project through the acquisition
of BGM. The Project was part of the asset that Osisko Gold Royalties contributed that created the Osisko Development Corp. on November 25,
2020.
| |
Osisko Development Corp.
NI 43-101 Technical Report
Feasibility Study for the Cariboo Gold Project |
|
During 2015, ODV milled 11,275 t of Bonanza Ledge
mineralized material at an average head grade of 10.14 g/t Au, a recovery rate of 94%, and an average net operating cost of
$877/oz. Based on the results as of February 28, 2015, management decided to cease production and place Bonanza Ledge under care
and maintenance.
In 2016, ODV mandated
InnovExplo (Brousseau et al., 2017) to complete an NI 43-101 technical report and the 2017 MRE for the Barkerville Mountain
deposit. GEOVIA GEMS™ was used for modelling purposes and the estimation approach, which consisted of 3D block modelling
and the ordinary kriging interpolation method. The close-out date of the database was July 18, 2016, and the effective date of the
2017 MRE was March 21, 2017 (Brousseau et al., 2017).
In 2017, ODV mandated
InnovExplo to update the 2017 MRE and perform a review and validation of the maiden MRE for the Cow Mountain and Island Mountain
deposits combined. The close-out date of the database was December 31, 2017, and the effective date for the 2018 MRE was May 2,
2018 (Beausoleil and Pelletier, 2018). Test Mining at Bonanza Ledge was completed in December 2018. The objective was to gain
technical information and train personnel to aid in future studies, permitting, and future mining. A total of 1,900 m of development
took place at the Bonanza Ledge Mine in 2018. Approximately 120,000 t of mineralized material was extracted and processed at an average
grade of 5.94 g/t Au. Bonanza Ledge Mine was placed on care and maintenance in December 2018.
In 2019, ODV mandated
InnovExplo to review, validate, and update the 2018 MRE (Beausoleil and Pelletier, 2019). Based on the results of the MRE completed
in 2019 (2019 MRE), ODV mandated BBA to prepare a technical report and PEA for the Project (Morgan et al., 2019). A number of specialized
consultants assisted BBA with the PEA: Allnorth Consultants Ltd., Golder Associates Ltd., InnovExplo, Mining Plus Canada Consulting
Ltd., SRK, and WSP Canada Inc. (“WSP”) The effective date of the PEA was August 18, 2019. The purpose was to complete
a review and compilation of the mineral resources, mining designs, processing options, and preliminary economics of the Project, and to
support the results disclosed in ODV’s press release entitled “Barkerville Gold Mines Delivers Positive PEA for Cariboo Gold
Project” dated August 19, 2019. The PEA provided a base case assessment for developing the Project as a 4,000 tonnes
per day (“tpd”) underground mine, with a concentrator located at the Mine Site at Wells and further processing at the QR Mill.
The mine life was estimated to be 11 years. These results are described in detail in the PEA (Morgan et al., 2019) available
on SEDAR+.
| |
Osisko Development Corp.
NI 43-101 Technical Report
Feasibility Study for the Cariboo Gold Project |
|
In
2020, ODV mandated InnovExplo (Beausoleil and Pelletier, 2020) to complete an NI 43-101 technical report to present an updated
MRE and geological model ("2020 MRE") for the Project. The close-out date of the database was January 29, 2020,
and the effective date of the 2020 MRE was April 28, 2020 (Beausoleil and Pelletier, 2020). In 2022, a PEA was
completed for the Project; ODV mandated BBA to prepare a technical report
and updated PEA for the Project (Hardie et al., 2022). This report was prepared based on contributions from several independent
consulting firms, including InnovExplo, SRK, WSP, BBA, Falkirk, and Klohn Crippen Berger Ltd. It encompassed updated resources for
the deposits of Cow Mountain (Cow Zone and Valley Zone), Island Mountain (Shaft Zone and Mosquito Zone), and Barkerville
Mountain (Lowhee Zone). The updates were prepared by Leonardo de Souza, MAusIMM (CP), of Talisker Exploration Services Inc.
(“Talisker”), and reviewed and validated by Carl Pelletier, P.Geo., and Vincent Nadeau-Benoit, P.Geo., both of
InnovExplo, using all available information. The effective date of the 2022 MRE update was May 17, 2022 (Hardie et al.,
2022).
In
2023, a FS was completed for the Project; ODV mandated BBA to prepare a technical
report and FS for the Cariboo Gold Project (Hardie et al., 2023). This report was prepared based on contributions from several independent
consulting firms, including BBA, Falkirk, Golder Associates Ltd. (amalgamated with WSP Canada Inc. on January 1, 2023 to form WSP
Canada Inc.) (“Golder”), InnovExplo, JDS, KCC Geoconsulting Inc. (“KCC”), Klohn Crippen Berger Ltd.(“KCB”),
SRK, and WSP USA Inc.
It encompassed updated
resources for the deposits of Cow Mountain (Cow Zone and Valley Zone), Island Mountain (Shaft Zone and Mosquito Zone), and Barkerville
Mountain (Lowhee Zone). The updates were prepared by Leonardo de Souza, MAusIMM (CP), of Talisker, and reviewed and validated by Carl
Pelletier, P.Geo., and Vincent Nadeau-Benoit, P.Geo., both of InnovExplo, using all available information. The effective date of
the 2022 MRE update was May 17, 2022 (Hardie et al., 2022).
The Bonanza Ledge Mine resumed development in
mid–2019 and in 2020, 3,268 t of mineralized material was extracted at an average grade of 2.58 g/t Au. In 2020, the underground
focus was the development of drifts to access the BC Vein. In 2021, 98,786 t of mineralized material was extracted at an average grade
of 4.48 g/t Au (as of December 31, 2021). In 2022, 170,652 t of mineralized material was extracted at an average grade of 5.16 g/t
Au. Development of a new portal to access and develop a bulk sample at the Cow Mountain portion of the mineral resource was completed
in December 2021. The Bonanza Ledge Mine was placed on care and maintenance in June 2022.
| |
Osisko Development Corp.
NI 43-101 Technical Report
Feasibility Study for the Cariboo Gold Project |
|
| 6.7. | Regional Mineral Claims of the Cariboo Gold Project |
Parts of the regional
mineral claims of the Project have a very long history of exploration and development dating back to the late 1800’s. It
is beyond the scope and technical requirements of the Report to review all the historical information. Work History (InnovExplo, 2025a)
provides a complete list of references for all available records relating to historic work on the regional mineral claims of the Project
by previous owners for the period 1949 to 2024.
The documents used to compile the information
were obtained from the database assessment files of the British Columbia Ministry of Energy and Mines (ARIS (gov.bc.ca)).
| |
Osisko Development Corp.
NI 43-101 Technical Report
Feasibility Study for the Cariboo Gold Project |
|
| 7. | Geological Setting and Mineralization |
| 7.1 | Introduction and Clarification |
For the purposes of this Report, Barkerville
Gold Mines Ltd., as it operated from 2015 to 2021, will be referred to as Osisko Development Corp. (“ODV”). The current
ODV management has been in place since 2015 and on November 21, 2019, Osisko Gold Royalties
acquired the Cariboo Gold Project through the acquisition of Barkerville Gold Mines Ltd. The Project was part of the assets contributed
by OGR that created ODV on November 25, 2020.
In addition, the Cariboo Gold Project as described
geologically refers to the entirety of the ODV land package in British Columbia.
Information presented in this section was taken
and modified from Hardie et al. (2023). Other references in the section are duly indicated where applicable.
| 7.2 | Regional Geological Setting |
The principal vein style deposits of the Cariboo
Discovery Property are hosted within Neoproterozoic to Paleozoic off-shelf siliciclastic and lesser carbonate facies rocks belonging
to the Snowshoe Group of the peri-cratonic Barkerville terrane (e.g., Monger and Berg, 1984; Struik, 1986;1988; Schiarizza and Ferri,
2003; Ferri and Schiarizza, 2006). Within central BC, the Barkerville terrane represents the westernmost component within the Omineca
morphogeological belt of the Canadian Cordillera (Figure 7-1).
The Omineca Belt is characterized by elevated
metamorphic grades, Paleozoic through early Tertiary granitoid intrusions, and protracted polyphase deformation beginning by the Middle
Jurassic (e.g., Monger and Price, 2002) (Figure 7-2). Across the Cariboo Mountains, the Omineca Belt can be described as consisting
of the following tectonostratigraphic elements:
| 1. | Neoproterozoic rift-related clastic and minor
volcanic rocks deposited on continental basement attenuated during break-up of the supercontinent
Rodinia (e.g., Monger and Price, 2002; Hoffman, 1991) (basal Barkerville and Cariboo terrane
sequences); |
| 2. | Paleozoic peri-cratonic off-shelf siliciclastic
rocks, with lesser volcanic, volcaniclastic, and carbonate facies rocks (characteristic Barkerville
terrane sequences) (e.g., Struik 1988; Schiarizza and Ferri, 2003); |
| 3. | More proximal Paleozoic platformal carbonate
facies and siliciclastic rocks (characteristic Cariboo terrane sequences) (e.g., Schiarizza
and Ferri, 2003); |
| |
Osisko Development Corp.
NI 43-101 Technical Report
Feasibility Study for the Cariboo Gold Project |
|
| 4. | Large-scale klippe including Late Paleozoic
mafic volcanic rocks, ultramafic to mafic intrusive rocks, and deep sea pelagic sedimentary
rocks often interpreted as representing a partial ophiolite sequence (Slide Mountain terrane)
(e.g., Struik, 1988; Nelson, 1993). |
Proximal and off-shelf sequences of the Cariboo
and Barkerville terranes are interpreted to have been deposited on and adjacent to the continental margin of ancestral North America
(Laurentia). This idea is supported by deep-crustal geophysical data collected through the National Lithoprobe Geoscience Project (Monger
and Price, 2002; Cook, 1995) (Figure 7-3), and by locally exhumed windows of Paleoproterozoic continental basement of North American
affinity occurring within the Omineca Belt of south-central BC (e.g., the Monashee core complex) (Monger and Price, 2002).
The metamorphism and magmatism that characterize
the Omineca Belt are superimposed across the interface between peri-autochthonous terranes (e.g., Barkerville, Kootenay) and allochthonous
terranes of the more westerly Intermontane Belt. The boundary between the two belts can thus be placed somewhat arbitrarily, unless coincident
with a major fault (Monger and Price, 2003). Within the Cariboo terrane, the Omineca-Intermontane Belt boundary is coincident with the
Barkerville-Quesnellia terrane boundary along the Jurassic aged Eureka thrust (e.g., Struik, 1988; Schiarizza and Ferri, 2003; Ferri
and Schiarizza, 2006). Figure 7-4, modified from Struik (1988), details the inferred tectonic architecture across the Omineca Belt
in the Cariboo Gold District.
| |
Osisko Development Corp.
NI 43-101 Technical Report
Feasibility Study for the Cariboo Gold Project |
|
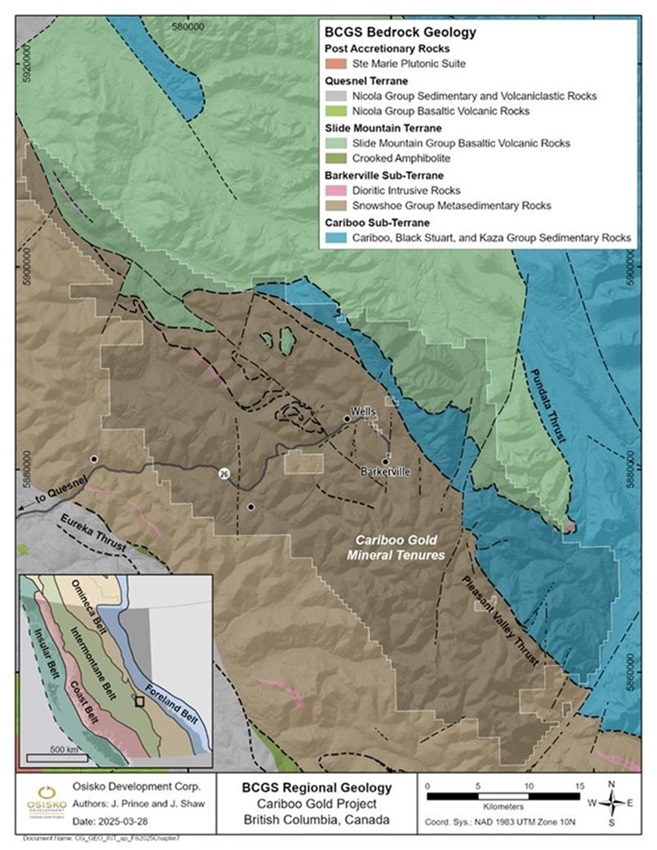
Figure 7-1: BCGS bedrock
geology of the Cariboo Gold Project area
| |
Osisko Development Corp.
NI 43-101 Technical Report
Feasibility Study for the Cariboo Gold Project |
|

| A) | Approximate location of the Project indicated by the star. |
| B) | Sg – sub-greenschist facies; G – greenschist facies;
A – amphibolite facies; B – Blueschist facies (dots); Gr – granitic rocks. |
Figure 7-2: A) Morphogeological belts
of the Canadian Cordillera with the northern (N)
and southern (S) Lithoprobe
transects; B) Simplified map of the distribution of granitic rocks and regional metamorphic grade (Monger and Price, 2002)
| |
Osisko Development Corp.
NI 43-101 Technical Report
Feasibility Study for the Cariboo Gold Project |
|
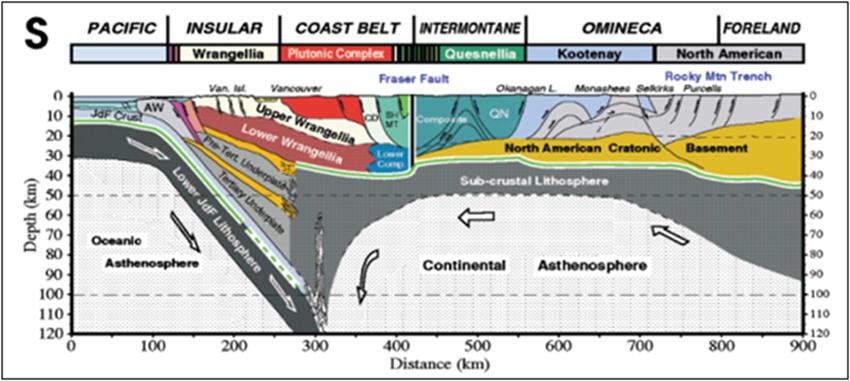
Figure 7-3: Lithospheric-scale cross-section
of the southern Cordilleran Lithoprobe transect
(Monger and Price, 2002)
The Cariboo terrane represents the easternmost
component of the Omineca Belt within the Cariboo district; its boundary with the Foreland Belt coincides with the eastern limit of the
Cariboo Mountains at the Rocky Mountain Trench. The Cariboo terrane is juxtaposed atop the Barkerville terrane along the E-dipping Pleasant
Valley Thrust. The age of formation of the thrust must post-date the youngest rocks within the Barkerville and Cariboo terranes, which
fossil age constraints place within the Lower Permian (Struik, 1986; 1988). While stratigraphic similarities certainly exist between
sections of the Barkerville and Cariboo terranes (e.g., Monger and Berg, 1984; Struik, 1986) the more carbonate-rich stratigraphy of
the Cariboo suggests a setting proximal to the Laurentian margin, and it is commonly classified as a sub-terrane of the more northerly
Cassiar (Struik, 1986; Ferri and Schiarizza, 2006). Significant (≥500 km) relative-northward Cretaceous through Eocene translation
of the Cassiar terrane along the Northern Rocky Mountain – Tintina fault system is believed to disperse and step westward at the
northern limits of the Cariboo mountains. The more southerly accommodation of this translation is believed to have occurred along the
intra-Omineca Matthew and McLeod Lake faults, with comparatively minor displacements experienced along the Rocky Mountain Trench (Gabrielse
et al., 2006).
| |
Osisko Development Corp.
NI 43-101 Technical Report
Feasibility Study for the Cariboo Gold Project |
|
The allochthonous Quesnel terrane, or Quesnellia,
consists primarily of Middle Triassic to Lower Jurassic sedimentary, volcanic, and intrusive rocks formed in an island arc – arc-marginal
basin setting (Struik, 1988; Panteleyev et al., 1996). These rocks represent the easternmost component of the Intermontane Belt and were
emplaced above the Barkerville terrane along the east-vergent Eureka Thrust during the Early to Middle Jurassic (e.g., Schiarizza and
Ferri, 2003). The thrust itself was folded not long after its formation (Struik, 1988; Schiarizza and Ferri, 2003), and it is marked
by lenses of variably sheared mafic and serpentinized ultramafic rocks collectively described as the Crooked Amphibolite (Struik, 1988;
Schiarizza and Ferri, 2003; Ferri and Schiarizza, 2006). The Crooked Amphibolite represents an ophiolitic sliver (e.g., Pantaleyev et
al., 1996), and it is commonly viewed as a correlative of a potential root to the shallowly emplaced Slide Mountain terrane (Pantaleyev
et al., 1996, Struik, 1986; Ash, 2001; Ray et al., 2001; Ferri and Schiarizza, 2006). Quesnel terrane accretion, perhaps co-eval with
the emplacement of the Slide Mountain terrane, has been linked with the development of the earliest recognizable phases of deformation
and accompanying regional metamorphism within the Cariboo and Barkerville terranes (Schiarizza and Ferri, 2003). Metamorphic cooling
ages of 174+\- 4 mega annum (million years) (“Ma”) obtained from uranium-lead (“U-Pb”) dating of metamorphic
sphene from the Quesnel Lake area (Mortensen et al., 1987) constrain peak metamorphism to the Middle Jurassic.
The Slide Mountain terrane structurally overlies
both the Cariboo and Barkerville terranes along the sub-horizontal, broadly warped and locally folded Pundata Thrust (Struik, 1986).
In the Wells-Barkerville area, the Slide Mountain klippe consists of Lower-Mississippian to Lower Permian meta-basalt and chert of the
Antler Formation (e.g., Schiarizza and Ferri, 2003). The structural relationship between the Pleasant Valley and Pundata thrusts seems
to suggest that the latter post-dates the former and that, therefore, Slide Mountain emplacement post-dates Cariboo-Barkerville terrane
amalgamation (Struik 1986, 1988). However, Schiarizza and Ferri (2003) note that it is in fact unclear whether the Pleasant Valley thrust
cuts up-section through the Pundata to affect Antler Formation rocks of the Slide Mountain terrane.
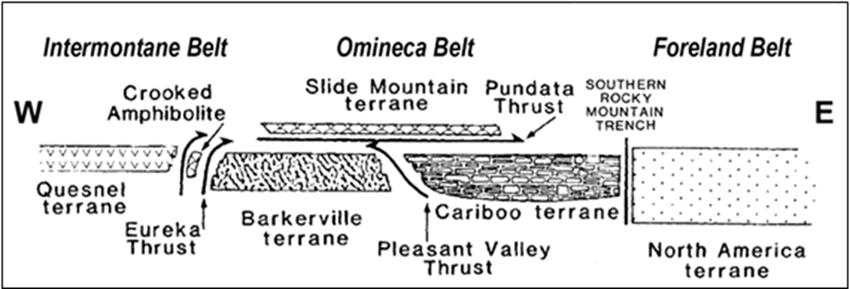
Figure 7-4: Tectonic architecture of the
Cariboo Gold District
(Modified from Struik, 1986)
| |
Osisko Development Corp.
NI 43-101 Technical Report
Feasibility Study for the Cariboo Gold Project |
|
| 7.2.1 | Snowshoe Group Stratigraphy |
Siliciclastic and carbonate sequences, volcanic
and volcaniclastic rocks of the Barkerville terrane collectively comprise the Snowshoe Group, a singular formal unit proposed by Struik
(1986). Stratigraphic subdivisions of the Snowshoe Group proposed by Struik (1986) were qualified as “informal”, given uncertainties
regarding relative stratigraphic order. A final re-interpretation, as presented in Ferri and Schiarizza (2006), goes hand in hand with
a new model for the fundamental structural architecture within the Barkerville terrane allowing for large-scale structural repetitions
of a simplified stratigraphic sequence. See Struik (1988) for further discussion of earlier stratigraphic interpretations across the
Barkerville and Cariboo terranes. The simplified stratigraphy of Ferri and Schiarizza (2006) divides the Snowshoe Group into three major
successions, from oldest to youngest: the Downey, Harveys Ridge and Goose Peak successions (Figure 7-5).
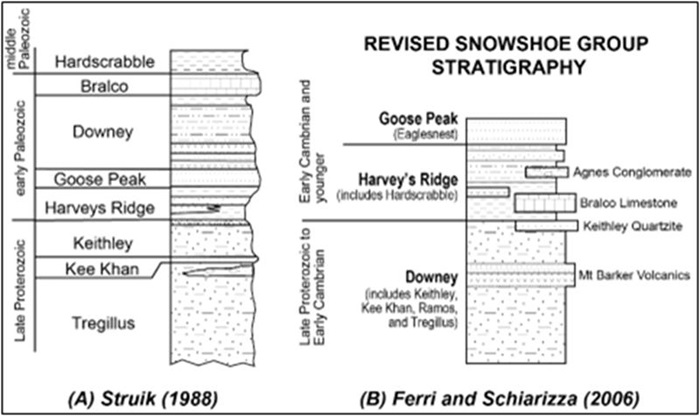
Figure 7-5: Stratigraphic interpretations
of the Snowshoe Group
(Modified from Ferri and Scharizza,
2006)
| |
Osisko Development Corp.
NI 43-101 Technical Report
Feasibility Study for the Cariboo Gold Project |
|
The revised Downey succession of Ferri and Schiarizza
(2006) outcrops within two separate belts in the Barkerville terrane. An eastern belt corresponds to the original Downy succession of
Struik (1988); a western belt corresponds to and includes the Tregillus clastic rocks, Kee Khan marble, Keithley, and Ramos successions
as defined by Struik (1988). Siliciclastic rocks within the Downey succession of Ferri and Schiarizza (2006) consist of green-grey micaceous
to feldspathic quartzite and phyllite or schist, depending on metamorphic grade. Ferri and Schiarizza retain the name “Keithley
Quartzite” to describe a localized marker orthoquartzite occurring near the top of the sequence. The Downey succession commonly
includes relatively thick and discontinuous carbonate units, including the Kee Khan marble of Struik (1988), which are found most often
in association with alkali mafic metavolcanic and volcaniclastic rocks (e.g., Mt. Barker Volcanics). Metavolcanic rocks range from thin
horizons of chloritic phyllite in the Wells-Barkerville area, to thick, regional-scale exposures of chlorite±actinolite phyllite
and schist north of Cariboo Lake (Allan et. al., 2017). Ferri and Schiarizza (2006) constrain the depositional age range for the Downey
succession to Late Proterozoic through Early Cambrian. The geochemical nature of Downey volcanic rocks and the immature nature of its
siliciclastic sequences are consistent with deposition in a continental rift environment (Ferri and Schiarizza, 2006). Depositional onset
is consistent with the timing of Rodinia break-up (e.g., Hoffman, 1991).
The revised Harveys Ridge succession of Ferri
and Schiarizza (2006) includes rocks grouped by Struik (1988) into the separate Harveys Ridge and Hardscrabble Mountain successions.
The sequence consists predominantly of dark grey to black carbonaceous and locally pyritic siltstone to phyllite and variably carbonaceous
dark to pale grey quartzite. The term ‘Hardscrabble facies’ is still employed to describe the finer grained rocks in the
succession, though facies changes between carbonaceous siltstones and quartzites occur both in section and laterally. The Harveys ridge
succession also includes intervals of dark grey to black (carbonaceous) limestone and minor mafic metavolcanic rocks. The Agnes Conglomerate
of Struik (1988) forms discontinuous lenses at the uppermost levels of the succession. The Bralco Limestone of Struik (1988) is found
at the base of the succession but is believed to occur only within its eastern exposures. Rocks of the Harveys Ridge succession are believed
to be in sharp contact with rocks of the underlying Downey, though Harveys Ridge is transitional into the overlying Goose Peak succession,
grading from carbonaceous to clean quartzites in its upper reaches.
The Goose Peak succession of Ferri and Schiarizza
(2006) consists predominantly of light grey to grey-green quartzite to feldspathic quartzite with lesser interbedded dark grey phyllite
and siltstone. The redefined sequence includes both the Goose Peak and Eaglesnest successions of Struik (1988).
Ferri and Schiarizza (2006) constrain the Harveys
Ridge and Goose Peak successions as Early Cambrian or younger, based on correlations with similar units within the Cariboo terrane to
the east. Lower Permian conodont ages are determined for the Sugar Limestone, which unconformably overlies Hardscrabble facies rocks
at Sugar Creek on Hardscrabble Mountain (Struik, 1988). While the upper age limits of the Harvey’s Ridge and Goose Peak successions
are otherwise poorly constrained, the age gap represented by the unconformity at the base of the Sugar Limestone may be quite profound
(Ferri and O’Brein, 2002).
Snowshoe group rocks are locally intruded by
dikes and sills of varying composition and relative timing of emplacement (e.g., Struik 1988).
| |
Osisko Development Corp.
NI 43-101 Technical Report
Feasibility Study for the Cariboo Gold Project |
|
In tandem with the revised Snowshoe Group stratigraphy,
Ferri and Schiarizza (2006) present a model within which Snowshoe Group rocks, along with the overriding Eureka Thrust, are folded into
a terrane-scale SW-vergent nappe (Figure 7-6). The nappe is overridden in the northeast (“NE”) by the Cariboo terrane
along the Pleasant Valley Thrust, beneath which Downey succession rocks are interpreted to represent the core of an early recumbent anticline.
The nappe itself is then subjected to another phase of upright folding about a horizontal axis to produce a broad antiform with the youngest
Snowshoe group rocks of the Goose Peak succession exposed at its core. The broad antiform, known as the Lightning Creek Anticlinorium,
was recognized by Struik (1988) as a domain across which orogenic vergence transitions from NE to SW. In a transect along the Barkerville
Highway (BC 26) the domain is characterized by predominantly subhorizontal regional foliation. Further south, i.e., in the Yanks Peak
area north of Cariboo Lake, the domain is characterized by tight upright folds.
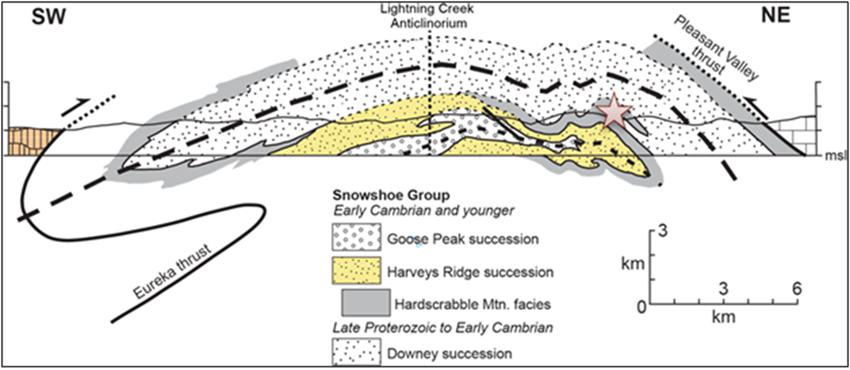
Note: Section line approximately equivalent to a transect along
the Barkerville Highway (BC 26). The approximate location of Wells is indicated by the star.
Figure 7-6: Barkerville terrane nappe
model
(Modified from Ferri and Schiarizza,
2006)
All known gold and silver mineralization within
the Barkerville trend is hosted in rocks metamorphosed to lower-greenschist facies (sub-biotite isograd). The principal metamorphic minerals
largely depend on the protolith but generally include sericite, chlorite, quartz, and iron-carbonate. A regional S1 foliation is defined
by the alignment of metamorphic micas, suggesting that peak metamorphic temperature coincided with the D1 deformation with possible overprinting
during D2 (Struik, 1988). Peak metamorphism is thought to have occurred at approximately 174±4 Ma, based on a U-Pb age for
metamorphic titanite (sphene) collected near Quesnel Lake (Mortensen et al., 1987). Andrew et al. (1983) reported a similar K-Ar whole-rock
age of 179±8 Ma for phyllite at the Cariboo Gold Quartz Mine. However, more recent dating by Rhys et al. (2009) constrained
the age of the metamorphism at Cariboo Gold Quartz and Bonanza Ledge Mines between 146.6±1.1 and 151.5±0.8 Ma, which
is significantly closer to the age of mineralization.
| |
Osisko Development Corp.
NI 43-101 Technical Report
Feasibility Study for the Cariboo Gold Project |
|
Amphibolite-facies rocks are found within a klippe
atop Island Mountain but are not associated with any significant mineralization and their origin is not well understood. Rocks within
the klippe at Island Mountain include both amphibolite and garnet-mica (white mica ± biotite) schist. They have been postulated
as correlative with the Slide Mountain terrane and/or Crooked Amphibolite but may alternatively represent more deeply rooted rocks of
Barkerville terrane affinity (e.g., Schiarizza and Ferri, 2003). Amphibolite-facies rocks are also found at the western margin of
the Barkerville terrane, where Snowshoe Group rocks consist of garnet-biotite schists and micaceous quartzites (Moynihan & Logan,
2009; Struik et al., 1992).
Detailed surface mapping conducted at a 1:2,000
scale and the collection of high-density structural data was completed within the core of the Project area covering the Island Mountain,
Cow Mountain, Barkerville Mountain, and Mount Proserpine prospect areas during the 2018-2019 field seasons and during the 2018 to 2022
field seasons at the following four Cariboo Gold Project regional prospect areas: Proserpine, Cunningham, Burns, and Yanks Peak. The
goal was to develop a geologic understanding of each location as well as generating drill targets and/or additional research objectives.
The following synthesis is based largely on that
work. Culminating map and cross-section products are presented in Figure 7-11 and Figure 7-12 at the end of Section 7.3.1.
| 7.3.1 | Cariboo Gold Project’s
Core Area |
Snowshoe Group rocks within the Project consists
of an internally deformed sequence of siliciclastic, carbonate, and lesser volcaniclastic rocks that correspond with both the Downey
and Harveys Ridge (including Hardscrabble facies) successions of Ferri and Schiarizza (2006). Historical workings in the Cariboo Gold
District along with active brownfields exploration of approximately 13 km in strike length define a strike-parallel belt of lode
gold deposits hereafter and historically referred to as the Barkerville trend. Within the Barkerville trend, Snowshoe Group rocks are
deformed within a close to tightly folded northwest-southeast striking and northeast-dipping tectonostratigraphic sequence regionally
metamorphosed to greenschist facies and locally disrupted by strike-parallel shear structures of varying thickness and undetermined offset
(e.g., BC Vein). Given the consistency of low metamorphic grades within deposit hosting rocks of the Project, all Snowshoe Group lithologies
are referenced using protolith terminology in both core logging and surface mapping. These pre-established protocols will be followed
herein.
| |
Osisko Development Corp.
NI 43-101 Technical Report
Feasibility Study for the Cariboo Gold Project |
|
Each of the vein-related deposits within the
Project (Mosquito Creek, Shaft, Valley, Cow Mountain, Lowhee, and KL) are hosted in Snowshoe Group rocks within the hanging-wall to the
BC Vein shear structure. A large-scale (ca. 300 m wavelength) D2 fold pair, consisting of the Mosquito Creek antiform and Barkerville
synform, is exposed at different structural levels across Island Mountain, Cow Mountain, and Barkerville Mountain drill areas. Most of
the diamond drilling at the Project takes place within the shared overturned limb of the Mosquito Creek-Barkerville antiform-synform
pair. Despite complexities of finer-scale structural repetition and lateral facies changes, the tectonostratigraphy in this shared overturned
limb can be described in terms of a simplified five-member sequence (Figure 7-7) that can be applied across the Island Mountain,
Cow Mountain, and Barkerville Mountain drill areas. From top to bottom (oldest to youngest) this sequence includes:
| 1. | Calcareous facies rocks including limestone
(“LST”), characteristically chloritic and effervescent volcaniclastic rocks with
varying degrees of intermixed carbonates classified within the Project as calcareous mafic
volcaniclastic rocks (“CLMV”), and lesser occurrences of dominantly sericitic
to weakly chloritic calcareous siltstones (“CLSI”). |
| 2. | Transitional calcareous siliciclastic facies
rocks including dominantly sericitic to locally chloritic and less commonly fuchsite-bearing
calcareous sandstone (“CLSS”) and sericitic siltstone (“SI”). |
| 3. | A sandstone dominant facies characterized
by generally weakly carbonaceous pale to medium-grey, fine to locally coarse-grained, quartz-dominant
to sub-arkosic sandstone (“SS”) with varying scales of intercalated carbonaceous
siltstone (“CSI”) horizons (interlaminations to map-scale interbeds) and less
common discontinuous lenses of quartz to locally polymictic quartz-plagioclase-lithic pebble
conglomerate (“CGL”). |
| 4. | A laterally extensive siltstone facies generally
characterized by iron-carbonate porphyroblastic sericitic to locally weakly chloritic SI. |
| 5. | A carbonaceous siltstone facies correlative
to the Hardscrabble facies of Ferri and Schiarizza (2006) and characterized by moderate to
strongly CSI with locally characteristic euhedral diagenetic pyrite and variable intercalations
of very fine to fine-grained carbonaceous sandstone. |
| |
Osisko Development Corp.
NI 43-101 Technical Report
Feasibility Study for the Cariboo Gold Project |
|
The highest density and largest scale veins at
the Project are hosted within the rheologically favourable central sandstone facies, sometimes referred to as the “Target Sandstone”.
It should be noted that rocks of both the sericitic siltstone and carbonaceous siltstone facies gradually coarsen moving laterally to
the southeast, respectively correlating with micaceous sandstone and carbonaceous sandstone dominant facies in the Mount Proserpine area.
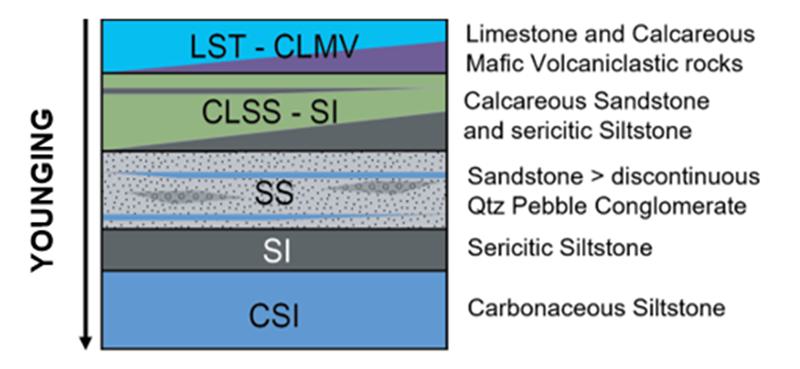
Figure 7-7: Simplified BC Hanging-wall
tectonostratigraphy for the Island, Cow,
and Barkerville Mountain drill
areas
Photographic examples of select lithologies encountered
at the Project are presented in Figure 7-8. More detailed tectonostratigraphic facies models prepared by Harbort (2017) for Island
Mountain – Cow Mountain and Barkerville Mountain sequences are presented (likewise overturned) in Figure 7-9 and Figure 7-10,
respectively. Specific details of these models will not be discussed herein.
| |
Osisko Development Corp.
NI 43-101 Technical Report
Feasibility Study for the Cariboo Gold Project |
|
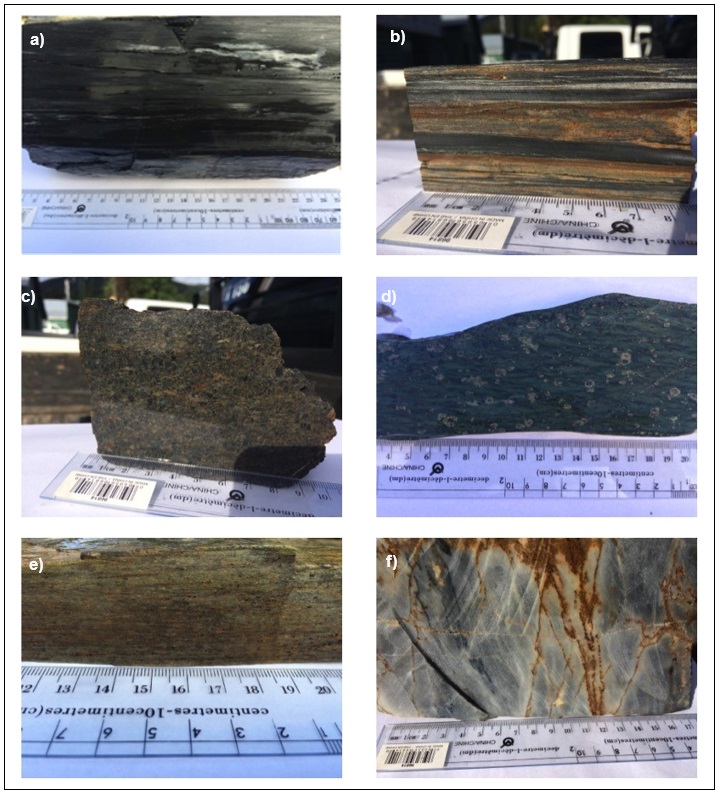
a) carbonaceous siltstone; b) interlaminated
carbonaceous siltstone and fine-grained sandstone; c) coarse-grained sandstone; d) calcareous mafic volcaniclastic;
e) calcareous siltstone; f) micritic limestone.
Figure 7-8: Select rock-types observed
on the Cariboo Gold Project
(Barkerville Gold Mines, 2018)
| |
Osisko Development Corp.
NI 43-101 Technical Report
Feasibility Study for the Cariboo Gold Project |
|
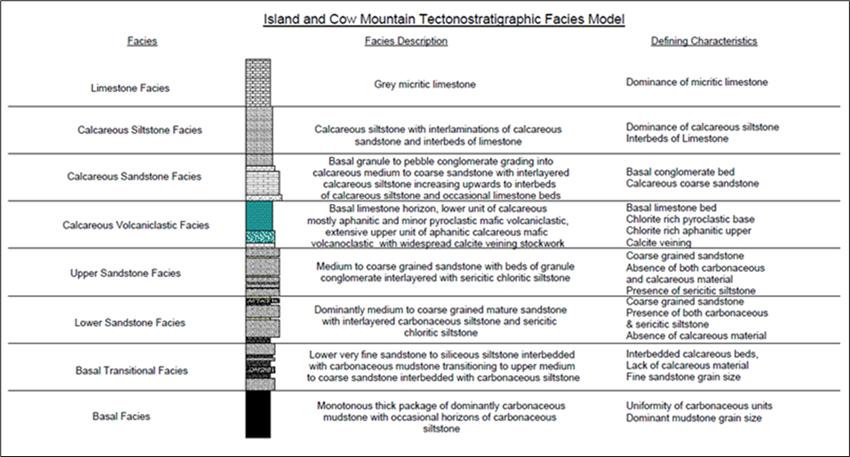
Figure 7-9: Detailed tectonostratigraphic
facies model for Island and Cow Mountains
(Harbort, 2017)
| |
Osisko Development Corp.
NI 43-101 Technical Report
Feasibility Study for the Cariboo Gold Project |
|
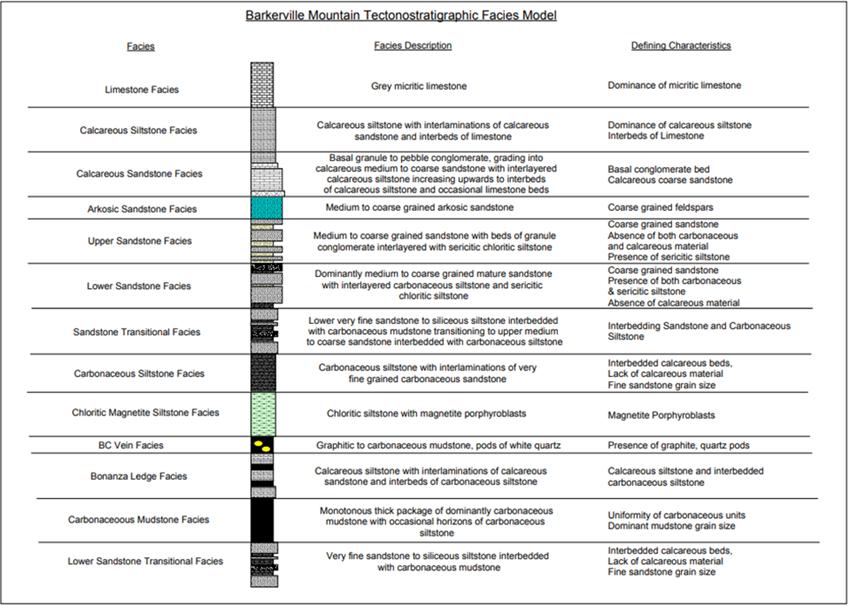
Figure 7-10: Detailed tectonostratigraphic
facies model for Barkerville Mountain
(Harbort, 2017)
| |
Osisko Development Corp.
NI 43-101 Technical Report
Feasibility Study for the Cariboo Gold Project |
|
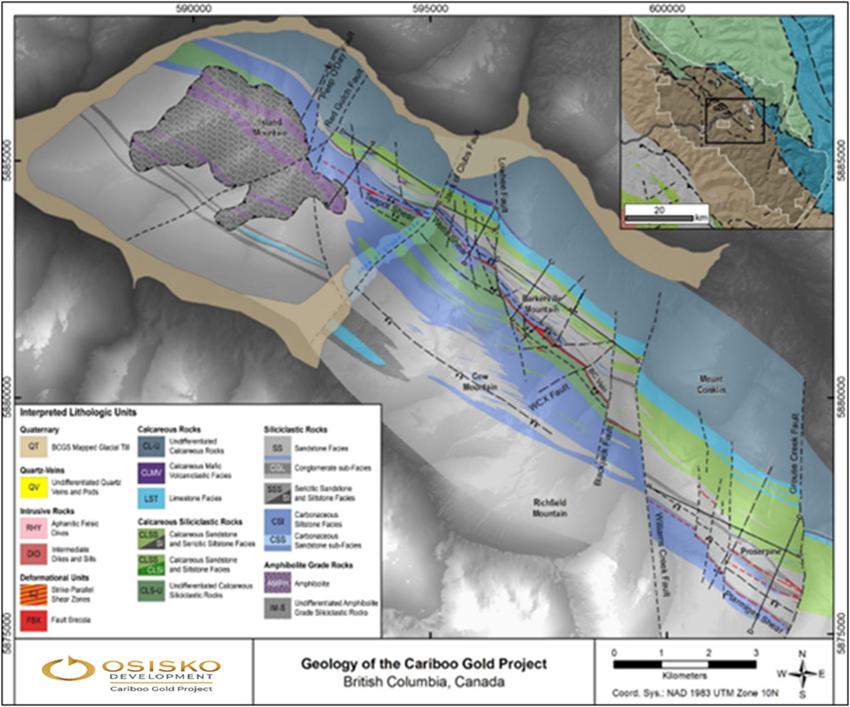
Figure 7-11: Geologic map of the core
Cariboo Gold Project area
Corresponding sections presented
in Figure 7-12
(Shaw and Prince, 2019)
| |
Osisko Development Corp.
NI 43-101 Technical Report
Feasibility Study for the Cariboo Gold Project |
|
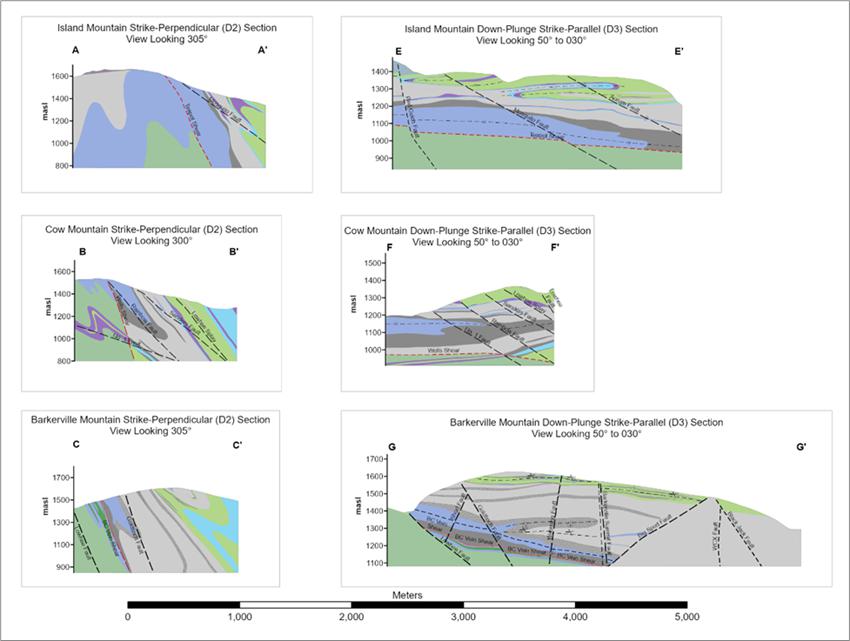
| |
Osisko Development Corp.
NI 43-101 Technical Report
Feasibility Study for the Cariboo Gold Project |
|
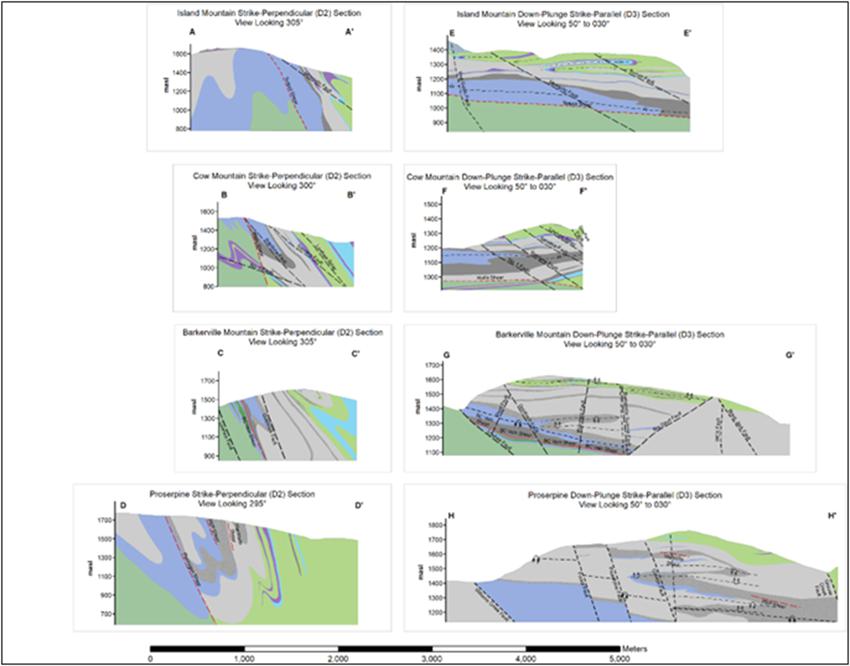
a) Island Mountain sections; b) Cow Mountain sections;
c) Barkerville Mountain sections, d) Mount Proserpine sections
Figure 7-12: Vertical strike-perpendicular
(left) and down-plunge strike-parallel (right)
cross-sections for the core Cariboo Gold Project
area
(Shaw and Prince, 2019)
In the Proserpine region, we observe host rocks
like those of the deposits in the Project. Snowshoe Group rocks host mineralized veining within the hanging wall of a carbonaceous shear
structure, which itself is locally well mineralized. Figure 7-13 shows the interpreted geologic units based on mapping completed
in 2018 and 2019 (Shaw and Prince, 2018, 2019). Most of the veining occurs within sandstone dominant facies of the generalized tectonostratigraphic
sequence presented in Figure 7-13.
| |
Osisko Development Corp.
NI 43-101 Technical Report
Feasibility Study for the Cariboo Gold Project |
|
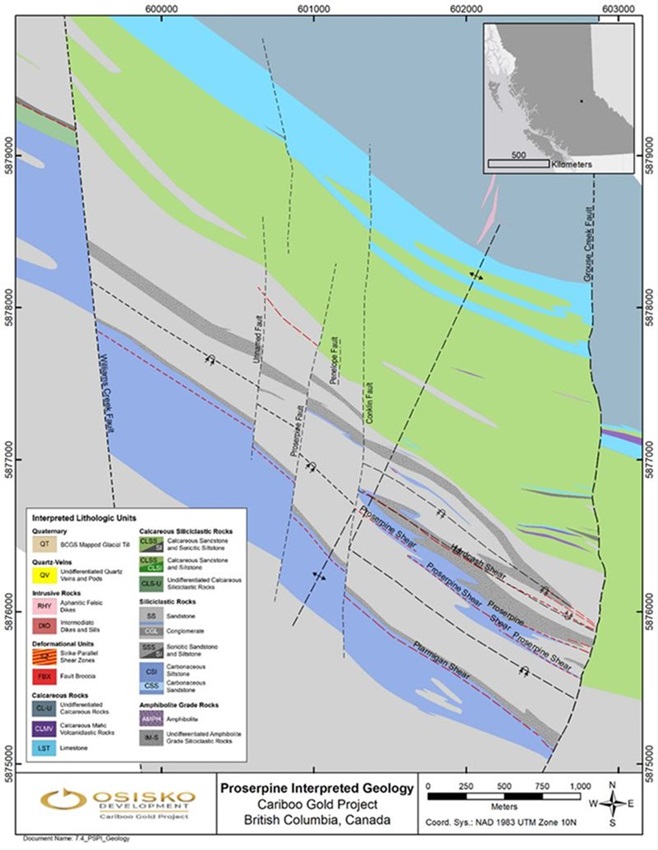
Figure 7-13: Proserpine
interpreted geology map
| |
Osisko Development Corp.
NI 43-101 Technical Report
Feasibility Study for the Cariboo Gold Project |
|
Detailed mapping and analysis in the Cunningham
region have been focused on the Cariboo-Hudson prospect. The lithologic units observed here are like what is observed in the Project
with vein-hosted mineralization focused within the sandstone dominant units.
The vein system at Cariboo-Hudson consists of
a series of strike parallel or strike oblique shear veins. These veins were modelled in 2021 using the surface mapping observations,
underground level plans from the historic Cariboo-Hudson mine, and DDH intercepts from historic drilling.
The following is a geologic plan map, cross-section,
and lithologic stratigraphy model for the Cariboo-Hudson prospect area (Figure 7-14, Figure 7-15 and Figure 7-16).
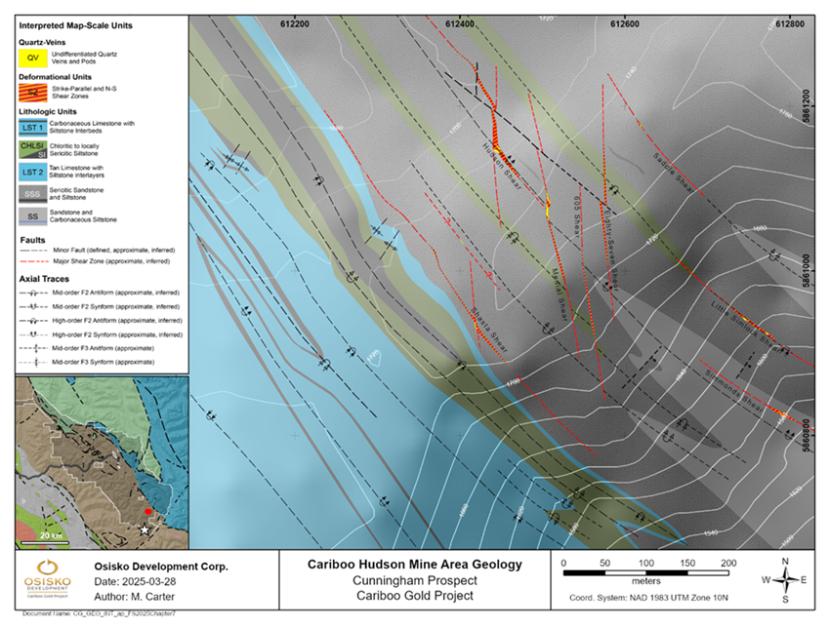
Figure 7-14: Cariboo-Hudson
Mine Area geology within the Cunningham Region
| |
Osisko Development Corp.
NI 43-101 Technical Report
Feasibility Study for the Cariboo Gold Project |
|
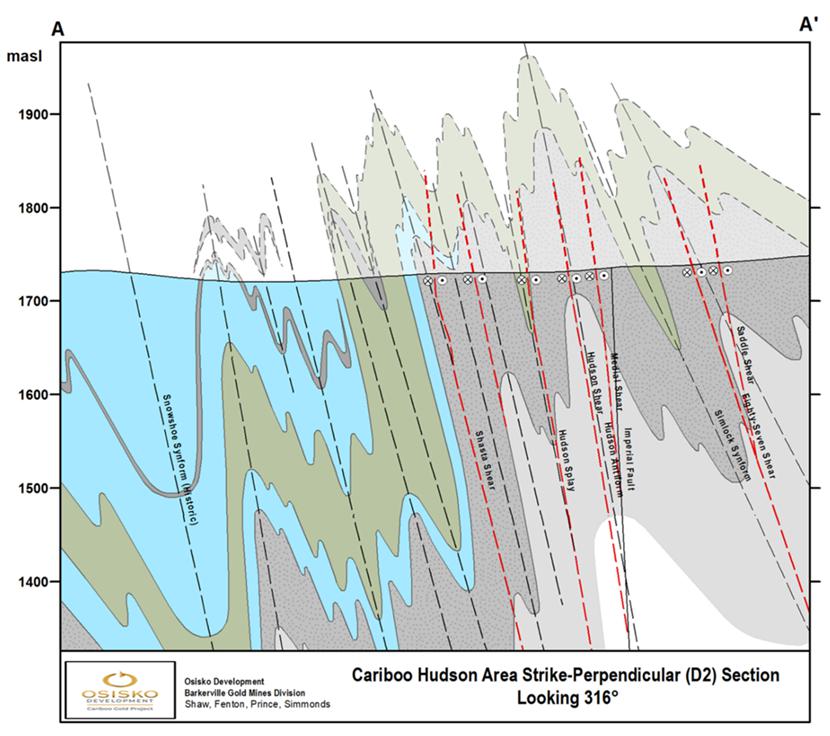
Figure 7-15: Cariboo-Hudson
Mine Area cross-section
| |
Osisko Development Corp.
NI 43-101 Technical Report
Feasibility Study for the Cariboo Gold Project |
|
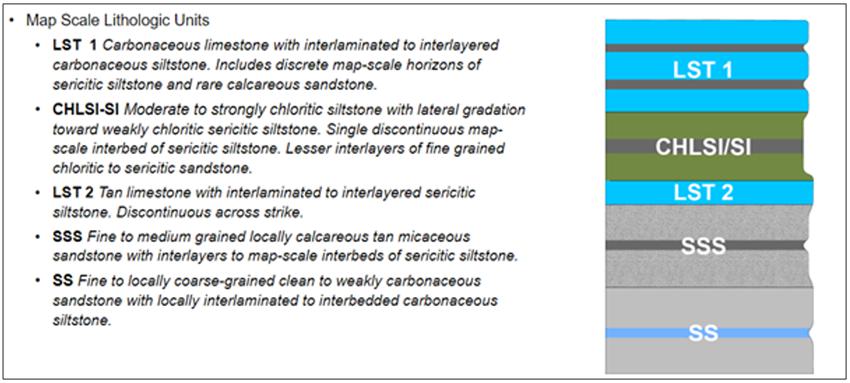
Figure 7-16: Simplified
tectonostratigraphy for the Cunningham region
At Burns Mountain, the lithologic succession
comprises predominantly medium-grained sandstones and carbonaceous siltstones with minor calcareous and locally chloritic sandstones
as well as granule to pebble quartz grain conglomerate. There is an overall gently east dipping succession, which has been subjected
to at least two episodes of SW-NE oriented shortening followed by NW-SE oriented compression and finally NW-SE oriented extension (Figure 7-17
and Figure 7-18).
The dominant type of veins in the Burns region
are AXPL veins that are steeply dipping and strike NNE.
| |
Osisko Development Corp.
NI 43-101 Technical Report
Feasibility Study for the Cariboo Gold Project |
|
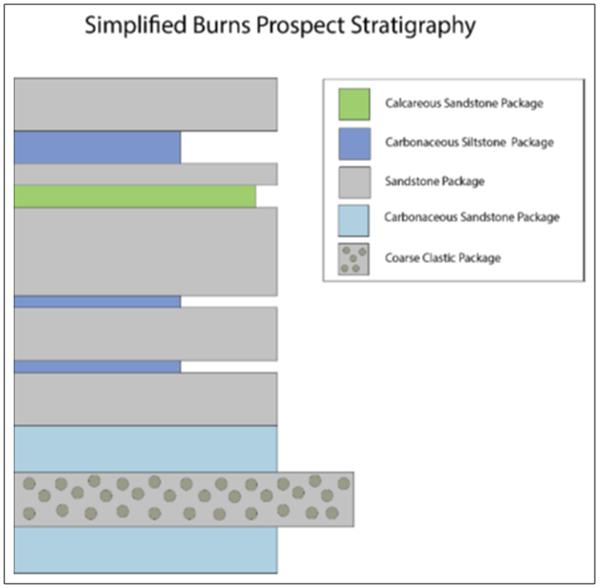
Figure 7-17: Simplified Burns prospect
stratigraphy
(Friesen et al., 2022)
| |
Osisko Development Corp.
NI 43-101 Technical Report
Feasibility Study for the Cariboo Gold Project |
|
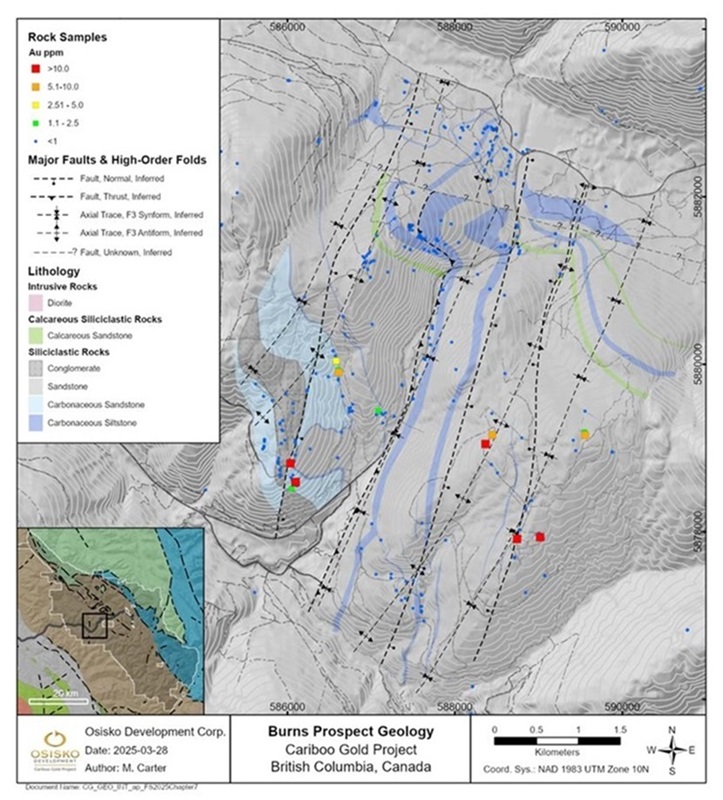
Figure 7-18: Burns Region geologic interpretation
map
(Friesen et al., 2022)
| |
Osisko Development Corp.
NI 43-101 Technical Report
Feasibility Study for the Cariboo Gold Project |
|
Rocks underlying mapped areas at the Yanks Peak
property include fine to locally coarse-grained generally clean quartz sandstone with interbeds of carbonaceous siltstone. A package
of transitional carbonaceous sandstones and carbonaceous siltstones appears to separate sandstones exposed along the crest of the Yanks
Peak plateau from a tectonostratigraphical higher and characteristically non-carbonaceous sandstone package with lesser inliers of sericitic
siltstone exposed on the flanks of the plateau and at the Yanks Peak summit. Calcareous siliciclastic rocks are also observed in rare
outcrop occurrences; all rocks are metamorphosed to lower greenschist facies. Polyphase deformation in the Yanks Peak area is recognized
by the re-folding of a penetrative NW-SE-striking bedding-parallel S1 slaty to phyllitic cleavage best expressed in more silt-rich facies.
F2 folding in the Yanks peak area is tight, and generally upright to gently inclined. Though often cryptic at the outcrop-scale, F2 folding
is recognizable by the development of a penetrative to locally disjunctive S2 cleavage, and by the localized development of L and L-S-tectonites
elongate parallel to the F2 axis. Field observations generally support a model consistent with previous interpretations that the axial
trace of the regional-scale Lightning Creek Anticlinorium, representing a domain of reversal from SW to NE orogenic vergence, lies along
the crest of the Yanks Peak plateau (Munnich. 2021) (Figure 7-19).
Lithological units mapped at Yanks Peak include
the following:
| 1. | Clean
to locally carbonaceous sandstone exposed along crest of plateau at core of Lightning Creek
Anticlinorium. |
| 2. | Carbonaceous Siltstone and Carbonaceous Sandstone. |
| 3. | Clean to locally sericitic sandstone with
lesser siltstone and rare calcareous inliers. |
| |
Osisko Development Corp.
NI 43-101 Technical Report
Feasibility Study for the Cariboo Gold Project |
|
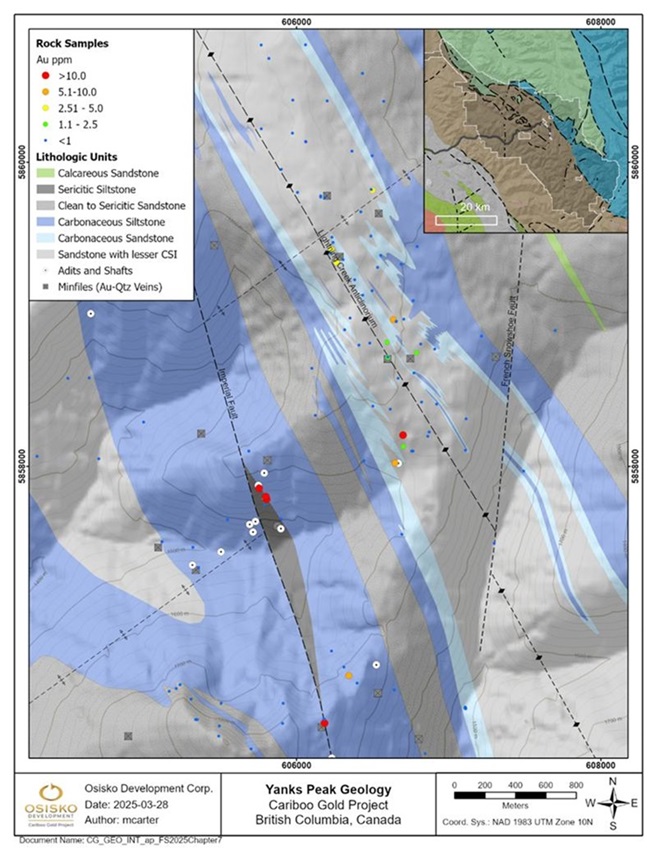
Figure 7-19: Yanks Peak
geologic interpretation map
| |
Osisko Development Corp.
NI 43-101 Technical Report
Feasibility Study for the Cariboo Gold Project |
|
A minimum of four phases of deformation are recognized
within the Project area, resulting in a complex array of intersecting and cross-cutting deformational fabrics (Figure 7-20).

Figure 7-20: Relative orientation of variable
structures arising from polyphase deformation
within the Wells-Barkerville area
(Shaw and Prince, 2019)
The earliest recognizable phase of deformation
(D1) in the Cariboo Gold District is best evidenced by the presence of a penetrative slaty to phyllitic cleavage (S1) developed axial
planar to rarely observed transpositional folds (F1). The S1 foliation is the generally the dominant fabric throughout the area and is
predominantly defined by phyllosilicate minerals (sericite and chlorite). F1 folds are rarely observed, expressed as highly asymmetric
and isoclinal isolated hinges of rootless folds (Figure 7-21). The D1 event is commonly attributed to emplacement of the Slide Mountain
allochthon and is believed to be transitional into D2.
| |
Osisko Development Corp.
NI 43-101 Technical Report
Feasibility Study for the Cariboo Gold Project |
|
A secondary phase of deformation (D2) accommodated
northeast-southwest shortening with the development of close to locally isoclinal F2 folds moderately inclined with vergence toward the
SW in the Barkerville trend. Folding was accompanied by the development of a disjunctive to locally phyllitic axial planar crenulation
cleavage (S2) (Figure 7-21) striking west-northwest with an average dip ~50° to the northeast within the Barkerville trend.
A well-developed S1-S2 intersection lineation (Figure 7-21) approximates the F2 axis. The S2 foliation becomes more penetrative
where proximal to F2 hinge zones, making it difficult to discern between S1 and S2 foliations locally. Rod-shaped L-tectonites developed
under uniaxial strain (Figure 7-21) are also observed within F2 hinge zones and are particularly well-formed within the carbonaceous
siltstone facies. The long axes of replacement mineralization at Mosquito Creek and Island Mountain are parallel to these lineations,
within the hinge zones and parallel to the axes of F2 folds.
This second phase of deformation is likely related
to the progressive collision of the Quesnel terrane. The final phase of northeast-southwest shortening (D3 of Ferri and Schiarizza, 2003)
is characterized by the local development of a steeply dipping S2-strike parallel, disjunctive fracture set within the Barkerville trend
and is grouped within the D2 event at the Cariboo Gold Project.
A tertiary phase of deformation (D3) accommodated
strike-parallel (northwest-southeast) shortening with the development of gentle F3 folds with a generally disjunctive sub-vertical axial
planar cleavage (S3). The geometry, scale, and deformation mechanics involved with the formation of F3 folds are significant contributors
to structural control and distribution of vein-hosted Au-mineralization within the Barkerville trend. With continued shortening under
more brittle crustal conditions, local extension in the hinge zones of F3 antiforms resulted in the opening of S3-parallel Mode 1 fractures.
The primary Au-bearing vein systems in the region are classified as axial planar because they parallel the S3 disjunctive cleavage and
are believed to have exploited and/or contributed to the progressive opening of these fracture systems.
F3 folds are observable at the hand sample and
outcrop scale but can also reach wavelengths exceeding 1 km (Figure 7-21 and Figure 7-22). The geometry of the larger-scale
F3 folding is best recognized by changing dip angles through S3 cleavage fanning, folding of the L21 intersection lineation, and by deflections
in S1 strike (Shaw and Prince, 2019).
| |
Osisko Development Corp.
NI 43-101 Technical Report
Feasibility Study for the Cariboo Gold Project |
|
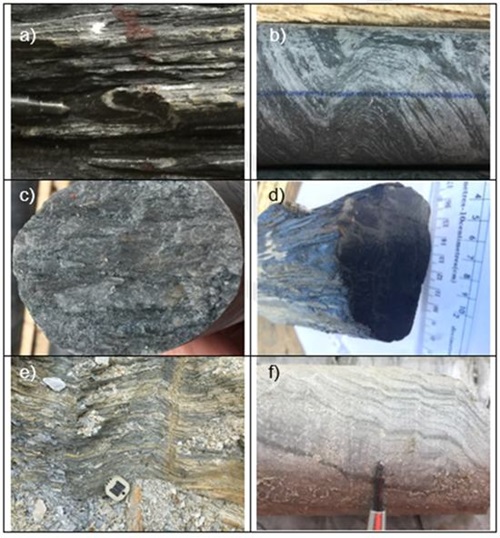
a) F1 isoclinal fold hinges attributed to remnant transposed
layering during D1; b) F2 folds with weakly developed S2 foliations AXPL to folds; c) L21 intersection lineation; d)
Rod-shaped L-tectonite fold hinge structure of F2 fold axis; e) Open gentle F3 folds with weakly developed spaced AXPL cleavage;
f) Weakly developed F3 crenulation cleavage.
Figure 7-21: Deformation phases and associated
fabrics on the Cariboo Gold Project
(Barkerville Gold Mines, 2018)
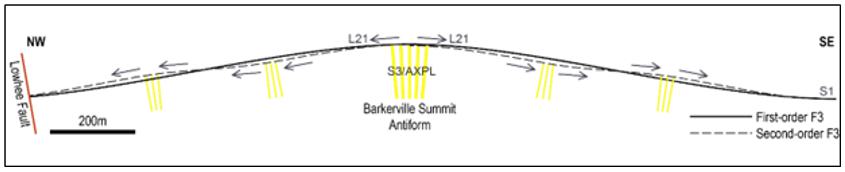
Figure 7-22: To scale schematic strike
parallel Barkerville Mountain section illustrating
the geometries of first and second order F3
folds
(Shaw and Prince, 2019)
| |
Osisko Development Corp.
NI 43-101 Technical Report
Feasibility Study for the Cariboo Gold Project |
|
A final brittle phase of deformation (D4) is
recognized by the development of both S3-parallel and N-S trending faults with constrained relative surface offsets (most commonly dextral)
locally exceeding 1,000 m (e.g., Grouse Creek and Williams Creek faults). The S3-parallel D4 faults may be post-orogenic relaxation structures
reactivating and inverting D3 reverse faults, or simply normal faults exploiting zones of high density S3 fractures. The N-S striking
D4 faults may likewise form as normal structures linking pre-existing fracture systems but are locally characterized by dominant components
of dextral strike-slip. This latter observation suggests either a syn-relaxation component of dextral transtension, or an independent,
post-relaxation phase of dextral transpression.
The presence of brecciated mineralized quartz
vein material within D4 structures has been observed in drill core (Figure 7-22) and was reported by Skerl (1948), indicating that
at least some of the movement on D4 faults must postdate mineralization. D4 structures (e.g., Lowhee fault) are also observed to cross-cut
and offset mineralized corridors. Many of the best-mineralized prospects within the Barkerville Trend are formed adjacent to the D4 faults,
e.g., Shaft Zone, Valley Zone, Lowhee Zone. The observed spatial association between vein zones and major D4 structures may simply reflect
the preferential formation of each within zones of high S3 fracture density.
| 7.5 | Mineralization and Alteration |
Gold +/- silver-bearing veins and replacement-style
mineral deposits in the Project are inter-related but can be subdivided into five principal types:
| 1. | Fault-fill
shear veins in fractured early-phase quartz lenses within carbonaceous mud and silt-rich,
foliation sub-parallel (northwest-southeast trending) shear zones (BC Vein-style). |
| 2. | Sub-vertical,
foliation-perpendicular (northeast-southwest trending) so-called AXPL veins structurally
controlled by late-stage extensional fractures preferentially formed in rheologically brittle
sandstone units. |
| 3. | Foliation-oblique
so-called extensional (“EXT”) veins characterized by greatest mineral potential
where in association with AXPL vein systems. |
| 4. | Sulphide-replacement
bodies structurally controlled by and elongate parallel to the hinges of F2 folds within
calcareous sandstones and limestones (Mosquito Creek-style). |
| 5. | Fault
bound sulphide-replacement bodies within calcareous siltstones (Bonanza Ledge-style). |
Photographic examples of varying mineralization
styles are presented in Figure 7-23 and Figure 7-24.
| |
Osisko Development Corp.
NI 43-101 Technical Report
Feasibility Study for the Cariboo Gold Project |
|
| 7.5.1 | Vein-related Mineralization |
Axial planar quartz veins are the primary source
of vein hosted Au +/- Ag within the Barkerville trend, defining the fundamental architecture of the Mosquito Creek, Shaft, Valley, Cow
Mountain, Lowhee, and KL deposits. Individual veins range in width from millimetres to several metres. Where density is high, AXPL veins
form mineralized corridors extending for up to a few hundred metres along strike and down-dip within rheologically prospective units.
Though often advantageous to model and describe AXPL veins as tabular bodies, their morphologies are generally more complex. They are
often observed to pinch and swell in thickness with undulatory margins, and commonly network with (and/or refracture and cross-cut) earlier
EXT vein systems. Au-Ag-bearing EXT veins and Au-rich (+/- Ag) sulphide replacement bodies are intimately related to AXPL vein systems,
both spatially and presumably in terms of mineralizing fluid dynamics.
The composition of both the AXPL and EXT veins
is quartz dominant. Lesser iron carbonate usually occurs as vein-marginal or clustered intergrowths and vein-hosted sericite is also
common. Pyrite is the most prevalent sulphide mineral across all deposits, with vein content ranging from trace amounts to tens of percent
(Figure 7-23). Pyrite content appears to have a direct association with gold and silver content within veins. Galena (Figure 7-23)
and arsenopyrite are also common vein-hosted sulphides, occurring in individual veins in amounts up to several percent and locally exceeding
pyrite content. Additional sulphide minerals generally occurring in trace amounts include pyrrhotite, sphalerite (Figure 7-23),
chalcopyrite and (rarely) argentite. Pb-Ag-Bi sulphosalts including cosalite are found in trace amounts within veins and generally have
a close association with elevated Au grades (Figure 7-23). Elevated silver grades are typically accompanied by vein hosted pyrite,
galena, or cosalite mineralization. Scheelite is also locally observed, generally as secondary fill within quartz vein vugs.
Veining
can be subdivided into at least two temporally separate events. Both events are characterized by a quartz - iron carbonate ±
sericite hydrothermal fluid, but they differ greatly in their Au potential.
Early veins may host sulphides (mostly Py, Po, Gal, Sph ± Cpy)
but tend to be barren of Au and Ag except where mineralized by later fluids. The later, Au +/- Ag bearing veins tend to be more sulphide-rich
(mostly Py, Aspy, Gal, Sph ± Arg ± Cos)
and cross-cut earlier veining (Figure 7-23). In these cases, sulphides may be observed filling void space or occasionally replacing
the iron-carbonate within the early veins (Figure 7-23), a reaction which is known to precipitate Au from solution:
FeCO3 + Au(HS)2-
= FeS2 + CO2 + H2O + Au (Zhu et al., 2011)
| |
Osisko Development Corp.
NI 43-101 Technical Report
Feasibility Study for the Cariboo Gold Project |
|
| 7.5.2 | Replacement-style Mineralization |
Replacement mineralization (Figure 7-24)
in calcareous siliciclastic and carbonate facies rocks varies from fine to coarsely crystalline pyrite with rare arsenopyrite. This style
of mineralization is thought to be the result of a reaction between the slightly acidic, Au-Ag bearing hydrothermal fluid and carbonate
minerals within the host rocks which results in the simultaneous dissolution of carbonate and precipitation of gold-rich sulphide. Bonanza
Ledge-style replacement mineralization is hosted in calcareous siltstone and consists entirely of fine-grained pyrite ore. Sulphide content
in replacement ore types is generally high, ranging from 10% (replacing thin calcareous bands) to massive (replacing entire beds). Mosquito
Creek-style replacement bodies in limestones and calcareous sands contain the most consistently high Au grades in the Cariboo Gold Project.
These replacement bodies are thought to be both spatially and temporally related to the mineralized AXPL vein systems (Figure 7-24).
| |
Osisko Development Corp.
NI 43-101 Technical Report
Feasibility Study for the Cariboo Gold Project |
|
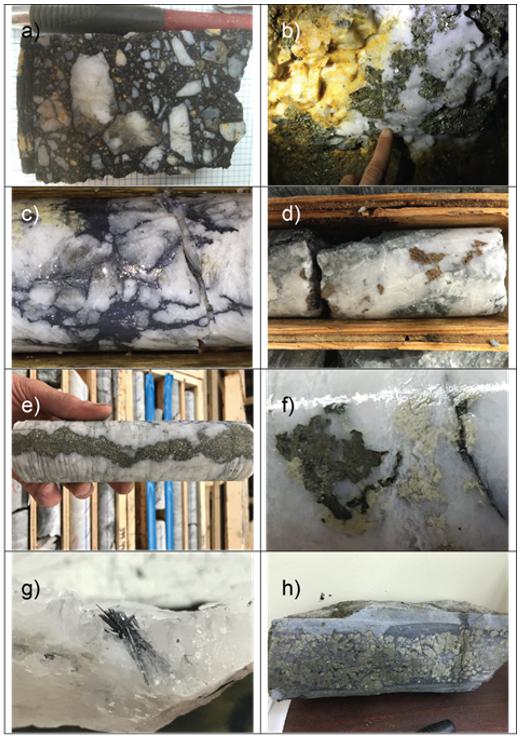
a) BC Vein-style fault-fill (breccia annealing)
mineralization; b) Pyrite in quartz vein; c) Galena in quartz vein; d) Sphalerite in quartz vein; e)
Pyrite deposition along the centerline of veins in pre-existing inter-crystal void space; f) Pyrite replacement of iron-carbonate;
g) Cosalite in quartz vein; h) Sulphide replacement mineralization.
Figure 7-23: Mineralization
styles observed on the Cariboo Gold Project
(Barkerville
Gold Mines, 2018)
| |
Osisko Development Corp.
NI 43-101 Technical Report
Feasibility Study for the Cariboo Gold Project |
|
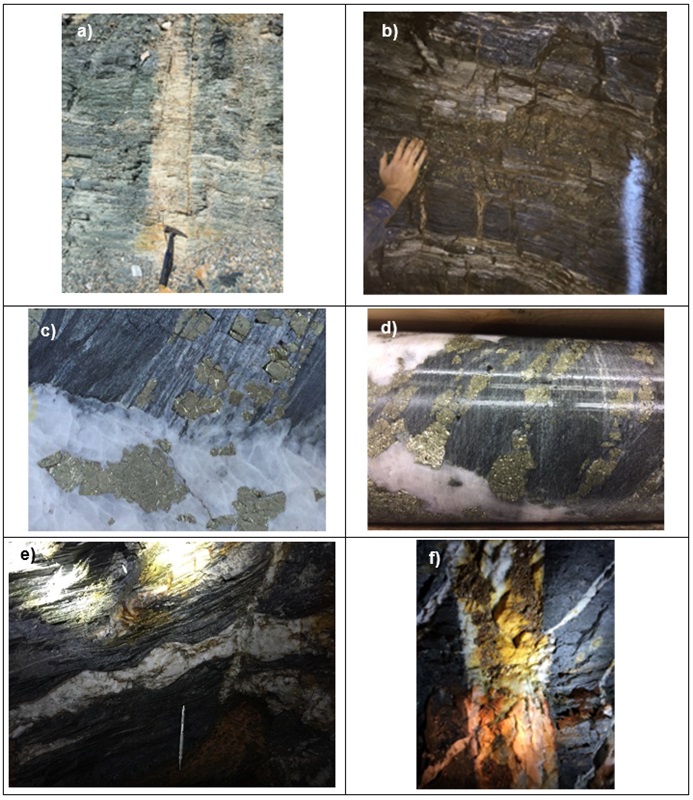
a) Vertical S3 structures bounding sericite-Fe-carbonate
alteration; b) Vertical AXPL veins acting as multiple feeders to sulphide replacement body; c) Diffuse AXPL vein boundary
with silica bleeding into replacement band; d) Outgrowths of pyrite from vein into carbonate replacement bands; e) Semi-vertical
AXPL vein cutting across boudinaged layer-parallel vein; f) Vertical AXPL vein cross-cutting oblique-dipping shear veins.
Figure 7-24: Mineralization
styles observed on the Cariboo Gold Project
| |
Osisko Development Corp.
NI 43-101 Technical Report
Feasibility Study for the Cariboo Gold Project |
|
| 7.5.3 | Vein-related Alteration |
A schematic illustrating the relationships between
mineralized quartz veins and their associated alteration halos as observed within the Project is presented in Figure 7-25. Large
veins tend to exhibit a strong silica alteration halo with associated vein halo pyrite (Figure 7-26). Stepping outward, moderate
silicification persists, accompanied by moderate sericite, with pyrite present only in trace amounts (Figure 7-26). A widespread
moderate silica envelope with patchy but intense silica closer to the veins is observed within high density vein corridors. Moving further
from the fluid source, silicification becomes weak and sericite is present as the dominant alteration mineral (Figure 7-26). The
distal-most alteration halo is characterized by iron carbonate and lesser sericite (Figure 7-26). Clay minerals (e.g., illite, smectite)
and chlorite may be presented as vein forming minerals outside of mineralized corridors (Figure 7-26).
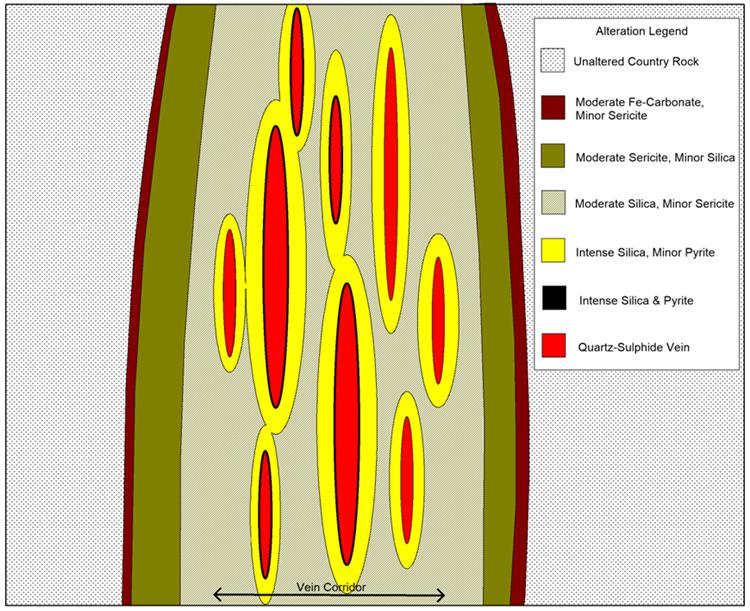
Figure 7-25: Schematic vertical section
(looking NE) of vein alteration observed at the Project
(Barkerville Gold Mines, 2018)
| |
Osisko Development Corp.
NI 43-101 Technical Report
Feasibility Study for the Cariboo Gold Project |
|
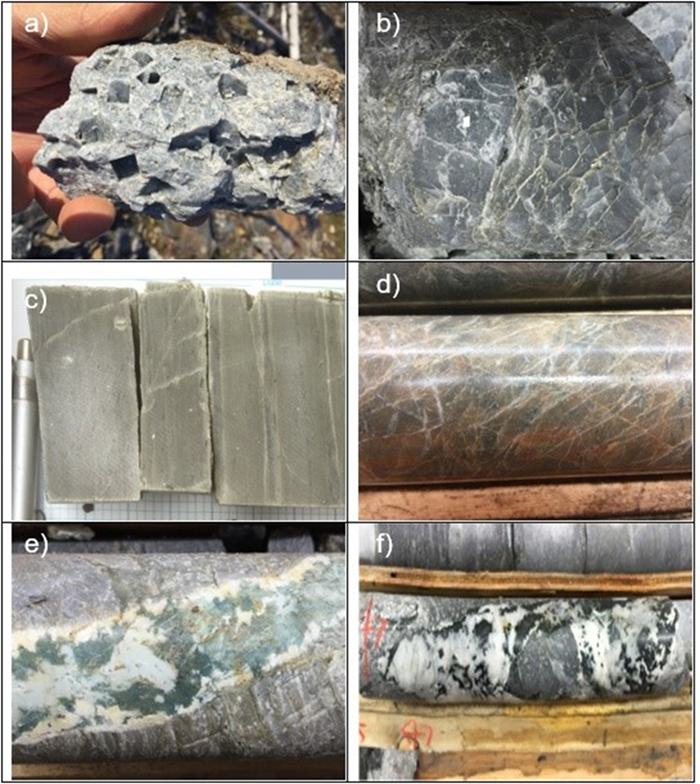
a) Intense silica alteration with boxwork textures
after pyrite in vein margin; b) Intense silica alteration with trace pyrite adjacent to vein margin; c) Moderate sericite
alteration distal from vein array; d) Iron carbonate alteration distal from vein array; e) Late argillic alteration
in vertical AXPL vein; f) Late chlorite alteration in vertical AXPL vein.
Figure 7-26: Vein-related alteration styles
at the Cariboo Gold Project
(Barkerville Gold Mines, 2018)
| |
Osisko Development Corp.
NI 43-101 Technical Report
Feasibility Study for the Cariboo Gold Project |
|
Age of mineralization in the Cariboo Gold District
is currently constrained to an approximate 20 Ma window straddling the Jurassic-Cretaceous boundary. 40Ar-39Ar
dates obtained from white mica in Au-bearing veins and replacement bodies by Rhys et al. (2009), Mortensen et. al. (2011) and Allan et
al. (2017) are presented in Figure 7-27).
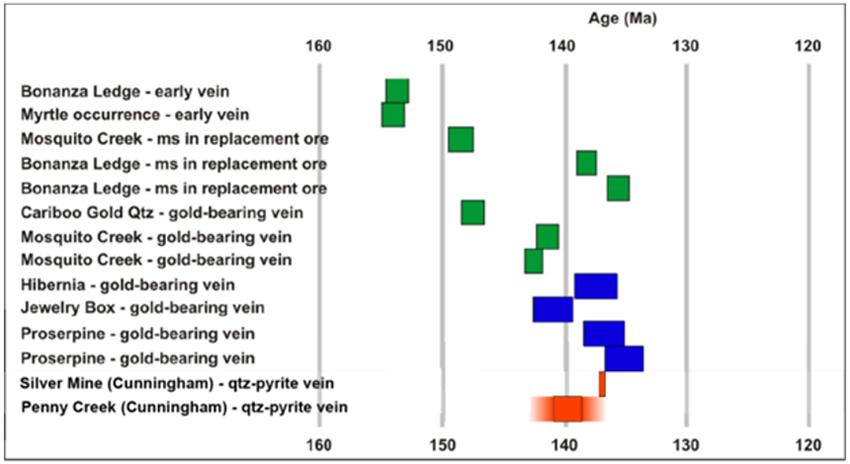
Figure 7-27: Compilation plot of 39Ar/40Ar
age data from white mica in veins
and replacement bodies in the Cariboo Gold
District
Green blocks: Rhys et al. (2009);
Blue blocks: Mortenson et al. (2011); Red blocks: Allan et al. (2017)
(Modified from Mortensen et. al., 2011)
| 7.7 | Summary of Mineralized Occurrences (MINFILEs) |
MINFILE contains geological, location and economic
information on more than 14,750 metallic, industrial mineral and coal mines, deposits and occurrences in British Columbia. This data
has been compiled and filtered geographically to form a table of all the showings, deposits, and past producers present within the Cariboo
Gold mineral tenure. The MINFILEs pertinent to the Cariboo Gold land package have been sorted by region then summarized focusing on the
physical aspects of the deposit or showing. It is beyond the scope and technical requirements of the Report to review all of this information.
The summary table of mineralized occurrences is presented in MINFILEs (InnovExplo, 2025b).
| |
Osisko Development Corp.
NI 43-101 Technical Report
Feasibility Study for the Cariboo Gold Project |
|
For
the purposes of this Report, Barkerville Gold Mines Ltd., as it operated from 2015 to 2021, will be referred to as Osisko Development
Corp (“ODV.”). The current management of ODV has been in place since 2015 and
on November 21, 2019, Osisko Gold Royalties acquired the Cariboo Gold Project through the acquisition of BGM. The Project was part
of the assets contributed by OGR that created ODV on November 25, 2020.
In addition, the Project, as described herein,
refers to the entirety of ODV’s land package in British Columbia. The information presented in this section was taken and modified
from Hardie et al. (2023). Other references are duly indicated where applicable.
| 8.1. | Orogenic Gold Deposits |
The Project shares many characteristics with an
orogenic gold deposit model (Chapman and Mortensen, 2016). This class of deposit is typified by deformed and metamorphosed mid-crustal
blocks and major structures, inherent products of orogenesis (Figure 8-1). Orogenic gold deposits span the entire breadth of the
province of British Columbia, occurring predominantly within two main trends. The westerly trend is associated with accreted pericratonic
terranes linked to Late Cretaceous to Paleocene movement on crustal-scale dextral strike-slip fault systems along the western margin of
the Stikine terrane, and eastern Coast Belt (e.g., Bralorne-Pioneer, Atlin, Cassiar). The easterly trend is crudely cospatial with the
Jurassic to Cretaceous accretion of the Intermontane terranes and autochthonous strata of the ancestral North American (e.g., Cariboo,
Sheep Creek) (Allan, 2017). Orogenic deposits have significant economic importance, as they are known to host auriferous mineralization
as high-grade vein deposits and low-grade bulk-tonnage lode deposits, and are intimately linked with substantial placer accumulations
(Goldfarb et al., 2001; 2005).
| |
Osisko Development Corp.
NI 43-101 Technical Report
Feasibility Study for the Cariboo Gold Project |
|
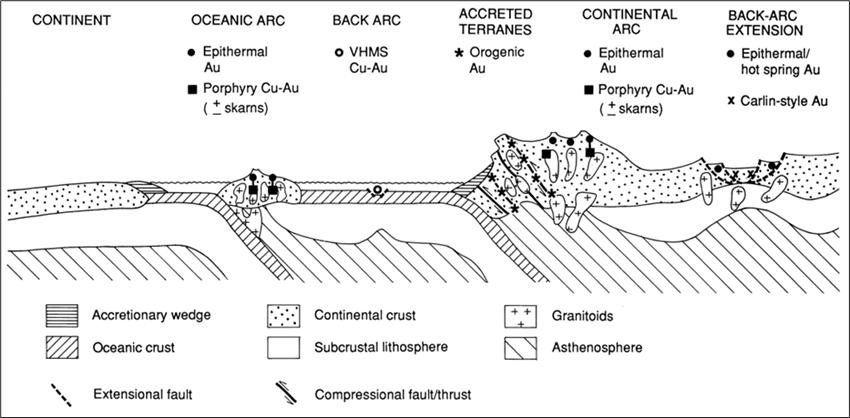
Figure 8-1:
Tectonic settings of gold-rich epigenetic mineral deposits
Orogenic gold deposits are emplaced during compressional
to transpressional regimes and throughout
much of the upper crust, in deformed accretionary
belts adjacent to continental magmatic arcs.
(Modified after Groves et al. 1998)
Most orogenic gold deposits in metamorphic terranes,
such as the Barkerville terrane, are found adjacent to first-order, deep-crustal fault zones, which show complex structural histories
and may extend along strike for hundreds of kilometres with widths of as much as a few thousand metres (Goldfarb et al., 2005). Most
orogenic gold deposits occur in greenschist facies rocks, but significant orebodies can be present in both lower and higher-grade rocks
(Phillips and Powell, 2010). Hydrothermal fluids are generated from metamorphic dehydration reactions along deep-crustal fault zones,
driven by episodes of major pressure fluctuations during seismic events (Cox, 2005). Gold mineralization is associated with orogenic
silica-carbonate-sericite-pyrite stable fluids moving along secondary permeability controlled by metamorphic fabrics, vein arrays, faults,
lithologic contacts, and rheological contrasts (Groves et al., 2003). Gold deposits form as simple to complex networks of gold-bearing,
laminated quartz-carbonate shear veins along second- and third-order faults, particularly at jogs or changes in strike along major deformation
zones. Mineralization styles vary from stockworks and breccias in shallow, brittle regimes, through laminated crack-seal veins and sigmoidal
vein arrays in brittle-ductile crustal regions, to replacement- and disseminated-type orebodies in deeper, ductile environments (Groves
et al., 2003).
| |
Osisko Development Corp.
NI 43-101 Technical Report
Feasibility Study for the Cariboo Gold Project |
|
Mineralization styles vary from stockworks and
breccias in shallow, brittle regimes, through laminated crack-seal veins and sigmoidal vein arrays in brittle-ductile crustal regions,
to replacement - and disseminated -type orebodies in deeper, ductile environments (Groves et al., 2003). Mineralization is syn- to late-deformation
and typically post-peak metamorphism, and commonly associated with silica-carbonate-sericite-pyrite alteration. Gold is largely confined
to the quartz-carbonate vein network but may also be present in significant amounts within iron-rich sulphidized wall-rock selvages, or
within silicified and sulphide-rich replacement zones (Dubé and Gosselin, 2007). One of the key structural factors for gold mineralization
emplacement is often a late strike-slip movement event that reactivates earlier-formed structures within the developing orogen (Goldfarb
et al., 2001). The following aims to highlight economically significant deposit types within the Project.
Inter-related vein systems are the principal source
of gold and silver within the Barkerville trend and are a key fluid pathway for sulphide mineralization. Axial planar quartz veins represent
the dominant vein system hosting gold-and-silver-rich sulphide mineralization in the Project’s most well-developed deposits and
regional prospects, namely the Mosquito Creek, Shaft, Valley, Cow Mountain, Lowhee, and KL Zone deposits. AXPL veins are classified as
such because they are believed to have exploited and/or contributed to the progressive opening of axial planar fracture systems in the
hinge zones of F3 folds. AXPL veins parallel the sub-vertical F3 axial planar disjunctive cleavage (S3) and are classifiable by a perpendicular
relationship with S1 foliation (Figure 8-2). See Section 7.4.3 for more information on F3 fractures and foliation.
| |
Osisko Development Corp.
NI 43-101 Technical Report
Feasibility Study for the Cariboo Gold Project |
|
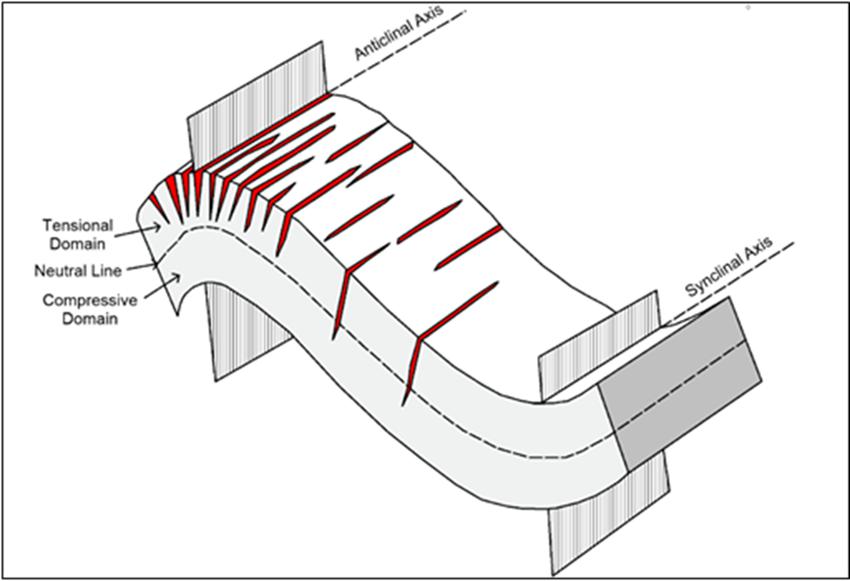
Figure 8-2:
Model for the formation of vertical AXPL veins in the hinges of F3 folds
on the Cariboo Gold Project (Harbort, 2017)
Extensional veins are classified by an orientation
oblique to S1-foliation (Figure 8-3). Significant scatter in both drill hole and surface datasets suggests that veins classified
as EXT may represent multiple variably oriented S1-oblique sub-populations. At least one population of EXT veins is parallel to the S2
cleavage and suggests veins classified as EXT may have exploited S2 surfaces.
| |
Osisko Development Corp.
NI 43-101 Technical Report
Feasibility Study for the Cariboo Gold Project |
|
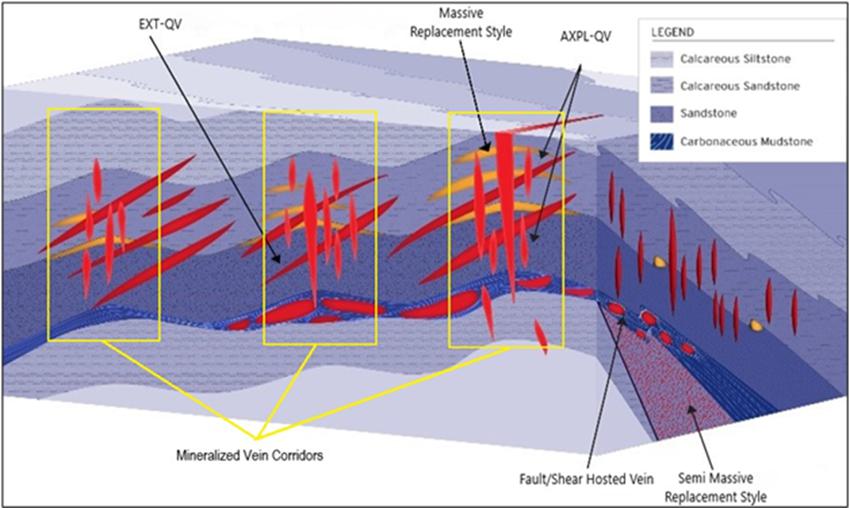
Figure 8-3:
Composite model of the mineralization styles on the Cariboo Gold Project
Illustrating oblique EXT quartz veins (dark
red), massive replacement style in the hinges of F2 folds (orange),
sub-vertical AXPL quartz veins along S3 surfaces
(light red), D2 related fault, shear-hosted vein (BC Vein),
and semi massive replacement (Bonanza Ledge).
(Modified after Harbort, 2017).
Veins range in width from millimetres to several
metres and are termed vein corridors when concentrated in zones that are 2 m or greater in thickness. Vein corridors are planar structures,
typified as steeply dipping, striking N020-N050, extending 100-700 m downdip, and extending 100-300 m along strike. The principal
aims of exploration and infill drilling programs involve testing the extent and concentrations of AXPL vein corridor deposits, with targeting
based in part on proximity to identifiable large-scale F3 hinge zones (Shaw and Prince, 2019).
| |
Osisko Development Corp.
NI 43-101 Technical Report
Feasibility Study for the Cariboo Gold Project |
|
| 8.1.2. | Replacement Deposits |
Replacement-style gold mineralization contains
the highest and most consistent gold grades at the Project and was the main target for the historic underground of Mosquito Creek Mine
on Island Mountain. Occasional elevated silver grades are also observed within replacement sulphide bodies at Cariboo. Semi-massive replacement
style mineralization observed at the historically mined Bonanza Ledge is fault-bounded in the footwall of the BC Vein shear. The
replacement deposits at Island Mountain and Mosquito Creek are thought to be structurally controlled in the hinges of F2 folds (Figure 8-4).
These rod-like structures, parallel to the axes of the F2 fold, act as conduits for hydrothermal fluids that react with the pH buffered
calcareous sediments. This reaction simultaneously creates pore space and precipitates gold-rich sulphides.
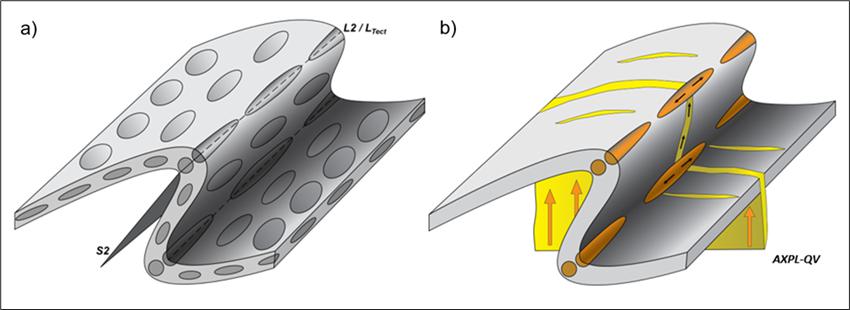
Figure 8-4:
a) Formation of structural traps in F2 hinges as L-Tectonites;
b) Replacement style mineralization (orange)
fed by AXPL quartz veins (yellow)
| 8.1.3. | Shear Zone Deposits |
Shear zone deposits are typified by the BC Vein
deposit that was mined on Barkerville Mountain from 2019 to 2022. These shear zones are commonly found within the Barkerville Trend and
can be spatially associated with vein deposits. These steep, orogen-parallel faults and damage zones can act as fluid pathways for crustal
fluids. The BC Vein is a poly-deformed, steeply-dipping, and S1 strike-parallel shear zone of unknown relative offset. The structure is
internally characterized by strongly carbonaceous to graphitic siltstone fault breccia, discontinuous pods of brecciated milky white quartz
and later stage grey quartz that has, in places, annealed the breccia matrix. Fine-grained pyrite and gold are associated with the annealing
late-stage grey quartz.
| |
Osisko Development Corp.
NI 43-101 Technical Report
Feasibility Study for the Cariboo Gold Project |
|
The Wells Shear is interpreted as the offset Cow
Mountain equivalent of BC Vein owing to its similar strike, deformational style, and position within tectonostratigraphic sequence. The
BC Vein-Wells Shear structure is highly variable in thickness both along strike and down dip. The close geographic association between
this structure and the locations of highest density axial planar veining as well as the highest gold grades in both soil and rock geochemical
assays is taken to reflect its importance as a fluid pathway at the time of mineralization.
The Proserpine Shear (Figure 7-13) is a poly-deformed,
steeply-dipping, and S1 strike-parallel shear zone. The Proserpine Shear structure is internally characterized by strongly carbonaceous
to graphitic siltstone fault breccia, discontinuous pods of brecciated milky white quartz and later stage grey quartz that has, in places,
annealed the breccia matrix. Fine-grained pyrite and gold are associated with the annealing late-stage grey quartz.
| |
Osisko Development Corp.
NI 43-101 Technical Report
Feasibility Study for the Cariboo Gold Project |
|
For the purposes of this Report, Barkerville Gold
Mines Ltd., as it operated from 2015 to 2021, will be referred to as Osisko Development Corp (“ODV”). The current ODV management
has been in place since 2015 and on November 21, 2019, Osisko Gold Royalties acquired the Cariboo Gold Project through the acquisition
of BGM. The Project was part of the OGR contributed assets that created ODV on November 25, 2020.
ODV carried out work on the Project yearly from
2015 to 2021 and recommenced in 2024. These programs consisted of geologic mapping, surface rock sampling, soil sampling, and underground
development. The field programs typically ran from April to October, depending on the weather, with the soil programs occurring towards
the middle of that period. Mapping and sampling efforts targeted the northwest and southeast extensions of the known mineralized corridor
in the Wells area, the Barkerville Trend, as well as a parallel trend, at Mount Burns (Lightning Creek Trend). The prospective regions
are displayed in Figure 9-1.
Proserpine, Cariboo Hudson Mine, Burns, and Yanks
are currently the most promising regional prospects within the Project claims (Figure 9-2).
Barkerville Trend Prospect
At 4.4-km strike length, the current MRE area
covers less than 10% of the Barkerville Trend (Figure 9-2). Fire assay and multielement data from surface geochemical sampling
programs (soils and rocks) conducted by ODV between 2016 and 2018 highlight anomalous gold and a favourable multi-element suite established
through baseline analyses of local ore geochemistry for an approximate 47 km-long strike length extending from NW Island Mountain (~3
km northeast of Mosquito Creek) SE to the area of the historic Cariboo Hudson Mine, approaching the SE extents of the CGP Mineral Tenure
(Shaw and Prince, 2019, Internal Report).
Proserpine
Geochemical data from 2016-2019 rock and soil
surface samples highlighted a 4-km (strike length) zone within the Barkerville Trend sandstone in the Proserpine prospect area. As a general
observation, mineralized veins within the Proserpine area are more commonly polymetallic than elsewhere along the Barkerville Trend. From
northwest to southeast, noteworthy surface assay hotspots coincide with several historic mining camps and claims; Victory, Wilkinson,
Warspite, and Bell-Independence.
| |
Osisko Development Corp.
NI 43-101 Technical Report
Feasibility Study for the Cariboo Gold Project |
|
Cariboo Hudson Mine Prospect
The Cariboo Hudson Mine area is located on Cunningham
Mountain. Mapping conducted in 2021 was coupled with available historic data from the Cariboo Hudson mine to define a series of gold-bearing
strike-parallel and strike-oblique shear veins that are priority drill targets.
Lightning Creek Trend
Historical workings (BC Minfile Database) and
anomalous gold in soil likewise define a 35 km-long prospective trend SE of and parallel to the Barkerville trend stretching from the
Mt. Nelson – Mt. Burns area along BC 26 in the NW to Yanks Peak in the SE. The Yanks Peak and Nelson-Burns prospect areas were covered
by several coupled geochemical (soil and rock) sampling and mapping campaigns conducted by ODV from 2018 to 2021. (Shaw and Prince, 2022
Internal Report.)
Mount Burns Prospect
Major geological mapping and geochemical samples
programs targeted Mount Burns from 2018 to 2021. The programs at Mount Burns Prospect were prioritized to cover areas surrounding historically
productive mine workings of particularly high concentration near its summit. Primary goals were to establish structural controls on mineralization
and follow up on gold anomalies identified within geochemical data collected over the course of the 2018 Regional soil sampling program.
High-grade vein samples overlap with strong gold soil anomalies around the historic Textbook and Lucky Cap showings.
Yanks Prospect
Major geological mapping and geochemical samples
programs targeted Yanks Peak in 2020 and 2021. The objective at Yanks Peak prospect was designed to expand upon the results derived from
the 2017 and 2018 geochemical survey completed by ODV.
| |
Osisko Development Corp.
NI 43-101 Technical Report
Feasibility Study for the Cariboo Gold Project |
|
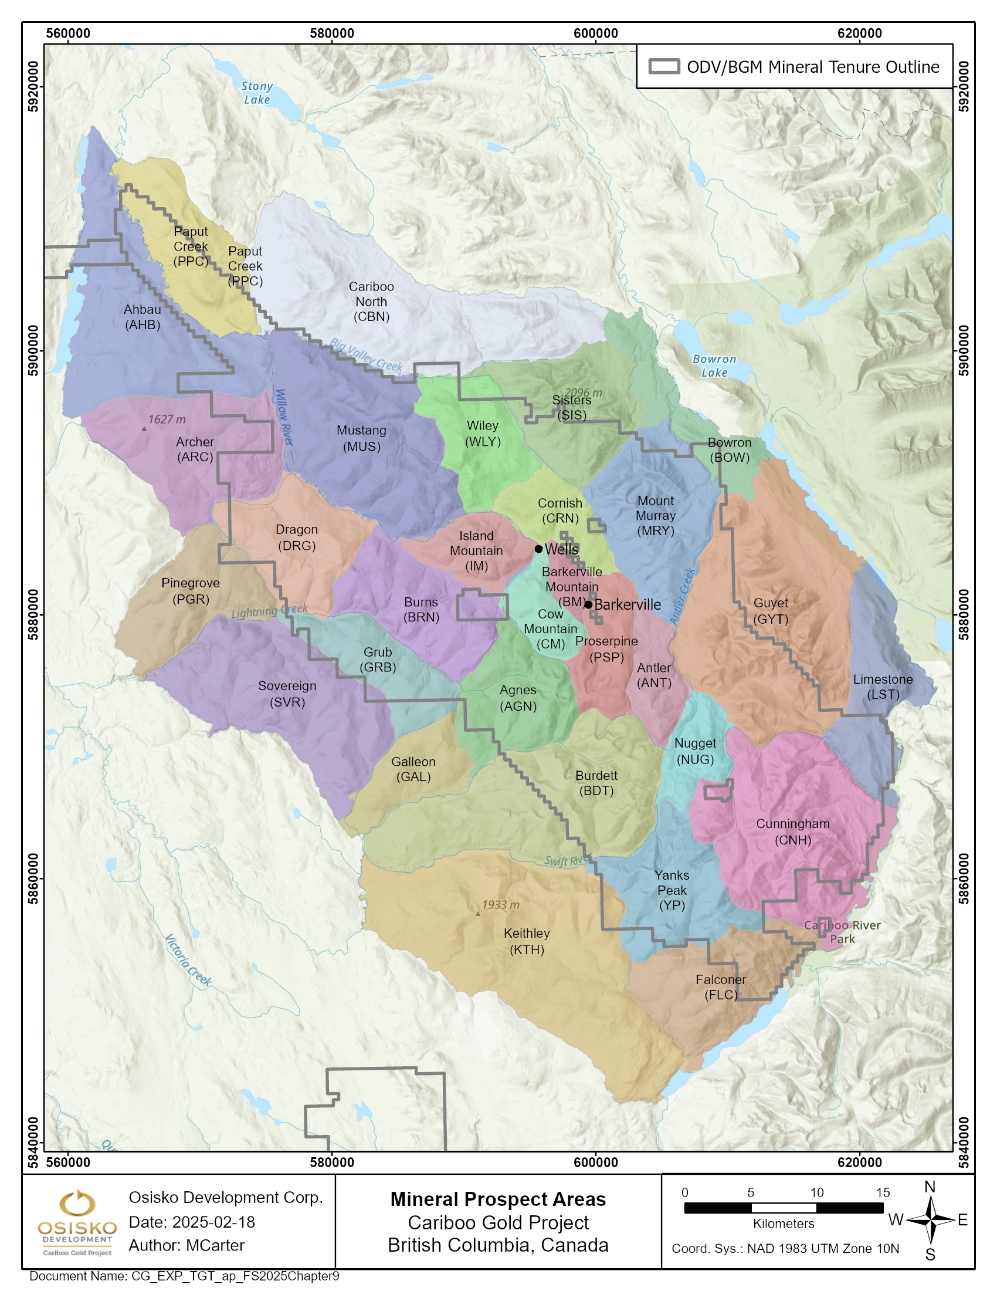
Note:
The grey colour delineates the boundary of the Cariboo claims. Prospective Regions are broken down with the associated name and
acronym.
Figure 9-1: Barkerville’s
mineral prospects of the Cariboo Region
| |
Osisko Development Corp.
NI 43-101 Technical Report
Feasibility Study for the Cariboo Gold Project |
|
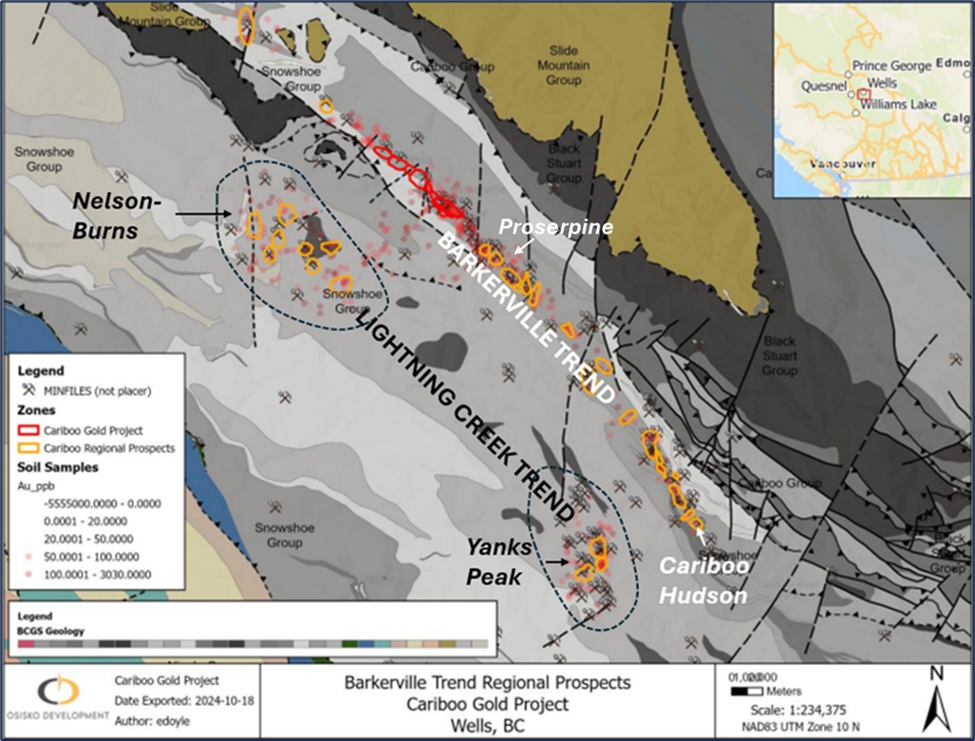
Figure 9-2: Barkerville
and Lightning Creek Trend showing BC Minfile prospects
| |
Osisko Development Corp.
NI 43-101 Technical Report
Feasibility Study for the Cariboo Gold Project |
|
| 9.1 | Program Purpose and Methodology |
Geological mapping, from 2015 to 2021, was conducted
to identify lithologic contacts, define alteration and geochemical signatures, record structural data and collect select rock samples.
The overall goal of these mapping programs was to define drill-ready regional targets by determining where drill holes should be placed
and the best direction to drill to target mineralized structures.
The scale of mapping was conducted at 1:2,000.
Mapping of an area was classified as complete when all roads, trails, and stream valleys were traversed. Rock samples were taken when
significant veining and/or sulphide mineralization occurred. These samples were sent to be fire assayed to provide gold-grade and multi-element
data to aid in future exploration programs.
Figure 9-3 shows the geological mapping
and rock sampling coverage across the property.
Soil sampling, from 2016 to 2021, was conducted
to identify gold-in-soil anomalies, which were then used to target prospective bedrock. Dutch augers were used to taking 500-g soil sample
from the B soil horizon. If the B horizon was not present, a C horizon sample was taken. If insufficient sample material was available,
a no sample (“NS”) point was marked and noted. Soil samples were collected every 50 m along north-south oriented lines
spaced 200 m apart. The sample lines were oriented to best test for gold mineralization hosted in quartz lenses oriented parallel
to stratigraphy and northeast-southwest trending quartz veins noted throughout the Cariboo Gold prospect. At any outcrop or historical
working site observed in the field, geologic information was collected, and a rock sample was taken if the material yielded possible mineralization.
Soil samples returned with gold (“Au”) values in the 90th percentile and above were considered anomalous. Anomalous samples
were used to guide further exploration.
Figure 9-4 shows the soil sampling coverage
across the property.
| 9.1.3 | Underground Development |
The Cow portal was completed in October 2021.
Official development started in January 2024 to reach the Lowhee Zone and extract a 10,000-t bulk sample of mineralized material. A roadheader
was used in conjunction with drilling and blasting techniques to excavate the ramp access at a profile of approximately 5.4 m wide by
5.8 m high. Geological information observed during the development of the ramp will aid in future development and exploration activities.
| |
Osisko Development Corp.
NI 43-101 Technical Report
Feasibility Study for the Cariboo Gold Project |
|
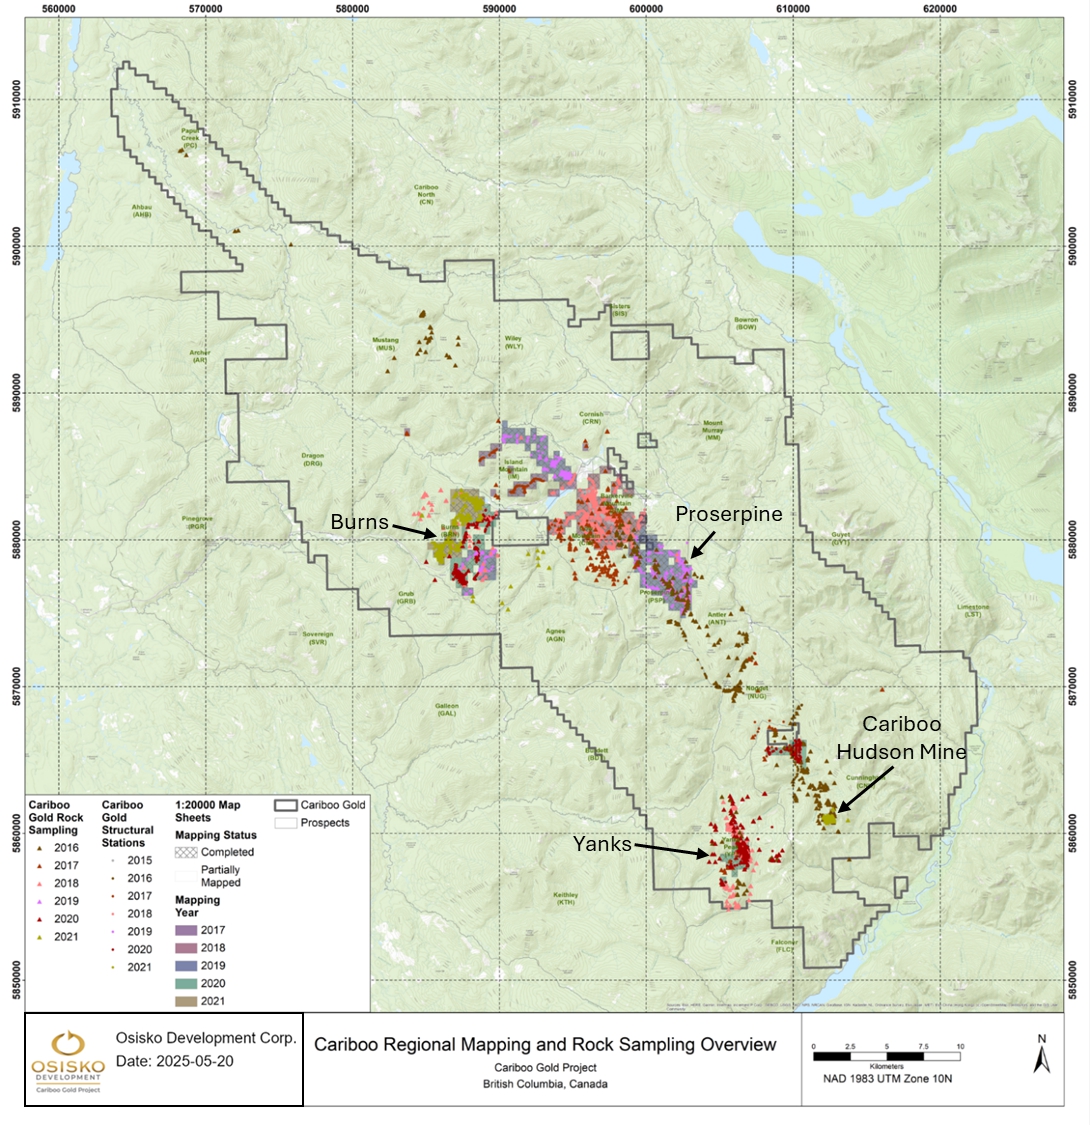
Figure 9-3: Cariboo
Regional mapping and rock sampling overview from 2015 to 2021
| |
Osisko Development Corp.
NI 43-101 Technical Report
Feasibility Study for the Cariboo Gold Project |
|
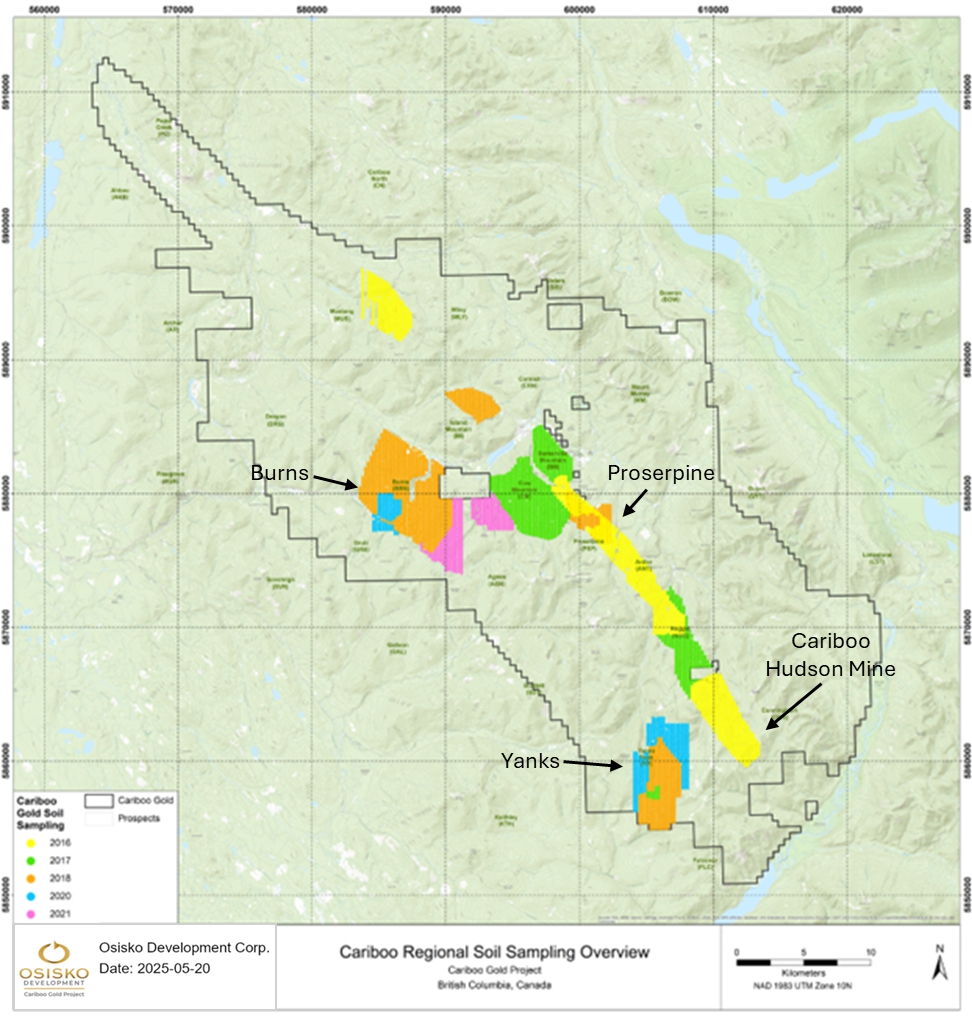
Figure 9-4: Cariboo
Regional soil sampling overview from 2016 to 2021
| |
Osisko Development Corp.
NI 43-101 Technical Report
Feasibility Study for the Cariboo Gold Project |
|
| 9.2 | Program
Objectives and Results |
For BGM and previous operators’ works prior
to 2015, refer to Chapter 6.
| 9.2.1 | 2015–2019 Geochemical and Mapping Programs |
From 2015 to 2019, ODV executed a systematic approach
with surface mapping and geochemical sampling. From 2015 to 2017, sampling efforts specifically targeted the Barkerville Trend, a major
deep-seated shear that trends 60 km northwest-southeast through the centre of the Project area. In 2018 and 2019, the focus shifted to
the northwest and southeast extensions of known mineralization around the Wells area within the Barkerville Trend. Further exploration
was conducted along the parallel Lightning Creek Trend. A summary of the samples collected from mapping and geochemical sampling is summarized
in Table 9-1. Results from these programs generated drill targets for past and current drilling.
Table 9-1: Surface
geochemical samples collected on the Cariboo Gold Project 2015-2019
| Year |
Rock
Samples (qty) |
Structural
Stations
(qty) |
Soil
Samples
(qty) |
| Grab |
Select |
Float |
Linear |
Channel |
Panel |
| 2015 |
- |
25 |
- |
- |
- |
111 |
1,875 |
- |
| 2016 |
81 |
75 |
1 |
17 |
341 |
50 |
704 |
4,928 |
| 2017 |
121 |
42 |
- |
10 |
11 |
- |
439 |
3,775 |
| 2018 |
108 |
182 |
25 |
8 |
26 |
4 |
4,961 |
6,307 |
| 2019 |
52 |
139 |
- |
1 |
- |
8 |
1,291 |
- |
| Total |
362 |
463 |
26 |
36 |
378 |
173 |
9,270 |
15,010 |
| 9.2.2 | 2016 Magnetic and VTEM Survey Program |
In 2016, a helicopter-borne Magnetic and VTEM
Survey was conducted by Geotech Ltd. over ODV’s Cariboo Gold Project. The principle geophysical sensors used were a VTEM Plus system
and a horizontal magnetic gradiometer with two caesium sensors. The sensors were tested daily to verify data integrity. The survey was
flown in southwest to northeast lines, spaced 200 m apart. A total of 7,024 line-km of data was acquired. The data was corrected
against a base station. The program resulted in 1,308 km2 of geophysical data that confirmed a northwest-southeast VTEM
anomaly associated with magnetic anomalies.
| |
Osisko Development Corp.
NI 43-101 Technical Report
Feasibility Study for the Cariboo Gold Project |
|
| 9.2.3 | 2020 Geochemical and Mapping Programs |
Geological surface mapping took place on the Burns
Mountain prospect from June 22 to August 4, 2020. Geochemical surveying coincided with mapping on the Yanks Peak prospect
from August 18 to September 10, 2020. The geochemical survey then moved to Burns Mountain from September 10 to 29, 2020. The objective
at Yanks Peak prospect was designed to expand upon the results derived from the 2017 and 2018 geochemical survey completed by ODV. The
grid at the Burns Mountain prospect was designed to infill a gap in the geochemical grid and expand to the south of Lightning Creek to
Chisholm Creek.
The 2020 geochemical sampling program was designed
to primarily test for soil geochemical signatures in an area known to host several mineral occurrences which lay within a quartzite dominant
lithology. A secondary objective was to collect stratigraphic and structural geologic information with emphasis on structural control
and the structural relation to mineralization on the properties. A total of 429 soil samples and seven rock samples were collected on
the Burns Mountain prospect; 1,187 soil samples and 56 rock samples were collected on the Yanks Peak prospect in 2020. These results are
summarized in Table 9-2.
The principal objectives of the 2020 mapping program
were to refine the understanding of local stratigraphy and structure, with emphasis on the structural controls on mineralization. Additionally,
another goal of the program was to delineate highly prospective target areas for future brownfields exploration and provide recommendations
for targeting methodology. The program consisted of detailed geologic mapping at a 1:2000 scale at the Burns Mountain, Yanks Peak and
Cunningham Creek prospects. A total of 43 rock samples were collected at the Burns Mountain prospect, 12 rock samples at the Cunningham
Creek prospect and 42 rock samples at the Yanks Peak prospect. The 2020 program collected an additional 3,060 structural measurements
at 905-point locations on the Burns Mountain prospect, 1,036 structural measurements at 341-point locations on the Cunningham Creek prospect,
and 2,318 structural measurements at 706-point locations on Yanks Peak prospect. The results from the mapping program are summarized in
Table 9-2. The anomalous gold-in-soil values, along with the data gleaned from the geologic mapping program on these prospects,
indicated stratigraphy and veining similar to those that are gold-bearing in the Wells-Barkerville area. Exploratory drilling in this
area is recommended in the future to test the area’s viability.
| |
Osisko Development Corp.
NI 43-101 Technical Report
Feasibility Study for the Cariboo Gold Project |
|
Table 9-2: 2020 Soil,
rock samples and structural station by prospect
| Prospect |
Soil
Samples |
Grab
Samples |
Select
Mineralized
Samples |
Panel
Samples |
Linear
Samples |
Channel
Samples |
Structural
Stations |
| Burns |
429 |
15 |
32 |
2 |
1 |
- |
905 |
| Cunningham |
- |
- |
12 |
- |
- |
- |
341 |
| Yanks Peak |
1,187 |
34 |
63 |
- |
- |
1 |
706 |
| Total |
1,616 |
49 |
107 |
2 |
1 |
1 |
1,952 |
| 9.2.4 | 2021 Geochemical and Mapping Programs |
Geological surface mapping took place on the Burns
Mountain prospect from June 1 to July 25, 2021, and September 18 to October 3, 2021, and on the Cunningham Creek
prospect from August 12 to October 21, 2021. The geochemical survey took place on the Burns Mountain, Cow Mountain, and Mount Agnes prospects
from June 26 to July 21, 2021, and July 25 to August 31, 2021.
The primary objective of the 2021 Soil program
was to connect the Burns Mountain and Yanks Peak soil sampling grids along the Lightning Creek Trend. A secondary objective was to begin
closing the gap in the soil data between Cow Mountain and Burns Prospects, following up on anomalies seen in the eastern portion of Burns
Mountain and western portion of Cow Mountain. In total, 651 soil samples were collected on the Burns Mountain prospect, 682 on the Mount
Agnes prospect and 20 on the Cow Mountain prospect areas. In addition, in 2021, the geochemical sampling team collected a total of eight
rock samples on the Mount Agnes prospect and eight on the Burns Mountain prospect. These results are summarized in Table 9-3.
The 2021 Geologic mapping programs principal aims were to delineate and provide detailed exploration strategies for greenfield-brownfield
exploration targets within both Burns Mountain and Cunningham Creek prospects. The focus of the mapping efforts in the Burns Mountain
area was on Mount Nelson and Oregon Gulch. The efforts on Mount Nelson were in following up on geochemical anomalies found in previous
years’ soil programs. Oregon Gulch has many historic showings that suggest mineralization in a style comparable to what ODV is targeting.
On the Cunningham Creek prospect mapping was focused on the historic Cariboo-Hudson Mine and along the trend of it. Detailed geologic
mapping was conducted at a 1:2000 scale. A total of 244 rock samples were collected on Burns Mountain, eight rock samples on Mount Agnes,
and 97 rock samples on the Cunningham Creek prospects. The 2021 mapping team collected an additional 3,509 structural measurements at
844-point locations on the Burns Mountain prospect, and 1,390 structural measurements at 407-point locations on the Cunningham Creek prospect.
These results are summarized in Table 9-3. The anomalous gold-in-soil values along with the data collected from the geologic
mapping program on both prospects indicated stratigraphy and veining similar to those which are gold-bearing in the Wells-Barkerville
area. Exploratory drilling in this area is recommended in the future to test the area’s viability.
| |
Osisko Development Corp.
NI 43-101 Technical Report
Feasibility Study for the Cariboo Gold Project |
|
Table 9-3: 2021 Soil,
rock samples and structural station by prospect
| Prospect |
Soil
Samples |
Grab
Samples |
Select
Mineralized
Samples |
Panel
Samples |
Linear
Samples |
Channel
Samples |
Structural
Stations |
| Agnes |
682 |
1 |
7 |
- |
- |
- |
- |
| Burns |
651 |
105 |
127 |
10 |
1 |
1 |
844 |
| Cunningham |
- |
41 |
51 |
1 |
1 |
3 |
407 |
| Cow Mountain |
20 |
- |
- |
- |
- |
- |
- |
| Total |
1,353 |
147 |
185 |
11 |
2 |
1 |
1,251 |
| 9.2.5 | 2024 Underground Development Program |
The objective of the 2024 underground development
program was to access the mineralization at the Lowhee deposit for the eventual extraction and analysis of a 10,000-t bulk sample, which
was permitted in 2021 under a mineral exploration (“MX”) permit MX-4-561.
The Cow portal construction was completed in Q4
2021. During Q1 2024, the Company commenced development of the underground ramp from the existing Cow portal into the Project's mineral
deposit at the Lowhee Zone. JDS Energy and Mining Inc. were contracted for the construction of the Cow portal and the subsequent development
of the ramp access and the Lowhee bulk sample.
All 1,172 m of linear development to reach the
target bulk sample area has been completed and the bulk sample stope of ~7,482 t was extracted, providing supporting information for geotechnical,
dilution, and potential stope sizes. A further ~150 m of development has advanced on the 1,260 elevation level, cross-cutting the
geological model with the objective of facilitating the collection of one or two additional bulk samples. Mapping and structural analysis
of the development has confirmed the local geological model. Data collection, analysis and interpretation from the bulk sample are pending
as of the effective date of the Report.
| |
Osisko Development Corp.
NI 43-101 Technical Report
Feasibility Study for the Cariboo Gold Project |
|
This chapter focuses mainly on ODV’s 2020,
2021 and 2022 diamond drilling programs (the “2020 Program”, “2021 Program”, “2022 Program” and “2023
Program”) and BGM’s 2015 to 2019 diamond drilling programs. Drilling prior to 2015 is summarized in Chapter 6. Meterage summaries
by prospect may differ from those reported in previous NI 43-101 reports, as drill holes have been re-assigned to prospects based
on the target deposit rather than their collar location.
The objectives for the 2020 and 2021 programs
were to test new brownfields targets adjacent to known deposits, infill high-grade vein corridors modelled from the 2019 PEA that were
classified as Inferred and explore the depth potential of known deposits. The primary focus of the 2022 Program was the infill of a proposed
underground bulk-sampling area, the continued category conversion from Inferred to Indicated status of modelled vein corridors, and the
delineation of additional vein corridors. The objective of the 2023 Programs was to provide geotechnical information along the proposed
underground development towards a bulk sample area to aid with safe and productive extraction methods. Figure 10-1 shows an overview
map of the 2015 through 2022 Programs.
From 2015 to 2022, BGM/ODV drilled a total of
2,280 diamond drill holes (“DDH”), totalling 695.08 km of drill core. While surface data continues to inform the geologic
model, diamond drill core is the primary source of geological information for the Cariboo Gold Project.
The current Mineral Resource Estimate update (the
“2025 FS MRE”) presented in Chapter 14, with an effective date of April 22, 2025, includes assay results from up to April
6, 2022. The potential impact on the 2025 FS MRE of the assay results received after this date is also commented below.
Drills are aligned using a Suunto compass. Drill
alignments are confirmed using Minnovare’s Azimuth Aligner (it was used for a part of the 2021 drilling campaign and all of the
2022 drilling campaign). For the 2023 Program, the drill rig was aligned by a geologist using a robotic total station. The downhole dip
and azimuth are surveyed using a REFLEX EZ-TRAC too. Collar locations are determined using a Trimble DGPS. The first survey was usually
measured 9 m below the casing, and readings were then taken every 30 m downhole. A survey was also taken at the bottom of the
hole if the end of hole (“EOH”) depth was 15 m or more from the previous test. The instrument was handled by the drilling
contractors, and survey information was digitally recorded using IMDEX’s IMDEXHUB-IQ, as well as transcribed and provided in paper
format to ODV geologists.
| |
Osisko Development Corp.
NI 43-101 Technical Report
Feasibility Study for the Cariboo Gold Project |
|
At the drill rig, the drill helpers placed the
core into core boxes and marked off every 3-m drill run using a labelled wooden block. The drill helpers were also responsible for marking
orientation information on the core using either the REFLEX ACT IIITM tool or the Devico DeviHead orientation tool. All holes
were drilled in NQ diameter unless noted otherwise in this Report.
All drill hole casings collared at an elevation
similar to Jack of Clubs Lake were cemented into bedrock. Special consideration was given to the Valley Zone due to the local groundwater
conditions, whereby a cementing procedure was deployed to ensure no groundwater would escape the drill hole once plugged: A first hole
was drilled through the overburden and cased (HWT size) 6 m to 9 m into competent bedrock. HQ drill rods were then drilled 1 m
beyond casing. Once the geologist and drill foreman inspected the rock to ensure the rock was competent bedrock, casing was reamed to
the bottom of the hole and cemented with the drill foreman present. A PQ displacement plug was then pushed downhole until cement came
up around the casing, leaving it to set. After at least 24 hours, 250 pounds per square inch (“psi”) of water pressure was
applied to the drill hole. If, during the pressure test, the pressure decreased and water was able to escape the cement, the drill hole
was either abandoned or recemented. If no issues were experienced during the pressure test, drilling would then commence, and this process
was repeated for any additional holes. Upon completion of the drill hole, a safety plug was placed 24 m past the shoe and the hole
cemented. The HQ drill rods were then removed, and a displacement plug was pumped down the hole. One additional batch of cement was then
pumped downhole, and a wait time of 45 minutes was observed, ensuring that no water was seen exiting the hole.
| 10.2 | Core Logging Procedures |
The drill core was transported to ODV’s
facility in Wells, BC where it was cleaned of drilling additives and mud, and the metres were marked before collecting data. Recovery
for each 3 m drill run was noted. When recovery was less than 2.5 m (>0.5 m of loss), loss was recorded on a separate block as a “lost
core interval”.
Geotechnical data collection included Rock Quality
Designation (“RQD”), Intact Rock Strength (“IRS”), and fracture counts at 1–3 m intervals. Magnetic susceptibility
data were not collected because it was concluded that such data are not relevant to the deposit. Downhole orientation lines were connected
where possible, and orientation off-set measurements were recorded.
All data (lithology, alteration, mineralization,
structures, interval structures, and veins less and greater than 5 cm) were recorded using Datamine DHLogger software. Sample intervals
and pertinent information regarding lithology, mineralization and alteration were marked on the core.
| |
Osisko Development Corp.
NI 43-101 Technical Report
Feasibility Study for the Cariboo Gold Project |
|
After recording the sampling information, drill
core samples were cut in half using a diamond-blade table mounted rock saw. Half the sample was bagged and labelled, then packaged for
shipment to an assay lab. Numbered security tags were applied to lab shipments for chain of custody requirements. Samples were then shipped
to the laboratory of ALS Minerals in North Vancouver, BC, for analysis. The remaining half-core samples are stored on-site in a secured
location for future reference.
The qualified persons have not identified drilling,
sampling, or recovery factors that could materially impact the accuracy and reliability of the results. In the opinion of the QPs, the
core logging and sampling procedures used by ODV are consistent with generally accepted industry best practices and are, therefore, adequate
for an advanced exploration project and use in this Feasibility Study.
| 10.3 | 2015 to 2019 Drilling |
2015 Drilling
In 2015, drilling was focused on Barkerville Mountain
(Figure 10-6) with 180 holes drilled on the BC Vein and Bonanza Ledge deposit, totalling 35,848.5 m; eight drill holes on
the KL Zone totalling 1,675 m, and 12 dill holes on the Barkerville Mountain deposit totalling 3,626.7 m. The 2015 diamond drill
program was designed to drill the BC Vein structure at a spacing of 25 m to 50 m to a depth of 250 m from surface, and
a spacing of 100 m down to a depth of 450 m below surface (Brousseau et al., 2017).
2016 Drilling
In 2016, drilling on Barkerville Mountain
(Figure 10-6) consisted of 53 holes on the BC Vein and Bonanza Ledge deposit, totalling 8,605.5 m, and 10 holes on the
KL Zone deposit, totalling 2,621.18 m. The BC Vein area was drilled to infill high-grade areas at 12.5 m to 25 m
spacing (Brousseau et al., 2017) while the KL Zone was drilled to test an 800 m-long gold-in-soil (“Au-in soil”) anomaly
(Beausoleil and Pelletier, 2018). Cow Mountain drilling produced 233 drill holes on the Cow prospect, and drill holes on the Valley
Zone prospect, totalling 31,157.07 m and 1,023.5 m, respectively. The Cow Mountain drilling program (Figure 10-4)
was designed to upgrade areas of geological uncertainty as well as constrain the geological model in areas devoid of historical
drilling on Cow Mountain. It also focused on confirming historical gold intersections using modern drilling techniques. The 2016
campaign tested depths of approximately 300 m. Drill holes were completed on approximately 50 m centres in selected areas
(Beausoleil and Pelletier, 2018). Drilling in the Valley Zone tested the lateral extents of AP veins and refined the stratigraphic
model. Results showed denser than expected vein occurrences. As a result, three more rigs were added to the program and collar
locations were stepped out to expand the intersected vein corridors (Beausoleil and Pelletier, 2018). On Island Mountain, 33 holes
were drilled on the Shaft Zone prospect, and 50 holes on the Mosquito Creek prospect, totalling 11,289.5 m and
16,026.75 m, respectively. Drilling on Island Mountain (Figure 10-2) was conducted in order to understand the
structural and lithological controls on gold mineralization, as well as to test the down-plunge extent of sulphide replacement
zones.
| |
Osisko Development Corp.
NI 43-101 Technical Report
Feasibility Study for the Cariboo Gold Project |
|
2017 Drilling
In 2017, drilling was again conducted on Barkerville
Mountain (BC Vein and Bonanza Ledge, KL Zone, and Barkerville Mountain deposits), Cow Mountain (Cow and Valley Zone deposits), and
Island Mountain (Shaft Zone and Mosquito Creek deposits) (Figure 10-6, Figure 10-4, and Figure 10-2, respectively).
Barkerville Mountain drilling produced 25 holes at BC Vein, seven at Bonanza Ledge, and one drill hole at KL Zone, totalling 4,412.7 m,
3,388 m, and 530.15 m, respectively. It should be noted that the diamond drill holes on the BC Vein of Barkerville Mountain
were drilled for geotechnical purposes only and were therefore not assayed or included in the resource estimate database (Beausoleil and
Pelletier, 2018). The 2017 drilling program on Barkerville Mountain explored the Au-in-soil anomaly adjacent to the KL Zone, investigating
the 2016 identified targets. Cow Mountain had a total of 17 drill holes at the Cow prospect, and 80 drill holes at the Valley Zone
prospect, totalling 6,034.7 m, and 38,872.96 m, respectively. Cow Mountain drilling continued the goals of the 2016 drilling
program. Island Mountain had a total of 211 holes at the Shaft Zone prospect, and 44 dill holes at the Mosquito Creek prospect, totalling
93,733.12 m and 13,455.7 m, respectively. Drilling on Island Mountain during 2017 was primarily designed to define the extent
of recently discovered vein systems and to discover new vein corridors and sulphide replacement. Early in the program, holes were drilled
on 100 m drill centres with dice-five infill patterns concentrated in the Shaft Zone. As the geologic understanding of the controls
on mineralization improved, a tighter infill of approximately 25 m spacing began in August to expand known corridors (Beausoleil
and Pelletier, 2018).
2018 Drilling
In 2018, drilling was conducted on Barkerville
Mountain (BC Vein and Bonanza Ledge deposits), Cow Mountain (Cow and Valley Zone deposits), and Island Mountain (Shaft Zone and Mosquito
Creek deposits) (Figure 10-6, Figure 10-4, and Figure 10-2, respectively). Barkerville Mountain had a total
of ten drill holes on the BC Vein and Bonanza Ledge deposits totalling 1,683.8 m. The aim of the 2018 Program at Barkerville Mountain
was to provide infill data on the BC Vein. In addition, the program expanded upon data collected in 2017 and also targeted vein mineralization
concentrated within the hanging wall of the BC Vein.
| |
Osisko Development Corp.
NI 43-101 Technical Report
Feasibility Study for the Cariboo Gold Project |
|
Cow Mountain had a total of 246 drill holes on
the Cow prospect, and two drill holes on the Valley Zone prospect, totalling 67,715.05 m and 401.9 m, respectively. The aim of the 2018
Program at Cow Mountain was to infill and expand the high-grade gold-bearing vein corridors (Beausoleil and Pelletier, 2018). Drilling
on Island Mountain produced 168 drill holes on the Shaft Zone prospect, and 20 drill holes on the Mosquito Creek prospect, totalling 53,731.29
m and 4,597 m, respectively. The 2018 Program at Island Mountain focused on targets generated by underground mapping and sampling data,
as well as historical data compiled from smaller scale mapping, trenching, soil sampling and drilling programs. The program aimed to demonstrate
continuity and expand on known mineralized vein corridors. Infill drilling was designed to intercept modelled vein corridors with a 25
m spacing at depth in order to convert Inferred resources to the Indicated category (Beausoleil et al., 2019).
Also, in 2018, in addition to the main Project
claim group detailed above, Grouse Creek had a total of 14 drill holes, totalling 4,903.2 m (Figure 10-8). The aim of the drilling
program was to identify the potential source of an Au-in-soil anomaly and subsequent gold rich placer deposits in the Discovery Claim
and Shy Robin Gulch. (Filgate, 2018).
2019 Drilling
In 2019, drilling was conducted on Barkerville
Mountain (BC Vein and Bonanza Ledge, KL Zone, Williams Creek, and Lowhee Zone deposits), Cow Mountain (Cow prospect), and Island Mountain
(Shaft Zone, Mosquito Creek, and Willow prospects) (Figure 10-6, Figure 10-4, and Figure 10-2, respectively).
Barkerville Mountain had a total of 36 drill holes on the BC Vein and Bonanza Ledge deposit, 73 on the KL Zone, four on Williams Creek,
and 24 holes on the Lowhee Zone, totalling 7,974.2 m, 31,974.62 m, 1,572 m, and 8,422 m, respectively. The 2019 Program
on Barkerville Mountain focused on exploration for mineralized vein corridors analogous to those on Cow Mountain and Island Mountain within
the prospective sandstone unit, with drilling on BC Vein to increase confidence in the block model (Beausoleil et al., 2019). Cow Mountain
had a total of 72 drill holes on the Cow prospect, totalling 16,136.6 m and was primarily focused on infill drilling and testing
down dip extents of mineralized vein corridors. Island Mountain had a total of 26 drill holes on the Shaft Zone prospect, 15 on the Mosquito
Creek prospect, and six on the Willow prospect, totalling 12,032.45 m, 8,258.89 m, and 3,078.9 m, respectively. The objective
of the 2019 Program on Island Mountain was to infill high-grade areas currently classified as Inferred on the Mosquito and Shaft Zones
and to test the strike and depth extent of the mineralized vein corridors. Exploration to the northwest of Mosquito Creek also occurred
on what is known as the Willow Target, an Au-in-soil geochemical anomaly identified from 2018 soil sampling (Beausoleil et al., 2019).
Additionally, the Proserpine property had a total of six holes drilled, totalling 2,676.25 m (Figure 10-8 and Figure 10-9).
This program was aimed at testing Au-in-soil anomalies and historical gold occurrences, as well as historical underground workings.
| |
Osisko Development Corp.
NI 43-101 Technical Report
Feasibility Study for the Cariboo Gold Project |
|
| 10.4 | 2020 Drilling Program |
The 2020 drilling program (the “2020 Program”)
was conducted between January 16, 2020, and December 14, 2020, by Smithers, B.C. based Hy-Tech Drilling Ltd. (“Hy-Tech”) and
its primary focus was delineating the Cow-Island-Barkerville corridor. A total of 57,078.8 m was drilled in 196 surface holes, as summarized
in Table 10-1. The objective of this program was to delineate mineralized vein corridors further within all deposits and intercept
veins with a 25 m spacing from previously drilled holes to support conversion of Inferred resources to the Indicated category.
Table 10-1: Summary
of BGM’s 2020 Drilling Program
| Deposit |
Number
of Drill Holes |
Metres
Drilled |
| BC Vein and Bonanza Ledge |
3 |
560.60 |
| Lowhee Zone |
24 |
10,144.50 |
| Cow Mountain |
48 |
12,596.05 |
| Valley Zone |
56 |
17,558.85 |
| Shaft Zone |
15 |
3,909.00 |
| Mosquito Creek |
50 |
9,392.40 |
| Proserpine |
5 |
2,917.40 |
| Total |
201 |
57,078.80 |
The 2020 Program at Island Mountain focused on
Shaft Zone with 3,909 m drilled in 15 holes and Mosquito Creek, totalling 9,392.4 m drilled in 50 holes (Figure 10-2), further
supporting the category conversion work from Inferred to Indicated status within known vein corridors.
The 2020 Program at Cow Mountain (Figure 10-4)
was primarily focused in the Valley Zone to continue support category conversion work and expand known mineralized vein corridors, with
a total of 12,596.05 m drilled in 56 holes. Target vein corridors are being drilled from surface to a maximum vertical depth of 600 m.
Additional infill drilling on Cow Mountain was conducted (Figure 10-4), furthering supporting category conversion on known vein
corridors (Inferred to Indicated) and exploring the down-dip extent of selected targets. The targeted vein corridors were drilled from
surface to a maximum vertical depth of 350 m with a 25 m intercept spacing at depth. A total of 12,596.05 m was drilled in 48 holes.
A bulk core sampling program to test the feasibility
of the mineral sorter was conducted during the 2020 and 2021 drill program on both Cow Mountain and Island Mountain, totalling 168 m and
513 m, respectively. A total of 2,000 kg of material was collected. Samples were selected based on modelled vein corridors hosting
grades inferred to be representative of the overall deposit.
| |
Osisko Development Corp.
NI 43-101 Technical Report
Feasibility Study for the Cariboo Gold Project |
|
Selected samples were then shipped to Société
Générale de Surveillance (“SGS”) for metallurgical analysis.
The aim of the 2020 Program at Barkerville Mountain
(Figure 10-6) was to provide infill data on the BC Vein and to further define the Lowhee Zone prospect.
BC Vein drilling, totalling 560.6 m in three holes,
improved block model confidence and further delineated the deposit. Drilling at the Lowhee Zone targeted mineralized vein corridors within
the prospective sandstone unit analogous to those on Cow Mountain and Island Mountain. The targeted vein corridors were drilled from surface
to a maximum vertical depth of 370 m with a 25 m intercept spacing at depth. A total of 10,144.5 m was drilled in 24 holes.
The intersections were visually compared in 3D
to the mineralized zones 3D solids and interpolated block grades of the 2020 MRE.
Overall, visual inspection of the 2020 drilling
results demonstrated that the thickness and the grade of the mineralized zones were in the same order of magnitude as the 2020 MRE.
The 2020 drilling continued to confirm the geological and grade continuities that were demonstrated in the 2020 MRE (Beausoleil et al.,
2019).
In addition, 2020 also saw drilling on the Proserpine
prospect (Figure 10-8 and Figure 10-9), with five drill holes totalling 2,917.4 m. The program consisted of one
stratigraphic drill hole and four holes drilled orthogonal to known surface mineralization within the Proserpine prospect from September
13, 2020, to November 16, 2020. The objective of the stratigraphic hole was to constrain stratigraphy, understand F2 relationships, and
target strike parallel shear structures, while the objective of the remaining holes was to explore for northeast-southwest-striking, axial
planar oriented vein structures, and to support estimation of an Inferred resource by stepping out from 2019 drilling (Yao and Doyle,
2020).
| |
Osisko Development Corp.
NI 43-101 Technical Report
Feasibility Study for the Cariboo Gold Project |
|
| 10.5 | 2021 Drilling Program |
Table 10-2:
Summary of BGM’s 2021 Drilling Program
| Deposit |
Number
of Drill Holes |
Metres
Drilled |
| Lowhee Zone |
95 |
29,860.9 |
| Cow Zone |
6 |
1,988.5 |
| Valley Zone |
108 |
47,484.92 |
| Shaft Zone |
162 |
60,990.8 |
| Mosquito Creek |
42 |
10,710.65 |
| Total |
413 |
151,035.77 |
The 2021 drilling program (the “2021 Program”)
was conducted by Hy-Tech between January 4, 2021, and October 20, 2021. The 2021 Program also saw the addition of Paycore Drilling (“Paycore”),
based in Valemount, British Columbia, between August 18, 2021, and October 16, 2021.
The 2021 Program at Island Mountain focused on
Shaft Zone with 60,990.8 m drilled in 162 holes, and Mosquito Creek totalling 10,710.65 m drilled in 42 holes (Figure 10-2 and
Figure 10-3), further continuing the category conversion work from Inferred to Indicated status within known vein corridors.
The 2021 Program at Cow Mountain (Figure 10-4
and Figure 10-5) was primarily focused in the Valley Zone to continue category conversion work and expand known mineralized vein
corridors with a total of 47,484.92 m drilled in 108 holes. Minor drilling on Cow Mountain was conducted, totalling 1,988.5 m
drilled in six holes (Figure 10-4). The purpose of this drilling was to conduct metallurgical testing of modelled vein corridors.
The 2021 Program at Lowhee Zone (Figure 10-6
and Figure 10-7) continued to define the prospect, targeting mineralized vein corridors within the prospective sandstone unit
analogous to those on Cow Mountain and Island Mountain. A total of 29,860.9 m was drilled in 95 holes. Drill hole spacing along the modelled
vein corridors was kept to a distance of 25 m.
| |
Osisko Development Corp.
NI 43-101 Technical Report
Feasibility Study for the Cariboo Gold Project |
|
| 10.6 | 2022 Drilling Program |
Table 10-3: Summary of BGM’s
2022 Drilling Program
| Deposit |
Number
of Drill Holes |
Metres
Drilled |
| Lowhee Zone |
27 |
6,563.9 |
| Total |
27 |
6,563.9 |
The 2022 drilling program (the “2022 Program”)
was conducted by Hy-Tech at the Lowhee Zone on Barkerville Mountain (Figure 10-6 and Figure 10-7). The 2022 Program
started on March 25, 2022, and was completed on of July 6, 2022.
The focus of the 2022 Program at the Lowhee Zone
was the infill of a proposed underground bulk-sampling area, continued support for category conversion from Inferred to Indicated status
of modelled vein corridors, and the delineation of additional vein corridors.
| 10.7 | 2023 Drilling Program |
Table 10-4: Summary of BGM’s
2022 Drilling Program
| Deposit |
Number
of Drill Holes |
Metres
Drilled |
| Lowhee Zone |
2 |
640.05 |
| Total |
2 |
640.05 |
The 2023 geotechnical drilling program (the “2023
Program”) was conducted by Hy-Tech at the Cow portal on Barkerville Mountain (Figure 10-6 and Figure 10-10). The
2023 Program started on October 7, 2023, and was completed on October 20, 2023.
The focus of the 2023 Program at the Lowhee Zone
consisted of geotechnical drilling parallel to planned underground development that would lead towards a planned bulk sample location
in the Lowhee Zone Deposit. The core was logged for lithology, alteration, mineralization, oriented structures, and geotechnical logging
to calculate RQD and RMR89. LECO analysis was completed at the Quesnel River (“QR”) Mine assay lab.
The Cow portal geotechnical drill holes enabled
the identification of faults, rock mass designation testing, lithologic contacts, rock mass abrasiveness, and metal leaching and acid
rock drainage (“MLARD”) hazards, to aid in the planning for underground development towards the Lowhee Zone bulk sample.
| |
Osisko Development Corp.
NI 43-101 Technical Report
Feasibility Study for the Cariboo Gold Project |
|
| 10.8 | QP Comments on 2015-2022 Drilling |
The QPs have reviewed the 2015-2022 drill data
and are of the opinion that the drilling and data was collected using best practices for use in the Mineral Resource Estimate.
| 10.9 | QP Comments on Post-2022 Drilling |
Assay results from 27 drill holes were received
after April 6, 2022, representing 6,563.9 m of assays, and, as such, are excluded from the 2025 FS MRE. Overall, the visual inspection
of the 2022 drilling results demonstrated that the thickness and the grade of the mineralized zones are in the same order of magnitude
as the 2025 FS MRE. The 2022 drilling continued to confirm the geological and grade continuities that were demonstrated in the 2025 FS
MRE.
For the purpose of this Report, the QP is of the
opinion that the gains and the losses would balance each other, and the resulting difference would not be material to the overall MRE.
According to the drilling results in the extension of the known mineralized zones and with the discovery of new zones, there is a potential
to increase the mineral resources.
| |
Osisko Development Corp.
NI 43-101 Technical Report
Feasibility Study for the Cariboo Gold Project |
|
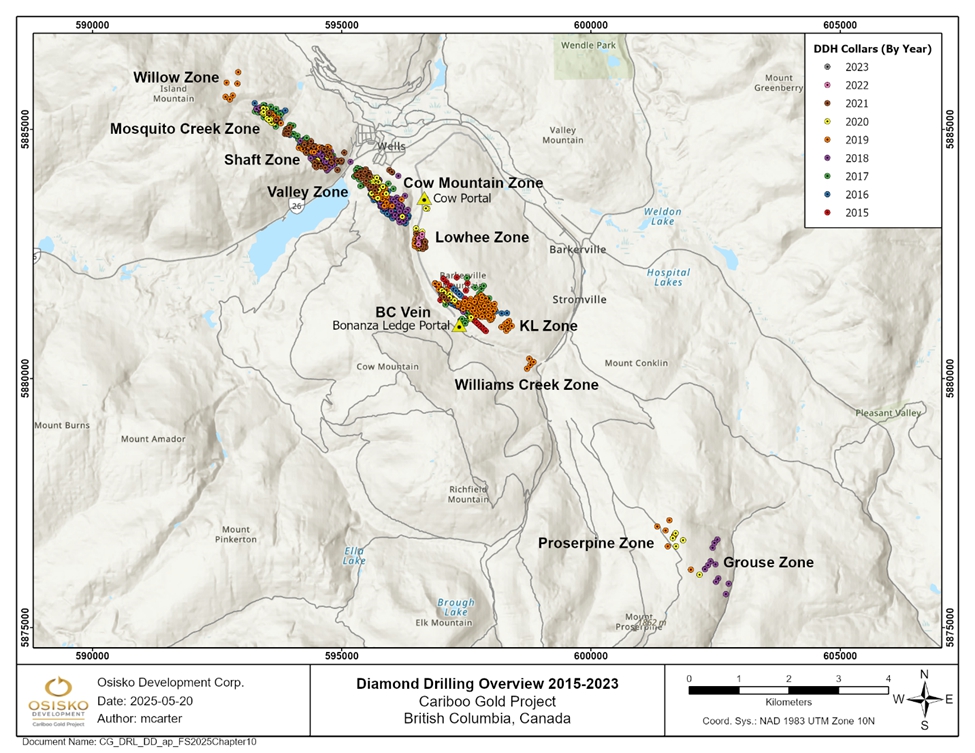
Figure 10-1: Cariboo
Gold Project Diamond Drilling Program Overview
| |
Osisko Development Corp.
NI 43-101 Technical Report
Feasibility Study for the Cariboo Gold Project |
|
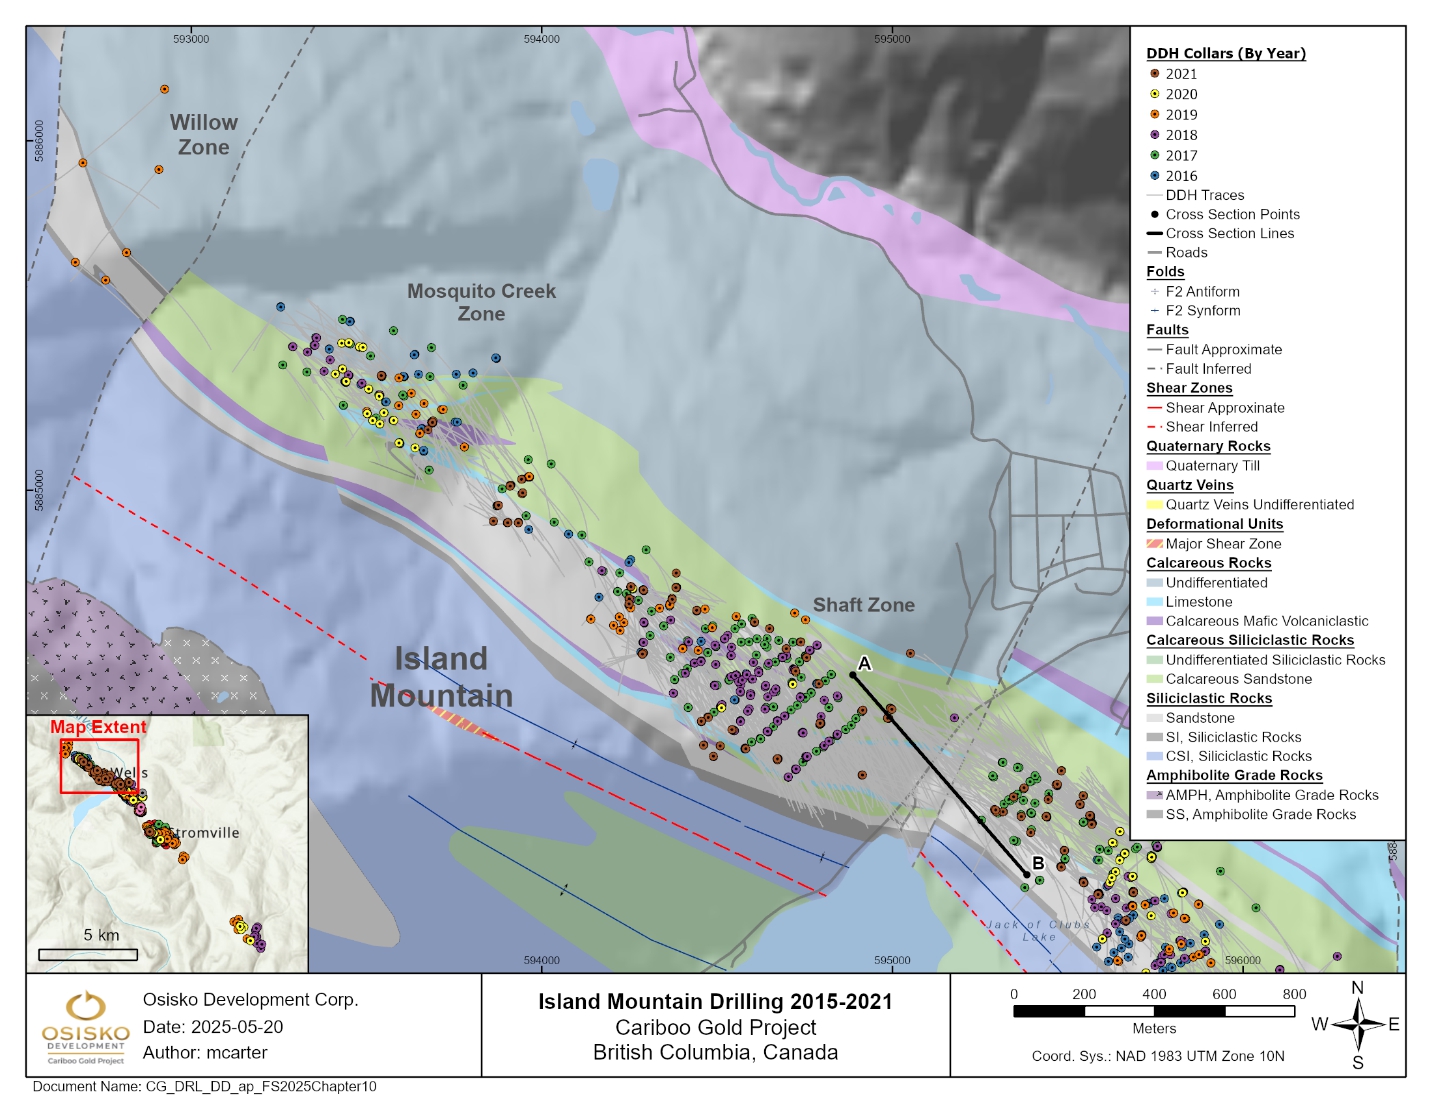
Figure 10-2: Island
Mountain Drilling Program 2015–2021
| |
Osisko Development Corp.
NI 43-101 Technical Report
Feasibility Study for the Cariboo Gold Project |
|
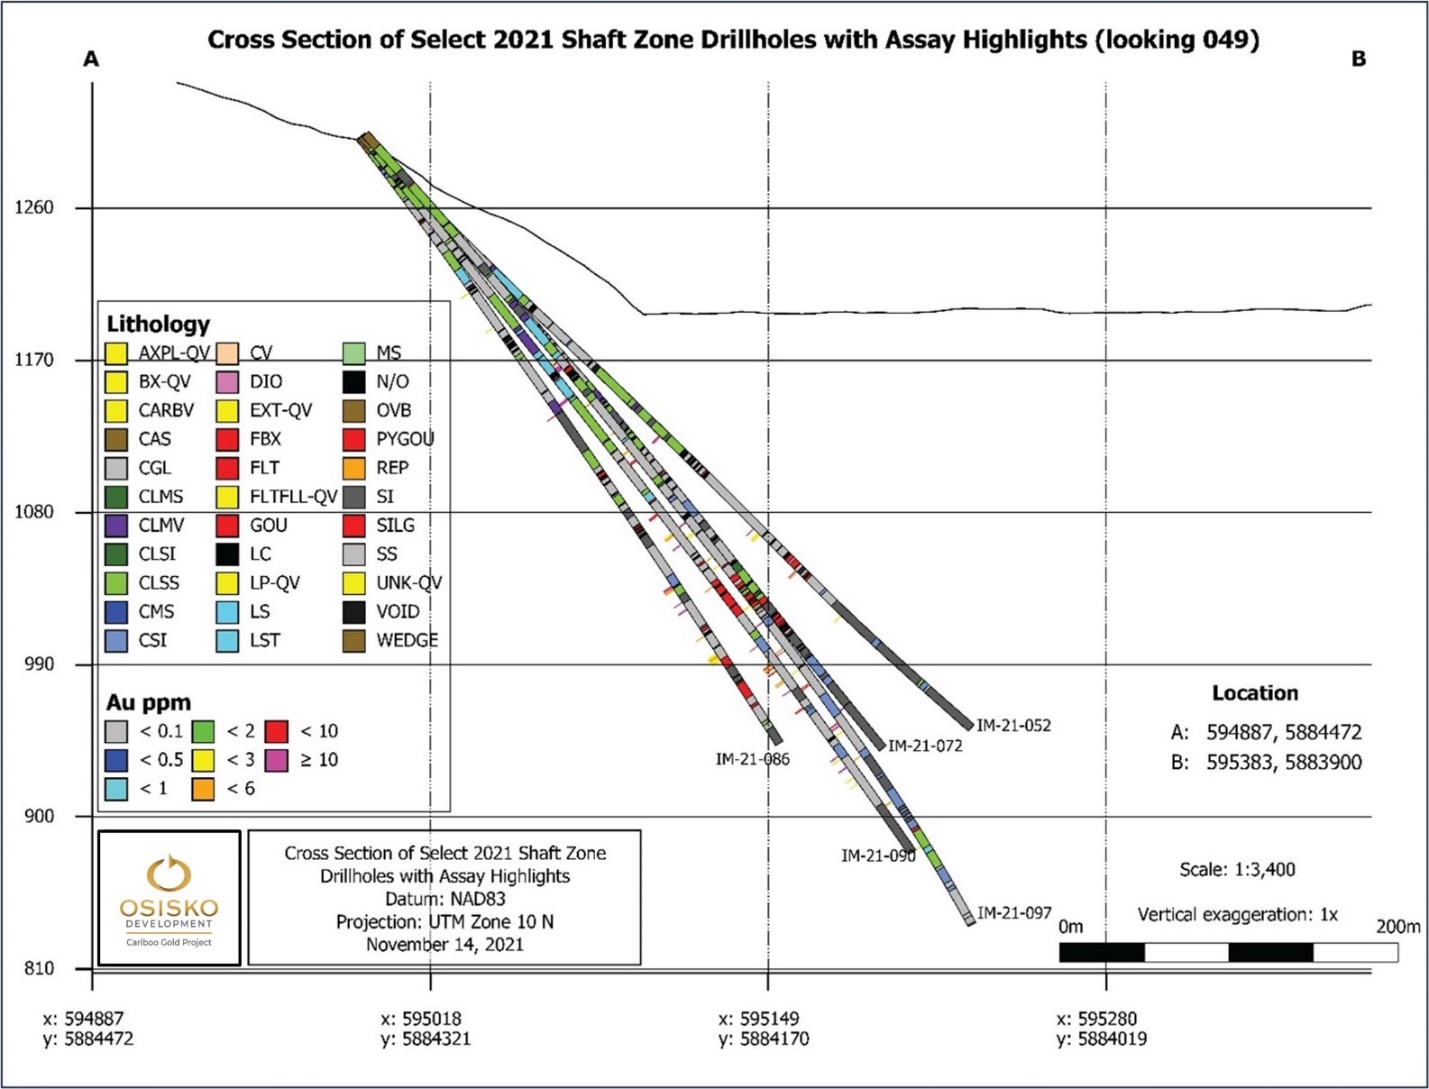
Figure 10-3: Cross-section
of Shaft Zone diamond drill holes with gold assay highlights
| |
Osisko Development Corp.
NI 43-101 Technical Report
Feasibility Study for the Cariboo Gold Project |
|
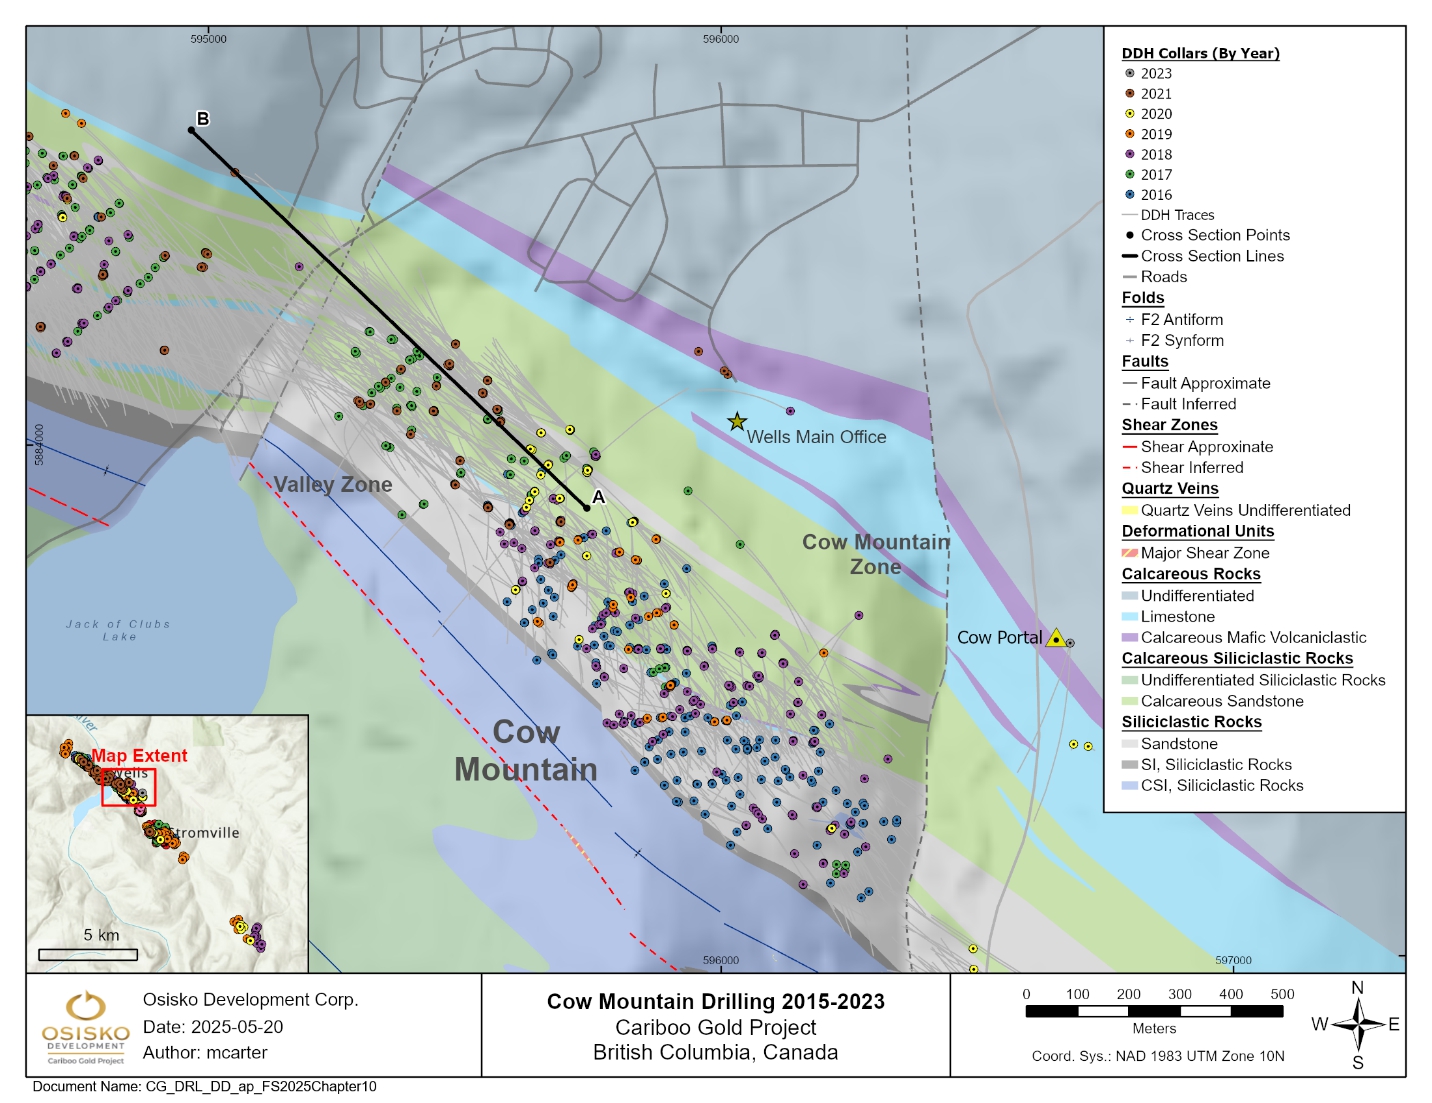
Figure 10-4: Cow
Mountain Drilling Program 2015–2021
| |
Osisko Development Corp.
NI 43-101 Technical Report
Feasibility Study for the Cariboo Gold Project |
|
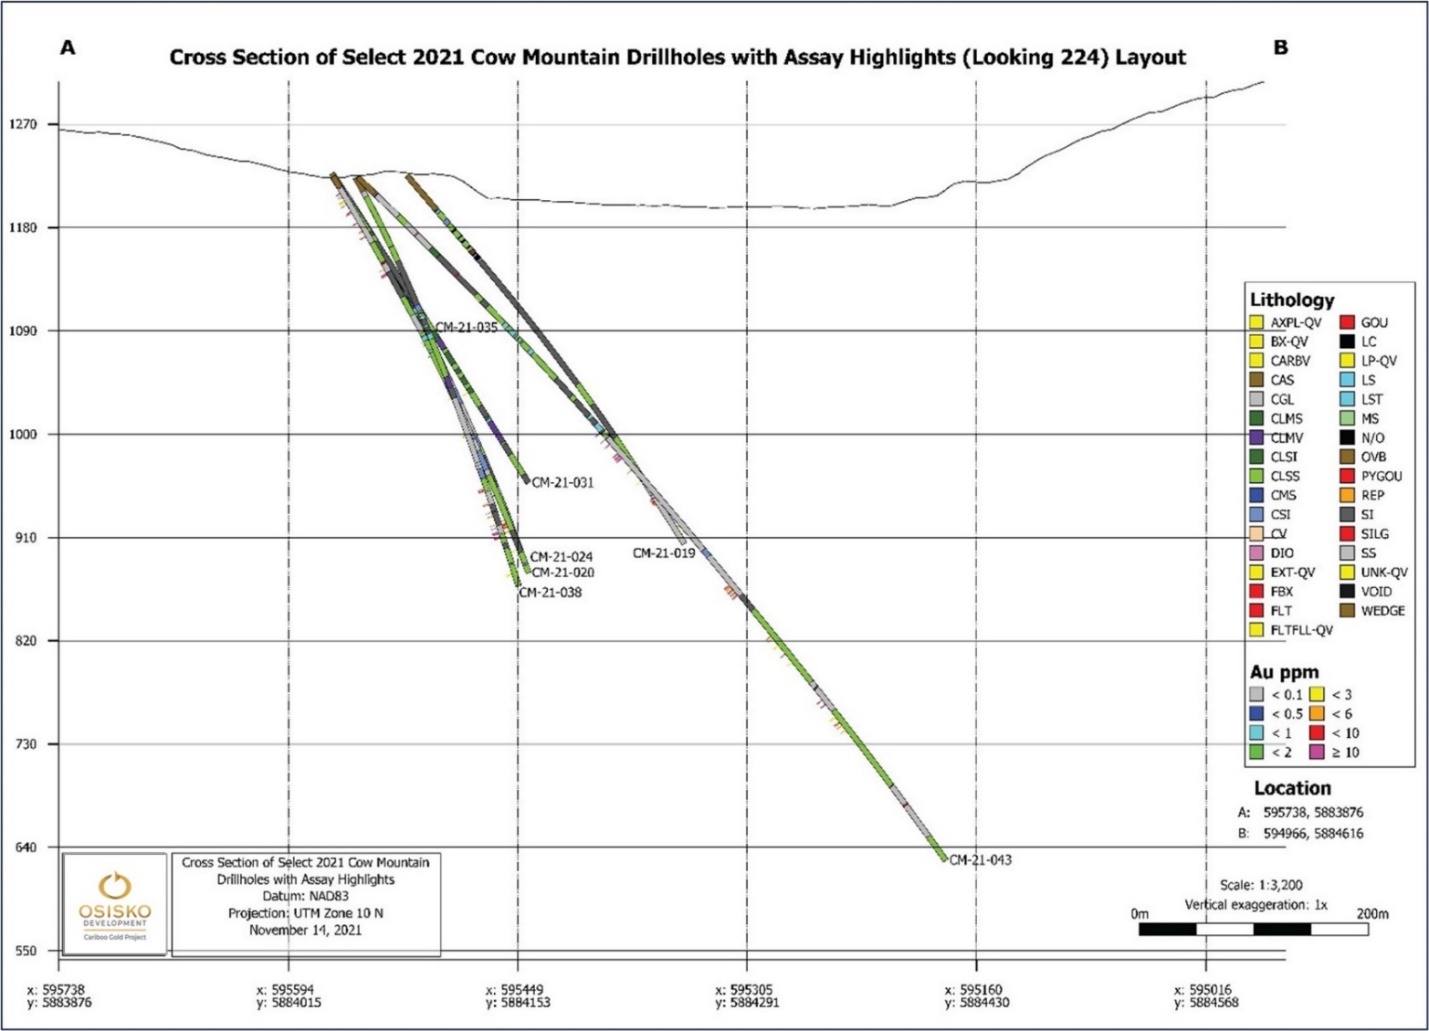
Figure 10-5: Cross-section
of Cow Mountain diamond drill holes with gold assay highlights
| |
Osisko Development Corp.
NI 43-101 Technical Report
Feasibility Study for the Cariboo Gold Project |
|

Figure 10-6: Barkerville
Mountain Drilling Program 2015–2022
| |
Osisko Development Corp.
NI 43-101 Technical Report
Feasibility Study for the Cariboo Gold Project |
|
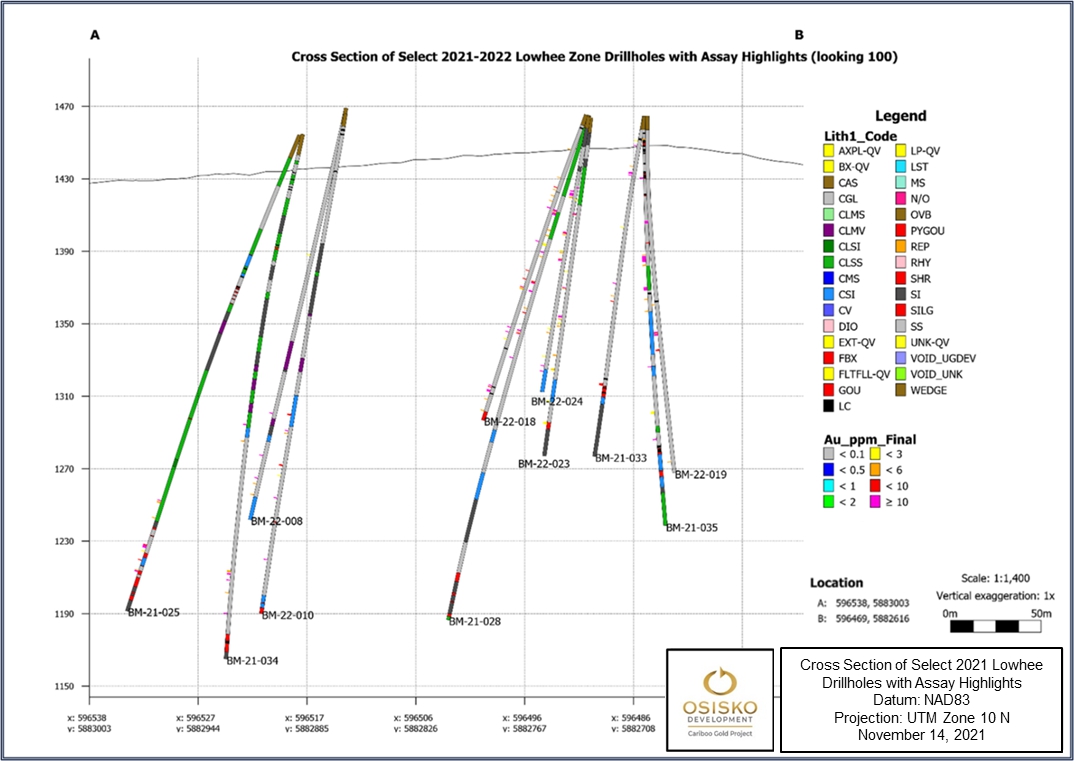
Figure 10-7: Cross-section
of Barkerville Mountain diamond drill holes
with gold assay highlights
| |
Osisko Development Corp.
NI 43-101 Technical Report
Feasibility Study for the Cariboo Gold Project |
|
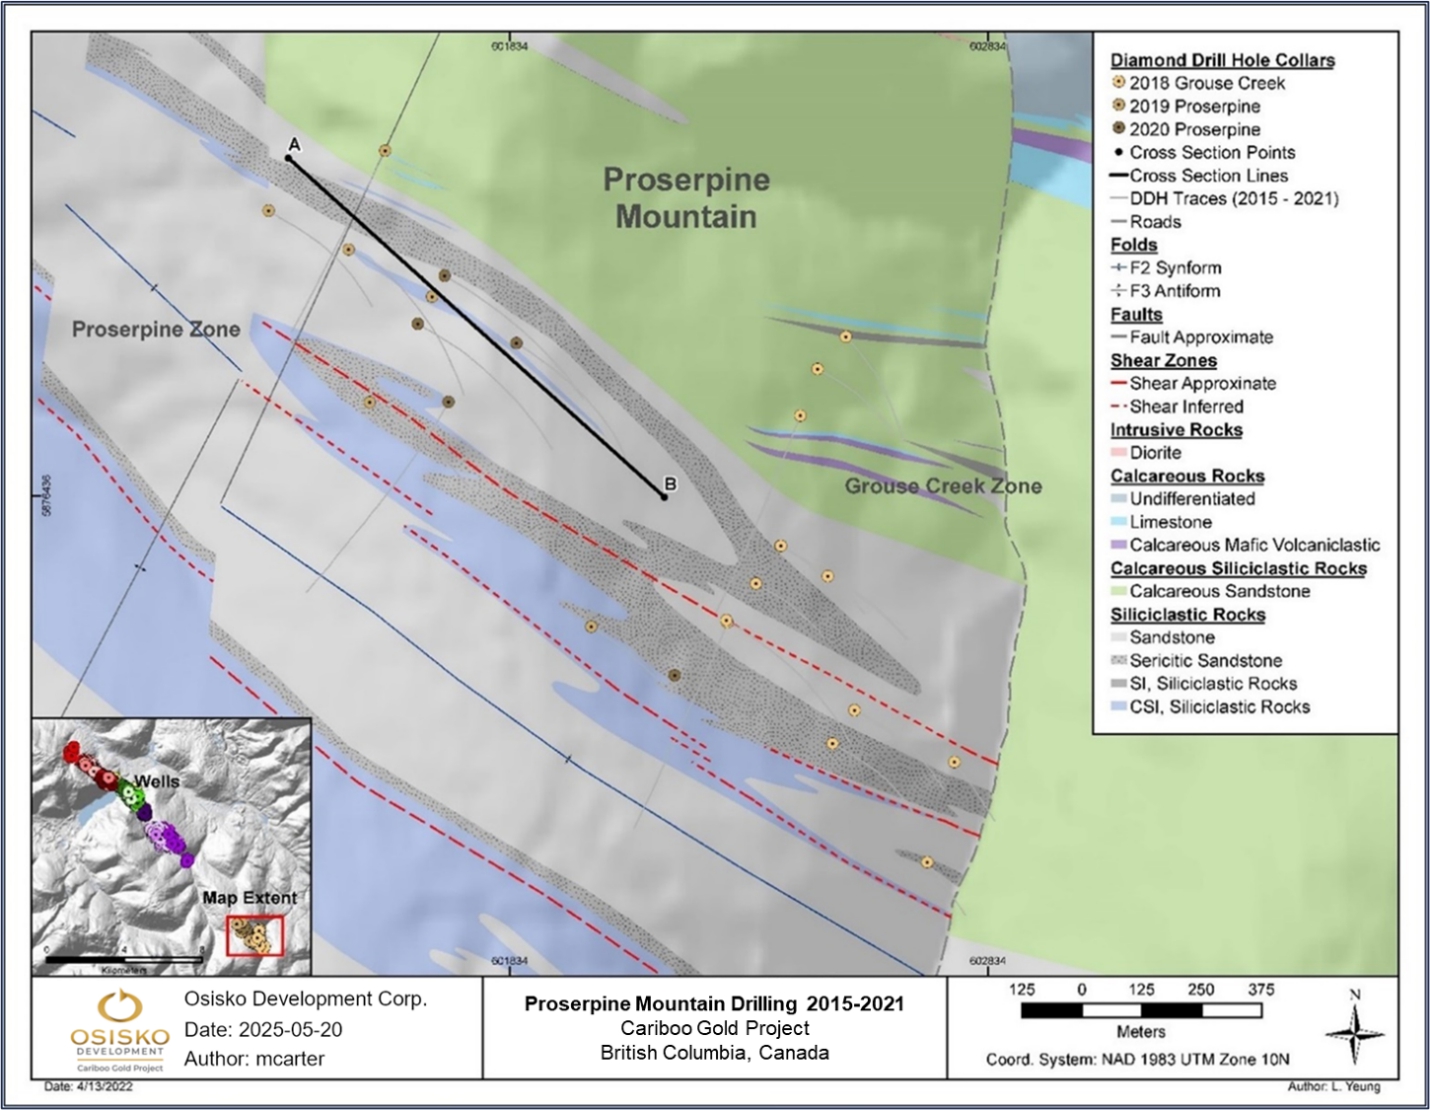
Figure 10-8: Proserpine
Mountain Drill Program 2015–2021
| |
Osisko Development Corp.
NI 43-101 Technical Report
Feasibility Study for the Cariboo Gold Project |
|
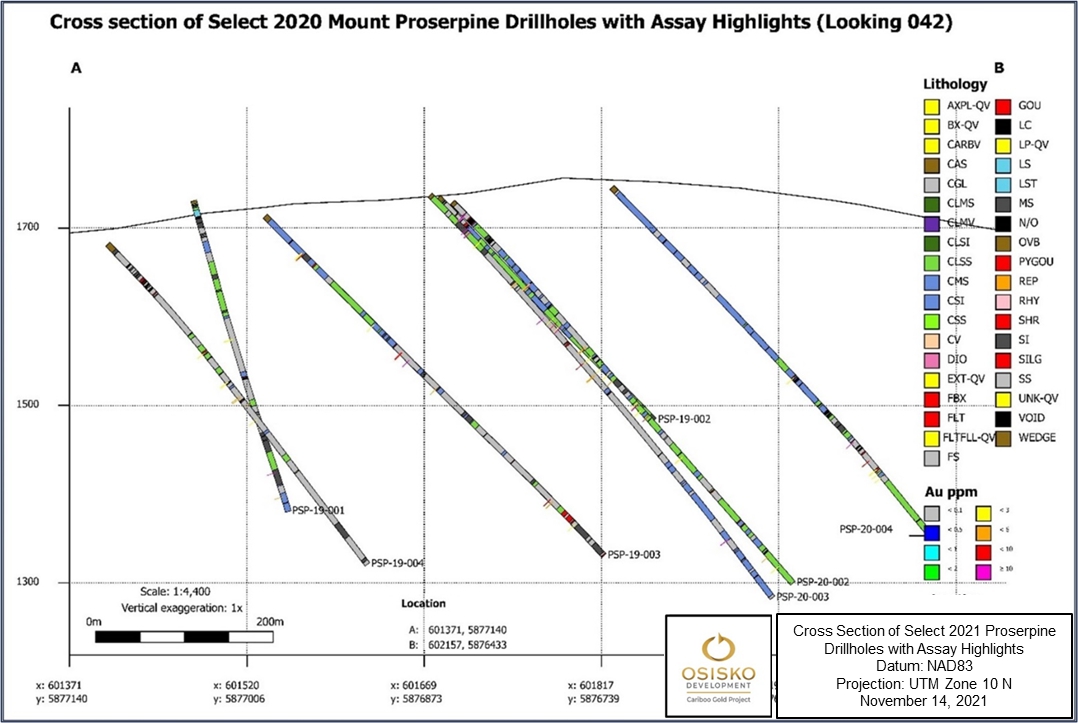
Figure 10-9: Cross-section
of Proserpine Mountain diamond drill holes
with gold assay highlights
| |
Osisko Development Corp.
NI 43-101 Technical Report
Feasibility Study for the Cariboo Gold Project |
|
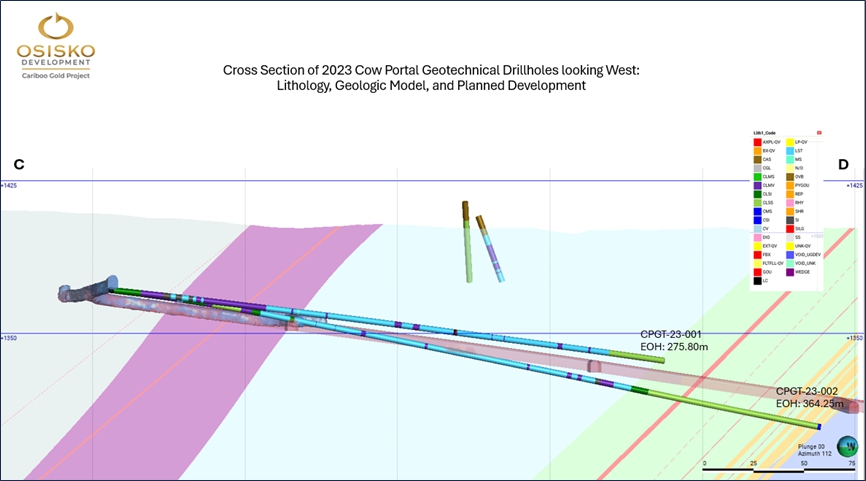
Figure 10-10: Cross-section
of Cow portal geotechnical drill holes with lithology
| |
Osisko Development Corp.
NI 43-101 Technical Report
Feasibility Study for the Cariboo Gold Project |
|
| 11. | Sample Preparation, Analyses, and Security |
This chapter describes the sample preparation,
analysis, and security procedures for the 2020 and 2021 diamond drill holes programs (“2020 and 2021 Programs”) included in
the current resource estimate. The QP reviewed the quality assurance/quality control (“QA/QC”) procedures and results completed
only for gold assay results. The reader is referred to Beausoleil and Pelletier (2020) for details of the 2019 drilling program, to Beausoleil
and Pelletier (2019) for details of the 2018 drilling program, and to Beausoleil and Pelletier (2018) for the 2016 and 2017 programs.
| 11.1 | Core Handling, Sampling, and Security |
Core handling, sampling, and security procedures
are managed by ODV personnel. The procedures are described in detail below.
The drill core is placed into wooden core boxes
at the drill site with the end of each drill run marked with a small wooden block displaying the depth of the hole. Box labels indicate
the hole and box numbers. The boxes are racked and covered at the drill, secured with ratchet straps, and then transported daily from
the drill site to ODV’s core storage and logging facility in the District of Wells, British Columbia. The boxes are labelled in
permanent marker with the hole and box number (e.g., GR-15-01 Bx 1). The core is transported by truck during the drilling programs. There
are two secure core storage areas, one in Wells near the core logging facility and a second is located near the Ballarat Camp, approximately
5 km east of Wells.
Upon receiving a load of core from the drill crew,
the core is brought into the logging room. Meterage blocks are checked for errors, the core is oriented in the box and cleaned, and the
metre marks are drawn on the core before logging begins. The geological and geotechnical core logging data is collected with Datamine’s
DHLogger software.
The
sample intervals are between 0.5 m and 1.5 m in length and do not cross geological contacts. A line is drawn with a pencil
along the length of the core to indicate where the core will be sawed. Each sampling ticket is divided into three tags. One tag is stapled
to the core box at the beginning of the interval to record the drill hole number and sample interval recorded. The second tag is placed
in the sample bag, which is sent to the laboratory; this tag does not reference the drill hole or meterage. The last tag remains in the
sample ticket book with the hole number and recorded intervals. All samples are assigned a unique sample number.
After the core boxes with tags are photographed,
the core boxes are moved to the cutting station. The core is cut lengthwise by diamond saw, with half the core submitted as the primary
sample and the remaining half core retained in the core box for future reference.
| |
Osisko Development Corp.
NI 43-101 Technical Report
Feasibility Study for the Cariboo Gold Project |
|
The samples are individually bagged with the corresponding
tag. The tag number is written on the bag and each bag is sealed. The bags are then placed in rice bags and the rice bags are sealed with
numbered security tags for the chain of custody requirements. If any tampering with security tags is suspected, the laboratory will communicate
with ODV. Samples are transported to the ALS Minerals (“ALS”) laboratory in Vancouver, BC and the remaining drill core is
subsequently stored on site at ODV’s secure facilities in Wells and at a second location near the Ballarat Camp.
| 11.2 | Laboratories Accreditation and Certification |
The International Organization for Standardization
(“ISO”) and the International Electrotechnical Commission (“IEC”) form the specialized system for worldwide standardization.
ISO/IEC 17025 General Requirements for the Competence of Testing and Calibration Laboratories set out the criteria for laboratories
wishing to demonstrate that they are technically competent, operating an effective quality system, and able to generate technically valid
calibration and test results. The standard forms the basis for the accreditation of competence of laboratories by accreditation bodies.
ISO 9001 applies to management support, procedures, internal audits, and corrective actions. It provides a framework for existing quality
functions and procedures.
All the samples of the 2020 and 2021 Programs
were submitted to the ALS laboratory in BC. The ALS laboratory is ISO 9001 certified and accredited (ISO/IEC 17025) for the analytical
methods used routinely on the samples from Cow Mountain, Island Mountain, and Barkerville Mountain. The ALS facility is a commercial laboratory
independent of ODV and has no interest in the Cariboo Gold Project.
| 11.3 | Sample Preparation and Assay |
| ■ | Samples are sorted and logged into the ALS LIMS program; |
| ■ | Samples are dried and weighed; |
| ■ | Samples are crushed to +70% passing 2 millimetres (“mm”) (CRU-31); |
| ■ | The crushed sample split of up to 500 g is pulverized to +85% passing 75 microns (“μm”) screen (PUL 32 m); |
| ■ | Samples containing visible gold or cosalite mineralization are assayed by metallic screen method; a crushed sample split of 1,000 g
is pulverized (method PUL-32) to pass 100 μm (Tyler 150 mesh) stainless steel screen to separate the oversize fractions (method
SCR-21). |
| |
Osisko Development Corp.
NI 43-101 Technical Report
Feasibility Study for the Cariboo Gold Project |
|
| ■ | A 50 g pulp aliquot is analyzed by Au-AA26: fire assay followed by aqua regia digestion (HNO3-HCl)
with an atomic absorption spectroscopy finish (“AAS”); |
| ■ | When assay results are higher than 100 g/t Au, a second 50 g pulp aliquot is analyzed by Au-GRA22: fire assay, parting with nitric
acid (HNO3) with a gravimetric finish; |
| ■ | All samples containing visible gold or cosalite mineralization are assayed by the metallic screen method (method Au-SCR21). At the
request of ODV, any sample exceeding 100 g/t Au (Au-AA26) is rerun with the screen method following the procedure below; |
| ■ | For visible gold assays or cosalite mineralization, the +100 μm fraction (Au+) is analyzed in its entirety by fire assay (“FA”)
with gravimetric finish. The 100 μm fraction (minus) is homogenized and two subsamples are analyzed by FA with AAS (Au-AA25) or
gravimetric finish (AuGRA21). The average of the two minus fraction subsamples are taken and reported as the Au-fraction result. The gold
content is then determined by the weighted average of the Au+ and Au- fractions. |
| 11.3.3 | Multi-element Assaying |
| ■ | Some samples are analyzed by trace-level multi-element method ME-MS61:
a 0.25 g aliquot is digested by four-acid digestion (HNO3-HClO4-HF-HCl)
and HCl leach (method GEO-4A01) and analyzed by ICP-AES; |
| ■ | Following this analysis, the results are reviewed for high concentrations of bismuth, mercury, molybdenum, silver, and tungsten and
diluted accordingly. Samples meeting these criteria are then analyzed by ICP-MS. Results are corrected for spectral interelement interferences. |
| 11.3.4 | Specific Gravity Measurements |
| ■ | Before crushing and pulverizing, the specific gravity of selected samples is determined by the bulk sample method (water displacement,
OA GRA08). |
| 11.4 | Quality Assurance and Quality Control |
This
section summarizes the reviews of ODV’s 2020 and 2021 assay QA/QC programs.
A
total of 49,243 and 111,361 samples (including QA/QC samples) were assayed during 2020 and 2021, respectively. The 2020 and 2021
QA/QC programs included a routine insertion of standards and blanks to monitor gold assay results. ODV included one standard in every
20 samples and one blank in every 40 samples. The 2020 and 2021 QA/QC programs did not include field or coarse reject duplicates.
| |
Osisko Development Corp.
NI 43-101 Technical Report
Feasibility Study for the Cariboo Gold Project |
|
| 11.4.1 | Certified Reference Materials (Standards) |
Accuracy is monitored by adding standards at the
rate of one certified reference material (“CRM”) for every 20 samples. Standards are used to detect assay problems with specific
sample batches and any possible long-term biases in the overall dataset. ODV’s definition of a quality control failure is when:
| ■ | Assays for a CRM are outside plus or minus three standard deviations (±3SD) or ±10%; or |
| ■ | Assays for two consecutive CRMs are outside ±2SD, if one of them is outside ±3SD. |
| 11.4.2 | 2020 Certified Reference Materials (Standards) Performance |
A
total of 2,458 standards were analyzed during the 2020 Program, for an insertion rate of 5.0%. Five different CRMs from Ore Research
and Exploration Pty Ltd. (“OREAS”) were used.
In
2020, a total of 22 QC failures were recognized, and reruns were requested in 17 cases. Reruns were not requested for the other five cases,
as per ODV’s protocol, because the surrounding samples were assayed at or below the lower detection limit (0.01 g/t Au).
A total of 18 corrected certificates were issued, and the corrected assays were loaded into the database.
The
2020 average CRM results are all within ±0.4% of the expected values (Table 11-1). Most assays were within ±3SD
of the accepted value (Figure 11-1).
Table 11-1:
Results of standards used by ODV for the 2020 Program
| CRM |
Count |
Expected
Au (g/t) |
Observed
Au (g/t) |
Percent
of expected
(%) |
| Average |
SD |
Average |
SD |
| OREAS 218 |
113 |
0.531 |
0.017 |
0.533 |
0.013 |
100.3 |
| OREAS 219 |
506 |
0.76 |
0.024 |
0.760 |
0.019 |
100.0 |
| OREAS 226 |
609 |
5.45 |
0.126 |
5.448 |
0.083 |
100.0 |
| OREAS 228b |
612 |
8.57 |
0.199 |
8.583 |
0.134 |
100.2 |
| OREAS 237 |
618 |
2.21 |
0.054 |
2.219 |
0.044 |
100.4 |
| Total |
2,458 |
Weighted Average |
100.15 |
| |
Osisko Development Corp.
NI 43-101 Technical Report
Feasibility Study for the Cariboo Gold Project |
|
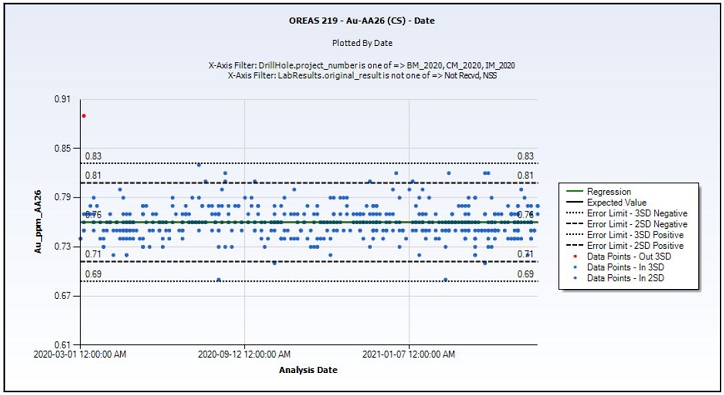
Figure 11-1:
Example of results for standard OREAS 219 for the 2020 Program
| 11.4.3 | 2021 Certified Reference Materials (Standards) Performance |
A total of 5,571 standards were analyzed during
the 2021 Program, for an insertion rate of 5.0%. Eight different CRMs from OREAS were used.
In
2021, a total of 75 QC failures were recognized, and reruns were requested in 63 cases. Reruns were not requested for the other 12 cases,
as per ODV’s protocol, because the surrounding samples were assayed at or below the lower detection limit (0.01 g/t Au).
A total of 50 corrected certificates were issued, and the corrected assays were loaded into the database. Two standards failed
again on the rerun, but the samples that were rerun along with the standards were within 10% of the original values.
The
2021 average CRM results are all within ±1.8% of the expected values, except for OREAS 217 which had a small sample size
(Table 11-2). Most assays were within ±3SD of the accepted value (Figure 11-2).
| |
Osisko Development Corp.
NI 43-101 Technical Report
Feasibility Study for the Cariboo Gold Project |
|
Table 11-2:
Results of standards used by ODV for the 2021 Program
| CRM |
Count |
Expected
Au (g/t) |
Observed
Au (g/t) |
Percent
of expected
(%) |
| Average |
SD |
Average |
SD |
| OREAS 217 |
2 |
0.338 |
0.010 |
0.345 |
0.007 |
102.1 |
| OREAS 219 |
1,207 |
0.76 |
0.024 |
0.758 |
0.019 |
99.7 |
| OREAS 226 |
1,083 |
5.45 |
0.126 |
5.417 |
0.101 |
99.4 |
| OREAS 228b |
640 |
8.57 |
0.199 |
8.553 |
0.159 |
99.8 |
| OREAS 232 |
267 |
0.902 |
0.023 |
0.901 |
0.020 |
99.9 |
| OREAS 237 |
1,477 |
2.21 |
0.054 |
2.216 |
0.047 |
100.3 |
| OREAS 240 |
353 |
5.51 |
0.139 |
5.427 |
0.104 |
98.5 |
| OREAS 242 |
542 |
8.67 |
0.215 |
8.516 |
0.171 |
98.2 |
| Total |
5,571 |
Weighted Average |
99.60 |
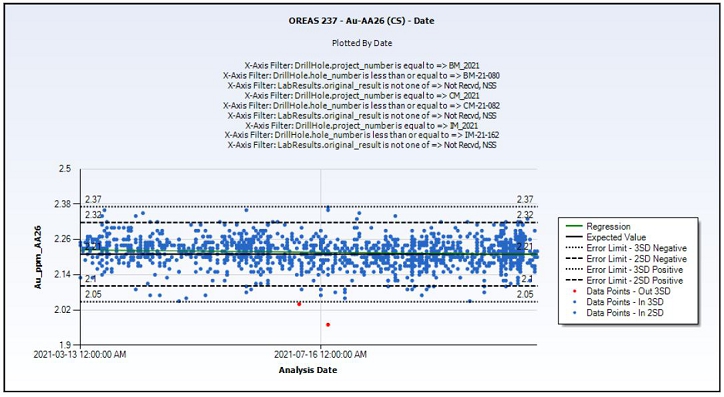
Figure 11-2:
Example of results for standard OREAS 237 for the 2021 Program
| |
Osisko Development Corp.
NI 43-101 Technical Report
Feasibility Study for the Cariboo Gold Project |
|
| 11.4.3.1 | Comment for Monitoring Accuracy |
The QP is of the opinion that ODV’s QC program
for monitoring accuracy using standards is reliable and valid based on the results presented by ODV personnel.
Contamination
during preparation is monitored by the routine insertion of coarse barren material (a “blank”) that goes through the
same sample preparation and analytical procedures as the core samples. Elevated values for blanks may indicate sources of contamination
in the fire assay procedure (contaminated reagents or crucibles) or sample solution carry-over during instrumental finish.
| 11.4.5 | 2020 Blank Samples Performance |
In 2020, 1,235 blanks were submitted to ALS with
the core samples. ODV personnel identified two cases of contamination for gold in coarse blank material, and both cases were sent for
repeat assaying. Both cases passed on the rerun. The corrected assay certificates were loaded into the database.
All
the blanks analyzed at ALS assayed less than or equal to 0.1 g/t Au, which is 10 times the detection limit of 0.01 g/t Au
and are thus considered acceptable. Table 11-3 summarizes the performance of the blanks. Figure 11-3 shows the results
over the year.
Table 11-3:
Results of blanks used by ODV for the 2020 Program
| Total
Blanks |
1,235 |
| Minimum Au g/t |
<0.01 |
| Maximum Au g/t |
0.09 |
| Below Detection Limit (# and %) |
1,073 (86.9%) |
| QC Failures (# and %) |
2 (0.16%) |
| |
Osisko Development Corp.
NI 43-101 Technical Report
Feasibility Study for the Cariboo Gold Project |
|
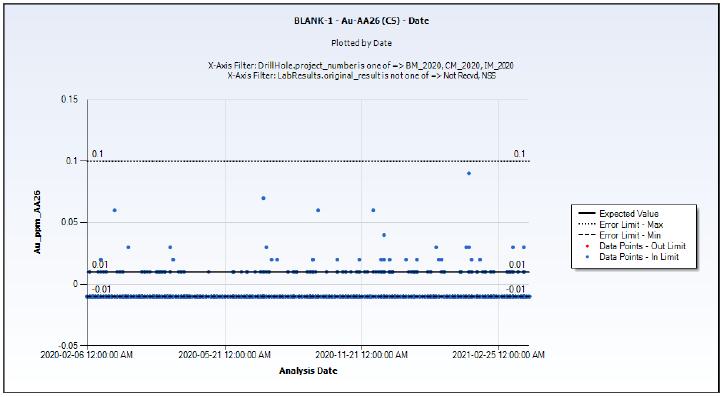
Figure 11-3:
Results of blanks for the 2020 Program
| 11.4.6 | 2021 Blank Samples Performance |
In 2021, 2,789 blanks were submitted to ALS with
the core samples. ODV personnel identified two cases of contamination for gold in coarse blank material, and both cases were sent for
repeat assaying. Both cases passed on the rerun. The corrected assay certificates were loaded into the database.
All
the blanks analyzed at ALS, assayed less than or equal to 0.1 g/t Au, which is 10 times the detection limit of 0.01 g/t Au,
and are thus considered acceptable. Table 11-4 summarizes the performance of the blanks. Figure 11-4 shows the results over
the year.
Table 11-4:
Results of blanks used by ODV for the 2021 Program
| Total
Blanks |
2,789 |
| Minimum Au g/t |
<0.01 |
| Maximum Au g/t |
0.09 |
| Below Detection Limit (# and %) |
2,315 (83.0%) |
| QC Failures (# and %) |
2 (0.07%) |
| |
Osisko Development Corp.
NI 43-101 Technical Report
Feasibility Study for the Cariboo Gold Project |
|
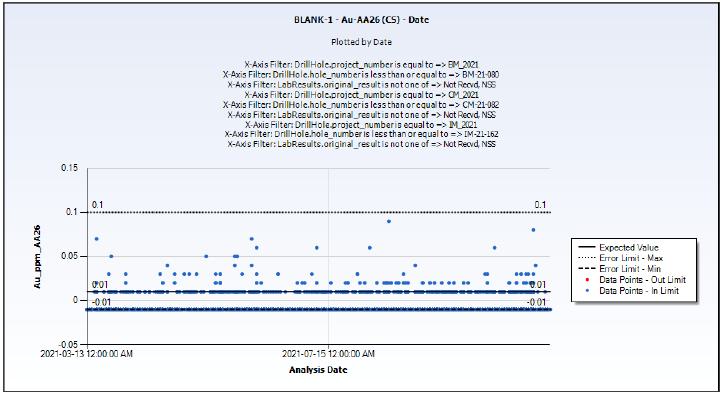
Figure 11-4:
Results of blanks for the 2021 Program
| 11.4.6.1 | Comment on Monitoring Contamination |
The QP is of the opinion that ODV’s QC program
for monitoring contamination using blanks is reliable and valid based on the results presented by ODV personnel.
A total of 564 holes from the 2020 and 2021 Programs
were included in the current resource. The QP is of the opinion that the sample preparation, analysis, QA/QC, and security protocols used
for the Project follow generally accepted industry standards, and that the data is valid. The QP recommends the implementation of QA/QC
on the silver assay results for future programs.
| |
Osisko Development Corp.
NI 43-101 Technical Report
Feasibility Study for the Cariboo Gold Project |
|
This chapter covers the data verification of ODV’s
diamond drill hole databases used for the resource estimates previously reported in the 2022 FS MRE (the “ODV Databases”),
as well as the review and validation of the geological models of each deposit. It also includes the review of information on mined-out
areas and the data for selected drill holes, including assays, QA/QC programs, downhole surveys, lithologies, alteration, and structures.
No changes have been made to the resource estimation
as previously reported in the 2022 FS MRE; however, there has been mining depletion for the Lowhee Zone and changes to the cut-off grade
assumptions as well as elimination of silver in the model
The ODV Databases contain 4,064 completed and
validated DDH used for the 2025 FS MRE for the Cariboo Gold Project. These are divided among four databases covering the eight
deposits, as follows:
| ■ | Cow Mountain database: Cow and Valley deposits (1,473 holes); |
| ■ | Island Mountain database: Shaft and Mosquito deposits (1,851 holes); |
| ■ | Barkerville Mountain database: BC Vein and Splays, KL, and Lowhee deposits (578 holes); |
| ■ | Bonanza Ledge database: Bonanza Ledge deposit (162 holes). |
Carl Pelletier, QP, previously conducted site
visits from February 1 to 4, 2016, and from May 3 to 12, 2016. The first included visits to the Bonanza Ledge pit, the Cow Mountain area,
and the Island Mountain area, while the second focused on core logging facilities, several drill hole collars, drill pads, and mineralized
outcrops. Core logging and sampling procedures were discussed with ODV’s geologists, covering collar locations, drilling protocols,
downhole surveys, logging protocols, oriented core, structural measurements, sampling protocols, and QA/QC protocols.
Eric Lecomte, QP, has also visited the property
on February 25, 2022. The visit included a review of the proposed MSC location in Wells and an inspection of the Bonanza Ledge site. The
primary objective was to evaluate surface and underground site conditions, including a visual assessment of ground conditions and excavation
behaviour at Bonanza Ledge. A second visit was conducted on September 11, 2024, with a primary focus on the Cow portal ramp. The inspection
aimed to assess current ground conditions and excavation behaviour specific to the ramp area. Discussions were held with site personnel
regarding the operational performance of the Roadheader used for ramp development, including its productivity, ground response, and cycle
time performance.
| |
Osisko Development Corp.
NI 43-101 Technical Report
Feasibility Study for the Cariboo Gold Project |
|
Historical work subject to verification consisted
of the holes used for the 2020 MRE (Beausoleil and Pelletier, 2020). Basic cross-check routines were performed between the current ODV
Databases and the previously validated database for the 2020 MRE; i.e., collars, downhole surveys, assay fields. No discrepancies with
the current database were found.
The ODV Databases were verified for consistency
against the Datamine DHLogger export.
The final databases are considered to be of good
overall quality. The QPs consider the ODV Databases to be valid, reliable and suitable for the use in the 2025 FS MRE.
| 12.2.1. | ODV Drill Hole Collar and Downhole |
The 2020 and 2021 surface drill hole collars were
surveyed using a Trimble DGPS unit.
The collar survey information was verified for
5% of the holes from the latest drilling programs, using the raw survey files. The QP verifications also included numerous field checks
on collar location (using a handheld GPS). No discrepancies were found.
Downhole surveys (single shot and multi-shots)
were conducted on the majority of surface holes. The Reflex survey information was verified for 5% of the holes from the latest drilling
programs. No discrepancies were found.
The QPs had access to the assay certificates for
all historical and current holes in the ODV Databases. All assays were verified for selected drill holes from the latest drilling programs,
i.e., 5% of the 2020 and 2021 Program. The assays recorded in the databases were compared to the original certificates from ALS Minerals
(North Vancouver, BC). The electronic transfer of the laboratory results via e-mail, followed by the electronic transfer directly into
the databases by the issuer’s staff, allowed for immediate error detection and prevented any typing errors.
No errors or discrepancies were found. The final
databases are considered to be of good overall quality. The QPs consider the ODV Databases to be valid and reliable.
Discussions and reviews with the issuer’s
personnel convinced the QPs that the protocols and the QA/QC program in place are adequate.
| |
Osisko Development Corp.
NI 43-101 Technical Report
Feasibility Study for the Cariboo Gold Project |
|
The Lowhee bulk sample has been mined by ODV.
The MRE for this deposit is depleted with a solid representing the latest surveyed underground workings and the 2025 bulk sample stope.
Both the underground workings and bulk sample are current as of the end of January 2025.
The voids models for all other deposits remain
unchanged since the 2022 FS.
The “buffer voids” are a combination
of the historical underground workings (stopes, drifts and shafts) of the Cariboo Gold Quartz Mine (Cow Mountain), the Aurum Mine and
Mosquito Creek Mine (Island Mountain), and the Barkerville Mountain Mine (Barkerville Mountain) with a 5 m buffer around them.
These “buffer voids” were used to
deplete the final resource estimate.
For the Cow, Valley, Shaft, Mosquito, Lowhee,
and BC Vein deposits, the drilling program continues to intercept undocumented voids. To reduce the associated risk, a spherical buffer
with a 10 m radius was applied around the intercepts to represent
a potential stope of 20 m in diameter. These spherical buffers were
also used to deplete the final resource estimate and referred to the mining engineers (mining plan and dewatering program).
The QPs consider the level of detail in the void
triangulation to be of good quality and reliable, despite some uncertainty related to previously undocumented voids.
| 12.4. | ODV Logging, Sampling, and Assaying Procedures |
The drill holes from the 2020 Program and 2021
Program were examined.
All core boxes were labelled and properly stored
on core racks or on pallets. Sample tags are present in the boxes and it was possible to validate sample numbers and confirm the presence
of mineralization in the reference half-core samples from mineralized sections.
Independent resampling was also completed by the
QP of mineralized intervals from the Cow deposit and Mosquito deposit. The results show that low-grade samples yielded grade that are
consistent with the original results and more variable results for higher-grade samples (although gold values still considered high),
reflecting a nugget effect commonly related to this type of deposit.
Table 12-1 shows the results of the independent
resampling.
The pictures in Figure 12-1 illustrate the
site visit and core review.
| |
Osisko Development Corp.
NI 43-101 Technical Report
Feasibility Study for the Cariboo Gold Project |
|
Table 12-1: Results of
the independent resampling of material
from the Cow and Mosquito
deposits
| Hole
Information |
Original
(ODV) |
1/4-Split
(InnovExplo) |
Litho.
Code (Deposit) |
| Hole
ID |
From |
To |
Sample
Number |
Au
(ppm) |
Sample
Number |
Au
(AA26) (ppm) |
| CM-21-010 |
94.80 |
95.85 |
B859968 |
0.03 |
2155817 |
0.03 |
SS (V8-Cow) |
| CM-21-010 |
95.85 |
96.85 |
B859969 |
4.05 |
2155818 |
5.78 |
SS (V8-Cow) |
| CM-21-010 |
96.85 |
97.65 |
B859971 |
1.18 |
2155819 |
0.66 |
SS (V8-Cow) |
| CM-21-010 |
97.65 |
98.85 |
B859972 |
1.20 |
2155820 |
0.75 |
SS (V8-Cow) |
| CM-21-010 |
98.85 |
100.00 |
B859973 |
3.02 |
2155821 |
1.51 |
SS (V8-Cow) |
| CM-21-010 |
100.00 |
101.50 |
B859974 |
0.12 |
2155822 |
0.08 |
SS (V8-Cow) |
| IM-21-005 |
204.00 |
205.40 |
C235583 |
Below DL |
2155823 |
0.02 |
SS (V39-Mosquito) |
| IM-21-005 |
205.40 |
206.05 |
C235584 |
1.94 |
2155824 |
2.10 |
SS (V39-Mosquito) |
| IM-21-005 |
206.05 |
207.15 |
C235585 |
17.95 |
2155825 |
18.85 |
SS (V39-Mosquito) |
| IM-21-005 |
207.15 |
208.00 |
C235586 |
0.02 |
2155826 |
0.03 |
SS (V39-Mosquito) |
| IM-21-005 |
208.00 |
209.50 |
C235587 |
0.02 |
2155827 |
0.02 |
SS (V39-Mosquito) |
| |
Osisko Development Corp.
NI 43-101 Technical Report
Feasibility Study for the Cariboo Gold Project |
|
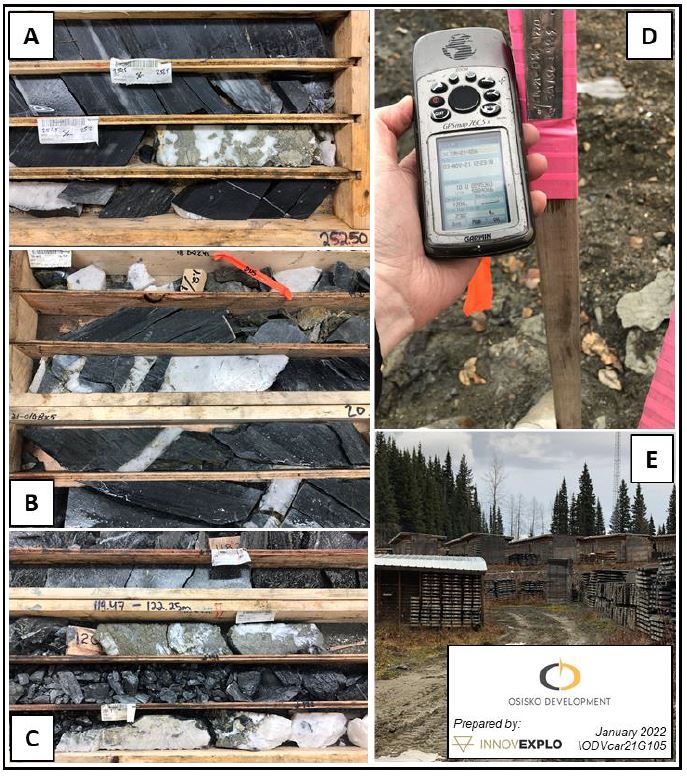
Figure 12-1: Site visit
including core review (November 2021)
A) Review of hole BM-21-001
(Lowhee deposit); B) Review of hole CM-21-010 (Cow and Valley deposit); C) Review
of hole IM-21-067 (Shaft deposit); D) Field check by QP on collar location;
E) External core storage
| |
Osisko Development Corp.
NI 43-101 Technical Report
Feasibility Study for the Cariboo Gold Project |
|
| 12.5. | Mineral Resource Estimation Process |
There have been no changes to the mineral estimation
since the 2022 FS.
The QPs reviewed the estimation process described
in Chapter 14 for the deposits and consider these models to be acceptable.
| 12.5.1. | Bulk Sample and Drilling Pattern |
The drilling data and mapping of the bulk sample
was provided by ODV. The QPs have reviewed the data and discussed the Project with the ODV team.
Based on data from ODV mapping (levels 1260 and
1290), the presence of sub-vertical AXPL veins is clear (Figure 12-2). Sub-vertical AXPL veins are observed to pinch and swell, narrow,
discontinuous and sometimes can bifurcate. Individual mineralized veins show a thickness range from centimetre to decimetre. The spacing
between individual veins within the same corridor ranges from 10 cm to 60 cm. The veins are quartz dominant, with few iron carbonate,
and pyrite is the most prevalent sulphide mineral. Some of them show a massive pyritization, up to 30–40 %. AXPL veins preferentially
develop within the sandstone-rich units of the gallery.
The mineralized interval observed at the lower
level, with a grade higher than 3.0 g/t Au on the AXPL veins corridor, extends approximately 30 m. In that specific interval 2–3
distinct APXL vein were observed, with a range of 20–25 m (Figure 12-2). A deviation, in certain surface holes was also
observed, located approximately 200 m from the target area, reveals 5–6 m displacement when comparing the interpretation
of the drill zone with their actual spatial location. Considering the location of the mineralized target within the deposit and the method
used to access it, it is strongly recommended to use a 12–15 m drilling pattern, with collars located no more than 100–120 m
from the target. Particular attention should be given to the boundary of the economic zone, where a tighter drilling pattern (8–9 m)
may be necessary to accurately define the start or end of the mineralized zone.
| |
Osisko Development Corp.
NI 43-101 Technical Report
Feasibility Study for the Cariboo Gold Project |
|
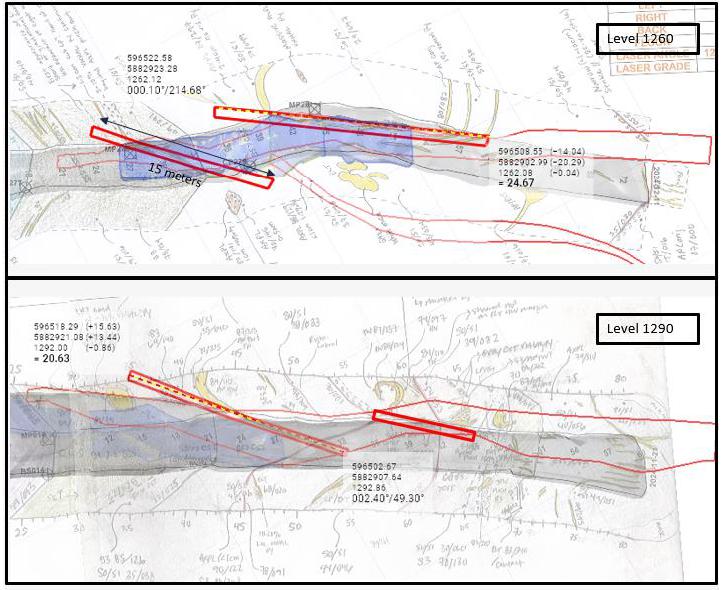
Figure 12-2: Plan view,
continuity of AXPL veins
Regarding the 2016 and 2021 site visits, the QPs
data verification demonstrates that the data, interpretation of protocols, and estimation processes are acceptable. The QPs consider the
ODV Databases to be valid and of sufficient quality to be used for the MRE herein.
Overall, the QPs believe that the structural understanding
and steps involved in bulk sample are generally well understood. However, it is recommended to provide additional support and experience
for production purposes within the technical services department.
| |
Osisko Development Corp.
NI 43-101 Technical Report
Feasibility Study for the Cariboo Gold Project |
|
| 13. | Mineral Processing and Metallurgical Testing |
The Cariboo deposit
is divided into five main zones: Shaft, Valley, Cow, Lowhee and Mosquito. The metallurgical test work programs were developed by
BBA and ODV to characterize the Cariboo Gold Project mineralized material. Extensive work has been carried out to determine the metallurgical
characterization of the deposits (Table 13-1). The test programs up to year 2022 were presented in more detail in the previous reports
by BBA in 2022 (PEA) and 2023 (FS) (Hardie et al., 2022; 2023).
The main objectives of the 2024/2025 metallurgical
programs were to further assess the variability across ore zones, ore sorter amenability, gravity recoverable gold and the ability to
generate a sealable flotation concentrate. Mineralogy, thickening, filtration and paste backfill works were completed, and details are
presented within this section of the Report.
Table 13-1: Summary of
metallurgical test work programs
| Testing Facility |
Description of Program |
Material Tested |
| 2018-2019 |
|
|
| Steinert USA |
Ore sorting test work |
Drill core variability samples from Shaft, Cow, Valley and Mosquito zones and LOM composite |
| SGS, Burnaby |
Sample characterization, mineralogical analysis, comminution tests, flotation, gravity separation, cyanide (“CN”) leaching and cyanide destruction tests |
| Cyanco, Nevada |
Cyanide leaching and cyanide destruction tests |
LOM composite |
| Pocock, Utah |
Sample rheology, thickening and filtration tests |
LOM composite Flotation concentrate, Flotation tailings, pre-leach thickener, detoxed tailings |
| Golder |
Paste fill testing and tailings characterization |
LOM composite Flotation tailings |
| 2020-2021 |
|
|
| Tomra, Germany |
Ore sorting test work |
Shaft Zone bulk sample |
| SGS, Burnaby |
Sample characterization, mineralogical analysis, comminution tests, flotation, gravity separation, cyanide leaching and cyanide destruction tests |
| |
Osisko Development Corp.
NI 43-101 Technical Report
Feasibility Study for the Cariboo Gold Project |
|
| Testing Facility |
Description of Program |
Material Tested |
| 2022 |
|
|
| Steinert, USA |
Ore sorting test work |
Drill core sample from Lowhee deposit |
| SGS, Burnaby |
Sample characterization, mineralogical analysis, comminution tests, gravity separation, cyanide leaching and cyanide destruction tests |
Drill core sample from Lowhee deposit and remaining Shaft Zone bulk sample from 2021 test program |
| SGS, Lakefield |
Rheology |
Shaft Zone bulk sample flotation concentrate, Detoxed tailings |
| FLS, Utah |
Thickening and filtration tests |
Shaft Zone bulk sample flotation tailings |
| Cyanco, Nevada |
Cyanide leaching and cyanide destruction tests |
Shaft Zone bulk sample |
| WSP Golder |
Paste fill testing and tailings characterization |
Flotation tailings of Shaft Zone bulk sample |
| 2024-2025 |
| Base Met, Kamloops |
Sample characterization, comminution tests, XRT amenability and bench scale ore sorting, comminution tests, flotation and gravity separation |
Drill core variability samples from Shaft, Deep Shaft, Cow, Lowhee and Valley zones, Zone composites and two blend composites |
| Metso |
Thickening and filtration |
Flotation products - rougher tail, cleaner scavenger tails and copper concentrate |
| AMTEL |
Gold deportment |
Zone composites (Shaft, Cow and Valley) |
| T Engineering |
Paste backfill test work - sample preparation, material characterization, rheological characterization, and UCS testing |
Rougher and cleaner scavenger flotation tails |
| 13.1 | Sample Selection and Characterization |
The test work program was designed to determine
the mineralized material response to a pre-concentration process and, subsequently, to the cyanide leach process. The test work was conducted
at Steinert, SGS, Cyanco, and Pocock testing facilities (Hansuld and Gajo, 2019).
| |
Osisko Development Corp.
NI 43-101 Technical Report
Feasibility Study for the Cariboo Gold Project |
|
| 13.1.1.1 | Sample Origin and Compositing |
The program included composite samples from four
zones: Shaft Zone (“SZ”), Cow Zone (“CZ”), Valley Zone (“VZ”), and Mosquito Zone (“MZ”).
The material for the composites was obtained from NQ drill core intervals of the drilling campaigns performed by ODV in 2016, 2017, and
2018. The spatial distribution of the selected intervals is represented in Figure 13-1 and Figure 13-2.
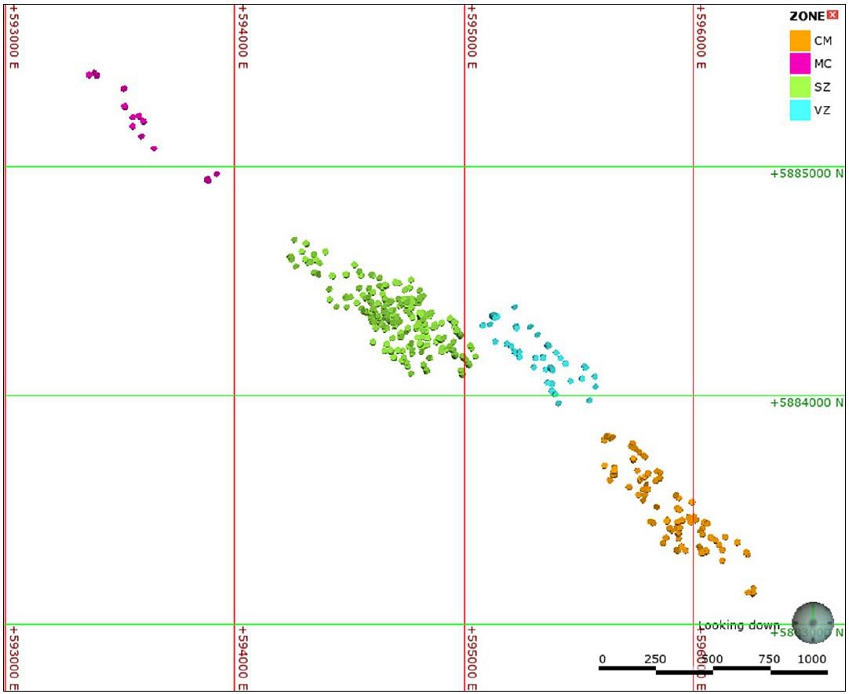
Figure 13-1: 2018 Sample
locations – Plan view
| |
Osisko Development Corp.
NI 43-101 Technical Report
Feasibility Study for the Cariboo Gold Project |
|
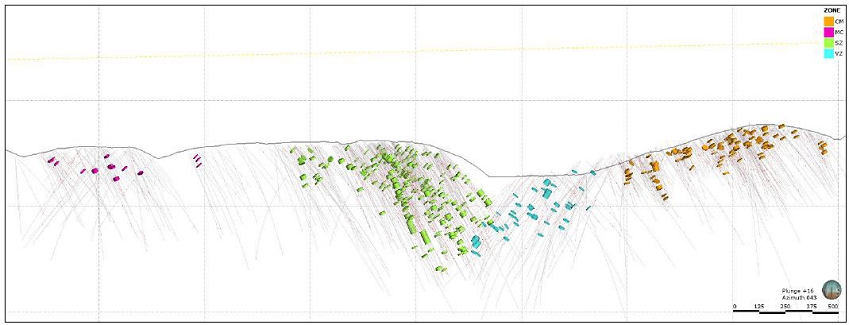
Figure 13-2: 2018 Sample
locations – Section view
The selected mineralized intervals for the life
of mine (“LOM”) composite included wall rock/shoulder samples from quartered NQ drill core and were separated on site into
two size fractions: coarse (-60 mm/+10 mm) sized material sent to Steinert in Kentucky, USA for ore sorting test work; and (-10 mm)
sized material called “fines” sent to SGS Burnaby, BC, for compositing for metallurgical test work. The amount of material
received by SGS is presented in Table 13-2.
Ore sorting pre-concentration products from Steinert
were sent back to SGS and blended to create composites for further testing.
Table 13-2:
2018 Material received for LOM composites
| Zone |
Weight (kg) |
| Fines |
Coarse |
| Cow |
257.8 |
365.2 |
| Valley |
59.4 |
172.4 |
| Mosquito |
81.0 |
33.2 |
| Shaft |
287.8 |
237.2 |
| Shaft 2 |
411.8 |
590.8 |
| Total |
1,097.8 |
1,398.8 |
| |
Osisko Development Corp.
NI 43-101 Technical Report
Feasibility Study for the Cariboo Gold Project |
|
Drill core intervals for variability composites
that represented gold grade variation of each mineralized zone was selected by ODV and BBA and sent to SGS for a second metallurgical
test work campaign. The material received for the variability test work program was 1,243 kg from Shaft Zone, 728 kg from Cow
Zone, and 180 kg from Valley Zone (Table 13-3). The drill core intervals received were crushed to -35 mm and screened.
The coarse fraction (-35/+10 mm) of the material was sent to Steinert for ore sorting test work. Material sized below 10 mm
was kept at SGS for metallurgical test work. Ore sorting products received back from Steinert were assayed and prepared for metallurgical
test work at SGS.
Table 13-3: 2018 Material
received for variability composites
| Zone |
Composite Name |
Weight (kg) |
| Fines |
Coarse |
Total |
| Shaft Zone |
SZ-LOM |
157 |
370 |
527 |
| SZ-High |
89 |
160 |
249 |
| SZ-Low |
87 |
174 |
261 |
| SZ-Deep |
64 |
142 |
206 |
| Cow Zone |
CZ-LOM |
58 |
167 |
225 |
| CZ-High |
70 |
139 |
209 |
| CZ-Low |
78 |
216 |
294 |
| Valley Zone |
VZ-LOM |
18 |
38 |
56 |
| VZ-High |
14 |
29 |
43 |
| VZ-Low |
17 |
64 |
81 |
| 13.1.1.2 | Sample Characterization |
Head Assays
The samples were submitted to screen metallic
analysis (“SMA”) for gold at 150 mesh size. Oversize (“O/S”) material was assayed via fire assay in its entirety
and undersize (“U/S”)material was assayed in triplicate. The U/S was also assayed for total sulphur and total organic carbon
(“TOC”) and semi-quantitative inductively coupled plasma (“ICP”) scan for multi-element analysis. Head grade ranges
for ore sorter concentrate (“OSC”) composites were 3.8 g/t to 9.3 g/t Au and 2.3% to 4.9% total sulphur. The LOM fines composite
assayed 3.42 g/t Au and 2.62% S. Table 13-4 summarizes the results of variability and zone LOM composites for fines and OSC.
| |
Osisko Development Corp.
NI 43-101 Technical Report
Feasibility Study for the Cariboo Gold Project |
|
Table 13-4: Variability
composites head assays via SMA and ICP
| Sample ID |
O/S Mass
(%) |
U/S Mass
(%) |
O/S Au
(g/t) |
U/S Au
(g/t) |
Calculated Total
Au Grade(1)
(g/t) |
Total TOC(2)
Grade (%) |
Total S
Grade (%) |
Total Cu
(g/t) |
Total Fe
(g/t) |
| Fines (-10 mm) |
|
|
|
|
|
|
|
|
| SZ LOM |
3.7 |
96.3 |
10.9 |
9.3 |
9.4 |
0.1 |
7.4 |
<40 |
71,287 |
| SZ High |
3.6 |
96.4 |
30 |
20.5 |
20.9 |
0.1 |
10.4 |
140 |
102,439 |
| SZ Low |
3.7 |
96.3 |
79.5 |
8.2 |
10.8 |
0.2 |
7.8 |
<40 |
80,090 |
| SZ Deep |
3.9 |
96.1 |
7 |
2.7 |
2.9 |
0.5 |
2.3 |
121 |
35,611 |
| CZ LOM |
3.7 |
96.3 |
20 |
3.2 |
3.8 |
0.4 |
2.8 |
<40 |
50,877 |
| CZ Low |
3.9 |
96.1 |
46.9 |
5.7 |
7.4 |
0.5 |
6.7 |
<40 |
74,497 |
| CZ High |
2.3 |
97.7 |
283 |
14.9 |
21.2 |
0.7 |
8.1 |
<40 |
83,066 |
| VZ LOM |
2.9 |
97.1 |
89.7 |
5.1 |
7.7 |
1.4 |
3.5 |
87 |
89,018 |
| VZ Low |
96.9 |
3.1 |
14.9 |
3.5 |
3.9 |
0.7 |
5.4 |
162 |
43,225 |
| VZ High |
96.7 |
3.3 |
48.9 |
9.5 |
10.9 |
0.8 |
9.3 |
117 |
51286 |
| Ore Sorting Samples |
|
|
|
|
|
|
|
|
| SZ LOM |
3.1 |
96.9 |
9.4 |
6.4 |
6.5 |
0.2 |
4.2 |
105.6 |
46,736 |
| SZ High |
3.1 |
96.9 |
55 |
8.9 |
9.7 |
0.1 |
4.3 |
278.8 |
52,407 |
| SZ Low |
3.4 |
96.6 |
17.1 |
4.3 |
4.7 |
0.1 |
3.1 |
33.9 |
41,011 |
| SZ Deep |
3 |
97 |
88.4 |
1.5 |
3.4 |
0.5 |
1.4 |
49.8 |
29,508 |
| CZ LOM |
3.2 |
96.8 |
62.6 |
2.1 |
4 |
0.3 |
1.7 |
52.5 |
34,771 |
| CZ Low |
3.3 |
96.7 |
15.8 |
3 |
3.5 |
0.3 |
2.9 |
<40 |
37,368 |
| CZ High |
3.4 |
96.6 |
208.4 |
6.8 |
14.1 |
0.5 |
5.7 |
<40 |
57,561 |
| VZ LOM |
4 |
96 |
18.7 |
5.3 |
5.8 |
0.9 |
4.8 |
118.2 |
58,423 |
| VZ Low |
3.6 |
96.4 |
5.4 |
2.7 |
2.9 |
0.5 |
3.5 |
63.3 |
43,225 |
| VZ High |
5.4 |
94.6 |
14.6 |
5.7 |
6 |
1.2 |
3.2 |
108.7 |
48,112 |
| (1) | Head grades calculated using ore sorting product assays. |
| (2) | “TOC”: Total organic carbon. |
| |
Osisko Development Corp.
NI 43-101 Technical Report
Feasibility Study for the Cariboo Gold Project |
|
Gold Deportment
A sample of LOM
fines composite was submitted for gold deportment analysis at SGS. The study reported 13.8% of total liberated gold (liberated and pure
gold minerals) and 86.2% gold associated with other minerals. 59.9% of the gold was associated with pyrite, 7.3% with heavy silicates,
and 2.5% with complex sulphides. Approximately 43% of pure gold was found in the coarse size range of 125-180 μm and gold
associated with heavy silicates was under 20 μm.
| 13.1.2.1 | Sample Origin and Compositing |
This test program was completed on Shaft Zone
material received from Tomra ore sorting test work (Sun, 2022a). Three composite samples were prepared by combining the U/S material (“prep
fines”) with the OSC generated at Tomra. The ratio of prep fines to OSC varied for each blend. Blends recipes and head assays are
presented in Table 13-5.
Table 13-5: Recipes of
composite samples
| Sample ID |
Weight (%) |
Total
Mass
(kg) |
Au
(g/t) |
Ag
(g/t) |
Cu
(%) |
Fe
(%) |
Zn
(%) |
S
(%) |
TC
(%) |
TOC
(%) |
Prep
Fines |
OSC |
| Blend 1 |
32 |
68 |
243.5 |
8.81 |
4.28 |
0.02 |
5.9 |
0.14 |
5.48 |
0.54 |
0.11 |
| Blend 2 |
55 |
45 |
243.5 |
6.22 |
4.61 |
0.02 |
6.21 |
0.13 |
6.22 |
0.49 |
0.12 |
| Blend 3 |
72 |
28 |
243.5 |
6.95 |
4.42 |
0.02 |
6.79 |
0.11 |
6.38 |
0.47 |
0.12 |
| 13.1.3.1 | Sample Origin and Compositing |
The program included a composite sample from Lowhee
Zone. The material for the composite was obtained from NQ drill core intervals from the diamond drill core of the drilling campaign performed
by ODV in 2021. A total of 134.4 kg of material from the Lowhee Zone was sent to SGS Burnaby. At SGS, it was crushed under 35 mm. Minus
10 mm material was screened and saved as prep fines. Plus 10 mm material was sent to Steinert in Kentucky, USA, for ore sorting test
work. The gold content and mass distribution of the Lowhee composite is presented in Table 13-6 (Sun, 2022a).
| |
Osisko Development Corp.
NI 43-101 Technical Report
Feasibility Study for the Cariboo Gold Project |
|
Table 13-6: Lowhee composite
gold content
| Description |
Au
(g/t) |
Mass
(kg) |
| Sorting Feed (-35 +10 mm) |
1.11 |
103.8 |
| Prep Fines (-10 m) |
5.68 |
30.6 |
| Total – Lowhee Head |
2.15 |
134.4 |
| 13.1.3.2 | Sample Characterization |
Mineralogy
A subsample of the Lowhee head composite was sent
for mineralogical analysis and the X-ray diffraction results show sample composition of 89% silicates, 7% iron carbonates and 3% pyrite
(Zhou & Kapusianyk, 2022).
| 13.1.4 | Base Met Labs – 2024 |
The test work program was designed to determine
the mineralized material response to a pre-concentration process and, subsequently, to gravity and rougher and cleaning flotation. It
included flotation optimization work and variability work. The test work was conducted at Base Metallurgical Laboratories Ltd.(“Base
Met Labs”), AMTEL Ltd., and Metso.
| 13.1.4.1 | Sample Origin and Compositing |
The material for the test program was obtained
from NQ drill core intervals from the diamond drill core of the drilling campaign performed by ODV between 2021 and 2023. About 1.3 t
of material was received at the testing facility. The spatial distribution of the selected intervals is represented in Figure 13-1
and Figure 13-2. The program included composite samples from each of the following five zones: Cow, Deep Shaft, Lowhee, Shaft and
Valley and 16 variability samples from each of the following five zones: Cow, Deep Shaft, Shaft, Deep Valley and Valley.
| |
Osisko Development Corp.
NI 43-101 Technical Report
Feasibility Study for the Cariboo Gold Project |
|
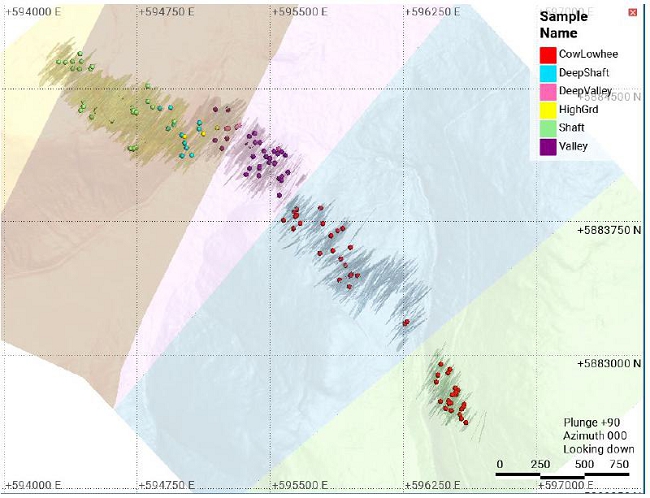
Figure 13-3: 2024 Sample
locations – Plan view
Source: ODV, 2025
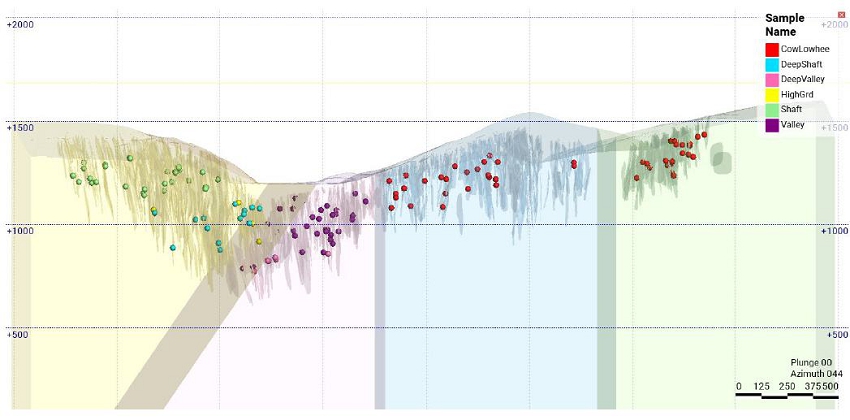
Figure 13-4: 2024 Sample
locations – Section view
Source: ODV, 2025
| |
Osisko Development Corp.
NI 43-101 Technical Report
Feasibility Study for the Cariboo Gold Project |
|
Two production composites were also prepared:
the bulk composite and the blend composite. The bulk composite was used for gravity testing and to generate sample for paste backfill
and dewatering test work on a sample representative of the first five years of production. The blend composite, more representative of
LOM mineral composition, was used to confirm flowsheet performance including a standard locked cycle test (“LCT”) on gravity
tailings after pre concentration via ore sorting. The mass split by zone of the two composite samples is shown in Table 13-7.
Table 13-7: Composites
construction
| Zone
Composite |
Weight
(kg) |
Weight
(k%) |
| Bulk
|
Blend |
Bulk
|
Blend |
| Shaft |
66 |
96 |
41% |
51% |
| Deep
Shaft |
24 |
|
15% |
|
| Lowhee |
26 |
8 |
16% |
4% |
| Cow |
21 |
44 |
13% |
23% |
| Valley |
24 |
40 |
15% |
21% |
| Total
Production Composite Mass |
160 |
188 |
100% |
100% |
| 13.1.4.2 | Sample Characterization |
Head Assays
The samples were submitted to 30 g fire assay
with Flame Atomic Absorption Spectroscopy (“FAAS”) finish for gold determinations. ICP was used to assay silver (“Ag”)
and arsenic (“As”), and LECO was used to assay sulphur (“S”), carbon (“C”) and TOC. FAAS was used
for iron (“Fe”) assay. The bulk composite was sampled twice to determine the head assay, and the variability samples and Shaft
Zone composite were also assayed via SMA at 106 μm screen size. Results are summarized in Table 13-8 and detailed SMA results
are presented in Table 13-9.
| |
Osisko Development Corp.
NI 43-101 Technical Report
Feasibility Study for the Cariboo Gold Project |
|
Table 13-8: Head assays
| Zone |
Sample |
Au |
Au(1) |
Ag |
As |
S |
C |
Fe |
TOC |
| g/t |
g/t |
ppm |
% |
% |
% |
% |
| Shaft
Zone - Variability |
|
|
|
|
|
|
|
|
| Shaft |
Shaft
Var 1 |
1.4 |
2.1 |
1.2 |
154 |
2.4 |
1.8 |
3.3 |
0.5 |
| Shaft |
Shaft
Var 3 |
4.4 |
5.7 |
1.0 |
389 |
4.7 |
1.3 |
5.7 |
0.0 |
| Shaft |
Shaft
Var 5 |
11.6 |
12.1 |
2.4 |
356 |
4.4 |
1.0 |
5.0 |
0.0 |
| Shaft |
Shaft
Var 7 |
3.6 |
3.7 |
1.8 |
1540 |
1.4 |
0.8 |
2.3 |
0.1 |
| Deep
Shaft |
Shaft
Var 2 |
5.4 |
5.9 |
0.7 |
423 |
4.6 |
2.1 |
6.9 |
0.0 |
| Deep
Shaft |
Shaft
Var 4 |
4.0 |
5.3 |
1.2 |
234 |
5.8 |
1.1 |
6.6 |
0.0 |
| Deep
Shaft |
Shaft
Var 6 |
2.4 |
2.5 |
1.4 |
114 |
2.3 |
1.4 |
4.7 |
0.0 |
| Deep
Shaft |
Shaft
Var 8 |
6.7 |
5.9 |
1.6 |
168 |
1.2 |
2.1 |
4.1 |
0.0 |
| South
Zone - Variability |
|
|
|
|
|
|
|
|
| Cow |
South
Var 3 |
4.5 |
4.5 |
0.4 |
211 |
4.1 |
0.9 |
4.2 |
0.3 |
| Cow |
South
Var 4 |
0.7 |
1.1 |
0.2 |
78 |
0.9 |
1.3 |
3.4 |
0.0 |
| Cow |
South
Var 7 |
0.2 |
0.5 |
0.2 |
88 |
1.1 |
1.5 |
3.7 |
0.1 |
| Cow |
South
Var 8 |
0.2 |
0.8 |
0.2 |
35 |
1.0 |
2.0 |
5.1 |
0.1 |
| Deep
Valley |
South
Var 2 |
2.2 |
2.3 |
0.4 |
227 |
3.9 |
1.3 |
4.3 |
0.3 |
| Deep
Valley |
South
Var 6 |
0.8 |
0.7 |
0.2 |
91 |
1.4 |
0.8 |
2.3 |
0.0 |
| Valley |
South
Var 1 |
2.9 |
2.1 |
0.2 |
134 |
4.1 |
1.0 |
2.9 |
0.5 |
| Valley |
South
Var 5 |
2.1 |
2.4 |
0.2 |
68 |
1.2 |
1.8 |
5.4 |
0.0 |
| Zone
Composites |
|
|
|
|
|
|
|
|
| Shaft |
Shaft
Composite |
3.4 |
3.8 |
0.6 |
1229 |
3.5 |
1.4 |
5.3 |
0.2 |
| Deep
Shaft |
Deep
Shaft Composite |
4.6 |
|
0.9 |
234 |
2.7 |
1.5 |
3.8 |
0.1 |
| Lowhee |
Lowhee
Composite |
4.0 |
|
0.5 |
160 |
3.1 |
0.6 |
3.4 |
0.2 |
| Cow |
Cow
Composite |
1.5 |
|
0.4 |
142 |
1.8 |
1.3 |
3.4 |
0.2 |
| Valley |
Valley
Composite |
3.4 |
|
0.8 |
244 |
3.7 |
1.4 |
4.3 |
0.2 |
| Production Composite |
|
|
|
|
|
|
|
|
| LOM |
Bulk
Comp Hd 1 |
2.6 |
|
1.1 |
457 |
3.3 |
1.3 |
4.4 |
0.2 |
| Bulk
Comp Hd 2 |
3.1 |
|
0.9 |
358 |
2.8 |
1.4 |
4.0 |
0.2 |
| AVERAGE |
2.8 |
|
1.0 |
408 |
3.0 |
1.3 |
4.2 |
0.2 |
(1) Screen metallics assay
| |
Osisko Development Corp.
NI 43-101 Technical Report
Feasibility Study for the Cariboo Gold Project |
|
Table 13-9: SMA results
| Zone |
Sample
ID |
O/S
Mass
(g) |
U/S
Mass
(g) |
O/S
Au
(g/t) |
U/S
Assay 1
Au (g/t) |
U/S
Assay 2
Au (g/t) |
Calculated
Total
Au Grade
(g/t) |
| Shaft |
Shaft
Composite |
25.1 |
474.9 |
9.7 |
3.63 |
3.35 |
3.8 |
| Shaft |
Shaft
Zone Var 1 |
27.8 |
472.2 |
4.59 |
1.64 |
2.29 |
2.11 |
| Shaft |
Shaft
Zone Var 3 |
28.4 |
471.6 |
30.5 |
3.98 |
4.34 |
5.65 |
| Shaft |
Shaft
Zone Var 5 |
27.4 |
472.6 |
13.6 |
11.7 |
12.3 |
12.1 |
| Shaft |
Shaft
Zone Var 7 |
27.7 |
472.3 |
45.4 |
1.46 |
1.12 |
3.73 |
| Deep
Shaft |
Shaft
Zone Var 2 |
24.3 |
475.7 |
21 |
5.27 |
5.00 |
5.91 |
| Deep
Shaft |
Shaft
Zone Var 4 |
29.7 |
470.3 |
11.7 |
4.93 |
4.83 |
5.29 |
| Deep
Shaft |
Shaft
Zone Var 6 |
24.1 |
475.9 |
5.96 |
2.79 |
1.89 |
2.51 |
| Deep
Shaft |
Shaft
Zone Var 8 |
25.7 |
474.3 |
9.39 |
5.63 |
5.70 |
5.86 |
| Cow |
South
Zone Var 3 |
29.3 |
470.7 |
13.8 |
4.51 |
3.36 |
4.51 |
| Cow |
South
Zone Var 4 |
29.1 |
470.9 |
5.48 |
0.75 |
0.82 |
1.06 |
| Cow |
South
Zone Var 7 |
27.6 |
472.4 |
4.33 |
0.29 |
0.23 |
0.48 |
| Cow |
South
Zone Var 8 |
22.2 |
477.8 |
4.3 |
0.53 |
0.77 |
0.81 |
| Deep
Valley |
South
Zone Var 2 |
26.1 |
473.9 |
9.62 |
1.94 |
1.81 |
2.28 |
| Deep
Valley |
South
Zone Var 6 |
25.2 |
474.8 |
1.44 |
0.66 |
0.72 |
0.73 |
| Valley |
South
Zone Var 1 |
23.1 |
476.9 |
3.85 |
2.14 |
1.96 |
2.13 |
| Valley |
South
Zone Var 5 |
18.8 |
481.2 |
17.3 |
1.93 |
1.68 |
2.39 |
From SMA results we can see the gold grade of
the coarse fraction higher than 3-fold of the finer fraction grade in three of the eight variability samples for Shaft Zone, and in six
of the eight variability samples for South Zone. A significantly higher gold grade on the O/S might be the indication of gravity-recoverable
gold in the sample.
Diagnostic Leaching
Diagnostic leaching
tests were performed to assess gold association on 16 variability samples, eight samples from Shaft Zone and eight samples from South
Zone (comprised of Cow and Valley zones), and run of mine (“ROM”) composite samples from each of the following five
zones: Cow, Deep Shaft, Lowhee, Shaft and Valley. The three-stage diagnostic includes intensive cyanide leaching to infer free and exposed
gold, Aqua Regia digestion to infer gold associated to sulphides, and fire assay to infer gold encapsulated in silica. All samples were
ground to a target P80 of 45 μm in preparation for the test. Results are summarized in Table 13-10 (Base Met Labs,
2025).
| |
Osisko Development Corp.
NI 43-101 Technical Report
Feasibility Study for the Cariboo Gold Project |
|
Table 13-10: Diagnostic
leaching results
| Zone |
Sample |
Test |
Gold
Distribution - % |
Head
Assay |
Intensive
Cyanide Leach |
Aqua
Regia
Digest |
Fire
Assay |
Au
(g/t) |
| Shaft |
Shaft
Var 1 |
T02 |
93.4 |
2.6 |
4.0 |
2.1 |
| Shaft |
Shaft
Var 5 |
T06 |
95.2 |
4.7 |
0.1 |
12.0 |
| Shaft |
Shaft
Var 7 |
T08 |
98.1 |
1.7 |
0.2 |
4.8 |
| Shaft |
Shaft
Var 3 |
T04 |
98.9 |
1.0 |
0.1 |
17.9 |
| Deep
Shaft |
Shaft
Var 4 |
T05 |
94.3 |
5.4 |
0.2 |
4.4 |
| Deep
Shaft |
Shaft
Var 2 |
T03 |
95.0 |
4.8 |
0.2 |
5.4 |
| Deep
Shaft |
Shaft
Var 8 |
T09 |
96.7 |
3.1 |
0.2 |
5.8 |
| Deep
Shaft |
Shaft
Var 6 |
T07 |
97.5 |
2.2 |
0.3 |
3.2 |
| Cow |
South
Var 7 |
T16 |
81.2 |
16.7 |
2.1 |
0.5 |
| Cow |
South
Var 8 |
T17 |
87.4 |
11.0 |
1.6 |
0.6 |
| Cow |
South
Var 4 |
T13 |
92.3 |
6.6 |
1.1 |
0.9 |
| Cow |
South
Var 3 |
T12 |
95.9 |
2.5 |
1.5 |
3.9 |
| Deep
Valley |
South
Var 2 |
T11 |
93.3 |
6.3 |
0.4 |
2.2 |
| Deep
Valley |
South
Var 6 |
T15 |
94.0 |
4.5 |
1.5 |
0.7 |
| Valley |
South
Var 1 |
T10 |
98.1 |
1.1 |
0.8 |
2.6 |
| Valley |
South
Var 5 |
T14 |
99.7 |
0.0 |
0.3 |
1.8 |
| Shaft |
Shaft
Composite |
T18 |
94.0 |
4.3 |
1.7 |
3.5 |
| Deep
Shaft |
Deep
Shaft Composite |
T19 |
94.5 |
4.4 |
1.1 |
2.7 |
| Lowhee |
Lowhee
Composite |
T20 |
93.3 |
6.1 |
0.6 |
3.6 |
| Cow |
Cow
Composite |
T21 |
96.5 |
0.0 |
3.5 |
2.3 |
| Valley |
Valley
Composite |
T22 |
96.8 |
2.6 |
0.6 |
3.4 |
On average, the eight variability samples from
Shaft and Deep Shaft zones had 96% of the gold leachable by cyanide, 3.2% dissolved by Aqua Regia and 0.7% incapsulated in silica while
the average for the Shaft and Deep Shaft composites was 94% of the gold leachable by cyanide, 4.3% dissolved by Aqua Regia and 1.4% incapsulated
in silica.
Gold Deportment
A gold deportment study was completed by AMTEL
Ltd. in October 2024 (AMTEL, 2024). AMTEL Ltd. received three samples representing Shaft, Valley and Cow zones.
| |
Osisko Development Corp.
NI 43-101 Technical Report
Feasibility Study for the Cariboo Gold Project |
|
The following observations were made:
| ■ | Rock and sulphide mineral assemblages were found to be similar amongst all
the samples. The sulphides content, namely pyrite, was lower in the Cow Zone deposit. |
| ■ | Five split were assayed to determine the gold grade of the samples. The Shaft,
Valley and Cow zones had gold grades of 3.82 g/t, 4.83 g/t, and 1.52 g/t, respectively. |
| ■ | The ores TOC content ranged from 0.17–0.21%. It was noted that the
carbon matter did not appear highly active and minimal potential for preg-robbing was observed in samples for Valley and Cow zones. No
preg-robbing material was seen for the Shaft Zone sample. |
| ■ | Leach tests were performed under ‘intensive’ conditions (24 h
leach time, 5 g/l sodium cyanide (“NaCN”), 30% solids, and approximately 30 kg/t activated carbon) for head sample and each
of the individual size fractions used to determine the gold deportment. |
| ■ | Theoretical flotation performance calculations were completed to determine
the potential metallurgical response of the three mineralized zones and findings are summarized in Table 13-11, along with the leaching
test results. |
Table 13-11: Leaching and
flotation results
| Sample ID |
Leaching |
Flotation (Estimations) |
| Description |
Feed
Grade
g/t Au |
Residue
Grade
g/t Au |
Au
Recovery
% |
Rougher
Conc. Grade
ppm Au |
Mass
Pull
%% |
Rougher
Recovery
% |
| Shaft |
Head Sample |
3.802 |
0.222 |
94.2 |
42.9 |
10.2 |
95 |
| Individual Fractions |
4.595 |
0.37 |
92 |
| Valley |
Head Sample |
4.826 |
0.291 |
94 |
65.5 |
8.5 |
97 |
| Individual Fractions |
5.739 |
0.298 |
94.8 |
| Cow |
Head Sample |
1.506 |
0.073 |
95.2 |
36 |
5.4 |
96 |
| Individual Fractions |
2.014 |
0.08 |
96 |
Source: AMTEL, 2024
Both leaching and theoretical flotation yielded
positive recovery results. The forecast for rougher flotation gold recovery ranged from 95–97%. The forecast for whole ore leaching
shows gold recoveries of 92–96%.
| |
Osisko Development Corp.
NI 43-101 Technical Report
Feasibility Study for the Cariboo Gold Project |
|
| 13.2 | Comminution Test Work |
Samples were submitted to crusher work index (“CWi”),
Bond ball mill work index (“BWi”), and abrasion index (“Ai”) testing at SGS. The OSC from the Shaft Zone had CWi
ranging from 5.7 kWh/t to 6.9 kWh/t, while the unsorted material from the Cow Zone had a CWi ranging from 12.4 kWh/t to
18.5 kWh/t. BWi tests were performed on the fines and OSC individually. The fines had a BWi ranging from 10.7 kWh/t to 12.1
kWh/t for mesh size 150, and 14.2 kWh/t for mesh size 230. The OSC had a BWi ranging from 14.0 kWh/t to 17.0 kWh/t for mesh
size 230.
The CWi and BWi results categorize the hardness
of the mineralized material as medium. The Ai categorized the mineralized material abrasiveness as medium for the sorted Shaft Zone material,
and moderately abrasive for the unsorted Cow Zone material.
Subsamples of Lowhee composite were submitted
for BWi and Ai testing at SGS. BWi result was 13.2 kWh/t, and categorized the hardness of the mineralized material as moderately
soft, and the Ai result was 0.285, categorized as medium abrasive.
| 13.2.3 | Base Met Labs – 2024 |
The Base Met Labs campaign included the following
comminution test work to assess variability across the ore zones:
| ■ | SMC Testing (completed by JKTech); |
| ■ | Hardness Index Test (“HIT”); |
| ■ | Bond test work (RWi, BWi and Ai). |
SMC Results
The test work was conducted on composite samples
from each of the following five zones: Cow, Deep Shaft, Lowhee, Shaft and Valley. SMC Test® results are summarized in Table 13-12
and Table 13-13, and Figure 13-5 and Figure 13-6.
| |
Osisko Development Corp.
NI 43-101 Technical Report
Feasibility Study for the Cariboo Gold Project |
|
Table 13-12: SMC Test®
results
| Sample Designation |
DWi
(kWh/m3) |
DWi
(%) |
Mi Parameters (kWh/t) |
SG |
| Mia* |
Mih* |
Mic* |
| Cow |
4.9 |
28 |
15 |
10.4 |
5.4 |
2.73 |
| Deep Shaft |
4.4 |
22 |
13.4 |
9.1 |
4.7 |
2.78 |
| Lowhee |
3.8 |
16 |
12.1 |
8 |
4.1 |
2.72 |
| Shaft |
4.7 |
25 |
14.2 |
9.8 |
5.1 |
2.79 |
| Valley |
3.5 |
14 |
11.2 |
7.3 |
3.8 |
2.8 |
DWi = Drop Weight index
Mi = Ore work index (includes Mia,
Hih and Mic)
Mia = Coarse ore work index; Mih
= HPGR ore work index; Mic = Crushing ore work index
Source: JKTech, 2024
Table 13-13: Parameters
derived from the SMC Test® results
| Sample Designation |
A |
b |
A*b |
ta |
SCSE(1)
(kWh/t) |
| Cow |
67 |
0.83 |
55.6 |
0.53 |
8.58 |
| Deep Shaft |
65.3 |
0.98 |
64 |
0.6 |
8.16 |
| Lowhee |
66.1 |
1.1 |
72.7 |
0.69 |
7.69 |
| Shaft |
62.3 |
0.95 |
59.2 |
0.55 |
8.44 |
| Valley |
63.6 |
1.25 |
79.5 |
0.74 |
7.51 |
(1) “SCSE”: SAG Circuit Specific Energy
Overall, Cariboo samples are classified as moderate
hardness according to JKTech database.
| |
Osisko Development Corp.
NI 43-101 Technical Report
Feasibility Study for the Cariboo Gold Project |
|
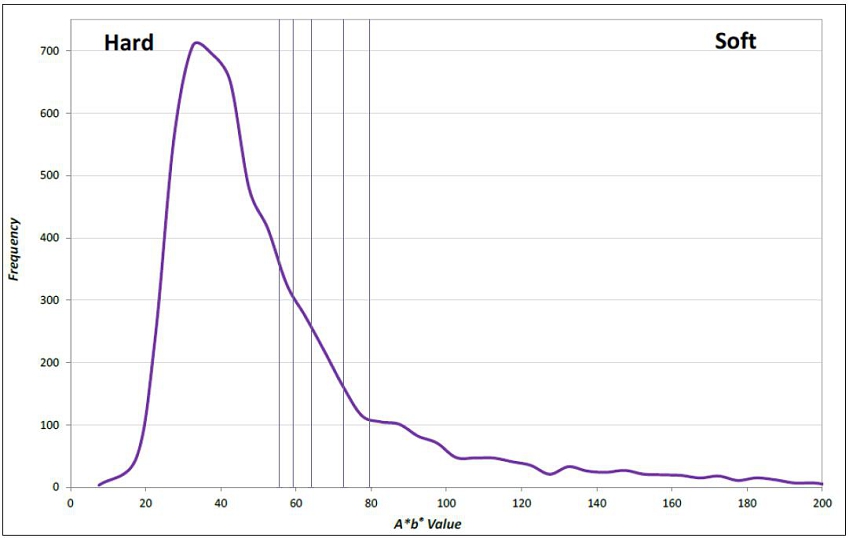
Figure 13-5: Frequency
distribution of A*b in the JKTech database
(Source: JKTech, 2024)
| |
Osisko Development Corp.
NI 43-101 Technical Report
Feasibility Study for the Cariboo Gold Project |
|
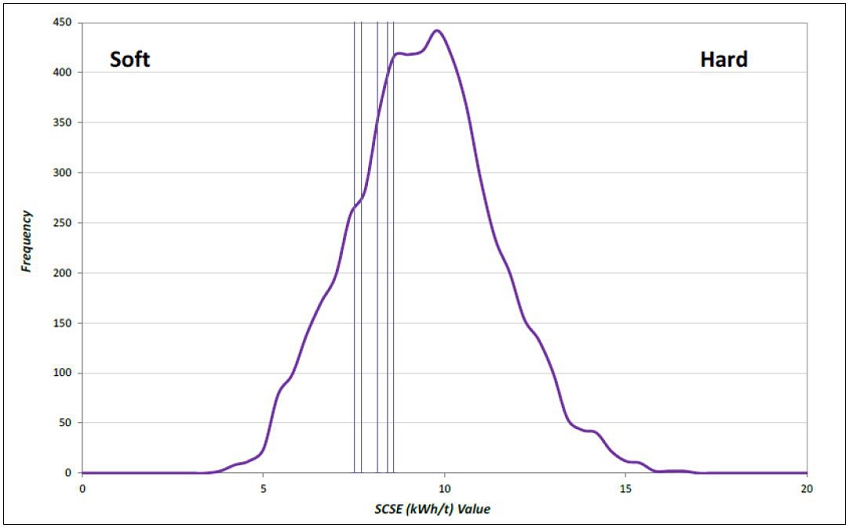
Figure 13-6: Frequency
distribution of A*b in the JKTech database
(Source: JKTech, 2024)
Hardness Index Test
SimSAGe Pty Ltd. designed the HIT to enable rapid,
on-site rock hardness assessments, providing instant insights into material variability at mining locations. The HIT leverages a key principle
of single particle impact testing, allowing for a reliable estimation of the Axb index through a precise, low-energy test Industrial trials
have validated its accuracy, demonstrating that HIT results closely match Axb values obtained through the JK Drop Weight Test or SMC Test—provided
the same fragments and standardized sizing protocols are used in both methods. (Kojovic, 2016; Napier-Munn et al., 1996).
The HIT was intended
to assess variability within the Shaft Zone and South Zone (comprised of Cow and Valley). Results are presented in Table 13-14.
| |
Osisko Development Corp.
NI 43-101 Technical Report
Feasibility Study for the Cariboo Gold Project |
|
Table 13-14: HIT test work
results
| Zone |
Sample
Designation |
HIT
– Axb (16 mm x 19 mm) |
| Set
1 |
Set
2 |
Set
3 |
Av |
| Shaft |
Shaft
Zone 0 |
65 |
120 |
65 |
83 |
| Shaft |
Shaft
Zone 1 |
51 |
63 |
67 |
61 |
| Deep
Shaft |
Shaft
Zone 2 |
94 |
85 |
69 |
83 |
| Shaft |
Shaft
Zone 3 |
68 |
87 |
67 |
74 |
| Deep
Shaft |
Shaft
Zone 4 |
95 |
67 |
121 |
94 |
| Shaft |
Shaft
Zone 5 |
53 |
93 |
88 |
78 |
| Deep
Shaft |
Shaft
Zone 6 |
65 |
50 |
45 |
53 |
| Shaft |
Shaft
Zone 7 |
53 |
43 |
57 |
51 |
| Deep
Shaft |
Shaft
Zone 8 |
77 |
84 |
64 |
75 |
| Valley |
South
Zone 1 |
92 |
72 |
83 |
82 |
| Deep
Valley |
South
Zone 2 |
56 |
57 |
74 |
63 |
| Cow |
South
Zone 3 |
76 |
58 |
65 |
67 |
| Cow |
South
Zone 4 |
66 |
67 |
67 |
67 |
| Valley |
South
Zone 5 |
60 |
71 |
47 |
59 |
| Deep
Valley |
South
Zone 6 |
53 |
112 |
51 |
72 |
| Cow |
South
Zone 7 |
96 |
94 |
86 |
92 |
| Cow |
South
Zone 8 |
63 |
53 |
56 |
57 |
Bond Test Work
The BWi and Ai test work was conducted on OSC
for Shaft Zone and ROM composite samples from each of the following five zones: Cow, Deep Shaft, Lowhee, Shaft and Valley. Bond Rod Work
Index (“RWi”) was only performed on the Shaft Zone composite sample.
BWi was tested at sieve size of 212 µm and
RWi at sieve size 1,180 µm. Table 13-15 summarizes test results, including test feed size (F80), test product size
(P80) and net U/S produced per mill revolution (grams per revolution (“Gpr”)).
| |
Osisko Development Corp.
NI 43-101 Technical Report
Feasibility Study for the Cariboo Gold Project |
|
Table 13-15: Bond test
work results
Sample
Designation |
Bond RWi |
Bond BWi |
Abrasion
Index |
| F80-μm |
P80-μm |
Gpr |
kWh/t |
F80-μm |
P80-μm |
Gpr |
kWh/t |
| Shaft (OSC) |
|
|
|
|
1,786 |
151 |
2.39 |
12.2 |
|
| Shaft |
9,292 |
915 |
15.08 |
10.9 |
1,993 |
159 |
2.65 |
11.3 |
0.11 |
| Deep Shaft |
|
|
|
|
1,887 |
155 |
2.62 |
11.3 |
0.12 |
| Lowhee |
|
|
|
|
1,952 |
162 |
2.88 |
10.8 |
0.20 |
| Cow |
|
|
|
|
1,959 |
159 |
2.75 |
11.0 |
0.14 |
| Valley |
|
|
|
|
2,003 |
162 |
2.52 |
11.9 |
0.20 |
| 13.3 | Ore Sorting Test Work |
Ore sorting test work was conducted at Steinert
facilities in Kentucky, USA, in August 2018. The initial test work program focused on 1,264 kg of drill core material, from
Shaft, Cow, Valley and Mosquito zones, crushed to -60 mm/+10 mm. The ore sorting products of two samples from Shaft Zone and
Cow Zone were recombined to reproduce the previously tested -60 mm/+10 mm feed, crushed to -35 mm/+10 mm, and sent
back to Steinert for ore sorting. A summary of these samples is presented in Table 13-16.
Table 13-16: Ore sorted
LOM composites
| Zone |
Sample ID |
Mass (kg) |
Size Fraction |
| Shaft |
SZ1 |
239 |
-60 mm/+10 mm |
| Shaft |
SZ2 |
252 |
| Cow |
CZ |
325 |
| Valley |
VZ1 |
46 |
| Mosquito |
MC |
8 |
| Run of Mine |
ROM 1 |
30 |
| Run of Mine |
ROM 2 |
70 |
| Run of Mine |
ROM 1-2 |
62 |
| Valley |
VZ2 |
70 |
| Shaft |
LOM-SZ |
178 |
| Shaft |
SZ |
66 |
-35 mm/+10 mm |
| Cow |
CZ |
58 |
| |
Osisko Development Corp.
NI 43-101 Technical Report
Feasibility Study for the Cariboo Gold Project |
|
The second ore sorting test work program involved
the variability samples from three mineralized deposits. Ten variability samples sized -35 mm/+10 mm were ore sorted at Steinert
in January 2019. The summary of the variability samples is presented in Table 13-17.
Once the ore sorting tests were completed, the
ore sorting products were sent to SGS for analysis along with the -8 mm fines generated during ore sorting due to sample handling.
Table 13-17: Ore sorted
variability composites
| Zone |
Sample ID |
Mass (kg) |
Size Fraction |
| Shaft |
SZ LOM |
330 |
-35 mm/+10 mm |
| SZ High Grade |
149 |
| SZ Low Grade |
158 |
| SZ Deep |
129 |
| Cow |
CZ LOM |
161 |
| CZ Low Grade |
208 |
| CZ High Grade |
134 |
| Valley |
VZ LOM |
36 |
| VZ Low Grade |
61 |
| VZ High Grade |
27 |
| 13.3.1.1 | Sensor Evaluation |
In order to determine the best sensor suited to
the project material, hand-picked core samples representing mineralized rock and waste rock were prepared. The response of these two groups
of rocks to X-Ray Transmission (“XRT”), colour camera, induction, and XRT/laser combination scanners were evaluated.
An XRT/laser combination was used for the testing
based on the results of the evaluation.
| 13.3.1.2 | Flowsheet Tests and Results |
The tests on each sample were run in a five-stage
process. The first four stages were “rougher” stages consisting of XRT only at different scanner settings. The purpose of
the XRT scanner is to collect the sulphide minerals. The fifth stage was a laser scanner “scavenger” to collect quartz-bearing
particles.
| |
Osisko Development Corp.
NI 43-101 Technical Report
Feasibility Study for the Cariboo Gold Project |
|
The XRT rougher stage conditions were set up to
be highly selective at first to produce the highest-grade concentrate with the least amount of mass pull. With each additional stage,
the conditions became less selective, increasing recovery but decreasing concentrate grade. Conditions for maximum gold recovery and simultaneous
waste rejection were selected based on the analysis of the results. A summary of the results for each sample tested is presented in Table 13-18.
The “Fines” in the table refers to the fines generated during the sorting test manipulation. According to the ore sorter strategy,
they can be combined with concentrate. The mass-recovery curves for each sample are illustrated in Figure 13-7.
| |
Osisko Development Corp.
NI 43-101 Technical Report
Feasibility Study for the Cariboo Gold Project |
|
Table 13-18: Ore sorting
test results – ROM composites
| Zone |
Sample ID |
Feed
Grade
(Au, g/t) |
Mass Pull (%) |
Au Distribution (%) |
Product Grade (Au, g/t) |
| Conc.(1) |
Waste |
Fines |
Conc.(1) |
Waste |
Fines |
Conc.(1) |
Waste |
Fines |
| Shaft |
SZ1 |
7.48 |
70.4 |
29.6 |
4.2 |
99.2 |
0.8 |
3.7 |
10.8 |
0.2 |
6.6 |
| Shaft |
SZ2 |
7.35 |
60.7 |
39.3 |
2.6 |
98.2 |
1.8 |
4.5 |
11.9 |
0.3 |
12.7 |
| Cow |
CZ |
4.67 |
48.7 |
51.3 |
4.1 |
97.4 |
2.6 |
5.6 |
9.6 |
0.2 |
6.4 |
| Valley |
VZ1 |
3.77 |
78.1 |
21.9 |
3.1 |
99.0 |
1.0 |
7.9 |
4.6 |
0.2 |
9.7 |
| Mosquito |
MC |
4.92 |
86.1 |
13.9 |
6.7 |
99.1 |
0.9 |
8.9 |
5.6 |
0.3 |
6.3 |
| Run of Mine |
ROM 1 |
5.19 |
82.2 |
17.8 |
3.8 |
99.2 |
0.8 |
7.9 |
6.0 |
0.2 |
10.7 |
| Run of Mine |
ROM 2 |
5.3 |
52.4 |
47.6 |
11.2 |
95.1 |
4.9 |
10.9 |
10.8 |
0.5 |
5.2 |
| Run of Mine |
ROM 1-2 |
6.89 |
42.4 |
57.6 |
0.1 |
96.9 |
3.1 |
0.2 |
15.8 |
0.4 |
9.6 |
| Valley |
VZ2 |
3.77 |
44.2 |
55.8 |
0.9 |
97.4 |
2.6 |
1.1 |
8.4 |
0.2 |
4.5 |
| Shaft |
LOM-SZ |
9.27 |
65.2 |
34.8 |
1.9 |
98.9 |
1.1 |
1.4 |
14.3 |
0.3 |
6.8 |
| Shaft |
SZ (-35 mm/+10 mm) |
5.94 |
44.2 |
55.8 |
0.9 |
96.6 |
3.4 |
1.2 |
13.1 |
0.4 |
7.8 |
| Cow |
CZ (-35 mm/+10 mm) |
7.10 |
65.2 |
34.8 |
1.9 |
77.5 |
22.5 |
2.8 |
8.4 |
4.6 |
10.9 |
| Global Average |
5.97 |
61.7 |
38.4 |
3.5 |
96.2 |
3.8 |
4.7 |
9.9 |
0.7 |
8.1 |
| Minimum |
- |
42.4 |
13.9 |
0.1 |
77.5 |
0.8 |
0.2 |
4.6 |
0.2 |
4.5 |
| Maximum |
- |
86.1 |
57.6 |
11.2 |
99.2 |
22.5 |
10.9 |
15.8 |
4.6 |
12.7 |
| (1) | Concentrate (“Conc.”) mass recovery, gold distribution, and grade values include fines. |
| |
Osisko Development Corp.
NI 43-101 Technical Report
Feasibility Study for the Cariboo Gold Project |
|
Table 13-19: Ore sorting
test results – Variability composites
| Zone |
Sample ID |
Feed Grade (Au, g/t) |
Mass pull (%) |
Au distribution (%) |
Product grade (Au, g/t) |
| Conc.(1) |
Waste |
Fines |
Conc.(1) |
Waste |
Fines |
Conc.(1) |
Waste |
Fines |
| Shaft |
SZ LOM |
6.47 |
33.6 |
66.4 |
0.1 |
86.8 |
13.2 |
0.2 |
16.73 |
1.28 |
9.66 |
| SZ High Grade |
9.74 |
44.5 |
55.5 |
0.1 |
92.0 |
8.0 |
0.3 |
20.17 |
1.40 |
18.60 |
| SZ Low Grade |
4.68 |
34.8 |
65.2 |
0.1 |
93.5 |
6.5 |
0.2 |
12.58 |
0.46 |
8.99 |
| SZ Deep |
3.41 |
32.4 |
67.6 |
0.1 |
35.6 |
64.4 |
0.2 |
3.74 |
3.25 |
6.32 |
| Cow |
CZ LOM |
3.95 |
65.7 |
34.3 |
6.8 |
64.0 |
36.0 |
5.6 |
3.85 |
4.14 |
3.24 |
| CZ Low Grade |
3.45 |
65.6 |
34.4 |
4.7 |
96.2 |
3.8 |
7.1 |
5.06 |
0.38 |
5.21 |
| CZ High Grade |
14.05 |
70.0 |
30.0 |
9.1 |
99.7 |
0.3 |
5.3 |
20.01 |
0.15 |
8.14 |
| Valley |
VZ LOM |
5.77 |
61.2 |
38.8 |
5.8 |
98.4 |
1.6 |
11.1 |
9.27 |
0.24 |
5.77 |
| VZ Low Grade |
2.90 |
56.3 |
43.7 |
5.4 |
95.5 |
4.5 |
7.3 |
4.92 |
0.29 |
3.86 |
| VZ High Grade |
5.96 |
43.0 |
57.0 |
6.3 |
97.6 |
2.4 |
8.0 |
13.53 |
0.25 |
7.65 |
| SZ Average |
6.07 |
36.3 |
63.7 |
0.1 |
77.0 |
23.0 |
0.2 |
13.30 |
1.60 |
10.89 |
| CZ Average |
7.15 |
67.1 |
32.9 |
6.9 |
86.6 |
13.4 |
6.0 |
9.64 |
1.56 |
5.53 |
| VZ Average |
4.88 |
53.5 |
46.5 |
5.8 |
97.2 |
2.8 |
8.8 |
9.24 |
0.26 |
5.76 |
| Global Average |
6.04 |
50.7 |
49.3 |
3.9 |
85.9 |
14.1 |
4.5 |
10.99 |
1.18 |
7.74 |
| (1) | Concentrate mass recovery, gold
distribution, and grade values include fines. |
| |
Osisko Development Corp.
NI 43-101 Technical Report
Feasibility Study for the Cariboo Gold Project |
|
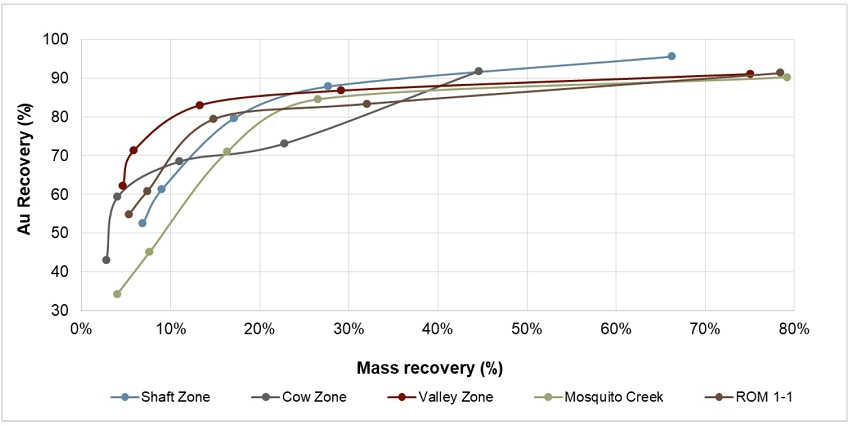
Figure 13-7: Ore sorting
mass-recovery curves
The XRT was successful in recovering 70% to 94%
of the gold after four roughing stages targeting sulphide bearing rock with only 23% to 37% mass pull. The implementation of a laser scavenging
step to collect quartz particles increased gold recovery on average by approximately 2% for Shaft Zone samples and approximately 9% for
Cow Zone and Valley Zone samples. However, the associated mass recovery increased by 19% on average; ranging between 7% and 32%. In general,
Shaft Zone samples had lower mass recoveries at the laser stage. With further testing, it may be possible to optimize the ore sorter setting
for quartz recovery to maintain gold recovery and limit mass pull.
The samples prepared and sent to Steinert were
screened to the designated feed sizes (-60 mm/+10 mm or -35 mm/+10 mm); however, there were fines generated during
transport, material handling, and testing. The mass and gold recoveries of the generated fines (-8 mm) collected at the end of the
tests were included in the total recovery and grade. It is critical to consider the fines during circuit design as they represent an average
of 5% of the gold fed at the ore sorting stage. In the test work, the concentrate was targeted for separation by air jet while the fines
reported with the waste to the conveyor belt and then were screened out. In operations, the waste will be removed by air jetting and the
fines will report with the concentrate (Steinert, 2019).
| |
Osisko Development Corp.
NI 43-101 Technical Report
Feasibility Study for the Cariboo Gold Project |
|
| 13.3.1.3 | Ore Sorter Performance |
Table 13-20: Summary –
Average ore sorting recoveries
| Zone |
Feed grade
(Au, g/t) |
Mass recovery
(%) |
Au recovery
(%) |
Conc. grade
(Au, g/t) |
Waste grade
(Au, g/t) |
| Shaft |
6.8 |
48.2 |
87.6 |
12.9 |
0.9 |
| Cow |
6.6 |
63.0 |
87.0 |
9.4 |
1.9 |
| Valley |
4.4 |
56.6 |
97.6 |
8.1 |
0.2 |
The average mass recovery of the Cow Zone and
Valley Zone ore sorting concentrates were higher than the Shaft Zone ore sorting concentrates. Although gold recoveries for the majority
of the tested samples were higher than 87%, Shaft Zone Deep, Cow Zone LOM, and Cow Zone (-35 mm/+10 mm) samples were outliers
with lower recoveries. The global average recovery increases to 95.7% if these outlying data points are excluded. Further test work is
required to determine the response to mineralogical variation and to optimize the ore sorting settings.
| 13.3.1.4 | Effect of Particle Size |
The Shaft Zone and Cow Zone samples of -60 mm/+10 mm
size fraction, which were outside the recommended top size to minimum size range of 3:1, were re-crushed to -35 mm/+10 mm and
re-submitted to the ore sorting procedure. The results of re-runs are presented in Table 13-18. For the Shaft Zone, the mass recovery
improved significantly from an average of 65% to 44% without compromising the gold recovery. However, for the Cow Zone, gold recovery
dropped unexpectedly. Although the mass pull was higher, 4.6% of gold was reported to waste. The test work on the -35 mm/+10 mm
size range with the variability samples followed the same trend for Shaft Zone.
| 13.3.2 | Tomra – 2020 (Shaft Zone) |
Ore sorting test work was conducted in Wedel,
Germany by Tomra in 2020. The initial sample was 2,213 kg from the Shaft Zone. The sample was screened, the U/S material (-10 mm)
was removed, and two ranges of grain sizes, +10/-25 mm and +25 mm, were generated. In Test Series 1, the +25 mm material was sorted,
while in Test Series 2, the +10/-25 mm fine-grain materialwas sorted. The sample preparation flowsheet is shown in Figure 13-8.
Tomra used XRT sensors to detect sulphides, and laser sensors to detect quartz particles.
| |
Osisko Development Corp.
NI 43-101 Technical Report
Feasibility Study for the Cariboo Gold Project |
|
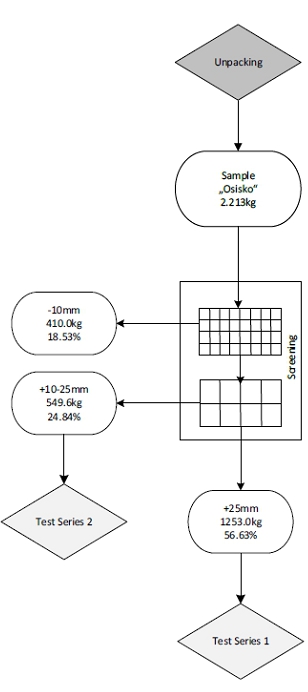
Figure 13-8: Sample preparation
flow diagram
(Source: Tomra, 2021)
The flowsheet used to produce ore sorter concentrates
is a “cascade” method, where the sorting is conducted in series with increased sorting sensitivity. The first two sorting
steps were performed with the XRT sensor to produce a high-medium-grade concentrate and a low-grade concentrate. The waste from XRT tests
was sorted with the laser sensor in scavenger tests. The Series 1 sample underwent additional screening and a second laser sorting
stage after the first scavenger test, to produce a massive quartz and a quartz vein product.
| |
Osisko Development Corp.
NI 43-101 Technical Report
Feasibility Study for the Cariboo Gold Project |
|
Test work results showed that the use of XRT sorting
resulted in significant upgrades and high recovery rates. For the coarser sample +25 mm, using setting 1 resulted in a recovery
of 96.4% with a mass pull of 35.5% while the feed grade 2.33 g/t upgraded to 6.24 g/t. Applying a more sensitive setting 2
increased the recovery up to 99.2% with a total mass pull of 47.5% including the screened fines. The results achieved by XRT showed no
need for additional techniques and contributed to the assumption that the gold in the tested material was mainly associated with sulphides.
| 13.3.3 | Steinert – 2022 (Lowhee Zone) |
Sorting test work was performed on the (-50/+16 mm)
(Sun, 2022a) size fraction of the Lowhee composite at Steinert using a combination of Laser and XRT sensors (von Ketelhodt and Karem,
2022). The sorting products obtained from the test work were sent back to SGS Burnaby for assaying. The sorting test results are summarized
in Table 13-21. Products 426.1.1, 426.2.1, and 426.3.2 (fine) were combined to create a sorting concentrate of 3.45 g Au/t with 91%
gold recovery and 47% mass recovery.
Table 13-21: Lowhee sorting
test results
| Sorting Product ID |
Au grade (g/t) |
Mass distribution (%) |
Au distribution (%) |
| 426.1.1 |
3.45 |
25 |
78 |
| 426.2.1 |
0.49 |
20 |
9 |
| 426.3.1 |
0.17 |
21 |
3 |
| 426.3.2 (fine) |
2.67 |
2 |
4 |
| 426.3.2 (coarse) |
0.20 |
32 |
6 |
| Sorting Feed |
1.11 |
100 |
100 |
| 13.3.4 | Base Met Labs – 2024 |
Bench scale XRT amenability tests were completed
to assess mass and metal recoveries to up to six levels of XRT response to determine the theoretical mass-metal recovery curves. XRT scanning
was completed on composite samples from Shaft, Deep Shaft, Cow, Valley and Lowhee zones, one Shaft Zone bulk composite sample, and two
variability samples.
| |
Osisko Development Corp.
NI 43-101 Technical Report
Feasibility Study for the Cariboo Gold Project |
|
All samples were crushed to 100% passing 32.5 mm
and each sample was separated into three size fractions via screening. The two coarse size fractions were combined (-32.5/+16 mm)
and the remaining fines (-16 mm) were collected. XRT scanning was completed on the combined coarse size fractions. After scanning,
each rock was classified and hand picked into one of up to six XRT response groupings. Each of the XRT groups were then weighed and assayed
to identify the mass pull and recovery of gold, silver, sulphur and other elements in the grouping.
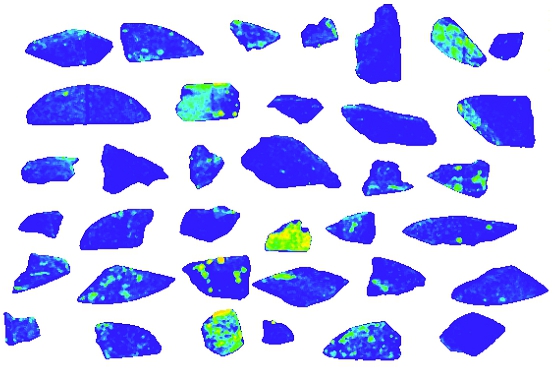
Figure 13-9: XRT Scan (Shaft
1A sample)
The fines upgrade was observed again in this test
work program. The results of the mass recovery versus gold and sulphur recoveries for each zone are shown in Figure 13-10.
| |
Osisko Development Corp.
NI 43-101 Technical Report
Feasibility Study for the Cariboo Gold Project |
|
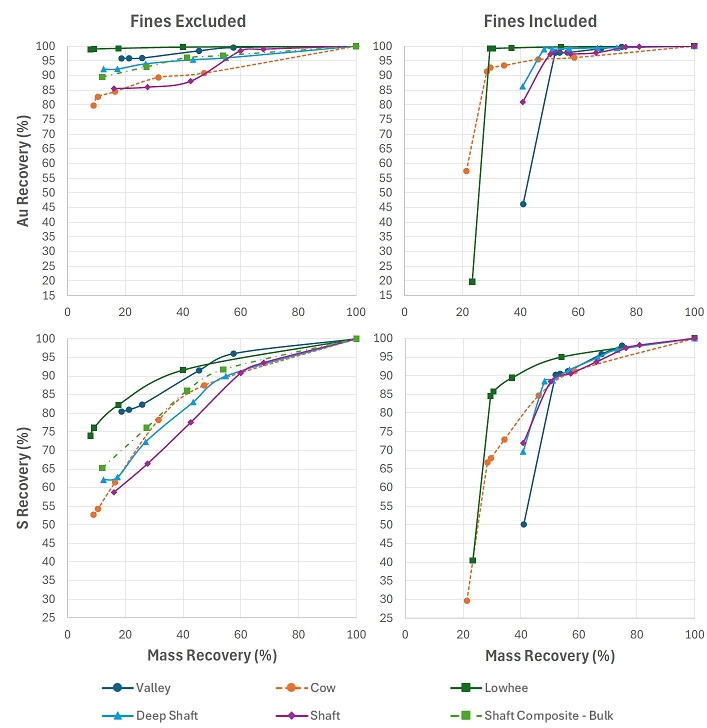
Figure 13-10: Gold and
sulphur recovery vs mass recovery
(Base Met Labs, 2025)
| |
Osisko Development Corp.
NI 43-101 Technical Report
Feasibility Study for the Cariboo Gold Project |
|
| 13.3.4.1 | Ore Sorting Results |
Ore sorting results for the samples and composites
used for downstream test work are summarized in Table 13-22. Samples were sorted manually, assuming rock belongs to rejects if from
XRT response groups 1 or 2 (the weaker XRT response groups), which is assumed to be the conditions for maximum gold recovery.
Table 13-22: Ore sorting
results
| Zone |
Sample |
Mass
(g) |
Grade |
Distribution (%) |
| Au (g/t) |
S (%) |
Fe (%) |
Mass |
Au |
S |
Fe |
| Shaft |
Zone Comp |
10,000 |
2.97 |
2.7 |
4.9 |
100 |
100 |
100 |
100 |
| Sorter Feed |
5,921 |
0.95 |
1.3 |
3.4 |
59.2 |
19.0 |
28.1 |
41.5 |
| Fines (< 16 mm) |
4,079 |
5.89 |
4.8 |
7.0 |
40.8 |
81.0 |
71.9 |
58.5 |
| OSC |
3,551 |
1.57 |
2.0 |
4.6 |
35.5 |
18.7 |
25.5 |
33.5 |
| Sorter Tails |
2,370 |
0.04 |
0.3 |
1.6 |
23.7 |
0.3 |
2.6 |
8.0 |
| Sorted Comp |
7,630 |
3.88 |
3.5 |
5.9 |
76.3 |
99.7 |
97.4 |
92.0 |
| Deep Shaft |
Zone Comp |
9,960 |
5.01 |
3.2 |
4.2 |
100 |
100 |
100 |
100 |
| Sorter Feed |
5,901 |
1.16 |
1.6 |
3.1 |
59.2 |
13.7 |
30.4 |
43.5 |
| Fines (< 16 mm) |
4,059 |
10.60 |
5.5 |
5.8 |
40.8 |
86.3 |
69.6 |
56.5 |
| OSC |
2,569 |
2.54 |
3.1 |
5.1 |
25.8 |
13.1 |
25.2 |
31.7 |
| Sorter Tails |
3,332 |
0.09 |
0.5 |
1.5 |
33.5 |
0.6 |
5.2 |
11.8 |
| Sorted Comp |
6,628 |
7.48 |
4.6 |
5.5 |
66.5 |
99.4 |
94.8 |
88.2 |
| Lowhee |
Zone Comp |
9,966 |
4.29 |
2.8 |
3.0 |
100 |
100 |
100 |
100 |
| Sorter Feed |
7,637 |
4.49 |
2.2 |
2.5 |
76.6 |
80.3 |
59.5 |
65.4 |
| Fines (< 16 mm) |
2,329 |
3.62 |
4.9 |
4.4 |
23.4 |
19.7 |
40.5 |
34.6 |
| OSC |
1,350 |
25.23 |
10.2 |
9.2 |
13.5 |
79.7 |
48.9 |
42.0 |
| Sorter Tails |
6,286 |
0.04 |
0.5 |
1.1 |
63.1 |
0.6 |
10.6 |
23.4 |
| Sorted Comp |
3,679 |
11.55 |
6.8 |
6.2 |
36.9 |
99.4 |
89.4 |
76.6 |
| Cow |
Zone Comp |
9,995 |
2.64 |
1.6 |
3.0 |
100 |
100 |
100 |
100 |
| Sorter Feed |
7,862 |
1.43 |
1.4 |
2.8 |
78.7 |
42.6 |
70.4 |
75.0 |
| Fines (< 16 mm) |
2,133 |
7.09 |
2.2 |
3.5 |
21.3 |
57.4 |
29.6 |
25.0 |
| OSC |
2,480 |
4.04 |
3.5 |
5.5 |
24.8 |
38.1 |
55.0 |
46.1 |
| Sorter Tails |
5,382 |
0.22 |
0.4 |
1.6 |
53.8 |
4.5 |
15.3 |
29.0 |
| Sorted Comp |
4,613 |
5.45 |
2.9 |
4.6 |
46.2 |
95.5 |
84.7 |
71.0 |
| Valley |
Zone Comp |
9,975 |
3.77 |
4.2 |
5.1 |
100 |
100 |
100 |
100 |
| Sorter Feed |
5,889 |
3.44 |
3.5 |
4.4 |
59.0 |
53.8 |
49.9 |
51.1 |
| Fines (< 16 mm) |
4,085 |
4.25 |
5.1 |
6.1 |
41.0 |
46.2 |
50.1 |
48.9 |
| OSC |
2,685 |
7.43 |
7.1 |
7.8 |
26.9 |
53.0 |
45.7 |
40.8 |
| Sorter Tails |
3,205 |
0.10 |
0.6 |
1.6 |
32.1 |
0.9 |
4.2 |
10.3 |
| Sorted Comp |
6,770 |
5.51 |
5.9 |
6.8 |
67.9 |
99.1 |
95.8 |
89.7 |
| |
Osisko Development Corp.
NI 43-101 Technical Report
Feasibility Study for the Cariboo Gold Project |
|
The recoveries to the sorted composite were 76%
mass and 99.7% Au for the Shaft Zone, 66% mass and 99.4% Au for the Deep Shaft Zone, 37% mass and 99.4% Au for the Lowhee Zone, 46% mass
and 95.5% Au for the Cow Zone, and 68% mass and 99.1% Au for the Valley Zone.
| 13.4 | Gravity
Concentration |
The Extended Gravity
Recoverable Gold (“E-GRG”) test was performed on a subsample of the Fines composite. Gravity concentration tests were
performed on the blend of OSC and flotation concentrate prior to leach tests as per envisioned flowsheet at the time. The samples were
first subjected to gravity concentration using a lab scale Knelson concentrator and further concentrated with Mozley table. The average
gold recovery was 28.1%.
A standard E-GRG
test was conducted on the blend of the three rougher flotation concentrates from the rougher flotation testing in Section 13.5.2.3.
The E-GRG test on the combined flotation concentrate sample (Fconc) was performed to determine the theoretical maximum amount of gold
recovery. The test was done at two grind sizes (two stages) and the results are shown in Table 13-23. The overall gold and silver
gravity recoveries for the combined flotation sample were 31.8% and 14.2%, respectively.
Table 13-23: E-GRG test
results summary – gold and silver
Sample
ID |
P80, (µm) |
Mass (%) |
Cumulative
Recovery (%) |
Concentrate
Grade
(g/t) |
Head Grade (g/t) |
| Stage 1 |
Stage 2 |
Stage 1 |
Stage 2 |
Stage 1 |
Stage 2 |
Direct |
Calculated |
| Fconc - Gold |
112 |
50 |
0.62 |
0.55 |
17.9 |
31.8 |
1,028 |
39.2 |
37.8 |
| Fconc - Silver |
112 |
50 |
0.62 |
0.55 |
9.4 |
14.2 |
291 |
26.7 |
23.9 |
| |
Osisko Development Corp.
NI 43-101 Technical Report
Feasibility Study for the Cariboo Gold Project |
|
A 6-kg composite of the Lowhee Blend composite
was submitted to gravity concentration. The material was ground to a P80 of 199 µm and processed on a single-pass
through a Knelson MD-3 concentrator. The gravity concentrate was assayed for gold and silver to extinction and the test results are summarized
on Table 13-24. Gravity tailings were used for leaching tests.
Table 13-24: Gravity separation
results for Lowhee
Sample
ID |
Product |
Weight |
Assays (g/t) |
Distribution (%) |
| g |
% |
Au |
Ag |
Au |
Ag |
| Lowhee Blend |
Knelson Concentrate |
97.1 |
1.6 |
203 |
10.5 |
47.6 |
21.0 |
| Knelson Tailings |
5,902.3 |
98.4 |
3.68 |
0.65 |
52.4 |
79.0 |
| Head (calc. gravity products) |
6,000 |
100 |
6.91 |
0.81 |
100 |
100 |
| Head Direct |
|
|
4.0 |
0.65 |
|
|
| 13.4.4 | Base Met Labs – 2024 |
E-GRG test work was conducted by Base Met Labs
in July 2024 on the bulk composite sample. The test program flowsheet consisted of two grinding stages and three stages of gravity
concentration using a lab Knelson concentrator. The E-GRG flowsheet is shown in Figure 13-11.
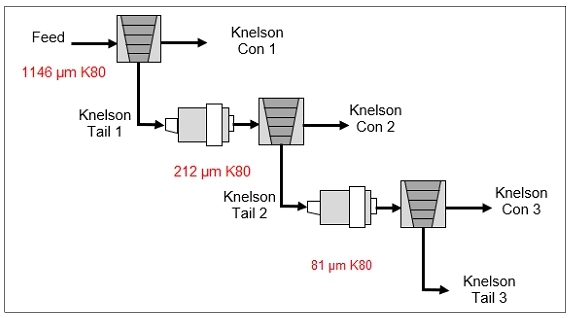
Figure 13-11: E-GRG flowsheet
schematic
(Base Met Labs, 2025)
| |
Osisko Development Corp.
NI 43-101 Technical Report
Feasibility Study for the Cariboo Gold Project |
|
The Knelson conditions applied to the E-GRG test
work and the test results are included in Table 13-25 and results are summarized in Table 13-26. The overall gold gravity recovery
for the three combined flotation concentrates was 55.1%.
Table 13-25: E-GRG test
Knelson conditions
| Knelson Concentration Conditions |
| G’s |
60 |
| Water Pressure to Bowl |
13.8 kPa |
| Fluidization Water Flowrate |
4.0 L/min |
| Feed Mass |
20 kg |
Table 13-26: E-GRG test
results summary
| Composite (Test) |
Product |
Feed Size
K80 (µm) per Stage |
Mass
(%) |
Assay
Au g/t |
% Au
Distribution |
| Bulk Composite GRG (T-01) |
Stage 1 Conc |
1,146 |
0.48 |
94.3 |
12.7 |
| Stage 2 Conc |
212 |
0.47 |
223.0 |
29.7 |
| Stage 3 Conc |
81 |
0.54 |
83.7 |
12.8 |
| Tailings |
- |
96.4 |
1.66 |
44.9 |
| Comb Conc 1-3 |
- |
1.50 |
131.2 |
55.1 |
The E-GRG test results were used by FLSmidth to
model the gravity circuit performance on both primary grinding circuit and regrind circuit. The results are summarized in Table 13-27.
The parameters assumed were:
| ■ | Mill feed rate: 3,300 tpd, 138 tph; |
| ■ | Sulphide content: 3.5% sulphur by mass; |
| ■ | Circulating load treated: 95% (in both circuits); |
| ■ | The as-tested GRG of 55.7% was corrected to 37.4% to account for the observed
nugget effect on test results. |
Two scenarios were
evaluated to predict the gravity performance within the regrind circuit and the maximum recovery results, assuming all GRG gold would
be recovered in the two gravity circuits, are aligned with the test results observed within the Base Met Labs test program.
| |
Osisko Development Corp.
NI 43-101 Technical Report
Feasibility Study for the Cariboo Gold Project |
|
Table 13-27: Gravity recovery model results
(Source: FLSmidth)
| Primary Grinding |
Regrind |
Overall,
Au Plant
Recovery |
| Installed Location |
Feed to
Primary
Gravity |
No of
Knelsons |
Au Primary
Recovery
to Gravity
Conc |
Installed
Location |
Feed to
Regrind
Gravity |
No of
Knelsons |
Au
Regrind
Recovery
to Gravity
Conc |
| (tph) |
(tph) |
| Ball Mill Discharge |
580 |
2 x QS48 |
24.8% |
Mill Discharge |
30 |
1 x QS30 |
4.3% |
29.1% |
| Ball Mill Discharge |
580 |
2 x QS48 |
24.8% |
Mill Discharge |
30 |
1 x QS30 |
19.5% |
44.3% |
Single pass gravity
concentration tests were performed on sorted composite samples for Shaft, Cow, Valley and Lowhee zones. Test work was completed within
the envisioned flowsheet for the Project including gravity concentration of ball mill discharge and regrind mill discharge target sizes
of P80 of 200-250 µm and P80 of 20-25 µm, respectively. Results are summarized in Table 13-28.
Gravity recoveries of gold on individual samples
ranged from 10% to 64% on primary grinding product and 17% to 46% (of primary mill feed) on regrind product. When looking at the averages
by zone, we see a much narrower range with 46% combined gold recovery for Lowhee Zone, 30% for Deep Shaft Zone, 32% for Cow Zone, 25%
for Valley Zone and 18% for Shaft Zone. The Blend composite sample yielded an average 36% combined gold recovery.
| |
Osisko Development Corp.
NI 43-101 Technical Report
Feasibility Study for the Cariboo Gold Project |
|
Table 13-28: Gravity concentration
tests
| Test
ID |
Composite
sample |
Grind
P80 (µm) |
Recalculated
Feed |
Gravity
Recovery (%) |
| Primary |
Regrind |
Au
(g/t) |
Ag
(g/t) |
S
(%) |
Con.
1 |
Con.
2 |
Total |
| R96 |
SORT |
Cow |
232 |
|
13.3 |
1.2 |
3.3 |
10 |
|
10 |
| Cl100 |
SORT |
Cow |
234 |
22 |
5.5 |
0.6 |
3.0 |
25 |
|
25 |
| Cl108 |
SORT |
Cow |
234 |
24 |
5.6 |
0.5 |
3.1 |
14 |
46 |
60 |
| R98 |
SORT |
Deep Shaft |
269 |
|
5.7 |
1.1 |
3.9 |
30 |
|
30 |
| Cl102 |
SORT |
Deep Shaft |
201 |
21 |
4.5 |
1.1 |
3.8 |
16 |
|
16 |
| Cl110 |
SORT |
Deep Shaft |
201 |
22 |
4.1 |
1.2 |
3.9 |
14 |
30 |
44 |
| R99 |
SORT |
Lowhee |
317 |
|
4.7 |
0.6 |
4.7 |
27 |
|
27 |
| Cl103 |
SORT |
Lowhee |
264 |
23 |
4.3 |
0.6 |
4.7 |
29 |
|
29 |
| Cl111 |
SORT |
Lowhee |
264 |
23 |
10.2 |
0.5 |
5.0 |
64 |
17 |
81 |
| Cl60D |
SORT |
Shaft |
250 |
20 |
5.1 |
0.9 |
4.3 |
20 |
|
20 |
| Cl60E |
SORT |
Shaft |
250 |
21 |
5.9 |
0.9 |
5.3 |
17 |
|
17 |
| R97 |
SORT |
Valley |
274 |
|
7.0 |
8.6 |
5.7 |
27 |
|
27 |
| Cl101 |
SORT |
Valley |
232 |
24 |
4.8 |
10.7 |
5.5 |
13 |
|
13 |
| Cl109 |
SORT |
Valley |
232 |
25 |
4.8 |
10.0 |
5.8 |
13 |
24 |
37 |
| Cl79 |
SORT |
Blend |
200 |
20 |
7.5 |
0.8 |
3.7 |
45 |
36 |
80 |
| R92 |
SORT |
Blend |
200 |
|
7.5 |
1.2 |
3.6 |
30 |
|
30 |
| Cl93 |
SORT |
Blend |
200 |
25 |
4.7 |
0.9 |
3.7 |
15 |
|
15 |
| Cl94 |
SORT |
Blend |
200 |
22 |
5.5 |
1.0 |
3.7 |
24 |
|
24 |
| Cl95 |
SORT |
Blend |
200 |
22 |
9.6 |
1.1 |
3.7 |
51 |
|
51 |
| Cl112 |
SORT |
Blend |
200 |
22 |
8.7 |
0.9 |
3.6 |
37 |
|
37 |
| Cl113 |
SORT |
Blend |
200 |
22 |
4.4 |
0.9 |
3.5 |
19 |
|
19 |
| Cl114 |
SORT |
Blend |
200 |
22 |
5.3 |
1.0 |
3.8 |
35 |
|
35 |
| Cl86 |
SORT |
Blend |
200 |
21 |
4.8 |
1.0 |
3.7 |
22 |
|
22 |
| Cl91 |
UN-S |
BULK |
200 |
22 |
2.4 |
0.7 |
2.8 |
23 |
|
23 |
| |
Osisko Development Corp.
NI 43-101 Technical Report
Feasibility Study for the Cariboo Gold Project |
|
Kinetic flotation tests were conducted on fine
fraction gravity tails, fine fraction of whole rock composites, OSC, and a blend of OSC with fines.
The gravity tails
composites were produced from bulk gravity concentration tests, while the whole rock samples consisted of the -25 mm fines. The effect
of grind size on flotation performance at target P80 values of 200 μm, 150 μm, and 100 μm was
tested on these samples. Whole rock variability composites (SZ1, SZ2, SZ3, and SZ4) were tested at two target P80 values of
200 μm and 400 μm. The results of the flotation tests on the fines are provided in Table 13-29. Variability fines
of Cow Zone and Shaft Zone were also tested at 100 μm and 200 μm. The results are provided in Table 13-30.
Table 13-29: Flotation
test results
| Test ID |
Feed Type |
Grind Size
(P80, μm) |
Au Grade
(g/t) |
Mass Pull
(%) |
Au Recovery
(%) |
| Target |
Actual |
Head |
Conc.(1) |
Tails |
9 min |
20 min |
9 min |
20 min |
| F1 |
Gravity Tails |
200 |
248 |
2.11 |
13.5 |
0.04 |
15.4 |
21.0 |
98.4 |
98.9 |
| F2 |
Gravity Tails |
150 |
205 |
2.56 |
14.0 |
0.05 |
18.0 |
23.9 |
98.5 |
98.8 |
| F3 |
Gravity Tails |
100 |
131 |
2.57 |
11.2 |
0.04 |
22.7 |
31.0 |
98.9 |
99.2 |
| F10 |
Whole Rock |
200 |
178 |
3.18 |
14.11 |
0.03 |
18.3 |
22.5 |
99.3 |
99.5 |
| F11 |
Whole Rock |
150 |
123 |
3.58 |
16.42 |
0.04 |
17.2 |
21.6 |
99.1 |
99.3 |
| F12 |
Whole Rock |
100 |
75 |
3.20 |
12.24 |
0.03 |
20.5 |
26.0 |
99.3 |
99.5 |
| F-SZ1-A |
Whole Rock |
200 |
221 |
12.04 |
47.24 |
0.06 |
22.9 |
25.4 |
99.6 |
99.8 |
| F-SZ1-B |
Whole Rock |
400 |
351 |
10.75 |
44.73 |
0.21 |
21.2 |
23.9 |
98.4 |
99.4 |
| F-SZ2-A |
Whole Rock |
200 |
131 |
15.46 |
35.42 |
0.10 |
37.7 |
43.5 |
99.6 |
99.6 |
| F-SZ2-B |
Whole Rock |
400 |
211 |
14.34 |
36.80 |
0.06 |
33.9 |
38.9 |
99.7 |
99.8 |
| F-SZ3-A |
Whole Rock |
200 |
144 |
7.01 |
30.23 |
0.06 |
19.1 |
23.1 |
99.3 |
99.5 |
| F-SZ3-B |
Whole Rock |
400 |
234 |
5.41 |
27.73 |
0.02 |
15.6 |
19.4 |
99.7 |
99.7 |
| F-SZ4-A |
Whole Rock |
200 |
89 |
2.74 |
9.61 |
0.01 |
21.7 |
28.4 |
99.6 |
99.7 |
| F-SZ4-B |
Whole Rock |
400 |
156 |
2.86 |
11.84 |
0.03 |
18.7 |
24.0 |
99.1 |
99.2 |
| Minimum |
15.4 |
19.4 |
98.4 |
98.8 |
| Average |
21.2 |
26.1 |
99.1 |
99.4 |
| Maximum |
37.7 |
43.5 |
99.7 |
99.8 |
| Standard Deviation |
6.3 |
6.7 |
0.5 |
0.3 |
| (1) | Concentrate and tailings grades presented are at 9 min. |
| |
Osisko Development Corp.
NI 43-101 Technical Report
Feasibility Study for the Cariboo Gold Project |
|
Table 13-30: Flotation
test results – Variability composite fines
| Test ID |
Feed Type |
Grind Size
(P80, μm) |
Au Grade
(g/t) |
Mass Pull
(%) |
Au recovery
(%) |
| Target |
Actual |
Head |
Conc.(1) |
Tails |
9 min |
20 min |
9 min |
20 min |
| CZ-LOM-F1 |
Fines |
200 |
180 |
4.51 |
38.6 |
0.11 |
11.4 |
13.5 |
97.8 |
98.1 |
| CZ-LOM-F2 |
Fines |
100 |
205 |
4.07 |
18.5 |
0.29 |
20.8 |
25.0 |
94.3 |
95.2 |
| CZ-Low-F1 |
Fines |
200 |
131 |
6.90 |
33.5 |
0.07 |
20.4 |
23.8 |
99.2 |
99.4 |
| CZ-Low-F2 |
Fines |
100 |
178 |
6.27 |
22.2 |
0.05 |
28.1 |
31.8 |
99.5 |
99.6 |
| CZ-High-F1 |
Fines |
200 |
123 |
21.68 |
91.2 |
0.15 |
23.7 |
25.1 |
99.5 |
99.7 |
| CZ-High-F2 |
Fines |
100 |
75 |
13.60 |
40.6 |
0.15 |
33.2 |
38.9 |
99.3 |
99.6 |
| SZ-LOM-F1 |
Fines |
200 |
300 |
10.97 |
67.0 |
0.12 |
16.1 |
17.0 |
98.1 |
99.1 |
| SZ-LOM-F2 |
Fines |
100 |
133 |
9.74 |
44.6 |
0.08 |
21.7 |
24.3 |
99.3 |
99.4 |
| SZ-Low-F1 |
Fines |
200 |
182 |
7.35 |
34.3 |
0.04 |
21.3 |
23.4 |
99.4 |
99.6 |
| SZ-Low-F2 |
Fines |
100 |
124 |
7.54 |
27.9 |
0.09 |
26.8 |
30.3 |
99.1 |
99.2 |
| SZ-High-F1 |
Fines |
200 |
213 |
18.20 |
75.3 |
0.11 |
24.0 |
28.3 |
99.1 |
99.6 |
| SZ-High-F2 |
Fines |
100 |
128 |
19.78 |
67.2 |
0.08 |
29.3 |
32.9 |
99.7 |
99.7 |
| SZ-Deep-F1 |
Fines |
200 |
214 |
3.02 |
19.2 |
0.02 |
15.6 |
18.5 |
99.2 |
99.5 |
| SZ-Deep-F2 |
Fines |
100 |
127 |
3.08 |
13.3 |
0.04 |
22.9 |
26.4 |
98.9 |
99.0 |
| Minimum |
15.4 |
19.4 |
98.4 |
98.8 |
| Average |
21.2 |
26.1 |
99.1 |
99.4 |
| Maximum |
37.7 |
43.5 |
99.7 |
99.8 |
| Standard deviation |
6.3 |
6.7 |
0.5 |
0.3 |
| (1) | Concentrate and tailings grades presented are at 9 min. |
| |
Osisko Development Corp.
NI 43-101 Technical Report
Feasibility Study for the Cariboo Gold Project |
|
As seen in Table 13-29
and Table 13-30, regardless of grind size, the average gold recovery of fines flotation achieved was approximately 99% after 9 minutes
(“min”) flotation. In general, an increase in mass pull was observed with decreasing grind size, with no discernible improvement
in recovery. It is therefore recommended to use a flotation time of 9 min at a targeted grind size of 200 μm for fines
fraction.
A graph of the gold recovery as a function of
flotation time is presented in Figure 13-12. The plot illustrates that gold recovery reaches a plateau after 9 min beyond which additional
flotation time does not improve recovery. While gold recovery is not improved, Figure 13-13 illustrates that increasing flotation
time from 9 min to 20 min results in an average increase of approximately 5% in mass pull for an average 0.2% increase in gold
recovery.
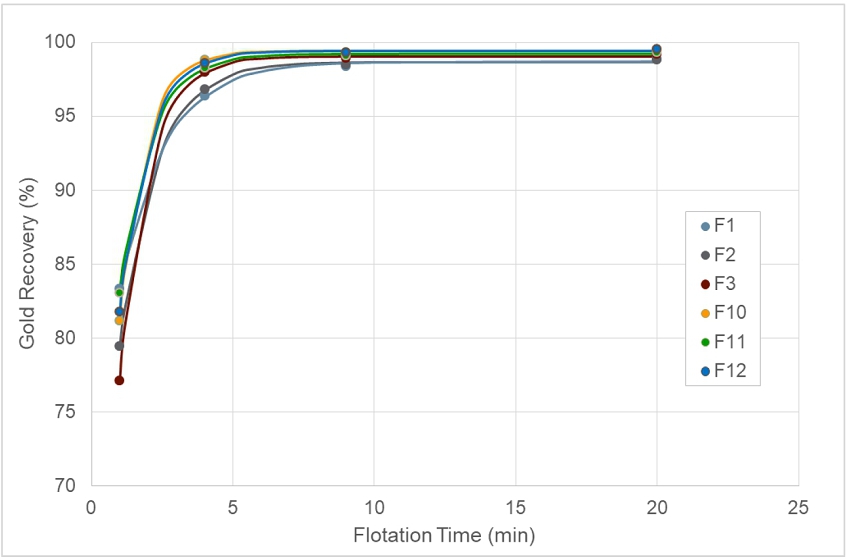
Figure 13-12: Gold recovery
flotation kinetics
(Hansuld and Gajo, 2019)
| |
Osisko Development Corp.
NI 43-101 Technical Report
Feasibility Study for the Cariboo Gold Project |
|
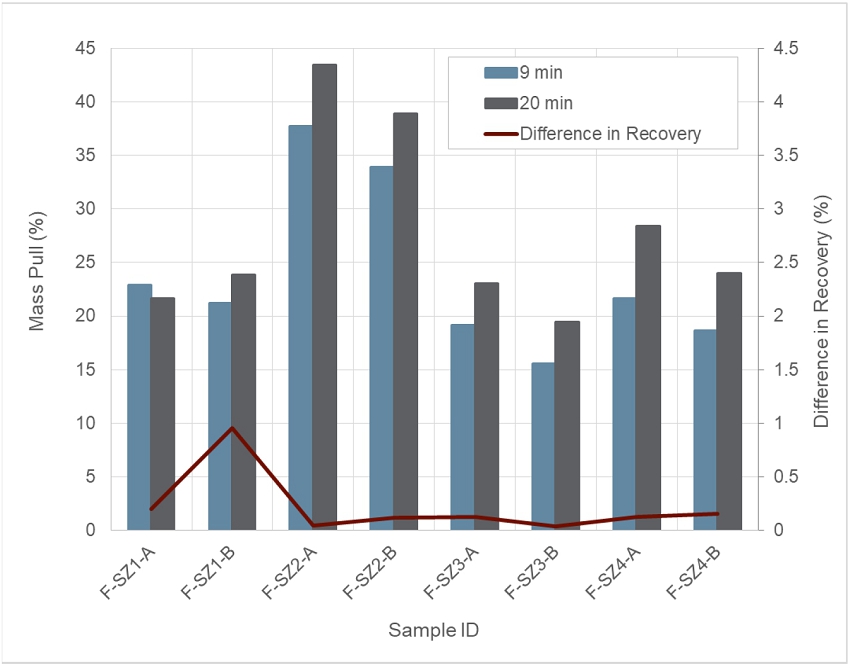
Figure 13-13: Impact of
flotation time on mass pull and gold recovery
| 13.5.1.3 | Ore Sorter Concentrate Flotation |
Ore sorting concentrate
of Cow Zone and Shaft Zone variability samples were tested at 100 μm and 200 μm. The same OSC samples were blended
with their generated fines and tested at 100 μm and 200 μm. Table 13-31 shows that the OSC flotation average gold
recovery was higher than 98.6% after 9 min of flotation. In general, an increase in mass pull was observed with decreasing grind
size, without any noticeable improvement in recovery. CZ-LOM blend of ore sorter concentrates and fines achieved 72% and 78% at 9 min
flotation and >99% at 15 min. Further test work is recommended on OSC and fines blend.
 |
Osisko
Development Corp.
NI
43-101 Technical Report
Feasibility
Study for the Cariboo Gold Project |
 |
Table 13-31: Flotation
test results – Ore sorter concentrate
| Test ID |
Feed Type |
Grind Size
(P80, μm) |
Au Grade
(g/t) |
Mass Pull
(%) |
Au Recovery
(%) |
| Target |
Actual |
Head |
Conc.(1) |
Tails |
9 min |
15 min |
9 min |
15 min |
| CZ-LOM-OSC-F1 |
OSC |
100 |
116 |
2.08 |
9.2 |
0.04 |
22.2 |
29.1 |
98.6 |
99.3 |
| CZ-LOM-OSC-F2 |
OSC |
200 |
200 |
2.06 |
14.1 |
0.03 |
14.4 |
19.6 |
98.6 |
98.8 |
| CZ-LOM-Blend-F1 |
OSC + Fines |
100 |
101 |
9.06 |
24.1 |
3.43 |
27.3 |
36.3 |
72.4 |
99.8 |
| CZ-LOM-Blend-F2 |
OSC + Fines |
200 |
174 |
4.76 |
18.3 |
1.32 |
20.2 |
26.0 |
77.9 |
99.7 |
| VZ-LOM-OSC-F1 |
OSC |
100 |
101 |
8.49 |
24.5 |
0.02 |
34.6 |
42.3 |
99.8 |
99.9 |
| VZ-LOM-OSC-F2 |
OSC |
200 |
197 |
10.15 |
32.9 |
0.04 |
30.8 |
34.7 |
99.7 |
99.8 |
| VZ-LOM-Blend-F1 |
OSC + Fines |
100 |
97 |
6.88 |
20.1 |
0.04 |
34.2 |
38.7 |
99.6 |
99.7 |
| VZ-LOM-Blend-F2 |
OSC + Fines |
200 |
201 |
1.21 |
3.1 |
0.06 |
37.9 |
43.4 |
96.9 |
97.7 |
| Minimum |
14.4 |
19.6 |
72.4 |
97.7 |
| Average |
27.7 |
33.8 |
93.0 |
99.3 |
| Maximum |
37.9 |
43.4 |
99.8 |
99.9 |
| Standard deviation |
7.63 |
7.74 |
10.40 |
0.71 |
| (1) | Concentrate and tailings grades
presented are at 9 min. |
| |
Osisko Development Corp.
NI 43-101 Technical Report
Feasibility Study for the Cariboo Gold Project |
|
| 13.5.2 | SGS – 2020 (Shaft Zone) |
| 13.5.2.1 | Rougher Flotation Test Work Results |
The samples, Blend
1, Blend 2 and Blend 3 were tested at three different grind sizes: 150 μm, 100 μm, and 75 μm. The effect of
the grind size on rougher flotation was observed while keeping the reagent dosages, pH (natural) and flotation duration constant. These
conditions are shown in Table 13-32.
Table 13-32: Rougher flotation
test conditions
| Test # |
Grind Size
K80
(µm) |
Reagent |
pH |
Rougher
Stages |
Time
(min) |
Collector PAX(1)
(g/t) |
Frother MIBC(2)
(g/t) |
| F1 |
150 |
30 |
19 |
natural |
4 |
8 |
| F2 |
100 |
30 |
19 |
natural |
4 |
8 |
| F3 |
75 |
30 |
19 |
natural |
4 |
8 |
| (1) | “PAX”: Potassium amyl xanthate. |
| (2) | “MIBC”: Methyl isobutyl carbinol. |
Figure 13-14, Figure 13-15, and Figure 13-16
present the flotation kinetics for each blend and each rougher flotation test condition. All tests yielded higher than 97% gold recovery
at the eighth minute of flotation, regardless of the grind size.
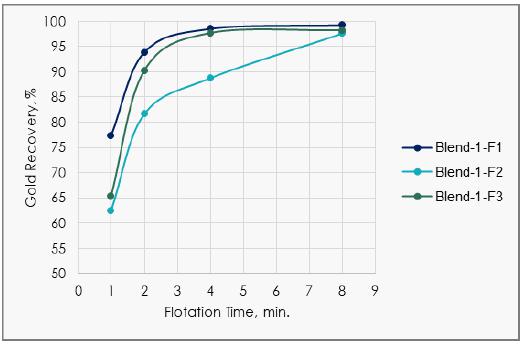
Figure 13-14: Flotation
time vs gold recovery – Blend 1
| |
Osisko Development Corp.
NI 43-101 Technical Report
Feasibility Study for the Cariboo Gold Project |
|
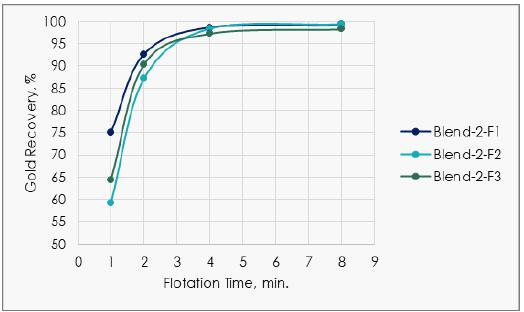
Figure 13-15: Flotation
time vs gold recovery – Blend 2
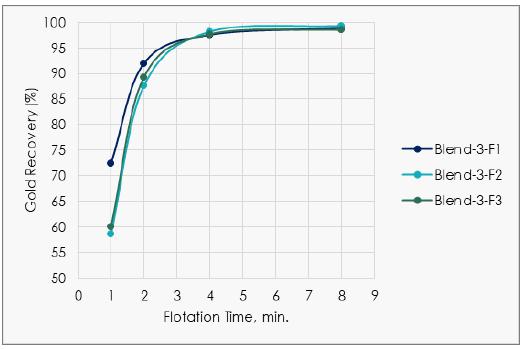
Figure 13-16: Flotation
time vs gold recovery – Blend 3
For Blend 1, F1
(150 μm) has the highest gold recovery with 99.3%, while F2 (100 μm) has the lowest gold recovery with 97.6%. For Blend 2,
F2 (100 μm) has the highest gold recovery with 99.3%, while F3 (75 μm) has the lowest gold recovery with 98.2%. For Blend 3,
F2 (100 μm) has the highest gold recovery with 99.3%, while F3 (75 μm) has the lowest gold recovery with 98.6%.
| |
Osisko Development Corp.
NI 43-101 Technical Report
Feasibility Study for the Cariboo Gold Project |
|
| 13.5.2.2 | Cleaner Flotation Test Work Results |
The cleaner flotation
samples were tested at three different grind sizes: 100 μm (no regrind), 45 μm, and 25 μm. The effect of regrinding
on cleaner flotation was observed while keeping the same reagent dosages, pH, cleaner stages, and flotation durations. These conditions
are shown in Table 13-33.
Table 13-33: Cleaner flotation
test conditions
Grind Size
K80 (µm) |
Reagent |
pH |
Cleaner
Stages |
Time
(min) |
| PAX (g/t) |
MIBC (g/t) |
| No |
5 |
2 |
Natural |
2 |
8 |
| 45 |
5 |
2 |
Natural |
2 |
8 |
| 25 |
5 |
2 |
Natural |
2 |
8 |
Table 13-34
shows that regrinding has a negative effect on gold and silver recoveries for Blend 1 and Blend 2. However, for Blend 3, regrinding the
sample to 46 μm improved the gold recovery by 11.1% with little impact on the silver recovery.
| |
Osisko Development Corp.
NI 43-101 Technical Report
Feasibility Study for the Cariboo Gold Project |
|
Table 13-34: Cleaner flotation
test results
| Sample ID |
Regrind |
Weight |
Concentrate Grade |
Recovery |
| Au |
Ag |
Cu |
Fe |
S |
TOC |
Au |
Ag |
Cu |
Fe |
S |
TOC |
| K80 |
% |
g/t |
g/t |
% |
% |
% |
% |
% |
% |
% |
% |
% |
% |
| Blend-1 |
- |
10.8 |
62.3 |
34.6 |
0.06 |
39.4 |
46.0 |
0.32 |
96.4 |
86.2 |
41.5 |
75.5 |
91.9 |
23.0 |
| Blend-1 |
40 |
8.65 |
76.7 |
39.2 |
0.07 |
41.4 |
48.0 |
0.27 |
95.3 |
83.1 |
39.3 |
63.5 |
77.6 |
17.1 |
| Blend-1 |
24 |
3.62 |
153 |
89.0 |
0.14 |
36.7 |
43.3 |
0.57 |
88.4 |
76.1 |
33.8 |
23.8 |
29.5 |
14.8 |
| Blend-2 |
- |
11.8 |
58.6 |
31.1 |
0.06 |
39.9 |
47.0 |
0.31 |
97.1 |
87.2 |
44.6 |
78.6 |
93.6 |
25.0 |
| Blend-2 |
40 |
9.43 |
66.0 |
34.0 |
0.07 |
42.6 |
49.2 |
0.23 |
92.6 |
80.3 |
40.9 |
66.8 |
79.1 |
17.2 |
| Blend-2 |
22 |
2.97 |
190 |
107 |
0.15 |
38.2 |
44.6 |
0.47 |
79.4 |
73.2 |
30.1 |
19.1 |
22.6 |
10.4 |
| Blend-3 |
- |
12.4 |
53.1 |
31.1 |
0.05 |
40.7 |
47.1 |
0.25 |
82.0 |
89.0 |
41.3 |
76.5 |
90.1 |
23.7 |
| Blend-3 |
46 |
10.7 |
77.9 |
34.6 |
0.06 |
43.4 |
49.0 |
0.21 |
93.3 |
87.5 |
39.0 |
70.5 |
81.5 |
18.8 |
| Blend-3 |
24 |
4.64 |
136 |
68.0 |
0.11 |
38.7 |
44.6 |
0.37 |
85.9 |
76.4 |
33.7 |
27.3 |
31.9 |
13.8 |
| |
Osisko Development Corp.
NI 43-101 Technical Report
Feasibility Study for the Cariboo Gold Project |
|
| 13.5.2.3 | Bulk Rougher Flotation Test |
The three blend’s rougher flotation samples
were mixed and their test results of the three series of 22 tests were averaged. The blend mixes were used for the subsequent E-GRG
test and leaching tests. Table 13-35 shows the average weight recovery, gold rougher concentrate grade, gold rougher tailings grade,
and gold recovery for each blend average. The blend weight recovery averages vary between 16.9% and 18.5%; gold recovery averages vary
between 98.2% and 99.5%; gold rougher concentrate grade averages vary between 37.4 g/t and 38.0 g/t.
Table 13-35: Bulk rougher
flotation test results summary
| Test # |
Mass Pull |
Au (g/t) |
Au Recovery |
| % |
Ro Conc |
Ro Tailings |
% |
| Blend -1-Average |
16.9 |
38.0 |
0.04 |
99.5 |
| Blend -2-Average |
18.0 |
37.4 |
0.17 |
98.2 |
| Blend -3-Average |
18.5 |
37.8 |
0.05 |
99.4 |
| 13.5.2.4 | Combined Flotation Concentrate Assay |
The assay results of the flotation concentrate
are shown below. In addition to having 39.2 g/t of gold and 26.7 g/t of silver, the combined concentrate has high amounts of
iron, sulphur, and copper.
Table 13-36:
Assay results summary – Combined flotation concentrate
| Element |
Unit |
Assay
Result |
Element |
Unit |
Assay
Result |
| Au |
g/t |
39.2 |
Mg |
g/t |
1,840 |
| Ag |
g/t |
26.7 |
Ni |
g/t |
<300 |
| Fe |
% |
30.9 |
As |
g/t |
4,490 |
| Cl |
g/t |
<50 |
Bi |
g/t |
51.1 |
| S |
% |
34.9 |
Cd |
g/t |
85.9 |
| Hg |
g/t |
<0.3 |
Pb |
g/t |
4,790 |
| F |
% |
0.074 |
Sb |
g/t |
38.6 |
| Ca |
g/t |
1,060 |
Se |
g/t |
<10 |
| Cu |
g/t |
349 |
Te |
g/t |
<4 |
| |
Osisko Development Corp.
NI 43-101 Technical Report
Feasibility Study for the Cariboo Gold Project |
|
| 13.5.3 | Base Met Labs – 2024 |
The flotation work was intended to produce a sealable
cleaner concentrate. Conditions were optimized for the OSC for Shaft Zone (Sorted Shaft composite) and flotation performance was confirmed
for the sorted composite samples from each of the following five zones: Cow, Deep Shaft, Lowhee and Valley. Variability per zone was tested
on small interval samples (non-sorted material) for Cow, Shaft and Valley zones.
| 13.5.3.1 | Rougher Flotation Optimization |
Rougher flotation
tests were performed for grind sizes from 80% passing (P80) 83 μm to 423 μm to determine the target primary grind
size for the project. Concentrates were collected at minutes 1, 3, 5 and 9 for all tests. Flotation was performed at natural pH, and MIBC
and PAX were the reagents used.
Figure 13-17
summarizes the results for all six grind sizes tested on OSC from the Shaft Zone composite. For mass pull 20% or above, all grind sizes
yielded gold recoveries above 95% and sulphur recoveries above 90%.
| |
Osisko Development Corp.
NI 43-101 Technical Report
Feasibility Study for the Cariboo Gold Project |
|
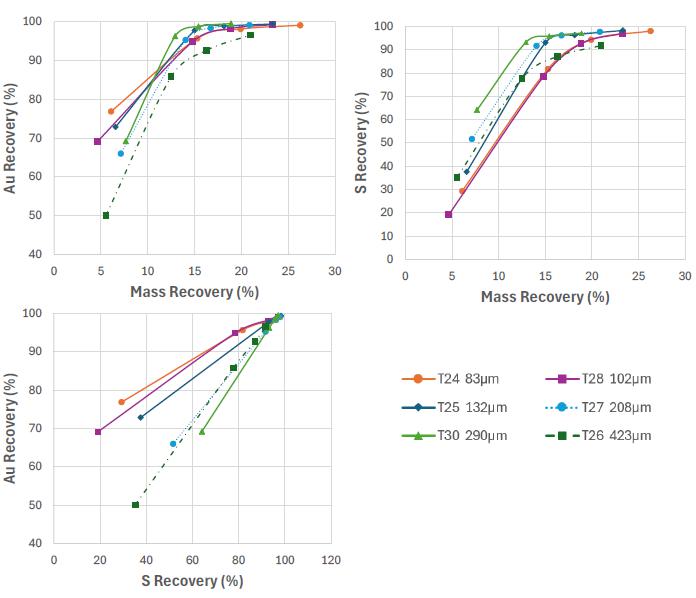
Figure 13-17: Effect of
particle size on gold and sulphur recoveries – Rougher flotation
| |
Osisko Development Corp.
NI 43-101 Technical Report
Feasibility Study for the Cariboo Gold Project |
|
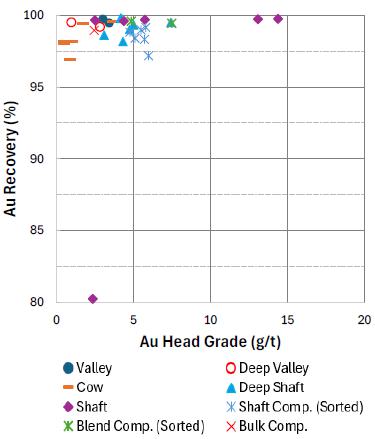
Figure 13-18: Gold head
grade vs recovery – Rougher flotation
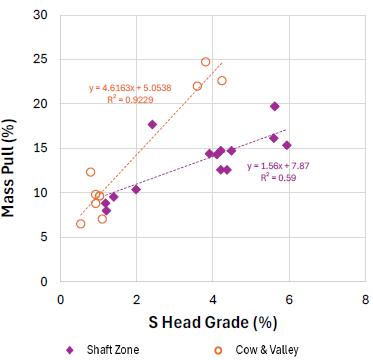
Figure 13-19: S head grade
vs mass pull – Rougher flotation
| |
Osisko Development Corp.
NI 43-101 Technical Report
Feasibility Study for the Cariboo Gold Project |
|
| 13.5.3.2 | Cleaner Flotation Optimization |
Cleaner flotation
tests were performed for grind sizes from 80% passing (P80) 20 μm to 52 μm to determine the target regrind grind size for
the project. Concentrates were collected at minutes 5, 9 and 12 for all tests. A cleaner scavenger of 2 min was performed on the first
cleaner tail. Figure 13-20 summarizes the results for all six grind sizes tested on OSC from the Shaft Zone composite.
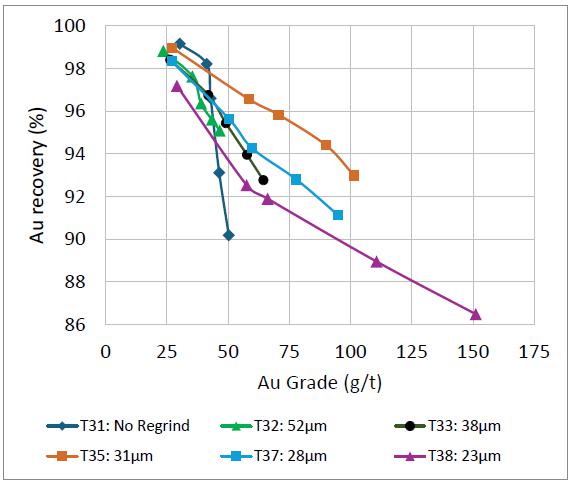
Figure 13-20: Effect of
regrind size – Cleaner flotation
Reagent optimization tests showed cleaning performance
improvement with the use of Polyfloat 7040 in the cleaning circuit. Figure 13-21 summarizes the results. Tests were performed on
gravity tails of OSC from the Shaft Zone composite.
| |
Osisko Development Corp.
NI 43-101 Technical Report
Feasibility Study for the Cariboo Gold Project |
|
Figure 13-21: Reagent optimization
– Cleaner flotation
| 13.5.3.3 | Flotation Circuit Confirmation and Variability |
Flotation was performed
at natural pH, and MIBC and Polyfloat 7040 (PF7040) were the reagents used on both, cleaner and scavenger stages. Results for tests on
sorted composites are summarized in Figure 13-22.
The LCT was completed on sorted Blend composite
at optimized conditions and test results are summarized in Table 13-37.
| |
Osisko Development Corp.
NI 43-101 Technical Report
Feasibility Study for the Cariboo Gold Project |
|
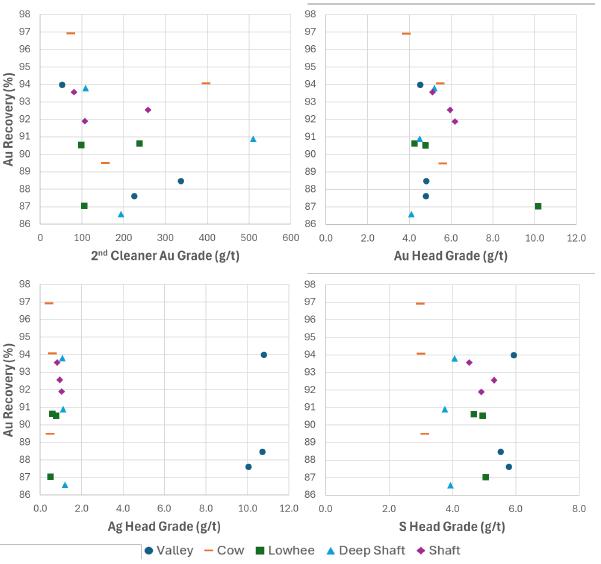
Figure 13-22: Head grade
vs recovery – Cleaner flotation on sorted samples
| |
Osisko Development Corp.
NI 43-101 Technical Report
Feasibility Study for the Cariboo Gold Project |
|
Table 13-37: LCT results
| Product |
Weight |
Assay (% or g/t) |
Distribution (%) |
| % |
g |
Au |
Ag |
As |
S |
C |
Fe |
Au |
Ag |
As |
S |
C |
Fe |
| Cycle D |
| Feed |
100 |
984.0 |
4.85 |
1.28 |
804 |
3.93 |
1.57 |
6.13 |
100 |
100 |
100 |
100 |
100 |
100 |
| Mozley Table Conc. |
0.2 |
1.5 |
488.8 |
200.0 |
1,000 |
40.00 |
0.01 |
35.0 |
15.6 |
24.2 |
0.2 |
1.6 |
0.0 |
0.9 |
| Bulk Conc. |
1.7 |
16.9 |
228.4 |
44.0 |
1,160 |
9.42 |
5.89 |
9.1 |
80.8 |
59.1 |
2.5 |
4.1 |
6.4 |
2.5 |
| Clnr Scav Tails |
16.5 |
162.1 |
0.96 |
0.8 |
3,870 |
22.20 |
0.61 |
20.1 |
3.3 |
10.3 |
79.3 |
93.2 |
6.4 |
54.0 |
| Rougher Tails |
81.7 |
803.5 |
0.02 |
0.10 |
178 |
0.06 |
1.68 |
3.20 |
0.3 |
6.4 |
18.1 |
1.1 |
87.2 |
42.6 |
| Cycle E |
| Feed |
100 |
990.6 |
14.29 |
1.15 |
736 |
3.82 |
1.55 |
6.09 |
100 |
100 |
100 |
100 |
100 |
100 |
| Mozles Table Conc. |
0.1 |
1.0 |
10,097 |
200.0 |
1,000 |
40.00 |
0.01 |
35.0 |
68.8 |
16.9 |
0.1 |
1.0 |
0.0 |
0.6 |
| Bulk Conc. |
1.6 |
15.8 |
268.2 |
47.0 |
1,197 |
9.19 |
6.01 |
8.9 |
29.9 |
65.0 |
2.6 |
3.8 |
6.2 |
2.3 |
| Clnr Scav Tails |
15.8 |
157.0 |
1.05 |
0.8 |
3,770 |
22.60 |
0.65 |
20.9 |
1.2 |
11.0 |
81.2 |
93.7 |
6.6 |
54.4 |
| Rougher Tails |
82.5 |
816.8 |
0.02 |
0.1 |
144 |
0.07 |
1.64 |
3.16 |
0.1 |
7.1 |
16.1 |
1.5 |
87.2 |
42.8 |
| Cycles D+E |
| Feed |
100 |
1,974.6 |
9.59 |
1.22 |
770 |
3.87 |
1.56 |
6.11 |
100 |
100 |
100 |
100 |
100 |
100 |
| Mozles Table Conc. |
0.1 |
2.5 |
4,217.9 |
200.0 |
1,000 |
40.00 |
0.01 |
35.0 |
55.4 |
20.7 |
0.2 |
1.3 |
0.0 |
0.7 |
| Bulk Conc. |
1.7 |
32.7 |
247.6 |
45.4 |
1,178 |
9.31 |
5.95 |
9.0 |
42.8 |
61.9 |
2.5 |
4.0 |
6.3 |
2.4 |
| Clnr Scav Tails |
16.2 |
319.1 |
1.00 |
0.8 |
3,821 |
22.40 |
0.63 |
20.5 |
1.7 |
10.6 |
80.2 |
93.4 |
6.5 |
54.2 |
| Rougher Tails |
82.1 |
1,620.3 |
0.02 |
0.10 |
161 |
0.06 |
1.66 |
3.18 |
0.2 |
6.7 |
17.1 |
1.3 |
87.2 |
42.7 |
Clnr Scav: Cleaner Scavenger
Leaching
test work was carried out in the 2018, 2020 and 2022 test campaigns completed by SGS. The results of these test campaigns are summarized
in the subsections below. No leaching test work was completed on cleaner flotation concentrate.
2018
In
2018, a leaching program was conducted and included leaching of flotation rougher concentrates, OSC, and blends of flotation/ore sorter
concentrates at 70:30, 50:50, and 30:70 of fines-to-coarse ratios. The fines-to-coarse proportion for operations had not been established
when the tests were performed, the test work program was designed to cover a range of scenarios. The samples were prepared to a pulp
density of 45% (weight/weight [“w/w”]) solids, with the exception of the flotation rougher concentrate leach tests that were
run at 35% (w/w) solids. All leaching tests were conducted at a target pH of 11 to 11.5 and dissolved oxygen levels of 6 parts per
million (“ppm”) to 8 ppm.
Fines
flotation concentrate, OSC flotation concentrate and OSC of variability composites were blended in proportions, which would represent
the pre-concentrate production and leached at 45 μm and 75 μm with and without pre-treatment.
In
general, excellent gold leaching recoveries between 95% and 98% were observed for all tests performed on OSC and blended OSC/flotation
concentrate samples. A 3–4% decrease in recovery was observed for the rougher flotation concentrates when leached alone. Silver
recoveries were quite variable, averaging 77% and 86% for the flotation concentrates and ore sorter concentrates respectively. While
gold recoveries were excellent for the blended samples, silver recoveries for the same samples averaged 46%.
Leaching
of blended pre-concentrates at approximately 50 μm on average resulted in 94% gold recovery. A range of 0.8–2.4% decrease
in recovery was observed for leaching at 75 μm compared to 45 μm. In general, the pre-aeration stage decreased cyanide
consumption insignificantly; however, lime consumption increased 0.6 kg/t on average.
2020
In
2020, SGS completed standard cyanide bottle roll tests on rougher flotation concentrates from the three composite samples (Shaft Zone
bulk samples). Regardless of the testing conditions, gold recoveries varied between 95.7% and 96.8%, and silver recoveries varied between
44.8% and 55.5%.
| |
Osisko Development Corp.
NI 43-101 Technical Report
Feasibility Study for the Cariboo Gold Project |
|
2022
The leaching campaign in 2022 focused on the Lowhee
Zone and used a blend of sorting concentrate and prep fines to conduct further gravity and leaching test work. Lowhee leaching test work
was performed on the gravity tails of the blend and directly on the blend.
Leaching of the Lowhee blend resulted in gold
and silver recoveries of 95.7–96.5% and 66.2–77%, respectively. The gravity tails leaching recoveries ranged from 91.5–93.9%
for gold and 58–64.3% for silver.
| 13.7 | Thickening, Filtration, and Rheology |
The objective of the thickening, filtration and
rheology testing is to measure solid-liquid separation rates to predict sizing and operating parameters for full-scale dewatering equipment.
Several test works were conducted during the Cariboo
Project phases. As the mineralogical zone and flowsheet evolved, the physicochemical characteristics of the solids and the liquids changed.
Some of the paste backfill laboratory test work including dewatering test work specific to this area are presented in the paste backfill
Section 13.8.
Six types of flocculants were screened and tested.
Flocculant dosage and solid feeds were optimized using 1 L vessels. Optimal condition was carried in 4 L vessel to determine
the underflow (“U/F”) density. Results showed that a feed density of 12.5 wt% solids and a flocculant dosage of 25 g/t
generated an underflow density of 69 wt% solids. The underflow of the settling tests was centrifuged to determine the maximal density
achievable through gravimetric settling methods, which reached 77 wt% solids. The vacuum disc filtration was not a viable option,
the material was falling off the filter. Tests were, therefore, conducted to evaluate belt vacuum filtration. The sample was then filtered
on an apparatus simulating a vacuum belt filter to determine a possible option for paste production and test results are shown in Table 13-38.
Table 13-38: Belt vacuum
filtration test
| Feed wt% Solids |
Average Cake Moisture (wt%) |
| 75% |
19.1% |
| 70% |
21% |
| |
Osisko Development Corp.
NI 43-101 Technical Report
Feasibility Study for the Cariboo Gold Project |
|
| 13.7.1 | Pocock Industrial – 2018 |
Three samples were sent to Pocock Industrial in
Salt Lake City, Utah, for thickening, filtration, and rheology testing. The characteristics of the as-received materials are summarized
in Table 13-39.
Table 13-39: Sample characterization
| Sample |
Particle Size
(P80, μm) |
pH
(as received) |
SG for
Calculations |
| Flotation Tailings |
105 |
7.8 |
2.76 |
| Pre-leach Thickener Feed |
41 |
10.9 |
2.88 |
| Detoxed Tailings |
36 |
9.2 |
2.97 |
Flocculant Screening
All three samples were submitted to flocculant
screening tests to identify the best reagent for flocculation of solids to promote rapid settling and reducing suspended solids concentration
in overflow. The screening tests also provided an indication of the required reagent dosing. The selected flocculant for all three samples
was a high molecular weight, 10% charge anionic polyacrylamide.
Once an appropriate
flocculant was selected, static settling tests were conducted to provide an estimate of the optimized operating parameters, including
feed slurry density and flocculant dosing, for dynamic testing. The recommended flocculant dosing for dynamic testing ranged between
24 g/t and 36 g/t.
Dynamic Testing
Dynamic thickening
tests were performed on each material to determine the recommended maximum hydraulic design basis for high-rate thickener design. Expected
underflow solids concentrations and overflow suspended solids concentrations were also determined in testing. Table 13-40
provides high-rate thickener design criteria and operating parameters for each material.
| |
Osisko Development Corp.
NI 43-101 Technical Report
Feasibility Study for the Cariboo Gold Project |
|
Table 13-40: Recommended
high-rate thickener operating parameters
| Sample |
Feed Pulp
Density |
Flocculant
Dose |
Design Net
Feed Loading |
Predicted
TSS |
Predicted
U/F Density |
| (%, w/w) |
(g/t) |
(m3/m2/h) |
(mg/L) |
(%, w/w) |
| Flotation Tailings |
14.8 |
24–26 |
3.7 |
150–250 |
71% |
| Pre-leach Thickener Feed |
15.0 |
27–30 |
4.0 |
150–250 |
62% |
| Detoxed Tailings |
17.2 |
32–36 |
3.8 |
150–250 |
64% |
The overflow clarities achieved were shown to
be in the range of what is generally acceptable. For further reduction of overflow suspended solids concentration, a polish filtration
step may be required to treat the thickener overflow.
Each of the three thickening applications requires
dilution of feed to between 13% and 17% (w/w) solids.
The suggested maximum design hydraulic loading
rate is as follows:
| ■ | The flotation tailings material is 3.7 m3/m2/h,
with a maximum recommended underflow density of 71% (w/w); |
| ■ | The pre-leach thickener feed material is 4.0 m3/m2/h
with a maximum recommended underflow density of 62% (w/w); |
| ■ | The detoxed tailings material is 3.8 m3/m2/h with
a maximum recommended underflow density of 64% (w/w). |
Rheological measurements were performed on thickened
samples on each of the flotation tailings, pre-leach thickener feed, and detoxed tailings materials. A typical yield stress versus percent
solids is presented in Figure 13-23.
| |
Osisko Development Corp.
NI 43-101 Technical Report
Feasibility Study for the Cariboo Gold Project |
|
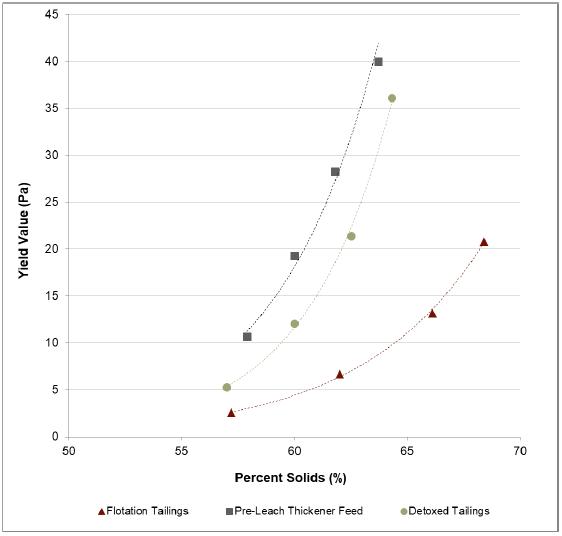
Figure 13-23: Yield value
vs percent solids
(Source: Pocock Industrials,
2019)
Rheology results
indicate that for each of the materials, the yield value was less than 30 pascals (“Pa”) at the maximum thickened
underflow density recommended from the thickening tests. For these materials, a heavy-duty thickener rake mechanism is recommended
to minimize the thickener underflow density due to insufficient rake torque.
Pressure filtration tests were conducted on both
flotation and detox tailings. The tests were done in a 60 mm chamber, using air blow with and without membrane squeeze. The test
conditions and main filtration results are presented in Table 13-41.
| |
Osisko Development Corp.
NI 43-101 Technical Report
Feasibility Study for the Cariboo Gold Project |
|
Table 13-41: Pressure filtration
results and design parameters
| Sample |
Membrane
Squeeze |
Feed Pulp
Density |
Dry Bulk
Density |
Cake
Thickness |
Cycle
Time |
Cake
Moisture |
| (%, w/w) |
(t/m3) |
(mm) |
(min) |
(%) |
| Flotation Tailings |
N |
68.3 |
1.49 |
60.0 |
12.0 |
8.5 |
| Flotation Tailings |
Y |
68.3 |
1.53 |
58.3 |
12.5 |
8.0 |
| Detoxed Tailings |
N |
62.7 |
1.50 |
60.0 |
12.0 |
13.9 |
| Detoxed Tailings |
Y |
62.7 |
1.57 |
57.4 |
12.5 |
12.7 |
The results demonstrate that both with and without
the membrane squeeze, both tailings materials dewatered well within an acceptable cycle time (12 min to 12.5 min). The cake moisture achieved
for the flotation tailings and detoxed tailings ranged from 8.0% to 8.5% and from 12.7% to 13.9%, respectively. Obtained results for detoxed
tailings are in the industry standard for tailings dry stacking (above 80% solid w/w).
| 13.7.2 | FLSmidth – 2022 (Shaft Zone) |
| 13.7.2.1 | Thickening and Filtration Tests |
The objective of the thickening, filtration and
rheology testing is to measure solid-liquid separation rates to predict sizing and operating parameters for full-scale dewatering equipment.
Tests were performed at FLS Laboratory in Midvale, Utah, on a flotation tailings composite. Process water from the flotation testing was
used to represent full scale slurry sample. Characteristics are summarized in Table 13-42.
Table 13-42: As-received
sample characteristic summary
| Description |
Unit |
Flotation
Tailings Solid Sample |
Process Water |
| Suspended Solids |
wt% |
84.0 |
- |
| Dissolved Solids |
wt% |
0.00 |
0.01 |
| Solids Specific Gravity |
|
2.70 |
- |
| Liquor Specific Gravity |
|
- |
1.00 |
| pH |
|
- |
8.1 |
| D80 |
µm |
101 |
- |
| D50 |
µm |
37.5 |
- |
| D20 |
µm |
11 |
- |
| D10 |
µm |
5.7 |
- |
| |
Osisko Development Corp.
NI 43-101 Technical Report
Feasibility Study for the Cariboo Gold Project |
|
Thickening Tests
As part of the thickening tests, five different
flocculants were tested, and BASF Magnafloc MF10 was selected for the remaining tests, as it performed the best. All the tests generated
clear overflow and good settling rates.
Table 13-43: Evaluated
flocculants
| Flocculant |
Charge |
Molecular Weight |
Charge Density |
| AN 923 VHM |
Anionic |
Medium |
Low |
| AN 910 |
Anionic |
Low |
Low |
| MF 351 |
Non-ionic |
Medium |
None |
| MF 1011 |
Anionic |
High |
Medium |
| MF 10 |
Anionic |
High |
Very low |
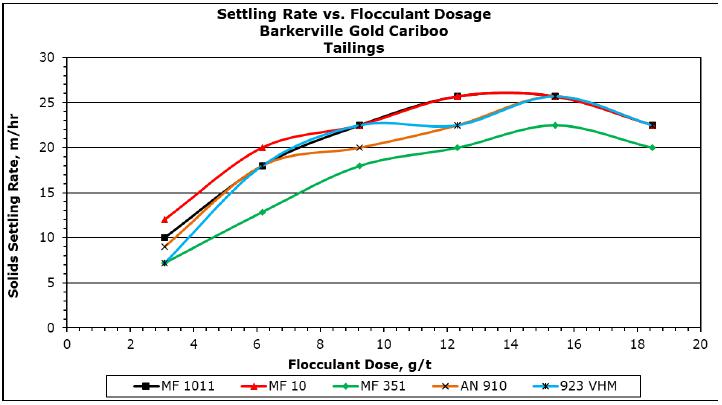
Figure 13-24: Settling rate vs Flocculant dosage
(Source: De Paula, 2022)
| |
Osisko Development Corp.
NI 43-101 Technical Report
Feasibility Study for the Cariboo Gold Project |
|
Additional tests
were performed to determine the maximum flux rate and the corresponding percent solids, which were then used for the 2-litre static tests
to represent a high-rate thickener, and continuous fill tests to determine the underflow density. These tests showed that at a feed percent
solids of 12% and flocculant dosage of 12 g/t an underflow percent solids of 68% can be achieved. The recommended thickener operating
parameters are shown in Table 13-44.
Table 13-44: Recommended
thickener operating parameters
| Description |
Unit |
Value |
| Recommended Feed Solids Density |
wt% |
12 |
| Underflow Characteristics |
|
|
| Design Underflow Solids |
wt% |
68 |
| Minimum Mud Residence Time Required |
min |
60 |
| Underflow Yield Stress |
Pa |
35 |
| Overflow Characteristics |
|
|
| Overflow Clarity |
ppm |
100 |
| Flocculant |
|
|
| Recommended Flocculant |
|
MF 10 |
| Recommended Total Flocculant Dose |
g/t |
12 |
| Recommended Flocculant Concentration |
g/L |
0.1 |
| Thickener Sizing |
|
|
| Solids Unit Area |
m2/tpd |
0.03 |
| Recommended Rise Rate |
m/h |
12 |
Filtration Tests
There were two types of filtration tests conducted
to simulate both a vacuum disc filter and pressure filter. Both filter tests were performed at 68% solids to represent flotation tailings
thickener underflow. The vacuum filter was able to achieve a cake moisture of 18–22% with thicknesses ranging from 19–44 mm,
in 14–126 seconds. The pressure filter was able to achieve a cake moisture of 10.4% at both 32 mm and 50 mm thicknesses, with a
blow time of 8–10 minutes at a pressure of 10 bar.
| |
Osisko Development Corp.
NI 43-101 Technical Report
Feasibility Study for the Cariboo Gold Project |
|
Table 13-45: Vacuum filtration
test results
| Process Parameter |
Unit |
Flotation Tailings |
| Filter Media |
- |
Paste Backfill |
| Feed Solids Density |
wt% |
68 |
| Form Vacuum |
kPa |
68 |
| Dry Vacuum |
kPa |
68 |
| Cake Thickness |
mm |
34 |
| Dry Cake Weight |
kg/m2 |
54 |
| Formation Time |
min |
0.7 |
| Dry Time |
min |
1.1 |
| Cake Moisture |
wt% |
19 |
| Filtration Rate |
kg/m2/h |
1,056 |
Table 13-46: Pressure filtration
test results
| Process Parameter |
Unit |
Flotation Tailings |
| Test ID |
- |
1 |
2 |
| Chamber Type |
- |
Recessed |
| Filter Media |
- |
POPR 966 |
| Filter Feed Suspended Solids |
wt% |
68.0 |
| Chamber Thickness |
mm |
50 |
32 |
| Feed Pressure |
bar |
10.0 |
10.0 |
| Drying Pressure |
bar |
7.0 |
7.0 |
| Fill Time |
min |
0.33 |
0.17 |
| Air Blow Time |
min |
10.0 |
8.0 |
| Ultimate Cake Moisture |
wt% |
10.4 |
10.4 |
| Dry Cake Density |
kg/m3 |
1,543 |
1,521 |
| Filtration Rate |
kg/m2/h |
168 |
123 |
| |
Osisko Development Corp.
NI 43-101 Technical Report
Feasibility Study for the Cariboo Gold Project |
|
Two samples were sent to SGS in Lakefield, Ontario,
for rheology testing: one from the flotation concentrate thickener underflow and one from the carbon in pulp (“CIP”) detoxified
tailings (Liu and Ashbury, 2022a). The characteristics of the as-received material are summarized in Table 13-47.
Table 13-47: Rheology sample
characterization
| Sample
ID |
Test
Code |
K80
μm |
ASG |
SG |
α
ASG/SG |
Temp
ºC |
Solids
% w/w |
Density
g/L |
| Flotation Concentrate Underflow |
T5 |
117 |
3.87 |
3.89 |
1.00 |
22 |
78.9 |
2,402 |
| T1 |
3.86 |
0.99 |
78.1 |
2,377 |
| T2 |
3.83 |
0.98 |
74.4 |
2,231 |
| T3 |
3.91 |
1.01 |
70.5 |
2,088 |
| T4 |
3.84 |
0.99 |
66.0 |
1,966 |
| CIP Detox Tailings Underflow |
T7 |
52 |
3.76 |
3.71 |
1.00 |
21 |
71.1 |
2,093 |
| T8 |
3.72 |
1.00 |
69.1 |
2,021 |
| T9 |
3.58 |
0.97 |
67.1 |
1,937 |
| T10 |
3.70 |
1.00 |
65.1 |
1,906 |
| T11 |
3.70 |
1.00 |
62.6 |
1,842 |
| T12 |
3.70 |
1.00 |
60.1 |
1,782 |
The results from the rheological testing show
that for the flotation concentrate thickener underflow, a percent-solids of 75% could be expected, while for the detoxified tailings,
a percent-solids of 68% could be expected from commercial thickeners. A summary of the results for the flotation concentrate is shown
in Table 13-48 and Figure 13-25, and Table 13-49 and Figure 13-26 provide a summary for the detoxified tailings.
| |
Osisko Development Corp.
NI 43-101 Technical Report
Feasibility Study for the Cariboo Gold Project |
|
Table 13-48: Summary of
rheology results – Flotation concentrate underflow
Test
Code |
Solids % w/w |
Unsheared Sample |
Unsheared Sample |
Observations |
Shear Rate
ϒ
range, 1/s |
Yield Stress
τyB
Pa |
Plastic Viscosity
ηP
mPa.s |
Shear Rate
ϒ
range, 1/s |
Yield Stress
τyB
Pa |
Plastic Viscosity
ηP
mPa.s |
| T5 |
78.9 |
100-300 |
114 |
724 |
100-300 |
72 |
614 |
Thixotropic |
| T1 |
78.1 |
100-300 |
80 |
546 |
100-300 |
61 |
411 |
Thixotropic |
| T2 |
74.4 |
100-300 |
35 |
87 |
100-300 |
18 |
86 |
Thixotropic |
| T3 |
70.5 |
100-300 |
9.9 |
30 |
100-300 |
5.9 |
32 |
Minor Settling |
| T4 |
66.0 |
100-300 |
3.3 |
14 |
Not available |
Fast Settling |
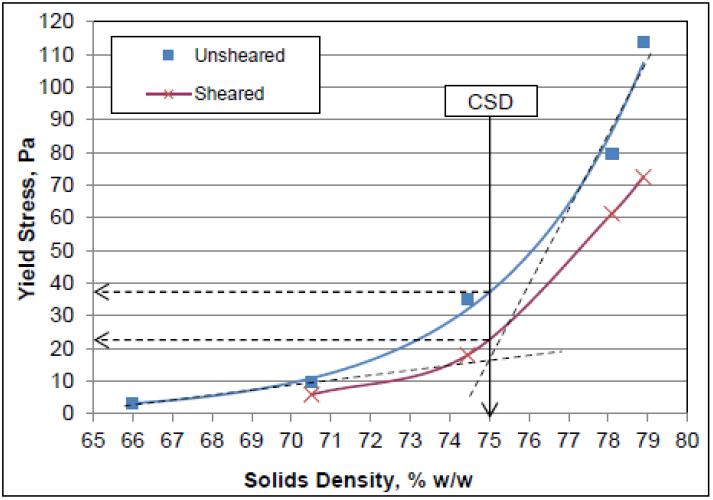
Figure 13-25: Yield stress
vs solids density – Flotation concentrate underflow
(Source: Liu and Ashbury, 2022)
| |
Osisko Development Corp.
NI 43-101 Technical Report
Feasibility Study for the Cariboo Gold Project |
|
Table 13-49: Summary of
rheology results – CIP detox tailings underflow
Test
Code |
Solids
%
w/w |
Unsheared Sample |
Unsheared Sample |
Observations |
Shear
Rate
ϒ
range, 1/s |
Yield
Stress
τyB
Pa |
Plastic
Viscosity
ηP
mPa.s |
Shear
Rate
ϒ
range, 1/s |
Yield
Stress
τyB
Pa |
Plastic
Viscosity
ηP
mPa.s |
| T7 |
71.1 |
200-400 |
112 |
33 |
200-400 |
44 |
87 |
Thixotropic |
| T8 |
69.1 |
200-400 |
57 |
25 |
200-400 |
25 |
45 |
Thixotropic |
| T9 |
67.1 |
200-400 |
30 |
22 |
200-400 |
16 |
27 |
Thixotropic |
| T10 |
65.1 |
200-400 |
17 |
19 |
200-400 |
11 |
19 |
Thixotropic |
| T11 |
62.6 |
200-400 |
9.2 |
14 |
200-400 |
6.5 |
14 |
Minor Settling |
| T12 |
60.1 |
200-400 |
4.8 |
12 |
200-400 |
3.2 |
13 |
Settling |
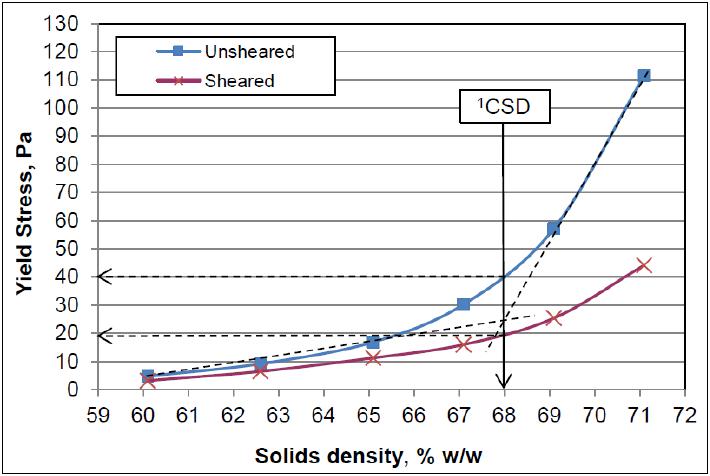
Figure 13-26: Yield stress
vs solids density – CIP detox tailings underflow
(Source: Liu and Ashbury, 2022)
| |
Osisko Development Corp.
NI 43-101 Technical Report
Feasibility Study for the Cariboo Gold Project |
|
The 2024 Metso test campaign included filtration
and dynamic thickening testing for two blended tailings samples and a bulk gold concentrate. The two blends were created by blending the
two samples received, rougher tails and scavenger tails, in the following ratios:
| ■ | Tails Blend 8:1 (Rougher Tails: Cleaner Scavenger Tails); |
| ■ | Tails Blend 5:1 (Rougher Tails: Cleaner Scavenger Tails). |
The dynamic thickening testing was completed on
the two blended tailings samples. The results of the thickening test work were used to aid in determining the design parameters suitable
for equipment sizing purposes.
Pressure filtration testing was completed on both
blended tails samples and belt vacuum filtration was completed on all three samples.
| 13.7.4.1 | Thickening Results |
The flocculant used
in the test work was the SNF913 SH. Six runs were performed at various flocculant dosage to determine the settling characteristics. The
results are summarized in Table 13-50 and Table 13-51.
Table 13-50: 8:1 Blended
tails – Dynamic thickening results
| Run No. |
Feed |
Flocculant |
Underflow |
Overflow |
Flux
(t/(m2·h)) |
Liquor RR
(m/h) |
Dose
(g/t) |
Meas. Solids
(% (w/w)) |
YS
(Pa) |
Solids
(mg/L) |
| 1 |
0.80 |
3.94 |
30 |
66.1 |
147 |
<100 |
| 2 |
1.00 |
4.93 |
30 |
65.9 |
81 |
<100 |
| 3 |
1.10 |
5.42 |
30 |
65.2 |
67 |
<100 |
| 4 |
1.30 |
6.40 |
30 |
64.5 |
58 |
<100 |
| 5 |
1.30 |
6.40 |
20 |
64.3 |
31 |
<100 |
| 6 |
1.30 |
6.40 |
5 |
65.4 |
25 |
194 |
Sources: Keckes (2024a; 2024b)
| |
Osisko Development Corp.
NI 43-101 Technical Report
Feasibility Study for the Cariboo Gold Project |
|
Table 13-51: 5:1 Blended
tails – Dynamic thickening results
| Run |
Feed |
Flocculant |
Underflow |
Overflow |
Flux
(t/(m2·h)) |
Liquor RR
(m/h) |
Dose (g/t) |
Meas. Solids
(% (w/w)) |
YS (Pa) |
Solids (mg/L) |
| 1 |
0.80 |
3.94 |
30 |
66.8 |
102 |
<100 |
| 2 |
1.00 |
4.93 |
30 |
64.2 |
89 |
<100 |
| 3 |
1.10 |
5.42 |
30 |
62.8 |
60 |
<100 |
| 4 |
1.30 |
6.40 |
30 |
65.8 |
74 |
<100 |
| 5 |
1.30 |
6.40 |
20 |
65.7 |
62 |
<100 |
| 6 |
1.30 |
6.40 |
10 |
66.6 |
60 |
<100 |
Sources: Keckes (2024a; 2024b)
No thickening work was completed on concentrate
samples due to limited amount of samples.
| 13.7.4.2 | Filtration Results |
Belt Vacuum Filtration
The vacuum filtration test work began with the
cloth selection for the two blended tails samples and the gold bulk concentrate. The intermediate air permeability cloth named MaroS60
was chosen for the further testing of the tailings samples. The tightest air permeability cloth named MaroS30 was chosen for the gold
bulk concentrate.
Different volumes of slurry were filtered with
the same drying time to determine the impact of the cake thicknesses on the moisture and the filtration rate. Following the cake thickness
test work, different drying times were tested to measure the impact on filtration rate and cake moisture.
The program also included, for the two blended
tails samples, filtration with flocculant SNF913 SH used as filter aid to examine the potential improvement in filtration rate and cake
moistures. Table 13-52 to Table 13-54 present the belt vacuum filtration results summary.
| |
Osisko Development Corp.
NI 43-101 Technical Report
Feasibility Study for the Cariboo Gold Project |
|
Table 13-52: 8:1 Blended
tails – Belt vacuum filtration results
| Parameters |
Unit |
Filter Cloth Selection |
Cake Thickness |
Drying Time |
| Run#1 |
Run#2 |
Run#3 |
Run#4 |
Run#5 |
Run#6 |
Run#7 |
Run#8 |
Run#9 |
| Filter Cloth |
- |
Maro S90 |
Maro S60 |
Maro S30 |
Maro S60 |
Maro S60 |
Maro S60 |
Maro S60 |
Maro S60 |
Maro S60 |
| Feed Solids |
% w/w |
~63% |
~63% |
~63% |
~63% |
~63% |
~63% |
~63% |
~63% |
~63% |
| Total Cycle Time |
s |
38 |
37 |
40 |
50 |
70 |
59 |
88 |
119 |
148 |
| Slurry Volume |
ml |
100 |
100 |
100 |
200 |
300 |
250 |
250 |
250 |
250 |
| Air Drying |
s |
30 |
30 |
30 |
30 |
30 |
30 |
60 |
90 |
120 |
| Cake Thickness |
mm |
6.0 |
5.3 |
5.5 |
11.8 |
18.3 |
15.0 |
14.5 |
14.3 |
14.9 |
| Cake Moisture |
% w/w |
17.9 |
17.2 |
16.9 |
19.8 |
20.5 |
20.7 |
20.5 |
19.6 |
20.3 |
| Filtration Rate |
kgD.S/m2h |
920 |
959 |
897 |
1459 |
1,622 |
1,565 |
1,025 |
743 |
618 |
Table 13-53: 5:1 Blended
tails – Belt vacuum filtration results summary
| Parameters |
Unit |
Filter Cloth Selection |
Cake Thickness |
Drying Time |
| Run#1 |
Run#2 |
Run#3 |
Run#4 |
Run#5 |
Run#6 |
Run#7 |
Run#8 |
Run#9 |
| Filter Cloth |
|
Maro S90 |
Maro S60 |
Maro S30 |
Maro S60 |
Maro S60 |
Maro S60 |
Maro S60 |
Maro S60 |
Maro S60 |
| Feed Solids |
% w/w |
~63% |
~63% |
~63% |
~63% |
~63% |
~63% |
~63% |
~63% |
~63% |
| Total Cycle Time |
s |
38 |
38 |
39 |
51 |
71 |
60 |
88 |
122 |
153 |
| Slurry Volume |
ml |
100 |
100 |
100 |
200 |
300 |
250 |
250 |
250 |
250 |
| Air Drying |
s |
30 |
30 |
30 |
30 |
30 |
30 |
60 |
90 |
120 |
| Cake Thickness |
mm |
5.2 |
5.7 |
5.6 |
11.3 |
19.2 |
14.5 |
14.1 |
15.6 |
15.0 |
| Cake Moisture |
%w/w |
18.6 |
17.0 |
17.5 |
20.6 |
20.8 |
20.3 |
20.0 |
20.6 |
20.1 |
| Filtration Rate |
kgD.S/m2h |
820 |
875 |
853 |
1,362 |
1,531 |
1,466 |
966 |
760 |
616 |
| |
Osisko Development Corp.
NI 43-101 Technical Report
Feasibility Study for the Cariboo Gold Project |
|
Table 13-54: 8:1 and 5:1
Blended tails - Belt vacuum filtration results using filter aid
| Parameters |
Unit |
8 :1 Blended Tails |
5 :1 Blended Tails |
| Run#1(1) |
Run#2(1) |
Run#3(1) |
Run#4(1) |
Run#1(1) |
Run#2(1) |
Run#3(1) |
Run#4(1) |
| Filter Cloth |
- |
Maro S60 |
Maro S60 |
Maro S60 |
Maro S60 |
Maro S60 |
Maro S60 |
Maro S60 |
Maro S60 |
| Feed Solids |
% w/w |
~63% |
~63% |
~63% |
~63% |
~63% |
~63% |
~63% |
~63% |
| Total Cycle Time |
s |
54 |
48 |
47 |
43 |
57 |
50 |
51 |
44 |
| Slurry Volume |
ml |
250 |
250 |
250 |
250 |
250 |
250 |
250 |
250 |
| Filter Aid Dosage |
g/t |
10 |
22 |
31 |
43 |
10 |
21 |
29 |
44Cake |
| Cake thickness |
mm |
15.6 |
14.5 |
15.5 |
15.7 |
15.9 |
15.0 |
16.4 |
15.3 |
| Cake Moisture |
%w/w |
20.4 |
22.4 |
23.4 |
24.0 |
21.4 |
20.1 |
23.3 |
24.0 |
| Filtration Rate |
kgD.S/m2h |
1,721 |
1,734 |
1,887 |
1,962 |
1,590 |
1,812 |
1,776 |
2,035 |
| (1) | SNF 913 SH filter aid used. |
Table 13-55: Gold bulk
concentrate – Belt vacuum filtration results
| Parameters |
Unit |
Filter Cloth Selection |
Cake Thickness |
Drying Time |
| Run#1 |
Run#2 |
Run#3 |
Run#4 |
Run#5 |
Run#6 |
Run#7 |
| Filter Cloth |
- |
Maro S60 |
Maro S30 |
Maro S30 |
Maro S30 |
Maro S30 |
Maro S30 |
Maro S30 |
| Feed Solids |
% w/w |
~52% |
~52% |
~52% |
~52% |
~52% |
~52% |
~52% |
| Total Cycle Time |
s |
50 |
47 |
58 |
100 |
94 |
118 |
153 |
| Slurry Volume |
ml |
150 |
150 |
200 |
300 |
200 |
200 |
200 |
| Air Drying |
s |
30 |
30 |
30 |
30 |
60 |
90 |
120 |
| Cake Thickness |
mm |
6.1 |
7.3 |
7.3 |
9.2 |
8.9 |
7.8 |
8.4 |
| Cake Moisture |
%w/w |
27.2 |
26.8 |
26.8 |
27.0 |
26.8 |
27.0 |
26.7 |
| Filtration Rate |
kgD.S/m2h |
726 |
685 |
793 |
811 |
537 |
358 |
316 |
| |
Osisko Development Corp.
NI 43-101 Technical Report
Feasibility Study for the Cariboo Gold Project |
|
Pressure Filtration
Pressure filtration was completed on both blended
tails. The Labox 100 bench scale unit was used in double-sided filtration (FFP mode) with the filter cloth named MitoS610. Three runs
of the test were completed. The initial test was performed using a 40 mm chamber to characterize the sample filtration properties. The
two additional runs were done using 50 mm and 60 mm chambers to observe the filtering performance. Pumping, pressing and air-drying
pressure were respectively 6, 12 and 10 bar for all the runs.
Overall, the pressure filtration observations
were the same for the two samples. As the chamber size increased the moisture content increased. The cake released off the cloth easily
and the cloths were easy to wash. The pressure filtration results summary is presented in Table 13-56.
Table 13-56: 8:1 and 5:1
Blended tails – Pressure filtration results
| Parameters |
Unit |
8 :1 Blended Tails |
5 :1 Blended Tails |
| Run#1 |
Run#2 |
Run#3 |
Run#1 |
Run#2 |
Run#3 |
| Feed Density |
% w/w |
~63% |
~63% |
~63% |
~63% |
~63% |
~63% |
| Chamber Depth |
mm |
40 |
50 |
60 |
40 |
50 |
60 |
| Cycle Time |
Min |
8.5 |
9 |
9.5 |
8.5 |
9 |
9.5 |
| Cake Thickness |
mm |
39.5 |
50.4 |
60.1 |
40.2 |
49.8 |
60.7 |
| Cake Moisture |
% w/w |
9.6 |
10.9 |
11.3 |
11.0 |
12.2 |
11.7 |
| Filtration Rate D.S. |
kg/m2h |
228 |
280 |
314 |
233 |
282 |
323 |
Blended Tails
The process flowsheet and the design parameter
are based on the 8:1 blended tails. The thickening results for this mix demonstrated that it is possible to achieve an underflow solid
content around 65% for a flux between 1.10 t to 1.30 t(m²*h) and a flocculant consumption of 30 g/t.
The filtered blended tails will feed the paste
backfill plant. The solid content of the tails must allow the addition of makeup water to adjust the paste slump and solid content around
75%. Belt vacuum filtration and pressure filtration test work achieved average moisture content in the given order of 20% and 10% that
should provide enough flexibility to adjust the paste slump.
| |
Osisko Development Corp.
NI 43-101 Technical Report
Feasibility Study for the Cariboo Gold Project |
|
Four paste
backfill laboratory investigation programs were carried out with Cariboo tailings samples. The results vary from test to test since the
Cariboo metallurgical flowsheet evolved affecting the physical and chemical characteristics of the tailings.
Golder (WSP Golder since April 2021) performed
two series of test work campaigns in 2019 and 2022. In the 2019 campaign, the paste tested was deemed unstable and Golder highlighted
risks of sanding pipelines when pumping through a paste distribution system. In the 2022 campaign, a larger sample, more representative
of the mill tailings, was evaluated and a paste recipe was determined.
The recent laboratory test work was conducted
by T Engineering (Ting and Pasqual, 2024). The test work was required to confirm the paste backfill recipe and paste backfill feasibility.
A summary of the results obtained prior to 2024
is presented in this section along with a more detailed presentation of the latest study.
| 13.8.1 | Paste and Solid-Liquid Investigation - Golder – 2019 |
The purpose of the laboratory program was to provide
information on the dewatering, rheological, and strength characteristics of flotation tailings for the paste backfill mix design.
| 13.8.1.1 | Tailings Characterization |
Samples were prepared and characterized before
testing. The material for testing was dewatered and homogenized to be treated as a unique sample called 19124019 Cariboo Tailings. It
was re-diluted with tap water, and the pH was adjusted to 7.8 with lime.
Particle size distribution was determined with
a mechanical sieving and laser particle size analyzer and is shown in Table 13-57.
Table 13-57: Tailings particle
size distribution
| Sample |
D10 (µm) |
D30 (µm) |
D50 (µm) |
D60 (µm) |
D80 (µm) |
| 19124019 Cariboo Tailings |
10 |
37 |
85 |
116 |
201 |
Specific gravity (“SG”) was determined
to be 2.67, using de-aired water, after de-airing the sample itself.
| |
Osisko Development Corp.
NI 43-101 Technical Report
Feasibility Study for the Cariboo Gold Project |
|
Chemical and mineralogical analyses were performed
using Whole Rock Analysis, by means of ICP and X-ray diffraction (“XRD”) methods. Sulphur analysis, performed by LECO method,
shows 0.17 wt% sulphur, and the mineralogical composition is shown in Table 13-58.
Table 13-58: XRD Mineralogical
composition
| Mineral |
Chemical Formula |
wt% |
| Quartz |
SiO2 |
80.60 |
| Muscovite |
H2KAl3SiO12 |
6.92 |
| Calcite |
CaCO3 |
4.99 |
| Orthoclase |
Al2O3.K20.6SiO2 |
4.16 |
| Ankerite |
Ca(Mg0.6Fe0.332+)(CO3)2 |
3.33 |
| 13.8.1.2 | Rheological Tests |
Rheological testing was done to evaluate flow
and handling properties. The test measured the slump in function of the solids content, where water was added in small increments. Figure 13-27
shows the relation of slump versus solids content.
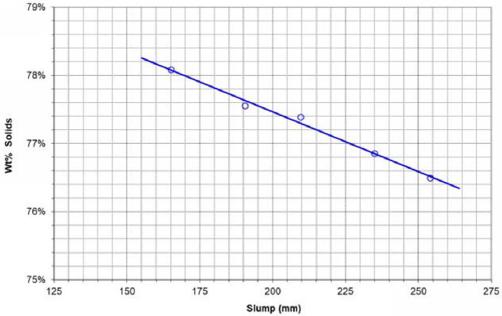
Figure 13-27: Solid content
vs slump
| |
Osisko Development Corp.
NI 43-101 Technical Report
Feasibility Study for the Cariboo Gold Project |
|
Static yield tests determined the minimum force
required to initiate flow. Measurements were taken at various solids contents by using a vane spindle attached to a torque spring. Results
are shown in Figure 13-28.
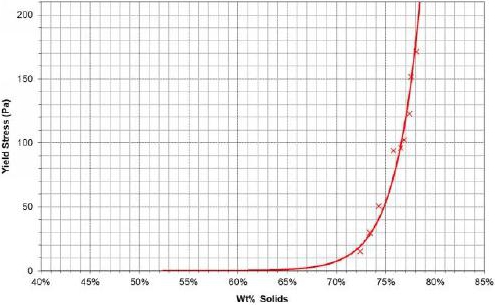
Figure 13-28: Yield stress
vs solids density
Tests were carried out to determine water bleed
properties of the paste while sitting idle in test beakers. Two slump consistencies were tested at four-time intervals. Water bleed and
yield stress were measured, as shown in Figure 13-29.
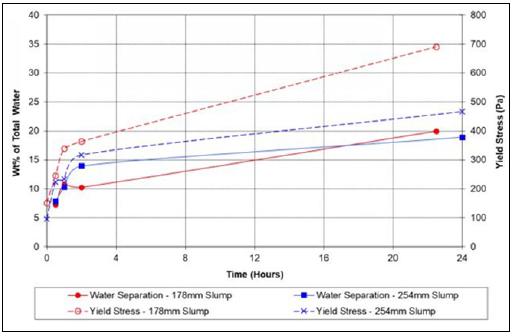
Figure 13-29: Water bleed
and yield stress vs time
| |
Osisko Development Corp.
NI 43-101 Technical Report
Feasibility Study for the Cariboo Gold Project |
|
A plug yield stress analysis was performed to
determine if consolidation had occurred through the idle paste material. Two slump consistencies sat idle for two hours and a special
design vane spindle was immersed at three depths. The tests are summarized in Figure 13-30.
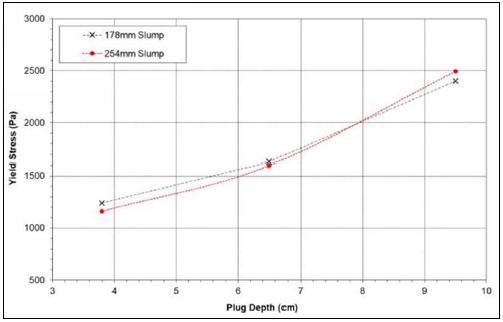
Figure 13-30: Plug depth
vs yield stress
Dynamic viscosity and dynamic yield stress are
extrapolated from dynamic shear stress to zero shear. The measurement is made by a sensor rotated inside a cup that contains the sample.
The torque measurements were recorded at several speeds or shear rates. Results from tests are presented in Table 13-59.
Table 13-59: Bingham viscosity
and yield stress
| wt% Solids |
Bingham Yield Stress (Pa) |
Bingham Viscosity (Pa.s) |
| Ramp up |
Ramp down |
Ramp up |
Ramp down |
| 76.6 |
97 |
31 |
0.522 |
0.583 |
| 75.2 |
53 |
20 |
0.374 |
0.400 |
| 74.7 |
43 |
19 |
0.402 |
0.378 |
| 73.5 |
33 |
9 |
0.243 |
0.255 |
| 72.2 |
20 |
6 |
0.152 |
0.159 |
| 70.4 |
12 |
2 |
0.065 |
0.071 |
| |
Osisko Development Corp.
NI 43-101 Technical Report
Feasibility Study for the Cariboo Gold Project |
|
| 13.8.1.3 | Unconfined Compressive Strength Testing |
A series of unconfined compressive strength (“UCS”)
tests were performed for two different binder contents, two slumps, and three curing times to assess the backfill strength. The mixes
were cast in triplicate into 2” by 4”. cylinders. The cylinders were cured in a high-humidity environment at 20 °C
to 25 °C. The preliminary results are presented in Table 13-60.
Table 13-60: Unconfined
compressive strength test results
| Mix |
wt%
Binder |
Binder |
Material |
Slump
mm (inch) |
Average UCS (kPa) |
Average
Bulk Density (kg/m3) |
Curing
7 days |
Curing
28 days |
Curing
56 days |
| 1 |
3 |
Lafarge NPC |
19124019 Cariboo Tailings |
178 mm (7”) |
203 |
305 |
332 |
2,009 |
| 2 |
3 |
229 mm (9”) |
195 |
247 |
283 |
2,022 |
| 3 |
5 |
178 mm (7”) |
358 |
634 |
715 |
2,031 |
| 4 |
5 |
229 mm (9”) |
359 |
619 |
695 |
2,035 |
| 13.8.1.4 | Conclusion: Paste and Solid-Liquid Investigation |
The tailings sample tested, does not produce a
truly stable paste. Based on the viscosity and dynamic yield stress data, it would be possible to pump the material horizontally and maintain
the total pressure loss below 90 bar. There is a high risk of sanding out the distribution pipeline.
| 13.8.2 | Feasibility Paste Fill Testing - WSP Golder – 2022 |
The 2019, test work results carried out by Golder
indicated that the tailings failed to form a stable paste. Therefore, a new test program was undertaken to confirm if a larger tailings
sample could perform better, as it would be more representative of the mill tailings. In addition, the tailings characteristics had changed
based on the metallurgical test optimization program.
The test program was divided into two stages:
i) the tailings characterization and rheology testing; and ii) the design of the underground distribution system (“UDS”)
and the optimization of the mix recipe.
| |
Osisko Development Corp.
NI 43-101 Technical Report
Feasibility Study for the Cariboo Gold Project |
|
| 13.8.2.1 | Tailings Characterization |
Particle size distribution (“PSD”)
was measured using a Malvern Mastersizer 3000 laser particle size analyzer and the results are presented in Table 13-61.
Table 13-61: Tailings particle
size distribution
| Sample |
D10 |
D30 |
D50 |
D60 |
D80 |
| (µm) |
| 177416001 Tailings |
6 |
18 |
39 |
56 |
106 |
The semi-quantitative
mineralogical composition of the sample was measured with XRD and results are presented in Table 13-62.
Table 13-62: XRD mineralogical
composition
| Sample |
Chemical Formula |
wt% |
| Quartz |
SiO2 |
78.87 |
| Muscovite |
(K,Na)(Al,Mg,Fe)2Si3.1Al0.9O10(OH)2 |
16.61 |
| Dolomite |
Ca(Ca0.13Mg0.87)(CO3)2 |
4.52 |
| Total |
100 |
| 13.8.2.2 | Rheological Tests |
Rheological tests were carried out to evaluate
flow and handling properties. In order to measure the sample’s sensitivity to water additions, increments of water were added to
the sample. After each addition, slump and solids contents were determined. The relationship between slump and solids content is presented
in Figure 13-31.
| |
Osisko Development Corp.
NI 43-101 Technical Report
Feasibility Study for the Cariboo Gold Project |
|
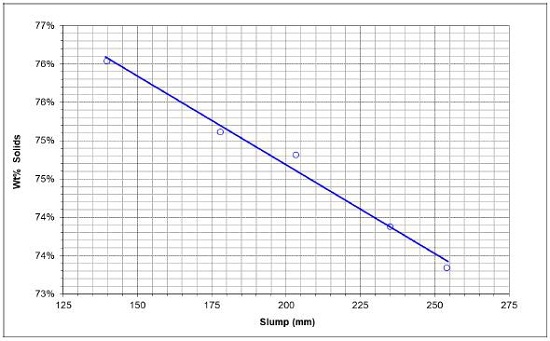
Figure 13-31: Solid content
vs slump
Yield stress is the minimum force required to
initiate flow. Static yield stress was determined by using a slow-moving (0.2 rotations per minute (“rpm”)) vane spindle
attached to a torque spring. Yield stress test results are presented in Figure 13-32.

Figure 13-32: Static yield
stress vs solids density
| |
Osisko Development Corp.
NI 43-101 Technical Report
Feasibility Study for the Cariboo Gold Project |
|
Moisture retention testing was performed to analyze
the water bleed properties of the paste while idling in test beakers. Two slump consistencies were tested at four-time intervals. At each
time interval, water bleed and yield stress were measured. The results are shown in Figure 13-33.
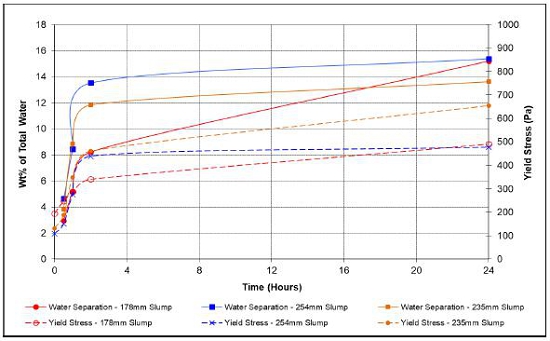
Figure 13-33: Water bleed
and yield stress vs time
| 13.8.2.3 | Flow Loop Testing |
Pump selection and pipeline distribution systems
design requires the data obtained from flow loop testing. The data provides viscosity and yield stress values essential to fluid characterization.
The lab-scale flow loop system consisted of 50 mm (2”) and 75 mm (3”) schedule 40 steel piping, a progressive cavity pump,
pressure transmitters, and a magnetic flow meter. A series of test runs were undertaken at each solid density to measure the pipeline
friction loss at several flow rates. The relationship between the solid densities and pipeline yield stress is presented in Figure 13-34.
| |
Osisko Development Corp.
NI 43-101 Technical Report
Feasibility Study for the Cariboo Gold Project |
|
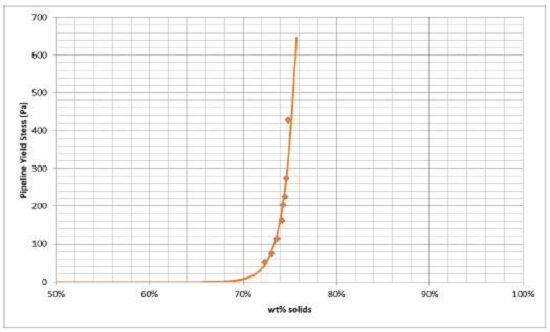
Figure 13-34: Pipeline
yield stress vs solids density
From the flow loop data, the estimated pressure
loss was measured for different pipeline diameters expected to be used for the UDS. The results are presented in Figure 13-35 and
Figure 13-36.
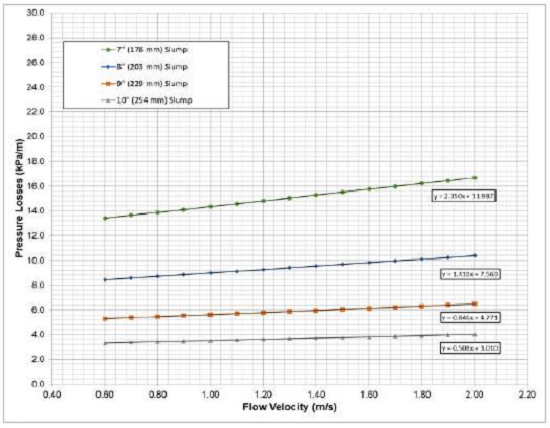
Figure 13-35: Estimated
pressure losses in 6" SCH 80 pipeline
| |
Osisko Development Corp.
NI 43-101 Technical Report
Feasibility Study for the Cariboo Gold Project |
|
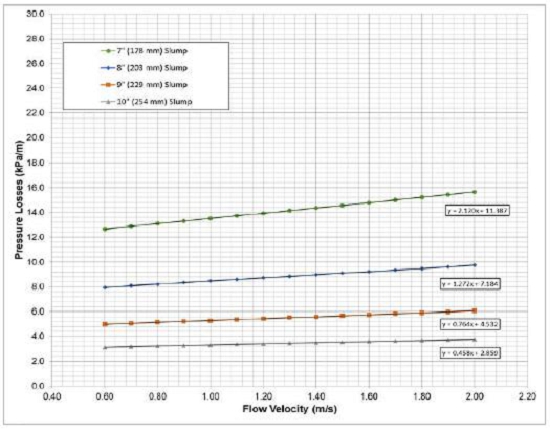
Figure 13-36: Estimated
pressure losses in 6" SCH 40 pipeline
| 13.8.2.4 | Unconfined Compressive Strength Testing |
The UCS testing was conducted with a Humboldt
HM2800 digital load frame. The load was measured using s-type load cells. Depending on the strength, either a 10 kN or 45 kN
(2,000 lb or 10,000 lb) load cell was used. The cured cylinder was placed between two platens, and during testing, the bottom
platen advanced at a rate of 2 mm (0.08”) per minute. The load was continuously observed, and the maximum load was recorded
automatically by the instrument.
The UCS program was undertaken to assess the backfill
strength using 76 mm x 152 mm (3” x 6”) cylinders. The cylinders were cured in a high humidity environment
maintained at 20 °C to 25 °C. Three cylinders per curing period were cast and the results were averaged. The test results
are presented in Table 13-63.
| |
Osisko Development Corp.
NI 43-101 Technical Report
Feasibility Study for the Cariboo Gold Project |
|
Table 13-63: UCS testing
program results – WSP Golder
| Mix |
Weight
%
Binder |
Binder |
Material |
Slump
(mm) |
Average UCS, kPa |
Average
Bulk Density
(kg/m3) |
Curing
Duration,
7 Days |
Curing
Duration,
14 Days |
Curing
Duration,
28 Days |
| 1 |
1.5 |
Lafarge Type 10 |
177416001
Tailings |
178 |
108 |
114 |
114 |
1,946 |
| 2 |
229 |
68 |
74 |
87 |
1,929 |
| 3 |
2.5 |
178 |
143 |
147 |
150 |
1,950 |
| 4 |
229 |
79 |
145 |
151 |
1,940 |
| 5 |
4.0 |
178 |
190 |
187 |
239 |
1,951 |
| 6 |
229 |
156 |
132 |
186 |
1,921 |
| 4 (Redo) |
2.5 |
229 |
116 |
170 |
155 |
1,931 |
| 6 (Redo) |
4.0 |
229 |
226 |
265 |
227 |
1,918 |
| 13.8.3 | T Engineering – 2024 |
In 2024, T Engineering completed a paste
backfill testing campaign to establish the paste backfill mix design for the Project (Ting and Pascual, 2024). Two tailings samples were
received by T Engineering as shown in Table 13-64.
Table 13-64: Samples received
| Sample ID |
Mass (kg) |
Moisture (%) |
Solid (%) |
| BL 1573-85 Rougher Tails |
~200 |
21.9 |
78.1 |
| BL 1573-85 Cleaner Scavenger Tails |
35 |
28.7 |
71.3 |
Using the samples received, the following two
tailings’ blends were created for testing:
| · | Tails Blend 8:1 (Rougher Tails: Cleaner Scavenger Tails); |
| · | Tails Blend 5:1 (Rougher Tails: Cleaner Scavenger Tails). |
Material characterization test work was completed
on the rougher tails, cleaner scavenger tails, and both tailings’ blends. Rheology testing was completed on the 8:1 Tails Blend
and UCS was completed on the two tailings blends.
| |
Osisko Development Corp.
NI 43-101 Technical Report
Feasibility Study for the Cariboo Gold Project |
|
| 13.8.3.1 | Material Characterization |
The particle size
distribution of the four samples was analyzed by laser particle size analyzer (Table 13-65).
Table 13-65: Particle size
distribution
| Sample ID |
d50 (μm) |
d80 (μm) |
% passing 20 μm |
SG |
| Rougher Tails |
37.0 |
223.8 |
31.5 |
2.84 |
| Cleaner Scavenger Tails |
14.4 |
27.6 |
66.0 |
3.28 |
| 8:1 Tails Blend |
33.0 |
214.7 |
35.0 |
2.86 |
| 5:1 Tails Blend |
26.6 |
132.9 |
39.5 |
2.9 |
The specific gravity was determined using a pycnometer
(Table 13-66).
Table 13-66: Specific gravity
of tailings and mixtures
| Sample ID |
Specific Gravity |
| Rougher Tails or RT |
2.80 |
| Scavenger Tails or ST |
3.22 |
| 8:1 Mix (RT:ST) |
2.86 |
| 5:1 Mix (RT:ST) |
2.85 |
Chemical composition and mineralogy of the rougher
and scavenger tailings were measured, respectively, by inductively coupled plasma mass spectroscopy (“ICP-MS”) and XRD (Table 13-67
and Table 13-68).
| |
Osisko Development Corp.
NI 43-101 Technical Report
Feasibility Study for the Cariboo Gold Project |
|
Table 13-67: ICP-MS results
| Sample ID |
Rougher Tailings |
Scavenger Tailings |
| Analyte |
Unit |
Assay |
Assay |
| Al2O3 |
wt% |
14.6 |
17.9 |
| As |
ppm |
192 |
1820 |
| Ba |
ppm |
656 |
70 |
| CaO |
wt% |
2.45 |
1.17 |
| Co |
ppm |
6.27 |
89.3 |
| Ce |
ppm |
62 |
77 |
| Cr |
ppm |
104 |
237 |
| Fe2O3 |
wt% |
4.65 |
21.5 |
| K2O |
wt% |
4.16 |
5.19 |
| La |
ppm |
34 |
40 |
| Li |
ppm |
19 |
20 |
| MgO |
wt% |
1.86 |
1.12 |
| MnO |
wt% |
0.134 |
0.063 |
| Na2O |
wt% |
0.35 |
0.34 |
| P2O5 |
wt% |
0.098 |
0.097 |
| S |
ppm |
741 |
137,000 |
| Se |
ppm |
0.3 |
0.8 |
| Sr |
ppm |
114 |
90 |
| TiO2 |
wt% |
0.709 |
0.728 |
| V |
ppm |
105 |
121 |
| Zr |
ppm |
98 |
137 |
Table 13-68: XRD results
| Sample ID |
Rougher Tailings |
Scavenger Tailings |
| Mineral |
wt% |
wt% |
| Quartz - SiO2 |
43.6 |
19.6 |
| Muscovite - (K.92Na.08)Si3.2Al2.65Ti.04Fe.12Mg.06O12) |
53.4 |
68.7 |
| Albite - (AlSi3)(Na.75K.25)O8 |
2.5 |
0 |
| Kaolinite - Al2Si2O9H4 |
0.6 |
1.7 |
| Pyrite - FeS2 |
0 |
9.9 |
| Total |
100 |
100 |
| |
Osisko Development Corp.
NI 43-101 Technical Report
Feasibility Study for the Cariboo Gold Project |
|
| 13.8.3.2 | Rheological Tests |
Rheology test work assess the flow properties
of the tailings and the paste for different percent solids. The yield stress of uncemented and cemented paste was measured. The binder
used for the cemented paste was the Portland-limestone (GUL) cement added at a ratio of 5% by weight. All rheological characterization
tests were performed on 8:1 tailings mixture.
To assess the sensitivity of the water addition,
decant water from the as-received tailings was added gradually to the uncemented sample. The slump and the solid content were measured
after each addition. The results are presented in Figure 13-37.
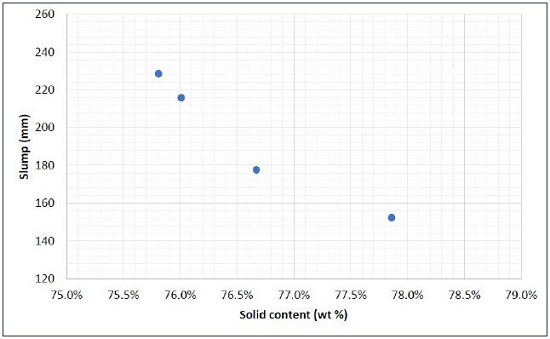
Figure 13-37: Uncemented
sample - solid content vs slump
Static Yield Stress, Dynamic Yield Stress and Dynamic
Viscosity Test Work
Yield stress is the minimum force required to
initiate flow. Static yield stress was determined by using a vane spindle rotating at a very low speed connected to a torque spring. Measurements
were taken at various solids content.
Dynamic viscosity and dynamic yield stress were
also tested to understand the fluid behaviour. Figure 13-38, Figure 13-39 and Figure 13-40 illustrate the static yield
stress, dynamic yield stress, and dynamic viscosity of the cemented tailings paste compared the uncemented tailings.
| |
Osisko Development Corp.
NI 43-101 Technical Report
Feasibility Study for the Cariboo Gold Project |
|
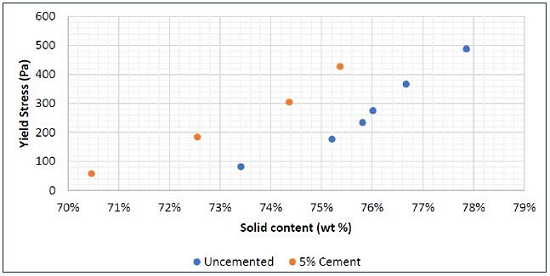
Figure 13-38: Static yield
stress vs solid density
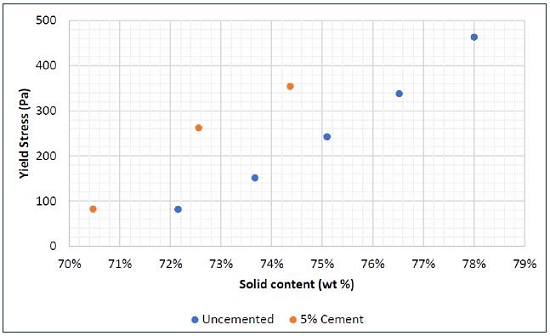
Figure 13-39: Dynamic yield
stress vs solid density
| |
Osisko Development Corp.
NI 43-101 Technical Report
Feasibility Study for the Cariboo Gold Project |
|
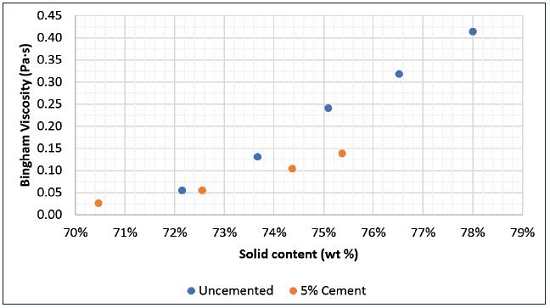
Figure 13-40: Dynamic viscosity
vs solid density
Water Bleed Test Work
Water bleeding refers to the separation of water
from the paste during the curing phase. Paste with three binder contents, 3%, 5% and 7%, were tested for water bleed at various time intervals.
Results are shown in Table 13-69.
Table 13-69: Water bleed
test results
| Slump (mm) |
247.7 |
245.0 |
251.6 |
| Paste Density (kg/m³) |
1,888 |
1,883 |
1,889 |
| Solid Content (%) |
73.2 |
73.2 |
73.3 |
| Binder Content (%) |
3.0 |
5.0 |
7.0 |
| Time (h) |
|
Bleed Water (%) |
|
| 0.5 |
0.5 |
0.5 |
0.5 |
| 1 |
0.9 |
1.1 |
1.1 |
| 2 |
1.1 |
1.4 |
1.6 |
| 4 |
1.1 |
1.5 |
1.6 |
| 24 |
1.1 |
1.5 |
1.6 |
| |
Osisko Development Corp.
NI 43-101 Technical Report
Feasibility Study for the Cariboo Gold Project |
|
| 13.8.3.3 | Unconfined Compressive Strength |
The USC testing
program was performed to assess the strength of the various paste mix design and curing time. The solid content, slump and binder
content were varied during the test to determine the effects on the USC. The binder used was the GUL cement.
Decanted sample water, binder and tailings were
mixed using a hand drill and casted in cylinder molds (51 mm x 102 mm) in triplicate. Samples were cured in covered curing bins at
≥95% humidity, at a temperature of 21 °C +/- 2 °C for 7, 28 and 120 days.
The USC was calculated based on the peak load
applied to the sample by a strain-controlled load frame of 5,000 lb S-type.
Table 13-70: Summary of
UCS matrix and test results
Batch
# |
Material |
Target
Slump
(mm) |
Actual
Slump
(mm) |
Binder
Content
(wt%) |
Solid
Content
(wt%) |
UCS (kPa) |
| Day 7 |
Day 28 |
Day 120 |
| 1 |
8:1 RT/ST mix |
200 |
197 |
3 |
74.5 |
129 |
157 |
156 |
| 2 |
8:1 RT/ST mix |
200 |
194 |
5 |
74.4 |
220 |
319 |
386 |
| 3 |
8:1 RT/ST mix |
200 |
195 |
7 |
74.5 |
437 |
546 |
665 |
| 4 |
8:1 RT/ST mix |
225 |
235 |
3 |
73.2 |
111 |
134 |
138 |
| 5 |
8:1 RT/ST mix |
225 |
231 |
5 |
73.1 |
193 |
253 |
266 |
| 6 |
8:1 RT/ST mix |
225 |
240 |
7 |
73.5 |
342 |
521 |
718 |
| 7 |
8:1 RT/ST mix |
250 |
248 |
3 |
73.2 |
119 |
135 |
184 |
| 8 |
8:1 RT/ST mix |
250 |
245 |
5 |
73.2 |
211 |
240 |
397 |
| 9 |
8:1 RT/ST mix |
250 |
252 |
7 |
73.3 |
396 |
513 |
623 |
| 10 |
5:1 RT/ST mix |
225 |
235 |
3 |
72.2 |
98 |
137 |
142 |
| 11 |
5:1 RT/ST mix |
225 |
229 |
7 |
72.6 |
311 |
422 |
592 |
| 12 |
8:1 RT/ST mix |
225 |
223 |
11 |
73.3 |
850 |
1,032 |
N/A* |
| 13 |
8:1 RT/ST mix |
225 |
219 |
14 |
73.5 |
1,667 |
2,023 |
N/A* |
* UCS Data for Day 120 not available due to limited
material.
The fourth paste backfill testing programs provided
valuable information on the material properties and paste performance characteristics. As the tailings physicochemical properties have
changed along the Project, the paste backfill analysis will be based on the latest testing program results.
| |
Osisko Development Corp.
NI 43-101 Technical Report
Feasibility Study for the Cariboo Gold Project |
|
As measured, an increase in the paste solid content
leads to a higher UCS. As well, the UCS increases with higher amount of cement in the paste. For the 7 to 120 days curing time, the strength
of the paste improves.
The binder content to obtain the backfill strength
required after a specific curing time is estimated from the UCS results for the 8:1 ratio (rougher tails: cleaner scavenger tails).
A paste with a solid
content between 72% to 75% and a cement content between 3% to 7% will cover the uncompressed strength needed for the mine plan.
Over the mine life, the average binder consumption will be 4%. A summary of requirements for the mine is presented in Table 13-71.
Table 13-71: Binder content estimate based
on the mining plan UCS and curing time requirement
| Stope Volume |
UCS |
Curing Time |
Binder |
| (% mine) |
(kPa) |
(day) |
(%) |
| 50% |
165 |
7 |
3.9 |
| 12% |
240 |
7 |
5.0 |
| 8% |
285 |
7 |
5.7 |
| 4% |
233 |
7 |
4.9 |
| 1% |
370 |
7 |
7.0 |
| 0% |
393 |
7 |
7.3 |
| 20% |
100 |
14 |
2.9 |
| 4% |
100 |
14 |
2.9 |
| 0% |
100 |
14 |
2.9 |
| Weighted Average |
|
|
4.0 |
| 13.9 | Recovery Considerations |
For overall recovery
calculations, the performance of Mosquito Zone was assumed to be the same as Shaft Zone. The recovery model was built by unit operation
and takes into consideration the natural enrichment of the fines bypassing the ore sorters, the ore sorter performance and the recoveries
to gravity and flotation (after only two stages of cleaning with scavenging of the first cleaner tails) concentrates. The model is mostly
based on test results for the Base Met Labs test program by ore zones and validated against tests on blended composites and previous
test results. However, the fines bypass (to the Ore Sorters) is assumed to be 30% of ROM as per a blast simulation for the PSD of the
mill feed, and all datapoints available per ore zones were used for the calculation of the grade enrichment of the fines. The fines enrichment
considerations are summarized in Table 13-72.
| |
Osisko Development Corp.
NI 43-101 Technical Report
Feasibility Study for the Cariboo Gold Project |
|
Table 13-72: Fines bypass
enrichment parameters
| Parameter |
Production
- Zones |
| Lowhee |
Shaft |
Mosquito |
Cow |
Valley |
| Au to Ore Sorter Bypass (fines) |
52.3% |
46.1% |
46.1% |
49.5% |
37.4% |
| Mass to Ore Sorter Bypass |
30.0% |
30.0% |
30.0% |
30.0% |
30.0% |
The ore sorting test work demonstrated the effectiveness
of various sorting methods and technologies in recovering valuable minerals from the ore. The XRT and laser sensors proved to be successful
in achieving high recovery rates with minimal mass pull. The test work highlighted the importance of considering fines during circuit
design and optimizing ore sorter settings
The recent test results at Base Met Labs were
utilized to determine settings for the development, evaluation, and measurement of recovery per zone. The focus was on achieving higher
recovery, lower mass pull, and an intermediate setting.
Table 13-73: Ore sorting
recovery parameters
| Parameter |
Lowhee Zone |
Shaft Zone |
Mosquito Zone |
Cow Zone |
Valley Zone |
Mass
(%) |
Gold
(%) |
Mass
(%) |
Gold
(%) |
Mass
(%) |
Gold
(%) |
Mass
(%) |
Gold
(%) |
Mass
(%) |
Gold
(%) |
| High Recovery |
17.7% |
99.3% |
54.5% |
97.4% |
54.5% |
97.4% |
31.5% |
89.4% |
45.6% |
98.4% |
| Lower Mass Pull |
7.9% |
98.9% |
14.9% |
87.8% |
14.9% |
87.8% |
9.0% |
79.8% |
18.7% |
95.8% |
| Intermediate |
9.2% |
99.0% |
37.5% |
90.1% |
37.5% |
90.1% |
16.5% |
84.5% |
25.9% |
95.9% |
| 13.9.2 | Gravity Concentration |
Variability gravity
concentration tests performed on sorted composite samples were completed within the envisioned flowsheet for the project, including gravity
concentration of ball mill discharge and regrind mill discharge target size. Results showed fluctuations in various zones with specific
recovery rates. The results are summarized in Table 13-74.
Table 13-74: Gravity recovery
parameters
| Parameter |
Production - Zones |
| Lowhee |
Shaft |
Mosquito |
Cow |
Valley |
| Au Recovery to Gravity |
55.0% |
45.0% |
45.0% |
50.0% |
35.0% |
| |
Osisko Development Corp.
NI 43-101 Technical Report
Feasibility Study for the Cariboo Gold Project |
|
The overall gravity recovery calculated via recovery
model for the mineral composition of the Bulk composite yielded a 45.8% Au recovery from ball mill feed and the model from FLSmidth, based
on E-GRG results on the same composite sample, show an overall 44.3% Au recovery to gravity concentrates.
Recovery and mass
pull forecast for each zone was based on averages of the latest test work on sorted material with gravity separation integrated to the
flowsheet and variability tests, when available. Results from Deep Shaft Zone were included with the Shaft Zone dataset. For mass pull
forecast, only tests with regrind size within the 17 µm to 25 µm
range were considered. Flotation mass pull was calculated from ball mill feed to final concentrate. The results are summarized in Table 13-75.
Table 13-75: Flotation
recovery parameters
| Parameter |
Production - Zones |
| Lowhee |
Shaft |
Mosquito |
Cow |
Valley |
| Au Recovery to Flotation |
90.7% |
92.6% |
92.6% |
88.1% |
92.9% |
| Mass Pull |
1.6% |
1.4% |
1.4% |
1.3% |
1.2% |
The LCT was completed on sorted Blend composite.
The overall recovery (to the second cleaner concentrate and gravity concentrate) was 98.5% Au. The flotation circuit performance (including
gravity concentration and excluding losses to ore sorting tailings) calculated via recovery model for the mineral composition of the Blend
composite yielded a 97.6% Au recovery showing potential for actual plant performance to be better than the forecast in this study.
| |
Osisko Development Corp.
NI 43-101 Technical Report
Feasibility Study for the Cariboo Gold Project |
|
| 14. | Mineral Resource Estimates |
The 2025 Feasibility Study Mineral Resource Estimate
(the “2025 FS MRE”) for the Cariboo Gold Project encompasses mineral resources for the deposits of Cow Mountain (Cow
Zone and Valley Zone), Island Mountain (Shaft Zone and Mosquito Zone), and Barkerville Mountain (Lowhee Zone, KL Zone, BC Vein Zone, and
the Bonanza Ledge Zone).
There have been no changes to the mineral resource
estimation as previously reported in the 2022 FS MRE, other than adjustments for mining depletion in the Lowhee Zone, changes to the cut-off
grade assumptions and removal of silver from the estimate.
Silver has been removed due to limited supporting
data and because the estimated ounces were not material.
The 2022 FS MRE for Cow, Valley, Mosquito, Shaft,
KL, Lowhee, and BC veins was prepared by Daniel Downton, P.Geo., of ODV. The Bonanza Ledge deposit remained unchanged.
The Lowhee Zone is depleted by the underground
workings and the bulk sample stope. As mineralization is present in the walls of the bulk sample, a 5-m buffer has not been added as there
is still mining potential. Both the underground workings and bulk sample are current as of the end of January 2025.
The depletion was reviewed and validated by Carl
Pelletier, P.Geo., and Tessa Scott, P.Geo., both of InnovExplo, using all available information.
The effective date of the 2025 FS MRE is
April 22, 2025.
The 2025 FS MRE covers all the deposits
in the Cow-Island-Barkerville Mountain Corridor. The Mineral Resource model area for the Cow/Island segment covers a strike length
of 3.7 km and a width of approximately 700 m, down to a vertical depth of 600 m below surface. The estimate for the Barkerville
segment covers a strike length of 3 km and a width of approximately 700 m, down to a vertical depth of 500 m below surface.
| |
Osisko Development Corp.
NI 43-101 Technical Report
Feasibility Study for the Cariboo Gold Project |
|
The models for the Cow, Valley, Shaft, Mosquito,
BC Vein, KL, and Lowhee deposits were prepared using LeapFrog GEO v.2021.2.4 (“LeapFrog”) and Datamine StudioTM
RM Pro 1.11.300.0 (“Datamine”). Leapfrog was used for the modelling, which included the construction of the dilution halos
and 481 mineralized solids: 109 for Cow; 106 for Valley; 98 for Shaft; 75 for Mosquito; six for BC Vein, including five BC Vein splays;
40 for KL; and 47 for Lowhee. Datamine was used for the estimation, which consisted of 3D block modelling and the ordinary kriging (“OK”)
interpolation method. Statistical studies, capping and variography were completed using Datamine, Supervisor v.8.14.3 software (“Supervisor”),
GSLIB, and Microsoft Excel. Capping and validations were carried out in Datamine, Supervisor, and Microsoft Excel.
The Bonanza Ledge model was prepared using GEOVIA
GEMSTM software v.6.7 (“GEMS”). GEMS was used for the modelling, which included
the construction of one mineralized solid, and for the estimation, which consisted of 3D block modelling and OK interpolation. Statistical
studies and variography were done using Supervisor. Capping and several validations were conducted in Microsoft Excel and Supervisor.
The main steps in the methodology were as follows:
| ■ | Compile and validate the diamond drill hole databases used for Mineral Resource estimation; |
| ■ | Validate the geological model and interpretation of the mineralized zones based on lithological and structural information, historical
underground mapping and general orientation of stopes, and metal content; |
| ■ | Validate the drill hole intercepts database, compositing database, and capping values, for the purposes of geostatistical analysis,
and variography; |
| ■ | Validate the block models and grade interpolation; |
| ■ | Revise the classification criteria and validate the clipping areas for Mineral Resource classification; |
| ■ | Assess the Mineral Resources with “reasonable prospects for economic extraction” and select appropriate cut-off grades
and produce “resources-level” optimized underground potentially mineable shapes; |
| ■ | Generate a Mineral Resource statement. |
| |
Osisko Development Corp.
NI 43-101 Technical Report
Feasibility Study for the Cariboo Gold Project |
|
Two diamond drill hole databases cover the Project:
Bonanza Ledge and BM-CM-IM (Barkerville Mountain, including the BC Vein, KL, and Lowhee deposits, Cow Mountain, including the Cow and
Valley deposits, and Island Mountain, including the Shaft and Mosquito deposits).
These databases were filtered by deposit (Cow,
Shaft, Valley, Mosquito, BC Vein, KL, or Lowhee) before working in Datamine. A subset of drill holes was used to generate the 2022 FS
MRE database for each deposit (Table 14-1 and Figure 14-1). Holes often overlap between deposits and the geological models are
reviewed to avoid using the same samples in different models.
| ■ | The close-out date for the Cow deposit is August 25, 2021. It contains 1,219 validated drill holes (1,067 surface DDH and 152 underground
DDH); |
| ■ | The close-out date for the Valley deposit is March 9, 2022. It contains 254 validated surface drill holes; |
| ■ | The close-out date for the Shaft deposit is March 31, 2022. It contains 1,010 validated drill holes (851 surface DDH and 159 underground
DDH); |
| ■ | The close-out date for the Mosquito deposit is July 19, 2021. It contains 841 validated drill holes (590 surface DDH and 256 underground
DDH); |
| ■ | The close-out date for the Lowhee deposit is April 6, 2022. It contains 158 validated surface drill holes; |
| ■ | The close-out date for the BC Vein and KL deposits is February 14, 2020. It contains 420 validated surface drill holes; |
| ■ | The close-out date for the Bonanza Ledge GEMS database is July 18, 2016. It contains 213 validated holes, of which a subset of 162
was used as the Mineral Resource database (103 surface DDH and 59 underground DDH) (Table 14-1and Figure 14-2). The database
also contains 7,432 blast holes that were used to guide the interpretation only. |
Assay results from 27 drill holes were received
after April 6, 2022, representing 6,563.9 m of assays, and, as such, are excluded from the 2025 FS MRE. As noted in Section 10.9,
these results would not make a material difference to the 2025 FS MRE.
All databases include lithological, alteration,
and structural descriptions taken from drill core logs. Oriented core data have been available since the 2016 Program.
The databases cover the strike length of each
Mineral Resource area at variable drill spacings, ranging from 10 m to 60 m for the Cow, Island, and Barkerville mountain deposits,
and from 5–15 m for the Bonanza Ledge deposit.
| |
Osisko Development Corp.
NI 43-101 Technical Report
Feasibility Study for the Cariboo Gold Project |
|
In addition to the tables of raw data, each database
includes several tables of calculated drill hole composites and wireframe solid intersections, which are required for the statistical
evaluation and Mineral Resource block modelling.
Table 14-1: Number of
drill holes in each database
| Deposit |
Validated
Drill Holes Used for the 2024 FS MRE |
| Surface |
Underground |
Total |
| Cow |
1,067 |
152 |
1,219 |
| Valley |
254 |
0 |
254 |
| Shaft |
851 |
159 |
1,010 |
| Mosquito |
590 |
256 |
841 |
| KL |
113 |
0 |
113 |
| Lowhee |
158 |
0 |
158 |
| BC Vein |
307 |
0 |
307 |
| Bonanza Ledge |
103 |
59 |
162 |
| |
Osisko Development Corp.
NI 43-101 Technical Report
Feasibility Study for the Cariboo Gold Project |
|
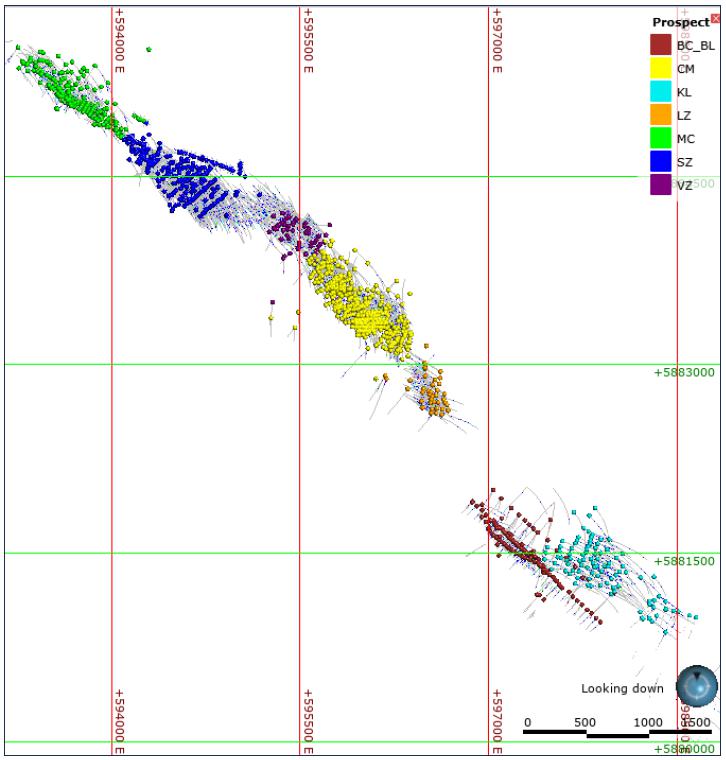
Figure 14-1: Surface
plan view of the validated DDH used to in the 2025 FS MRE
for the deposits of the Cow-Island-Barkerville
Mountain Corridor
| |
Osisko Development Corp.
NI 43-101 Technical Report
Feasibility Study for the Cariboo Gold Project |
|
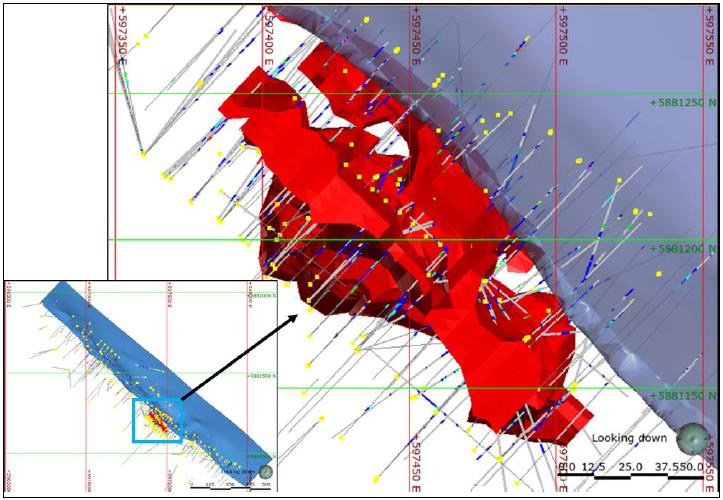
Figure 14-2: Surface
plan view of the validated Bonanza Ledge DDH for the 2025 FS MRE
The inset figure shows the
location of Bonanza Ledge (red) along the BC Vein (blue)
The geological models remain unchanged since the
2022 FS.
All the geological models were reviewed, validated,
and approved by the QPs for the 2025 FS. The QPs are of the opinion that the models are acceptable for the mineral resource.
The Bonanza Ledge geological model, as documented
in Brousseau et al. (2017), was reviewed and validated by the QPs. No new data have been acquired at Bonanza Ledge since the technical
report of Brousseau et al. (2017).
The data used to create the geological models
consists of drill hole data (including oriented core), underground mapping from historical level plans, and stope orientations. Oriented
core data have been available since 2016 for all the deposits.
| |
Osisko Development Corp.
NI 43-101 Technical Report
Feasibility Study for the Cariboo Gold Project |
|
A total of 482 geological solids were created
for the deposits.
The Cow, Valley, Shaft, Mosquito, Lowhee, and
KL geological models consist of 475 mineralized solids representing axial planar (“AXPL”) veins (Figure 14-3). All geological
solids were modelled in Leapfrog. The solids were designed with a minimum thickness of 2 m and based on a cut-off grade of 2.0 g/t
gold. The solids veins extend to a radius of up to 50 m from the last selected intercept or are fixed at the mid-distance of an intercept
that does not meet the minimum grade criterion. The solids were snapped to drill holes. The solids were created from the AXPL structural
data, using indicator interpolants as guides.
Figure 14-4 shows an example of a modelled
solid representing AXPL veins from the Shaft deposit model.
A solid representing a 5-m halo surrounding the
AXPL vein corridors was also created for each of the Mosquito, Shaft, Valley, Cow, Lowhee, and KL deposits. These were created to limit
and provide a halo of dilution around the AXPL mineralized veins. The halos were created using the numerical distance function around
the combined AXPL solids in LeapFrog. An example of the dilution halo for the Lowhee Zone is presented in Figure 14-5. Dilution halos
were not created for the BC Vein and Bonanza Ledge deposits.
The geological model for the BC Vein includes
one sheared solid representing the mineralized Layer Parallel (“LP”) vein, along with five solids representing mineralized
LP splays (Figure 14-6). The solids were modelled in Leapfrog. The BC Vein and splays were modelled from geological logs and
grade intervals. The BC Vein was designed with a minimum thickness of 2 m, controlled by the hanging and footwall of the shear,
and was based on a cut-off grade of 1.0 g/t Au. Geological contacts were given precedent over grade. The splays were designed with a minimum
thickness of 2 m and were based on a cut-off grade of 1.0 g/t Au. All solids were snapped to drill holes.
A geological structural contact was modelled between
the BC Vein and the KL deposits. The surface is a major lithological contact between the brittle sandstone, which hosts the KL AXPL
veins, and the more ductile carbonaceous mudstones and siltstones that host the BC Vein shear and LP veins. This contact was used
as a hard boundary to limit the extent of the mineralized geological models (Figure 14-6).
In 2017, InnovExplo created one solid for the
Bonanza Ledge deposit (Brousseau et al., 2017). Construction lines were created on cross-sections spaced 5 m to 25 m apart, which
were snapped to drill hole intercepts. The solid was inspired by a sulphide shell defined in Brousseau et al. (2017) using a threshold
of 3% pyrite and clipped to the Footwall Fault to the southwest, which was modelled from drill hole logs (Figure 14-7). The MRE QPs
for the 2025 FS reviewed and validated the 2017 model and concluded that the model remains accurate for the 2025 FS MRE update.
| |
Osisko Development Corp.
NI 43-101 Technical Report
Feasibility Study for the Cariboo Gold Project |
|
Two surfaces were created for each deposit to
define the topography and the overburden/bedrock contact. The topography was created using LIDAR data from 2016, except for Bonanza Ledge,
which used LIDAR data from 2000 (before the test pit was excavated at the Bonanza Ledge mine). The overburden-bedrock contact was modelled
using logged overburden intervals. A waste solid was also created for Bonanza Ledge corresponding to the block model limits.
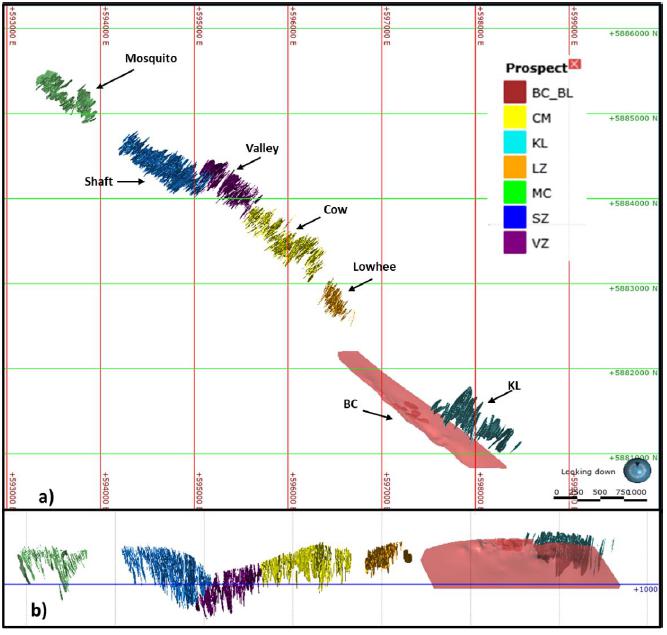
Figure 14-3: Mineralized
solids of the Cow, Valley, Shaft, Mosquito, Lowhee, BC Vein,
and KL models a) Surface
plan view; b) Section view looking north-northeast
| |
Osisko Development Corp.
NI 43-101 Technical Report
Feasibility Study for the Cariboo Gold Project |
|
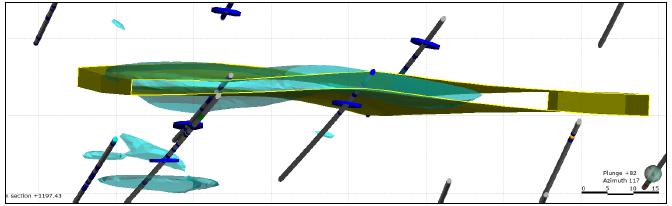
Figure 14-4: Example
of data used for the 3D Shaft deposit model
Vein solid (yellow); 3.0-g/t Au
indicator interpolant (cyan); oriented core AXPL veins (blue);
25-m-thick plan view section

Figure 14-5: Plan view
section of the Lowhee AXPL Veins and surrounding 5 m dilution halo
Lowhee AXPL Veins (Yellow);
5 m dilution halo (pale blue)
| |
Osisko Development Corp.
NI 43-101 Technical Report
Feasibility Study for the Cariboo Gold Project |
|
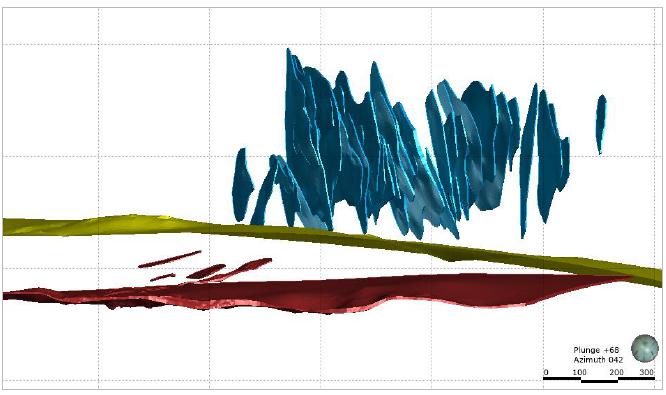
Figure 14-6: Isometric
view of the BC Vein and KL deposit models, and the AXPL-LP
contact surface BC Vein
(dark red); KL (blue); AP-LP contact (yellow)
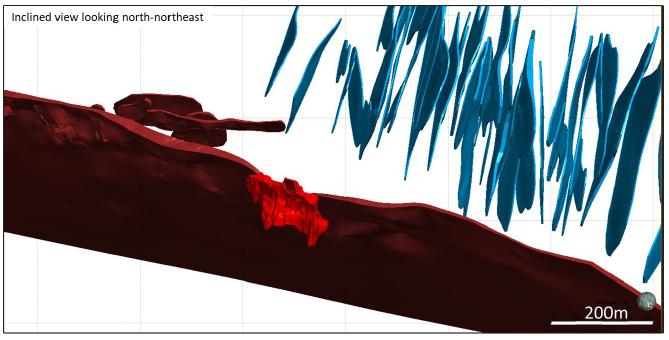
Figure 14-7: Isometric
view of the BC Vein, Bonanza Ledge, and KL deposit models
BC Vein (dark red); Bonanza
Ledge (red); KL (blue)
| |
Osisko Development Corp.
NI 43-101 Technical Report
Feasibility Study for the Cariboo Gold Project |
|
The only change to the 2022 FS void models is
the development and bulk sample at the Lowhee Zone in 2024/2025. The voids models for all other deposits remains unchanged since the 2022
FS.
The Underground infrastructure mined at Bonanza
Ledge and BC Vein by ODV was surveyed and modelled by ODV. These voids were used to deplete the Bonanza Ledge deposit, which remains unchanged.
The BC Vein infrastructure was given a 5-m buffer for the recent workings. The BC Vein was last depleted for the 2022 FS.
An underground historical infrastructure voids
model was developed through review of historical data from several past mines from Island through Barkerville mountains. A 5-m buffer
was applied to all the modelled infrastructure voids of the Cow, Valley, Shaft, Mosquito, Lowhee, and BC Vein deposits to compensate
for the uncertainty in void locations.
For the 2025 MRE, the Lowhee Zone is depleted
by the underground workings and the bulk sample stope. As mineralization is present in the walls of the bulk sample, a 5-m buffer has
not been added as there is still mining potential. Both the underground workings and bulk sample are current as of the end of January
2025.
Drilling continues to intercept undocumented voids.
When the drilled void intercepts are not explained through intersection of the 5-m infrastructure buffer, to reduce the associated risk,
a spherical buffer with a 10-m radius was applied around the intercepts to represent a potential stope of 20 m in diameter. These
“intercept buffer voids” were added to the 5-m infrastructure buffers, which were then used to deplete the final MRE of the
Cow, Valley, Shaft, Mosquito, Lowhee, and BC Vein deposits.
The void solids and underground workings were
reviewed and validated by the QPs. Based on the available data, the voids in the Datamine and GEMS projects are considered accurate to
support the 2025 FS MRE.
Figure 14-8, Figure 14-9, and Figure 14-10
show the voids used to deplete the current Mineral Resource Estimate.
| |
Osisko Development Corp.
NI 43-101 Technical Report
Feasibility Study for the Cariboo Gold Project |
|
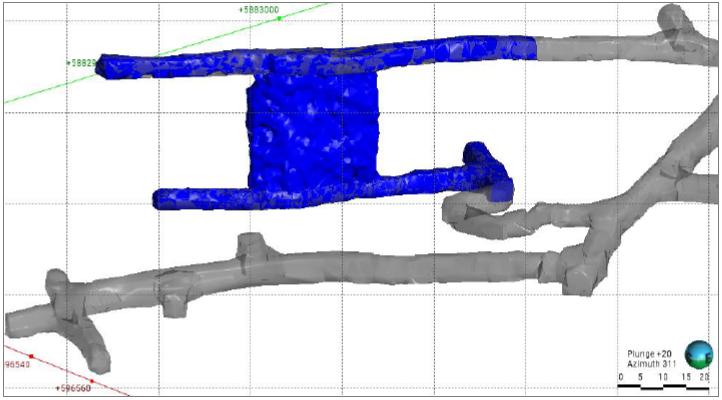
Figure 14-8: Bulk sample
at Lowhee and development (blue) with the previous development (grey)
| |
Osisko Development Corp.
NI 43-101 Technical Report
Feasibility Study for the Cariboo Gold Project |
|
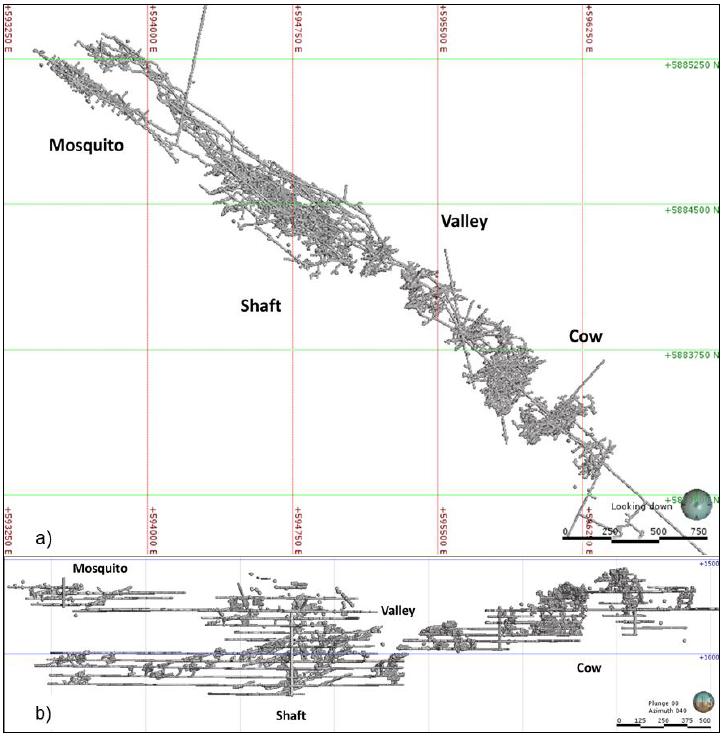
Figure 14-9: Plan and
longitudinal view of the 5-m buffer voids for Cow Mountain and Island Mountain
| |
Osisko Development Corp.
NI 43-101 Technical Report
Feasibility Study for the Cariboo Gold Project |
|
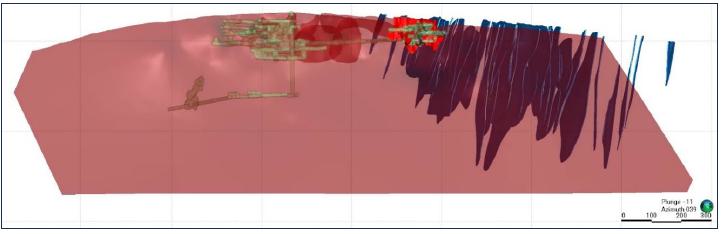
Figure 14-10: Longitudinal
view of the 5-m buffer voids for the BC Vein, Bonanza Ledge, and KL deposits
5-m buffer voids (transparent
green); BC Vein (transparent red); Bonanza Ledge (red);
KL (blue); looking north-northeast
Codes were automatically attributed to DDH assay
intervals intersecting the mineralized veins and dilution halos. Codes use the name of the corresponding 3D solid. The coded intercepts
were used to analyze sample lengths and generate statistics for raw assays and composites. Table 14-2 and Table 14-3 summarize
the statistical analysis of the original (raw) assays for each deposit. The raw sample statistics used for composite length, capping,
and variograms were defined by deposit and not individual veins due to the paucity of data.
Table 14-2: Summary statistics
for the DDH raw gold assays from mineralized veins
| Deposits |
Number
of
Samples |
Max
(Au g/t) |
Mean
(Au g/t) |
Standard
Deviation |
Coefficient
of
Variation |
| Cow |
14,876 |
6,590 |
4.31 |
56.54 |
13.12 |
| Valley |
12,982 |
1,870 |
3.37 |
24 |
7.12 |
| Shaft |
26,002 |
3,780 |
3.71 |
27.81 |
7.5 |
| Mosquito |
4,103 |
1,965 |
4.58 |
33.72 |
7.36 |
| BC Vein |
3,919 |
309 |
2.76 |
11.07 |
4.01 |
| KL |
2,413 |
145 |
1.88 |
6.09 |
3.23 |
| Lowhee |
5,450 |
2,420 |
3.61 |
36.28 |
10.07 |
| Bonanza Ledge |
3,062 |
234.5 |
7.08 |
15.35 |
2.17 |
| |
Osisko Development Corp.
NI 43-101 Technical Report
Feasibility Study for the Cariboo Gold Project |
|
Table 14-3: Summary statistics
for the DDH raw gold assays from dilution halos
| Deposits |
Number
of
Samples |
Max
(Au g/t) |
Mean
(Au g/t) |
Standard
Deviation |
Coefficient
of
Variation |
| Cow |
43,481 |
154.5 |
0.18 |
1.68 |
9.35 |
| Valley |
35,414 |
278 |
0.23 |
2.8 |
12.03 |
| Shaft |
78,184 |
192.5 |
0.15 |
1.42 |
9.2 |
| Mosquito |
13,470 |
78.1 |
0.15 |
1.16 |
7.93 |
| KL |
6,150 |
21.1 |
0.13 |
0.51 |
4.11 |
| Lowhee |
15,327 |
137.5 |
0.19 |
1.89 |
9.97 |
The DDH gold assays were composited within each
of the mineralized veins to minimize any bias introduced by variable sample lengths. DDH gold assays were also composited within the dilution
halo. Vein thickness, proposed block size, and original sample length were taken into consideration when calculating the composite lengths.
Therefore, the composite lengths were calculated for each deposit: Cow (3.0 m), Valley (1.5 m), Shaft (2.0 m), Mosquito
(2.5 m), BC Vein (2.0 m), Lowhee (1.5 m) KL (1.75 m), and Bonanza Ledge (2.0 m).
Tails were redistributed equally for all intervals
that were smaller than half the composite length. A grade of 0.00 g/t Au was assigned to missing sample intervals from historical
holes (pre-2016) within the solids. A few holes from the 2016–2021 programs were only partially sampled; a value of 0.00 g/t Au
was assigned to these missing intervals. Missing samples from the 2016–2019 drilling programs due to lost core, voids, or lost samples
were ignored.
Table 14-4 and Table 14-5 present the
summary statistics of the capped composites by deposit.
Table 14-4: Summary statistics
for capped gold composites from mineralized veins
| Deposits |
Number
of
Samples |
Max
(Au g/t) |
Mean
(Au g/t) |
Standard
Deviation |
Coefficient
of
Variation |
| Cow |
5,811 |
50 |
2.76 |
5.99 |
2.17 |
| Valley |
7,807 |
40 |
2.31 |
5.2 |
2.25 |
| Shaft |
12,879 |
50 |
2.67 |
6.46 |
2.42 |
| Mosquito |
1,897 |
50 |
3.09 |
6.96 |
2.26 |
| BC Vein |
2,040 |
40 |
2.3 |
5.45 |
2.37 |
| KL |
1,294 |
20 |
1.39 |
2.66 |
1.91 |
| Lowhee |
3,217 |
40 |
2.08 |
5.13 |
2.47 |
| Bonanza Ledge |
2,602 |
70 |
5.98 |
10.77 |
1.8 |
| |
Osisko Development Corp.
NI 43-101 Technical Report
Feasibility Study for the Cariboo Gold Project |
|
Table 14-5: Summary statistics
for capped gold composites from dilution halos
| Deposits |
Number
of
Samples |
Max
(Au g/t) |
Mean
(Au g/t) |
Standard
Deviation |
Coefficient
of
Variation |
| Cow |
19,594 |
2.0 |
0.12 |
0.26 |
2.18 |
| Valley |
24,529 |
2.0 |
0.12 |
0.28 |
2.41 |
| Shaft |
43,870 |
2.0 |
0.09 |
0.25 |
2.64 |
| Mosquito |
7,450 |
2.0 |
0.10 |
0.25 |
2.54 |
| KL |
3,794 |
1.5 |
0.09 |
0.20 |
2.26 |
| Lowhee |
10,743 |
1.5 |
0.10 |
0.22 |
2.20 |
Although the indicator variograms suggest that
high-grade continuity ranges increase with decreasing grade, the lack of detailed underground mapping and sampling is an obstacle to defining
the most suitable grade ranges in areas with wider drilling grids.
Multiple capping (capping at different ranges
in each deposit) was selected as the capping methodology for the gold grades in the Cow, Valley, Shaft, Mosquito, KL, Lowhee, and BC Vein
mineralized vein models (see below for Bonanza Ledge).
For these deposits, the highest selected capping
value corresponds to the grade at 99% of the total variance on the indicator variograms. The highest grades vary from 20 g/t to 70 g/t Au.
The second and third grades were selected based on the probability plot and vary from 7 g/t to 30 g/t Au. The Shaft deposit
is shown as an example in Figure 14-11 and Figure 14-12.
The maximum range for high-grade connectivity
was established using the indicator variograms, which suggests a loss of connectivity after 17 m to 33 m, depending on the mineralized
zone. A range of 25 m was selected and applied to all zones as a general average, given the lack of detailed information for each
deposit.
| |
Osisko Development Corp.
NI 43-101 Technical Report
Feasibility Study for the Cariboo Gold Project |
|
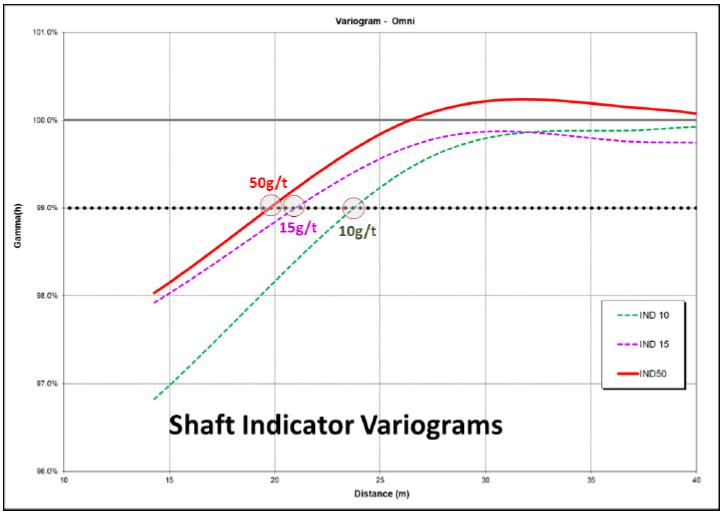
Figure 14-11: Indicator
variograms for the Shaft deposit
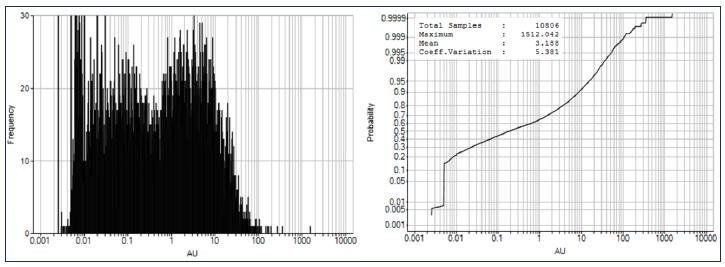
Figure 14-12: Grade log
histogram and probability plot for the Shaft deposit
| |
Osisko Development Corp.
NI 43-101 Technical Report
Feasibility Study for the Cariboo Gold Project |
|
For Bonanza Ledge, basic univariate
statistics were performed on individual composited gold assay datasets. The capping applied for Bonanza Ledge was a single top cap of
70 g/t Au on the composited data. 16 samples were capped with this value, which was selected by combining the dataset analysis
with the probability plot and log-normal grade distribution.
High-grade gold values in the dilution halos are
primarily associated with AXPL veins that could not be modelled due to lack of continuity between drill holes. Basic univariate statistical
analysis of the gold values within these halos indicates a change in the populations between 1.5 g/t Au (Lowhee and KL) and 2.0 g/t Au
(Mosquito, Shaft, Valley, and Cow) on log probability and mean / variance plots.
Bulk densities were determined by standard
water immersion methods on half-core samples. ODV’s Mineral Resource
databases contain 8,584 measurements taken on samples from within the mineralized veins from all deposits. A combination of 21,006 measurements
were used to determine the bulk density of the surrounding dilution from all deposit areas. Table 14-6 provides
a breakdown of bulk density measurements in both modelled mineralized solids and the surrounding dilution by zone.
Table 14-6: Bulk density
by mineralized zone
| Deposit |
Inside
/
Outside |
Number
of
Samples |
Median
SG |
Method |
| Cow |
Inside Mineralized Veins |
1,109 |
2.8 |
ID2 and Median |
| Valley |
1,835 |
2.81 |
Median |
| Shaft |
2,881 |
2.78 |
ID2 and Median |
| Mosquito |
515 |
2.79 |
Median |
| BC Vein |
323 |
2.69 |
ID2 and Median |
| KL |
437 |
2.81 |
Median |
| Lowhee |
1,279 |
2.74 |
ID2 and Median |
| Bonanza Ledge |
205 |
3.2 |
Median |
| Cow |
Surrounding Dilution |
2,932 |
2.74 |
Median |
| Valley |
4,488 |
2.76 |
Median |
| Shaft |
6,627 |
2.74 |
Median |
| Mosquito |
3,489 |
2.75 |
Median |
| KL |
1,683 |
2.76 |
Median |
| Lowhee |
1,787 |
2.72 |
Median |
| |
Osisko Development Corp.
NI 43-101 Technical Report
Feasibility Study for the Cariboo Gold Project |
|
For the Cow, Shaft, Lowhee, and BC Vein models,
the bulk density was estimated by the Inverse Distance Squared (“ID2”) interpolation method in the block model. The median
bulk density was applied to non-estimated blocks: 2.80 g/cm3” at Cow, 2.78 g/cm3 at Shaft, 2.74 g/cm3
at Lowhee, and 2.69 g/cm3 at BC Vein.
Due to the paucity of density data in each of
the Valley, Mosquito and KL Zones, the median value of the bulk density measurements in each of those mineralized veins was applied to
all blocks in each of the Valley (2.81 g/cm3), Mosquito (2.79 g/cm3), and KL (2.81 g/cm3)
deposits, respectively.
The median value of the bulk density measurements
in the surrounding dilution was applied to all six deposit dilution halos: Cow (2.74 g/cm3), Valley (2.76 g/cm3),
Shaft (2.74 g/cm3), Mosquito (2.75 g/cm3), KL (2.76 g/cm3), and Lowhee (2.72 g/cm3).
For Bonanza Ledge, the average value of 3.20 g/cm3
from Sandefur and Stone (2006) was applied. In 2017, InnovExplo confirmed this value with 23 bulk density measurements during the
independent resampling program, returning an average of 3.19 g/cm3 (Brousseau et al., 2017).
A density of 2.00 g/cm3 was assigned
to the overburden, 2.70 g/cm3 to any uncoded waste rock, and 0.00 g/cm3 to the 5-m buffer voids (including
underground drifts and stopes). The 3D mineralized zones and dilution halos were clipped at the overburden.
Bulk densities were used to calculate tonnages
from the volume estimates in the block model.
A block model was created for each of the deposits.
They were last updated on September 8, 2022, but remain appropriate for use in the 2025 FS MRE due to the lack of data generated since
then.
For the Cow, Valley, Shaft, Mosquito, Lowhee,
KL, and BC Vein models, unrotated sub-block models were used in Datamine. The sub-blocks were created within each mineralized vein
zone and dilution halo.
The Bonanza Ledge block model corresponds to an
unrotated percent block model in GEMS. All blocks with more than 0.01% of their volume falling within a selected solid were assigned the
corresponding block code for that solid in their respective folder. A percent block model was generated, reflecting the proportion of
each block inside every solid (i.e., individual mineralized zones, overburden, voids and waste).
The origin of each block model is the lower-left
corner. Block dimensions reflect the sizes of mineralized zones and plausible mining methods.
| |
Osisko Development Corp.
NI 43-101 Technical Report
Feasibility Study for the Cariboo Gold Project |
|
Table 14-7 shows the properties of each block
model.
Table 14-7: Block model
properties
| Deposits |
Description |
Easting
(m) |
Northing
(m) |
Elevation
(m) |
| Cow |
Block Model Origin |
595,500 |
5,883,000 |
850 |
| Parent Block Dimension |
5 |
5 |
5 |
| Number of Parent Blocks |
190 |
190 |
128 |
| Sub-block Dimension |
0.625 |
0.625 |
0.5 |
| Valley |
Block Model Origin |
595,000 |
5,883,700 |
600 |
| Parent Block Dimension |
5 |
5 |
5 |
| Number of Parent Blocks |
160 |
160 |
130 |
| Sub-block Dimension |
0.625 |
0.625 |
0.5 |
| Shaft |
Block Model Origin |
594,160 |
5,884,000 |
690 |
| Parent Block Dimension |
5 |
5 |
5 |
| Number of Parent Blocks |
212 |
164 |
154 |
| Sub-block Dimension |
0.625 |
0.625 |
0.5 |
| Mosquito |
Block Model Origin |
593,250 |
5,884,850 |
800 |
| Parent Block Dimension |
5 |
5 |
5 |
| Number of Parent Blocks |
150 |
140 |
130 |
| Sub-block Dimension |
0.625 |
0.625 |
0.5 |
| BC Vein |
Block Model Origin |
596,500 |
5,880,800 |
940 |
| Parent Block Dimension |
5 |
5 |
5 |
| Number of Parent Blocks |
370 |
284 |
118 |
| Sub-block Dimension |
1.0 |
1.0 |
1.0 |
| KL |
Block Model Origin |
597,500 |
5,880,900 |
1,000 |
| Parent Block Dimension |
5 |
5 |
5 |
| Number of Parent Blocks |
210 |
190 |
130 |
| Sub-block Dimension |
0.5 |
0.5 |
0.5 |
| Lowhee |
Block Model Origin |
596,300 |
5,882,450 |
1,000 |
| Parent Block Dimension |
5 |
5 |
5 |
| Number of Parent Blocks |
90 |
140 |
100 |
| Sub-block Dimension |
0.5 |
0.5 |
0.5 |
| Bonanza Ledge |
Block Model Origin |
596,700 |
5,880,800 |
1,600 |
| Block size |
2 |
2 |
5 |
| Block extent (m) |
1,300 |
1,200 |
620 |
| |
Osisko Development Corp.
NI 43-101 Technical Report
Feasibility Study for the Cariboo Gold Project |
|
14.9
Variography and Search Ellipsoids
For the Cow, Valley, Shaft, Mosquito, KL, Lowhee,
and BC Vein models, the 3D directional-specific search ellipses were guided by the hanging wall and footwall of each vein for an
anisotropic search. The search radii were determined by the indicator variograms in Section 14.6.
Variogram models were designed for gold using
composited assay data. Spherical variograms were modelled for each of these deposits. Separate variograms were designed for the dilution
halo domains along an orientation that corresponds to the strike and dip of the mineralized zones based on the assumption that any mineralization
in the dilution is associated with AXPL veins.
Figure 14-13 shows an example of the variogram
models used in the Mineral Resource estimation for the Cow model.
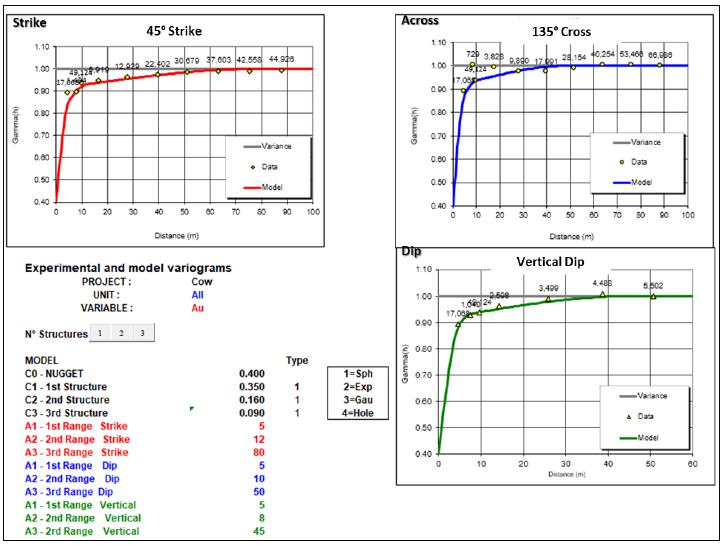
Figure 14-13: Variogram
models of gold grade for the Cow deposit
| |
Osisko Development Corp.
NI 43-101 Technical Report
Feasibility Study for the Cariboo Gold Project |
|
For the Bonanza Ledge model, a 3D directional
variography was completed on DDH composites of capped gold assay data. The study was carried out in the Supervisor software. The 3D directional-specific
investigations yielded the best-fit model along an orientation that corresponds to the strike and dip of the mineralized zones.
The downhole variograms suggest a low nugget effect
of 3% for the Bonanza Ledge zones. Two sets of search ellipsoids were built from the variogram analysis, corresponding to 1x the results
and 1.5x the results.
The interpolation profiles were customized for
each vein of each deposit to estimate grades with hard boundaries.
For the Cow, Valley, Shaft, Mosquito, KL, Lowhee,
and BC Vein deposits, the mineralized vein blocks were estimated independently. Gold was estimated with an anisotropic three-pass
search to estimate all blocks within the veins. For each pass, the high-grades were restricted, as determined in Section 14.6. The first
pass range and distance for the restricted search grade (high-grade capping) correspond to a maximum of 25 m, as determined in Section
14.6. For the second and third passes, the ranges increased (respectively 2x and 2.5x the previous pass ranges), but the restricted search
grade values decreased. These grade values were determined from indicator variograms and the geological knowledge for each deposit. The
fourth interpolation pass was used to fill the wireframes with gold grades. In the dilution halos, gold was estimated with a three-pass
search relative to the continuity rotation orientations determined from variogram analysis in Section 14.9. For each pass, the high-grades
were restricted, as determined in Section 14.6. The first pass range correspond to a maximum of 12.5 m x 12.5 m x 2.5 m, determined
by variogram analysis in Section 14.6 and chosen to limit the influence of distal high-grade samples in the dilution interpolation. For
the second and third passes, the ranges increased by 2x and 4x the first pass range, respectively.
For the Bonanza Ledge deposit, passes ranges were
derived from the variography using capped composites. The interpolation was run on a point area workspace extracted from the DDH dataset
in GEMS. A two-pass search was used for the MRE. The ellipsoid radii for Pass 1 were the same as the variography results (1x). The
ellipsoid radii from Pass 2 were 1.5x the results for blocks not interpolated during Pass 1.
The OK method was selected for the final Mineral
Resource estimation as it better honours the grade distribution for all the deposits.
The grade estimation parameters are summarized
in Table 14-8 and Table 14-9.
| |
Osisko Development Corp.
NI 43-101 Technical Report
Feasibility Study for the Cariboo Gold Project |
|
Table 14-8: Mineralized
veins gold grade estimation parameters
| Deposit |
Pass |
Min
Comp |
Max
Comp |
Min
DDH |
Orientation |
Ranges |
Au
g/t
Cap |
| Azi
(Z) |
Dip
(X) |
Azi
(Z) |
X
(m) |
Y
(m) |
Z
(m) |
| Cow |
1 |
4 |
12 |
2 |
Anisotropic |
25 |
25 |
25 |
50 |
| 2 |
4 |
12 |
2 |
Anisotropic |
50 |
50 |
50 |
25 |
| 3 |
4 |
12 |
2 |
Anisotropic |
125 |
125 |
125 |
15 |
| 4 |
3 |
12 |
2 |
Anisotropic |
250 |
250 |
250 |
10 |
| Valley |
1 |
4 |
12 |
2 |
Anisotropic |
25 |
25 |
25 |
40 |
| 2 |
4 |
12 |
2 |
Anisotropic |
50 |
50 |
50 |
25 |
| 3 |
4 |
12 |
2 |
Anisotropic |
125 |
125 |
125 |
15 |
| 4 |
3 |
12 |
2 |
Anisotropic |
250 |
250 |
250 |
10 |
| Shaft |
1 |
4 |
12 |
2 |
Anisotropic |
25 |
25 |
25 |
50 |
| 2 |
4 |
12 |
2 |
Anisotropic |
50 |
50 |
50 |
30 |
| 3 |
4 |
12 |
2 |
Anisotropic |
125 |
125 |
125 |
15 |
| 4 |
3 |
12 |
2 |
Anisotropic |
250 |
250 |
250 |
10 |
| Mosquito |
1 |
4 |
12 |
2 |
Anisotropic |
25 |
25 |
25 |
50 |
| 2 |
4 |
12 |
2 |
Anisotropic |
50 |
50 |
50 |
30 |
| 3 |
4 |
12 |
2 |
Anisotropic |
125 |
125 |
125 |
15 |
| 4 |
3 |
12 |
2 |
Anisotropic |
250 |
250 |
250 |
10 |
| BC Vein |
1 |
4 |
12 |
2 |
Anisotropic |
25 |
25 |
25 |
40 |
| 2 |
4 |
12 |
2 |
Anisotropic |
50 |
50 |
50 |
30 |
| 3 |
4 |
12 |
2 |
Anisotropic |
125 |
125 |
125 |
10 |
| 4 |
4 |
12 |
2 |
Anisotropic |
250 |
250 |
250 |
5 |
| KL |
1 |
4 |
12 |
2 |
Anisotropic |
25 |
25 |
25 |
20 |
| 2 |
4 |
12 |
2 |
Anisotropic |
50 |
50 |
50 |
10 |
| 3 |
4 |
12 |
2 |
Anisotropic |
125 |
125 |
125 |
7 |
| 4 |
3 |
12 |
2 |
Anisotropic |
250 |
250 |
250 |
7 |
| Lowhee |
1 |
4 |
12 |
2 |
Anisotropic |
25 |
25 |
25 |
40 |
| 2 |
4 |
12 |
2 |
Anisotropic |
50 |
50 |
50 |
20 |
| 3 |
4 |
12 |
2 |
Anisotropic |
125 |
125 |
125 |
15 |
| 4 |
NA – All blocks were estimated with the first three passes |
| Bonanza Ledge |
1 |
3 |
15 |
2 |
320 |
25 |
140 |
31 |
16 |
14 |
70 |
| 2 |
3 |
15 |
2 |
320 |
25 |
140 |
47 |
24 |
21 |
70 |
| |
Osisko Development Corp.
NI 43-101 Technical Report
Feasibility Study for the Cariboo Gold Project |
|
Table 14-9: Dilution
halo gold grade estimation parameters
| Deposit |
Pass |
Min
Comp |
Max
Comp |
Min
DDH |
Orientation |
Ranges |
Au
g/t
Cap |
| Azi
(Z) |
Dip
(X) |
Azi
(Z) |
X
(m) |
Y
(m) |
Z
(m) |
| Cow |
1 |
4 |
12 |
2 |
125 |
85 |
-130 |
12.5 |
12.5 |
2.5 |
2 |
| 2 |
4 |
12 |
2 |
25 |
25 |
5 |
2 |
| 3 |
4 |
12 |
2 |
50 |
50 |
10 |
2 |
| Valley |
1 |
4 |
12 |
2 |
125 |
80 |
-120 |
12.5 |
12.5 |
2.5 |
2 |
| 2 |
4 |
12 |
2 |
25 |
25 |
5 |
2 |
| 3 |
4 |
12 |
2 |
50 |
50 |
10 |
2 |
| Shaft |
1 |
4 |
12 |
2 |
130 |
75 |
-130 |
12.5 |
12.5 |
2.5 |
2 |
| 2 |
4 |
12 |
2 |
25 |
25 |
5 |
2 |
| 3 |
4 |
12 |
2 |
50 |
50 |
10 |
2 |
| Mosquito |
1 |
4 |
12 |
2 |
130 |
70 |
-130 |
12.5 |
12.5 |
2.5 |
2 |
| 2 |
4 |
12 |
2 |
25 |
25 |
5 |
2 |
| 3 |
4 |
12 |
2 |
50 |
50 |
10 |
2 |
| KL |
1 |
4 |
12 |
2 |
120 |
80 |
90 |
12.5 |
12.5 |
2.5 |
1.5 |
| 2 |
4 |
12 |
2 |
25 |
25 |
5 |
1.5 |
| 3 |
4 |
12 |
2 |
50 |
50 |
10 |
1.5 |
| Lowhee |
1 |
4 |
12 |
2 |
125 |
85 |
90 |
12.5 |
12.5 |
2.5 |
1.5 |
| 2 |
4 |
12 |
2 |
25 |
25 |
5 |
1.5 |
| 3 |
4 |
12 |
2 |
50 |
50 |
10 |
1.5 |
| 14.11 | Block Model Validation |
The block models were validated visually and statistically.
The visual validation confirmed that each block model honours the drill hole composite data and justifies the multiple capping for the
second and third passes ( Figure 14-14).
ID2 and Nearest-Neighbor (“NN”) models
were produced to check for local bias in the models. The ID2 models matched well with the OK models, and the differences in the high-grade
composite areas are within acceptable limits. The trend and local variation of the estimated ID2 and OK models were compared with the
NN models and composite data using swath plots in three to five directions (north, east, elevation, along strike, and across strike) for
the first pass. The ID2, NN and OK models show similar trends in grades with the expected smoothing for each method when compared to the
composite data. Figure 14-15 shows the swath plot in the three-five principal directions of the Shaft deposit as an example.
| |
Osisko Development Corp.
NI 43-101 Technical Report
Feasibility Study for the Cariboo Gold Project |
|
The Bonanza Ledge model of Brousseau et al. (2017)
was reviewed and validated, and a reconciliation exercise performed, but no changes were made to the block model. According to the reconciliation
results of the 2018 development in the Bonanza Ledge mine, grade produced versus estimated is 87.5% for a combined dilution-recovery rate
of 14.3%. No activities were carried out at the Bonanza Ledge mine in 2019–2025.
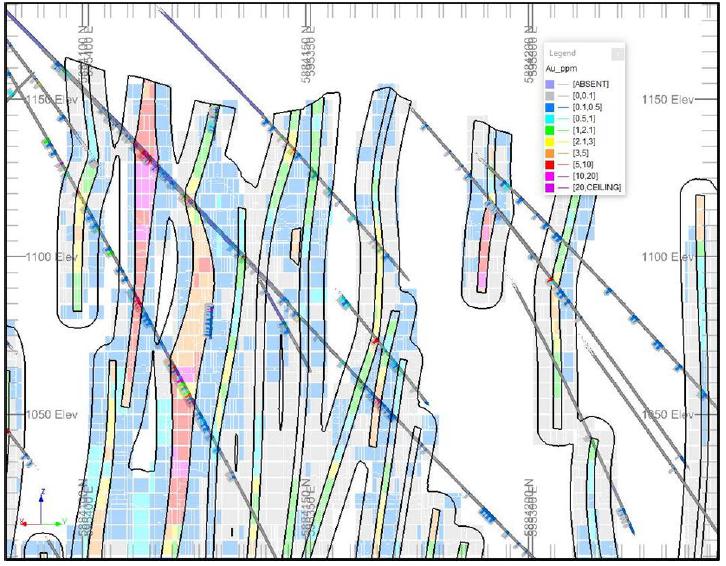
Figure 14-14: Validation
of the Valley block model, comparing drill hole composites
and block model gold grade
values - Cross-section looking southwest (±5 m)
| |
Osisko Development Corp.
NI 43-101 Technical Report
Feasibility Study for the Cariboo Gold Project |
|
a) 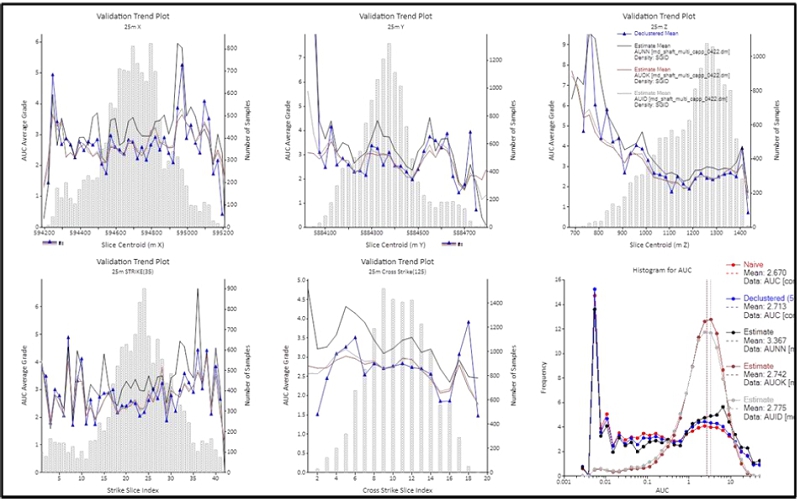
| |
Osisko Development Corp.
NI 43-101 Technical Report
Feasibility Study for the Cariboo Gold Project |
|
b) 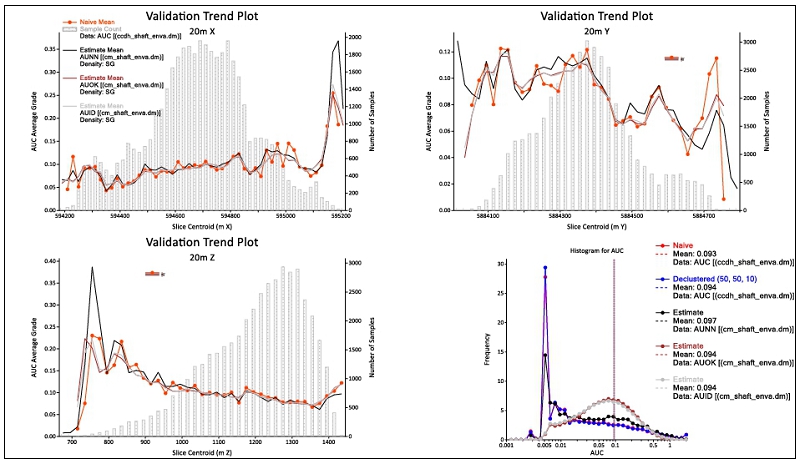
Figure 14-15: Shaft model
validation using three or five-direction swath plots
and log frequency plots comparing
the different interpolation methods to the DDH composites a) Gold in veins; b) Gold in dilution
| |
Osisko Development Corp.
NI 43-101 Technical Report
Feasibility Study for the Cariboo Gold Project |
|
| 14.12 | Economic Parameters and Cut-off Grade |
Cut-off grade (“CoG”) parameters were
determined by Éric Lecomte, QP, using the parameters presented in Table 14-10 and Table 14-11. All deposits (Cow, Valley,
Mosquito, Shaft, Lowhee, KL, and BC Vein) are reported at a CoG of 1.8 g/t Au. Bonanza Ledge is reported at a CoG of 3.5 g/t Au.
Table 14-10: Input parameters
used to calculate the U/G cut-off grade
for Cow, Valley, Mosquito,
Shaft, Lowhee, KL, and BC Vein deposits
| Input
Parameter |
Unit |
Value |
| Gold Price |
USD/oz |
1,915.00 |
| Exchange Rate |
USD:CAD |
1:1.32 |
| Gold Price |
$/oz |
2,528 |
| Royalty |
% |
5.0 |
| Recovery |
% |
92.1 |
| Global Mining Cost |
$/t |
54.19 |
| Processing and Transport Costs |
$/t |
30.53 |
| G&A plus Environmental Costs |
$/t |
16.85 |
| Sustaining CAPEX |
$/t |
25.63 |
| Total Cost |
$/t |
127.21 |
| Mineral Resource Cut-off Grade |
g/t Au |
1.8 |
Table 14-11: Input parameters
used to calculate the U/G cut-off grade for Bonanza Ledge
| Input
Parameter |
Unit |
Value |
| Gold Price |
USD/oz |
1,700.00 |
| Exchange Rate |
USD:CAD |
1:1.27 |
| Gold Price |
$/oz |
2,159 |
| Royalty |
% |
5.0 |
| Recovery |
% |
86.0 |
| Global Mining Costs |
$/t |
79.13 |
| Processing and Transport Costs |
$/t |
65 |
| G&A plus Environmental Costs |
$/t |
51.65 |
| Total Cost |
$/t |
195.78 |
| Mineral Resource Cut-off Grade |
g/t Au |
3.5 |
| |
Osisko Development Corp.
NI 43-101 Technical Report
Feasibility Study for the Cariboo Gold Project |
|
The QP considers the selected cut-off grades of
1.8 g/t Au and 3.5 g/t Au to be adequate based on the current knowledge of the Project and to be instrumental in outlining Mineral
Resources with reasonable prospects for eventual economic extraction for an underground mining scenario in each deposit.
The Deswik Stope Optimizer (“DSO”)
was used to demonstrate spatial continuity of the mineralized zones within “potentially mineable shapes”. The DSO parameters
used a minimum mining shape of 4.0 m for Mosquito and Shaft and 5.0 m for the remaining zones along the strike of the deposit, a height
of 10.0 m and a minimum width of 2.0 m. The maximum shape measures 30.0 m x 5.0 m width of the mineralized zone. The typical shape
was optimized first. If it was not potentially economical, smaller stope shapes were optimized until it reached the minimum mining shape.
Only those blocks of the model constrained by the resulting conceptual mineable shapes are reported as resources.
The use of those conceptual mining shapes as constraints
to report Mineral Resource Estimates demonstrates that the “reasonable prospects for eventual economic extraction” meet the
criteria defined in the CIM Definition Standards (2014), and the Mineral Resources and Mineral Reserves (“MRMR”) Best Practice
Guidelines (2019).
Economics of the resources were based solely on
the gold content within the mineralized vein zones.
| 14.13 | Mineral Resource Classification |
| 14.13.1 | Cow, Valley, Shaft, Mosquito, KL, Lowhee, and BC Vein Deposits |
Mineral Resource classification was determined
through geometric criteria deemed reasonable for these deposits by the QP. The samples containing gold values were used for the geometric
classification criteria.
No Measured Mineral Resources were defined.
Indicated Mineral Resources were defined for blocks
estimated with a minimum of two DDH and within 25 m of a drill hole. The classification can extend up to 35 m if the mineralized
trend is demonstrated by multiple adjacent holes.
Inferred Mineral Resources were defined for blocks
estimated with a minimum of two DDH and within 50 m of a drill hole. The classification can extend to 60–65 m from
a hole if the mineralized trend is demonstrated by multiple adjacent holes.
| |
Osisko Development Corp.
NI 43-101 Technical Report
Feasibility Study for the Cariboo Gold Project |
|
Based on the criteria described above, the final
classification, for all deposits, was obtained after applying a series of outline rings (clipping boundaries) created in longitudinal
views, keeping in mind that a significant cluster of blocks would be necessary to obtain an Indicated Mineral Resource. Within the Indicated
category outlines, some Inferred blocks were upgraded into Indicated, whereas some Indicated blocks outside of these outlines were downgraded
to the Inferred category. The QPs considered this a necessary step to homogenize (smooth out) the Mineral Resource volumes in each category
and to avoid the inclusion of isolated blocks in the Indicated category.
Figure 14-16 shows an example of the Mineral
Resource classification for the Cow deposit.
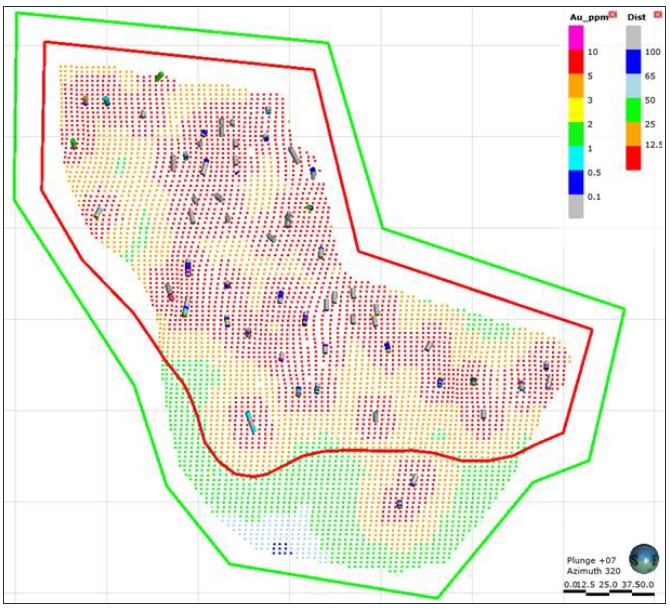
Figure 14-16: Example
of a clipping boundary for classification
Indicated category clip (red);
Inferred category clip (green) for the V11 vein of the Cow deposit
| |
Osisko Development Corp.
NI 43-101 Technical Report
Feasibility Study for the Cariboo Gold Project |
|
| 14.13.2 | Bonanza Ledge Deposit |
Measured Mineral Resources were defined for blocks
showing geological and grade continuity interpolated during Pass 1 only, with a minimum of three drill holes and the closest distance
at less than 10 m, and for blocks no more than 40 m below the pit.
Indicated Mineral Resources were defined for blocks
showing geological and grade continuity interpolated with a minimum of two drill holes during Pass 1 and the closest distance at less
than 20 m.
Inferred Mineral Resources were defined by the
remaining blocks interpolated from Pass 1 and Pass 2.
Figure 14-17 shows the Mineral Resource classification
for the Bonanza Ledge deposit.
In some areas, interpolated blocks remained unclassified
due to the lack of confidence in grade and/or continuity; these are kept as exploration potential.
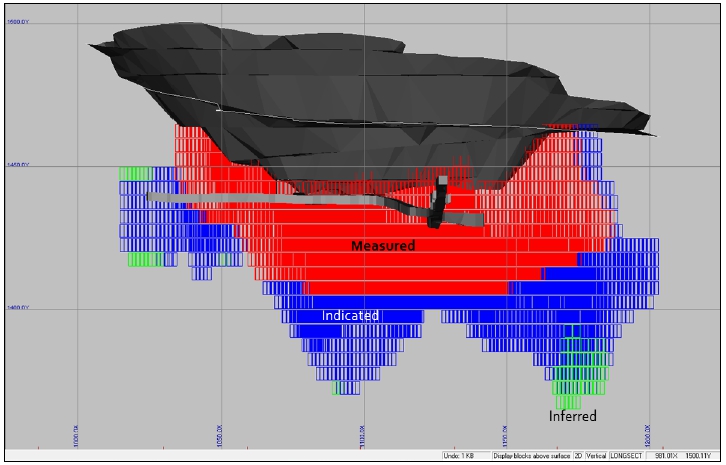
Figure 14-17: Longitudinal
view showing the classified Mineral Resources
of the Bonanza Ledge deposit
| |
Osisko Development Corp.
NI 43-101 Technical Report
Feasibility Study for the Cariboo Gold Project |
|
| 14.14 | Mineral Resource Estimate |
There has been no change to the MRE since the
2022 FS, other than that the 2025 FS MRE results incorporate a change in cut-off grade, mining depletion at Lowhee Zone and the elimination
of silver from the estimate.
The silver has been removed due to limited data
and because the estimated ounces were not material.
The approach to classification is unchanged since
the 2022 FS MRE. The MRE was classified as Measured, Indicated, and Inferred Mineral Resources based on data density, search ellipse
criteria, drill hole density, and interpolation parameters. The 2025 FS MRE is considered to be reliable and based on quality data
and geological knowledge. The Mineral Resource Estimate follows the 2014 CIM Definition Standards on Mineral Resources and Reserves and
the 2019 CIM Best Practice Guidelines.
Table 14-12 displays the results of the 2025
FS MRE exclusive of the reserves for the Project for all eight deposits: Cow, Valley, Shaft, Mosquito, KL, Lowhee, BC Vein and Bonanza
Ledge.
Table 14-13 and Table 14-14 show the
cut-off grade sensitivity analysis on gold of the 2025 FS MRE, exclusive of the reserves. The reader should be cautioned that
the figures provided in Table 14-13 and Table 14-14 should not be interpreted as a Mineral Resource statement. The reported
quantities and grade estimates at different cut-off grades are presented for the sole purpose of demonstrating the sensitivity of the
Mineral Resource model for gold to the selection of a reporting cut-off grade.
Table 14-12: Cariboo
Gold Project 2025 FS MRE reported at a 1.8 g/t Au cut-off grade
(except for Bonanza Ledge reported at a 3.5 g/t Au cut-off grade)
| Category |
Deposit |
Tonne |
Au
Grade |
Au
Ounce |
| '000 |
(Au g/t) |
'000 |
| Measured |
Bonanza Ledge |
47 |
5.06 |
8 |
| Indicated |
Bonanza Ledge |
32 |
4.02 |
4 |
| BC Vein |
1,057 |
3.00 |
102 |
| KL |
527 |
2.80 |
47 |
| Lowhee |
1,333 |
2.76 |
118 |
| Mosquito |
1,553 |
2.96 |
148 |
| Shaft |
6,121 |
2.92 |
575 |
| Valley |
2,718 |
2.70 |
236 |
| Cow |
3,991 |
2.91 |
374 |
| |
Osisko Development Corp.
NI 43-101 Technical Report
Feasibility Study for the Cariboo Gold Project |
|
| Category |
Deposit |
Tonne |
Au
Grade |
Au
Ounce |
| '000 |
(Au g/t) |
'000 |
| Total Indicated Mineral Resources |
17,332 |
2.88 |
1,604 |
| Inferred |
BC Vein |
596 |
3.17 |
61 |
| KL |
2,514 |
2.53 |
205 |
| Lowhee |
486 |
3.01 |
47 |
| Mosquito |
1,883 |
3.08 |
186 |
| Shaft |
7,457 |
3.44 |
826 |
| Valley |
2,470 |
3.01 |
239 |
| Cow |
3,368 |
2.78 |
301 |
| Total Measured and Indicated Mineral Resources |
17,380 |
2.88 |
1,612 |
| Total Inferred Mineral Resources |
18,774 |
3.09 |
1,864 |
Mineral Resource Estimate notes (Table 14-12):
| 1. | The independent and qualified persons for the Mineral Resources estimates, as defined by NI 43-101, are
Carl Pelletier, P.Geo., and Tessa Scott, P.Geo. of InnovExplo Ltd. The effective date of the 2025 FS MRE is April 22, 2025. |
| 2. | These Mineral Resources, exclusive of the reserves, are not Mineral Reserves as they do not have demonstrated
economic viability. |
| 3. | The MRE follows the 2014 CIM Definition Standards on Mineral
Resources and Reserves and the 2019 CIM Estimation of Mineral Resources and Mineral Reserves Best Practice Guidelines. |
| 4. | A total of 481 vein zones were modelled for the Cow Mountain
(Cow and Valley), Island Mountain (Shaft and Mosquito), Barkerville Mountain (BC Vein, KL, and Lowhee) deposits and one gold zone
for Bonanza Ledge. A minimum true thickness of 2.0 m was applied, using the gold grade of the adjacent material when assayed or
a value of zero when not assayed. |
| 5. | The estimate is reported for a potential underground scenario at a cut-off grade of 1.8 g/t Au, except
for Bonanza Ledge at a cut-off grade of 3.5 g/t Au. The cut-off grade for the Cow, Valley, Shaft, Mosquito, BC Vein, KL, and Lowhee deposits
was calculated using a gold price of USD 2,400/oz; a USD:CAD exchange rate of 1.35; an underground mining cost of $66.3/t; a processing
and transport cost of $30.80/t; a G&A plus Environmental cost of $22.40/t; and a sustaining CAPEX cost of $45.6/t. No changes have
been applied for the Bonanza Ledge. The cut-off grade for the Bonanza Ledge deposit was calculated using a gold price of USD 1,700/oz;
a USD:CAD exchange rate of 1.27; a global mining cost of $79.13/t; a processing and transport cost of $65.00/t; and a G&A plus Environmental
cost of $51.65/t. The cut-off grades should be re-evaluated in light of future prevailing market conditions (metal prices, exchange rate,
mining cost, etc.). |
| 6. | Density values for Cow, Shaft, Lowhee, and BC Vein were estimated using the ID2 interpolation
method, with a value applied for the non-estimated blocks of 2.80 g/cm3 for Cow, 2.78 g/cm3 for Shaft, 2.74
g/cm3 for Lowhee, and 2.69 g/cm3 for BC Vein. Median densities were applied for Valley (2.81 g/cm3),
Mosquito (2.79 g/cm3), and KL (2.81 g/cm3). A density of 3.20 g/cm3 was applied for
Bonanza Ledge. |
| 7. | A four-step capping procedure was applied to composited data for Cow (3.0 m), Valley (1.5 m),
Shaft (2.0 m), Mosquito (2.5 m), BC Vein (2.0 m), KL (1.75 m), and Lowhee (1.5 m). Restricted search ellipsoids ranged
from 7 to 50 g/t Au at four different distances ranging from 25 m to 250 m for each deposit. High-grades at Bonanza
Ledge were capped at 70 g/t Au on 2.0 m composited data. |
| |
Osisko Development Corp.
NI 43-101 Technical Report
Feasibility Study for the Cariboo Gold Project |
|
| 8. | The gold Mineral Resources for the Cow, Valley, Shaft, Mosquito, BC Vein, KL, and Lowhee vein zones
were estimated using Datamine StudioTM RM 1.9 software using hard boundaries on composited assays. The OK method was used to
interpolate a sub-blocked model (parent block size = 5 m x 5 m x 5 m). Mineral Resources for Bonanza Ledge were estimated using GEOVIA
GEMSTM 6.7 software using hard boundaries on composited assays. The OK method was used to interpolate a block model (block
size = 2 m x 2 m x 5 m). |
| 9. | Results are presented in-situ. Ounce (troy) = metric tons x grade / 31.10348. Calculations used metric
units (metres, tonnes, g/t). The number of tonnes was rounded to the nearest thousand. Any discrepancies in the totals are due to rounding
effects. Rounding followed the recommendations as per NI 43-101. |
| 10. | The QPs responsible for this section of the technical report are not aware of any environmental, permitting,
legal, title, taxation, socio-economic, marketing, political, or other relevant factors that could materially affect the Mineral Resource
Estimate other than as disclosed in this Report. |
Table 14-13: Cut-off
grade sensitivity analysis on gold for the Cow, Valley, Shaft, Mosquito, BC Vein,
KL and Lowhee deposits of the Cariboo Gold Project
| Cut-off
Grade |
Indicated |
Inferred |
| Tonne
('000) |
Grade
Au g/t |
Ounce
('000) |
Tonne
('000) |
Grade
Au g/t |
Ounce
('000) |
| 1.6 |
19,918 |
2.7 |
1,744 |
21,078 |
2.9 |
1,991 |
| 1.7 |
18,275 |
2.8 |
1,666 |
19,718 |
3.0 |
1,926 |
| 1.8 |
17,300 |
2.9 |
1,600 |
18,774 |
3.1 |
1,864 |
| 1.9 |
15,370 |
3.1 |
1,515 |
17,312 |
3.2 |
1,799 |
| 2 |
14,125 |
3.2 |
1,444 |
16,270 |
3.3 |
1,740 |
Table 14-14: Cut-off
grade sensitivity analysis on gold for the Bonanza Ledge deposit
of the Cariboo Gold Project
| Cut-off
Grade |
Measured |
Indicated |
| Tonne
('000) |
Grade
Au g/t |
Ounce
('000) |
Tonne
('000) |
Grade
Au g/t |
Ounce
('000) |
| 3.2 |
65 |
4.5 |
9 |
38 |
3.6 |
4 |
| 3.5 |
47 |
5.1 |
8 |
32 |
4.0 |
4 |
| 3.7 |
43 |
5.2 |
7 |
21 |
4.3 |
3 |
| |
|
|
|
|
|
|
|
| |
Osisko Development Corp.
NI 43-101 Technical Report
Feasibility Study for the Cariboo Gold Project |
|
| 15. | Mineral Reserve Estimates |
Mineral Reserves are reported using the 2014 CIM
Definition Standards and were estimated in accordance with the CIM 2019 Best Practices Guidelines, as required by NI 43-101 Standards
of Disclosure for Mineral Projects. As such, the Mineral Reserves are based on Measured and Indicated Mineral Resources and do not include
any Inferred Mineral Resources. Measured and Indicated Mineral Resources are exclusive of proven and probable reserves. Mineral Reserves
are the estimated tonnage and grade of ore that is considered economically viable for extraction based on the assumptions set out in this
Report.
Mineral Reserves for the Project deposit incorporate
dilution and mining recovery factors based on the selected mining method and design as set out in Chapter 16. In addition, economic analyses
were completed to validate the profitability of particular areas of the Mineral Resource to ensure it could be converted to Mineral Reserve.
The following sources of information were instrumental
in the Mineral Reserve estimation process:
| ■ | The
resource blocks model (last updated September 8, 2022) (see Section 14.8 of this
Study); |
| ■ | The
previous 2023 FS (“NI 43-101 Technical Report - Feasibility Study for the Cariboo
Gold Project”) conducted by BBA in 2022-2023 for Osisko Development Corporation, effective
date December 30, 2022 (Hardie et al., 2023); |
| ■ | Current
estimates of operating costs and other financial assumptions, as laid out in this Report; |
| ■ | Updated
forecasts for metal prices; |
| ■ | The
current 3D model of existing underground workings and historical stope outlines; |
| ■ | The
litho-structural model of the site. |
The Mineral Resource blocks model from the last
update of September 8, 2022 was used as the basis for estimating the mineable tonnage considered in the mine plan. The cut-off grades
for the Project were first estimated, then the stope shapes were optimized considering the general cut-off grade and according to various
parameters, such as geometry and dilution. The final reserve estimate was obtained after completing the stope and underground mine designs,
including the economic validation and considering additional factors, such as incremental blocks and mine recovery.
| |
Osisko Development Corp.
NI 43-101 Technical Report
Feasibility Study for the Cariboo Gold Project |
|
| 15.2.1 | Cut-off Grades Calculations |
The CoG calculations are based on technical and
economic parameters developed specifically for this Study, building in part on data obtained from the 2023 FS (Hardie et al., 2023)
and on cost estimates prepared by InnovExplo and ODV. These calculations consider current market conditions, including gold price and
exchange rate assumptions derived from a trailing 3-year average, to reflect a balanced economic outlook. Mining costs were estimated
using a zero-based approach tailored to the selected longitudinal long hole retreat mining method and benchmarked against comparable underground
gold projects.
Stope optimization was conducted in two stages.
The initial stage involved a preliminary screening using a cut-off grade-based stope optimization to identify potentially mineable zones.
This was followed by a second pass that incorporated development costs into the economic evaluation, ensuring that only stopes with a
positive economic margin, including access development, were retained. The parameters used in these calculations are summarized in Table 15-1.
For mineralized development material, a lower
CoG of 1.7 g/t Au was applied to account for reduced incremental cost structures associated with pre-planned access development.
The base cut-off grade was determined using the
following formula:
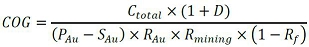
Where:
 |
Cut-off grade, in grams per tonne
of gold (g/t Au) |
| |
|
 |
Total operating cost, in CAD per tonne of mined
material (mining, processing, G&A, environment, sustaining capital) |
| |
|
 |
Gold price, in CAD per gram (converted from $/oz
at market rate and exchange rate) |
| |
|
 |
Selling cost, in CAD per gram (converted from
$/oz at market rate and exchange rate) |
| |
|
 |
Gold metallurgical recovery, expressed as a decimal
(e.g., 92.1% = 0.921) |
| |
|
 |
Mining recovery, expressed as a decimal (e.g.,
94% = 0.94) |
| |
|
 |
Royalty as a decimal (e.g., 5.0% = 0.05) |
| |
|
 |
Dilution, expressed as a decimal (e.g., 5% = 0.05) |
| |
Osisko Development Corp.
NI 43-101 Technical Report
Feasibility Study for the Cariboo Gold Project |
|
Table 15-1: Cut-off grade
calculation parameters
| Input Parameters |
Production Rate: 4,900 tpd |
| General Economic Assessment |
| Gold Price |
USD/oz |
1,915 |
| Exchange Rate |
CAD/USD |
1.32 |
| Royalty |
% |
5.00 |
| Refining Cost |
USD/oz |
5.0 |
| Processing Cost and Transport |
$/t treated |
30.53 |
| Metallurgical Recovery |
% |
92.10 |
| Mining Recovery |
% |
94.00 |
| Mining Dilution |
% |
5.00 |
| Mining Cost |
$/t treated |
54.19 |
| Sustaining Cost |
$/t treated |
25.63 |
| Environment |
$/t treated |
6.47 |
| General and Administration |
$/t treated |
10.39 |
| Cut-off Grade |
g/t |
2.0 |
| 15.2.2 | Dilution Factor Calculation |
Internal dilution was considered when optimizing
stope shapes and converting them into planned mineable stope shapes. External dilution was also considered during stope optimization by
using the appropriate estimated linear overbreak and sloughing (“ELOS”) values (see Chapter 16) based on stope size and location
and rock mechanics properties. Backfill dilution was added afterwards, based on the location of each stope and the mining sequence.
The following parameters were used to estimate
stope dilution:
| ■ | Dilution is expected to come from the hanging wall and foot wall for most
stopes. ELOS applied to the different stopes varies according to the strike length and the geotechnical classification (see Section 16.2.3); |
| ■ | A backfill dilution ranging from 1.3% to 5.3% by weight per wall in contact
with backfill is assumed; |
| ■ | No additional backfill dilution for sill due to rock sill pillar; |
| ■ | A lower recovery is assumed for sill pillar stopes; |
| ■ | No dilution is assumed for the stope floors; |
| |
Osisko Development Corp.
NI 43-101 Technical Report
Feasibility Study for the Cariboo Gold Project |
|
| ■ | The grade of internal and external dilution is based on an ordinary kriging
interpolation of the gold values in the vicinity of the mineralized zones (see Section 14.10); |
| ■ | Backfill dilution assumed a dilution grade of 0 g/t. |
In summary, the external waste dilution is estimated
to be 9.0% by weight. When considering the backfill dilution, the average dilution of the Project is estimated to be 10.1% by weight.
Mining loss (or mining recovery) is based on the
material in the model that is left behind, for example, to provide structural support when facing blasting or operational challenges and
rock mechanics issues.
Recovery varies mainly according to blasting method
and the associated challenges, as well as rock mechanics conditions such as sill pillar recovery. Recovery values for stopes classified
as geotechnical Class 1, 2, 3, 3L and 4 are based on the proposed production drilling approach for dilution control, past experience
and estimates for typical stopes. The mining recovery associated with Class 4 stopes was limited to 85% for stopes using the two
steps Doyon mining method. The factors seem reasonable given the selected mining method and the ground conditions.
The average mining recovery for the Project is
91.3%.
| 15.2.4 | Stope Shape Optimization |
The geological block model was the primary input
in the Deswik Shape Optimizer (“DSO”) version 2024.1, a Deswik software application used to optimize individual stope shapes
from the block model using Stope Shape Optimizer algorithms from Alford Mining Systems and the parameters indicated in the .
Table 15-2: Stope shape
optimization parameters
| Parameters |
Values |
| Cut-off Grade Value |
2.0 g/t |
| Typical Sublevel Interval |
30 m |
| Typical Stopes Length |
From 15 m to 25 m |
| Minimal Stope Width |
3.7 m |
| Minimum Horizontal Pillar Between Parallel Lenses |
5 m |
| External Dilution Included |
Presented in Section 15.2.2 |
| Minimum Slope Wall Angle |
45° |
| |
Osisko Development Corp.
NI 43-101 Technical Report
Feasibility Study for the Cariboo Gold Project |
|
| 15.2.5 | ESG Modifying Factors |
Environmental, Social, and Governance (ESG) considerations
have been evaluated as part of the modifying factors applied in converting Mineral Resources to Mineral Reserves. These factors are not
expected to materially affect the viability of the mine plan.
Table 15-3: Summary of
ESG modifying factors relevant to Mineral Reserve Estimation
| EGS Domain |
Parameter |
Status / Description |
| Environment |
Environmental Assessment Certificate (EAC) |
Received Oct 10, 2023 under BC Environmental Assessment Act, 2018. |
| Permitting Status |
BC Mines Act and Environmental Management Act permits received (Q4 2024). |
| Tailings Management |
Underground paste fill – reduces surface storage needs and enhances ground stability |
| Closure & Reclamation |
Preliminary plan developed; reclamation cost included in sustaining capital |
| GHG / Climate Risk |
Greenhouse Gas Management Plan under development per EAC conditions |
| Social |
Indigenous Agreement |
Agreements signed with Lhtako Dené Nation and Williams Lake First Nation. Ongoing discussions with Xatśūll First Nation and other affected parties. |
| Indigenous Consultation |
Ongoing meetings for technical discussions and relationship building occur with Lhtako Dené Nation, Xatśūll First Nation and Williams Lake First Nation |
| Community Impact |
Expected to create 613 jobs (construction), 525 (operations); community engagement ongoing. |
| Local Hiring & Procurement |
Commitment to local hiring and regional business participation. |
| Governance |
Compliance & Audits |
Independent environmental audits planned; EAO and Ministry of Environment oversight. |
| Corporate ESG Policy |
Formal ESG policy adopted; integrated into project risk and decision-making framework. |
These ESG factors have been reviewed by the QP
and are not expected to present a material risk to the classification of Mineral Reserves. They support the conclusion of reasonable prospects
for economic extraction as required under CIM and NI 43-101 standards.
| |
Osisko Development Corp.
NI 43-101 Technical Report
Feasibility Study for the Cariboo Gold Project |
|
| 15.3 | Mineral Reserve Statement |
Table 15-4 illustrates the tonnage and gold
contents for the different zones of the Project’s Mineral Reserves.
Table 15-4: Cariboo Gold Statement of
Mineral Reserves
at the effective date of April 10,
2025
| Category |
Tonnage |
Grade |
Contained Gold |
| (t) |
Au (g/t) |
(oz) |
| Proven |
| - |
- |
- |
- |
| Probable |
| Cow |
3,999,971 |
3.35 |
430,548 |
| Valley |
3,238,636 |
3.59 |
374,058 |
| Shaft |
8,548,295 |
3.72 |
1,021,599 |
| Mosquito |
1,105,370 |
3.94 |
140,102 |
| Lowhee |
923,162 |
3.52 |
104,491 |
| Total Proven & Probable |
17,815,435 |
3.62 |
2,070,798 |
Notes:
| 1. | The Qualified Person for the Mineral Reserve Estimate is Eric Lecomte, P.Eng. (InnovExplo, a subsidiary
of Norda Stelo). |
| 2. | The Mineral Reserve Estimate has an effective date of April 10, 2025. |
| 3. | Estimated at USD 1,915/oz Au using an exchange rate of USD 1.32:CAD 1.00, variable cut-off
value from 1.70 g/t to 2.0 g/t Au. |
| 4. | Mineral Reserve tonnage and mined metal have been rounded to reflect the accuracy of the estimate and
numbers may not add due to rounding. |
| 5. | Mineral Reserves include both internal and external dilution along with mining recovery. The average external
dilution is estimated to be 10.1%. The average mining recovery factor is 91.3% to account for mineralized material left in each block
in the margins of the deposit. |
| |
Osisko Development Corp.
NI 43-101 Technical Report
Feasibility Study for the Cariboo Gold Project |
|
| 15.4 | Factors that May Affect the Mineral Reserves |
Areas of uncertainty that may materially impact
the Mineral Reserve Estimate include the following:
| ■ | Commodity prices, market conditions, and foreign exchange rate assumptions; |
| ■ | Cut-off grade estimates; |
| ■ | Capital and operating cost assumptions; |
| ■ | Geological complexity and resource block modelling; |
| ■ | Stope stability, dilution and mining recovery factors; |
| ■ | Metallurgical recoveries and contaminants; |
| ■ | Rock mechanics (geotechnical) constraints and the ability to maintain constant
underground access to all working areas. |
| |
Osisko Development Corp.
NI 43-101 Technical Report
Feasibility Study for the Cariboo Gold Project |
|
The Cariboo Gold Project will be an underground
operation primarily using longitudinal retreat stoping method for the majority of the stopes (95% of production tonnage). This method
is well suited to the geometry of the deposit, as the five mineralized zones, each comprising of several narrow veins, will support the
development of multiple mining fronts to achieve a maximum production of 4,900 tonnes per day (“tpd”). The remaining
5% of production tonnage will be mined using the transverse stoping method in areas with wider mineralized zones.
Additionally, within the longitudinal retreat
method, a modified version executed in two passes was considered for stopes located in poor ground conditions, geologically classified
as "Class 4" (see Section 16.2.3). This variant accounts for 7% of the total stope tonnage, and a detailed description
of the method is provided in Section 16.4.
At the start of the pre-production period, access
to the development area will be through the Cow portal ramp, which has already been excavated. During this initial phase, development
will focus on advancing the Cariboo ramp and developing access to key infrastructure, including the ventilation network, underground crusher
chamber, slurry treatment facilities, maintenance installations, and the access ramp to the Valley portal. Once completed, the Valley
portal—strategically located near the centre of the deposit—will serve as the primary access point to support ongoing mining
operations. The Cow portal will remain active and will be used for the transport of waste material to the designated waste rock storage
facility (“WRSF”).
In parallel, development crews will extend workings
into the initial mining zones, specifically the upper zone of Shaft and Valley and the Lowhee Zone, as well as advance the development
of deeper access ramps.
The pre-production period will extend until early
Year 1, approximately 6 months after the progressive commissioning of the processing plant. Once stope production begins, a
ramp-up period of approximately 10 months will be required to reach the nominal production rate of 4,900 tpd, which is expected
to be achieved by first half of Year 1.
| |
Osisko Development Corp.
NI 43-101 Technical Report
Feasibility Study for the Cariboo Gold Project |
|
Alius is responsible for the content and conclusions
presented in this section of the Report, which are based on a review and update of the geotechnical data and interpretations previously
completed by SRK as part of the 2023 Cariboo Gold Project Geotechnical Feasibility Study (SRK, 2023).
Much of the information presented in Section 16.2
remains unchanged from the previous Feasibility Study (Hardie et al., 2023), particularly with respect to rock mass characterization,
including laboratory test results, rock mass classification, and class definitions. This earlier work was completed to industry-accepted
standards and remains valid and suitable for use in the current FS.
While additional stope classifications were carried
out by Alius using the established geotechnical design classification scheme (Section 16.2.3.1), the primary scope of work completed
by Alius focused on revising the interpretation of geotechnical data to support updated pillar and stope designs, dilution estimates,
backfill strength parameters, and ground support recommendations.
| 16.2.1 | Geotechnical Field and Test Work Programs |
Alius acknowledged and relied upon the geotechnical
characterization conducted by SRK, which was based on two geotechnical field investigation programs, included a geotechnical fieldwork
program (i.e., geotechnical core logging) and a laboratory test work program.
Two geotechnical field data acquisition programs
were completed, the first taking place during late summer and fall of 2018, and the second taking place in the summer of 2021. The
location of the 2018 and 2021 dedicated geotechnical drill holes used for assessment of the Project deposit are shown in Figure 16-1.
| |
Osisko Development Corp.
NI 43-101 Technical Report
Feasibility Study for the Cariboo Gold Project |
|
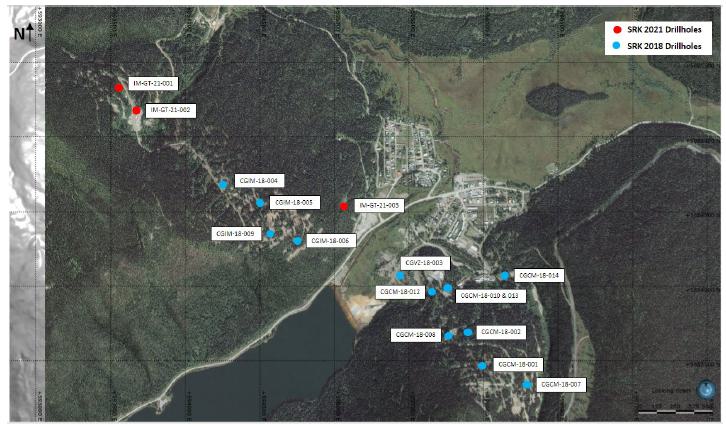
Figure 16-1: Plan view showing collar
locations of 2018 and 2021 geotechnical drill holes for the Project
(Source: SRK, 2022)
In addition to the detailed geotechnical data
collected during these dedicated geotechnical field programs, basic geotechnical data (recovery, fracture count, RQD, and estimated intact
rock strength) were collected for the 2016 to 2021 resource exploration drill holes.
The 2018 geotechnical field data acquisition/investigation
program comprised of geotechnical logging of oriented triple tube HQ core. Thirteen geotechnical drill holes were logged using RMR89
and Q’ rock mass classification systems for a total length of 4,181 m. This program focused on the Shaft, Cow, and Valley zones,
as well as the Valley (Main) portal location. Representative rock core samples from each geotechnical domain were collected from the geotechnical
drill holes in the 2018 field program to complete 96 multi-stage triaxial compressive strength (“TCS”) tests at the Queen’s
University laboratory.
The 2021 field program comprised of geotechnical
logging of oriented triple tube HQ core from five geotechnical specific holes with a total length of 881 m using the same logging guidelines
as 2018. This program focused on the expanded Mosquito Zone and new Lowhee Zone. During the 2021 field program, core samples were collected
to complete four UCS tests and nine TCS tests.
| |
Osisko Development Corp.
NI 43-101 Technical Report
Feasibility Study for the Cariboo Gold Project |
|
Representative laboratory test results for unit
weight and intact Young’s modulus data, based on laboratory testing, for each of the lithological facies, are presented in Table 16-1.
The limited UCS results as well as extrapolated UCS values from TCS are presented
in Table 16-2 and Table 16-3, respectively.
Table 16-1: Unconfined
compressive strength test results from 2021 field program
| Modelled
Lithological Facies |
Unit
Weight,
(tonnes/m3) |
Intact
Young’s Modulus
(GPa) |
| Calcareous Siltstone Facies |
2.80 |
25.7 |
| Calcareous Sandstone Facies |
2.78 |
43.3 |
| Aurum Limestone |
2.77 |
35.8 |
| Upper Sandstone Facies |
2.74 |
29.7 |
| Mafic Volcanic Facies |
2.80 |
25.7 |
| Lower Sandstone Facies |
2.81 |
27.5 |
| Basal Transitional Facies |
2.86 |
30.7 |
| Basal Facies |
2.77 |
45.1 |
Table 16-2: Limited unconfined
compressive strength test results from 2021 field program
| |
Unit |
Count |
Min |
Average |
Max |
Standard
Deviation |
| Mosquito |
MPa |
3 |
22 |
49 |
67 |
19 |
| Calcareous Siltstone Facies |
MPa |
3 |
22 |
49 |
67 |
19 |
| Island Mountain Portal |
MPa |
1 |
17 |
17 |
17 |
0 |
| Calcareous Siltstone Facies |
MPa |
1 |
17 |
17 |
17 |
0 |
| Total |
MPa |
4 |
17 |
41 |
67 |
22 |
| |
Osisko Development Corp.
NI 43-101 Technical Report
Feasibility Study for the Cariboo Gold Project |
|
Table 16-3:
Unconfined compressive strength estimates extrapolated from 2018 and 2021 TCS tests
| Zone |
Lithological
Facies |
Triaxial
Testing Results (2018 & 2021) |
No. Valid
Tests |
Extrapolated
UCS (MPa) |
| Min |
Average |
Max |
Standard
Deviation |
| Cow |
Calcareous Siltstone Facies |
11 |
10 |
24 |
57 |
13 |
| Calcareous Sandstone Facies |
2 |
32 |
33 |
34 |
1 |
| Aurum Limestone |
3 |
32 |
37 |
45 |
6 |
| Upper Sandstone Facies |
13 |
7 |
26 |
47 |
15 |
| Mafic Volcaniclastic |
3 |
33 |
47 |
69 |
16 |
| Lower Sandstone Facies |
7 |
21 |
45 |
97 |
27 |
| Basal Transitional |
1 |
72 |
72 |
72 |
0 |
| Basal |
3 |
20 |
38 |
68 |
21 |
| Shaft |
Calcareous Siltstone Facies |
0 |
- |
- |
- |
- |
| Calcareous Sandstone Facies |
3 |
23 |
66 |
102 |
33 |
| Aurum Limestone |
0 |
- |
- |
- |
- |
| Upper Sandstone Facies |
10 |
15 |
44 |
107 |
28 |
| Mafic Volcaniclastic |
7 |
10 |
60 |
102 |
30 |
| Lower Sandstone Facies |
13 |
12 |
36 |
114 |
27 |
| Basal Transitional |
3 |
16 |
49 |
78 |
25 |
| Basal |
0 |
- |
- |
- |
- |
| Valley |
Calcareous Siltstone Facies |
0 |
- |
- |
- |
- |
| Calcareous Sandstone Facies |
1 |
46 |
46 |
46 |
0 |
| Aurum Limestone |
1 |
32 |
32 |
32 |
0 |
| Upper Sandstone Facies |
1 |
24 |
24 |
24 |
0 |
| Mafic Volcaniclastic |
1 |
38 |
38 |
38 |
0 |
| Lower Sandstone Facies |
0 |
- |
- |
- |
- |
| Basal Transitional |
0 |
- |
- |
- |
- |
| Basal |
0 |
- |
- |
- |
- |
| Mosquito |
Calcareous Siltstone Facies |
2 |
4 |
12 |
21 |
8 |
| Calcareous Sandstone Facies |
0 |
- |
- |
- |
- |
| Aurum Limestone |
2 |
39 |
42 |
45 |
3 |
| Upper Sandstone Facies |
1 |
21 |
21 |
21 |
0 |
| Mafic Volcaniclastic |
1 |
59 |
59 |
59 |
0 |
| Lower Sandstone Facies |
0 |
- |
- |
- |
- |
| Basal Transitional |
0 |
- |
- |
- |
- |
| Basal |
0 |
- |
- |
- |
- |
| Island Mountain Portal |
Calcareous Siltstone Facies |
0 |
18 |
20 |
22 |
2 |
| Calcareous Sandstone Facies |
0 |
- |
- |
- |
- |
| Aurum Limestone |
0 |
- |
- |
- |
- |
| Upper Sandstone Facies |
0 |
- |
- |
- |
- |
| Mafic Volcaniclastic |
0 |
- |
- |
- |
- |
| Lower Sandstone Facies |
0 |
- |
- |
- |
- |
| Basal Transitional |
0 |
- |
- |
- |
- |
| Basal |
0 |
- |
- |
- |
- |
| |
Osisko Development Corp.
NI 43-101 Technical Report
Feasibility Study for the Cariboo Gold Project |
|
A 3D structural model had already been created,
by ODV, to represent the major Regional Fault structures on the Project property. A 3D fault model was created by SRK (2023) for the secondary
structures of the Project property, where information existed to extend these faults. This model was based on the integration of drill
hole data and underground mapping in the old mine-workings. Each of the mineralized zones were modelled separately. Modelling of the secondary
faults in the Cow, Valley, Shaft, and Mosquito zones took place in 2019. Secondary faults in the Mosquito Zone were updated in 2021 and
secondary faults in the Lowhee Zone were modelled in 2022.
| 16.2.3 | Geotechnical Design |
| 16.2.3.1 | Geotechnical Design Classifications |
SRK (2023) conducted a thorough evaluation of
geotechnical parameters, laboratory strength testing to support the underground mine design. The lithological facies in the deposit have
been modelled and initial assessments considered the geotechnical characteristics of the facies. The result of this assessment showed
that the main indicator for rock mass quality on the Project site is the presence of faults, and the width of the damage zones associated
with each fault or fault intersection.
| |
Osisko Development Corp.
NI 43-101 Technical Report
Feasibility Study for the Cariboo Gold Project |
|
Based on this assessment, five rock mass classifications
with unique geotechnical characteristics were defined. Due to the variability in the Shaft and Mosquito zones, Class 3 Lower was
broken out from the upper end of the Class 4 to represent the site-specific ground conditions better. The geotechnical characteristics
for these classes are:
| § | Classes 1 and 2: Open Stoping – Represents the most competent
rock mass in the deposit. It is massive, with high intact rock strength. Foliation parallel fractures are less pervasive in this class. |
| § | Classes 3 and 3 Upper (“Class 3U”): Open Stoping
– Reduced strike length. Characterized by moderately jointed rock mass. Foliation is well developed in this class. |
| § | Classes 3 Lower (“Class 3L”) and 4: Open Stoping
– Further reduced strike length. characterized by a jointed rock mass with a lower RQD. Foliation is well developed in this class,
and the rock tends to break along the foliation planes. |
| § | Class 5: Cut-and-Fill – Represents the least competent
rock mass that is not deemed suitable for massive mining due to increased fracture frequency and weak intact rock strength. Excavations
in this class will require limited spans and appropriate support to maintain stability. |
Stopes
were reviewed individually, by zone, and the anticipated distribution of the stopes in each geotechnical class was determined. Ranges
of rock mass properties were then assessed for each class, as summarized in Table 16-4.
Table 16-4: Summary of
rock mass properties for each qualitative geotechnical classification
Qualitative
Geotechnical
Classification |
RMR89
(Bieniawski, 1989) |
Q’
(Grimstad and Barton, 1993) |
| Classes 1 and 2 |
55 – 65 (Fair to Good rock mass) |
3.39 – 10.31 |
| Classes 3 and 3U |
50 – 55 (Fair rock mass) |
1.95 – 3.39 |
| Class 3L |
35 – 50 (Fair rock mass) |
0.37 – 1.95 |
| Class 4 |
33 – 40 (Poor rock mass) |
0.29 – 0.64 |
| Class 5 |
14 – 33 (Very poor rock mass) |
0.04 – 0.29 |
| 16.2.3.2 | Geotechnical Design Approach |
Excavation stability assessments were carried
out using well-established empirical and semi-empirical methods, supported by engineering judgment. These assessments were further informed
by operational insights gained from the Bonanza Ledge Mine and the ongoing Lowhee Bulk Sample mining. From the experience gained at both
sites, Alius notes that the ground conditions at Bonanza Ledge are generally poorer, mainly the ore sills along the BC Vein Corridor,
than those of the Project.
| |
Osisko Development Corp.
NI 43-101 Technical Report
Feasibility Study for the Cariboo Gold Project |
|
| 16.2.3.3 | Stope Design and Dilution Estimates |
A back-analysis of stope performance at the Bonanza
Ledge Mine was conducted by comparing the planned stope shapes to the actual mined geometry, as captured by Cavity Monitoring System (“CMS”)
surveys. The reconciliation included 21 stopes, as show in Table 16-5. The analysis revealed that 50% of the stopes (i.e., the median)
exhibited a hydraulic radius greater than 4.4 m. The median rock mass quality (Q’) of the footwall (“FW”) and hanging
wall (“HW”) were 1.7 and 1.1, respectively, which fall within geotechnical Classes 3L and 4 at CGP. On average, the combined
dilution (ELOS) of the footwall and hanging wall was 0.9 m, with a maximum value of 2.4 m. The results of this analysis have been used
to establish stope design and dilution estimates in areas with Class 3L and 4 ground conditions.
Table 16-5: Summary of
stope performance back-analysis at Bonanza Ledge Mine
| Stope
Parameters & Results |
Unit |
Min |
Median |
Average |
Max |
| FW
Q’ Classification |
- |
0.2 |
1.7 |
8.7 |
61 |
| HW
Q’ Classification |
- |
0.2 |
1.1 |
3.7 |
24 |
| Hydraulic
Radius |
m |
3.8 |
4.4 |
4.5 |
6.2 |
| Strike
Length |
m |
12 |
14 |
15 |
20 |
| Width |
m |
2.4 |
6.2 |
6.8 |
15 |
| Vertical
Height |
m |
18 |
24 |
23 |
27 |
| Dip |
° |
56 |
75 |
73 |
90 |
| ELOS
– FW |
m |
0.0 |
0.1 |
0.3 |
1.5 |
| ELOS
– HW |
m |
0.0 |
0.6 |
0.7 |
2.0 |
| ELOS
– Combined FW & HW |
m |
0.0 |
0.8 |
0.9 |
2.4 |
The surface stability of CGP stopes planned in
ground classified as Classes 1, 2 and 3U were assessed using the empirical stability charts developed by Potvin (1988) and Mawdesley et
al. (2001), along with the ELOS method (Clark, 1998) for dilution estimates. These approaches consider rock mass classification, induced
stress conditions, intact rock strength, joint orientations, as well as stope geometry (i.e., hydraulic radius) and orientation. Proposed
stope dimensions (for two different mining widths) and dilution estimates are shown in Table 16-6, for each geotechnical design class.
| |
Osisko Development Corp.
NI 43-101 Technical Report
Feasibility Study for the Cariboo Gold Project |
|
Table 16-6: Stope dimensions
and dilution estimates
Stope
Parameters & Dilution
Estimate |
Unit |
Geotechnical
Class |
| 1
and 2 |
3
and 3U |
3L |
4 |
5 |
| Mining Method |
- |
Open Stope |
Cut &
Fill |
| Maximum Hydraulic Radius(1) |
m |
6.8 |
6.0 |
5.0 |
5.0 |
| Maximum Width |
m |
<8 |
<8 |
<8 |
<8 |
| Strike Length |
m |
25 |
20 |
15 |
15 |
| Maximum Width |
m |
<15 |
<10 |
<10 |
<10 |
| Strike Length |
m |
12 |
12 |
10 |
10 |
| Vertical Height |
m |
30 |
30 |
30 |
30 |
| Geotechnical Mining Factor(2) |
- |
100% |
100% |
100% |
70%(3) |
| ELOS – Combined FW & HW |
m |
1.0 |
1.5 |
2.0 |
2.5(3) |
Notes:
| (1) | Maximum hanging wall and footwall hydraulic radius (surface area/perimeter) |
| (2) | Geotechnical mining factor indicates the percentage of stopes that are estimated to be recovered at this sublevel spacing and rock
mass classification. This percentage is to be applied to the inventory in advance. |
| (3) | If using the Doyon method, apply geotechnical mining factor of 85% and ELOS of 1.5 m. |
The stopes provided by InnovExplo were classified
primarily by SRK (2023), with any remaining unclassified stopes subsequently assessed and categorized by Alius, resulting in fewer than
5% of stopes remaining unclassified. Due to variability in geotechnical conditions across stopes within the same mining area, individual
stope dimensions were applied to ensure consistency in stope and brow geometry. For design purposes, a single representative geotechnical
class was selected based on the class corresponding to the median stope tonnage within each vein corridor area. To ensure this approach
did not result in overly optimistic designs, a comparison was conducted between
the proposed stope strike lengths and those used in the mine plan, as summarized in Table 16-7. In this table, green cells
represent stopes where conservative design dimensions were used, while orange and red cells indicate increasingly aggressive designs.
Overall, approximately 80% of stopes were consistent with (or more conservative than) the recommended design parameters, 15% were more
aggressive, and 5% remained unclassified.
| |
Osisko Development Corp.
NI 43-101 Technical Report
Feasibility Study for the Cariboo Gold Project |
|
Table 16-7: Comparison
of proposed and actual (design) stope strike lengths
| Proposed
Strike Length |
Actual
Strike Length |
| ≤
15 m |
20
m |
25
m |
| 15 m |
313 |
281 |
4 |
| 20 m |
314 |
810 |
107 |
| 25 m |
94 |
140 |
328 |
| Unclassified |
43 |
58 |
20 |
Various pillars, including crown pillar, inter-lens
and historic mine working pillars, were assessed to ensure safe mining conditions.
Crown
pillar stability was assessed for all zones using the Scaled Span method (Carter et al., 2008), accounting for overburden loads and a
range of Q’ values (low to high), which vary by zone based on SRK (2023). The analyses assumed unsupported spans of up to 5.0 m.
The resulting minimum required crown pillar thicknesses are summarized in Table 16-8. If larger stopes are to be mined under
the crown pillar, additional ground support should be accounted for, and stopes should be backfilled (and tight filled) as soon as possible.
Table 16-8:
Minimum crown pillar thickness
| Zone |
Overburden
Thickness
(m) |
Q’
Values
(low–high) |
Crown
Pillar Thickness
(m) |
| Cow |
3 |
3.1–6.3 |
22 |
| Lowhee |
3 |
3.1–6.3 |
22 |
| Mosquito |
3 |
1.7–4.4 |
32 |
| Shaft |
3 |
1.7–4.4 |
32 |
| Valley |
8 |
3.1–6.3 |
25 |
The historic mine workings include abandoned portals,
decline ramps, drifts, and stopes. ODV has developed a 3D model of these features (Figure 16-2), which has been integrated into the
assessment. A stand-off distance of 5 m with the historical mine workings was used. However, in areas where intersections with old workings
are expected, probe holes must be drilled ahead of development to verify their location, assess whether they are backfilled, identify
their contents, and determine if they have been dewatered.
| |
Osisko Development Corp.
NI 43-101 Technical Report
Feasibility Study for the Cariboo Gold Project |
|
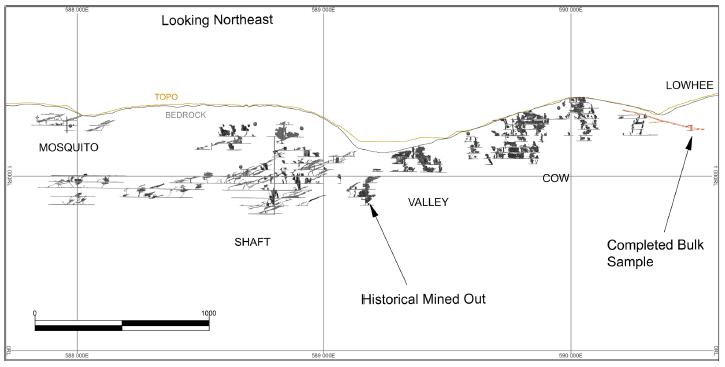
Figure 16-2: Existing underground workings
and completed bulk sample – Section view looking NE
(From InnovExplo, 2025)
Open stope mining will requires backfill to manage
stability and achieve the planned extraction. Paste backfill produced from the processed tailings and binding agents is required in stopes
and closure areas where mining progresses towards previously mined areas. The closure areas will require placement of a higher strength
plug or slab where the backfill will be undermined, with regular backfill in the rest of the stope. All excavations near surface need
to be tight-filled to minimize the space for potential failure and rock settlement that could result in surface subsidence. This requirement
is especially critical in the shallow areas of the mine where stope failure is more likely to cause surface subsidence. Backfilling strategy
for the Project is detailed in Section 16.6.15 of this Report.
Stopes are planned to be backfilled using paste
backfill to eliminate the need for rib pillars and to maintain the integrity of the excavation. Required strengths for the paste backfill
are based on the limit equilibrium approach described by Li & Aubertin (2012) and numerical modelling completed by A2GC (2024).
Depending on the geometry of the stope (e.g., span) and orientation of exposed surfaces (endwalls, hanging walls, or footwalls), required
paste fill strengths range from 165 kPa to 500 kPa.
| |
Osisko Development Corp.
NI 43-101 Technical Report
Feasibility Study for the Cariboo Gold Project |
|
Where
mining requires development through previously placed backfill – for example, to access sill-level stopes – higher
binder content will be used to increase the strength of the fill and maintain
the stability of the overlying excavation. In underhand mining conditions, where the backfill is exposed overhead, a strength of 750 kPa
is recommended to ensure stability.
| 16.2.3.6 | Extraction Sequence |
Following geotechnical recommendations, the overall
vein extraction sequence generally should follow a footwall-to-hanging wall direction, while leaving protective pillars in place at the
cross-cuts. These protection pillars would later be mined in the opposite direction, hanging wall to footwall, retreating from the cross-cuts.
To avoid overstressing as mining progresses, the cross-cut protection pillars must be designed with adequate strike length.
| 16.2.4 | Ground Support Recommendations |
Ground support requirements have been determined
using several widely accepted empirical design charts, including Grimstad and Barton (1993), Potvin & Hadjigeorgiou (2016), but
mainly based on previous Alius experience, and the knowledge gained at the Bonanza Ledge Mine and during the Cow portal and bulk sample
development. Ground support recommendations for typical conditions are presented below. Wider mining spans, or development through challenging
ground (e.g., fault-crossing) than those considered will require ground support designed on a case-by-case basis. Again, insights from
the bulk sample development can be used by the mine engineering department.
Table 16-9 presents the ground support recommendations
for the mine portals: conveyor portals (used for material handing, if required) and ramp portals (used for personnel and equipment transportation).
| |
Osisko Development Corp.
NI 43-101 Technical Report
Feasibility Study for the Cariboo Gold Project |
|
Table 16-9: Ground support
recommendations for mine portals
| Portal
Type |
Shotcrete
/ Mesh-straps |
Face
/ Wall Support |
Back
Support |
| Conveyor |
|
|
|
| Face Portal |
SC: 3.0 m around opening |
RB 2.4 m; 1.2 x 1.2 m |
N/A |
| Brow |
SC + M-S (3 rows) |
RB 2.4 m; 1.2 x 1.2 m |
CB 6.0 m; 3/row; 6 rows @ 1.5 m |
| Tunnel |
SC: walls & back (16 m) |
SS 1.8 m; 1.2 x 1.2 m |
RB 2.4 m; 1.2 x 1.2 m |
| Ramp |
|
|
|
| Face Portal |
SC: 8.0 m around opening |
RB 2.4 m; 1.2 x 1.2 m |
N/A |
| Brow |
SC + M-S (3 rows) |
RB 2.4 m; 1.2 x 1.2 m |
CB 6.0 m; 3/row; 6 rows @ 1.5 m |
| Tunnel |
SC: walls & back (16.0 m) |
SS 1.8 m; 1.2 x 1.2 m |
RB 2.4 m; 1.2 x 1.2 m |
Codes/Notes:
| ■ | CB 15 mm cable bolt; M-S 0.3 x 3.0 m 0-gauge mesh-straps; RB
Rebar #6; SS Split set 35 mm; SC 3" One pass of 3-inch shotcrete. |
| ■ | Screen/mesh for face portal and brow: chain link. |
| ■ | Screen/mesh for tunnels: 1.5 x 2.7 m galvanized welded wire mesh (“WWM”)
#6, 1.5 m from floor. |
| 16.2.4.2 | Lateral and Vertical Development |
Table 16-10 presents the ground support recommendations
for lateral and vertical development. Experience gained during the development of the Cow decline to reach the bulk sample area was also
considered.
Table 16-10: Ground support
recommendations for lateral and vertical development
| Excavation
Type |
Back
Support |
Wall
Support |
Max
Span (m) |
| Lateral |
|
|
|
| Decline / ramp |
RB 2.4 m; 1.2 x 1.2 m |
SS 1.8 m; 1.2 x 1.2 m |
6 |
| Permanent |
RB 2.4 m; 1.2 x 1.2 m |
SS 1.8 m; 1.2 x 1.2 m |
6 |
| Temporary |
SX 1.8 m; 1.2 x 1.2 m |
SS 1.8 m; 1.2 x 1.2 m |
5 |
| Intersection (<10 m) |
Permanent/Temporary + 9x CB 6.0 m |
10 |
| Intersection (<12 m) |
Permanent/Temporary + 16x CB 6.0 m |
12 |
| In or under cemented paste fill |
SC 2x 2" + WWM + SS 1.8 m; 1.2 x 1.2 m (floor-to-floor) |
5 |
| Vertical |
|
|
|
| Alimak raise (<3 x 3 m) |
SS 1.8 m; 1.2 x 1.2 m |
SS 1.8 m; 1.2 x 1.2 m |
3 |
| Raise (<3 m or equiv. section) |
SS 1.8 m; 1.2 x 1.2 m |
RB 1.8 m; 1.2 x 1.2 m |
3 |
| Raise (<5 m or equiv. section) |
N/A |
RB 2.1 m; 1.2 x 1.2 m |
5 |
| Raise (<8 m or equiv. section) |
N/A |
RB 2.4 m; 1.2 x 1.2 m |
8 |
Codes/Notes:
| § | CB 15 mm Cable bolt; M-S 0.3 x 3.0 m 0-gauge
mesh-straps; RB Rebar #6; SS Split set 35 mm; SC 2x 2" Two passes of 2-inch shotcrete; SX 12 t Swellex; SSX
24 t Super Swellex. |
| § | Screen/mesh (for lateral development): assume 1.5 x 2.7
m galvanized WWM #6, 1.5 m from floor. |
| § | Screen/mesh (for raises): assume chain link or WWM. For
a temporary Alimak raise (used prior to slashing a raise to larger diameter): screen HW and face only. |
| § | Development in classes 4 and 5: 3-inch shotcrete required;
full wall coverage. |
| |
Osisko Development Corp.
NI 43-101 Technical Report
Feasibility Study for the Cariboo Gold Project |
|
Ground support provisions for stopes were also
included, as shown in Table 16-11. Tendons can either be 24 t
inflatable bolts (e.g., Super Swellex) or cemented cables.
Table 16-11: Ground support
recommendations for stopes
| Stope
Type / Class |
Tonne/Metre |
Support
Length (m) |
Support
Details |
| Longitudinal |
|
|
|
| Classes 3 & 3U |
35 |
6 |
HW: 3 tendons/ring; 2 m spacing |
| Classes 3L & 4 |
18 |
6 |
FW: 3 tendons/ring; 2 m spacing
HW: 3 tendons/ring; 2 m spacing |
| Transversal |
|
|
|
| Classes 3 & 3U |
33 |
6 |
HW: 3 tendons/ring; 2 m spacing |
| Classes 3L & 4 |
44 |
6 |
FW: 3 tendons/ring; 2 m spacing
HW: 3 tendons/ring; 2 m spacing |
| Brows |
-- |
3.6 |
6x Super Swellex or cables |
| 16.2.4.4 | Permanent Infrastructure |
Preliminary secondary ground support has been
incorporated into the design of permanent underground infrastructure, including the crusher chambers and large excavations related to
the underground mechanical workshop. Cost allowances account for the installation of cement-grouted cable bolts and application of shotcrete.
| |
Osisko Development Corp.
NI 43-101 Technical Report
Feasibility Study for the Cariboo Gold Project |
|
WSP developed a numerical model to estimate groundwater
discharge into the underground workings during mine construction and operations. The information presented in the following subsections
is drawn from the WSP report (WSP, 2023d).
| 16.3.1 | Mine Site Area Hydrogeology |
The regional water table is generally a subdued
replica of topography, with local depressurization near historical underground workings that are draining towards the Jack of Clubs Valley
and/or Mosquito Creek. Regional groundwater flow directions are generally from areas of high elevation to areas of low elevation, with
ultimate discharge to the streams located in the valley bottoms.
| 16.3.2 | Groundwater Inflow Predictions – Mine Site Complex Area |
ODV plans to begin dewatering the existing underground
workings in Year -2. By Year -1, the groundwater level is expected to reach the base of the existing underground, approximately 400 m
below the current groundwater surface elevation. For the remainder of the mine's operations, the water level will be maintained at this
depth to ensure suitable operating conditions.
Model simulations were developed based on predicted
inflow rate to the underground, with results presented in Table 16-12 for two scenarios:
| § | Base Case – Model simulation with calibrated model values; |
| § | Alternative Scenario – Hydraulic conductivity of bedrock increased
by a factor of two. |
Table 16-12: Total predicted
groundwater inflow to the existing and new underground workings
| Year |
Base Case
(m3/day) |
Alternative Scenario
(Higher Bedrock Hydraulic Conductivity)
(m3/day) |
| -3 |
800 |
1,300 |
| -2 |
5,800 |
8,300 |
| -1 to 10 |
6,000 |
8,700 |
Table 16-12 provides an estimate of the ongoing
mine dewatering requirements. In addition to this, the volume of groundwater currently stored in the existing underground workings will
need to be pumped out during the Year -2 to Year -1 mine drawdown period. According to ODV (ODV, 2024b), the volume of flooded mine workings
is estimated at 1,090,000 m³, which will be dewatered during this timeframe.
| |
Osisko Development Corp.
NI 43-101 Technical Report
Feasibility Study for the Cariboo Gold Project |
|
| 16.3.3 | Limitations of Inflow Predictions |
The groundwater flow model is a simplification
of complex hydrostratigraphy and the network of underground workings. The following model assumptions, exclusions, and limitations should
be considered as new data is collected as the Project progresses:
| § | A simplified 3D geology model was constructed to support hydrogeological
numerical modelling. As such, geology was simplified into major aquifers and aquitards, and may omit units of geotechnical significance.
This approach is considered reasonable for the objective of the model, which is to support the understanding of changes in seepage migration
pathways and groundwater discharge quantities, but it may not represent precise pathways on a local scale. |
| § | In general, consistent hydraulic properties were assigned to each hydrostratigraphic
unit, though in reality local variations will occur spatially within each unit. While local modifications may have improved calibration,
it is not practical to collect sufficient data to make these modifications. During calibration, assigned parameters were selected to be
within the range of available field measured values and to represent local groundwater conditions and observed gradients over a larger
scale. |
| § | The Mine Site has historical underground workings, and it is assumed the
extent are as provided by ODV (ODV, 2024b). |
| § | The historical workings are assumed to be free draining, and it is assumed
that no bulkheads were installed to restrict the hydraulic connection within the underground workings. |
| 16.4 | Underground Mining Method |
The
primary mining method selected is longitudinal longhole stoping with paste backfill, representing 88% of the total stopes tonnage. This
method was selected based on several key factors, including average vein width, metal content (value), and ground conditions. Figure 16-3
illustrates the selected method.
| |
Osisko Development Corp.
NI 43-101 Technical Report
Feasibility Study for the Cariboo Gold Project |
|
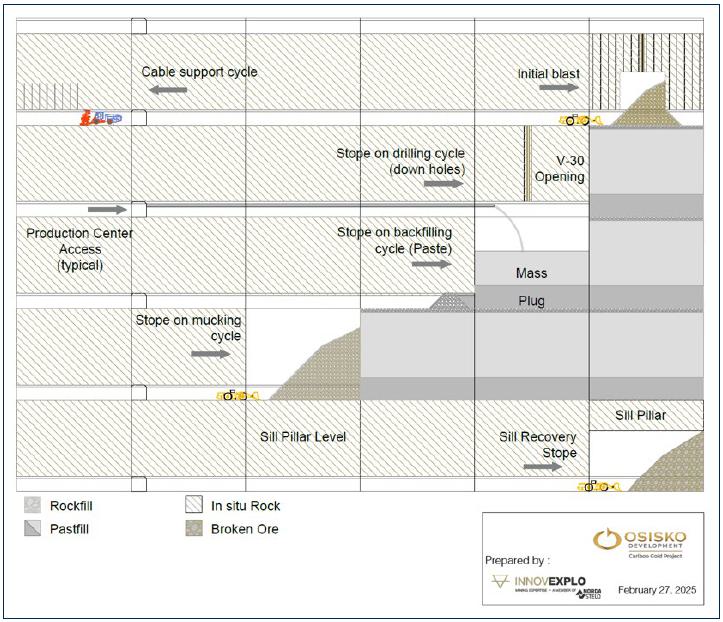
Figure 16-3: Longitudinal
longhole retreat - Mining cycle
Two additional methods will be used in specific
or marginal cases:
| § | Transverse longhole stoping will be applied to stopes located in very wide
mineralized zones (5% of the total stopes tonnage) (Figure 16-3). |
| § | A two-pass variant of longitudinal longhole stoping will be employed in zones
geotechnically classified as Class 4 ground (see Section 16.2.3.1 for geotechnical design classification details). |
| |
Osisko Development Corp.
NI 43-101 Technical Report
Feasibility Study for the Cariboo Gold Project |
|
The
two-pass variant was considered for stopes located in geotechnical ground classified as "Class 4" (see Section 16.2.3).
These stopes are primarily found in the Shaft, Cow, and Mosquito zones. This "modified" method, which requires paste backfill,
was selected to improve ore recovery, estimated at approximately 87% using this approach (see Section 16.5.10 for mining recovery
estimation details). The method has been tested at the Doyon Mine (Williams and Denoncourt,
2004) during the mining of stopes with similar characteristics in weak ground conditions. It involves drilling and blasting the stope
as in the conventional method; however, only about half of the tonnage is initially extracted. The upper part of the stope is then backfilled
with paste, followed by a curing period. Once curing is complete, the remaining ore is recovered. Two service holes are then drilled from
the upper drift to allow paste backfilling of the lower portion of the stope. Figure 16-4 illustrates
the sequential steps of the two-pass stoping method.
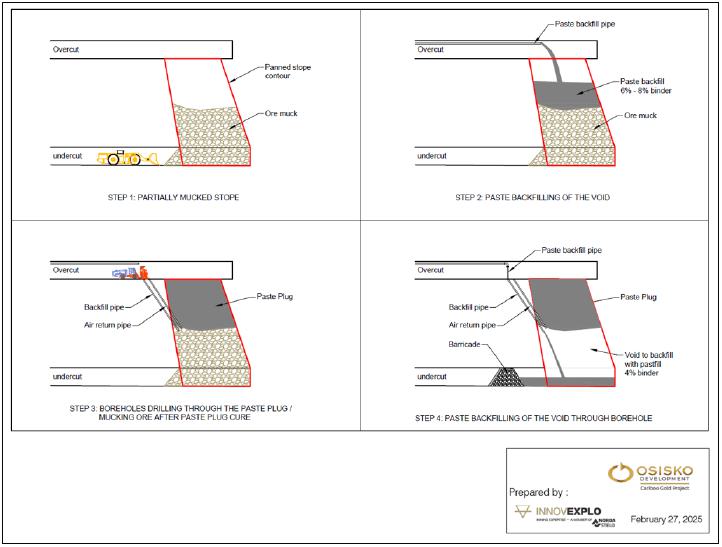
Figure 16-4: Two-pass variant
of the longitudinal longhole stoping
| |
Osisko Development Corp.
NI 43-101 Technical Report
Feasibility Study for the Cariboo Gold Project |
|
Despite higher costs and a loss of approximately
1 m of ore at the paste/ore interface, this method allows for a reduced open stope exposure time. For this Project, this modified approach
is applied to 7% of the total tonnage for stoping.
| 16.4.1 | Cut-off Grade Calculation |
The following cut-off grades were used for the
final mine design:
| § | 2.0 g/t Au ore envelopes for potential minable stopes design. These core
envelopes were used for the main mine design (ramps, access, etc.); |
| - | A two-stage stope optimization was performed, first using cut-off grade to identify mineable zones, then refining results by incorporating
development costs to retain only economically viable stopes. |
| § | 1.7 g/t Au ore – For mineralized development material, a lower cut-off
grade of 1.7 g/t Au was applied to account for reduced incremental cost structures associated with pre-planned access development. |
A detailed description of the cut-off grade estimation
is provided in Section 15.2.1.
| 16.4.2 | Selection of Economical Material for Life of Mine |
Minable Shape Optimiser® (“MSO”)
was used to determine the correlation between cut-off grade and the resulting mineable envelope. The optimization is driven by the following
inputs:
| § | Minimum and maximum stope width; |
| § | Minimum and maximum dip angle; |
Table 16-13 illustrates
the general input parameters used in the MSO runs.
| |
Osisko Development Corp.
NI 43-101 Technical Report
Feasibility Study for the Cariboo Gold Project |
|
Table 16-13: MSO input
parameters
| Parameters |
Unit |
Value |
| Cut-off Grade |
g/t Au |
2.0 |
| Min Mining Width |
m |
3.7 |
| Level Spacing |
m |
30 |
| Minimum DSO Strike |
m |
15 |
| Maximum DSO Strike |
m |
25 |
| Side Ratio |
m |
2.5 |
| Minimum Trans Pillar Width |
m |
5 |
| Minimum Dip Angle |
deg |
45 |
| Maximum Dip Angle |
deg |
135 |
The Project comprises five main mining zones,
listed below and shown in Figure 16-5:
| |
Osisko Development Corp.
NI 43-101 Technical Report
Feasibility Study for the Cariboo Gold Project |
|
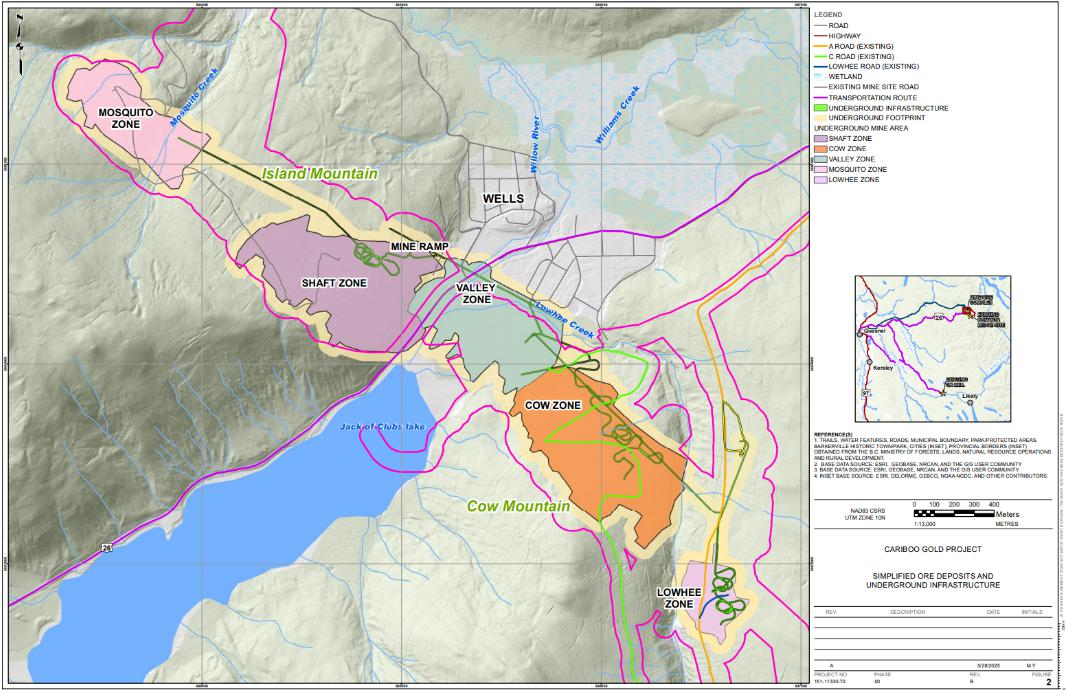
Figure 16-5: Plan view
of main mining zones
The vertical extent of all mineable blocks spans
approximately 630 m. The mineralized system is composed of discrete, parallel ore lenses that strike northwest and dip predominantly
sub-vertically. These lenses are distributed within a deposit extending over approximately 4.4 km in length.
Access to the mine is provided via two surface
portals, which connect directly to the Cow and Valley zones. Internal ramp systems connect these primary access points to all mining zones,
facilitating efficient movement of personnel, equipment, and material throughout the deposit. Figure 16-6 illustrates the overall
mine layout, including the portal locations and internal ramp network.
Following a detailed geotechnical analysis, mining
levels have been established at 30 m vertical intervals to optimize ground stability and operational efficiency.
| |
Osisko Development Corp.
NI 43-101 Technical Report
Feasibility Study for the Cariboo Gold Project |
|
For each mineralized zone, a haulage drift will
be developed perpendicular to the axis of the sub-parallel lens system, allowing multiple mining fronts to be accessed simultaneously.
This design optimizes production flexibility and scheduling.
Given the relatively shallow depth of the deposit,
all stopes will be mined using load-haul-dump (“LHD”) equipment. Ore will be transported by truck from each mining level to
either the underground crusher feed point, or to the ore silo feed point located in the Shaft Zone. From the Shaft Zone silo, ore will
be re-handled by truck and hauled to the crusher for processing. From there, the material will be conveyed to surface where it will be
directed to the ore sorter at the processing plant.
| |
Osisko Development Corp.
NI 43-101 Technical Report
Feasibility Study for the Cariboo Gold Project |
|
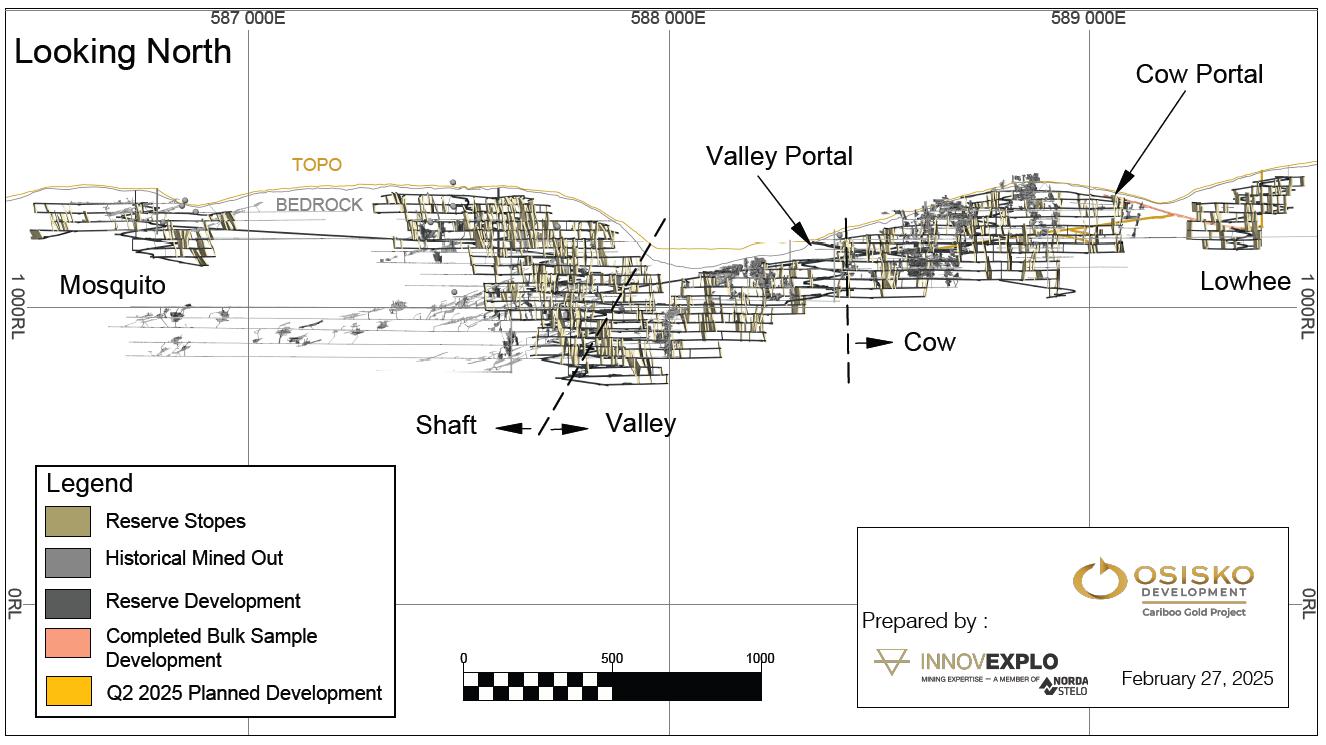
Figure 16-6: Cariboo Gold
Project – Longitudinal section looking north
| |
Osisko Development Corp.
NI 43-101 Technical Report
Feasibility Study for the Cariboo Gold Project |
|
Level accesses, haulage and ore drifts will be
excavated using conventional development drill and blast techniques. Decline and inter-zone ramp development during the pre-production
period will be achieved by Roadheaders, these units will be replaced by development drills during the production phase.
Declines and inter-zone ramps linking the different
portals to the five main mining zones are strategically placed throughout the mine to facilitate efficient material movement by trucks.
The development profiles by type are listed in Table 16-14.
Table 16-14: Lateral development
dimensions and cost category
| Development Type |
Development Profile
(width x height) |
Capital / Operating |
| Main Ramp |
5.4 m x 5.8 m |
Capital |
| Ramp Re-muck |
5.4 m x 5.8 m |
Capital |
| Level Access |
5.4 m x 5.8 m |
Capital |
| Truck Loading/Unloading Bay |
5.4 m x 7.5 m |
Capital |
| Level Haulage |
4.3 m x 5.0 m |
Capital |
| Paste Transfer Bay |
5.4 m x 5.8 m |
Capital |
| Pump Station |
5.3 m x 5.3 m |
Capital |
| Refuge Station |
5.3 m x 5.3 m |
Capital |
| Level Re-muck |
5.4 m x 5.8 m |
Capital |
| Sump |
4.3 m x 5.0 m |
Capital |
| Sump |
5.0 m x 5.3 m |
Capital |
| Vent Access |
4.3 m x 5.0 m |
Capital |
| Electrical Station |
6.0 m x 5.3 m |
Capital |
| Electrical Substation |
5.0 m x 5.3 m |
Capital |
| Ore Drift |
3.7 m x 4.0 m |
Operating |
| 16.5.2 | Main Infrastructure |
The main infrastructure for the Project includes
the main ramps, the maintenance shop, the sumps and pumping stations, electrical power grid, paste line and pumping station, lunchroom,
powder and cap magazines, rock breaker and crushing facilities including ore conveyor.
| |
Osisko Development Corp.
NI 43-101 Technical Report
Feasibility Study for the Cariboo Gold Project |
|
The crushing facilities are designed to handle
4,900 tpd and are located along the Cariboo ramp in the eastern extent of Valley Zone and along the Cow ramp, as shown in Figure 16-7.
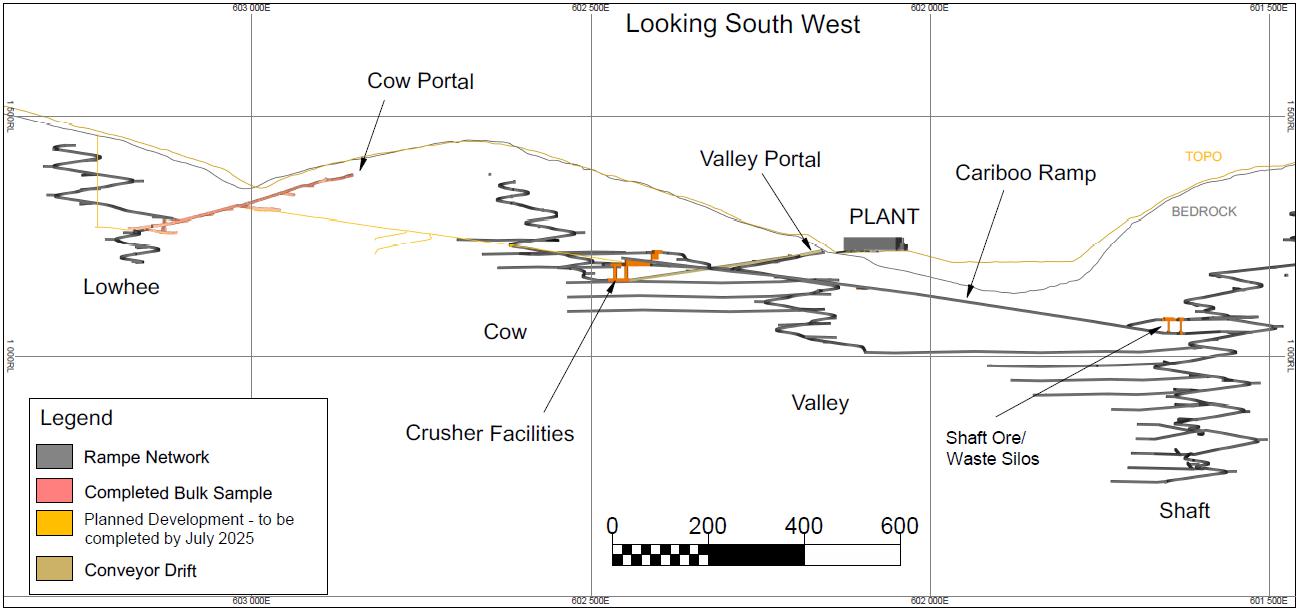
Figure 16-7: Location of
Cariboo ramp, crusher facilities and Shaft ore silos
The Mine Site will include two portals to access
the underground mine. Valley portal is located on the southern limit of the MSC while the Cow portal is located on the side of Barkerville
Mountain, south-east of the MSC. The Cow portal was developed in 2021 while the development of the Valley portal will occur during construction
of the Project. The Valley portal development will require excavation of overburden and rock and the removal of historic concrete structures
including a foundation and portal infrastructure.
The Cow portal will be used as access for development
in pre-production as well as the access for the waste hauling transfer to the WRSF. It will be the hauling road for ore and waste material
during that period. Once the Valley portal is connected to Cow portal via the underground ramp, the Valley portal will become the main
access portal for production. The ramp will progress directly to the Cow Zone. This layout allows for traffic alleviation between the
two zones. This ramp will be the main access ramp to access and provide the services to the different zones.
The associated infrastructure at each portal during
the development period will include an electrical substation, temporary ventilation fans and heater, and water management infrastructure.
| |
Osisko Development Corp.
NI 43-101 Technical Report
Feasibility Study for the Cariboo Gold Project |
|
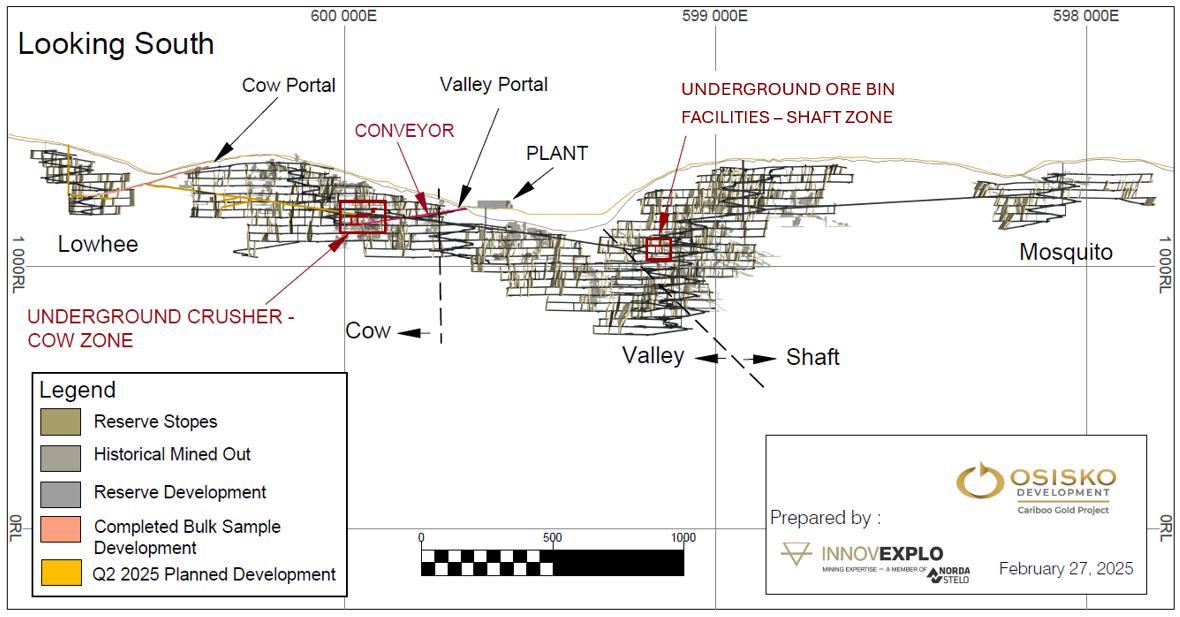
Figure 16-8: Location of
crushing facility and conveyor
| |
Osisko Development Corp.
NI 43-101 Technical Report
Feasibility Study for the Cariboo Gold Project |
|
| 16.5.3 | Level Layout Design |
The typical mine level layout consists of in the
level access, ventilation access, loading bay, sump, electrical substation (“ESS”), refuge station, haulage drift, and ore
drift. The typical mine level is shown in Figure 16-9. Minor variations exist between levels due to the trend of the ore veins, logistic,
or required infrastructure.
Specific areas mainly pertaining in the vicinity
of the level access will be capitalized as per Figure 16-9 (blue, yellow, green, pink, gray, orange and cyan), with remaining development
categorized as operating development (red).
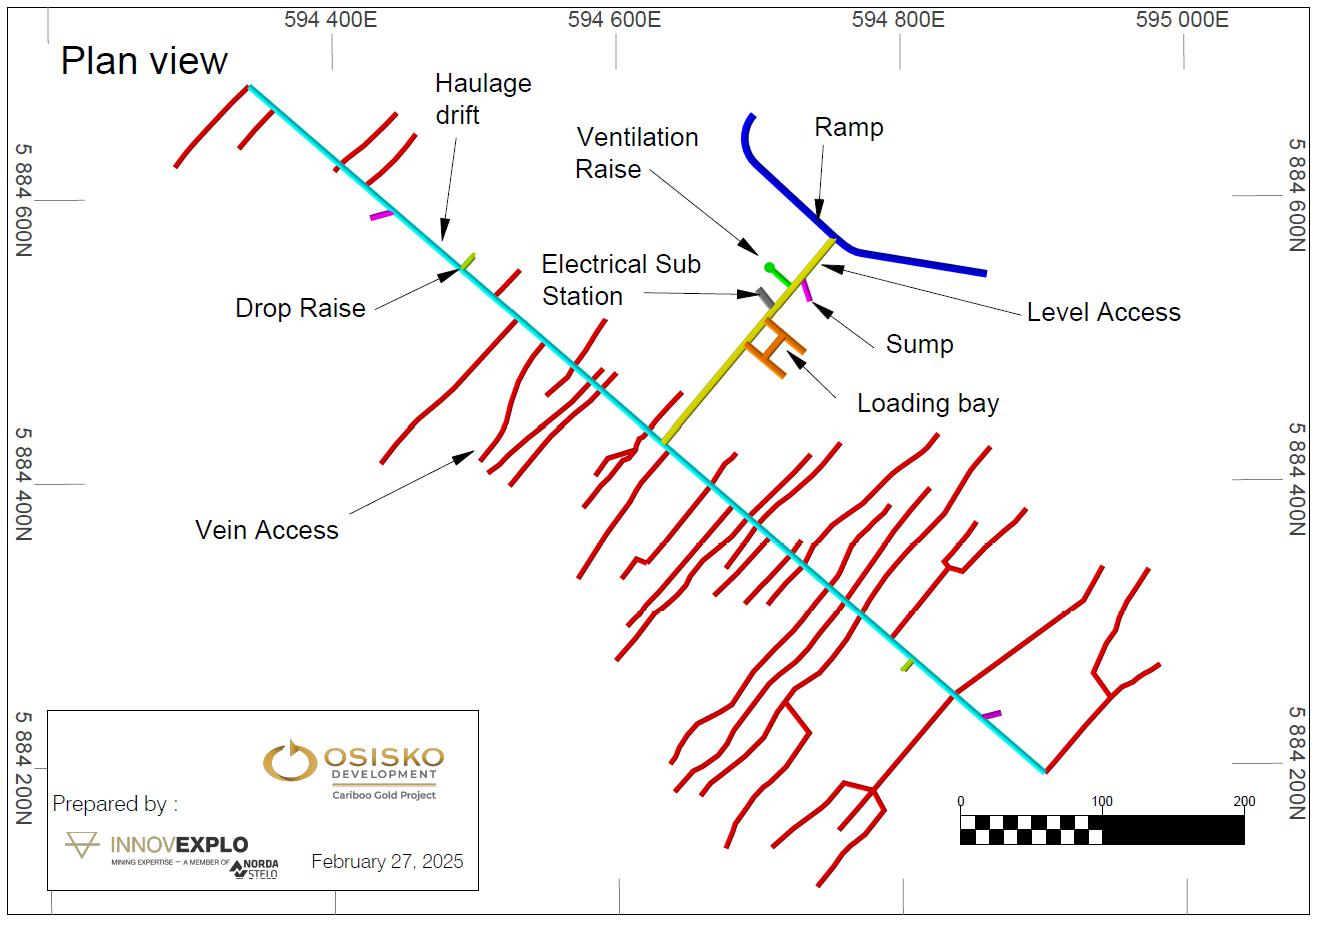
Figure 16-9: Plan view
of typical level layout
| |
Osisko Development Corp.
NI 43-101 Technical Report
Feasibility Study for the Cariboo Gold Project |
|
The level access will be excavated to the same
dimensions as the main ramp, 5.4 m wide x 5.8 m high, to allow for truck access. The typical electrical substation is located
near the level entrance with a sump located along the level access.
The level access typically intersects the haulage
drift (4.3 m wide x 5.0 m high), allowing for access of a 10 t capacity LHD into the ore drives. The smaller profile dimension serves
as a safeguard restricting haul trucks to operating in the level access and truck loading area.
The haul drift is typically linked to ore drives
(3.7 m wide x 4.0 m high), providing access to the production stopes. These drifts are generally positioned in the centre of the veins
to allow maximum stopes availability for production. The production drilling equipment has been selected to enable operation within the
smaller profile dimensions and minimize dilution.
All development infrastructure on each level were
designed with 2% gradients. Sumps were placed at a low point along the access to facilitate drainage. Sumps with a drain hole will be
4.3 m wide x 5.0 m high with a length of 15 m and a gradient of -12%; while the electrical stations will be 6.0 m
wide x 5.3 m high with an overall length of 16 m and electrical substations and 5.0 m wide x 5.3 m high with an overall
length of 7 m.
Two types of configurations have been developed
for truck loading operations to optimize material handling and reduce LHD transport distances. On selected levels, an inverted ventilation
raise has been strategically positioned between two levels, approximately at the mid-point of the haulage drift. To facilitate direct
truck access for loading, the haulage drift on these levels has been deliberately O/S up to the ventilation raise access.
For levels where no secondary ventilation raise
is present, a dedicated truck loading and unloading area has been planned within the access drift. This ensures operational efficiency
while maintaining flexibility in the overall haulage design. This area includes a 20 m long truck turnaround and waste storage (7.5 m
high x 5.4 m wide), with a parallel 33 m long loading access drift (7.5 m high x 5.4 m wide), and one perpendicular drift (7.5 m
high x 5.4 m wide), serving as a loading bay.
The truck loading access drift will be excavated
at a +2% gradient with the parallel loading access drift to be excavated at a 2% gradient. The loading bay will be excavated at a +3.5%
gradient to provide an elevated offset allowing a loaded LHD to dump material directly into a truck from above. Figure 16-10 provides
a typical truck loadout area:
| |
Osisko Development Corp.
NI 43-101 Technical Report
Feasibility Study for the Cariboo Gold Project |
|
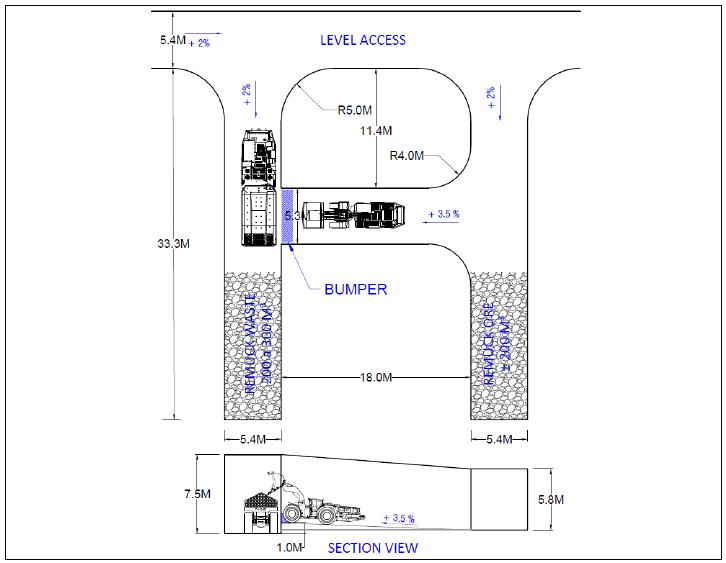
Figure 16-10: General arrangement
truck loading and unloading
Production stopes will consist of a set of 89
mm or 102 mm blasthole rings configured on a dice five or fan pattern depending on the width of the different veins in each zone. All
blastholes will be loaded with emulsion along with detonator, booster, and stemming in each hole. A 30-inch diameter V30 slot raise with
102 mm blastholes around the perimeter will be positioned in the middle of the stope and will generate the opening necessary for the first
blast. Blastholes will be drilled using a long hole drill from the top sill down to the undercut drift. Figure 16-11 and Figure 16-12
detail the specific drill configuration for production stopes in each zone. Typical stope blasting will be in two blasts: a primary opening
to achieve 20% void indices and a final blast.
| |
Osisko Development Corp.
NI 43-101 Technical Report
Feasibility Study for the Cariboo Gold Project |
|
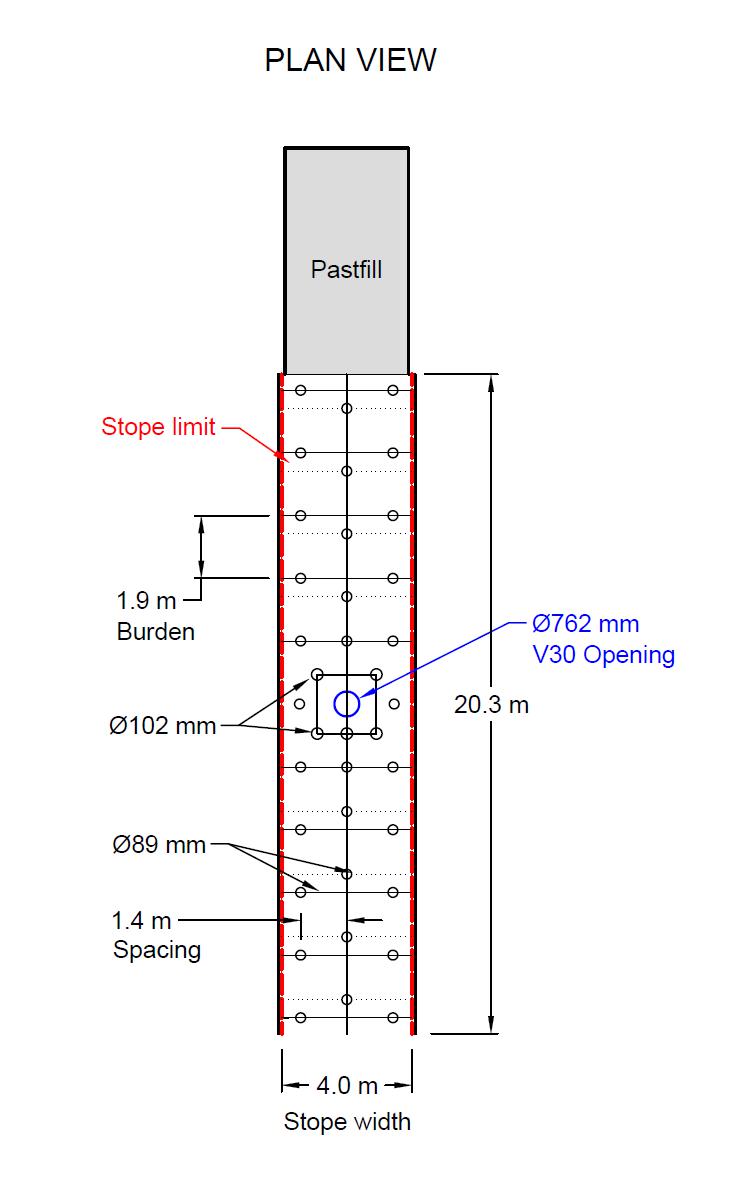
Figure 16-11: Typical drilling
pattern - Valley Zone – Plan view
| |
Osisko Development Corp.
NI 43-101 Technical Report
Feasibility Study for the Cariboo Gold Project |
|
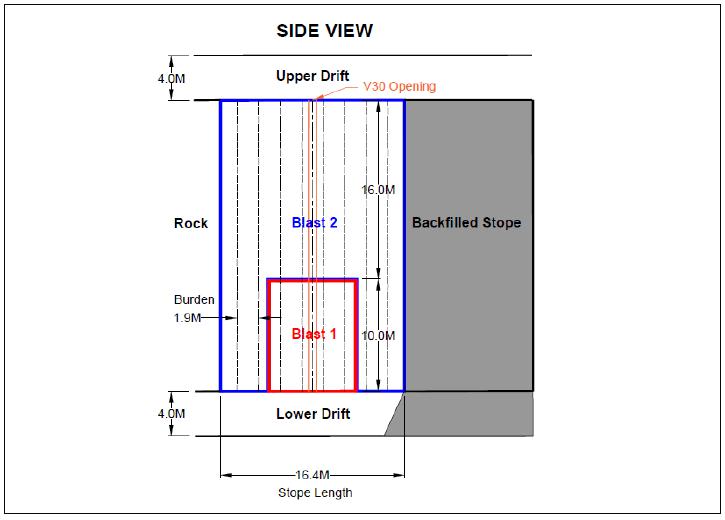
Figure 16-12: Typical drilling
configuration for Valley Zone, side view
The largest zone of the Project (by inventory
tonnage) is the Shaft Zone. This zone encompasses 21 levels from level 780 to level 1390 at a sublevel spacing of 30 m floor-to-floor,
with its lowest level currently reaching a mean sea level (“msl”) depth of approximately 780 m. Given the mountainous terrain
above the zone, the depth from the surface is highly variable. The zone’s horizontal extent stretches approximately 1 km along
the strike.
The average stope width in this zone is 4.9 m
with a length averaging 17 m along the strike. Stope strike length refers to the length of the stope along the strike of the mineralized
zone that can remain open for a certain period before being backfilled, due to geotechnical considerations. This is most often due to
maximum hydraulic radius dictated by local ground conditions surrounding the stopes.
| |
Osisko Development Corp.
NI 43-101 Technical Report
Feasibility Study for the Cariboo Gold Project |
|
Shaft Zone is expected to contribute 8.5 Mt
at an average grade of 3.71 g/t to the mine production over the life of mine. Additional information on stope dimensions can be found
in Section 16.2. A longitudinal view of the zone is included in Figure 16-13. The Shaft Zone is intersected along strike by
the Aurum Fault dipping approximately 50 degrees northeast, flanked by the Shaft Zone Fault 1 to the east, and the Jack of Clubs Fault
to the southeast, as shown in Figure 16-14.
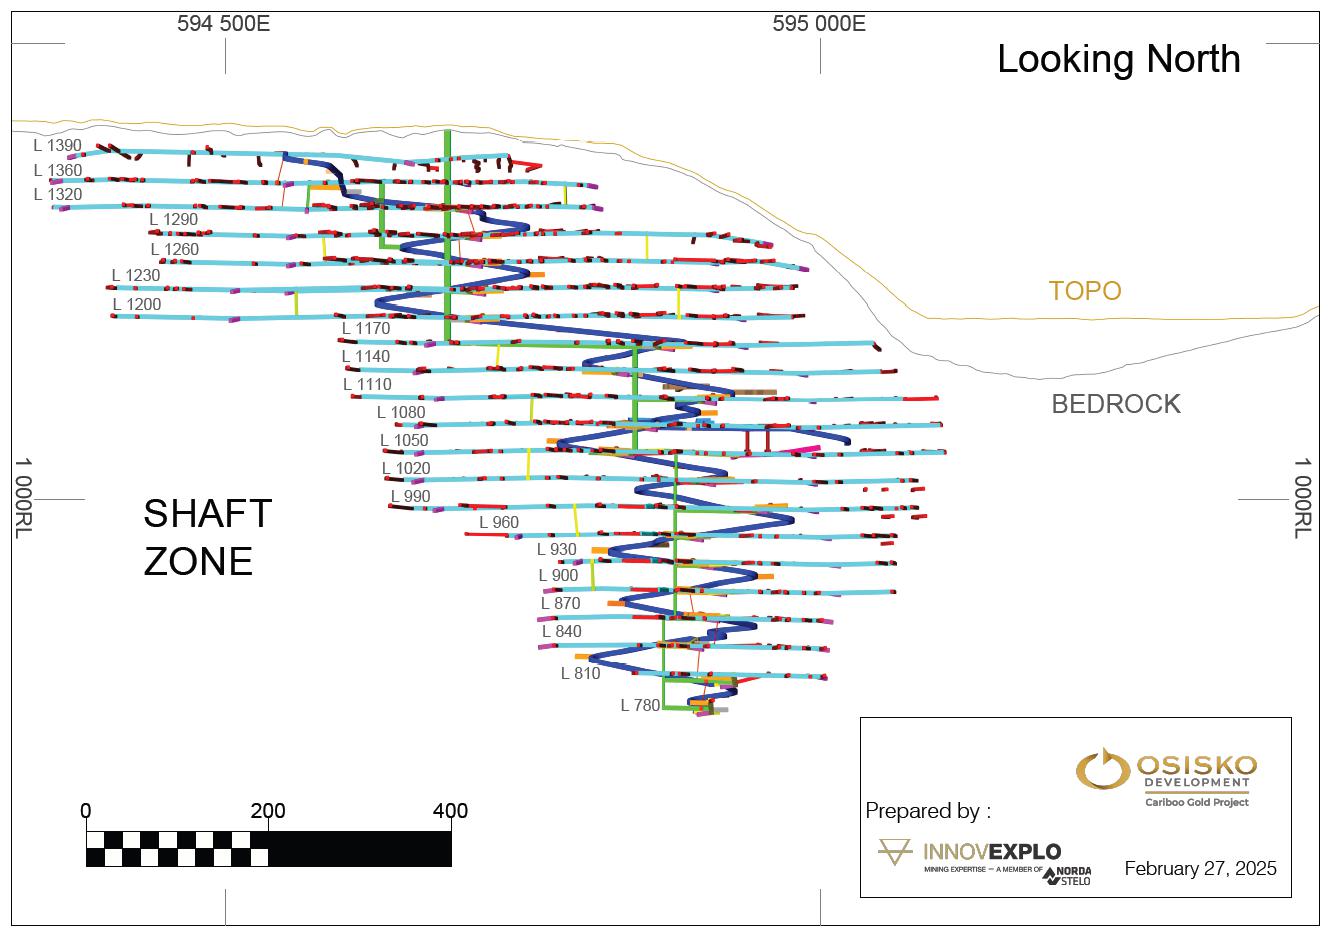
Figure 16-13: Longitudinal
section of Shaft Zone looking north
| |
Osisko Development Corp.
NI 43-101 Technical Report
Feasibility Study for the Cariboo Gold Project |
|
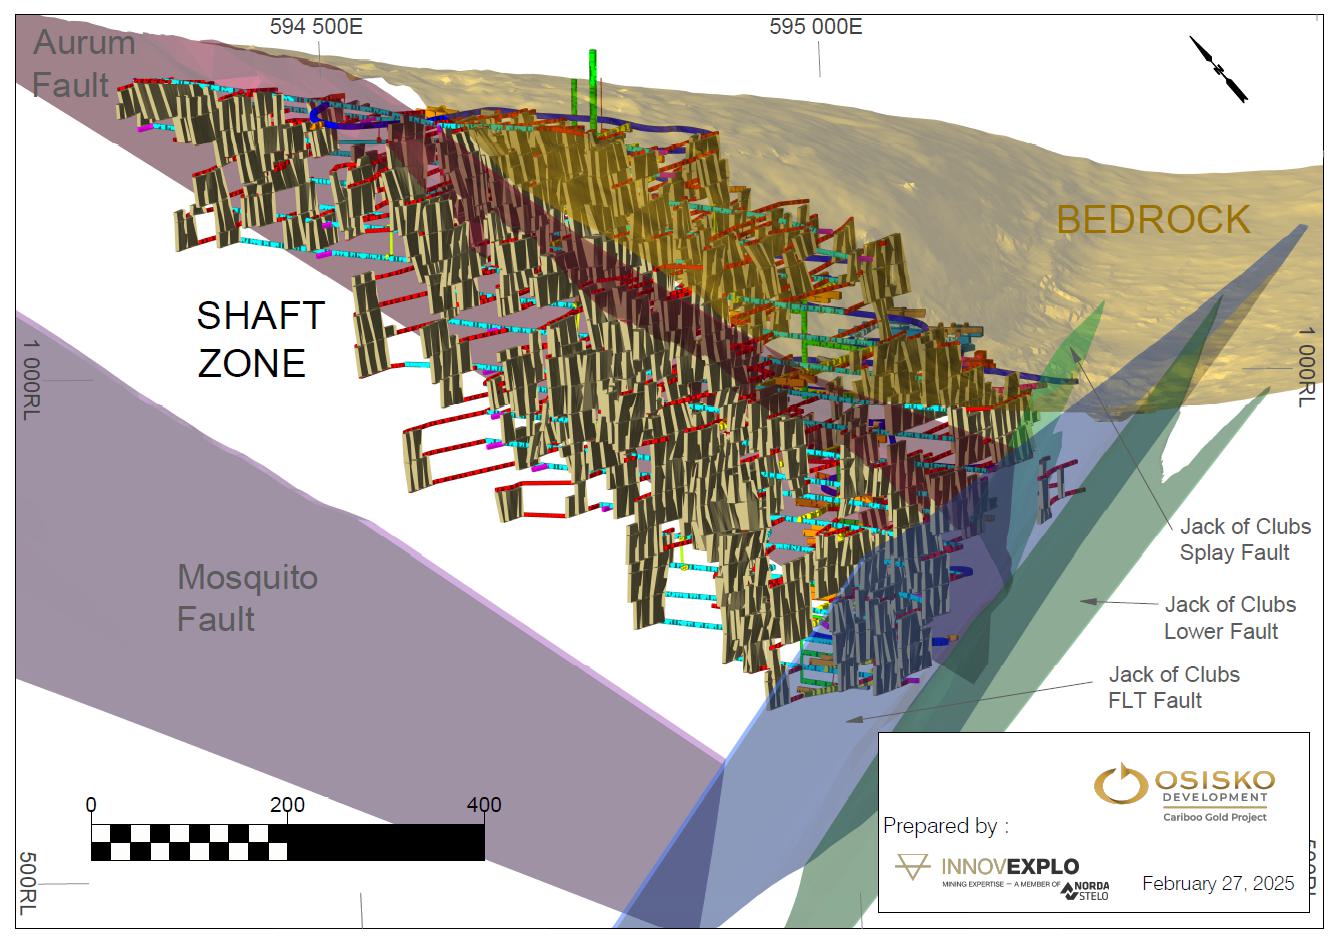
Figure 16-14: Perspective
view of Shaft Zone showing traversing fault structures, looking north
| |
Osisko Development Corp.
NI 43-101 Technical Report
Feasibility Study for the Cariboo Gold Project |
|
The Valley Zone comprises 15 levels from level
750 to level 1170 at 30 m from floor-to-floor and reaches a depth of around 750 m above msl. The Valley Zone spans 570 m along strike.
Stope widths in the Valley Zone average 4.9 m with the stope length averaging 20 m along the strike. The Valley Zone is expected to contribute
3.3 Mt at an average grade of 3.7 g/t to production over the life of the mine. A longitudinal view of the zone is included in Figure 16-15.
The Valley Zone is bisected horizontally at its
mid-elevation by the Shaft Zone Fault 1 dipping at approximately 75 degrees east, and it has a minor intersection with the Jack of Clubs
Fault Damage Zone on the western extent, while the Aurum Fault crosses the lower five levels of the zone. The fault structures are shown
in Figure 16-16.
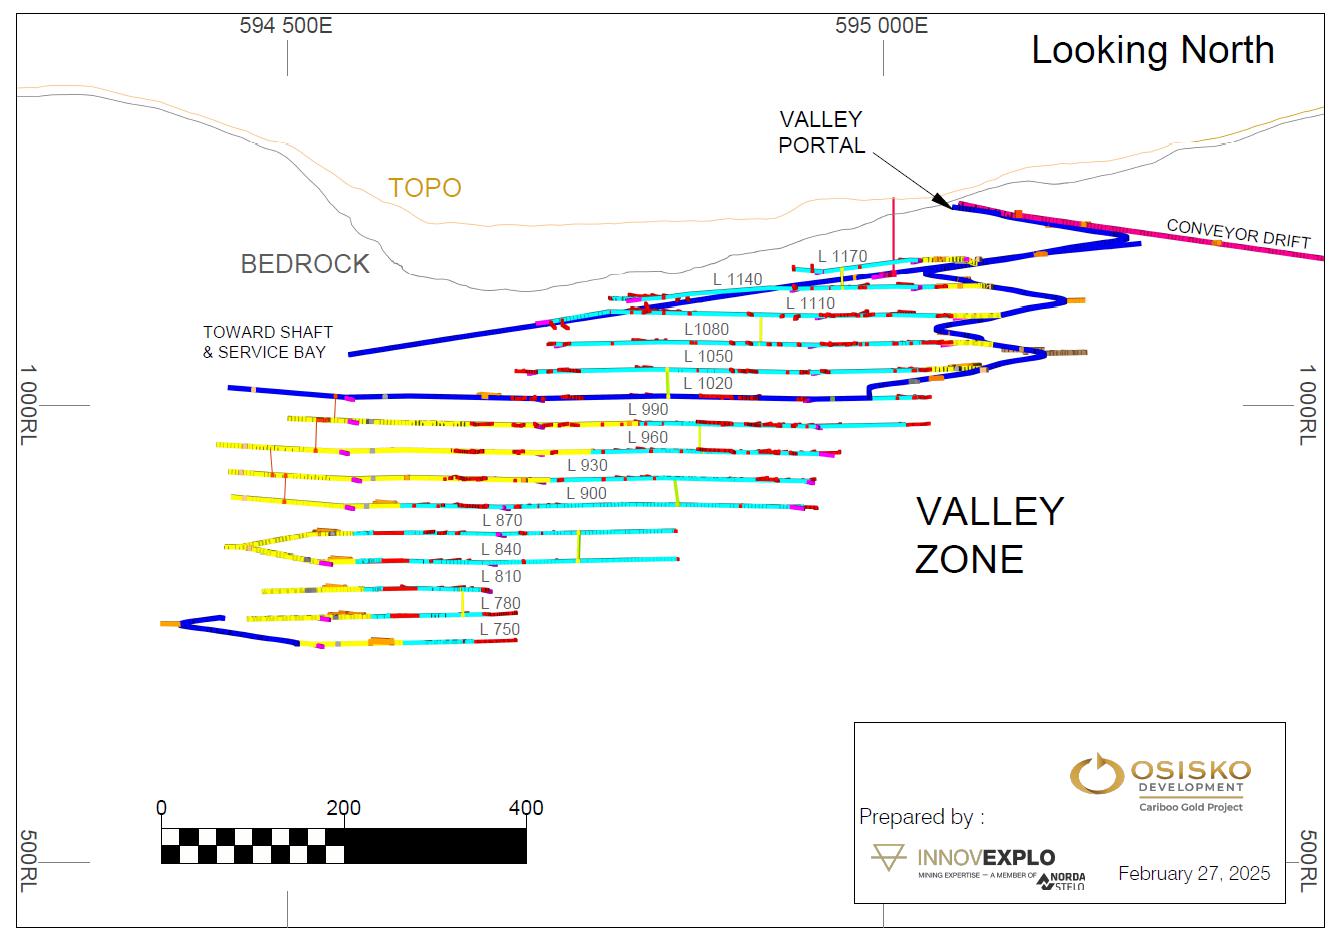
Figure 16-15: Longitudinal
section of Valley Zone looking north
| |
Osisko Development Corp.
NI 43-101 Technical Report
Feasibility Study for the Cariboo Gold Project |
|
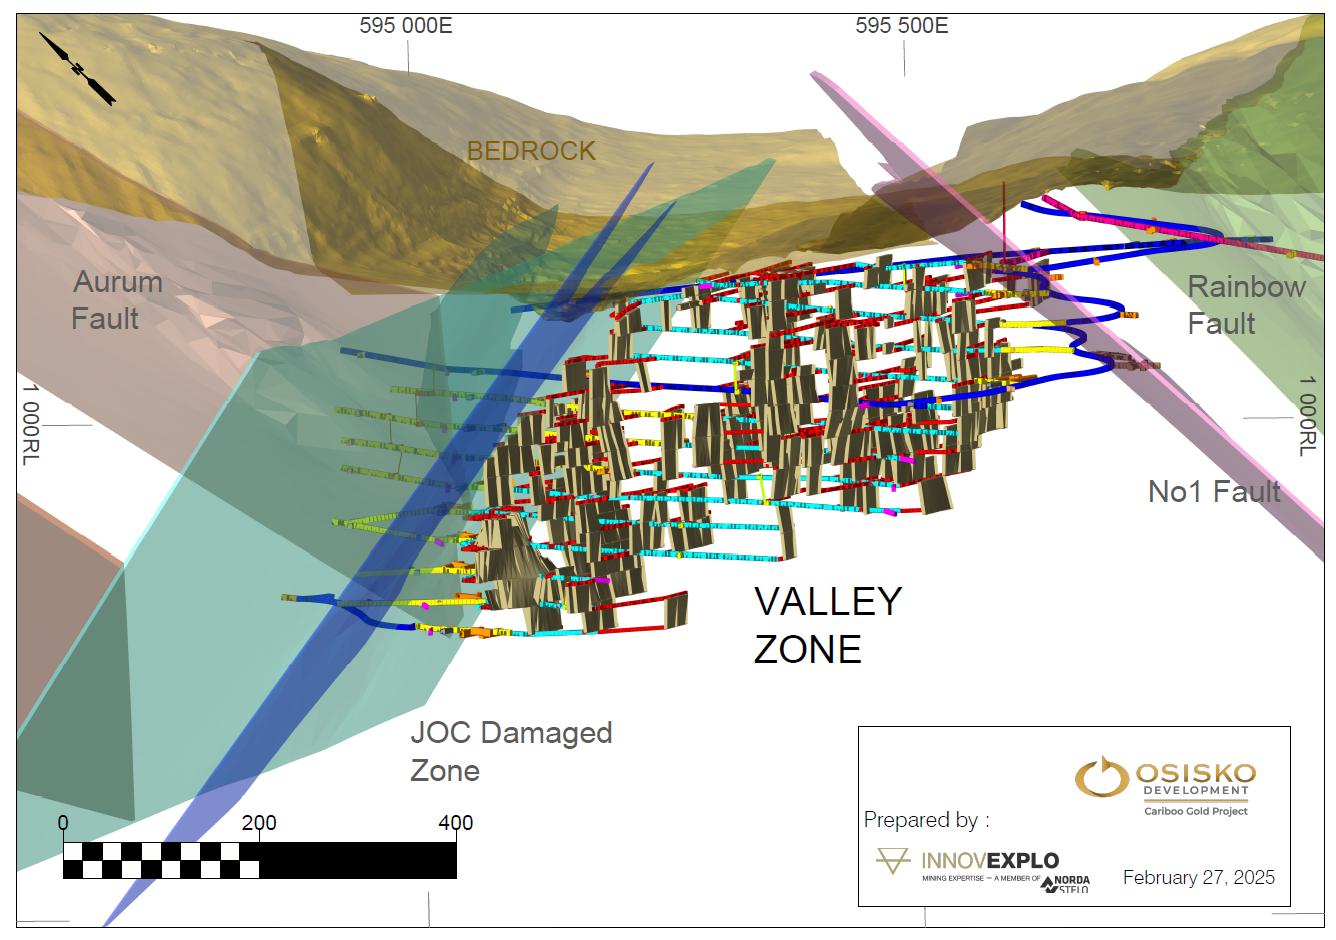
Figure 16-16: View of Valley
Zone showing traversing fault structures, looking north
| |
Osisko Development Corp.
NI 43-101 Technical Report
Feasibility Study for the Cariboo Gold Project |
|
The
Cow Zone comprises 13 levels, ranging from level 1050 to level 1410, spaced at 30 m intervals (floor-to-floor), extending to an approximate
elevation of 1,050 metres above msl. The zone spans nearly 1 km along strike, with an average stope width of 4.8 m. Typical
stope lengths along strike average 20 m across all veins. Over the LOM, the Cow Zone is projected to contribute approximately 4.0
Mt of ore at an average grade of 3.35 g/t Au. A longitudinal section of the zone is presented in Figure 16-17.
The
levels are intersected by four distinct faults striking offset by about 25 to 35 degrees from the zone axis as shown in Figure 16-18.
The No. 1 Fault cuts across the northwest corner of the zone, intersecting the six lower levels of Cow North and creating the least
amount of contact out of the four traversing faults. The Lowhee Fault, Sanders Fault, and Rainbow Fault cut across most of the zone and
access ramp.
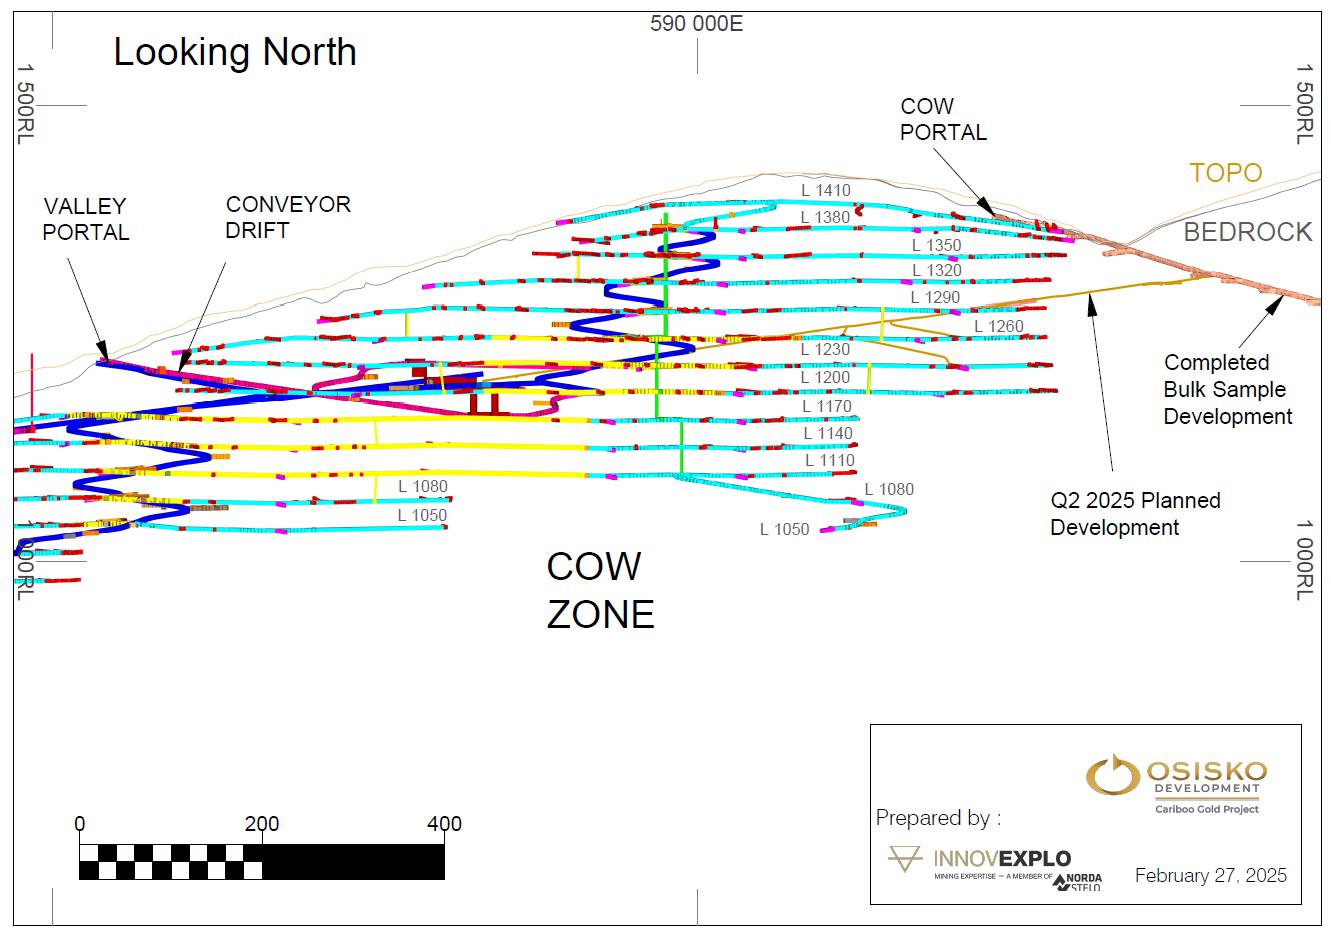
Figure 16-17: Longitudinal
section of Cow Zone looking north
| |
Osisko Development Corp.
NI 43-101 Technical Report
Feasibility Study for the Cariboo Gold Project |
|
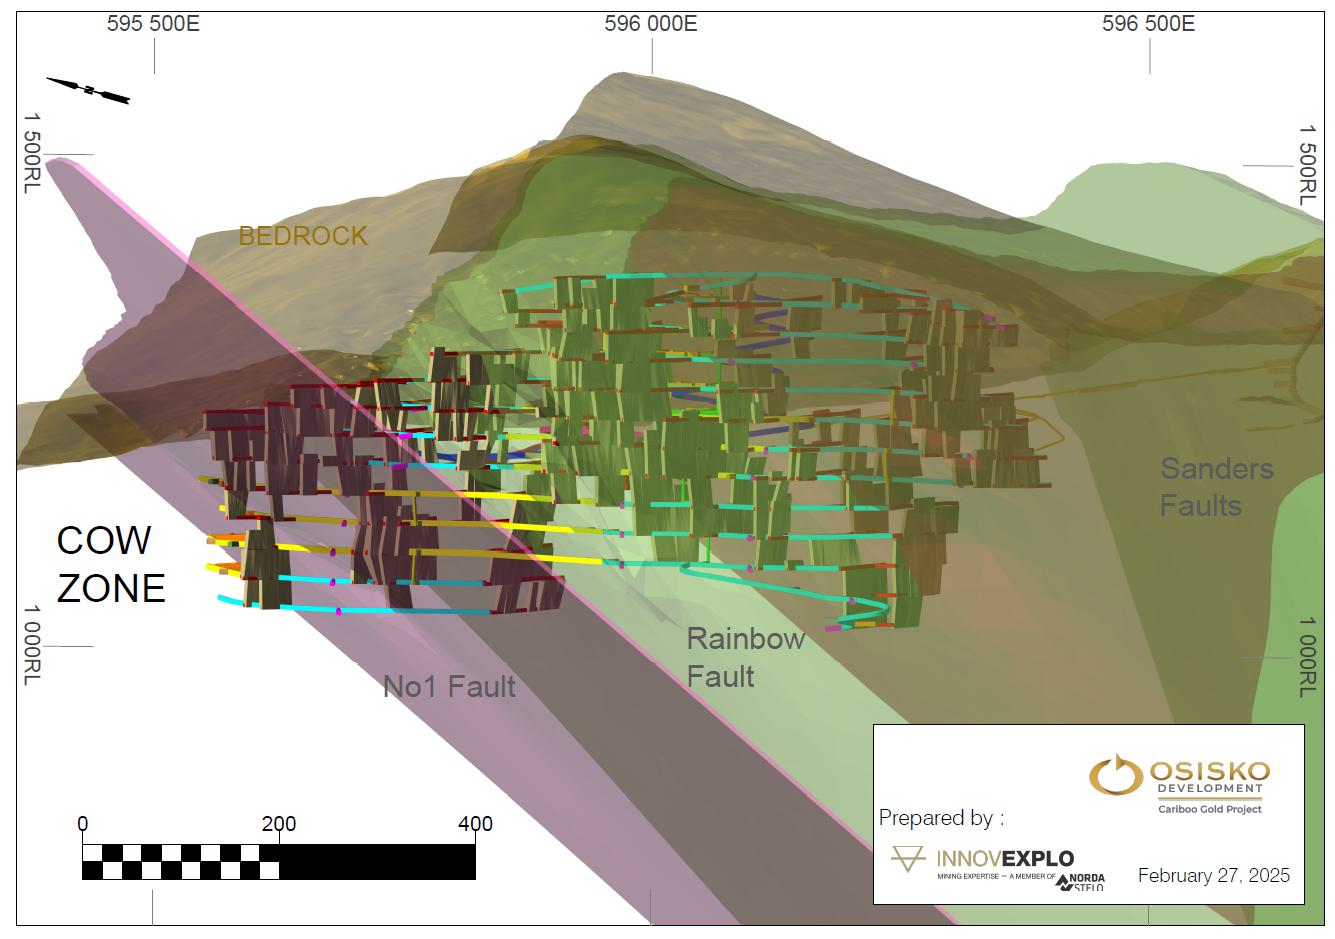
Figure 16-18: Perspective
view of Cow Zone looking northeast showing fault structures
| |
Osisko Development Corp.
NI 43-101 Technical Report
Feasibility Study for the Cariboo Gold Project |
|
The Lowhee Zone encompasses nine levels from level
1200 to level 1440 at 30 m spacing floor-to-floor, to a depth of approximately 1,200 m above msl. The zone spans almost a kilometre
along the strike, with stope widths averaging 4.5 m. The stope length on strike averages 21 m for all veins. The Lowhee Zone is expected
to contribute 0.9 Mt at an average grade of 3.52 g/t to production over the life of mine (Figure 16-19 and Figure 16-20).
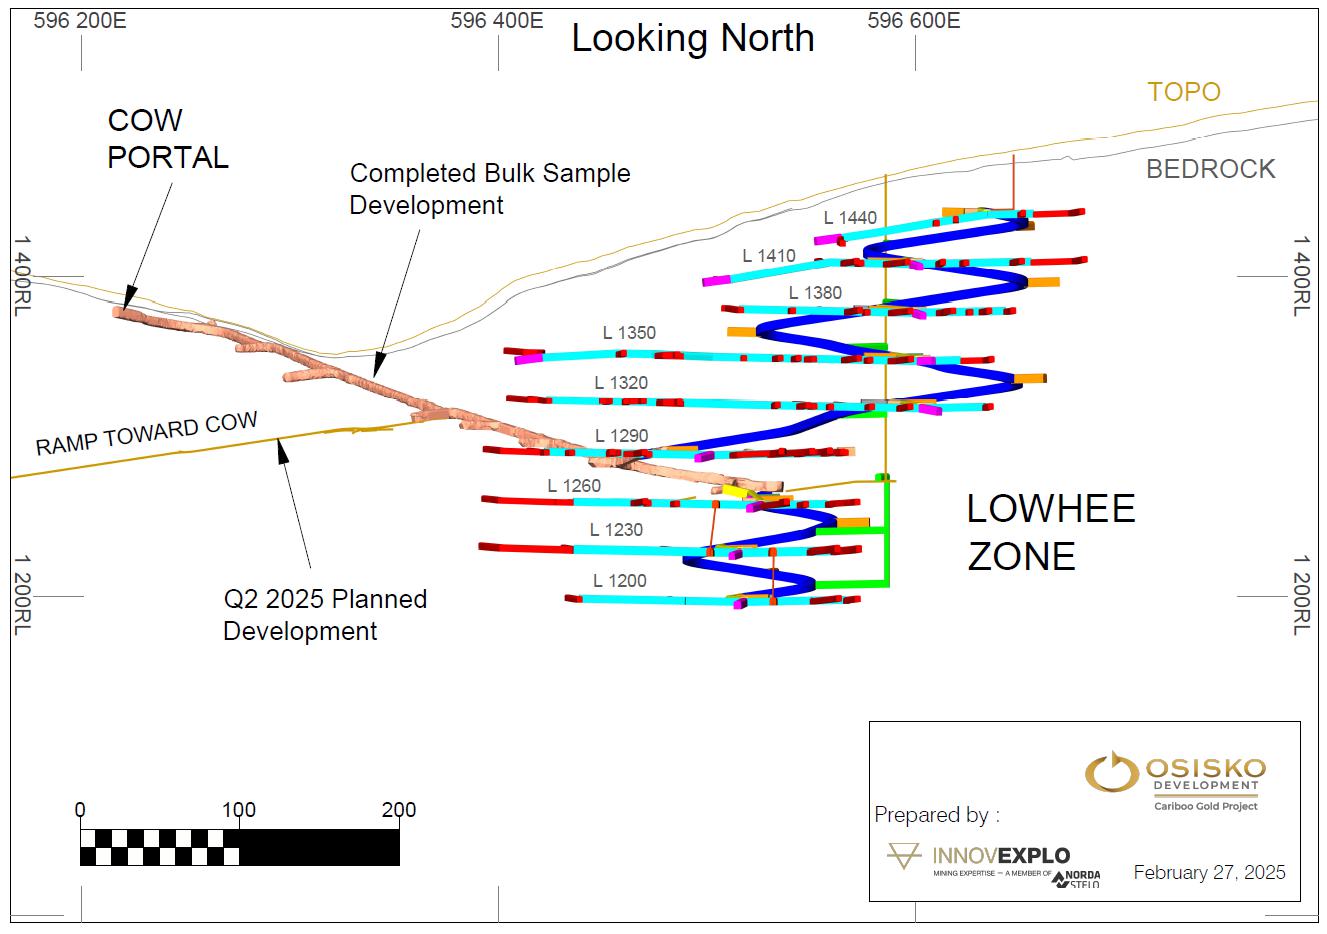
Figure 16-19: Longitudinal
section of Lowhee Zone looking north
| |
Osisko Development Corp.
NI 43-101 Technical Report
Feasibility Study for the Cariboo Gold Project |
|
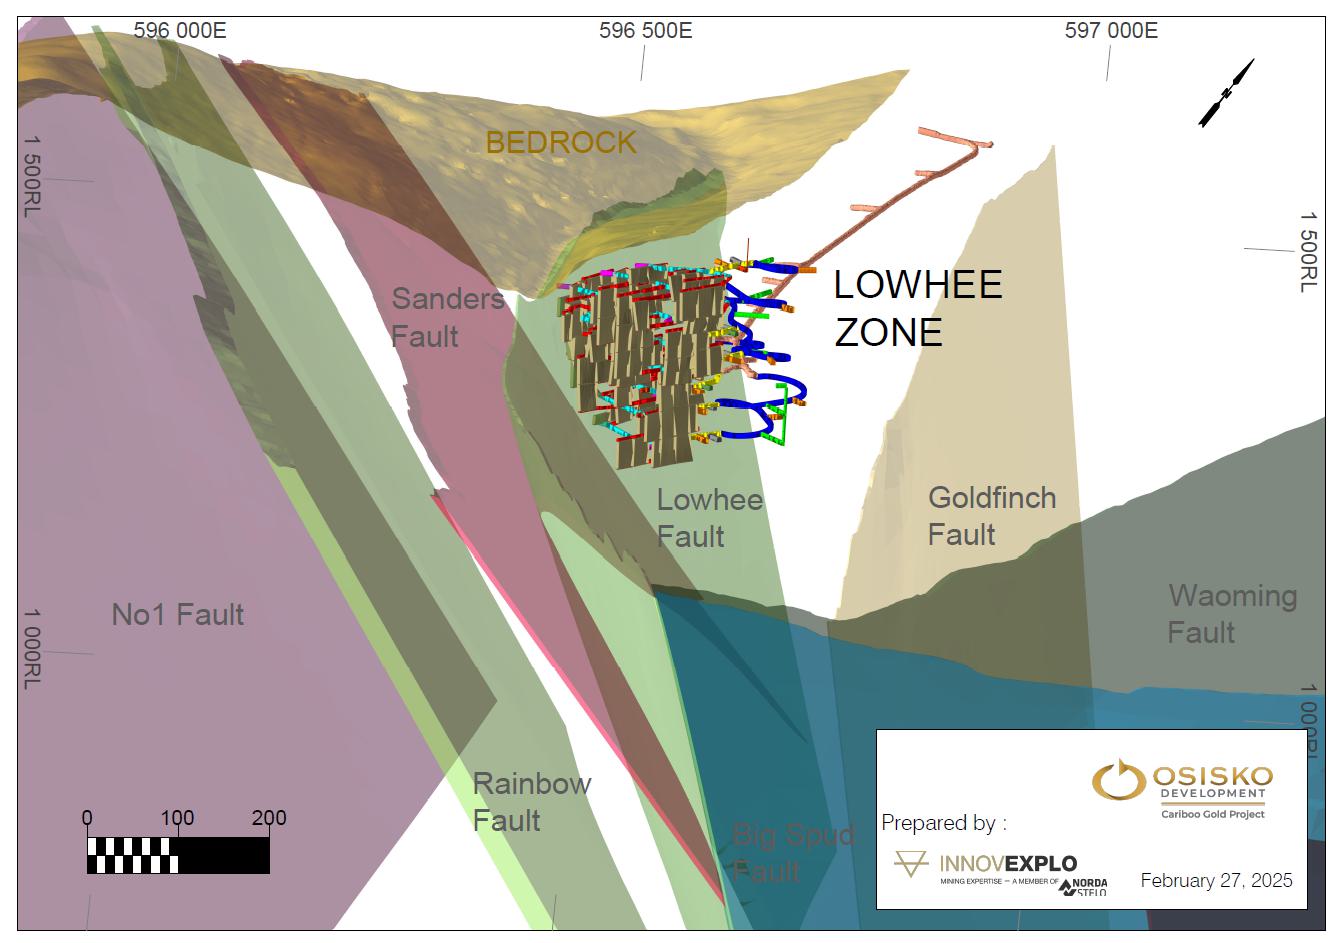
Figure 16-20: Perspective
view of Lowhee Zone looking northeast showing fault structures
| |
Osisko Development Corp.
NI 43-101 Technical Report
Feasibility Study for the Cariboo Gold Project |
|
The Mosquito Zone encompasses eight levels, from
level 1140 to level 1350 at 30 m spacing floor-to-floor, to a depth of approximately 1,140 m above msl. The zone spans over 700 m along
the strike. Stope length on strike averages 17 m for all veins. The Mosquito Zone is expected to contribute 1.1 Mt at an average
grade of 3.94 g/t to production over the life of mine. A longitudinal view of the zone is included in Figure 16-21. The zone is traversed
diagonally along the strike by the Mosquito Fault running northwest to southeast. The fault dips approximately 45 degrees northeast as
shown in Figure 16-22.
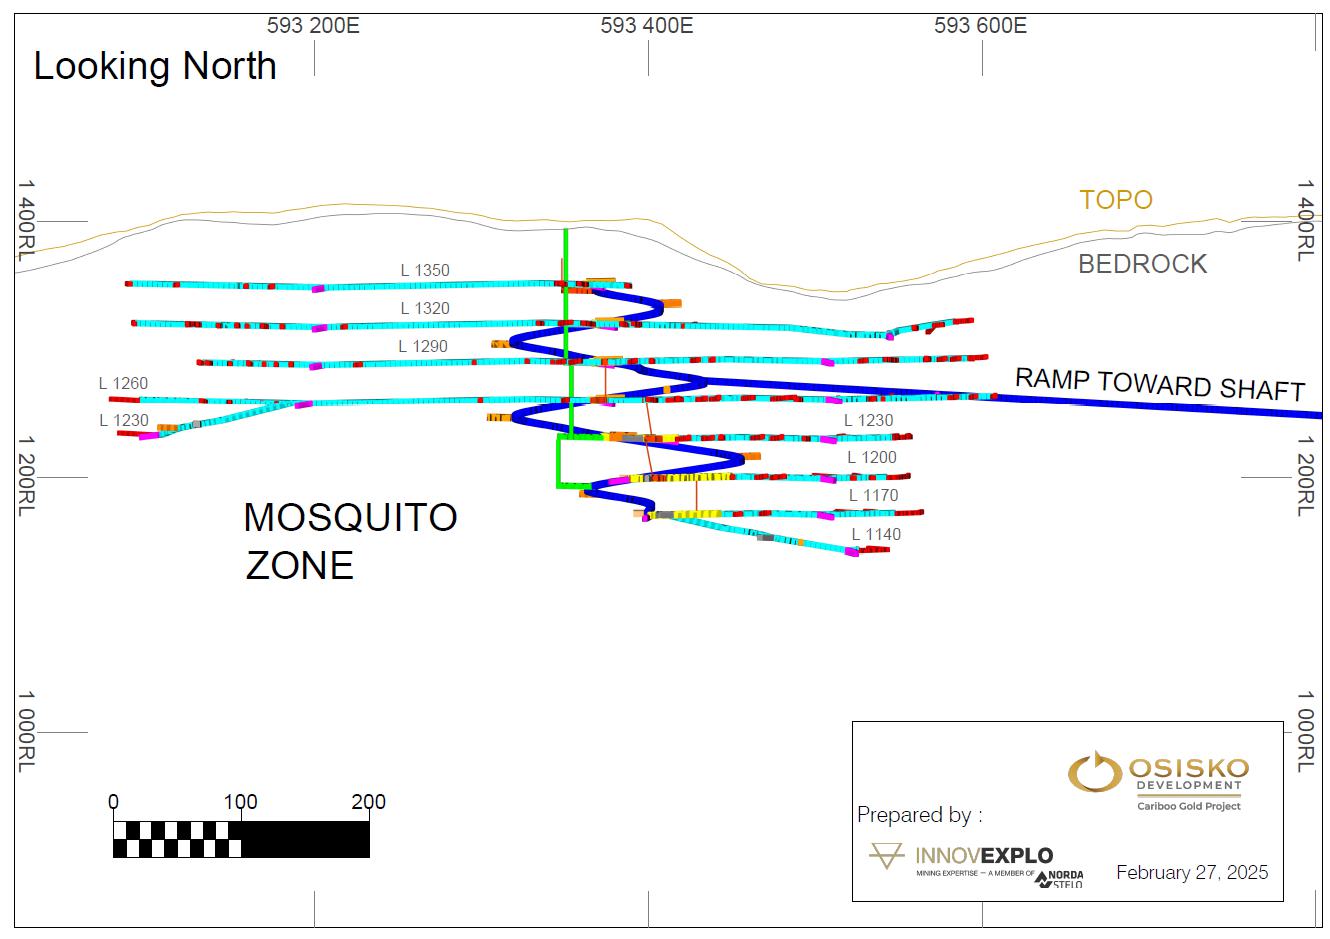
Figure 16-21: Longitudinal
section of Mosquito Zone looking north
| |
Osisko Development Corp.
NI 43-101 Technical Report
Feasibility Study for the Cariboo Gold Project |
|
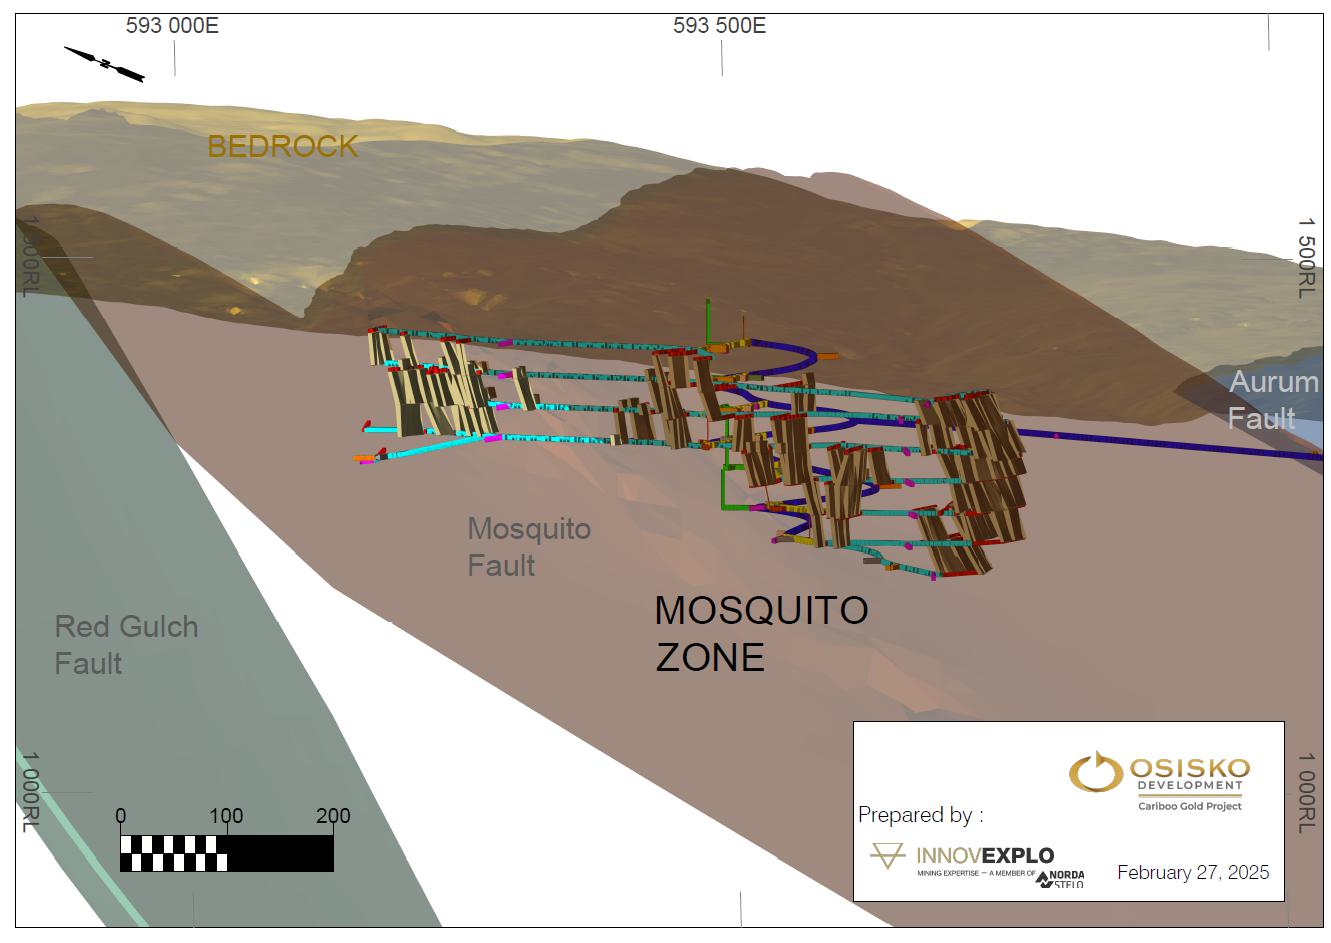
Figure 16-22: Perspective
view of Mosquito Zone looking northeast showing fault structure
| |
Osisko Development Corp.
NI 43-101 Technical Report
Feasibility Study for the Cariboo Gold Project |
|
| 16.5.10 | Mine Dilution and Recovery |
In accordance with the geotechnical guidance developed
by Alius (see Section 16.2), a strategy of under-drilling narrow stopes to experience “internal” dilution within mineralized
zones (sloughage will be mineralized) as part of the “total” dilution will be pursued. External mining dilution has been evaluated
for each zone and considered by adding a specific ELOS distance in metres on the hanging wall and footwall. This strategy can be seen
in Figure 16-23.
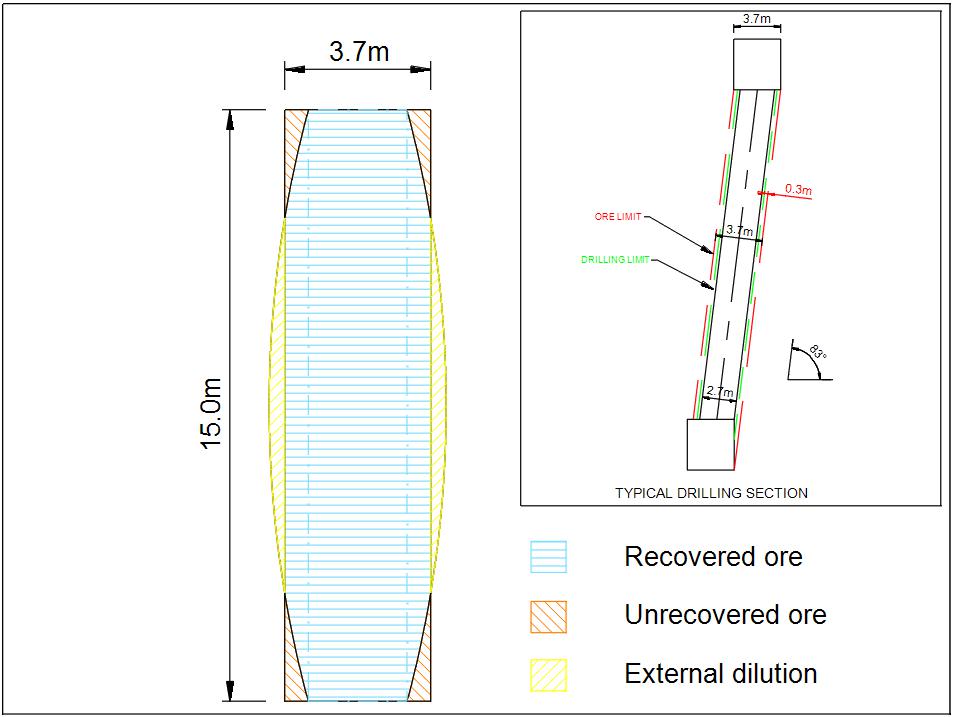
Figure 16-23: Internal
dilution strategy for stopes
| |
Osisko Development Corp.
NI 43-101 Technical Report
Feasibility Study for the Cariboo Gold Project |
|
Mining recovery varies across the different stopes
and is primarily influenced by the width of the mineralized zones. Recovery values have been established based on two principal factors:
| 1. | Ore loss along stope walls, which is associated with the internal dilution strategy illustrated in Figure 16-23. This loss is expressed
as a percentage and varies according to the stope width. Narrower stopes typically result in higher relative ore losses due to the fixed
equipment size and required stope geometries. |
| 2. | A global ore loss factor of 3% has been applied to all stopes to account for draw-related losses during extraction. This includes
potential material loss due to stope wall collapse, backfill interaction, or other operational challenges inherent to the selected mining
method. |
In addition, mining recovery has been further
adjusted for specific stope configurations:
| ¡ | For stopes mined using uphole longhole stoping, recovery has been reduced
in relation to expected drill hole lengths and accuracy. |
| ¡ | Sill stopes have been limited to a maximum height of 20 m, leaving a 10 m
sill pillar between levels to ensure geotechnical stability. |
| ¡ | For stopes utilizing the two-pass variant of longitudinal longhole stoping
(commonly referred to as the "Doyon method") included in Geotechnical Class 4, an additional 15% recovery loss has been
applied. This adjustment reflects geotechnical recommendations provided by Alius and considers potential paste infiltration through the
ore muck prior to the second mucking pass, which may result in material losses due to fill-related limitations. |
These recovery assumptions are consistent with
observed performance in similar mining environments and have been used to define mineable tonnage for the Project.
The Project requires approximately 179 km
of development, including 2.78 km of vertical development. Of this development, 106 km will be operational and distributed within
the strike of the different veins of all zones and 73 km will be capitalized to sustain the production all along the Project. Overall
waste lateral development metres by zone are shown in Table 16-15, as well as the lateral development metres occurring in material
above cut-off grade shown in Table 16-16.
| |
Osisko Development Corp.
NI 43-101 Technical Report
Feasibility Study for the Cariboo Gold Project |
|
Table 16-15: Lateral development
of waste by zone
| Zone |
Metres |
Tonnes |
| Cow |
29,001 |
1,832,099 |
| Valley |
25,393 |
1,606,982 |
| Shaft |
54,448 |
3,388,985 |
| Mosquito |
10,267 |
686,843 |
| Lowhee |
7,616 |
499,698 |
| Total |
126,725 |
8,014,607 |
Table 16-16: Summary of
total lateral development in ore
| Zone |
Metres |
Tonnes |
g/t
Au |
| Cow |
13,674 |
562,098 |
3.85 |
| Valley |
8,800 |
358,328 |
3.82 |
| Shaft |
24,196 |
1,014,756 |
4.20 |
| Mosquito |
3,052 |
124,605 |
4.41 |
| Lowhee |
2,982 |
122,715 |
4.09 |
| Total |
52,703 |
2,182,502 |
4.05 |
The
Project has approximately 17.8 Mt of ore. Of this material, approximately 15.6 Mt are from long hole production. The production distribution
is illustrated in Table 16-17.
Table 16-17: Summary of
total recovered production tonnes by zone
| Zone |
Tonnes |
g/t
Au |
| Cow |
3,437,874 |
3.27 |
| Valley |
2,880,308 |
3.57 |
| Shaft |
7,533,539 |
3.65 |
| Mosquito |
980,765 |
3.88 |
| Lowhee |
800,447 |
3.43 |
| Total |
15,632,933 |
3.55 |
| |
Osisko Development Corp.
NI 43-101 Technical Report
Feasibility Study for the Cariboo Gold Project |
|
| 16.6 | Underground Material Handling |
A fleet of 51 t trucks and 10 t LHD will
handle ore and waste rock material from stopes and development headings to surface. A truck loading station will be established on each
level to facilitate material storage and transfer.
Production from Mosquito, Shaft zones and the
lower part of Valley Zone will be trucked to the Shaft rock breaker station on level 1080. From there, a truck will haul ore on the Cariboo
ramp to the underground crushing facilities. The upper part of Valley and Cow ore zones will be hauled directly to the crushing facilities.
Figure 16-24 illustrates the underground ore handing for the production. The crushing facilities will be described in the following
subsection.
The concentration process, which is detailed in
Chapter 17, will consist of an ore sorter that will generate waste. The waste generated will be redirected underground through to a waste
pass inside the treatment plant from surface down to level 1170 at proximity of the Cariboo ramp. Finally, a fleet of 51 t trucks will
haul the waste to the WRSF. Figure 16-24 shows the ore and waste handling flow of the Project.
| |
Osisko Development Corp.
NI 43-101 Technical Report
Feasibility Study for the Cariboo Gold Project |
|
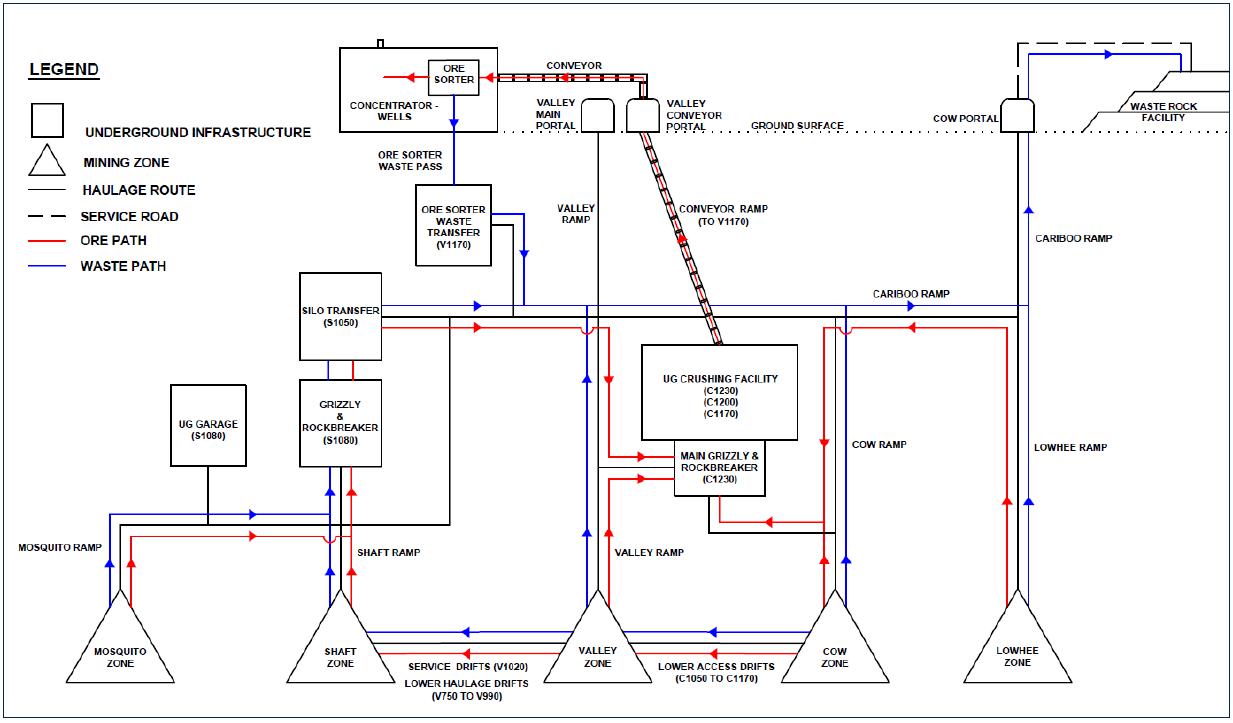
Figure 16-24: Ore and waste
handling flowsheet
| |
Osisko Development Corp.
NI 43-101 Technical Report
Feasibility Study for the Cariboo Gold Project |
|
| 16.6.1 | Material Handling Infrastructure |
The haulage distances between zones and crushing
facilities are long, and autonomous truck haulage will be used. Ore passes will store the feed for the crushing circuit. This system is
designed to convey a nominal capacity of 4,900 tpd of ore to the long-distance belt conveyor. The infrastructure required to support the
processing rate, and the overall material handling includes, but is not limited to:
| ¡ | Grizzly and rock breaker station; |
| ¡ | Mineralized material silos; |
| ¡ | Mineralized material chutes; |
| ¡ | Belt magnet and belt scale; |
| ¡ | Electrical distribution and communication; |
| ¡ | One primary fixed jaw crusher; |
| ¡ | One secondary fixed jaw crusher; |
| ¡ | One long distance conveyor belt. |
Figure 16-25 illustrates the flowsheet of
the underground crushing systems.
| |
Osisko Development Corp.
NI 43-101 Technical Report
Feasibility Study for the Cariboo Gold Project |
|
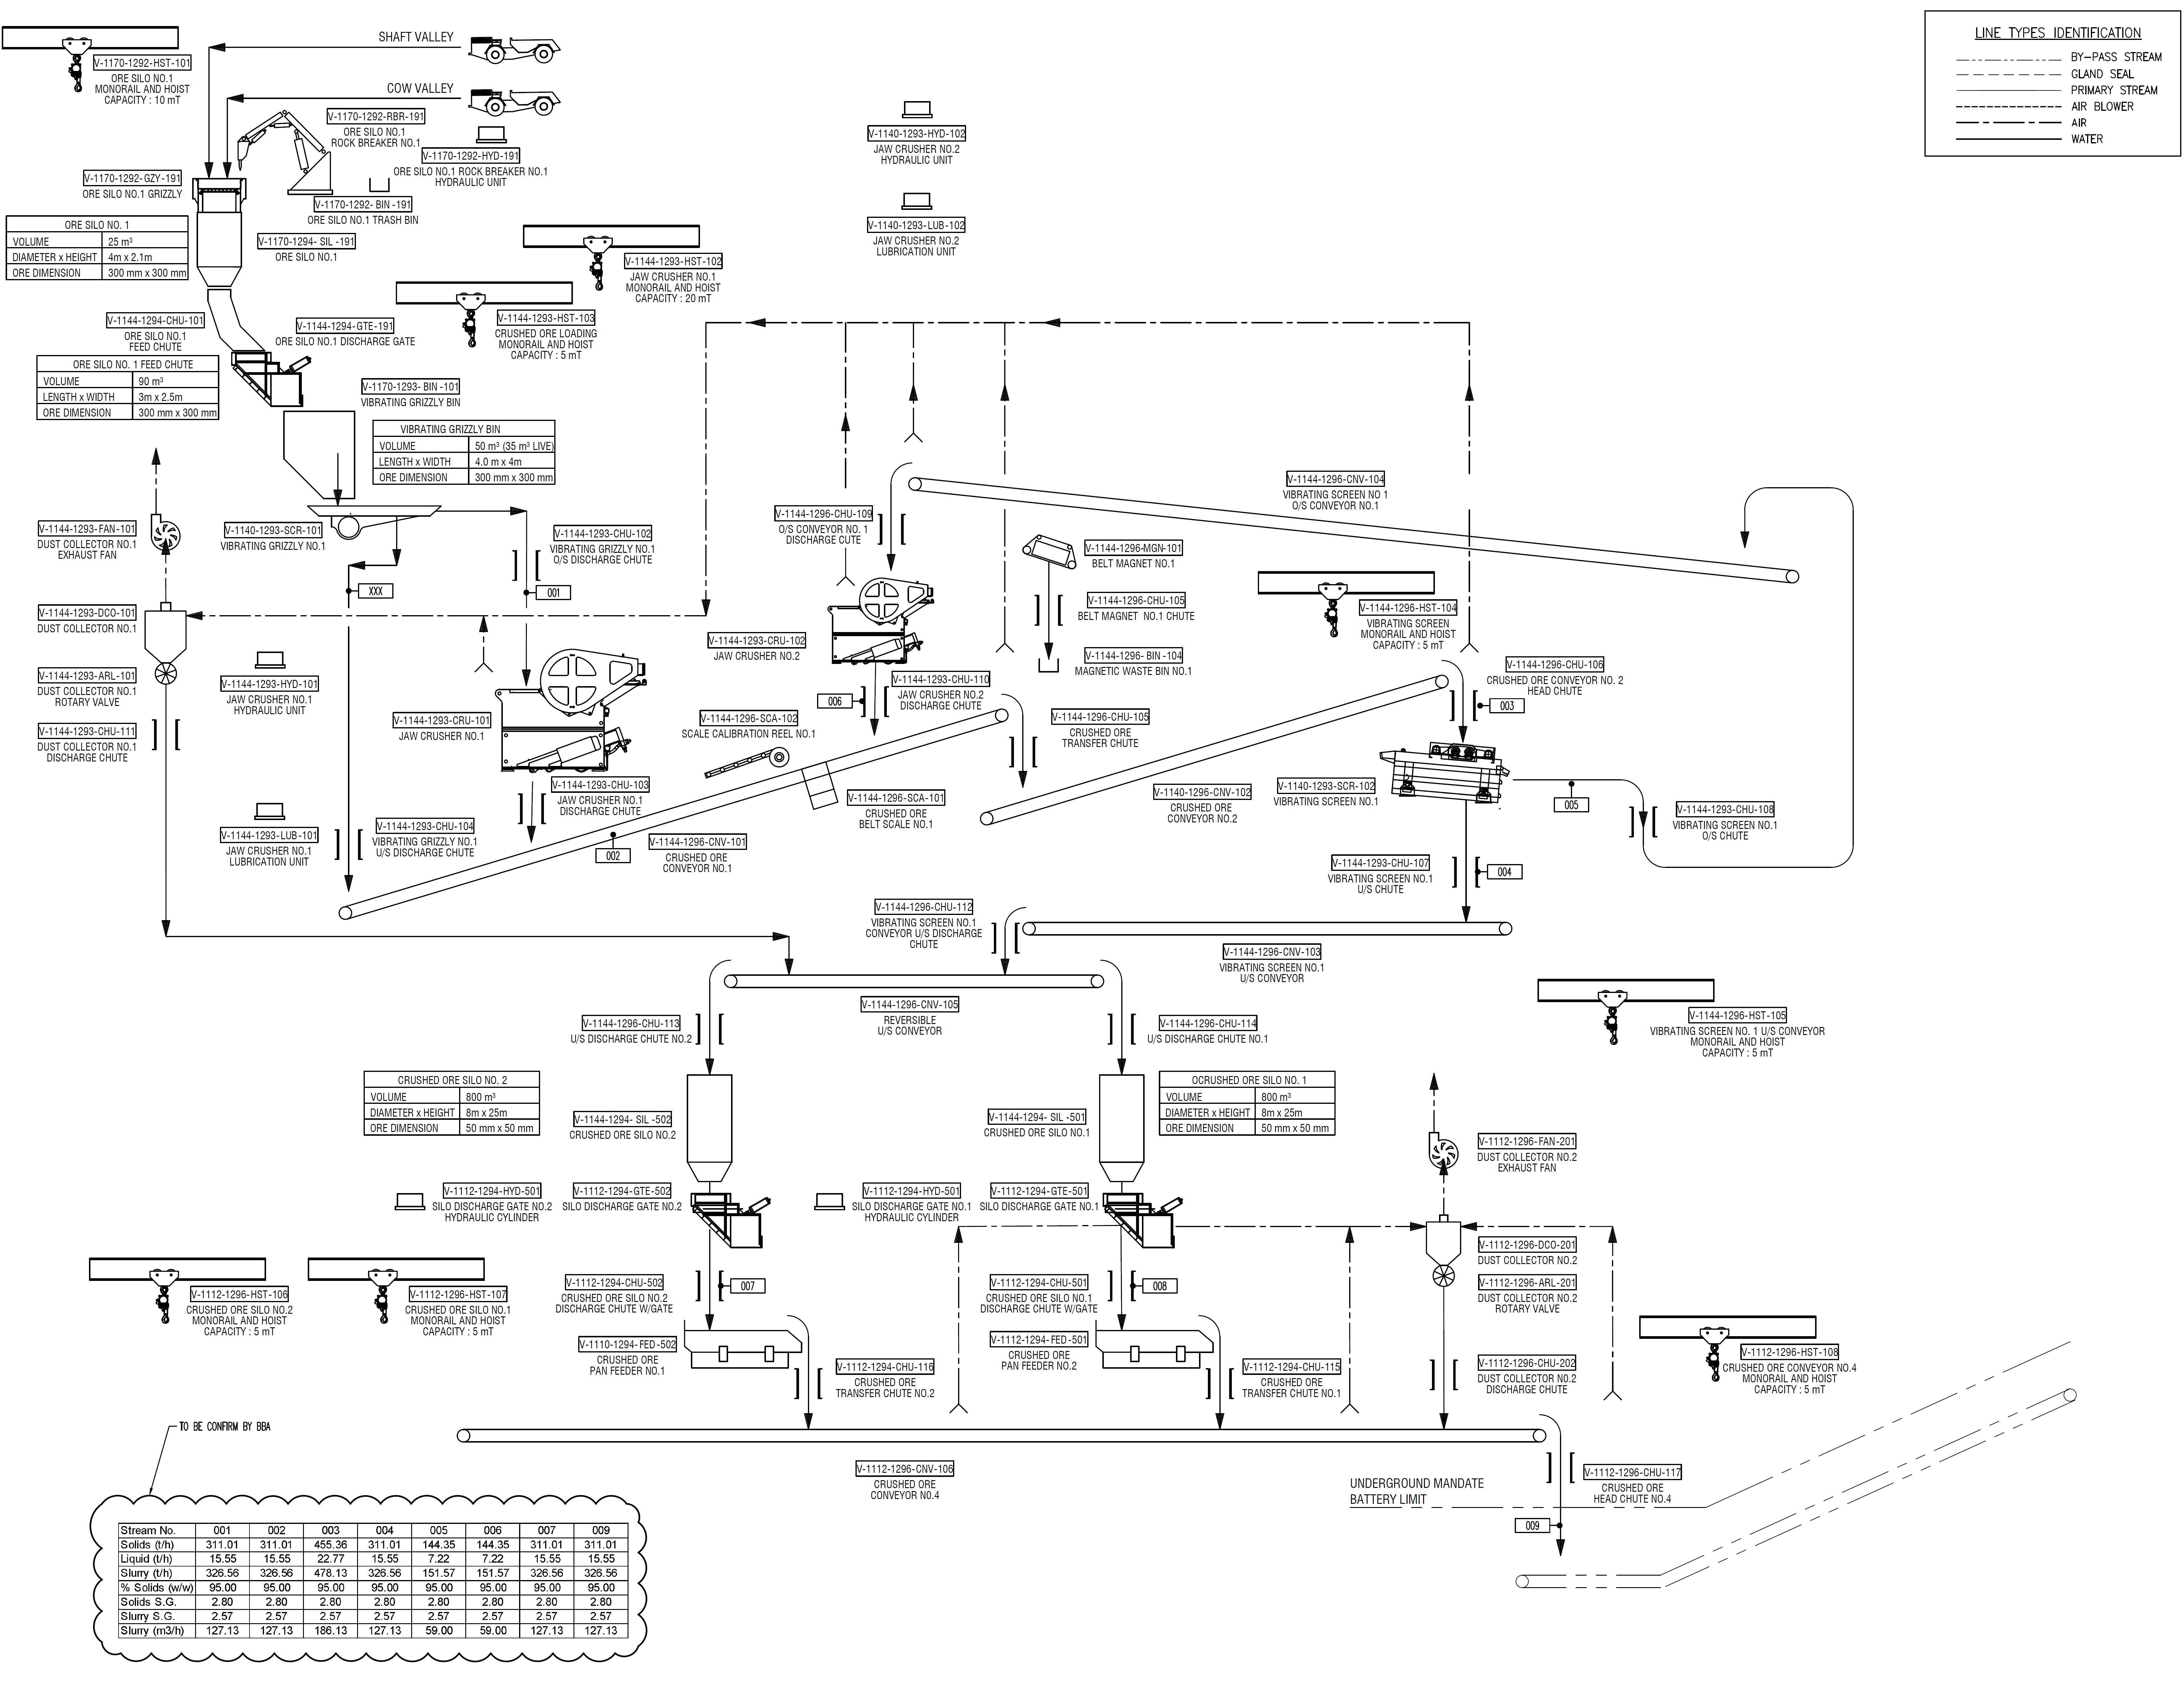
Figure 16-25: Underground
crushing facilities flowsheet
| |
Osisko Development Corp.
NI 43-101 Technical Report
Feasibility Study for the Cariboo Gold Project |
|
Waste generated from the surface sorting process
will be returned underground via a waste pass. This material will then be hauled either to stopes for backfilling or to the Bonanza Ledge
WRSF using the fleet of 51 t trucks. Figure 16-26 provides an elevation view of the underground crushing facilities.
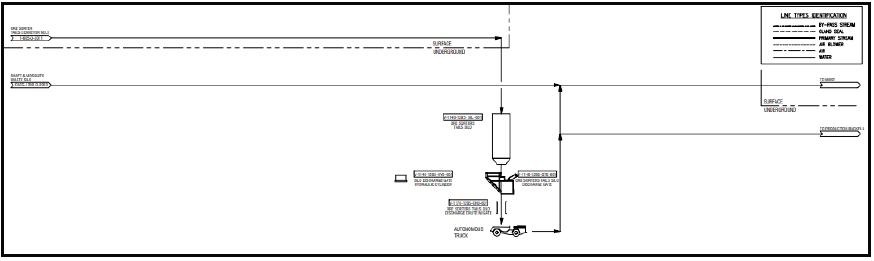
Figure 16-26: Underground
waste circuit flowsheet
| |
Osisko Development Corp.
NI 43-101 Technical Report
Feasibility Study for the Cariboo Gold Project |
|
| 16.6.2 | Grizzly and Rock Breaker Stations |
The material handling infrastructure includes
grizzly and rock breaker stations with a capacity of 4,900 tpd. A 4 m diameter ore silo under the grizzly will feed the fixed jaw
crusher on the lower level. The grizzly and the rock breaker station will handle ore from both Shaft, Cow and Valley.
The grizzly and the rock breaker station are designed
for simultaneously dumping two trucks. The grizzly openings have dimensions of 300 mm x 300 mm. The station is equipped with a hydraulic
hammer designed to provide a full coverage of the grizzly. An operator cabin will be installed to ensure a clear, unobstructed view of
the entire grizzly, as shown in Figure 16-27.
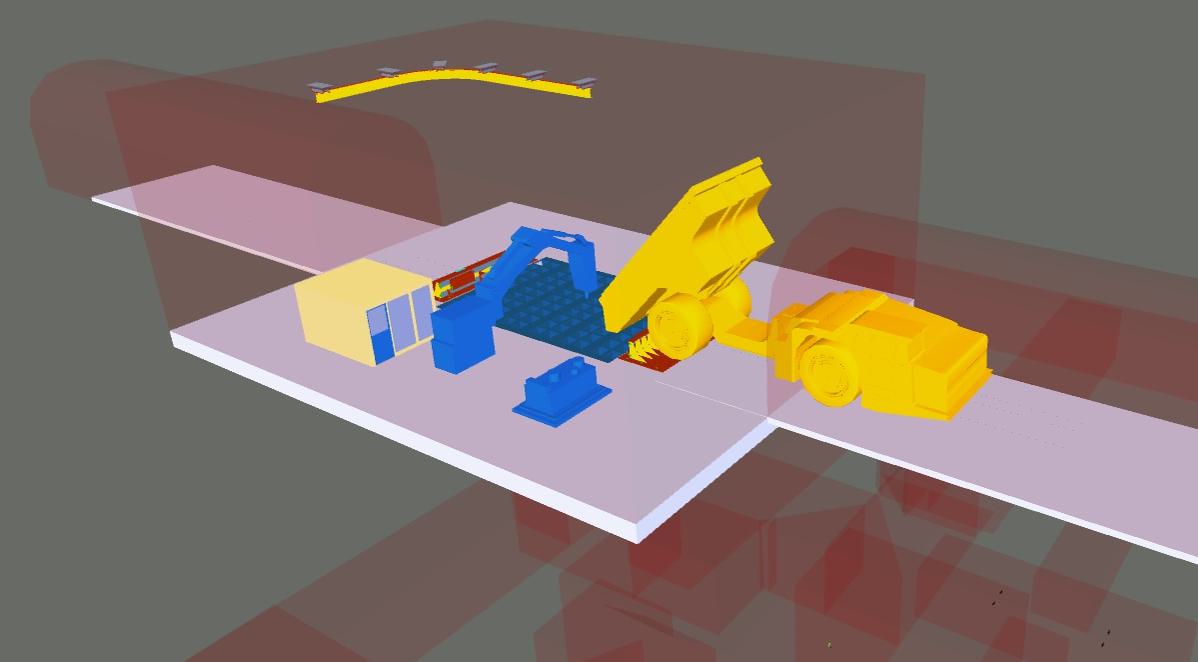
Figure 16-27: Underground
grizzly and rock breaker station
The rock breaker power unit is fed by a 600 volt
(“V”) power cable from the crusher electrical substation via boreholes. All electrical and control equipment will be in the
workplace. The local loads are fed from a 400 ampere (“A”) distribution panel. The electrical loads in the area will
be comprised of lighting, welding plugs and 120 V outlets. The programmable logic controller (“PLC”) control system has
a local human-machine interface (“HMI”), instrumentation, and fibre optic communication. A radar level transmitter provides
the actual level of mineralized material to the control system and operator. The communication infrastructure will provide sufficient
bandwidth to enable remote teleoperation and fully autonomous operation of the rock breaker.
| |
Osisko Development Corp.
NI 43-101 Technical Report
Feasibility Study for the Cariboo Gold Project |
|
The ore crushing system consists of a primary
crushing station, followed by ore classification using a vibrating screen. Oversized ore is processed through a closed-circuit secondary
crushing system to achieve further size reduction. Ore of the desired size is then transferred to the crushed ore silos, which are connected
to the loading station. Figure 16-28 shows the crushing system circuit.
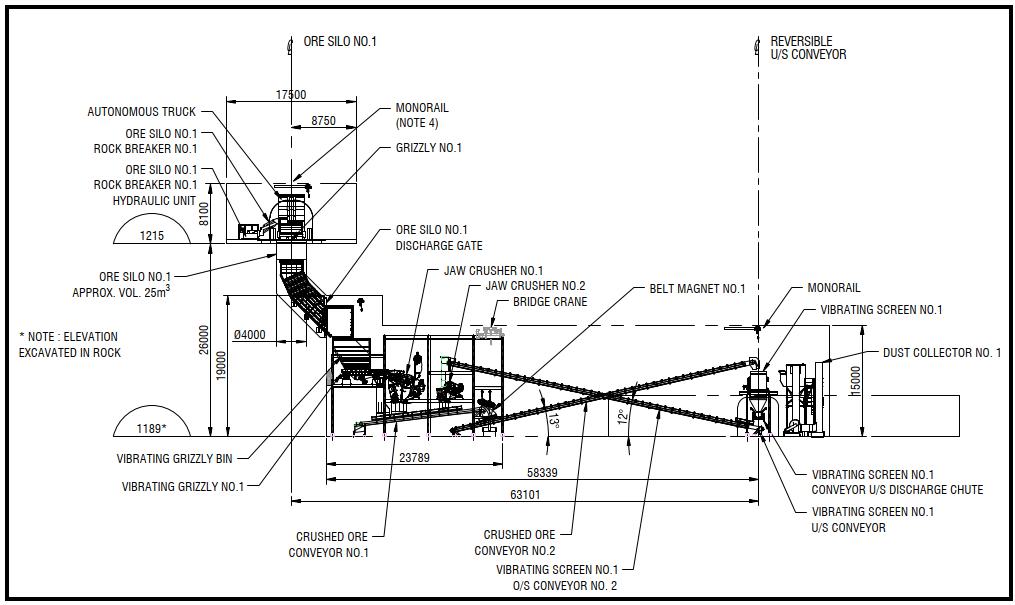
Figure 16-28: Underground
crushing system circuit
The ore is fed by a chute located below the ore
silo and ahead of the comminution circuits. A steel collar with a “finger” is planned downstream to the choke gate to prevent
premature wear of the press frame. The choke gates control the flow rate from the ore silo to the vibrating grizzly bin.
| |
Osisko Development Corp.
NI 43-101 Technical Report
Feasibility Study for the Cariboo Gold Project |
|
| 16.6.5 | Primary Crusher Station |
The Primary Crusher is a Jaw Crusher designed
to reduce ore to a size less than 100 mm. The system is designed for 284 tonnes per hour (“tph”) to achieve an average daily
production of 4,900 tpd. The planned crusher utilization rate is 75% for a 24 h/day operation.
The crushed material is discharged onto a crushed
ore conveyor that delivers it to the vibrating screen decks. The material passes under a belt magnet to remove tramp steel before reaching
the vibrating screen deck.
After passing through the primary crushing station,
the ore enters a closed-circuit system, as shown in Figure 16-29. A vibrating multi-deck screen separates the mineralized material
into oversized (“O/S”) and undersized (“U/S”) fractions. The U/S fraction discharges into the top of the vibrating
screen U/S conveyor. The O/S stream is conveyed from the vibrating screen through the vibrating screen O/S conveyor to the secondary crusher
for further size reduction. The O/S stream flow is shown in Figure 16-29.
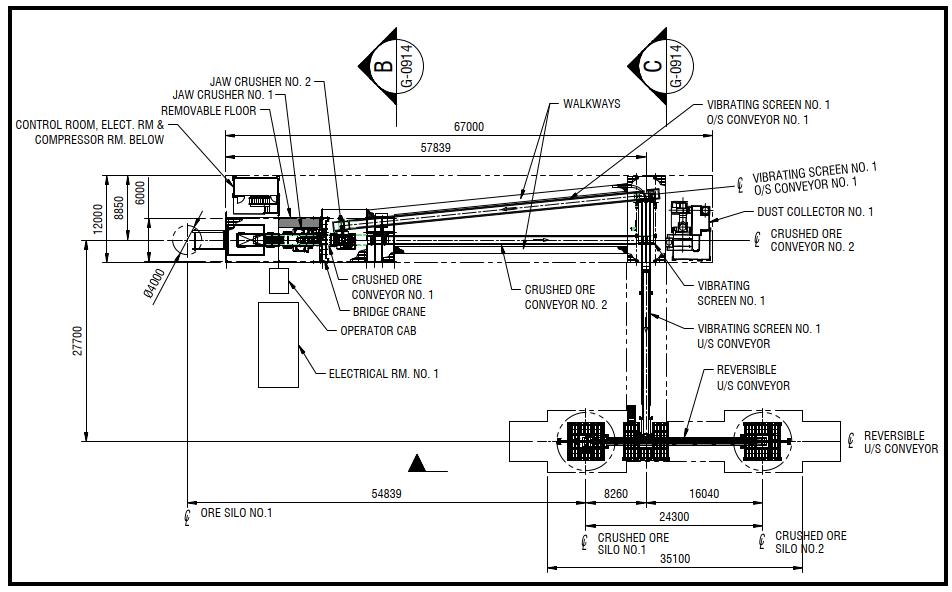
Figure 16-29:
Plan view underground closed loop crushing station
| |
Osisko Development Corp.
NI 43-101 Technical Report
Feasibility Study for the Cariboo Gold Project |
|
| 16.6.7 | Secondary Crushing Station |
The secondary crushing station includes a fixed
jaw crusher, reducing the material size to 22 mm or less. The secondary crusher products discharge onto the crushed ore conveyor
and undergo further size reduction at the vibrating screen station.
Once the required size reduction is achieved via
the primary and secondary crushing systems, the material is conveyed on a reversible conveyor feeding two 8 m diameter crushed ore
silos.
From the Crushed Ore Silos, ore is transferred
to the loading circuit, which feeds a conveyor long-distance belt connected to the surface plant. Figure 16-30 illustrates the Crushed
Ore Conveyor discharging onto the long-distance belt conveyor.
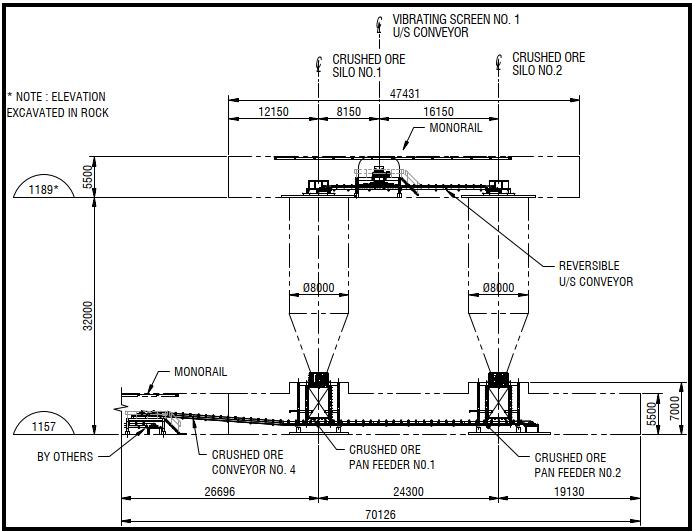
Figure 16-30: Underground
loading station
| |
Osisko Development Corp.
NI 43-101 Technical Report
Feasibility Study for the Cariboo Gold Project |
|
| 16.6.10 | Chutes Under the Silos |
Chutes under the crushed ore silos will feed a
conveyor that transfers the material to a transfer point, as illustrated in Figure 16-31. A steel collar will be installed at the
bottom of each silo.
The press frame gate controls the material flow
rate from the silo to the vibrating pan feeder. The vibrating pan feeder controls the feed rate onto the crushed ore conveyor. A trolley
and a hoist will be available at the location of the chutes for maintenance.
| 16.6.11 | Transfer Point and Transfer Conveyor |
As illustrated in Figure 16-31, the material
on the crushed ore conveyor will be fed onto the long-distance belt conveyor at the transfer point.
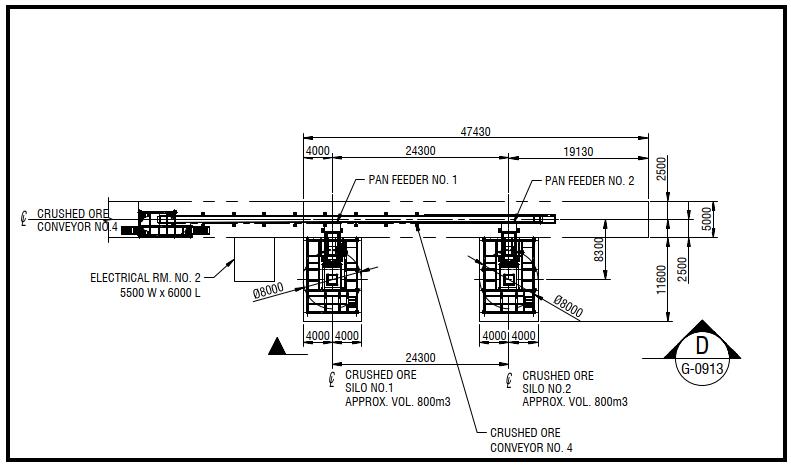
Figure 16-31: Transfer
point and transfer conveyor plan view
Dust Collection and suction points will be strategically
located along the system to effectively limit airborne dust contaminants and maintain a clean and safe working environment.
| |
Osisko Development Corp.
NI 43-101 Technical Report
Feasibility Study for the Cariboo Gold Project |
|
| 16.6.13 | Crushing Control System |
The crushing system can be operated either manually
(start- stop) or remotely in automated mode. The underground crushing system will be integrated into the mine’s main automated network,
allowing seamless communication and control across the entire operation.
| 16.6.14 | Underground Waste Truck Chute |
The truck chute is located at the bottom of the
waste silo and is used to load trucks that transport waste from underground to WRSF for final disposal. Figure 16-32 shows the general
arrangement at the bottom of the waste silo.
The truck chute will reduce the need for an LHD
to load trucks, thereby increasing waste haulage efficiency. The chute’s flow is regulated by a press frame with an arc gate. The
press frame is mounted on the excavation roof to provide easy access to the loading station.
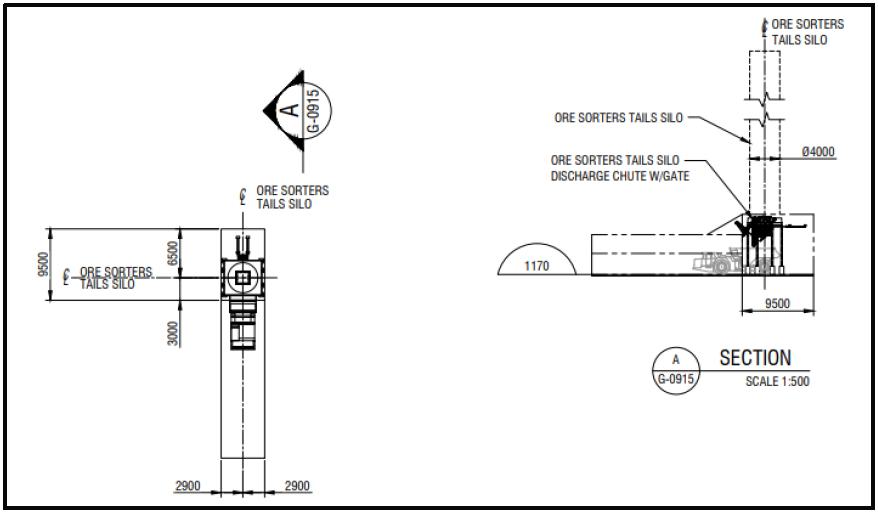
Figure 16-32: Underground
ore sorter waste truck chute
| |
Osisko Development Corp.
NI 43-101 Technical Report
Feasibility Study for the Cariboo Gold Project |
|
The waste chute is powered by a 600 V power pack
from the local substation. The electrical loads in the area include lighting, welding plugs, and 120 V outlets. A PLC-based control system
will be integrated with local HMI communication through fibre optic cables and instrumentation. The HMI provides the truck operator with
essential information, enabling efficient chute control and ensuring smooth operations.
| 16.6.15 | Underground Crushing Electrical Distribution and Communication |
A 13.8 kV feeder and a fibre optic communication
cable will be required. Communication between the process plant and the underground ore handling system is required to avoid spillage
along the entire crushing network. It is assumed that a 13.8 kV feeder cable and a fibre optic cable will be extended to the first of
the two electrical rooms.
The first electrical room will be located at level
1189 near the control room, jaw crushers, conveyors, and other equipment. It will be equipped with a 600 A, 13.8 kV Load Break
Switch, 2 MVA, 13.8 kV to 600 V transformer, a 600 V distribution panel, a 600 V motor control centre (“MCC”),
a 120/208 V distribution panel, a PLC cabinet, a communication cabinet, and a small UPS. Refer to Section 16.6.6 (Sizing Station)
for the for the location of Electrical Room No. 1.
The second electrical room will be located at
the bottom of the two crushed ore silos at level 1157 and will be fed from the first one at 600 V. A fibre optic communication cable
will also be extended from the first electrical substation. The second electrical room will be equipped with a 600 V MCC, a 120/208 V
distribution panel, a remote input/output (“I/O”) cabinet and a communication cabinet. Refer to Transfer Point and Transfer
Conveyor section for the location of Electrical Room No. 2.
The control room will be equipped with two human-machine
interface computers.
The two electrical substations and control rooms
will provide the required electrical infrastructure to support the ore handling system and the communication system between the process
plant and the underground crushing facilities.
General lighting, 600 V Welding outlets and
120 V service outlets will be available around the equipment to facilitate operations and maintenance.
A provision for instrumentation has been included
in the estimate. Each chute or silo will have a high/low level. All equipment feeding the conveyors will be equipped with side travel,
speed, and emergency pull cord switches. Cameras will allow the operators to view the equipment in operation remotely.
| |
Osisko Development Corp.
NI 43-101 Technical Report
Feasibility Study for the Cariboo Gold Project |
|
| 16.6.16 | Fire Detection and Suppression |
Fire protection and suppression systems will be
installed at critical points, such as at the head and tail pulleys of each conveyor and in the crushing station. The fire protection system
will be integrated with the main automated control system. In the event of an emergency, the fire protection system can be manually operated.
The design of the UDS is directly influenced by
the locations of the paste plant and the booster stations. A booster station is used when greater than 120 bar of pumping pressure
is required to deliver paste to the target stope locations. As a part of this analysis, a hydraulic flow model was developed by WSP to
examine the paste distribution to following underground zones; Mosquito, Shaft, Valley, Cow, and Lowhee. The flow model examined seven
scenarios that covered the entirety of the target paste delivery zones and analyzed the achievable delivery extents of some of the high-pressure
levels. The UDS has been aligned with the surface paste plant design. It is noted that there is no tailings storage facility (“TSF”)
on surface, therefore all tailings will report to underground. As the mill is designed to operate 24 hours per day, the tailings will
be pumped underground continuously.
| 16.7.1 | Underground Distribution System Design Criteria and Mass Balance |
The design is based on T Engineering’s
laboratory rheology test work and the information provided by ODV from the 2023 FS (Hardie et al., 2023). Table 16-18 and Table 16-19
show the design parameters used for the backfill strategy.
Table 16-18: Underground
distribution system design criteria
| Parameter |
Value |
Unit |
Source |
|
Flow Model Design Inputs:
Pipe Friction (Roughness)
■ Carbon
Steel:
■ Target
Velocities:
■ Friction
Calculation:
■ Friction
Safety Factor:
■ Flow
Rate: |
5.08E-05
0.8– 1.25
Empirical
10
100 |
m
m/s
-
%
m3/h |
PMID – Typical Design Properties |
|
Paste Plant Pumping System
Station Piping:
■ Type/Specification:
■ Pipe
SYMS:
■ Size: |
ASTM A106 GR. B, SCH 80, Class 1500
240
200 |
-
mPa
DN - nom |
PMID, Proposed |
| |
Osisko Development Corp.
NI 43-101 Technical Report
Feasibility Study for the Cariboo Gold Project |
|
| Parameter |
Value |
Unit |
Source |
|
Mosquito Booster Pumping System
Station Piping:
■ Type/Specification:
■ Pipe
SYMS:
■ Size: |
ASTM A106 GR. B, SCH 80, Class 1500
240
200 |
-
mPa
DN - nom |
PMID, Proposed |
|
Lowhee Booster Pumping System
Station Piping:
■ Type/Specification:
■ Pipe
SYMS:
■ Size: |
ASTM A106 GR. B, SCH 80, Class 1500
240
200 |
-
mPa
DN - nom |
PMID, Proposed |
Table 16-19: Mass balance
| Description |
Unit |
Material |
178
mm
Slump (7") |
203
mm
Slump (8") |
229
mm
Slump (9") |
254
mm
Slump (10") |
| Mass |
tpd |
solids |
3,094.0 |
3,094.0 |
3,094.0 |
3,094.0 |
| tph |
solids |
128.9 |
128.9 |
128.9 |
128.9 |
| tph |
water |
39.6 |
42.8 |
46.1 |
49.8 |
| tph |
slurry |
168.5 |
171.7 |
175.0 |
178.7 |
| Percent Solids |
% |
|
76.5 |
75.1 |
73.7 |
72.2 |
| Flow |
m3/h |
solids |
46.2 |
46.2 |
46.2 |
46.2 |
| m3/h |
water |
39.6 |
42.8 |
46.1 |
49.8 |
| m3/h |
slurry |
85.8 |
89.0 |
92.3 |
96.0 |
| Specific Gravity |
- |
solids |
2.79 |
2.79 |
2.79 |
2.79 |
| - |
water |
1.00 |
1.00 |
1.00 |
1.00 |
| - |
slurry |
1.96 |
1.93 |
1.90 |
1.86 |
| Pipeline Size |
200 mm (8”) |
area (m2) |
0.0295 |
0.0295 |
0.0295 |
0.0295 |
| 200 mm (8”) |
Sch 80 |
velocity m/s |
0.81 |
0.84 |
0.87 |
0.90 |
| Pressure Loss |
- |
kPa/m |
7.1 |
4.9 |
3.4 |
2.3 |
| Pipeline Size |
150 mm (6”) |
area (m2) |
0.0168 |
0.0168 |
0.0168 |
0.0168 |
| 150 mm (6”) |
Sch 80 |
velocity m/s |
1.42 |
1.47 |
1.52 |
1.59 |
| Pressure Loss |
- |
kPa/m |
9.8 |
6.8 |
4.7 |
3.2 |
| |
Osisko Development Corp.
NI 43-101 Technical Report
Feasibility Study for the Cariboo Gold Project |
|
| 16.7.2 | Underground Paste Fill Network Distribution Description |
As the tailing disposal relies exclusively on
paste underground, the entire mine will be fitted with paste network, as shown in Figure 16-33. The paste fill origination is located
just above the Valley Zone in the mill. There are a total three surface to underground boreholes, one operating and two standbys.
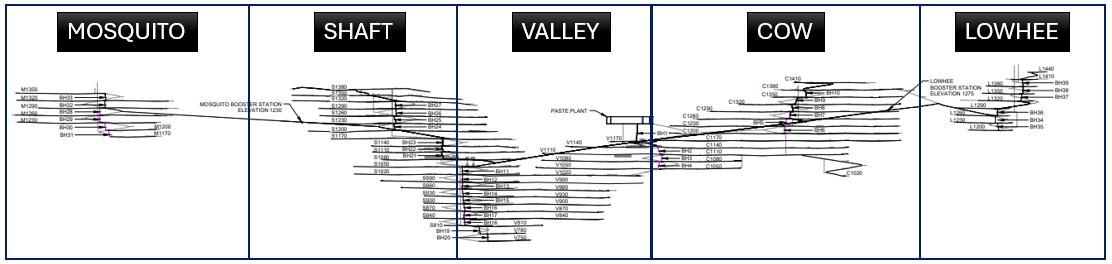
Figure 16-33: Underground
paste fill route
| 16.7.3 | Valley Paste Fill Distribution Network |
The Valley Zone will be filled from two different
locations. Levels 990-750 will employ the same initial routing and interlevel boreholes as the lower Shaft Zone, starting with BH11 and
ending with BH20 at level 750. Levels 1170-1050 will be supplied from the paste plant directly. The paste will be routed through the surface
borehole and will descend via a short ramp to the level V1140. From there, BH2/3/4 are used to fill V1110/V1080/V1050 respectively. This
is illustrated in Figure 16-34. The Valley will be the underground central point
for the distribution of paste fill for Shaft and Cow.
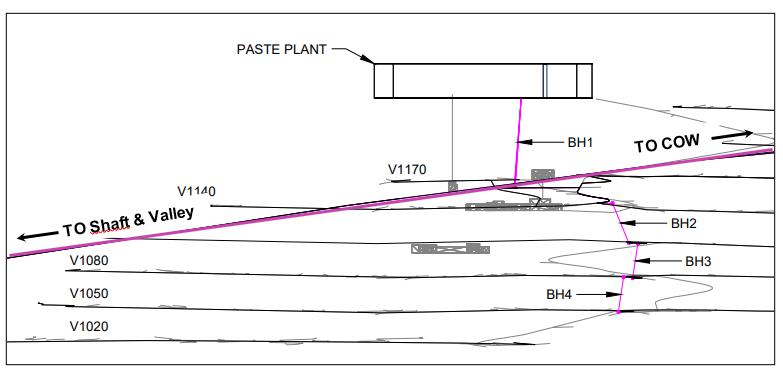
Figure 16-34: Paste Fill
distribution network for upper part of Valley and in route for Shaft and Cow
| |
Osisko Development Corp.
NI 43-101 Technical Report
Feasibility Study for the Cariboo Gold Project |
|
| 16.7.4 | Shaft Paste Fill Distribution Network |
The desired extents of the Shaft Zone can be reached
by delivering the paste from surface borehole (BH1), towards level S1015 using the ramp that connects all mine zones, Mosquito, Shaft,
Valley, Cow and Lowhee. The paste pipe routing will then split; the upper portion will be fed from the Mosquito Zone booster station at
the 1230 ramp elevation as shown in Figure 16-35, using BH21 and successive interval boreholes to reach the extends of level 1380.
The lower portions of Shaft Zone will be reached using BH11 as a starting point through a series of interlevel boreholes to finally intersect
level S810. The Shaft Zone pipe routing is illustrated in Figure 16-35.
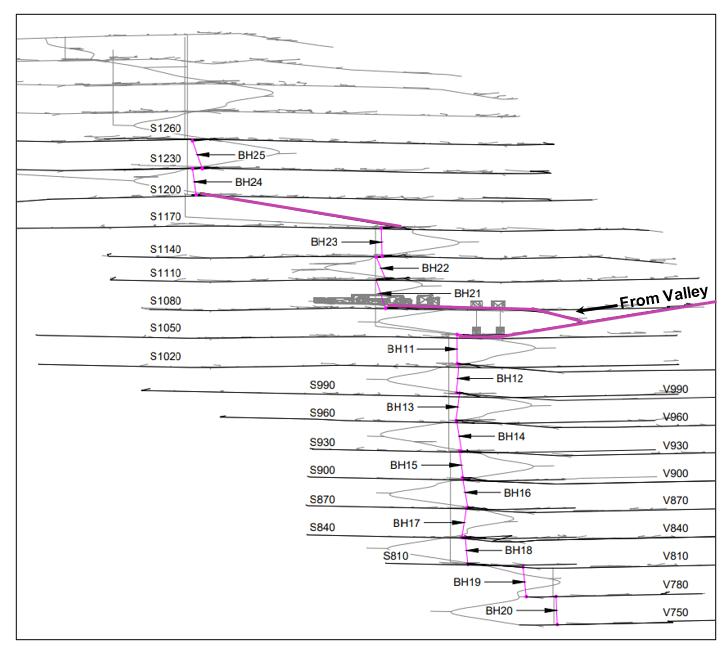
Figure 16-35: Pipe routing
for upper and lower part of Shaft and lower part of Valley
| |
Osisko Development Corp.
NI 43-101 Technical Report
Feasibility Study for the Cariboo Gold Project |
|
| 16.7.5 | Cow
Paste Fill Distribution Network |
Cow Zone will also be supplied through two different
routes. Levels C1170-C1050 will be filled by using BH2/3/4 (like Valley Zone). The remainder of the Cow Zone will be filled from the Lowhee
booster station located at the 1275 ramp elevation shown in Figure 16-36, owing to the long lateral expanse at the Cow Zone. From
the Lowhee booster station, there will be a split with paste delivered to some upper and lower levels. Upper levels will use boreholes
BH7 through BH10 to target levels C1290-C1410. Lower levels will use boreholes BH5 and BH6 to target levels C1230 and C1200.
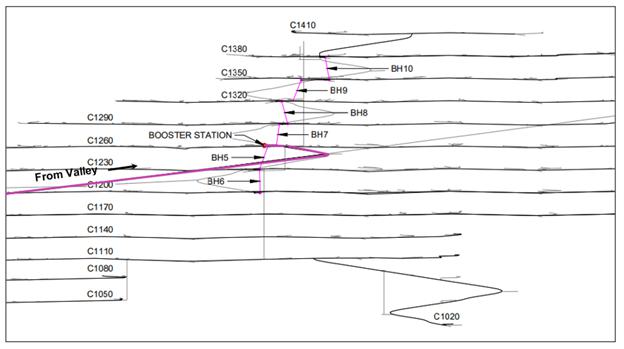
Figure 16-36: Cow paste
fill network and booster station location
| |
Osisko Development Corp.
NI 43-101 Technical Report
Feasibility Study for the Cariboo Gold Project |
|
| 16.7.6 | Mosquito Paste Fill Distribution Network |
The Mosquito Zone will be supplied via the Mosquito
booster pump to M1290. The lower Mosquito levels, M1260 to M1170, will be supplied using BH28 through BH31. The upper Mosquito levels,
M1320 and M1350, will use boreholes BH32 and BH33 as illustrated in Figure 16-37.
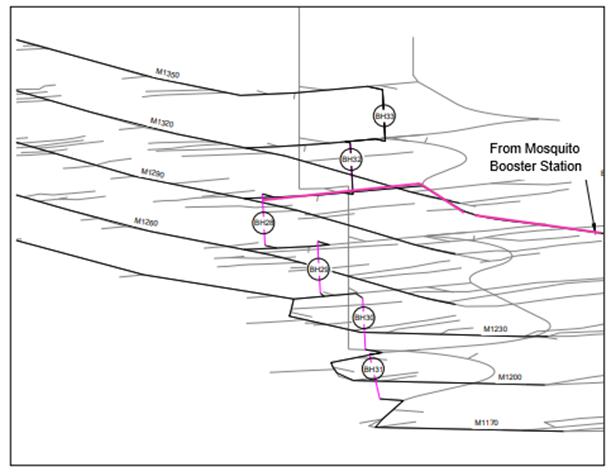
Figure 16-37: Mosquito
paste fill network distribution
| |
Osisko Development Corp.
NI 43-101 Technical Report
Feasibility Study for the Cariboo Gold Project |
|
| 16.7.7 | Lowhee Paste Fill Network Distribution |
The Lowhee Zone will be supplied via the Lowhee
booster pump to level 1260. The lower Lowhee levels 1230, 1230 and 1200 will be supplied using boreholes BH34 and BH35. The upper Lowhee
levels 1290 to 1440 will use boreholes BH36 through BH39.
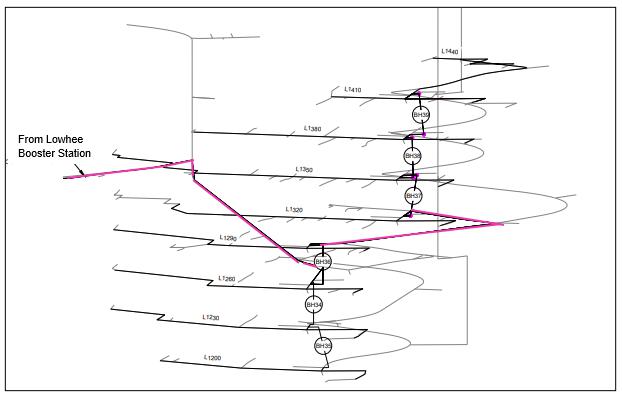
Figure 16-38: Lowhee paste
fill network distribution
| 16.7.8 | Typical Level Paste Fill Distribution Network |
The piping system underground is comprised of
200 mm (8”) Schedule 80 piping for the primary network and 200 mm (8”) Schedule 80 piping for the secondary network,
whereas the tertiary network (final pipe runs to stopes) will use 200 mm (8”) HDPE DR9 pipe. To facilitate paste fill operation
readiness, the tertiary network will consist of HDPE DR9 pipes with Victaulic couplings. These pipes are easy to move and reinstall in
the next sequenced stopes.
It is recommended that a rupture spool, a pressure
relief tee, and a pressure transducer be installed at the breakthrough of each borehole as these locations are more susceptible to pressure
build-up should a downstream blockage occur. These items should be installed within 5 m of the transition between vertical pipe and
the level piping. Pressure relief tees should be installed every 200 m to 250 m from the downhole breakthrough along the level
piping.
Figure 16-39 shows a plan view of typical
level paste line configuration with the Vertical Primary Network in green and red, the Secondary Network in cyan, and the Tertiary Network
in magenta. Table 16-20 illustrates the quantity of paste fill pipes to be installed during the life of mine.
| |
Osisko Development Corp.
NI 43-101 Technical Report
Feasibility Study for the Cariboo Gold Project |
|
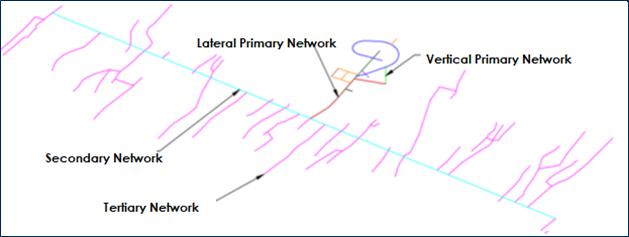
Figure 16-39: Typical paste
fill-level distribution network
Table 16-20:
Summary of the pipe lengths by zone in metres
| Paste
Fill Network |
Type |
Mosquito |
Valley |
Shaft |
Cow |
Lowhee |
Total |
| Principal Paste Fill Network – Vertical |
200 mm |
252 |
375 |
800 |
590 |
233 |
2,250 |
| Schedule 80 |
| Principal Paste fill Network – Lateral |
200 mm |
1,300 |
654 |
9,958 |
415 |
1,190 |
13,517 |
| Schedule 80 |
| Secondary Paste Fill Network |
200 mm |
3,489 |
6,324 |
7,985 |
8,663 |
1,903 |
28,364 |
| Schedule 80 |
| Tertiary Paste Fill Network (in sills) |
200 mm |
5,699 |
20,812 |
33,646 |
26,916 |
5,310 |
92,383 |
| Schedule 80 |
| 16.7.9 | Flow Model Analysis |
| 16.7.9.1 | Flow Model Inputs |
The parameters used to conduct the flow modelling
are summarized in Table 16-18 and Table 16-19 in Section 16.7.1. The flow models presented are calculated under the assumption
that the throughput is at the design mass flow rate of 121 tph of paste solids with a tailings solids specific gravity of 2.76. The
mass flow rate is inclusive of binder.
| |
Osisko Development Corp.
NI 43-101 Technical Report
Feasibility Study for the Cariboo Gold Project |
|
The weight % (“wt%”) solids content
changes slightly at different slumps. A 178 mm (7”) slump has a higher wt% solids (76.5 wt%) and a slightly slower velocity,
whereas a 254 mm (10”) slump has a lower wt% solids (72.2 wt%) and faster velocity. The weight percent solids at the various
slumps were taken from “Appendix B.2 Uncemented Rheology” in the T Engineering lab report (Cariboo Gold Project Laboratory
Report – Rev B, Dec 6, 2024).
Borehole and pipeline diameters have been selected
to maintain as low a flow velocity as possible to reduce wear and decrease the friction losses which will keep the number of booster stations
to a minimum. The 200 mm (8”) diameter pipeline provides a flow velocity of 0.79 m/s to 0.89 m/s, which is lower
than optimum 1 m/s, but still within the acceptable operating range for paste fill.
The flow model analysis is based on the 3D model
provided by ODV on December 18, 2024, which included the Mosquito and Lowhee Mining zones. These two zones have been added to the
mine plan since the original study was undertaken in 2022. Seven distribution locations were selected for flow modelling within the study.
Chainage for various locations were obtained through the 3D model of the mine. The worst cases distribution are at the top of the orebody
for Cow, Lowhee, Mosquito, and Shaft zones, and the bottom of the Valley Zone.
The friction factor range used for the 178 mm
to 254 mm slumps (7” to 10” slumps) is 9.3 kPa/m to 2.1 kPa/m for unlined DN200 (8”) schedule 80 pipe,
and 12.5 kPa/m to 2.8 kPa/m for unlined DN150 (6”) schedule 80 pipe. The pipeline friction loss for the DN 150 (6”) pipe
was estimated from the data presented in the T Engineering laboratory report (Ting and Pascual, 2024).
| 16.7.9.2 | Flow Model Analysis |
The flow models examined the worst-case scenario
at the extents of high-pressure levels. The flow model examined pipeline the routes presented in Figure 16-39.
The flow model results presented in Table 16-21,
indicate the lowest slump the paste plant can pump to still reach that area and level of the mine; and the pressure that will be needed
to reach it.
The analysis shows that:
| § | The entire mine is reachable with a slump range of 203 mm to 254 mm
(8” to 10”); |
| § | Booster stations are required to reach the Mosquito and Lowhee mine areas; |
| § | Shaft level 1380 can be reached with 229 mm slump (9”) if first
routed to Mosquito station; |
| § | Cow level 1410 can be reached with 203 mm slump (8”) if first
routed to Lowhee booster; |
| § | Lowhee level 1440 can be reached with 203 mm slump (8”) if paste
pump operates at 126 bar without having to install another booster station. |
| |
Osisko Development Corp.
NI 43-101 Technical Report
Feasibility Study for the Cariboo Gold Project |
|
Table 16-21: Slump and
pumping summary
| Originating
Location |
Discharge
Area |
Mine
Level |
Required
Slump
mm (inch) |
Required
Pumping Pressure
Bar |
| Paste Plant |
Mosquito Booster Station |
1230 |
229 (9) |
87 |
| Mosquito Booster Station |
Mosquito |
1350 |
229 (9) |
85 |
| Mosquito Booster Station |
Shaft |
1380 |
229 [9] |
92 |
| Paste Plant |
Shaft |
1380 |
254 (10) |
90 |
| Paste Plant |
Shaft |
1260 |
229 (9) |
100 |
| Paste Plant |
Valley |
750 |
203 (8) |
77 |
| Paste Plant |
Cow |
1410 |
229 (9) |
115 |
| Paste Plant |
Lowhee Booster Station |
1275 |
203 (8) |
111 |
| Lowhee Booster Station |
Lowhee |
1440 |
203 (8) |
126(1) |
| Lowhee Booster Station |
Lowhee |
1410 |
203 (8) |
105 |
| Lowhee Booster Station |
Cow |
1410 |
203 (8) |
117 |
| (1) | Paste pump operating pressure is rated for 128 bar, potential to consider 229 mm slump for level 1440. |
| 16.7.10.1 | Paste Pump Selection |
A Geho DHC-21250 positive displacement pump has
been selected for this duty. The following design criteria were used in the pump selection:
| § | Slurry to be pumped fine-grained, pumpable cemented tailings; |
| § | Slurry density: 189 kg/m3; |
| § | Solid density: 3,200 kg/m3; |
| § | Solid concentration: 75.4%; |
| § | Particle size distribution: d80 = 60; d50 = 33; d30 = 20; |
| § | Flow rate each pump: 100 m3/h operating; |
| § | Pump discharge pressure: 120 bar (design operating); |
| § | Installed power of main motors (2x): 450 kW. |
| |
Osisko Development Corp.
NI 43-101 Technical Report
Feasibility Study for the Cariboo Gold Project |
|
| 16.7.10.2 | Underground Booster Stations |
The current design calls for two underground booster
stations, one for Mosquito Zone, and one for Lowhee Zone. The design is for two booster pumps per pump station, one operating and one
standby. Figure 16-40 illustrates a typical booster pump station. The following points are noted:
| § | A 120 bar pump has been selected; |
| § | The
pumps have been positioned to allow access to their cylinders for removal; |
| § | The
total span is below 12 m including the standard 5 m drift; |
| § | The E-cutout can be moved closer to the pump if a rock mechanics evaluation
deems if safe; |
| § | The station cutout slashes can be squared at the ends if needed. The current
angled design makes it easy for pipe installation and for access and ventilation; |
| § | The booster station floor is sloped from right to left and to back of excavation
for cleaning; |
| § | The pump station can be installed in a separate drift, but this decreases
heat dissipation, complicates pipe layout, and requires additional excavation. The slashes drift assists with ventilation/cooling and
ease of movement for maintenance; |
| § | The second pump is on standby. |
It is normal practice to have one operating and
one standby pump, especially when a pump fails, and the pipeline is full of cemented paste. Alternate methods of clearing the distribution
system of cemented paste can be introduced without the use of a standby pump. This will include a small positive displacement (“PD”)
pump with standby power being placed in a suitable location, which can be used to flush any cemented paste from a line when a pump failure
occurs.
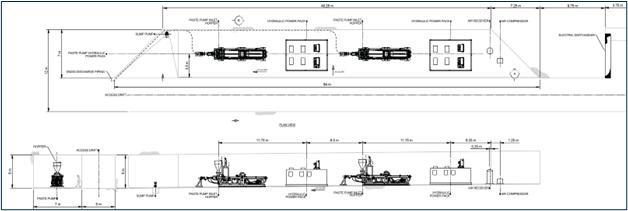
Figure 16-40: Booster station
(two pumps shown)
| |
Osisko Development Corp.
NI 43-101 Technical Report
Feasibility Study for the Cariboo Gold Project |
|
| 16.8.1 | Mine Sequence Methodology |
The
strategy associated with drawing up the infrastructure development sequence and the production plan has been to limit the ramp-up period
while ensuring that production remains sustainable over time. To limit the risk of disruption, provide maximum flexibility and allow maximum
recovery of reserves, production was achieved by creating three distinct sectors of production: Cariboo North, South, and Deep. As noted
in Figure 16-41, each area is expected to operate independently of
one another and provide a maximum ore feed of 2,455 tpd from Cariboo North, 2,740 tpd from Cariboo South, and 2,645 tpd from Cariboo Deep,
such that at any given time an aggregate of 4,900 tpd is mined across all deposit areas.
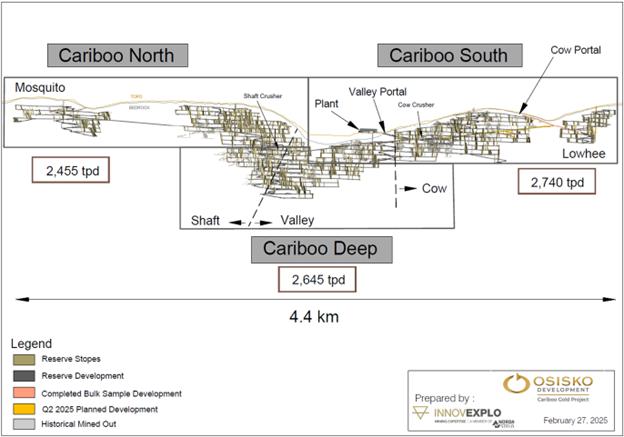
Figure 16-41: Mining plan
by areas long section
| |
Osisko Development Corp.
NI 43-101 Technical Report
Feasibility Study for the Cariboo Gold Project |
|
In the early stages of development, the focus
will be on reaching the main ventilation raise and being in a position to start the production of the Upper Shaft and Lowhee Zone, while
maintaining a high development priority of the down Ramp of the Shaft Zone.
All zones include multiple veins that extend to
the surface, though the highly uneven topography causes this to be variable between and within zones. Veins do not reliably extend through
the entire height of a zone. When a vein extends more than five sublevels, they are interrupted with a 10 m pillar for geotechnical stability
that was considered in the mining recovery of sill stopes. The mining sequence within a vein is bottom-up, though along veins with pillars
it is possible to open multiple mining fronts. Stopes along a vein on a level are universally mined in the retreat direction toward the
main access and then retreat to the level access. Sill levels are mined with blind uppers on retreat after the stopes above and below
have been mined, leaving a 10 m skin.
Stope sequencing per level is controlled by access
constraints between veins. As far as possible, respecting the various constraints, veins with a higher grade were assigned a correspondingly
higher priority.
Stopes are to be drilled from the top access,
except for pillars, which applies to both production drilling and V30 slot raise. Therefore, the development on the top and bottom access
is required to be completed before the initiation of production drilling tasks. For automation purposes, the development and production
activities were not allowed in the same level at the same time.
The
annual production schedule is based on a targeted average throughput of 4,900 tonnes per day. Therefore, the total economic material tonnage
is targeted to satisfy this daily production rate. All scheduling rates are based on experienced mining contractor feedback or typical
rates for similar operations. Task rates referred to the productivity rate at which any given task can complete its operational scenario.
Table 16-22 summarizes the development task rates applied to the
schedule.
| |
Osisko Development Corp.
NI 43-101 Technical Report
Feasibility Study for the Cariboo Gold Project |
|
Table 16-22: Schedule development
rates
| Development Type |
Development Profile
(width x height) |
Task Rate |
| Lateral Jumbo Development Multi Heading |
(3.7 m x 4.0 m) |
9.6 m/d |
| Lateral Jumbo Development Multi Heading |
(5.0 m x 4.3 m) |
9.6 m/d |
| Lateral Jumbo Development Multi Heading |
(5.4 m x 5.8 m) |
8.0 m/d |
| Lateral Roadheader Development Single Heading |
(5.4 m x 5.8 m) |
6.6 m/d |
| Vertical Development |
(average) |
2.5 m/d |
All ramp decline is planned to be excavated with
Roadheader or Jumbo equipment. Level access is planned to be developed mostly by Jumbo equipment. All multi-heading development is planned
to be excavated with Jumbos at a total rate of 244 m per month per crew with a maximum of 61 m per headings for ramps, level access and
infrastructure. Development of the haulage and ore drift was planned a rate of 292 m with a maximum of 73 m per headings.
Tests conducted by the manufacturer have successfully
demonstrated that the rock units associated with the excavations developed by the Roadheader are adequate when using the right type of
cutter (P. Cyr, personnel communication, March 8, 2019). In addition, a Roadheader was employed for the development of certain
sections during operations at the Bonanza Ledge Mine. It was also used to assess its operational viability during the development of the
ramp from the Cow portal, which led to the bulk sampling.
The first 6 months of pre-production development
will be carried out entirely by the contractor, after which the in-house team will gradually come in with project owned equipment and
start supplanting the contractor to carry out the development. During the pre-production period, a maximum of four standard Jumbo teams
and two Roadheaders teams per day will be required. After this period and considering that the bulk of the ramps will be developed, the
Roadheader equipment will be withdrawn and the Jumbo teams increased to six to ensure development for the subsequent three years and progressively
reduced thereafter.
Production tasks involving mucking, such as backfilling
or mucking stopes, are based on the maximum rate a loader can achieve in a day depending on the size of the equipment, the hauling distance
and the effective hours per day, which vary depending on the activity performed. In addition, for stope mucking activity, the effective
hours vary considering the different mucking modes (manual, manual and automated or fully automated). The rate is based on an LHD being
assigned the singular task. It has been presumed that the entire fleet of LHD loaders will be equipped with options enabling them to be
automated. It has been planned that all LHD loaders associated with production mucking activities will operate entirely in 12 hours manual
mode per shift until Year 2. Thereafter, A 6-month transition period for implementation from which it has been assumed that 30% of stopes
loading will be carried out manually over a period of 10 hours, with an additional 2 hours in automated mode. Following this period, 30%
of production will be carried out entirely in automated mode over a period of 12 hours per shift.
| |
Osisko Development Corp.
NI 43-101 Technical Report
Feasibility Study for the Cariboo Gold Project |
|
Production drilling and V30 slot raise are similarly
based on the assignment of a single resource to complete a single task. The production rates are shown in Table 16-23.
Table 16-23: Summary
of production rate tasks
| Production Task |
Unit |
Rate |
| Production Drilling |
m/d |
194 |
| Slot Raising |
m/d |
10.9 |
| Mucking (manual mode) – (min. max. range) |
tpd |
824–945 |
| Mucking (manual and automated mode) - (min. max. range) |
tpd |
845–1,037 |
| Mucking (automated mode) - (min. max. range) |
tpd |
897–1,100 |
| Uncemented Rockfill (min. max. range) |
tpd |
962–1,243 |
| Paste Fill Backfill |
tpd |
4,095 |
| Backfill Curing Time (paste fill) |
day |
7 |
| 16.8.3 | Mine Production Schedule |
The LOM production plan represents a 10-year mine
life. The production ramp-up to a steady state of 4,900 tpd is achievable by second half of Year 1. The average head grade for the LOM
averages 3.62 g/t Au. All scheduled physicals and summary data presented in this section represent the mined and recovered values.
Figure 16-42 shows mined and recovered economic material tonnage and grade on an annual basis and the Figure 16-43 show the
tonnage distribution in the three mining sectors.
| |
Osisko Development Corp.
NI 43-101 Technical Report
Feasibility Study for the Cariboo Gold Project |
|
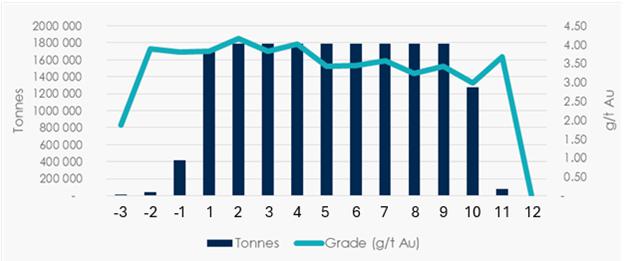
Figure 16-42: Annual mined ore tonnag
e and grade
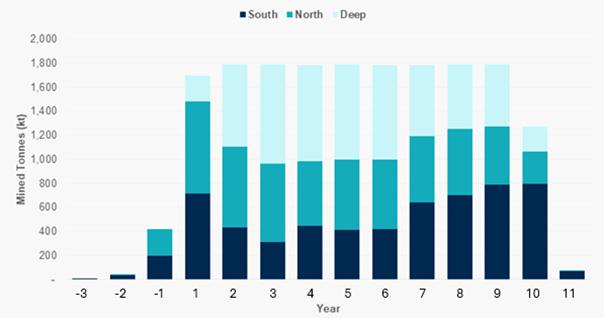
Figure 16-43: Mine plan
by sector
| |
Osisko Development Corp.
NI 43-101 Technical Report
Feasibility Study for the Cariboo Gold Project |
|
Table 16-24 presents a summary of ore tonnage
and grade by zone by year.
Table 16-24: Annual mine
production plan by zone
| Zone |
Unit |
Year -3 |
Year -2 |
Year -1 |
Year 1 |
Year 2 |
Year 3 |
Year 4 |
| Lowhee |
t |
1,662 |
32,101 |
133,676 |
527,845 |
195,803 |
32,498 |
- |
| g/t |
1,86 |
4,31 |
3,47 |
3,72 |
3,02 |
2,73 |
- |
| Cow |
t |
- |
- |
7,453 |
38,694 |
271,509 |
343,679 |
304,212 |
| g/t |
- |
- |
3,81 |
4,32 |
4,26 |
3,78 |
3,49 |
| Valley Upper |
t |
- |
2,007 |
43,327 |
141,794 |
4,568 |
8,323 |
100,212 |
| g/t |
- |
2,90 |
3,20 |
2,81 |
3,09 |
5,16 |
3,37 |
| Valley Lower |
t |
- |
- |
- |
60,995 |
214,797 |
180,383 |
327,497 |
| g/t |
- |
- |
- |
4,65 |
3,92 |
3,90 |
4,00 |
| Shaft |
t |
- |
7,123 |
235,028 |
927,503 |
1,103,993 |
1,224,076 |
1,056,684 |
| g/t |
- |
2,28 |
4,11 |
3,96 |
4,38 |
3,83 |
4,23 |
| Mosquito |
t |
- |
- |
- |
- |
- |
- |
- |
| g/t |
- |
- |
- |
- |
- |
- |
- |
| Zone |
Unit |
Year 5 |
Year 6 |
Year 7 |
Year 7 |
Year 8 |
Year 9 |
Year 10 |
| Lowhee |
t |
- |
- |
- |
- |
- |
- |
- |
| g/t |
- |
- |
- |
- |
- |
- |
- |
| Cow |
t |
440,423 |
423,188 |
601,324 |
511,376 |
436,815 |
586,204 |
37,153 |
| g/t |
3,20 |
3,34 |
3,37 |
3,15 |
3,10 |
2,90 |
4,46 |
| Valley Upper |
t |
81,938 |
25,427 |
120,399 |
34,267 |
289,273 |
168,154 |
23,874 |
| g/t |
3,86 |
3,64 |
3,30 |
3,21 |
3,78 |
2,91 |
2,51 |
| Valley Lower |
t |
170,066 |
364,500 |
307,704 |
351,910 |
209,272 |
10,232 |
- |
| g/t |
3,28 |
3,34 |
4,28 |
3,40 |
3,29 |
2,10 |
- |
| Shaft |
t |
1,091,803 |
697,910 |
490,047 |
559,352 |
643,580 |
504,172 |
13,626 |
| g/t |
3,52 |
3,23 |
3,26 |
3,05 |
3,25 |
3,14 |
3,59 |
| Mosquito |
t |
9,149 |
276,957 |
268,751 |
331,549 |
214,285 |
5,495 |
- |
| g/t |
3,63 |
4,31 |
3,96 |
3,47 |
4,20 |
2,68 |
- |
Figure 16-44 shows the annual ore tonnage
extracted per zone by year.
| |
Osisko Development Corp.
NI 43-101 Technical Report
Feasibility Study for the Cariboo Gold Project |
|
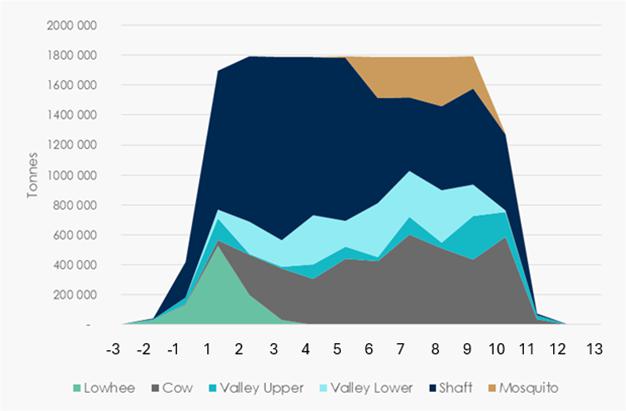
Figure 16-44: Annual ore
mined by zone
Approximately 15.6 Mt of ore is derived from the
stoping activity, with the remaining 2.2 Mt is derived from the development activity (12% of material generated). Figure 16-45 shows
the annual potentially economic material tonnage production versus development. Lateral development averages 1,230 m per month mine wide
for the LOM with peak development in Year -1 with an average of 1,790 m. Figure 16-45 shows annual development per zone per
annum for the LOM. Development metres per zone per time span changes throughout the LOM. Table 16-25 shows the development metre
breakdown per zone from pre-production over the life of the mine.
| |
Osisko Development Corp.
NI 43-101 Technical Report
Feasibility Study for the Cariboo Gold Project |
|
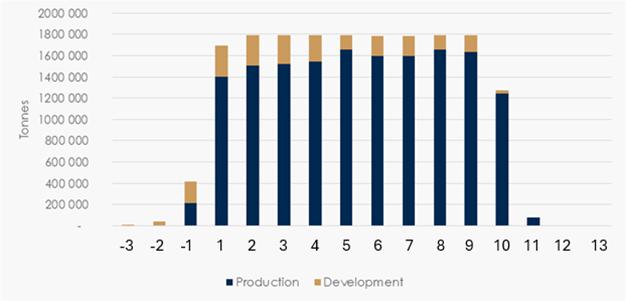
Figure 16-45: Distribution
of ore tonnage between development and production
Table 16-25: Annual lateral
development by zone (metres per year)
| Zone |
Unit |
Year
-3 |
Year
-2 |
Year
-1 |
Year
1 |
Year
2 |
Year
3 |
Year
4 |
| Lowhee |
m |
992 |
3,289 |
3,817 |
2,499 |
- |
- |
- |
| Cow |
m |
1,588 |
1,593 |
1,804 |
1,360 |
4,308 |
3,885 |
3,864 |
| Valley
Upper |
m |
1,916 |
2,958 |
2,071 |
174 |
36 |
607 |
1,736 |
| Valley
Lower |
m |
- |
- |
777 |
2,880 |
2,611 |
4,213 |
2,595 |
| Shaft |
m |
108 |
8,176 |
13,580 |
13,353 |
12,776 |
10,210 |
7,025 |
| Mosquito |
m |
- |
13 |
- |
- |
- |
702 |
1,479 |
| Zone |
Unit |
Year
5 |
Year
6 |
Year
7 |
Year
8 |
Year
9 |
Year
10 |
Year
11 |
| Lowhee |
m |
- |
- |
- |
- |
- |
- |
- |
| Cow |
m |
5,055 |
5,609 |
3,882 |
2,890 |
5,623 |
1,212 |
- |
| Valley
Upper |
m |
143 |
1,071 |
1,275 |
1,744 |
2,329 |
- |
- |
| Valley
Lower |
m |
924 |
1,193 |
2,179 |
761 |
2 |
- |
- |
| Shaft |
m |
4,215 |
2,291 |
3,758 |
1,558 |
1,593 |
- |
- |
| Mosquito |
m |
2,867 |
3,104 |
2,125 |
2,974 |
55 |
- |
- |
Table 16-26 provides an overview of the consolidated
LOM production schedule for the Project.
| |
Osisko Development Corp.
NI 43-101 Technical Report
Feasibility Study for the Cariboo Gold Project |
|
Table 16-26: Consolidated
mine plan overview – Cariboo Gold Project
| Item |
Unit |
Total |
Year
-3 |
Year
-2 |
Year
-1 |
Year
1 |
Year
2 |
Year
3 |
Year
4 |
Year
5 |
Year
6 |
Year
7 |
Year
8 |
Year
9 |
Year
10 |
Year
11 |
| Production |
|
|
|
|
|
|
|
|
|
|
|
|
|
|
|
|
| Tonnes
Stopes |
t |
15,632,933 |
0 |
0 |
207,600 |
1,408,953 |
1,506,844 |
1,509,190 |
1,553,767 |
1,651,736 |
1,609,602 |
1,589,302 |
1,654,238 |
1,626,981 |
1,243,206 |
71,515 |
| Grade |
g/t |
3.55 |
0.00 |
0.00 |
3.96 |
3.64 |
4.14 |
3.88 |
3.93 |
3.30 |
3.49 |
3.46 |
3.37 |
3.27 |
2.98 |
3.55 |
| Ounces |
oz. |
1,786,524 |
0 |
0 |
26,403 |
164,718 |
200,528 |
188,068 |
196,401 |
175,123 |
180,772 |
176,876 |
179,305 |
170,960 |
119,206 |
8,163 |
| #
Stopes |
|
2,803 |
0 |
0 |
34 |
231 |
239 |
241 |
260 |
340 |
281 |
274 |
297 |
327 |
263 |
16 |
| Development
Ore |
|
|
|
|
|
|
|
|
|
|
|
|
|
|
|
|
| Metres |
m |
52,703 |
20 |
921 |
5,088 |
6,779 |
6,767 |
6,738 |
5,717 |
3,459 |
4,232 |
4,870 |
3,294 |
4,094 |
724 |
0 |
| Tonnes |
t |
2,182,502 |
1,662 |
43,216 |
212,198 |
286,112 |
281,761 |
279,809 |
233,160 |
141,639 |
173,527 |
199,178 |
134,334 |
166,406 |
29,500 |
0 |
| Grade |
g/t |
4.05 |
1.86 |
3.92 |
3.85 |
4.63 |
4.30 |
4.07 |
4.16 |
4.10 |
3.78 |
3.84 |
3.79 |
3.51 |
3.76 |
0.00 |
| Ounces |
oz. |
284,275 |
100 |
5,443 |
26,298 |
42,612 |
38,964 |
36,576 |
31,205 |
18,664 |
21,074 |
24,605 |
16,374 |
18,793 |
3,567 |
0 |
| Development
Waste |
|
|
|
|
|
|
|
|
|
|
|
|
|
|
|
|
| Metres |
m |
126,725 |
4,487 |
15,016 |
16,877 |
13,546 |
13,092 |
12,912 |
10,898 |
9,678 |
9,179 |
8,411 |
6,548 |
5,546 |
535 |
0 |
| Tonnes |
t |
8,014,607 |
397,782 |
1,296,073 |
1,164,112 |
796,662 |
791,454 |
776,233 |
631,938 |
594,020 |
483,929 |
432,940 |
344,753 |
278,810 |
25,903 |
0 |
| Total
Development |
m |
179,428 |
4,507 |
15,937 |
21,966 |
20,325 |
19,858 |
19,650 |
16,615 |
13,137 |
13,411 |
13,281 |
9,842 |
9,640 |
1,259 |
0 |
| Backfill |
|
|
|
|
|
|
|
|
|
|
|
|
|
|
|
|
| Paste
fill |
t |
13,609,555 |
0 |
0 |
345,050 |
1,442,550 |
1,481,116 |
1,361,504 |
1,265,701 |
1,384,217 |
1,231,636 |
1,332,864 |
1,375,406 |
1,247,921 |
1,075,434 |
66,156 |
| Rockfill |
t |
1,037,110 |
0 |
0 |
12,580 |
83,620 |
89,540 |
88,430 |
97,680 |
125,060 |
103,600 |
102,490 |
109,890 |
117,474 |
100,086 |
6,660 |
| Total
Ore Mined |
|
|
|
|
|
|
|
|
|
|
|
|
|
|
|
|
| Tonnes |
t |
17,815,435 |
1,662 |
43,216 |
419,798 |
1,695,065 |
1,788,605 |
1,788,999 |
1,786,926 |
1,793,375 |
1,783,128 |
1,788,480 |
1,788,572 |
1,793,387 |
1,272,706 |
71,515 |
| Daily
Tonnage |
tpd |
|
9 |
118 |
1,150 |
4,631 |
4,900 |
4,901 |
4,896 |
4,900 |
4,885 |
4,900 |
4,900 |
4,900 |
3,487 |
795 |
| Grade |
g/tm |
3.62 |
1.86 |
3.92 |
3.90 |
3.80 |
4.16 |
3.91 |
3.96 |
3.36 |
3.52 |
3.50 |
3.40 |
3.29 |
3.00 |
3.55 |
| Ounces |
oz. |
2,070,799 |
100 |
5,443 |
52,701 |
207,330 |
239,492 |
224,644 |
227,605 |
193,788 |
201,846 |
201,481 |
195,680 |
189,754 |
122,773 |
8,163 |
| |
Osisko Development Corp.
NI 43-101 Technical Report
Feasibility Study for the Cariboo Gold Project |
|
InnovExplo, in collaboration with ODV, was responsible
for developing the strategy and for estimating the associated costs for an underground (“U/G”) ventilation system. Dello Ventilation
were engaged to assist InnovExplo with the ventilation design work.
The software VentSim was used to simulate and
estimate the fresh air requirements for the mine. The fresh air requirement has been established for each of the mining zones: Cow, Valley,
Shaft, Mosquito, and Lowhee. The air requirement complies with the Canadian Standards Association (“CSA”) prescribed ventilation
rate. The minimum requirement to dilute emissions from the mobile machinery listed in Table 16-27 is 0.06 cubic metres per second
per kilowatt (“m3/s/kW”) of diesel-powered equipment. The table shows the quantity of equipment required for LOM.
In estimating the aggregate rate of fresh airflow for the entire mine, a utilization rate has been applied to account when machines may
be mechanically unavailable, or simply not in use. The mine uses a full diesel fleet.
Table 16-27: List of mobile
equipment
| Equipment Type |
Diesel Engine Power |
Quantity Max(1) |
| (kW) |
(hp) |
| Roadheader |
Electric |
Electric |
2 |
| Jumbo 2 Booms |
110 |
147 |
6 |
| Bolter Type 1 |
93 |
125 |
4 |
| Bolter Type 2 |
110 |
147 |
3 |
| Scissor Lift |
110 |
147 |
6 |
| Loading Unit |
110 |
147 |
3 |
| LHD 10 t |
235 |
315 |
11 |
| Truck 51 t |
515 |
690 |
17 |
| Production Drill |
74 |
99 |
5 |
| Boom Truck |
160 |
214 |
5 |
| Personnel Carrier |
170 |
228 |
2 |
| Maintenance Truck |
170 |
228 |
2 |
| Service Truck |
170 |
228 |
2 |
| |
Osisko Development Corp.
NI 43-101 Technical Report
Feasibility Study for the Cariboo Gold Project |
|
| Equipment
Type |
Diesel Engine Power |
Quantity Max(1) |
| (kW) |
(hp) |
| Fuel Lube Truck |
110 |
147 |
2 |
| Water Cannon Truck |
110 |
147 |
1 |
| Grader |
168 |
225 |
1 |
| Light Truck |
126 |
169 |
6 |
| Tractor |
78 |
105 |
4 |
| (1) | Represents the number of units when the fleet is fully deployed. |
The utilization rates are 75% for production equipment,
30% for most service equipment, and 10% for machinery that operates primarily with electricity. Based on these utilization rates, the
fresh air requirement for LOM has been established at 592 m3/s (1.26 million cubic feet per minute (“M CFM”)).
The required airflow capacity for each of the zones has been determined based on the production rate. The Lowhee and Mosquito zones will
share the same fans and heaters. Once Lowhee is mined out, the fan will be moved to Mosquito.
All main fans and heaters will be installed on
surface. All will be installed in a horizontal parallel arrangement. The heaters and fans for Lowhee and Mosquito will be the one that
was initially purchased for the ramp development and for Bonanza Ledge. Required ducting and accessories will be purchased to accommodate
the dual parallel arrangement. All fans and heaters are equipped with the appropriate sound attenuation to maintain the adequate standards
for the workers and nearby community.
The different fan operating points, nominal motor
power, and heater power for each zone are shown in Table 16-28.
Table 16-28: Main fans
and heaters specifications
| Zone |
Max Fresh Air Requirement |
Total Fan Pressure Requirement |
Fan Motor
Nominal Power |
Heaters
Capacity |
| m3/s (kcfm) |
Pa (in. w.g.) |
kW (hp) |
MW (Mbtu/h) |
| Shaft/Valley |
519 (1,100) |
3,975 (19.3) |
2 x 1,567 (2,100) |
21.1 (72) |
| Cow |
265 (561) |
3,250 (13) |
2 x 672 (900) |
12.3 (42) |
| Lowhee and Mosquito |
175 (372) |
775 (3.1) |
2 x 149 (200) |
5.1 (17.5) |
| |
Osisko Development Corp.
NI 43-101 Technical Report
Feasibility Study for the Cariboo Gold Project |
|
The ventilation system layout consists of four
independent air intakes for the five mining zones: Cow, Shaft and Valley, Mosquito, and Lowhee. An exhaust air raise will also be constructed
in the Shaft Zone to avoid excessive airspeed in the ramp towards the Valley portal. The exhaust raise is left open and is not equipped
with any fans. Each zone is supplied with fresh air through a raise, breaking through each production level. Bulkheads with drop board
regulators will control the fresh air entering the production levels. In addition to the exhaust raise in Shaft, the exhaust air will
be directed towards the Cow and Valley portals. The Valley portal will be equipped with a double automatic door. It will only be closed
prior to blasts in order to direct the fumes towards the Cow portal to avoid contaminating the ambient air at proximity of the community
and mine surface installations.
Figure 16-46 shows a longitudinal view of
the ventilation layout for LOM.
The ventilation raises have been sized as follows:
| § | Shaft fresh air raise from surface to level S1170, 7.5 m (24.6 ft). The excavation
method is pilot slashed. |
| § | Shaft fresh air raise from level S1170 to S1020, 5.8 m (19 ft) diameter.
The excavation method is pilot slashed. |
| § | Shaft fresh air raise from level S1020 to S0870, 3.5 m (11.5 ft) diameter.
The excavation method is raisebore. |
| § | Shaft fresh air raise from level S0870 to bottom, 3 m (9.8 ft) diameter.
The excavation method is raisebore. |
| § | Shaft return air raise from level S1260 to surface, 6.0 m (20 ft) diameter.
The excavation method is pilot slashed. |
| § | Cow fresh air raise from surface to level C1260, 4.5 m (14.8 ft) diameter.
The excavation method is pilot slashed. |
| § | Cow fresh air raise from level C1260 to level C1170, 3.5 m (11.5 ft) diameter.
The excavation method is raisebore. |
| § | Cow fresh air raise from level C1170 to level bottom, 3 m (9.8 ft) diameter.
The excavation method is raisebore. |
| § | Lowhee and Mosquito fresh air raise have all been sized at 3.5 m (11.5 ft)
diameter. The excavation method is raisebore. |
| |
Osisko Development Corp.
NI 43-101 Technical Report
Feasibility Study for the Cariboo Gold Project |
|
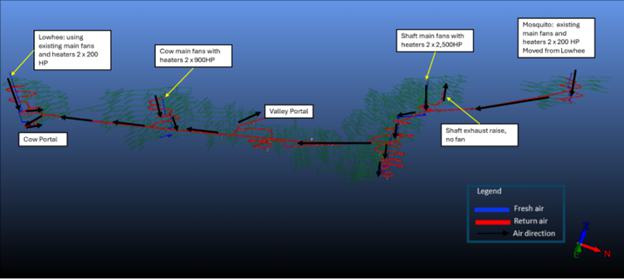
Figure 16-46: Ventilation
layout LOM
| 16.9.1.1 | Production Level and Development Ventilation Layout |
The network was created to meet the total fresh
air requirement. Given the shifting production profile from each zone, the total required airflow in each zone changes over time. Main
fans will therefore be equipped with variable speed drives to be able to accommodate advanced ventilation controls to optimize its speed
and consequently reduce energy costs.
| |
Osisko Development Corp.
NI 43-101 Technical Report
Feasibility Study for the Cariboo Gold Project |
|
The ramp will be developed with the Roadheader
from the Cow portal to Shaft level S1170 to access the initial ventilation raise. Two 250 hp auxiliary fans will push air in a twin
60-inch semi-rigid plastic duct system. The system will provide enough air for two trucks and an LHD. Auxiliary booster fans will be installed
at every kilometre to supply the required amount of air at the working face and minimize leakage. For the Roadheader ventilation, a third
duct in negative pressure is installed at the working face to extract the dust generated. The dusty air is carried to a scrubber unit
to remove the dust and discharged back in the ramp. The scrubber unit will be moved closer to working face as required to avoid long runs
of negative pressure duct. Once the Valley portal will be developed, the fans that were planned for Cow portal will be installed as exhaust
in the Valley portal with double doors and two ducts to carry the air between the two doors. The fans will be used until the Shaft intake
raise fans are installed to create the ventilation circuit between the portals and Shaft. At that point the doors will remain opened.
The air intake will be performed from the Lowhee intake raise and the Cow portal. During winter, the current installation of the Cow portal
heater and fans will be used to heat the air. The duct will be installed at 30 m inside the portal to discharge the warm air. For the
Lowhee intake raise, the main fans and heaters will also be installed to supply the heated towards the Valley portal. The Cow portal fan
will not be operational during the warm months of the year. The layout of the installation is shown in Figure 16-47.

Figure 16-47: Ramp development
Shaft/Valley layout
Most of the production levels will be ventilated
with the internal drop raises that will create a ventilation circuit to reduce the amount of auxiliary ducting required as shown in Figure 16-48.
| |
Osisko Development Corp.
NI 43-101 Technical Report
Feasibility Study for the Cariboo Gold Project |
|
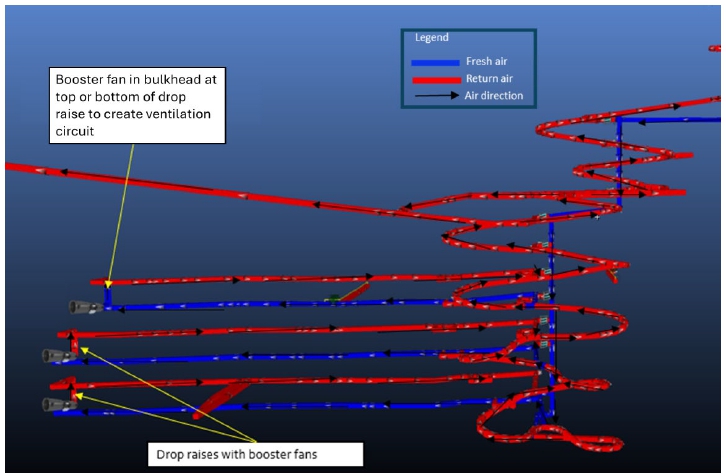
Figure 16-48: Drop raise
ventilation on levels
Auxiliary fans of 100 hp will supply the
fresh air at the extremity of the level for an LHD. Smaller auxiliary fans (50 hp) will be used, as needed, to ventilate each heading
again to supply enough air for an LHD. The drop raises are equipped with a bulkhead and a 100 hp fan supplying 170 thousand
of cubic feet per minute (“kcfm”) for the two levels. The layout of the production level ventilation system with drop raises
is shown in Figure 16-49. The ventilation design with the drop raises will enable the operation to have trucks being loaded up to
the drop raise and the possibility to have multiple LHDs on a given level.
| |
Osisko Development Corp.
NI 43-101 Technical Report
Feasibility Study for the Cariboo Gold Project |
|
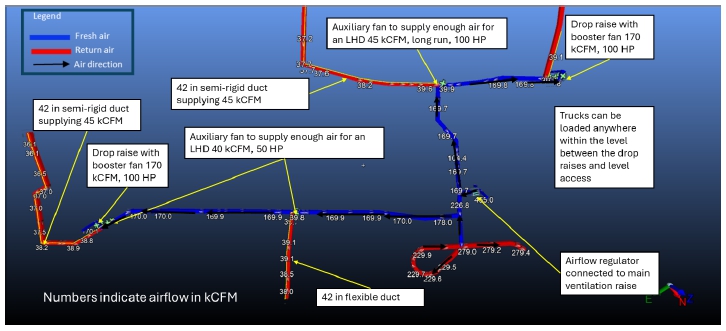
Figure 16-49: Production
level auxiliary ventilation with drop raises
For the levels without drop raises, an auxiliary
fan downstream of the regulator pushes 100 kcfm in a 54-inch semi-rigid duct plastic duct to discharge 60 kcfm at the truck loading station
with the use of a manual damper. The remaining airflow is carried at the extremity of the level to supply enough air for an LHD. The ventilation
layout of a typical production level is shown in Figure 16-50.
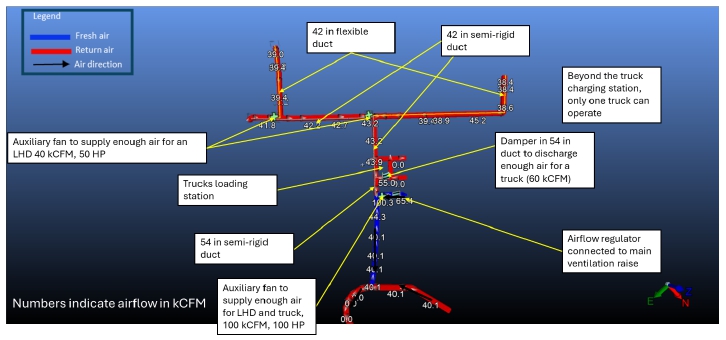
Figure 16-50: Production
level ventilation layout without drop raises
| |
Osisko Development Corp.
NI 43-101 Technical Report
Feasibility Study for the Cariboo Gold Project |
|
InnovExplo, in collaboration with the pump distributor
Technosub, and ODV, was responsible for establishing a dewatering strategy for the Project.
The design basis, assumptions, and work performed
by InnovExplo as it relates to dewatering operations has been summarized below. The dewatering solution must incorporate strategies for
management of all sources of water:
| § | Flooded historic workings – It is assumed that all old workings are
flooded below 1,226 m elevation (“EL”). It is estimated to contain a total of approximately 1,090,000 m3
of water based on water levels observed on the field (Figure 16-51). |
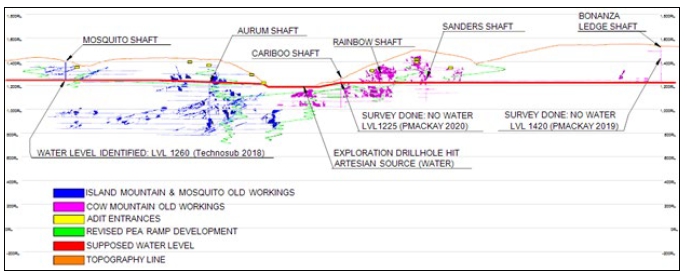
Figure 16-51: Flooded historic
workings and estimated water level
Technosub, in collaboration with ODV, conducted a water
level measurement in the historic Mosquito shaft (WSP, 2019a) and InnovExplo revised old working excavation volumes. InnovExplo assessed
the excavation volumes of the old workings on the basis of the revised 3D model developed by ODV following a digitization by InnovExplo
in 2016 of the old excavation plans provided by ODV. The model was subsequently enhanced with work done by ODV and with information gathered
from the entire ODV DDH drilling database. Although the total volume associated with the 3D model is close to the reconciliation of the
historical volumes mined, uncertainty remains as to the total volume of the actual voids.
| § | Groundwater inflow – All existing and new excavations are assumed to
be drain cells into which groundwater can flow. These numbers are explained in detail in Section 16.3 of this Report. |
| § | Process water – It includes all water required for mine operations,
including water requirements for mobile equipment, backfilling, U/G crushing, and mineral sorting, dust suppression, etc. |
| |
Osisko Development Corp.
NI 43-101 Technical Report
Feasibility Study for the Cariboo Gold Project |
|
| 16.9.3 | Historical Working Dewatering |
Historical workings are embedded within the various
zones of the Project, positioned between and around the different mineralized lenses. Below 1,226 m EL, they are assumed to be completely
flooded. In order to backfill them safely and work close to them, starting in Q4 Year -3, they will be gradually dewatered prior to the
advance of development heading at depth until water is completely removed.
As the main ramp progresses downwards below 1,226
m EL, level accesses will be opened, remaining a safe distance away from the flooded workings. From there, specialty boreholes with pre-installed
valve casings will be drilled to connect to the historical workings and allow for controlled pumping using the pressure from the water
head. Water will be managed through the mine pumping network but will bypass the water clarification system (Mudwizard) and will be directly
brought to the water treatment plant on surface.
Dewatering operations are expected to run at a
limited pumping flow rate during the period leading up to the commissioning of the MSC water treatment plant scheduled for Q4 Year -2.
It is estimated that the dewatering operation will span approximately three years, with a maximum considered pumping rate of 125 m³/h.
This rate is expected to decrease in the second half of Year -1 as dewatering progresses to the lower levels of the mine, specifically
within the Shaft and Valley zones, once those areas are reached.
| 16.9.4 | General Dewatering Design |
| 16.9.4.1 | Dewatering Requirements |
Dewatering flow estimates were established based
on projected groundwater infiltration rates and the anticipated water consumption associated with the equipment fleet required to implement
the mine plan. The dewatering system was sized with sufficient capacity to accommodate peak inflows and provide operational redundancy.
The design was based on the base case infiltration rate projected for the period Year -1 to Year 10, estimated at 6,000 m³/day
(250 m³/h) (see Section 16.3.2), with an added 50% contingency. This margin is adequate to support the alternative scenario
involving higher bedrock hydraulic conductivity, corresponding to an estimated 8,700 m³/day (363 m³/h).
The total estimated flow was distributed across
individual zones proportionally, based on their relative size and geometry. Zone-specific dewatering needs were compiled by summing the
estimated water volumes generated per zone, considering both infiltration rates and the average number of operating equipment units expected,
aligned with each zone’s contribution to the production plan (Table 16-29).
| |
Osisko Development Corp.
NI 43-101 Technical Report
Feasibility Study for the Cariboo Gold Project |
|
Table 16-29: Estimated
specific dewatering requirements per zone
| Mining Zone |
Average Equipment Fleet (units) |
Estimated Infiltration Rate(1) (m³/h) |
Estimated Operational Water Use(2) (m³/h) |
Contingency for peak flow
(m³/h) |
Total Dewatering Volume (m³/h) |
| Lowhee(3) |
- |
23 |
- |
12 |
35 |
| Cow |
9 |
57 |
26 |
29 |
112 |
| Valley |
9 |
41 |
26 |
20 |
86 |
| Shaft |
13 |
100 |
37 |
50 |
187 |
| Mosquito |
6 |
29 |
16 |
14 |
59 |
| Total |
37 |
250 |
104 |
125 |
479 |
| (1). | The infiltration rate was estimated for the entire sector as a whole, rather than on a zone-by-zone basis. It should be noted that
significant variability in infiltration rates between zones is possible. |
| (2). | Operational water use estimates include drilling, dust control, pipelines leak, backfill and washing. |
| (3). | Equipment count and estimated operational water use for the Lowhee Zone are not listed, as this zone will be mined using the same
equipment fleet allocated to the Mosquito Zone. |
| 16.9.4.2 | Dewatering Strategy |
The following is the general plan for managing
water from both infiltration and operational activities. Depending on the ramp configuration, certain levels are equipped with drain holes
to minimize reliance on pumping. Where drain holes are not feasible, water will be managed using submersible pumps installed in a Wilson
sump configuration, allowing transfer to another sump via the ramp system (Figure 16-52).
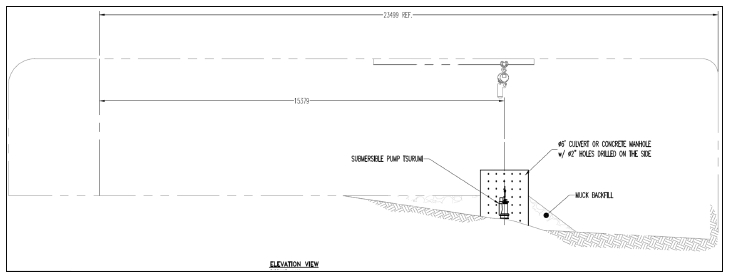
Figure 16-52: Typical sump
using the Wilson sump principle
| |
Osisko Development Corp.
NI 43-101 Technical Report
Feasibility Study for the Cariboo Gold Project |
|
At the start of the Project, and until the water
clarification systems in the Shaft and Valley zones (Shaft Mudwizard and Valley Mudwizard) become fully operational, water from mining
operations will be pumped to a temporary surface water clarification system located near the Cow portal entrance. Treatment will be carried
out using portable sump units, each consisting of a tank, a skid-mounted system, and two 60 hp Technoprocess pumps (Figure 16-53).
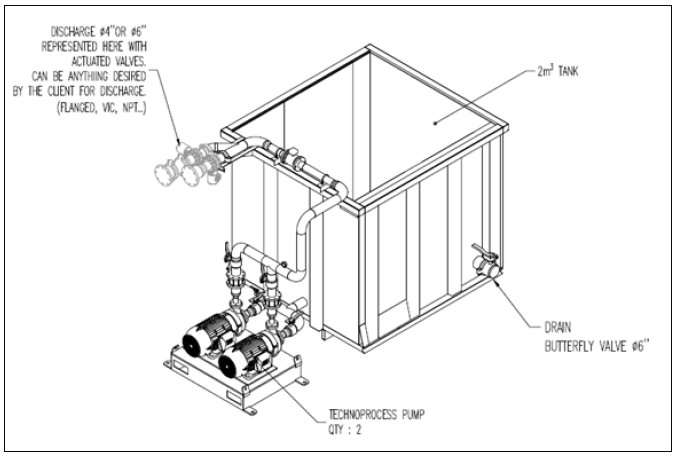
Figure 16-53: Typical drawing
for the tank on skid and technoprocess pump
Once the water clarification systems are operational,
collected water will be pumped to the Mudwizard units, where it will be treated and the clarified water redistributed within the mine
to support ongoing operations. To supply operational areas with clean water, Tsurumi LH series submersible pumps installed in tanks will
feed the mine service water line, distributing water to various levels.
At each water clarification station, one pump
will deliver water to lower levels, while another will supply higher levels. The system is designed to pump water to the highest practical
level, maintaining a target pressure of approximately 100 psi. Once water reaches the uppermost distribution point, it will be directed
into another tank equipped with a secondary Tsurumi LH series submersible pump for further distribution.
| |
Osisko Development Corp.
NI 43-101 Technical Report
Feasibility Study for the Cariboo Gold Project |
|
Any clarified water not used in operations will
be pumped back to surface using high-pressure stationary Technojet pumps. A typical water management flow sheet is illustrated in the
Figure 16-54.
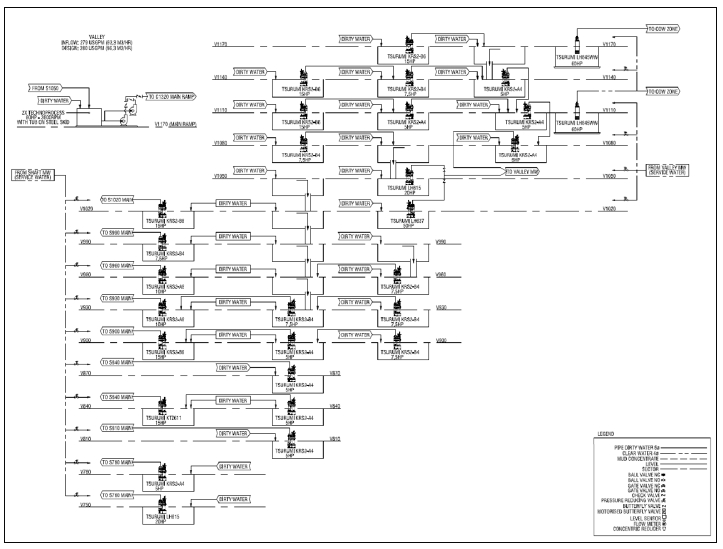
Figure 16-54: Typical water
management flow sheet (Valley Zone)
| 16.9.5 | Water Clarification System |
Contaminated water from various areas of the mine
is first directed to a conditioning sump, where it is agitated to maintain solids in suspension. A heavy-duty submersible pump, capable
of handling coarse particles, transfers the slurry to a Mudwizard polymer dosing system, where polymer pucks are used to initiate flocculation.
| |
Osisko Development Corp.
NI 43-101 Technical Report
Feasibility Study for the Cariboo Gold Project |
|
The flocculated water then flows to a series of
settling cones, where solid-liquid separation occurs. This system is engineered to reduce the concentration of suspended mine sludge by
a factor of 10:1, significantly improving water clarity and enabling reuse of the treated water in mine operations.
The resulting clear water is collected in a clean
water sump, where Tsurumi LH submersible pumps distribute it to both upper and lower operational levels. Any excess water not required
for operations is pumped to surface using a multistage centrifugal pump.
Meanwhile, the underflow from the settling cones—managed
by peristaltic pumps—is directed to the slurry discharge system. At the end of the process, decantation sumps are used to thicken
the slurry, making it suitable for handling by LHD units. The thickened material is then transported and disposed under control in empty
stopes as backfill.
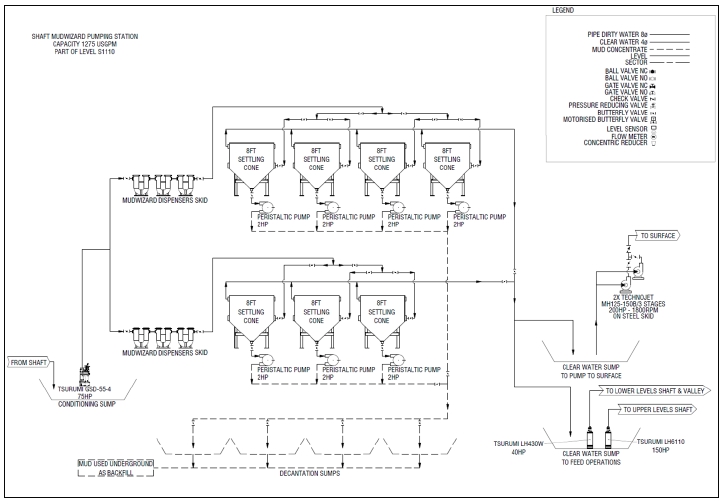
Figure 16-55: Mudwizard
system schematic
| |
Osisko Development Corp.
NI 43-101 Technical Report
Feasibility Study for the Cariboo Gold Project |
|
| 16.9.6 | Underground Electrical Distribution |
InnovExplo was responsible for developing the
strategy for the underground electrical distribution system. Meglab Electronique oversaw the design and assessment of the complete underground
electrical infrastructure.
The Project site power distribution input voltage
is 13.8 kV, that is step down to 600 V and 1,000 V with dual output voltage electrical substations. Two feeders will be deployed
from Valley portal and Cow portal at surface to underground levels. Each zone can be powered from either Valley portal leg or Cow portal
leg to allow redundancy and load balancing.
Fixed loads like fans and pumps will be fed from
600 V grid and mobile equipment like Jumbos, bolters etc. will be fed from 1,000 V grid. In summary, the electrical distribution
will be done as follows:
| § | Underground main distribution voltage: 13.8 kV equipment; |
| § | Underground fixed equipment (pumps, fans, battery chargers etc.): 600 V; |
| § | Underground mobile equipment (Jumbos, bolters etc.): 1,000 V; |
| § | Underground services (lighting, heating, ventilation, and air conditioning
(“HVAC”), outlets, controls etc.): 120/208 V; |
The Project scope for this Study includes high-level
single line diagrams, load list, and bill of material (“BOM”) listing the major equipment and major cabling fittings with
their associated costs.
The design of the electrical distribution complies
to all applicable codes, standards, and regulations.
All the electrical equipment electrical loads
are assembled into the electrical load list, assuming a reasonable amount of mining activity in all zones and most levels. The actual
mining activity will be better defined as the mine production plan is developed and this will affect the load list moving forward to the
next design stage. The current electrical load list reflects a high, but not excessive, activity level and it is a suitable model for
moving forward with the design. Switchgears on surface and on levels were estimated. The FS design includes 13.8 kV-600/1,000 V,
1 MVA, 1.5 MVA or 2 MVA mobile substations allocated for each level. As the mine development and production plan is further
developed, the quantity and arrangement of the unit substations can be better defined. The reuse of mobile substations will also be possible
depending on the progress of the mine development.
| |
Osisko Development Corp.
NI 43-101 Technical Report
Feasibility Study for the Cariboo Gold Project |
|
| 16.9.7 | Underground Mine Equipment |
Equipment selection was carried out based on the
following criteria:
| § | Suitability for the planned size of the excavations; |
| § | Power output (kW) and associated ventilation requirements; |
| § | Average Mechanical Availability (%); |
| § | Capital and operating costs. |
InnovExplo, in collaboration with an independent,
external consultant, Mr. Robert Hamilton, worked on the equipment selection. Mr. Hamilton has a background in maintenance
and equipment supply.
A
list detailing the equipment selected can be found in Table 16-27 in
Section 16.8.1. Equipment quantities have been estimated to achieve the steady state mining rate of 4,900 tpd with allowances
for spares of critical equipment types.
Six Jumbos with two-booms will be used to drill
all rounds, which will be mainly related to the level access, haulage drift and ore access drift. Decline development, for main haulage
and level access will be handled mostly by two Sandvik Roadheaders that will excavate at an average rate of 200 m/month, as provided
by the contractor and equipment supplier quotations. Samples of different lithologies were sent to Sandvik laboratory in Austria to test
and validate rock cutting performance with the road header. On that base, a conservative performance of 200 m per month was assumed for
the Project, considering mucking, hauling, and ground support cycle.
Ore and waste material will be hauled using 51
t diesel trucks to fulfill the Project production. A fleet totalling 17 trucks, including 2 rentals trucks during peak period from Year
2 to Year 4, will be required to satisfy material movement requirements. Four trucks will be used for development, four for production
and nine for transfer at the peak demand.
Given the size of the ore drifts, 10 t LHD units,
which will be ready to be operated in a fully automated mode by Year 2, were selected to perform all mucking and backfilling tasks related
to the stoping activities and the management of the waste material from the development heading. A total of 11 units are planned during
the period of highest demand, including six units for development work, five units for stopes mucking, re-handling and backfilling activities.
Stopes will be drilled using three top hammer
longhole drills suitable for drilling 89 mm blastholes up to 30 m and three down the hole (“DTH”) drills that will be used
for V30 slot raises drilling as well as production drilling.
| |
Osisko Development Corp.
NI 43-101 Technical Report
Feasibility Study for the Cariboo Gold Project |
|
An effective productivity of 61% over a 12-hour
shift was considered for the performance of equipment associated with the development activities. An effective productivity of 54% over
a 12-hour shift was considered for LHD and trucks in manual mode, and a productivity of 60% and 66% over a 12-hour shift was considered
for LHD unit for the addition of tele-remote between shifts and fully automated mode, respectively.
| 16.9.8 | Communication Network Automation |
As the Project includes a significant automation
component, the communication network is very important. A complete long-term evolution (“LTE”) network will be deployed from
the surface by the Valley and Cow portals to every underground level. This network will support voice and data communication and will
be deployed everywhere in the mine.
Fiber-optic network who will be brought in every
electrical substation, pumping stations, crushing stations, and conveying site. Each level will have LTE distribution, with LTE radio
head connected to high quality radiating cable (supporting till 2 gigahertz (“GHz”) radio frequency). This one can support
Channel Aggregation (“CA”) LTE exceeding 40 megabits per second (“Mbps”) upstream bitrate for data and voice communication.
Many options can be deployed, such as cameras, tracking, blasting with "SMART BLAST”, telemetry of heavy equipment and production,
autonomous vehicles, teleoperated equipment, automation, and others. This could provide a full control of pump stations, ventilation on
demand, electrical station remote control operation (LHD, drill, haul trucks, etc.), and monitoring.
In addition, the security asset will be higher,
with a tagging system that can provide the position of every equipment, worker, and visitor underground.
The main data network combined with the PLC and
the LTE system brings all the information and control signals in both ways from the surface to everywhere underground. This can be realized
to optimize the operation and cost.
The envisioned automation strategy for LHD units
at the mine encompasses teleoperated mucking from the stopes and level loading bay that includes a re-muck as transitional ore storage.
The concept of the loading bay located in the access level separates the teleoperated equipment from the man operated equipment, thus
respecting regulation and permitting teleoperation for extraction and the loading of trucks at the load-out bays. On levels without a
loading bay, fully automated stope mucking operations will be secured by physical gates restricting access to all other vehicles in the
section associated with the mucking operation and will be limited to ore storage in designated ore re-muck drifts.
| |
Osisko Development Corp.
NI 43-101 Technical Report
Feasibility Study for the Cariboo Gold Project |
|
Based on discussions between equipment suppliers,
ODV, and InnovExplo on the automated mode capabilities as well as based on automated mode operations currently underway in some operations,
the operation’s schedule was built around a production capacity averaging 4,900 tpd, out of which an average of 30%, starting
in Year 2, is attributed to autonomous mucking over a 12-hour shift period assuming optimal setup conditions.
The
basis for automation places strict demands on a robust communications network. A sample mine communications system is shown in Figure 16-56.
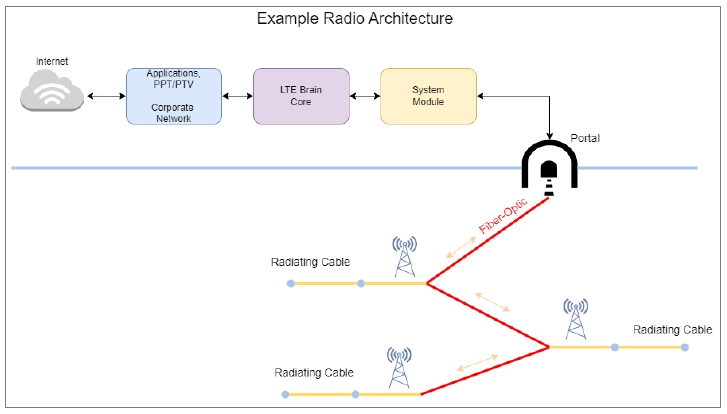
Figure 16-56: Schematic
of a standard mine communications system
The underground mine personnel will operate on
two 12-hour shifts per day for underground activities. Operations will be carried through 7 days a week, two shifts per day. It was assumed
that the mine will operate 365 days per year.
The mine will be operated using three different
rosters. A combination of a 4/3 and 5/2 (days working/days off) will be used for salaried personnel. Hourly employees are scheduled on
the basis of 14 days on, 14 days off roster on a fly-in fly-out (“FIFO”) schedule. The workforce will consist of maintenance
crews, operating personnel, and contractor personnel.
| |
Osisko Development Corp.
NI 43-101 Technical Report
Feasibility Study for the Cariboo Gold Project |
|
The salaried staff during the production period
will consist of an average of 169 people per rotation, including 25 office personnel, 110 operators, and 34 maintenance personnel. At
the peak point in the life of mine, this results in 26 office personnel, 137 operators, and 39 maintenance personnel.
Table 16-30: Underground
workforce per rotation - Distribution in time
| U/G Workforce per Rotation |
Year -3 |
Year -2 |
Year -1 |
Year 1 |
Year 2 |
Year 3 |
Year 4 |
| Mine Services Office Personnel |
6 |
6 |
10 |
10 |
10 |
10 |
10 |
| Development Operators |
14 |
28 |
39 |
39 |
39 |
39 |
34 |
| Drilling and Blasting Operators |
0 |
0 |
2 |
15 |
17 |
17 |
17 |
| Mucking and Blasting Operators |
11 |
21 |
33 |
49 |
53 |
55 |
50 |
| Services and Construction Operators |
9 |
13 |
20 |
21 |
20 |
15 |
17 |
| Shotcrete (Contractors) |
0 |
0 |
2 |
2 |
2 |
0 |
0 |
| Diamond Drilling (Contractors) |
0 |
4 |
6 |
6 |
6 |
6 |
6 |
| Total U/G Mine Services |
40 |
70 |
113 |
143 |
147 |
141 |
134 |
| U/G Maintenance Office Personnel |
12 |
9 |
16 |
16 |
16 |
16 |
16 |
| Mobile Mechanics |
3 |
4 |
14 |
20 |
22 |
22 |
16 |
| Fixed Mechanics |
0 |
1 |
1 |
2 |
2 |
3 |
3 |
| Electrics |
2 |
2 |
2 |
2 |
2 |
2 |
3 |
| Electro Mechanics |
1 |
2 |
2 |
3 |
3 |
4 |
4 |
| Welders |
2 |
7 |
7 |
6 |
7 |
5 |
7 |
| Automation & Communication |
1 |
1 |
1 |
1 |
1 |
1 |
1 |
| Fuel & Lube Attendant |
1 |
1 |
2 |
2 |
2 |
1 |
4 |
| Total U/G Maintenance |
21 |
26 |
44 |
51 |
55 |
54 |
54 |
Total U/G
(for Year -3 to Year 4) |
61 |
96 |
157 |
194 |
201 |
195 |
189 |
| |
Osisko Development Corp.
NI 43-101 Technical Report
Feasibility Study for the Cariboo Gold Project |
|
| U/G workforce per rotation |
Year 5 |
Year 6 |
Year 7 |
Year 7 |
Year 8 |
Year 9 |
Year 10 |
| Mine Services Office Personnel |
10 |
10 |
10 |
10 |
10 |
8 |
3 |
| Development Operators |
28 |
28 |
28 |
23 |
22 |
7 |
0 |
| Drilling and Blasting Operators |
18 |
18 |
17 |
18 |
18 |
14 |
1 |
| Mucking and Blasting Operators |
48 |
48 |
45 |
42 |
40 |
23 |
3 |
| Services and Construction Operators |
15 |
14 |
14 |
14 |
14 |
11 |
4 |
| Swatcrete (Backfill) (Contractors) |
0 |
0 |
0 |
0 |
0 |
0 |
0 |
| Diamond Drilling (Contractors) |
6 |
6 |
6 |
6 |
6 |
2 |
0 |
| Total U/G Mine Services |
69 |
66 |
65 |
62 |
60 |
35 |
6 |
| U/G Maintenance Office Personnel |
16 |
16 |
16 |
16 |
16 |
13 |
5 |
| Mobile Mechanics |
15 |
15 |
14 |
13 |
12 |
5 |
2 |
| Fixed Mechanics |
3 |
3 |
3 |
3 |
3 |
3 |
0 |
| Electrics |
3 |
3 |
3 |
3 |
3 |
3 |
3 |
| Electro Mechanics |
4 |
4 |
4 |
4 |
4 |
2 |
2 |
| Welders |
6 |
4 |
4 |
4 |
4 |
4 |
3 |
| Automation & Communication |
1 |
1 |
1 |
1 |
1 |
1 |
1 |
| Fuel & Lube Attendant |
4 |
4 |
4 |
4 |
4 |
4 |
4 |
| Total U/G Maintenance |
53 |
50 |
50 |
49 |
48 |
36 |
20 |
Total U/G
(for Year 5 to Year 10) |
178 |
174 |
170 |
161 |
158 |
101 |
31 |
| |
Osisko Development Corp.
NI 43-101 Technical Report
Feasibility Study for the Cariboo Gold Project |
|
The Cariboo Gold Project will ramp up to a processing
capacity of 4,900 tpd at the MSC, located in the town of Wells.
The processing flowsheet includes the following
unit operations: underground crushing and conveying to the surface, screening, ore sorting and tertiary crushing, grinding and gravity
concentration, and flotation and tailings dewatering. All mill tailings are returned underground as paste. The flotation concentrate is
trucked offsite for sale and the gravity concentrate undergoes further processing on a shaking table, followed by refining to produce
doré bars.
| 17.2 | Concentrator Process Design Criteria |
The process design criteria are presented in Table 17-1.
Table 17-1: Process design
criteria
| Process
Design Criteria |
Unit |
Value |
| Average Feed Grade |
g Au/t |
3.6 |
| ROM Tonnage |
tpd |
4,900 |
| Availabilities |
|
|
| ■ Underground crushing |
% |
65.0 |
| ■ Crushed ore reclaim and ore sorting |
% |
73.0 |
| ■ Grinding to paste plant |
% |
92.0 |
| Fine Ore Abrasion Index |
g |
0.26 |
| Ore Sorter Concentrate Abrasion Index |
g |
0.34 |
| Solids Specific Gravities |
|
|
| ■ ROM |
- |
2.84 |
| ■ Ore Sorter Concentrate |
- |
2.87 |
| ■ Ore Sorter Tailings Specific Gravity |
- |
2.80 |
| ■ Flotation Concentrate Specific Gravity |
- |
3.6 |
| ■ Flotation Tailings Specific Gravity |
- |
2.9 |
| |
Osisko Development Corp.
NI 43-101 Technical Report
Feasibility Study for the Cariboo Gold Project |
|
| Process
Design Criteria |
Unit |
Value |
| Mass Pulls |
|
|
| ■ Underground Crushing Fines (screening U/S) |
% |
30.0 |
| ■ Coarse Fraction to Ore Sorting |
% |
70.0 |
| ■ Fine Fraction Bypassing Ore Sorting |
% |
30.0 |
| ■ Ore Sorting Concentrate (combined) |
% |
50.0 |
| ■ Primary & Secondary Gravity Concentration |
% |
0.037 |
| ■ Rougher Flotation |
% |
19.0 |
| ■ 1st and 2nd Cleaner Flotation |
% |
50.0 |
| ■ Cleaner-scavenger Flotation |
% |
10.0 |
| ■ Flotation Concentrate (from rougher feed) |
% |
4.0 |
| Gold Recoveries |
|
|
| ■ Crushing and Ore Sorting Circuit |
% |
97.0 |
| ■ Primary & Secondary Gravity Concentrate |
% |
49.0 |
| ■ Rougher Flotation |
% |
99.0 |
| ■ Cleaner Flotation |
% |
94.0 |
| ■ Overall |
% |
93.0 |
| Grind Size to Rougher Flotation |
µm |
190 |
| Grind Size to Cleaner Flotation |
µm |
25 |
| 17.3 | Simplified Flowsheet and General Arrangement |
The following images show the simplified flowsheet
(Figure 17-1) and the overall general arrangement (“GA”) (Figure 17-2 to Figure 17-4) of the Project.
| |
Osisko Development Corp.
NI 43-101 Technical Report
Feasibility Study for the Cariboo Gold Project |
|
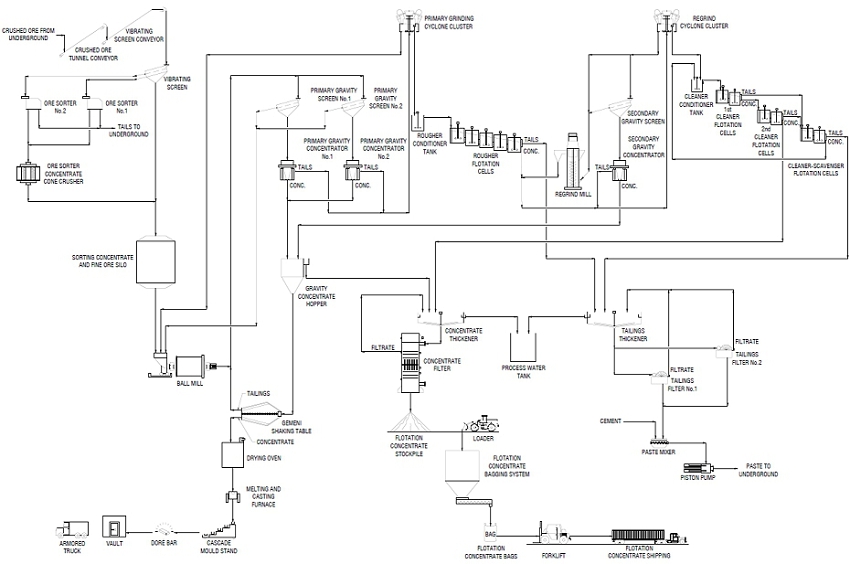
Figure 17-1:
Process simplified flowsheet
| |
Osisko Development Corp.
NI 43-101 Technical Report
Feasibility Study for the Cariboo Gold Project |
|
Figure 17-2: Cariboo Project
GA (western view)
| |
Osisko Development Corp.
NI 43-101 Technical Report
Feasibility Study for the Cariboo Gold Project |
|
Figure 17-3:
Cariboo Project GA (southern view)
| |
Osisko Development Corp.
NI 43-101 Technical Report
Feasibility Study for the Cariboo Gold Project |
|
Figure 17-4: Cariboo Project
GA (top view)
| |
Osisko Development Corp.
NI 43-101 Technical Report
Feasibility Study for the Cariboo Gold Project |
|
| 17.4 | Underground Crushing and Screening |
| 17.4.1 | Underground Crushing |
Underground crushing is discussed in Section 16.7
as part of the underground infrastructure scope. Crushed ore, with a P80 of 127 mm, will be delivered to the surface by a long-distance
belt conveyor at a throughput of 4,900 tpd. The conveying system operates 17.5 hours per day, equivalent to 280 tph at
73% availability.
The run of mine material will be fed to a double-deck
vibrating screen with a top screen aperture of 35 mm and a bottom screen aperture of 17 mm. The screen undersize, referred to
as “crushing fines” and representing 30% (84 tph) of the ROM, will bypass ore sorting and be sent directly to the sorting
concentrate and fine ore silo. The coarser material retained on the top deck will be directed to Ore Sorter No.1, while the finer material
retained on the second deck will be sent to Ore Sorter No.2. Overall, 70% (134 tph) of the retained material will be classified as
“coarse fraction” and sent to Ore Sorter No.1, while 30% (62 tph) will be classified as “fine fraction” and
sent to Ore Sorter No.2.
| 17.5 | Ore Sorting and Tertiary Crushing |
| 17.5.1 | Ore Sorting Circuit |
Two ore sorters will be used upstream of the mill
to reduce the volume of material processed at the plant. Both will operate at 73% availability, handling a combined feed of 3,430 tpd.
Ore Sorter No.1, equipped with a combined sensor
system featuring dual-energy X-ray transmission sensors, will process the coarse fraction (134 tph) from the vibrating screen. Ore
Sorter No.2, using dual-energy XRT technology, will process the fine fraction (62 tph).
The ore sorting circuit will achieve a combined
mass pull rate of 50%, recovering 98 tph of ore sorting concentrate. The concentrate will be conveyed to tertiary crushing via the
ore sorters concentrate discharge conveyor. This conveyor will be equipped with a belt scale. The crushing fines, particles too small
to be effectively sorted, will bypass the sorters and report directly to the fine or silo.
The 98 tph of ore sorter tails will be transported
back underground via the ore sorter tails conveyor to a mine raise and will be disposed of as waste rock. This conveyor will be equipped
with a belt scale.
The ore sorting area is serviced by the ore sorting
area overhead crane.
| |
Osisko Development Corp.
NI 43-101 Technical Report
Feasibility Study for the Cariboo Gold Project |
|
The combined ore sorter concentrate, with a P80
of 46 mm, will be transported to the ore sorter concentrate cone crusher via the ore sorters concentrate discharge conveyor. This
conveyor will be equipped with a belt scale. The crusher, set with a closed side setting of 13 mm, will produce material with a P80
of 10.6 mm. The crusher discharge will be conveyed to the concentrate and fine ore sorting silo by two conveyors, where it will be
combined with the crushing fines from the vibrating screen undersize.
| 17.6 | Grinding and Primary Gravity Concentration Circuit |
| 17.6.1 | Sorting Concentrate and Fine Ore Silo |
The sorting concentrate and fine ore silo will
receive crushed ore sorter concentrate (98 tph) and crushing fines from the vibrating screen undersize (84 tph). Material stored
in the silo will be discharged onto the silo discharge belt feeder, which will transfer it to the ball mill feed conveyor for delivery
to the ball mill for grinding.
The silo will discharge 3,185 tpd of material,
equivalent to a feed rate of 144 tph at 92% availability. The downstream unit operations, including the paste plant, will operate
at 92% availability as well.
The ball mill feed conveyor will be equipped with
a ball mill feed belt scale to measure the fresh feed entering the mill. Additionally, grinding media will be fed to the ball mill via
the ball mill media feed hopper onto this same conveyor.
The grinding circuit will consist of a 4.57 m
diameter ball mill powered by a 2,450-kW single motor. The ball mill will operate in closed circuit with the primary gravity concentration
circuit and the primary grinding cyclone cluster, grinding the material to a P80 of 190 μm.
The ball mill will receive material from the sorting
and fine ore silo at a rate of 144 tph. Additionally, the ball mill will handle the cyclone underflow (361 tph) and the oversize
material from the primary gravity screens.
The grinding area will be serviced by the grinding
and flotation area overhead crane, which will also service the flotation area.
| |
Osisko Development Corp.
NI 43-101 Technical Report
Feasibility Study for the Cariboo Gold Project |
|
| 17.6.3 | Primary Gravity Circuit |
The ball mill trommel screen will discharge into
the ball mill discharge pump box at a rate of 561 tph, which will feed two gravity parallel circuits, each handling 280 tph.
Each circuit will be composed of a screen and
a gravity concentrator, with a capacity of 400 tph, which will operate in batch mode. The concentrators will recover 0.037% of the
fresh feed solids as concentrate. The primary gravity concentrate will be sent to the gravity concentrate hopper along with the secondary
gravity concentrate (refer to Section 17.11) for further concentration using a shaking table.
| 17.6.4 | Primary Grinding Cyclone Cluster |
The primary grinding cyclone cluster will process
the tails from the primary gravity concentration at a rate of 505 tph. The cyclone overflow product, designed with an average P80
of 190 μm and a circulating load of 250%, will flow by gravity to the trash screen. The undersize from the trash screen will then
feed the rougher conditioner tank, supplying the flotation circuit at a rate of 144 tph. Meanwhile, the cyclone underflow, totalling
361 tph, will be recirculated to the ball mill.
| 17.7 | Flotation, Regrind and Secondary Gravity Concentration |
The rougher flotation circuit includes a rougher
conditioner tank, providing 4 minutes of conditioning time, and five 40 m³ rougher flotation tanks, offering a total retention
time of 18 minutes. Flotation will occur at natural pH levels between 7.5 and 8.5. The flotation area will be serviced by the grinding
and flotation area overhead crane, which will also service the grinding area.
Potassium amyl xanthate will be used as a collector,
and methyl isobutyl carbinol as a frother.
The trash screen undersize (144 tph) will
first enter the rougher conditioner tank, where it will be mixed with reagents before rougher flotation. The conditioned pulp will then
proceed to five successive rougher flotation cells. The circuit is designed to recover 19% of the feed mass. The rougher flotation concentrate
collected in the cell launders will be sampled by the rougher flotation concentrate sampler and sent to the regrind cyclone feed pump
box for further concentration.
The rougher flotation tails, as well as the cleaner-scavenger
flotation tails, will flow to the flotation tails pump box. Final tails will be sampled by the final flotation tails sampler before being
directed to the tailings thickener feed box for dewatering.
| |
Osisko Development Corp.
NI 43-101 Technical Report
Feasibility Study for the Cariboo Gold Project |
|
| 17.7.2 | Regrind Cyclone Cluster |
The regrind cyclone feed pump box will receive
fresh rougher flotation concentrate, as well as regrind mill discharge and tailings from the secondary gravity concentrator. The cyclone
overflow product, with an average P80 of 25 μm and a circulating load of 400%, will flow by gravity to the cleaner conditioner
tank and will be sampled by the cleaner flotation feed sampler.
The cyclone underflow will be divided into two
streams: two-thirds will feed the regrind mill, while the remaining one-third will be directed to the secondary gravity screen.
| 17.7.3 | Secondary Gravity Concentrator |
The secondary gravity screen will receive one-third
of the regrind cyclone cluster underflow. The screen oversize will be sent to the regrind mill, and the screen undersize will be processed
by the secondary gravity concentrator. The gravity concentrator, with a capacity of 150 tph, will operate in batch mode. The secondary
gravity concentrate will be combined with the primary gravity concentrate in the gravity concentrate hopper (refer to Section 17.11)
and fed to the shaking table and gold room for production of doré bars.
The regrind mill, a vertical stirred mill, will
receive material from the regrind cyclone cluster underflow. It will reduce the material P80 from 190 μm to 25 μm to liberate
the material before the following steps of flotation. The regrind mill will discharge 77 tph of material back into the regrind cyclone
feed pump box.
| 17.8 | Cleaner Flotation and Cleaner-scavenger Flotation |
The cleaner flotation circuit will include a cleaner
conditioner tank, two 15 m³ 1st cleaner flotation cells, followed by two 2nd cleaner flotation cells.
Polyfloat 7040, a gold collector, will be added to the conditioner tank, 1st cleaner flotation and 2nd cleaner flotation.
PAX will also be distributed to this circuit and may be added as needed. The MIBC will be used as frother.
| |
Osisko Development Corp.
NI 43-101 Technical Report
Feasibility Study for the Cariboo Gold Project |
|
The grinding cyclone cluster will feed the cleaner
conditioner tank, where it will be mixed with reagents before the first stage of cleaner flotation. The conditioned pulp will then proceed
to two successive 1st cleaner flotation cells, along with concentrate from the cleaner-scavenger flotation stage. This step
will be designed to recover 50% of the fresh feed mass of concentrate and rejecting the same amount as tails. The floated 1st
cleaner concentrate collected in the cell launders will be sent to the 2nd cleaner flotation stage, while the tails will be
sent to cleaner-scavenger flotation stage, along with 2nd cleaner tails.
The 2nd cleaner flotation will consist
of two successive cells and receive the 1st cleaner flotation stage’s concentrate. This second stage will be designed
to recover 50% of the feed mass, yielding concentrate and rejecting the same amount as tails. The floated 2nd cleaner concentrate
collected in the cell launders will be sent to the final concentrate pump box for dewatering, and sampled by the cleaner flotation concentrate
sampler. The tails will be sent to cleaner-scavenger flotation stage, along with 1st cleaner tails.
| 17.8.2 | Cleaner-Scavenger Flotation |
The cleaner-scavenger flotation circuit will feature
two 15 m³ cleaner-scavenger cells, operating at natural pH levels using Polyfloat 704 and PAX collector and MIBC frother. The
concentrate collected in the cell launders will be recirculated to the 1st cleaner flotation stage.
The cleaner-scavenger tails will be sampled by
the cleaner-scavenger flotation tails sampler and directed to the flotation tails pump box, along with rougher flotation tails. These
final tails will be sampled by the final flotation tails sampler before being transferred to the tailings thickener feed box for dewatering.
| 17.8.3 | Onstream and Particle Size Analysis |
The flotation circuit will be monitored using
an Onstream Analyzer and a Particle Size Analyzer, which will provide results at predetermined intervals to facilitate real-time operation
of the process. The following flotation streams will be analyzed as specified:
| ■ | Rougher flotation feed: Onstream and particle size analysis. |
| ■ | Rougher flotation concentrate: Onstream analysis. |
| ■ | 1st cleaner flotation feed: Onstream and particle size analysis. |
| ■ | Final flotation concentrate: Onstream and particle size analysis. |
| ■ | Final flotation tails: Onstream analysis. |
| ■ | Cleaner-scavenger flotation tails: Onstream analysis. |
| |
Osisko Development Corp.
NI 43-101 Technical Report
Feasibility Study for the Cariboo Gold Project |
|
The streams will continuously flow through a multiplexer,
which immediately returns them to the process, unless samples are retained for analysis. At scheduled intervals, the multiplexer will
divert a specific stream to either the Onstream Analyzer or the Particle Size Analyzer. After analysis, the demultiplexer will retrieve
the samples and reintroduce them into the process at appropriate locations in the system.
| 17.9 | Concentrate Dewatering |
The flotation concentrate will undergo a two-stage
dewatering process. The first stage will use a high-rate concentrate thickener to thicken the concentrate to 62% solids by weight in the
underflow. This will be followed by dewatering in the concentrate filter before stockpiling and shipment via trucks.
The process begins with the final concentrate,
entering the concentrate thickener feed box. The material is then fed into the concentrate thickener. Flocculant will be added to aid
thickening.
The thickener underflow will then be pumped to
the concentrate filter feed tank and subsequently fed to the vertical concentrate filter (a filter press) for further dewatering. The
filtrate is collected in the concentrate filtrate tank and returned to the concentrate thickener feed box. The dewatered concentrate cake
is stockpiled, bagged using the Flotation Concentrate Bagging System, and loaded into trucks for shipment.
| 17.10.1 | Flotation Tailings Dewatering |
The flotation tailings, consisting of combined
rougher and cleaner-scavenger tails, will undergo a two-stage dewatering process. The first stage involves thickening the tails to 62%
solids by weight in the underflow using a high-rate tailings thickener. This will be followed by further dewatering through two tailings
filters before the material is processed into paste backfill.
The combined rougher tailings and cleaner-scavenger
tailings from the flotation tails pump box will be directed to the tailings thickener feed box and then into the tailings thickener. Flocculant
will be added to enhance thickening. The thickener overflow will be sent to the process water tank for reuse.
| |
Osisko Development Corp.
NI 43-101 Technical Report
Feasibility Study for the Cariboo Gold Project |
|
The thickener underflow will be pumped to the
tailings filter tank and subsequently fed to two tailings filters operating in parallel. Filtrate from the filters will be collected in
two tailings filtrate receivers and returned to the tailings thickener feed box. The dewatered tailings cake will be discharged onto the
tailings tilter cake conveyor, where it will be weighed by the tailings filter cake belt scale. The dewatered tailings will either be
directed to the paste mixer or deposited onto an emergency dry storage stockpile.
| 17.10.2 | Paste Production and Distribution |
The dewatered tailings produced by the tailings
filters will be mixed with cement and water in a high-intensity paste mixer, forming a paste that will then be pumped to underground stopes
using a piston pump. The paste plant is serviced by the paste plant area overhead crane.
Dry cement will be stored in an outdoor cement
silo and conveyed to the paste mixer via the cement silo screw feeder and the cement scale belt conveyor. The prepared paste will then
be pumped underground by the piston pump, with a spare pump available as a backup.
| 17.11 | Gravity Concentrate Refinery |
The gravity concentrate hopper receives the primary
gravity concentrate and secondary gravity concentrate from the gravity concentration circuits.
The combined gravity concentrate will first be
processed through the shaking table magnetic separator before being fed to the table for further gold concentration. Middlings will be
directed to the final concentrate pump box, while the tailings will be sent to the ball mill discharge pump box. The concentrate from
the table will be dried in an oven and melted with flux in an induction furnace to produce doré.
| 17.12 | Water and Air Services |
| 17.12.1 | Fresh Water Distribution |
The fresh water tank will receive water from the
treated underground mine water to supply various operations. Fresh water will be used for the concentrate filter cloth wash, manifold
wash, and pressing water, as well as for the gland seal water pump, reagent preparation and paste density control.
| |
Osisko Development Corp.
NI 43-101 Technical Report
Feasibility Study for the Cariboo Gold Project |
|
| 17.12.2 | Process Water Distribution |
The process water tank will receive water from
the overflows of the concentrate and tailings thickeners, along with make-up water from the fresh water tank. Process water is to be used
in the mill unit operations. Any excess process water will be directed to the water treatment plant.
The plant will be equipped with one duty and one
standby high-pressure plant air compressor, along with a plant air receiver, to supply air throughout the facility. Instrumentation air
will also be sourced from this compressor and receiver, but also passing through a plant air dryer and a plant dry air receiver.
Compressed air for the two ore sorters will be
provided by a dedicated ore sorter air compressor (with a standby unit), an ore sorter air dryer (also with a standby unit), and a separate
ore sorter air receiver for each sorter.
Flotation air will be supplied by one duty and
one standby air blower. The rougher flotation circuit will use one blower set, while the 1st cleaner, 2nd cleaner,
and cleaner-scavenger flotation cells will share a second set.
Compressed air for the concentrate filter will
come from a dedicated filter press air compressor (with a standby unit) and a filter press air receiver. Compressed air for the tailings
filter will come from a dedicated tailings dewatering air compressor (with a standby unit), which will supply the two disc filter air
receivers, one for each filter.
| 17.13 | Reagents Preparation and Distribution Systems |
The PAX and flocculant systems will include preparation
units comprising a bagged reagent addition system (for solid form reagents), an agitated mixing tank, a transfer pump, a distribution
tank, and metering pumps. The PAX distribution system will feature three operating pumps and one standby pump, while the flocculant distribution
system will have two operating pumps and one standby pump. The flocculant system will also include two flocculant static mixers to complete
the dilution process before delivering the solution to the concentrate and tailings thickeners.
The MIBC and Polyfloat 7040 reagents will be received
in totes and distributed to the flotation circuit using metering pumps. The MIBC distribution system will consist of six operating pumps
and two standby pumps, while the Polyfloat 7040 system will consist of four operating pumps and two standby pumps.
| |
Osisko Development Corp.
NI 43-101 Technical Report
Feasibility Study for the Cariboo Gold Project |
|
| 17.14 | Concentrator Personnel |
A list of the planned concentrator personnel for
the concentrators is provided in Table 17-2.
Table 17-2: Concentrator
personnel
| Description |
Mill |
| Mill Superintendent |
1 |
| Maintenance Superintendent |
1 |
| Production Supervisor |
4 |
| Metallurgist |
2 |
| Metallurgical Technician |
2 |
| Supervisor Operation and Maintenance |
2 |
| Mechanical Planner |
2 |
| Automation and Control Technician |
2 |
| Subtotal Staff |
16 |
| Solution Operator |
4 |
| Refiner |
2 |
| Ore Sorter Operator |
4 |
| Grinding Operator |
4 |
| Flotation Operator |
4 |
| Dewatering and Paste Plant Operator |
4 |
| Control Room Operator |
4 |
| Mill Helper |
6 |
| Loading Station Operator |
8 |
| Subtotal Operations |
40 |
| Millwright & Stationary Equipment Mechanic |
20 |
| Mechanic - Apprentice |
4 |
| Electrician |
4 |
| Electrician - Apprentice |
4 |
| Subtotal Maintenance |
32 |
| Total |
88 |
| |
Osisko Development Corp.
NI 43-101 Technical Report
Feasibility Study for the Cariboo Gold Project |
|
| 17.15 | Power, Reagents and Consumables |
The process plant uses propane for heating. The
estimated annual propane consumption is approximately 1.2 million litres. This estimate is based on the operational heating requirements,
expected runtime of heating systems, and the efficiency of propane combustion equipment.
Power requirements
for the process plant were derived from the equipment list in which expected motor sizes for all
equipment and ancillaries have been provided. Each motorized item of equipment was assigned utilization, efficiency and load factors to
obtain the data presented using the load list and the expected utilization factors. The power demand of 8.2 megawatts (“MW”)
is estimated.
| 17.15.3 | Reagents, Cement, and Consumables |
Estimated consumption rates of reagents and consumables
are listed in Table 17-3. It should be noted that the consumption has been estimated based on laboratory test work.
Table 17-3: Consumption
of reagents and consumables
| Reagent
or Consumable |
Unit |
Consumption |
| MIBC (Frother) |
kg/t |
0.24 |
| PAX (Collector) |
kg/t |
0.05 |
| PF 7040 (Collector) |
kg/t |
0.03 |
| Flocculant |
kg/t |
0.03 |
| Cement |
% |
3.7 |
| Grinding Media (3 in) |
kg/t |
0.55 |
| Grinding Media (0.75 in) |
kg/t |
0.18 |
| |
Osisko Development Corp.
NI 43-101 Technical Report
Feasibility Study for the Cariboo Gold Project |
|
| 18. | Project Infrastructure |
The Project’s surface infrastructure and
services are designed to support the operations at the MSC and Bonanza Ledge Site. The Cariboo Gold Project also includes offsite infrastructure,
such as a new 69 kV transmission line (“TL”) between the Barlow substation, near Quesnel, BC, and the MSC.
The Project will be comprised of three different
areas, together referred to as the Mine Site:
| 1. | The Mine Site Complex, near the District of Wells, BC. Close-up image shown in Figure 18-2. |
| 2. | The Bonanza Ledge Site. |
| 3. | Offsite infrastructure to support the operations of the Project. |
A distance of 3.5 km separates the MSC from
the Bonanza Ledge site.
Figure 18-1 shows the Mine Site definition,
including the underground mine area, Mine Site surface footprint, Barkerville historic town and park, the District of Wells boundary,
as well as important routes and corridors.
| |
Osisko Development Corp.
NI 43-101 Technical Report
Feasibility Study for the Cariboo Gold Project |
|
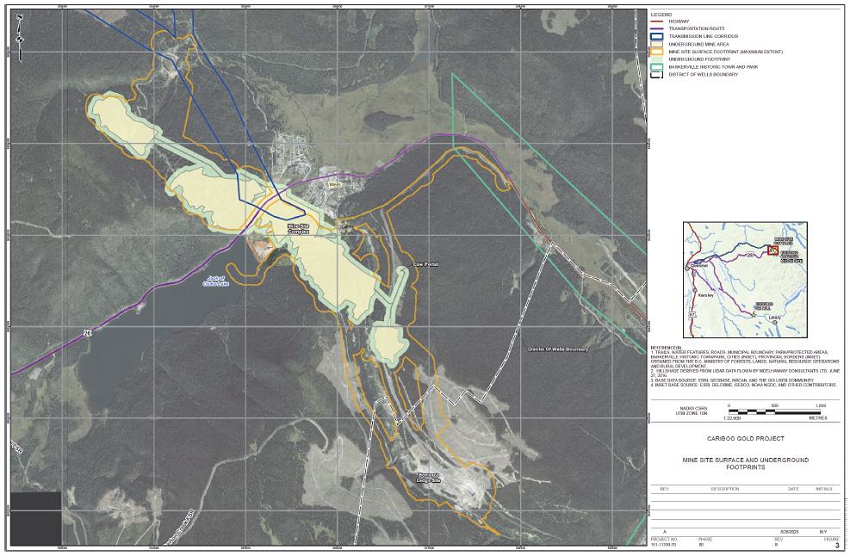
Figure 18-1: Mine Site
surface and underground footprints
| |
Osisko Development Corp.
NI 43-101 Technical Report
Feasibility Study for the Cariboo Gold Project |
|
The Project envisions the construction and upgrades
of the following key infrastructure items:
Bonanza Ledge Site:
| ■ | Full waste rock storage facility; |
| ■ | Water management infrastructure – flood management reservoir (“FMR”),
surface water channels and culverts, sumps and ponds, pumping stations, and pipelines; |
| ■ | Water treatment systems and revised water management plan (“WMP”)
to sustain operations until Year 3 (at which point water treatment is moved to the MSC); |
| ■ | Diesel fuel storage and distribution; |
| ■ | Ore crushing and sorting facility; |
| ■ | Overburden storage facility; |
| ■ | Existing warehouse, workshop, and electrical distribution. |
Mine Site Complex (Wells):
| ■ | Access roads and parking areas; |
| ■ | A concentrator building area, summarized in Chapter 17, which includes: |
| - | Inclined conveyor moving material from the underground crusher to surface; |
| - | Ore sorting and tertiary crushing; |
| - | Gravity circuit with a gold room capable of producing doré bars; |
| - | Beneficiation circuit capable of producing a gold flotation concentrate; |
| - | Secondary electrical room for paste backfill. |
| ■ | Diesel fuel storage and handling facilities; |
| ■ | 69 kV / 13.8 kV electrical substation; |
| ■ | Security facilities and access gates; |
| ■ | Firewater pumping station and firewater distribution piping system; |
| ■ | Treated effluent discharge line from the Mine Site water treatment system
(“WTS”), connecting to a diffuser in Jack of Clubs Lake; |
| ■ | New bridge over the Willow River (“Willow River Bridge”); |
| ■ | Fiber optic network interconnecting the main areas of the MSC; |
| |
Osisko Development Corp.
NI 43-101 Technical Report
Feasibility Study for the Cariboo Gold Project |
|
| ■ | New potable water well and associated potable water treatment and distribution
system; |
| ■ | Sewage treatment system; |
| ■ | Surface water channels and culverts, French drains, sumps and ponds, pumping
stations, and pipelines; |
| ■ | Mine water treatment plant (“WTP”); |
| ■ | Site electrical distribution and lighting. |
Offsite Infrastructure:
| ■ | The construction of a 69 kV power line connecting BC Hydro’s Barlow
substation and the site’s 69 kV / 13.8 kV substation; |
| ■ | Ballarat camp facility expansion, expanding capacity of 76 to 264 occupants; |
| ■ | Mine ventilation and heating infrastructure. |
| |
Osisko Development Corp.
NI 43-101 Technical Report
Feasibility Study for the Cariboo Gold Project |
|
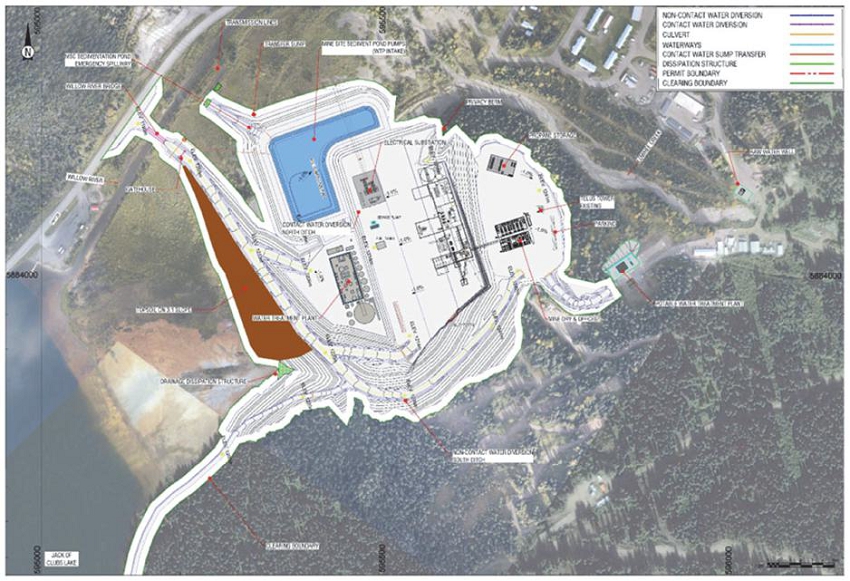
Figure 18-2: Cariboo Gold
Project Mine Site Complex general arrangement
| |
Osisko Development Corp.
NI 43-101 Technical Report
Feasibility Study for the Cariboo Gold Project |
|
| 18.2 | Geotechnical Investigations |
Geotechnical investigations were performed at
the MSC and Bonanza Ledge. The investigations helped to inform the design of the following facilities:
| ■ | Water management structures; |
The respective QPs for this section deem that
the studies listed below were carried out in a professional manner to acceptable standards and are suitable for use in this Study.
At the MSC, a geotechnical site investigation
was conducted, including a desktop study, and intrusive drilling and test pitting. Interpretation of results focused on overburden characterization
and depth to bedrock to determine suitability as foundation material, and stability of both excavated and fill slopes. Geotechnical drilling
and test pitting generally confirmed in situ surficial sediments are till. Historic waste rock is piled near the planned tunnel portal
elevation. Beyond the toe of the pile, the low wetland area consists of deposited historic mill tailings.
| 18.2.1.2 | Water Management Structure |
Golder (now WSP) completed a geotechnical site
investigation at the MSC in 2021 following a scope of work developed as part of a gap analysis completed for the feasibility design of
the proposed bulk fill area and MSC sediment pond. The site investigation was conducted to collect additional information on the existing
foundation conditions for the MSC sediment pond. The investigation included ten cone penetration tests, drilling 23 sonic boreholes, and
carrying out large penetration testing, and excavating test pits. Samples were collected for laboratory testing. Standpipe piezometers
and vibrating wire piezometers (“VWP”) were installed in select boreholes. Based on the information collected, Golder (now
WSP) completed a design for the water management infrastructure in 2023 (WSP, 2023). Subsequently, Okane reviewed and updated the design
of the MSC water management infrastructure to reflect changes at the MSC. Section 18.3.4 provides a summary of the updated MSC water
management infrastructure.
| |
Osisko Development Corp.
NI 43-101 Technical Report
Feasibility Study for the Cariboo Gold Project |
|
Golder completed a geotechnical site investigation
at the Bonanza Ledge Site in 2021 (Golder, 2022), to address a gap analysis completed for the feasibility design of the WRSF. The site
investigation was conducted to collect additional information on the existing foundation conditions of the WRSF. The investigation included
drilling 13 boreholes, carrying out large penetration testing (“LPT”), cone penetration tests (“CPT”), shear vane
tests and excavating 15 test pits. Samples were collected for laboratory testing, and standpipe piezometers and vibrating wire piezometers
(“VWP”) were installed in selected boreholes.
| 18.3 | On-site Infrastructure |
The following subsections outline the existing
infrastructure that will be essential for the full-scale development of the Cariboo Gold Project.
| 18.3.1 | Surface Mobile Equipment |
The Project operations will require a select fleet
of surface mobile equipment throughout construction for the general maintenance of the site roads and operating areas. Material handling
equipment will be used to transport equipment and materials to work fronts and utilized for rigging support as required. Personnel lifts
and heating / light plants will be used to execute final installation in a safe manner for the workers and those in the surrounding areas.
The proper selection of surface equipment is responsible for ensuring construction activities are completed as per schedule. Table 18-1
lists the rental equipment that will be required for the construction period.
Table 18-1: Rental equipment
to support construction
| Construction Equipment Rentals |
Description |
| Cranes |
230 t Crawler or AT |
| 100 t Rough-terrain |
| 20 t Boom Truck |
| Material Handling - Surface |
12,000 lb Telehandler |
| 5,000 lb Telehandler |
| Large Tool Carrier (966 or equivalent) |
| Tractor and Float |
| Rigging |
| Site Services Including Road Maintenance |
Grader – 140 Class |
| Dozer – D6 Class |
| Loader – 950 Class |
| Excavator – 336 |
| Skid Steer |
| Water Truck |
| Roll-off Truck |
| Personnel Lifts |
125 ft Aerial Work Platform |
| 85 ft Aerial Work Platform |
| 50 ft Aerial Work Platform |
| 45 ft Aerial Work Platform |
| 40 ft Scissor Lift |
| 35 ft Scissor Lift |
| Heaters and Light Plants |
350,000 BTU Diesel Heater |
| 8 kW Light Plant |
| |
Osisko Development Corp.
NI 43-101 Technical Report
Feasibility Study for the Cariboo Gold Project |
|
Once construction is completed the operation will
require fewer surface mobile equipment to operate as most of the activities will occur underground. Support equipment will be required
mainly for consumable receiving, site maintenance and waste placement. See Table 18-2 for a list of equipment that will be required
for the Project.
Table 18-2: List of Equipment
for Operations
| Operation Surface Equipment |
Description |
Status |
| Material Handling - Surface |
Dozer - D8 Class |
Rental |
| Loader – 644 Class |
Owned |
| Site Services |
Grader – 872 Class |
Owned |
| 12,000 lb Telehandler |
Rental |
| Excavator – 250 Class |
Owned |
| Skid Steer – 330 Class |
Owned |
| |
Osisko Development Corp.
NI 43-101 Technical Report
Feasibility Study for the Cariboo Gold Project |
|
| 18.3.2 | Site Water Management |
The objective of water management is to meet water
supply requirements, protect infrastructure from interruptions and damage from flooding, and ensure that discharge of surplus water to
the environment meets regulatory requirements. Water management system components will include:
| ■ | Diversion of non-contact runoff around the Project footprint; |
| ■ | Collection, storage, treatment and release of surplus contact water; |
| ■ | Water supply to the mill; |
The mine dewatering system will operate continuously
to maintain suitable operating conditions in the underground. Water will be pumped from the underground workings to the surface for treatment
and release.
To minimize the amount of runoff water requiring
collection and treatment, drainage from upslope areas (i.e., non-contact water) will be diverted around the active footprint of the Project
and into local watercourses. Runoff from within the active footprint (i.e., contact water) will be collected and treated prior to discharge
to the receiving environment.
The Project will have a combined storage and treatment
capacity to manage the Environmental Design Flood (“EDF”). The EDF is defined in this assessment as the runoff generated from
a 30-day (duration), 200-year (return period) rain plus snowmelt event, adjusted for climate change (Section 20.3.3.1).
Water management will have two distinct stages
during operations. Stage 1 is the period when the mine is under development. Stage 2 is when the mine is at full production and the mill
is operating. Key components of Stage 1 and Stage 2 water management are as follows:
Water Management Stage 1:
| ■ | Ore will be stockpiled at Bonanza Ledge. Waste rock will be placed in the
WRSF at Bonanza Ledge. The WRSF will be lined to minimize waste rock seepage to the underlying groundwater system. |
| ■ | Bonanza Ledge contact water will be collected in the Bonanza Ledge Sediment
Control Pond (“SCP”), Pond A, or Pond B, and treated at the Bonanza Ledge WTP. Treated effluent will be discharged to Lowhee
Creek. |
| |
Osisko Development Corp.
NI 43-101 Technical Report
Feasibility Study for the Cariboo Gold Project |
|
| ■ | The Bonanza Ledge FMR will be available for storage of contact water during
extreme runoff events. |
| ■ | Initially, mine dewatering will be pumped via the Cow portal and treated
at the Bonanza Ledge WTP. |
| ■ | Part-way through Stage 1, the MSC WTP will be commissioned. Mine dewatering
will be pumped out via the Valley portal and treated at the MSC WTP from that point forward. The Bonanza Ledge WTP will continue to treat
contact water at Bonanza Ledge for the remainder of Stage 1. |
Water Management Stage 2:
| ■ | Mined rock will be sorted underground. Ore will be transported to the mill
and waste rock to the WRSF at Bonanza Ledge. |
| ■ | The WRSF footprint will be expanded to accommodate the life-of-project waste
rock quantity. |
| ■ | Ore will be processed at the mill and concentrate will be shipped offsite.
Tailings paste will be backfilled in the underground. Bleed water from the backfill will be collected with the mine dewatering system. |
| ■ | Bonanza Ledge WTP will be decommissioned. Contact water from Bonanza Ledge
will be piped to the MSC pond for storage and subsequent treatment and released from the MSC WTP. |
| ■ | MSC WTP effluent will be used for freshwater requirements to the mill to
meet gland/seal and reagent mixing demand. Unused effluent will discharge to Jack of Clubs Lake. |
Following operations, the WRSF will be reclaimed.
Mine dewatering will cease, and the underground will be allowed to flood by natural recharge.
Figure 18-3 (Stage 1) and Figure 18-4
(Stage 2) show flow diagrams depicting the connectivity of the water management system components. Overview maps showing catchment areas
and conveyance channels are shown on Figure 18-5 (BL, Stage 1), Figure 18-6 (BL, Stage 2), and Figure 18-7 (MSC, Stage 2).
| |
Osisko Development Corp.
NI 43-101 Technical Report
Feasibility Study for the Cariboo Gold Project |
|
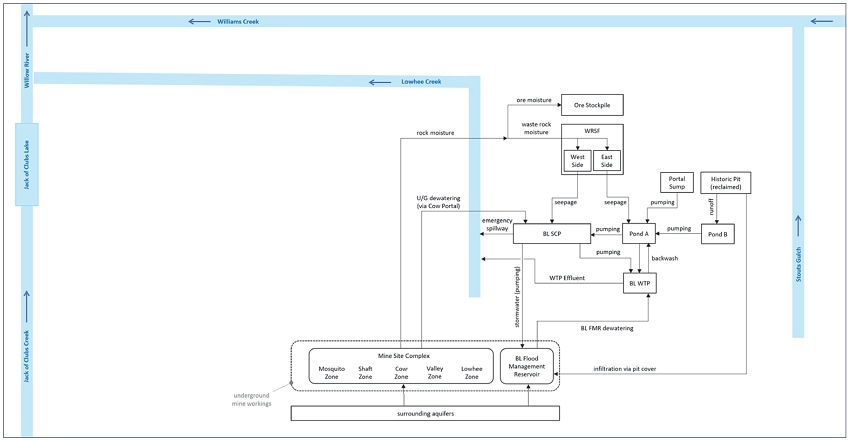
Figure 18-3: Flow Diagram
– Water Management Stage 1
| |
Osisko Development Corp.
NI 43-101 Technical Report
Feasibility Study for the Cariboo Gold Project |
|
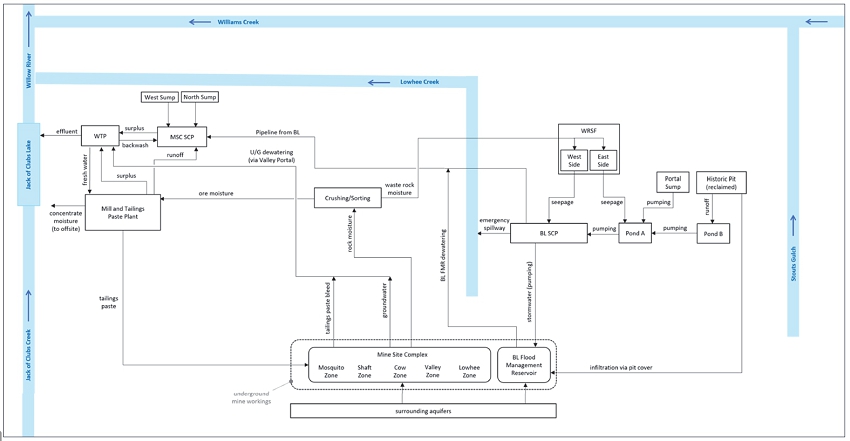
Figure 18-4: Flow Diagram
– Water Management Stage 2
| |
Osisko Development Corp.
NI 43-101 Technical Report
Feasibility Study for the Cariboo Gold Project |
|
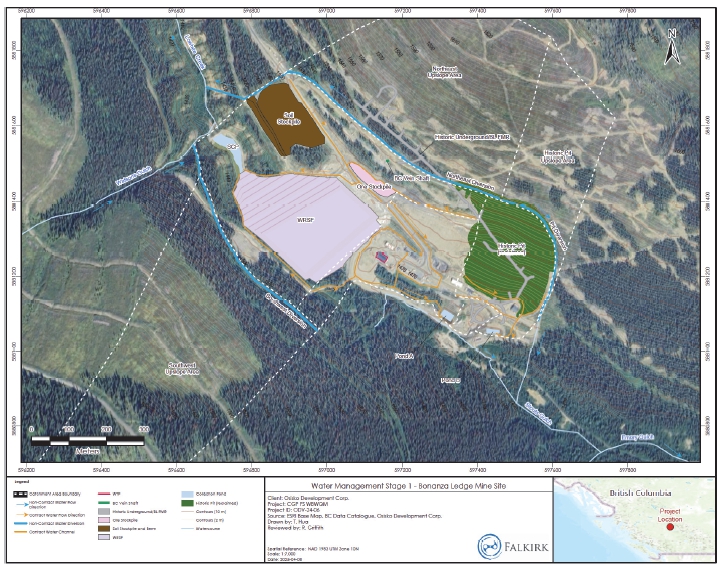
Figure 18-5: Bonanza Ledge
– Water Management Stage 1
| |
Osisko Development Corp.
NI 43-101 Technical Report
Feasibility Study for the Cariboo Gold Project |
|
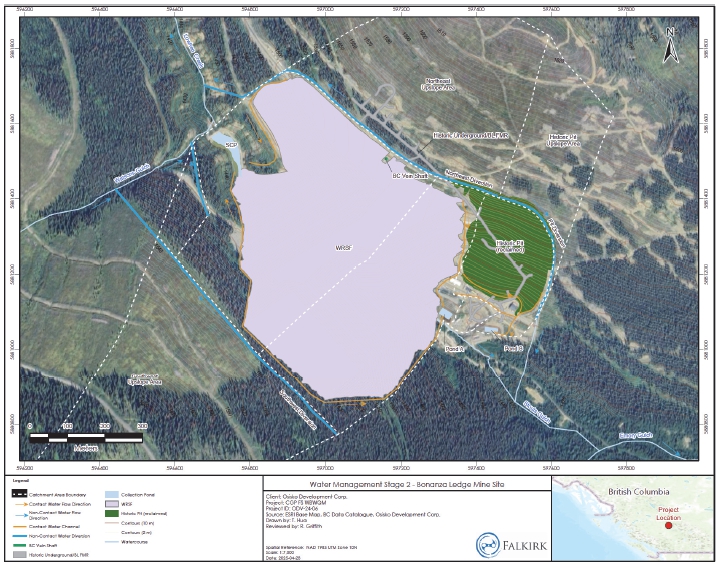
Figure 18-6: Bonanza Ledge
– Water Management Stage 2
| |
Osisko Development Corp.
NI 43-101 Technical Report
Feasibility Study for the Cariboo Gold Project |
|
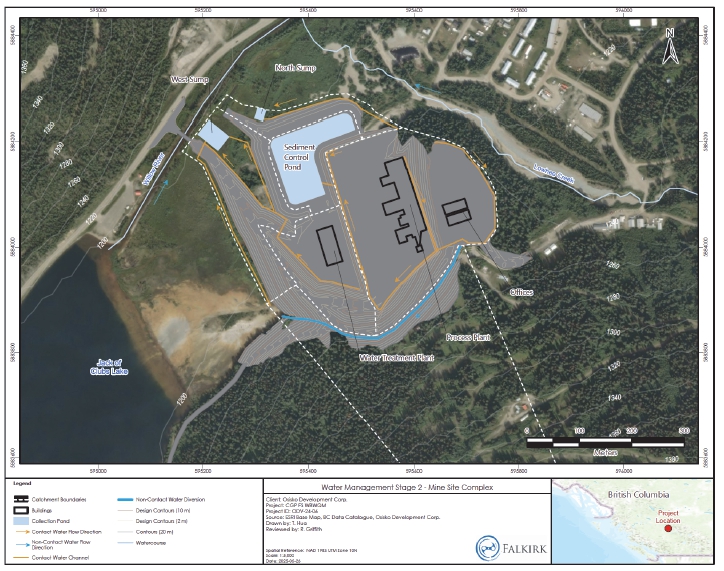
Figure 18-7: Mine Site
Complex – Water Management Stage 2
| 18.3.3 | Bonanza Ledge Area Water Management Infrastructure |
Existing Infrastructure
The Bonanza Ledge Site is not currently active
in mining or material handling but maintains existing operational water management infrastructure, including:
| ■ | Contact water collection channels: These channels collect surface water from
developed site areas and convey to ponds and, eventually, to the existing water treatment facility at Bonanza Ledge. |
| |
Osisko Development Corp.
NI 43-101 Technical Report
Feasibility Study for the Cariboo Gold Project |
|
| ■ | Contact water collection ponds and sumps: These facilities are intended to
collect and store contact water temporarily, prior to being conveyed to the water treatment facility located at Bonanza Ledge. The key
existing facilities include: |
| - | Ponds A and B are two smaller ponds, collecting contact water from the partially backfilled open pit and local runoff. Water in Pond
B is pumped to Pond A, which is then pumped to the WTP. |
| ■ | Water treatment plant: Located south of the existing WRSF. |
Proposed Infrastructure
For the Project, existing water management infrastructure
will be reused and upgraded, as needed, to meet the Project design basis requirements. In particular, the Bonanza Ledge SCP and dam, and
the WTP are key components of the water management system and will be upgraded and incorporated into the Project’s new WMP.
The proposed water management infrastructure for
Bonanza Ledge is designed to support the Project water management strategy and achieve the following objectives:
| ■ | Intercept and divert non-contact runoff: Wherever practical, runoff from
non-contact drainages will be collected and conveyed downstream of the Project site and discharged downstream of the Bonanza Ledge SCP,
in Lowhee Creek. Non-contact diversion channels will either be built (new channels) or existing ones will be upgraded, as required. |
| ■ | Manage contact water: Contact water will be collected through a system of
channels, and ponds. As much as possible, this water will be reused for internal mining and operational purposes. The excess water will
be monitored for water quality and will be treated, if necessary, before being discharged to the receiving environment. |
The existing water management infrastructure will
be reused and upgraded, as needed, to meet the Project design basis requirements. In particular, the SCP and the WTP are key components
of the water management system that will be upgraded and incorporated into the Project’s new water management system. The existing
WTP will be upgraded to process the Bonanza Ledge Site contact water collected at the SCP and Pond A. Contact water drainage from
the WRSF will be collected using a system of contact water collection ditches, and will be conveyed to the SCP or Pond A, as illustrated
in Figure 18-8. Water from both ponds will be conveyed to the WTP. Treated water will be discharged to the environment. As described
in the water management strategy, the existing WTP located within the Bonanza Ledge area will be active during Stage 1 of operations.
The discharge from the WTP to the receiving environment is located downstream of the SCP, into Lowhee Creek. During subsequent stages
of operations, the water treatment will cease at the Bonanza Ledge Site, and water will be conveyed by pipeline to the MSC WTP that will
discharge its treated effluent to Jack of Clubs Lake.
| |
Osisko Development Corp.
NI 43-101 Technical Report
Feasibility Study for the Cariboo Gold Project |
|
An emergency pumping line will be built between
the SCP and the Bonanza Ledge FMR, located underground. This system is anticipated to be activated during extreme storm events, if water
levels in the SCP exceed a critical threshold. The system was selected to maintain the safety and integrity of the SCP, and prevent overtopping
of the pond’s dam. Water will be temporarily stored in the FMR and, following the extreme storm event, it will be pumped to the
WTP for treatment and discharge to the receiving environment.
The historic open pit located east of the WRSF
will be backfilled, covered and revegetated. Drainage from the reclaimed area will be collected and conveyed to the existing Pond B, pumped
to Pond A and then treated at the WTP. The water quality from the reclaimed historic open pit runoff will be monitored and when it meets
the criteria to be classified as “non-contact” water, the collection channel will be redirected to discharge to the receiving
environment, into Stouts Gulch.
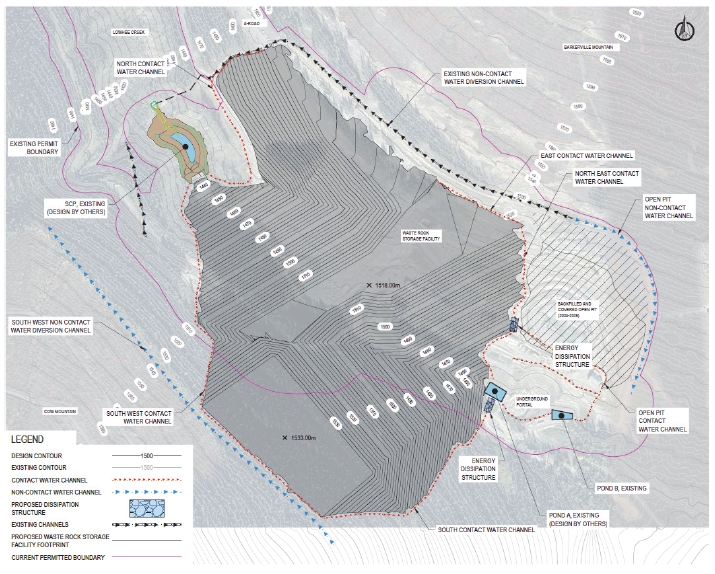
Figure 18-8: Bonanza Ledge
Site water management infrastructure layout
| |
Osisko Development Corp.
NI 43-101 Technical Report
Feasibility Study for the Cariboo Gold Project |
|
Summary of Key Water Management Infrastructure
Non-contact water diversion:
| ■ | Southwest non-contact diversion channel: Collects non-contact runoff from
the southwest catchment area, above the WRSF, and conveys it northward, toward Watson’s Gulch, which connects to the Lowhee Creek,
downstream of the SCP. |
| ■ | Existing non-contact water diversion channel: This channel, located north
of the WRSF collects non-contact runoff from the Barkerville Mountain (north of the Bonanza Ledge Site) and conveys it towards the northwest,
along the A Road. At the northern edge of the Bonanza Ledge Site, the channel crosses A Road through a culvert and follows the
edge of the property, conveying water down to Lowhee Creek. The channel outlet will be located downstream of the SCP. |
| ■ | Open pit non-contact water channel: This channel will collect the non-contact
runoff from the Barkerville mountain (north of the reclaimed open pit) and convey it around the open pit footprint, on the eastern edge,
and discharge towards Stouts Gulch. |
Contact water collection channels:
| ■ | East and northeast contact water channels: Collects the contact water runoff
from the northeastern area of the WRSF footprint and conveys it to the Bonanza Ledge Pond A. |
| ■ | North contact water channel: Collects the contact water runoff from the northwestern
area of the WRSF footprint and conveys it to the SCP. |
| ■ | South contact water channel: Collects the contact water runoff from the southeastern
area of the WRSF footprint and conveys it to the Bonanza Ledge Pond A. |
| ■ | Southwest contact water channel: Collects water from the southwestern WRSF
footprint to route it to the SCP. |
Emergency flood management system:
| ■ | Flood management reservoir: Using existing underground openings, the FMR
will have a storage capacity of up to 84,000 m³. It is intended to remain empty, filling only during flood events when the SCP is
overwhelmed. |
| - | A set of pumps and pipeline will connect the SCP to the FMR. This system will be operational only when water levels in the SCP reach
a pre-determined threshold. |
| - | A set of pumps and pipeline will connect the FMR to the water treatment facility. This system will start operating following a flood
event that triggers the emergency pumping system. The water will be pumped from the FMR to the WTP. |
| - | A set of pumps and pipeline will connect the SCP to the WTP. |
| - | A set of pumps and pipeline will connect Pond B to Pond A, and Pond A to the SCP. |
| |
Osisko Development Corp.
NI 43-101 Technical Report
Feasibility Study for the Cariboo Gold Project |
|
Water storage infrastructure:
| ■ | Sediment Control Pond: The SCP is the main contact water collection pond,
receiving the majority of contact water from the waste storage facility. Its storage capacity is designed to safely manage water from
extreme storm events. The existing SCP will be completely rebuilt as a lined facility that will connect to the WRSF liner. Additional
upgrades include the addition of a pump station and pipelines for transferring to the WTP and the FMR. The primary pond outlet is to the
WTP, via pumping. During an extreme storm event, a secondary pond outlet will be the FMR, via emergency pumping. A third outlet is an
emergency outlet structure, designed to safely manage flows associated with the Inflow Design Flood (“IDF”) and discharge
downstream of the SCP, into Lowhee Creek in a controlled manner. The emergency overflow spillway consists of outlet pipes securely anchored
to the embankment. |
| ■ | Pond A: Located at the southeastern edge of the WRSF, the existing Pond A
is intended as a temporary storage for non-contact water from the waste rock facility to be collected prior to being pumped to the WTP
via the SCP. |
| ■ | Pond B: Located near Pond A and south of the backfilled open pit, Pond B
is intended as a temporary storage for non-contact water, from the backfilled and reclaimed historic open pit, to be collected and pumped
to Pond A. |
| 18.3.4 | Mine Site Complex Area Water Management Infrastructure |
The water management infrastructure for the MSC
is designed to support the Project’s water management strategy and achieve the following objectives:
| ■ | Intercept and divert non-contact runoff: Wherever practical, non-contact
water will be collected and conveyed for discharge downstream of the MSC area, to the Willow River. |
| ■ | Manage contact water: The MSC contact water will be collected through a system
of channels, culverts, French drains and sumps, and conveyed to the MSC SCP. The MSC SCP will also receive contact water from the Bonanza
Ledge SCP, as described in the site water management section (Section 18.3.2). As much as possible, contact water will be reused
for the mining process and operational purposes. |
| ■ | The MSC WTP: Treats contact water from mine dewatering activities and the
MSC SCP. The treated effluent will be used to supply freshwater at the mill, and the remaining unused treated effluent will be discharged
to Jack of Clubs Lake via a diffuser. |
Figure 18-9 shows the layout of the MSC water
management infrastructure. Contact water collection channels and French drains are designed to collect contact water that would accumulate
on the MSC pad areas where the offices, process plant concentrator and WTP are located. These channels are located at the periphery of
the MSC pad areas.
| |
Osisko Development Corp.
NI 43-101 Technical Report
Feasibility Study for the Cariboo Gold Project |
|
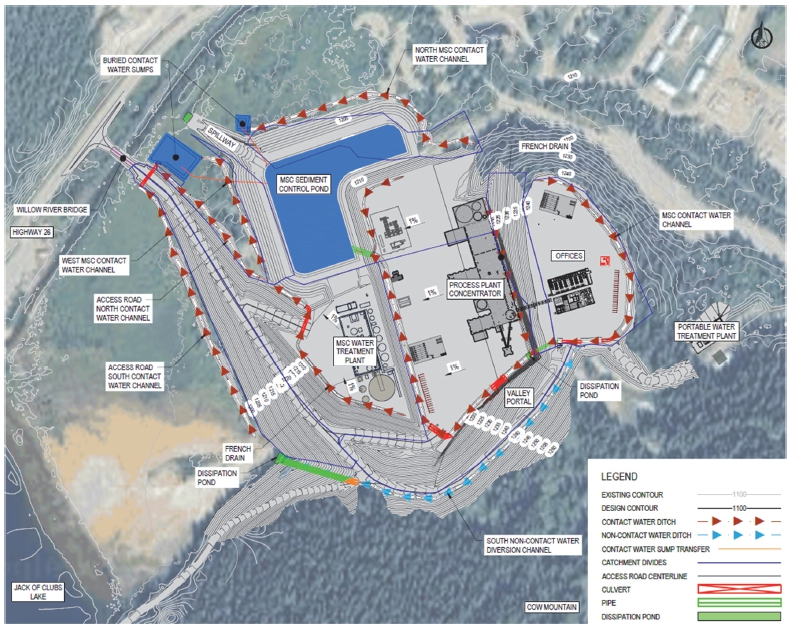
Figure 18-9: Mine Site
Complex water management infrastructure layout
 |
Osisko Development Corp.
NI 43-101 Technical Report
Feasibility Study for the Cariboo Gold Project |
 |
Summary of Key Water Management Infrastructure
Non-contact water diversion:
| ■ | South non-contact diversion channel: Collects non-contact runoff from the
south catchment area, above the MSC area, and conveys it westward, toward the Jack of Clubs Lake. |
Contact water collection channels:
| ■ | MSC contact water channel: Collects the contact water that accumulates on
the MSC pad areas where the offices and process plant are located. The channel is located at the periphery of the pads and conveys water
directly to the MSC SCP. A French drain, located behind the process plant concentrator, collects contact water from the plant and the
upstream slope leading to the offices pad. It connects to the MSC contact water channel. |
| ■ | North and west MSC contact water channels: Collect the contact runoff from
the MSC SCP embankments. The channels convey contact water to two sumps that are operated to remain empty by pumping the stored water
to the MSC SCP. |
| ■ | Access road north and south contact water channels: The access road connecting
the MSC site to Highway 26 is flanked with north and south contact water channels to collect contact runoff and convey it to a sump that
is operated to remain empty by pumping the stored water to the MSC SCP. A French drain at the western edge of the MSC WTP pad area will
collect contact runoff accumulating on the pad and the portion of the access road that is located immediately above the pad. Water collected
in the French drain will be conveyed to the access road north contact water channel. |
Water storage infrastructure:
| ■ | Mine Site Complex Sediment Control Pond: The MSC SCP is the main contact
water collection pond, receiving water from the MSC area. It will also receive water from the Bonanza Ledge SCP during Stage 2 of operations,
as defined in Section 18.3.2. The pond is designed to safely manage the EDF without overflowing into the environment. The primary
pond outlet is to the WTP, via pumping. The pond has an emergency spillway designed to safely manage flows associated with the IDF and
discharge into Willow River. |
| ■ | Contact water sumps: Located at the northwestern edge of the MSC area, on
either side of the MSC SCP spillway, the two sumps are operated to remain empty by pumping the stored water to the MSC SCP. |
Diffuser and pipeline:
| ■ | Diffuser pipeline: A pipeline will connect the MSC WTP to a diffuser to be
located on the Jack of Clubs lakebed. |
|
Osisko Development Corp.
NI 43-101 Technical Report
Feasibility Study for the Cariboo Gold Project |
|
| ■ | Diffuser: Located approximately 240 m from the southern shoreline, in the
northeast portion of the Jack of Clubs Lake, a diffuser will be installed on the bottom of the lake in about 15 m of water depth.
The diffuser will be 189 m long, orientated perpendicular to the lake long axis, and composed of eight 3” DR9 HDPE nozzles
for all seasons. The diffuser system is designed to meet regulatory guidelines for dilution of the effluent. |
Infrastructure at the Bonanza Ledge Site will
consist of a WRSF, associated water management, water treatment infrastructure (for the first 3 years of the life).
Existing Infrastructure
The Bonanza Ledge Site has an existing overburden
stockpile that will be used in support of the closure plan for the previous operations, prior to the Project. The site also has an existing
WRSF that contains PAG waste rock from previous operations. In preparing for the foundation and liner system for the Bonanza Ledge WRSF,
the design assumes that both the existing overburden stockpile and the PAG waste rock will be removed prior to construction.
Proposed Infrastructure
A WRSF with an elevation of 1,533 m and a
capacity for approximately 7,940,000 m3 (15,880,000 t, assuming a density of 2.0 t/m3) of waste rock storage,
will be built in the northern limits of the Bonanza Ledge property, located approximately 3.5 km from the MSC to the southeast. The
WRSF is situated within a valley northwest of the WTP and southeast of the Bonanza Ledge SCP. The WRSF is designed to have slopes of 3H:1V
with inclusion of working benches to manage erosion. This results in an overall slope of 3.3H:1V. The proposed slopes and construction
method will allow for lower bench slopes to be progressively reclaimed while upper lifts of the WRSF are being built. This will reduce
the need for rehandling at closure to accommodate the closure design of the WRSF.
Prior to construction, removal of existing PAG
waste rock and overburden stockpiled materials will be carried out. Foundation preparation activities include removal of vegetation and
organic material, as well as re-sloping of the overburden materials to support the installation of a liner system up to elevation 1,470
m to cover the final WRSF footprint. The design of the underdrain and liner system has been completed by Knight Piésold.
|
Osisko Development Corp.
NI 43-101 Technical Report
Feasibility Study for the Cariboo Gold Project |
|
A geotechnical slope stability assessment was
conducted on the proposed WRSF. Stability analyses were performed for the base case representing long-term conditions, as well as sensitivities
considering seismic loading conditions and an increased water table. Geotechnical acceptance criteria selected for the WRSF are based
on those recommended by the British Columbia Mine Waste Rock Pile Research Committee (BCMWRPRC, 1991). Modelling inputs were determined
based on previous investigations, laboratory testing, instrumentation data and experience. Based on modelling results, the stability of
the proposed WRSF meets the minimum factor of safety (“FoS”) requirements for all scenarios.
A layout plan showing the WRSF location is shown
in Figure 18-10.
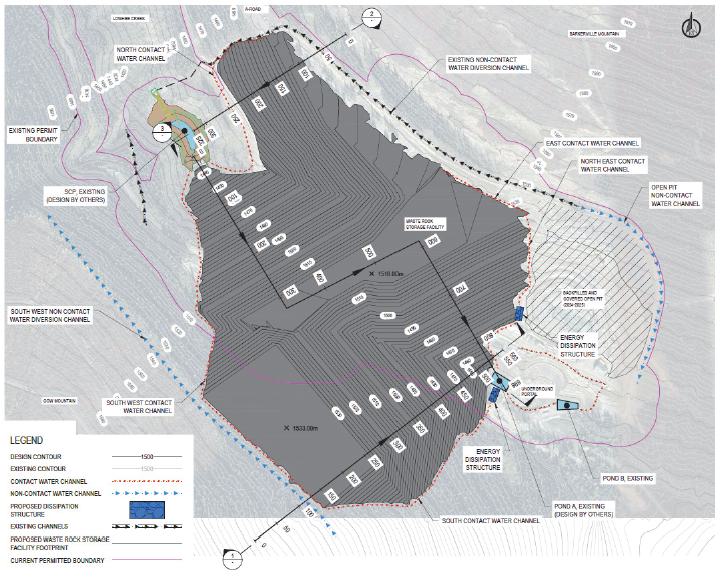
Figure 18-10: Layout plan
showing the WRSF location
|
Osisko Development Corp.
NI 43-101 Technical Report
Feasibility Study for the Cariboo Gold Project |
|
Existing Infrastructure
The Bonanza Ledge WTP is configured to treat contact
and surface runoff water via two primary treatment systems: one for sulphate and metals removal, and a second for nitrogen species. The
sulphate/metals train consists of a four-chamber reactor tank and barium chloride system, followed by a clarifier for solids separation.
Downstream of the clarifier, treatment continues through multimedia and bag filters operated in series, with pH adjustment completed prior
to final discharge.
The nitrogen removal system is based on a Moving
Bed Biofilm Reactor (“MBBR”) to manage nitrate using denitrification. Sludge generated in the process is dewatered using geotubes.
Chemical dosing systems are used for pH adjustment, coagulant addition, sulphate precipitation, and metals treatment.
Proposed Infrastructure
As part of the Project, two water treatment plants
were proposed and permitted, one for the MSC and another at Bonanza Ledge. An opportunity was identified to build a combined WTP as a
more efficient way to treat mine impacted water. Due to the proximity and similar water characteristics, it was decided to expand the
design of the MSC WTP to treat water from both the MSC and Bonanza Ledge.
Prior to constructing the MSC, the Bonanza Ledge
WTP will be upgraded to treat a total discharge flow of 200 m3/h. The upgrade will also include adding a barium hydroxide
chemical treatment system as well as additional polishing filtration. Ultrafiltration (“UF”) and reverse osmosis or nanofiltration
(“RO” or “NF”) will be installed at the back end of the WTP for advanced filtration. While both RO and NF technologies
remain under consideration, the current design favors NF to reduce operational complexity and avoid the need for post-treatment remineralization.
These upgrades will allow the treatment of water from the different project components during the construction phase and align with the
newly permitted discharge limits. The Bonanza Ledge WTP is meant to operate until the MSC WTP is constructed and operational.
| 18.3.5.3 | Water Treatment Conveyance Infrastructure (Pumping and Pipelines) |
Existing Infrastructure
Prior to the start of the Project, Bonanza Ledge
will be equipped with pump stations and pipe systems to meet the water treatment conveyance requirements of the Project. The pumping stations
and pipeline systems are designed to transfer water directly, or indirectly, to the water treatment plants from the Bonanza Ledge SCP
and the FMR.
|
Osisko Development Corp.
NI 43-101 Technical Report
Feasibility Study for the Cariboo Gold Project |
|
Proposed Infrastructure
Two pumping stations will be installed at Bonanza
Ledge prior to the start of the Project. A 1,100 m3/h (200 m3/h from the FMR) capacity pump station having
2x 50% configuration will be installed to transfer water from the Bonanza Ledge FMR to the Bonanza Ledge SCP. An existing 200 m3/h
capacity pump station having 1x 100% configuration is used to transfer water from the Bonanza Ledge SCP to the Bonanza Ledge WTP.
Two water pipeline systems will be installed at
the site, one for each pumping station described earlier. The water pipelines will be of high-density polyethylene (“HDPE”)
material of construction and will be installed above grade.
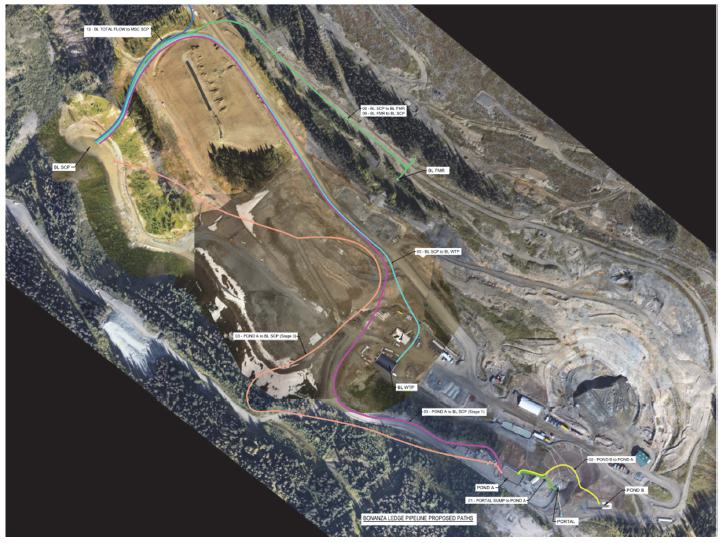
Figure 18-11: Proposed
Bonanza Ledge pipeline pathways
|
Osisko Development Corp.
NI 43-101 Technical Report
Feasibility Study for the Cariboo Gold Project |
|
| 18.3.5.4 | Surface Support Infrastructure |
An existing modular office building will be reused
for the operation at Bonanza Ledge. Additionally, the existing workshop, warehouse, electrical distribution infrastructure, and fuel storages
(diesel and propane) will be reused for the Project.
| 18.3.5.5 | Fuel Storage and Distribution |
The Bonanza Ledge site will be serviced by three
10,000 L diesel fuel tanks and a 10,000 L gasoline fuel tank, all previously existing infrastructure. The tanks are double-walled and
distribution will consist of fuel dispensing systems, pumps, filtration units, and spill containment measures. Safety features include
fire suppression systems, containment areas, and emergency shutoff controls. Service and filling of storage tanks will be completed by
tanker trucks.
Arrangement of fuel storage considers applicable
regulations, such as required offsets.
ODV has an office complex at the MSC across Lowhee
Creek from the District of Wells. The facility was used in the past to support the previous operations at Bonanza Ledge and various exploration
programs.
Existing infrastructure related to the MSC includes:
| ■ | Access Road: In general, access to the site is from A Road, which is
accessed from Highway 26 and located between the District of Wells and the Ballarat Camp. |
| ■ | First Aid/Emergency Service: The existing first aid/emergency services office
is located on Ski Hill Road in Wells. |
| ■ | Bulk Explosive Storage and Magazines: ODV has an existing explosive storage
with adequate capacity to support pre-production. Once the underground storage is built, the existing explosive storage area will no longer
be used for operations. |
| ■ | IT and Telecommunication Services: ODV’s Bonanza Ledge Mine operations
have existing IT and telecommunication services available to support the activities at Bonanza Ledge during the life of the Project, including
internet, telephone, and fibre optic. Mine operating requirements and capacity have been defined and staged and will require new communications
services as described in Section 18.3.6.9 |
|
Osisko Development Corp.
NI 43-101 Technical Report
Feasibility Study for the Cariboo Gold Project |
|
| 18.3.6.1 | Site Preparation at the Mine Site Complex |
It is proposed to build the MSC on the site of
the historical Cariboo Gold Quartz Mine. All infrastructure will be new and will require clearing to establish the MSC footprint. The
site is covered by vegetation with limited immature coniferous and deciduous trees. A clearing of 100,000 m2 will be required.
Upon completion of clearing, 57,000 m3 will require stripping and grubbing. Where possible, excavated material from the
concentrator building, Valley portal, and MSC WTP pad will be placed as backfill for civil works, including the site access roads, concentrator
building and water management infrastructure. Additional engineered fill will be generated from a mobile jaw crusher fed by waste rock
generated from the underground mining development.
Permanent Bridge
The Willow River Bridge is designed as a bridge
consisting of steel girders with a concrete deck. The deck will be flared to accommodate the additional width required for the vehicles
turning off and on from Highway 26. The bridge will span 21.4 m.
The Lowhee Creek Bridge was confirmed to be 100 t
rated, which will not require upgrades to the structure in the future. Upgrades to the approaches will be performed.
Main Access Road
Vehicles and visitors will go through a security
check point before being granted access to the premises. Following the Willow River Bridge and security check point, the main access road
will be capped with gravel and will span to reach the security check point. Design of the main access road will account for on-highway
rated traffic only; no off-road vehicle loading is expected. Additionally, access to the MSC will also be possible to the east by the
Lowhee Creek Bridge, at a crossing right next to the existing office complex.
The approximate total length of the main access
road is approximately 1.1 km, from Highway 26 through the concentrator building area and ending at the MSC WTP.
Access Gates
One access gate will be required to manage incoming
and outgoing traffic from the MSC. This gate will be located at the toe of the access ramp to the MSC across the Willow River Bridge.
|
Osisko Development Corp.
NI 43-101 Technical Report
Feasibility Study for the Cariboo Gold Project |
|
Light Vehicle Roads
The WTP effluent discharge access road will branch
from the main MSC access road. This portion of road will be for light vehicle traffic only.
Parking Area
Development of the mill process plant and office
complex/mine dry will include provision for parking of personnel vehicles. This will allow for parking spaces to accommodate up to 20
light vehicles. The parking area will be built according to applicable BC provincial regulation and safety standards.
| 18.3.6.3 | Mine Site Complex Operation Infrastructure |
Office Complex and Mine Dry
The office complex will consist of two single-storey,
pre-engineered, and prefabricated modular buildings, each comprising 12 modules of 3.8 m x 18.3 m.
The first building, with a total surface area
of approximately 800 m², will house the administrative offices, including Process and Mining Operations, as well as support departments
such as Health and Safety, Maintenance, and Security.
The second building, also approximately 800 m²,
will contain the mine dry facilities, which include men’s and women’s dry areas (clean and dirty sides), lockers, showers,
a lunchroom, janitor space, mechanical room, and mine dispatch.
|
Osisko Development Corp.
NI 43-101 Technical Report
Feasibility Study for the Cariboo Gold Project |
|
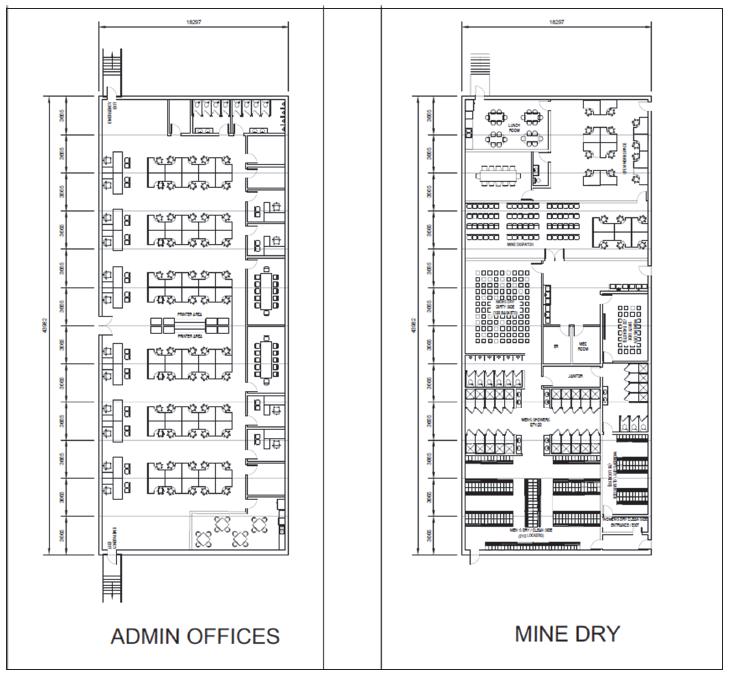
Figure 18-12: Preliminary
office and mine dry layouts
|
Osisko Development Corp.
NI 43-101 Technical Report
Feasibility Study for the Cariboo Gold Project |
|
Emergency Response Team Garage
The Emergency Response Team (“ERT”)
garage will be located at 4270 Sanders Ave in Wells, BC. This is an existing building owned by ODV, currently in use as a community relations
office. There are two existing roll up doors at the back of the building on the southern side, providing access to the garage. Upgrades
will be made to the building to accommodate storage of a fire truck and an ERT truck. Equipment and tooling will be purchased to support
the mine rescue team. Within the interior of the garage, shelving and general storage will be installed to aid in gear and equipment organization
not limited to the following subareas:
| ■ | ERT call out crew personal protective equipment (“PPE”); |
| ■ | Detection and monitoring instruments; |
| ■ | Rescue tools and devices; |
| ■ | Medical and first aid equipment; |
| ■ | Fire, hazmat, and utility equipment; |
| ■ | Administrative and support materials. |
Air Intake Raises
Ventilation raises will be installed for each
of the underground zones. They will be built to follow the underground mine development schedule as they become required. Each raise will
consist of cut/fill excavation inclusive of a fresh air intake fan and heater, a concrete slab, and a connection to an underground natural
gas pipeline, with the exception of the Lowhee air intake, which will use propane with the appropriate propane storage and distribution
facilities.
Each ventilation raise area will be fenced for
safety purposes. The respective pads will also serve for alternate emergency egresses for the underground mine. Existing access roads
will be used to access the ventilation raises.
Air Intake raises planned:
|
Osisko Development Corp.
NI 43-101 Technical Report
Feasibility Study for the Cariboo Gold Project |
|
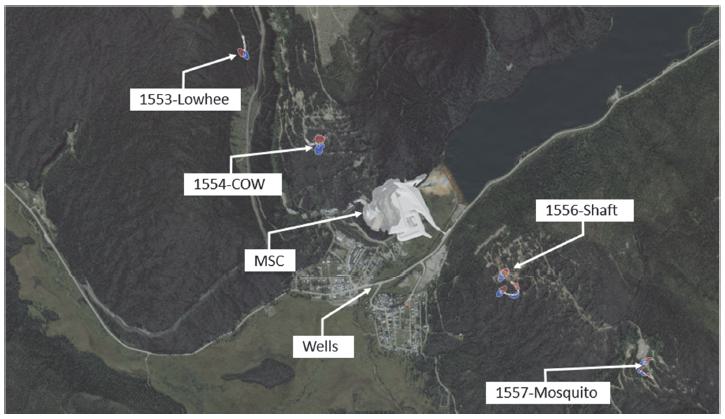
Figure 18-13: Preliminary
air intake locations
Fuel Storage and Distribution
The MSC will be serviced by a 70,000 L diesel
fuel tank and a 10,000 L gasoline fuel tank. The tanks will be double-walled and distribution will consist of fuel dispensing systems,
pumps, filtration units, and spill containment measures. Safety features to include fire suppression systems, containment areas, and emergency
shutoff controls. Service and filling of storage tanks to be completed by tanker trucks.
Liquefied Petroleum Gas (“LPG”) will
be stored in a 10,000 United States Water Gallon (“USWG”) tank and distributed through an underground distribution network.
The surrounding infrastructure of the MSC will be tied into this distribution network.
Arrangement of fuel storage will consider applicable
regulations, such as required offsets, tertiary containment, and be covered by a prefabricated structure to mitigate the accumulation
of snow.
|
Osisko Development Corp.
NI 43-101 Technical Report
Feasibility Study for the Cariboo Gold Project |
|
Firewater
A fire pump station will be located near the MSC
WTP building. The water source for the fire water protection system will be the effluent of the MSC WTP, feeding a 900 m3
steel tank equipped with a mechanical overfill to ensure the tank is always full. The tank will be connected to an enclosed pumping system
comprised of an electrical fire pump, and a diesel fire pump. A buried pipeline will distribute water to all main buildings.
Sewage Treatment
The sewage treatment system will be located northeast
of the mill process building area. An underground sewage piping system will be established to collect sewage wastewater from the mill
process building, the admin offices and mine dry building for treatment. A buried equalization tank, next to the modularized sewage treatment
system, will collect wastewater from the underground piping system as well as from a vacuum truck. A feed pump will then pump the contents
of the equalization tank to the sewage treatment plant, which will employ the membrane biological reactor (“MBR”) technology
with submerged UF membranes. The effluent will meet the effluent standard limits of British Columbia.
Potable Water Treatment and Distribution
The MSC will be serviced through an underground
potable water distribution system. Raw water from a well located adjacent to the Lowhee Creek Bridge will feed to the Potable WTP. Water
is fed through a filtering system where it is dosed with coagulant. Then the water will be pumped to a U/F unit where the total suspended
solids and turbidity are removed. The U/F permeate water will be sent to a granular activated carbon (“GAC”) filter and then
disinfected with ultraviolet and a hypochlorite dose to maintain residual chlorine in the water to prevent any potential regrowth.
The proposed MSC WTP and associated infrastructure
will be located on the north side of the mine site, close to Jack of Clubs Lake. The water from the Bonanza Ledge Site will be conveyed
to the MSC SCP via a designated pipeline (by others), for redistribution to the MSC WTP.
The MSC WTP will support the mining efforts during
operation, active closure, and post closure active care phases of the Project. The MSC WTP will be designed to treat and discharge 800 m3/h
of mine-impacted water. Treatment objectives will include metals, nitrogen species such as ammonia, nitrite and nitrate, and suspended
solids. The MSC WTP design includes a High-Density Sludge (“HDS”) system that provides the bulk removal of metals and solids,
nitrification and denitrification MBBR for nitrogen species removal, and post-filtration prior to discharge. Treated water will be discharged
to Jack of Clubs Lake. Solid waste streams (recovered sludge) will be dewatered and disposed.
|
Osisko Development Corp.
NI 43-101 Technical Report
Feasibility Study for the Cariboo Gold Project |
|
HDS is a proven method for metals and metalloids
removal from mine-impacted water. Recirculation of generated sludge in the lime treatment process allows for a denser sludge, which enhances
the removal of contaminants. Hydroxide, sulphide, and iron co-precipitation is achieved via dosing reagents such as lime, sulphide, and
coagulant. A conventional clarifier is designed to remove the generated suspended solids from the process water.
Treatment for some nitrogen species is achieved
with biological treatment in MBBR tanks, a nitrifying step for ammonia and nitrite conversion to nitrate followed by a denitrifying step
for nitrate conversion to inert nitrogen gas. Biosolids are removed by way of a downstream clarifier. MBBRs are widely used in water treatment
for nitrogen species attenuation.
An oxidation reactor is included to ensure preferable
oxidation potential of the clarifier overflow prior to filtration. The final filtration and polishing stage is included to help ensure
sufficient removal of suspended solids, including precipitated metals and residual biomass from the biological treatment systems. The
filtration system uses anthracite sand filtration media. The treated effluent will be discharged to the environment.
The MSC WTP will be housed within a centralized
WTP building with the majority of equipment located inside. Large tanks and clarifiers will be located outside and designed for the climate
conditions.
| 18.3.6.5 | Water Treatment Conveyance Infrastructure (Pumping and Piping Systems) |
The surface water handling system for the Project
is designed to manage a wide range of flow rates using a combination of submersible and centrifugal pumps using HDPE pipelines, heat traced
and/or insulated when required, to circulate water between infrastructure as defined in the flow diagram. The system supports both low-flow
and high-capacity applications across multiple surface infrastructure components including underground dewatering reporting to surface
for treatment.
Submersible pumps are proposed for localized dewatering
and utility water services. These units are selected for their reliability and adaptability across voltage requirements with single- and
three-phase configurations, depending on the application. Pump selection is based on required flow and head conditions, with rotational
speeds typically ranging between 1,700 rpm and 3,500 rpm.
For higher flow applications, such as bulk water
transfer or process water return, high-head pumps and centrifugal pumps are utilized. These pumps are configured in both single-line and
parallel-line arrangements to optimize flow distribution and system redundancy.
|
Osisko Development Corp.
NI 43-101 Technical Report
Feasibility Study for the Cariboo Gold Project |
|
The system is designed for contingency capacity
to account for seasonal variations and maintenance flexibility. Overall, the pumping system is modular, scalable, and designed to accommodate
the operational and environmental conditions expected on site.
Surplus Treated water that cannot be recirculated
in the process will be subsequently discharged into Jack of Clubs Lake. Surface contact water runoff will be collected from a ditching
network.
The MSC pumping and pipeline infrastructure pathways
are shown in Figure 18-14 and summarized in Table 18-3.
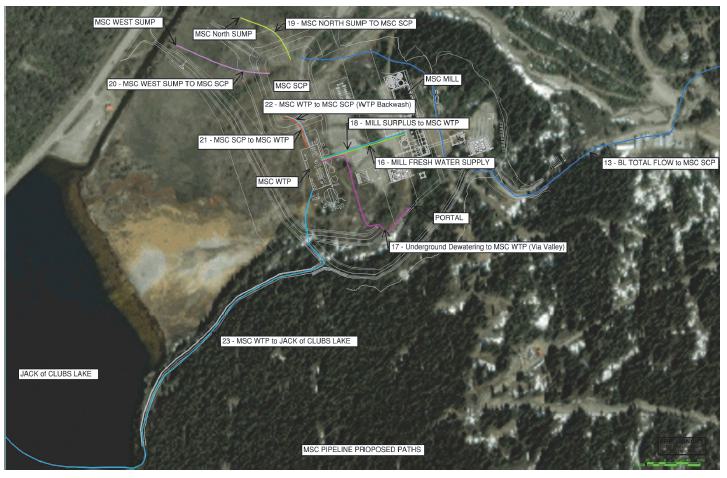
Figure 18-14: MSC pipeline
pathways
|
Osisko Development Corp.
NI 43-101 Technical Report
Feasibility Study for the Cariboo Gold Project |
|
Table 18-3: MSC pipeline
pathways summary
Pipeline
No. |
Flow Path |
Pumping
Capacity |
Pump(s)
Configuration |
| 16 |
Fresh Water Supply: WTP MSC to MSC Mill |
56 m3/h |
Single |
| 17 |
Underground Dewatering to MSC WTP |
480 m3/h |
Single |
| 18 |
MSC Mill Surplus Water to MSC WTP |
21 m3/h |
Single |
| 19 |
MSC north sump contact water from mill pad runoff to MSC SCP |
51 m3/h |
Parallel |
| 20 |
MSC West sump contact water from mill pad runoff to MSC SCP |
172 m3/h |
Parallel |
| 21 |
MSC SCP to MSC WTP |
920 m3/h |
Parallel |
| 22 |
MSC WTP backwash to MSC SCP |
104 m3/h |
Parallel |
| 23 |
MSC WTP treated effluent to Jack of Clubs through a diffuser |
1440 m3/h |
Parallel |
The power demand at the MSC and Bonanza Ledge
is approximately 20 MW on average, peaking at 21.4 MW.
Table 18-4: Peak power
demand by area
| Area |
Peak Power Demand (MW) |
| Underground Mine |
10.8 |
| Processing Plant |
8.1 |
| Ancillary Infrastructure |
2.5 |
Substation Power Distribution
The incoming TL will terminate on a gantry structure
in the main substation, which will be designed to accommodate 138 kV and 69 kV terminations as well as a fibre incoming. The outdoor substation
will initially house parallel 69 kV to 13.8 kV transformers rated to 18/24 MVA, 22 MW (ONAN/ONAF). The substation could
be upgraded with parallel 138 kV to 13.8 kV transformers rated to 30/40/50 MVA (ONAN/ONAF1/ONAF2) to handle an increase
in site loads. The substation will be designed for both 69 kV and 138 kV scenarios. Inrush current mitigation is assumed to be required
for these transformers, and independent-pole-operated breakers with point-on-wave controllers will be included to minimize the inrush
current of energization. During normal operation, both transformers will share the load, but during maintenance or repair, one transformer
will be capable of supplying the entire load of the MSC.
|
Osisko Development Corp.
NI 43-101 Technical Report
Feasibility Study for the Cariboo Gold Project |
|
Electrical Room
From the secondary electrical room of the main
power transformers, 13.8 kV air-insulated switchgear (“AIS”) will distribute the medium voltage to the MSC loads including
the 600 V switchgear located within the Substation Electrical Building. This 600 V switchgear will distribute power to the local
MCCs to cover the process plants as well as the substation protection and control systems within the electrical room.
Emergency Power
Emergency power generators are planned to supply
the critical equipment and installations when BC Hydro power is unavailable. BC Hydro does not allow parallel operation of diesel generators,
so the critical loads will be supplied with two diesel generators during these conditions. These generators are currently located at Bonanza
Ledge and will be integrated into the system distribution through the underground with communication assisted lockouts to prevent paralleling
the generators during utility operation.
| 18.3.6.7 | Process Plant Power |
Site Power Distribution
The main electrical room, described within Section 18.3.6.6,
will have 13.8 kV and 600 V electrical distribution gear that will provide power to key operational loads within the concentrator plant.
Two 13.8 kV power feeds from the main electrical
room shall feed two 13.8 kV-600 V dry transformers and electrical distribution gear, located in the paste plant electrical room.
This room is located beside the concentrator building and shall provide power to key operational loads within the concentrator plant.
Construction Power
Temporary construction power will be supplied
at the MSC via one 600 kW generator with a 450 kW backup generator. The generators will supply 20 ft long insulated high cube shipping
containers. Within the shipping container will be a manual transfer switch between the 600 kW and 450 kW generators. Provision for
600 A, 600 V distribution with a 600 A main breaker before stepping down to breakers ranging from 150 A to 15 A.
|
Osisko Development Corp.
NI 43-101 Technical Report
Feasibility Study for the Cariboo Gold Project |
|
| 18.3.6.9 | Telecommunication and IT Infrastructure |
Public Internet access and telephony services
will be provided to the MSC via a primary wide area network (“WAN”) link composed of an aerial fibre optic cable running between
Quesnel and the new Telus Telecommunication tower, which is situated near the MSC WTP.
For redundancy, a secondary WAN link will be implemented
using a fibre optic cable running from Quesnel to BC Hydro Barlow substation (aerial on Highway 97, then buried on Highway 26) and then
over the new 69 kV powerline that will be built between Barlow and the MSC in Wells.
A redundant fibre optic campus area network will
interconnect all facilities of the MSC, including:
| ■ | Main electrical substation; |
| ■ | Concentrator building area; |
| ■ | Portals, exhaust raise and main intake raises; |
| ■ | Water treatment plant and pumping stations; |
| ■ | Fire water pumping station. |
The fibre optic campus area network will be shared
between the following systems:
| ■ | Process and electrical grid industrial control system; |
| ■ | Corporate network (administration, maintenance, and telephony); |
| ■ | Security video surveillance and access control system. |
Remote areas on the site could be serviced via
Point-to-Multipoint microwave links when more cost effective than through fibre optic.
IT and networking equipment and software required
for the Project will be deployed to service the different areas via wired or wireless networks, where appropriate, for administrative
and industrial systems.
The network architecture of the Telecom and IT
infrastructure will be designed with resilience and cybersecurity in mind.
An underground private 4G/5G LTE and fibre optic
network will be deployed to service the mine personnel and vehicles. Supported applications should include personnel and equipment geolocation
for safety and ventilation on demand, remote operation, two-way radio communication, mining equipment predictive maintenance, pumps, and
electrical distribution network control.
|
Osisko Development Corp.
NI 43-101 Technical Report
Feasibility Study for the Cariboo Gold Project |
|
A Digital Mobile Radio (“DMR”) system
will provide two-way radio service for surface communications. To complement the DMR, a Push-to-Talk over Cellular (“PoC”),
that can be used also over Wi-Fi, will be deployed to allow authorized workers, consultants and contractors to communicate with each other
and with the DMR system users.
The telecom and IT infrastructure have been designed
to allow for the potential future implementation of remote-control operation with a low latency communication connection.
| 18.4 | Off-site Infrastructure |
ODV owns various lodging facilities, including
an existing camp at Ballarat (detailed below).
The company also owns the following lodging facilities
in the District of Wells:
| ■ | The Hubs Motel: 23 rooms; and, |
| ■ | Various houses and apartments: 27 rooms. |
The existing Ballarat Camp will undergo a significant
expansion to increase its capacity from 76 to 264 occupants, directly supporting the Project.
The current Ballarat Camp includes detailed infrastructure
listed below:
| ■ | Two 38-person dormitories with private washroom (with toilet, sink, and shower),
bed with premium mattress, wardrobe, desk, television, chair, and blackout window blinds; |
| ■ | Three-unit mine dry facility with lockers and hanging baskets for drying; |
| ■ | Eight-unit kitchen and diner facility; |
| ■ | The camp is currently powered with diesel gensets; |
| ■ | Propane storage tank and distribution line; |
| ■ | Communications (Pole Fiber Drop) – Buried fiber line to central communications
room; |
| ■ | Sewage Collection – 63.6 m3 Sewage tank and underground
pumping and conveyance system; |
| ■ | Water treatment plant – Capacity of producing 27 m3/day
potable water; |
| ■ | Water supply well – Producing ~46 m3/day freshwater. |
The Phase 2 development includes comprehensive
accommodation, facility upgrades, utility expansions, and essential infrastructure enhancements.
|
Osisko Development Corp.
NI 43-101 Technical Report
Feasibility Study for the Cariboo Gold Project |
|
Accommodation Facilities
| ■ | Addition of five dormitory wings, each providing 36–40 single-occupancy
rooms, totalling at least 182 additional rooms. |
| ■ | Each accommodation room will include a private washroom (with toilet, sink,
and shower), bed with premium mattress, wardrobe, desk, television, chair, and blackout window blinds. |
| ■ | All dormitory wings will include centralized or zoned HVAC systems for heating
and air conditioning and dedicated laundry areas equipped with commercial-grade washers and dryers. |
| ■ | Accommodation modules will primarily comprise lightly used, prefabricated
units. |
| ■ | One 38-person dormitory will be relocated from the currently existing QR
Camp, involving disassembly, transportation, and reassembly. |
| ■ | Four 38-person lightly used dormitory facilities will be sourced from a specialty
camp supplier. |
Kitchen and Dining Facility Upgrades
| ■ | Existing kitchen and dining facilities will undergo renovations, including
wall removals and spatial reconfiguration, to expand dining capacity to accommodate 266-person capacity. |
| ■ | Modifications include relocation of lunch areas, boot rooms, janitorial spaces,
and handwashing facilities to improve operational efficiency. |
Recreation Facility
| ■ | A new modular recreation facility consisting of prefabricated modules will
be installed. |
| ■ | This facility will include dedicated spaces for exercise and recreation,
equipped with fitness equipment, entertainment amenities (including a 65-inch TV), and accessible washroom facilities. |
Arctic Corridors
| ■ | The addition of enclosed, prefabricated modular corridors will interconnect
existing and new dormitory wings, kitchen and dining areas, new recreation facilities, and the existing mine dry building. |
|
Osisko Development Corp.
NI 43-101 Technical Report
Feasibility Study for the Cariboo Gold Project |
|
Utilities and Infrastructure Enhancements
| ■ | Electrical Supply: Expansion and upgrades to existing power distribution,
including transformers, distribution panels and infrastructure and addition of exterior lighting to encompass additional dormitory expansion.
The kitchen will be powered from the line power and the remainder of the camp power will be supplied via the camp generator. |
| ■ | Communication Networks: Installation of comprehensive networking infrastructure,
including Wi-Fi access points, routers, and cabling, delivering high-quality connectivity to all facilities. |
| ■ | Water Treatment and Distribution: Expansion of potable water capacity from
27 m3/day by additional 30 m³/day, including new water distribution systems connected to accommodations, kitchen,
and recreation facilities. Upgraded potable water capacity ~57 m3/day. |
| ■ | Propane System: Evaluation and potential upgrades to propane storage and
distribution infrastructure to supply expanded HVAC, hot water, and kitchen needs. |
Sewage Management
| ■ | Installation of expanded sewage collection infrastructure, incorporating
a new lift station and associated piping to transport wastewater to an existing 400-barrel holding tank. |
| ■ | Development of an on-site septic lagoon system and seepage bed, as per
Radloff engineering designs, to treat sewage efficiently. The septic system is designed to treat, at minimum, the existing 76-person capacity
of the current Ballarat Camp. Any wastewater generated above this treatment capacity will be managed by regular pump-and-haul operations
off-site. |
Life Safety Infrastructure
| ■ | Comprehensive life safety systems, including centralized fire detection,
alarms, emergency exits, and lighting, compliant with BC Building Code standards. |
| ■ | Installation of dedicated fire water storage, pumping facilities, and strategically-placed
fire hose stations to support effective emergency response. |
|
Osisko Development Corp.
NI 43-101 Technical Report
Feasibility Study for the Cariboo Gold Project |
|
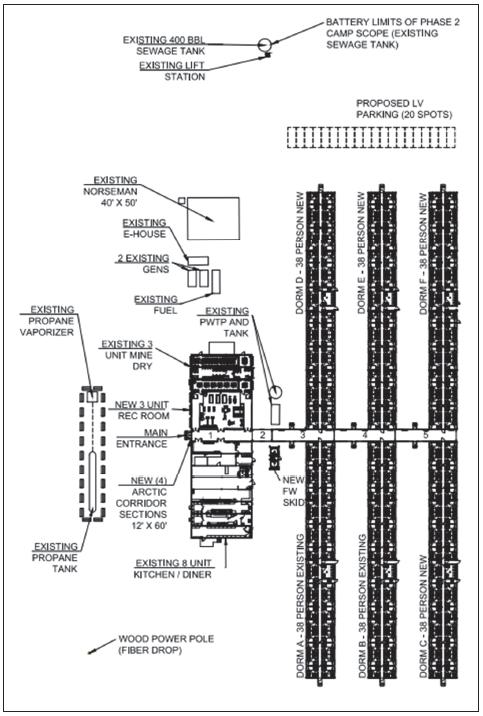
Figure 18-15: Proposed
Ballarat camp expansion
|
Osisko Development Corp.
NI 43-101 Technical Report
Feasibility Study for the Cariboo Gold Project |
|
The TL will initially operate at 69 kV from Barlow
Substation to the mine-end substation, but will be built to 138 kV standards after the proposed step-up substation, for future electrification
opportunities. The TL will also accommodate an underbuilt 24-fibre all-dielectric self-supporting (“ADSS”) cable.
The line will originate from Barlow Substation,
which is located approximately 5 km northeast of Quesnel, off Highway 26. After exiting Barlow Substation, the line will run parallel
to the existing BC Hydro lines 2L354, 5L011, 5L012, and 5L013 for just over 1 km until crossing the 500 kV TL corridor underground (see
Section 5.7 for more information on the underground crossing). The line will then run east for approximately 4.5 km until crossing
Highway 26. Shortly after crossing the highway, the line will switch to 138 kV structure type and framing as it passes the proposed step-up
substation location. The line will then continue northeast before reaching the mine-end substation in Wells.
The terrain is variable throughout the transmission
alignment. The 69 kV portion before the step-up substation is relatively flat, with some wetland presence. After the step-up substation,
the terrain becomes more mountainous with varying elevation. The TL follows nearby forestry service roads (“FSR”) when available
but, in some cases, it is not possible due to right-of-way constraints.
 |
Osisko Development Corp.
NI 43-101 Technical Report
Feasibility Study for the Cariboo Gold Project |
 |
| 19. | Market Studies and Contracts |
It was assumed in this FS and Technical Report
that the Cariboo Gold Project will produce two saleable gold products: gold doré bars (produced from the gravity concentrate) and
a high-grade flotation concentrate from a single processing facility in Wells, at the MSC. Doré bars will be sold and refined through
a certified North American refinery, with numerous options available in both Canada and the United States.
In parallel, a high-grade flotation concentrate
(110–150 g/t Au), estimated at approximately 65 tpd to 70 tpd, will also be produced. A preliminary off-take agreement
has been established with a well-known international metals trading firm for the sale of this concentrate. The flotation concentrate will
be bagged and transported by truck from the MSC in Wells to the Port of Vancouver, where it will be shipped via ocean freight to a smelting
partner, based in Asia.
No market
studies have been conducted by ODV or its consultants in relation to the gold doré and
flotation concentrate that will be produced by the Project. The QP has reviewed the prevailing market context, taken into account the
absence of formal market studies, and has validated the reasonableness and appropriateness of the commodity price assumptions utilized
in the economic analysis.
Global demand
for gold remains strong, driven by both industrial use and investment demand. Gold continues to trade with high liquidity on global markets,
and there is robust capacity among refiners and smelters to process doré and gold concentrates. The Project is, therefore, not
exposed to material market risk in terms of its ability to place products or receive competitive terms.
No material
long-term contracts (e.g., hedging, streaming, or fixed pricing) are currently in place for either doré or concentrate sales. This
allows the Project to benefit from spot market pricing and maintain commercial flexibility.
| 19.2 | Gold Price and Exchange Rate |
The long-term price of gold and CAD:USD exchange
rates were estimated on the basis of discussions with experts, trailing averages, consensus analyst estimates, and recently published
economic studies that were deemed to be credible. For this Report, a gold price of USD 2,400/oz and a CAD:USD exchange rate
of 1.00:0.74 was used. Table 19-1 outlines the pricing and exchange rate assumptions used in the economic analysis, as described
in Chapter 22.
|
Osisko Development Corp.
NI 43-101 Technical Report
Feasibility Study for the Cariboo Gold Project |
|
Table 19-1: Pricing and
exchange rate assumptions
| Assumption |
Unit |
Value |
| Gold Price |
USD/oz |
2,400 |
| Exchange Rate |
USD:CAD (CAD:USD) |
1.35 (0.74) |
Figure 19-1 show the historical monthly gold
price (end of Month) since April 2022. As of April 30, 2025, the 3-year trailing average is USD 2,161/oz.
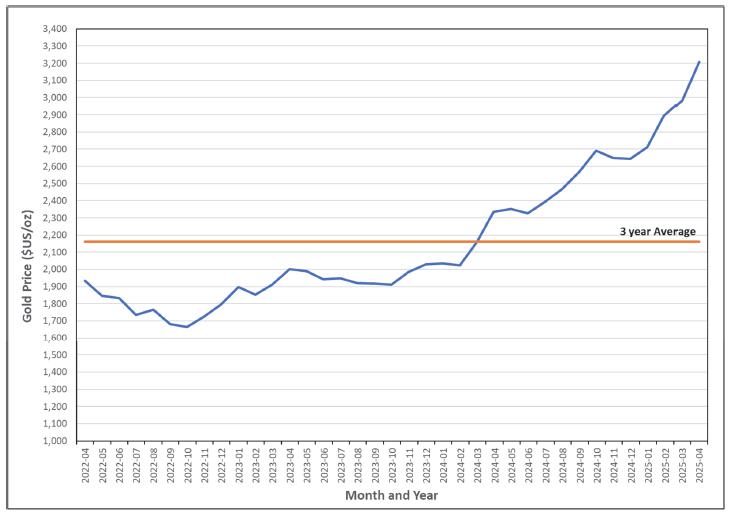
Figure 19-1: Historical
monthly gold price (USD/oz)
As of the effective date of this Report, the gold
price has been considerably higher than the 3-year trailing average (USD 2,161/oz) and the assumed FS gold price (USD 2,400/oz)
over the past year. The forecasted and assumed exchange rate and precious metal prices have been kept constant and are meant to reflect
long-term expectations over the life of the Project. It should be noted that the exchange rate and precious metal prices can be volatile
and that there is the potential for deviation from the LOM forecasts.
|
Osisko Development Corp.
NI 43-101 Technical Report
Feasibility Study for the Cariboo Gold Project |
|
The Project will produce two saleable gold products:
gold doré bars and a high-grade flotation concentrate from a single processing facility.
Gold doré bars will be produced on site
via gravity recovery and smelting of high-grade gravity concentrate. The doré will typically contain gold and silver, with minor
base metal impurities. These bars will be shipped to a certified North American precious metals refinery for recovery of the gold into
high purity bars meeting the minimum London Bullion Market Association (“LBMA”) delivery standards for sale into the open
market. Refining terms for doré are standardized and favorable to producers. Under current market conditions, the following terms
for gold doré refining have been assumed based on a budgetary quotation received from a North American-based refinery:
| § | Payable Gold: 99.97% of contained gold; |
| § | Transport and Refining Charges: USD 2.56 per ounce of gold; |
| § | Settlement Timing: five business days from receipt of doré and assay
confirmation. |
Given the robust gold market and multiple refining
options in both Canada and the United States, doré sales are not expected to encounter any logistical or market-related constraints.
No offtake agreement is required for doré sales, and the Project will retain flexibility to negotiate terms with refiners based
on prevailing conditions.
In addition to doré, the Project will produce
a high-grade flotation concentrate containing significant gold values, as well as minor quantities of silver, copper, and other trace
elements. The concentrate is expected to average approximately 110–150 g/t Au, with an estimated production rate of 65 tpd
to 70 tpd. The concentrate will be bagged and trucked from the process plant to the Port of Vancouver for ocean shipment to a third-party
smelter. ODV will be responsible for transporting the concentrate from the processing facility at the MSC (in Wells) to the Port of Vancouver,
which is located approximately 750 km via road from the Project site. A local transport provider has provided a transport cost of $93.10/t.
Storage, handling, loading and ocean shipping costs from the port of Vancouver to Qingdao, China, have been estimated to total USD 125.00/t.
A preliminary purchase offer agreement has been
established between ODV and a well-known international metals trading firm for the purchase and marketing of the gold concentrate. The
trading firm will determine the destination smelter for the concentrate. Under standard terms, the concentrate is expected to be sold
to a smelter or refinery under the following indicative conditions:
|
Osisko Development Corp.
NI 43-101 Technical Report
Feasibility Study for the Cariboo Gold Project |
|
The main terms of the agreement are the following:
| § | Gold payable is equal to the lower of 97.75% or a 2 g/t deduction; |
| § | Payable Gold: 97.75%, subject to final assay and contract terms; |
| § | Treatment Charges (TCs): USD 195.00 per dry tonne of concentrate; |
| § | Refining Charges (RCs): USD 10.00 per payable ounce; |
| § | Penalty Elements: Arsenic USD 2.00 for each 0.1% over 0.2%. |
The metallurgical test work indicates that the
concentrate is not expected to contain deleterious elements (e.g., arsenic, antimony, mercury) above penalty thresholds.
On February 5, 2016, OGR completed the acquisition
of a 1.5% NSR royalty on the Project for a cash consideration of $25M, with an option for OGR to purchase an additional 0.75% NSR royalty
for $12.5M. On April 19, 2017, OGR exercised the option, bringing its total NSR royalty on the Project to 2.25%. On September 5,
2018, OGR announced the purchase of an additional 1.75% NSR royalty on the Project for a cash consideration of $20M, with an option for
OGR to purchase an additional 1.0% NSR royalty for $13M. OGR announced it would exercise the option on October 5, 2020, bringing
its NSR for the Project to 5.0%. OGR’s 5.0% NSR royalty is the only royalty that currently applies to the Project.
In the past, ODV’s Barkerville Gold Mines
was working with an American refiner; there are no refining agreements, sales contracts or other contracts currently in place for the
gold doré. The doré to be eventually produced by the Project will be shipped to a North American precious-metals refinery
for recovery of the gold into high purity bars meeting the minimum LBMA delivery standards.
| 19.5.2 | Flotation Concentrate |
ODV has a preliminary offer in place to purchase
the gold concentrate. The general terms and conditions were previously described in Section 19.3.2.
|
Osisko Development Corp.
NI 43-101 Technical Report
Feasibility Study for the Cariboo Gold Project |
|
As of the effective date of this Report, ODV has
signed agreements and awarded several equipment and service contracts as part of its operation of the Bonanza Ledge Mine, as well as for
pre-construction activities for the Project. The significant contracts and agreements are summarized in Table 19-2.
Table 19-2: Significant
project contracts and agreements
| Contract/Agreement |
Supplier |
| Roadheader Capital Lease |
Sandvik Financial Services Canada |
| |
Osisko Development Corp.
NI 43-101 Technical Report
Feasibility Study for the Cariboo Gold Project |
|
| 20. | Environmental
Studies, Permitting, and Social or Community Impact |
This section summarizes the environmental studies
conducted in support of the Cariboo Gold Project, the environmental management and monitoring efforts that may be required throughout
the life of mine, as well as regulatory requirements and status.
| 20.1 | Environmental
Studies |
The
Project area is composed of three
main components:
| § | Mine Site including the Mine Site Complex and the Bonanza Ledge Site; |
The majority of the Project infrastructure at
the Mine Site, including the MSC, and the Bonanza Ledge WRSF, will be located on brownfield sites and lands previously disturbed by historical
mining and recent mining at the Bonanza Ledge Mine (Morgan et al., 2019).
The development of a mining project in British
Columbia requires various regulatory approvals. Project permitting is generally split into two phases, the EA phase followed by the permitting
phase. Any major changes to the Project require amendments to authorizations as the Project evolves.
Osisko Development Corp. has undertaken EA and
permitting processes for the Project, which have been supported by studies on the technical, environmental, and socio-economic components
of the Project. Since 2016, through ongoing consultation and engagement, ODV has informed Indigenous nations, provincial government representatives
and agencies, local and regional government representatives, community and economic organizations, adjacent permit/authorization holders,
non-government organizations, local and regional businesses, and residents about the Project, and has considered their feedback throughout
Project planning. Studies continued throughout the EA process and permitting stages of the Project and into pre-construction.
| |
Osisko Development Corp.
NI 43-101 Technical Report
Feasibility Study for the Cariboo Gold Project |
|
The Project received an Environmental Assessment
Certificate, Certificate #M23-01, on October 10, 2023, and Schedule B of the certificate lays out the conditions of the approval
under 22 separate sections. ODV also submitted the Joint Permit Application to the BC Major Mines Office to advance permitting of the
Mines Act and Environmental Management Act on May 31, 2023, and the decision package was referred to the Statutory Decision
Maker (“SDM”) on November 12, 2024. The Mines Act permit, M-247, was received on November 20, 2024. The Environmental
Management Act permits (PE-17876 for Bonanza Ledge and PE-111511 for the Mine Site Complex) were received on December 11, 2024.
The permitting process for the Transmission Line
is being overseen by the Ministry of Water, Land and Resource Stewardship who is running a coordinated process for all authorizations
required for the TL. The License of Occupation (“LOO”) to authorize the construction of the TL under the Forest Act
was submitted in July 2021, with updated documents for the Decommissioning and Closure Plan (“DRP”), LOO Management Plan,
and TL Construction Environmental Management Plan (“CEMP”) provided on May 26, 2025. and is anticipated to be in hand
in Q3 2025.
Amendments to the EAC and other permits will be
required to address changes in the Project described in Chapter 1.
The following sections describe the environmental
effects that the Project is expected to have on the area and the mitigation measures proposed to control those impacts.
The Cariboo Region experiences a dry continental
climate due to the coastal mountains influencing the westerly flow of winds and moisture coming from the Pacific Ocean. The climate at
the sites is characterized by relatively cold winters and mild summers. The annual precipitation is moderate and there is comparatively
little variation over the year in monthly precipitation.
Historical trend
analysis and climate change predictions were used to evaluate the likelihood of the historical measurements to represent future climate
conditions. Climate existing condition studies for the Project were conducted by Golder (now WSP). Table 20-1 consolidates
the main climate statistics obtained from the Mine Site existing conditions report (Golder, 2022a).
| |
Osisko Development Corp.
NI 43-101 Technical Report
Feasibility Study for the Cariboo Gold Project |
|
Table 20-1: Summary of
climate statistics
| Variable |
Unit |
Mine Site
(Golder, 2022a) |
| Mean Annual Total Precipitation |
mm |
1,034 |
| Mean Annual Rainfall |
mm |
530 |
| Mean Annual Snowfall |
mm |
504 |
| Mean Annual Temperature for the LSA and RSA (1,460 m mean elevation) |
ºC |
1.7 |
| Mean Annual Temperature Lapse Rate (ºC change per 100 m altitude increase) |
ºC |
-0.38 |
| Average Winter Season (sub-zero mean monthly temperatures) |
|
November to March |
| Mean Annual Relative Humidity |
% |
72 |
| Mean Annual Solar Radiation |
W/m2 |
130 |
| Mean Annual Shallow Lake Evaporation for the LSA |
mm |
630 |
| Mean Annual Potential Evapotranspiration for the LSA |
mm |
737 |
| Difference in Mean Annual Shallow Evaporation and Potential Evapotranspiration Between the LSA and RSA |
% |
2% to 3% |
| Mean Snow Depth for the Month of March |
cm |
96 |
| Mean Snow Density for the Month of March |
g/cm3 |
0.29 |
Notes:
| § | Statistics are based on reviewed historical records from
multiple climate stations and measured and derived data (where applicable); |
| § | RSA: Regional study area. |
Historical trends (trends in the data over the
period of historical record) and available future climate change predictions were analyzed to predict future regional climate changes
(Golder, 2022). Climate predictions for future time periods are available from Environment and Climate Change Canada’s Coupled Model
Intercomparison Project Phase 5 multi-model ensemble database with 1 × 1 degree grid resolution (ECCC, 2019). The ECCC climate change
projection data are presented for the entire province and do not provide locally downscaled outputs. To predict site-specific effects
for the local study area (“LSA”), a locally downscaled model (ClimateBC) with higher grid resolution was used for the climate
change projections (Wang et al., 2016). The University of British Columbia (Morgan and Wright, 2020) uses the same climate change multi-model
ensemble output to extract climate change predictions for a particular location.
| |
Osisko Development Corp.
NI 43-101 Technical Report
Feasibility Study for the Cariboo Gold Project |
|
Table20-2
summarizes the predicted climate changes from Morgan & Wright (2020) for the Project (ODV, 2023):
Table 20-2: Summary of
climate change predictions
| Climate Factor |
Predicted Changes |
| Precipitation |
Projected median increases relative to 1981 to 2010 in total annual precipitation normals of 3%, 10%, and 12% for 2025, 2055, and 2085, respectively. Projected median decreases relative to 1981 to 2010 in precipitation as snowfall normals of 4%, 17%, and 22% for 2025, 2055, and 2085, respectively. |
| Temperature |
Projected median increases in annual mean temperature relative to 1981 to 2010 are 1.3 °C, 2.6 °C, and 3.8 °C for 2025, 2055, and 2085, respectively. |
| Humidity |
Projected median increases in annual relative humidity relative to 1981 to 2010 are 1%, 2%, and 3% for 2025, 2055, and 2085, respectively. |
| Solar Radiation |
Historical trend analysis of the derived solar radiation records for the LSA and RSA indicate a historical decreasing trend of mean annual solar radiation of approximately 14 W/m2 over 100 years (or 0.14 W/m2/year). |
| Snow Cover |
Climate change model data indicate an overall decrease in snow depth moving into the future. For RCP4.5, for the 50th percentile of the multi-model ensemble, and the 2046 to 2065 horizon, snow depth is predicted to decrease by 8.05 cm annually, relative to the 1986 to 2005 reference normals. |
The climate resilience of the Project has been
addressed by developing detailed, site-specific climate change projections for the Project (Golder, 2022h). At this stage of the Project,
the potential climate change impact on the design event for the Mine Site water conveyance structures was assessed by developing a series
of site-specific deterministic climate projection timeseries for the Project (Golder, 2022i). A total of 72 climate scenarios resulting
from different climate models and carbon emission profiles were generated for use at the feasibility and permitting stage.
Golder completed ambient air quality modelling
for the Project and used Quesnel, British Columbia, as a conservative baseline. The primary Project effect on Air Quality is the potential
for an increase in ambient Criteria Air Contaminants (“CACs”) due to Project sources and activities, most notably nitrogen
dioxide (“NO2”) and particulate matter.
| |
Osisko Development Corp.
NI 43-101 Technical Report
Feasibility Study for the Cariboo Gold Project |
|
To mitigate expected effects, a Waste (Refuse
and Emissions) Management Plan, which includes a Fugitive Dust Control Plan have been included in the CEMP for the MSC, Bonanza Ledge,
and the TL, and will be implemented prior to the start of construction to ensure that measures are in place to minimize air contaminant
emissions (ODV, 2023). ODV will consider approaches for reducing emissions of air contaminants, with a focus on dust emissions from surface
activities at the Mine Site and the TL, as well as road dust and fugitive dust mitigation and its impacts on air quality. Two air quality
stations have been installed in Wells.
| 20.1.4 | Land
Capability and Use |
An assessment of contemporary land and resources
uses was completed by WSP in 2022 in support of the Project (WSP, 2022a). A summary of project overlaps is provided below:
| § | The Project does not overlap any protected areas or parks. |
| § | The Project overlaps a few mineral occurrences (“MINFILE”) with
overlapping mining and exploration interests including tenure holders of mineral claims, client holdings, placer claims, and placer leases.
ODV owns all 16 mineral claims within the Mine Site area as well as 17 of the 31 placer claims and nine of the ten placer leases. |
| § | The Project site also overlaps forestry and timber resources interests, including
old-growth management areas, Tree Farm Licenses, and different tenures (active, pending, and retired) such as Occupant Licenses to Cut,
and numerous forest sector resources roads. |
| § | The MSC’s LSA does not overlap any Agricultural Land Reserve (“ALR”)
areas. The TL route overlaps some ALR lands. |
| § | The Mine Site LSA and Transmission Line LSA do not overlap any range tenures. |
Recreation and tourism are important activities
for the area from both a recreational and economic perspective. In the winter, local residents enjoy snowmobiling, snowshoeing, cross-country
skiing, back country skiing, and dog sledding opportunities. In summer, ATV use, mountain biking, hiking, canoeing, fishing, gold panning,
wildlife viewing, and bird-watching are popular activities. Wells, Barkerville, and the neighbouring Bowron Lakes are popular tourist
destinations. The Wells and Area Visitor Centre, located on Jack of Clubs Lake, provides tourists information about the area.
Hunting, trapping, and fishing is another land
use in the Project area and is reflected in five guide outfitter certificate areas that overlap with one or more Project Study Areas.
Resident and non-resident anglers are provided with the opportunity to go fishing where and when they desire as long as they follow current
fishing regulations. Regulations for Region 5 – Cariboo indicate that Lake trout over 45 cm in Jack of Clubs Lake may contain
elevated mercury levels, and consumption should be limited (Government of BC, 2021).
| |
Osisko Development Corp.
NI 43-101 Technical Report
Feasibility Study for the Cariboo Gold Project |
|
The RSA of the Project for the Mine Site and TL
overlaps:
| § | Two Agricultural Land Reserve areas; |
| § | Several agricultural Crown tenures; |
Both the RSA and LSA display parcels with different
owner types, tenures, and licenses (private and Crown).
Soil characterization of existing conditions for
the Mine Site was conducted by WSP-Golder (Golder, 2022a) including field studies between 2016 and 2020 for the MSC, where information
was collected from 740 sites regarding location, site characterization, and bioterrain information within the LSA. Of these sites, 490
included, at a minimum, a soil subgroup assignment.
Soil characterization of existing conditions for
the TL was conducted by Falkirk Environmental Consulting (“FEC”) in 2024. Information was collected regarding the soil characteristics
along sections of the TL that fall within the ALR pond will require the importation of fill to complete the underground vault crossing
of the BC Hydro right-of-way.
The majority of project infrastructure for the
Mine Site will be located on brownfield sites that have been previously disturbed by historical mining operations that were not reclaimed
after the closure of those mines. The Project is committed to minimization of surface disturbance and utilization of existing disturbed
areas. ODV's Soil Management Plan, the Reclamation and Closure Plan (“RCP”) for the MSC, the DRP for the Transmission Line,
the MSC Remediation Plan, and industry standard Best Management Practices (“BMPs”) for soil management will be implemented
prior to the start of construction and throughout the Operation Phase of the Project to ensure that measures are in place to minimize
loss and alteration of soil quantity and quality.
Efforts to conserve soil quality during stripping,
transport, storage, and redistribution over reclaimed areas are discussed in a Soil Management Plan, the Mine Site RCP, and the TL DRP
and specify the volumes and types of salvaged soil and describe recommended procedures to decommission, reclaim, and remediate mine components
during the Closure Phase.
A Mine Emergency Response Plan, Chemical and Materials
Storage, Transfer and Handling Plan, and Fuel Management and Spill Control Plan provide the management of hazardous materials and regulate
prevention and response actions in the event of a release. Prevention of soil contamination by effective management of waste generated
by Project employees are described in a Waste (Refuse and Emission) Management Plan.
| |
Osisko Development Corp.
NI 43-101 Technical Report
Feasibility Study for the Cariboo Gold Project |
|
The Project spans two biogeoclimactic zones:
| § | Sub-Boreal Spruce: occurs throughout the lower elevations at the MSC, and
large portions of the TL route; |
| § | Engelmann Spruce-Subalpine Fir: occurs the higher elevations along the TL
route, and at the Mine Site. |
Due to historical anthropogenic use, much of the
MSC and Bonanza Ledge Site are not vegetated and consist of anthropogenic infrastructure such as road surfaces, mine spoils, and historic
mines (Morgan et al., 2019).
The TL follows existing transmission line corridors,
highways and forest service roads wherever possible. The TL corridor alignment occurs within the ALR between km 0.2 and km 3.8,
and the remaining alignment is in generally forested areas that have anthropomorphic features such as road surfaces and clear-cuts from
previous logging activities, and residential development. Undisturbed forested area within the TL corridor includes old-growth forest
and caribou habitat.
WSP-Golder investigated vegetation existing conditions.
During 2016, 2018, 2019, and 2020, Golder (2021b) conducted ecosystem-based subcomponent-field studies including Terrestrial Ecosystem
Mapping, identification of listed species, traditional use plants, invasive and non-native plant species, and forage species for wildlife.
The more recent studies carried out by WSP-Golder do not affect the existing conditions described in this section.
Efforts to minimize impacts to vegetation during
construction are discussed in the Vegetation Management Plan and the Invasive Plants Management Plan. Additional measures are detailed
in the Construction Environmental Management Plans for both the Mine Site and the TL. The Mine Site RCP and the TL DRP outline protocol
for revegetation reclamation prescriptions.
| 20.1.7 | Wildlife
and Wildlife Habitat |
Existing conditions data for wildlife and wildlife
habitat was collected through background information review and field data collection. Six field study programs were completed by WSP-Golder
from 2016 to 2020: amphibian breeding surveys, breeding bird surveys, northern goshawk surveys, winter tracking surveys, bat summer foraging
and winter hibernacula acoustic surveys, and remote camera surveys. The Project area provides suitable habitat for several reptiles, birds,
mammals, and invertebrate species, including federally and/or provincially listed species.
| |
Osisko Development Corp.
NI 43-101 Technical Report
Feasibility Study for the Cariboo Gold Project |
|
Waterbodies throughout the Project area provide
suitable amphibian breeding habitat including Columbia spotted frog (Rana luteiventris), wood frog (Lithobates sylvaticus),
western toad, and long-toed salamander (Ambystoma macrodactylum), while upland forested areas provide habitat for terrestrial amphibians.
Birds, such as passerines, raptors, and waterfowl,
may utilize a variety of habitat types throughout the Project area, including forested habitat, riparian areas, clear-cuts, wetlands,
and open waterbodies.
Shrub, forest, and wetland habitat provide suitable
habitat for small mammals, ungulates, and small to large carnivores. Open waterbodies, wetlands, and rights-of-way throughout the Project
area provide suitable foraging habitat for bats, while abandoned mine shafts and adits provide potential bat winter hibernacula. Suitable
invertebrate habitat occurs throughout the Project area and includes wetlands, riparian areas, watercourses, forested habitat, and clear-cuts
(Morgan et al., 2019).
Important Wildlife Areas (“IWAs”)
are defined geographical areas recognized as being important to wildlife and biodiversity on a regional, national, or international scale.
Five IWAs overlap the Terrestrial LSA:
| § | The Project Caribou Assessment Area (“CAA”) is entirely
within southern mountain caribou critical habitat (provincial and federal) and covers 334,322.3 ha. The CAA is defined by the boundaries
of the Barkerville herd boundary obtained from WLRS on May 17, 2024, plus an additional area of federally designated ‘unmapped
range’ caribou critical habitat west of the Barkerville herd boundary, which includes a 2 km buffer around the Transmission Line
ROW, 3.6 km buffer around QR Mill, and 0.8 km buffer around the Transportation Route and access roads. The CAA is divided into approximately
156,137.8 ha of core all-season caribou critical habitat, 149,632.2 ha of matrix habitat, and 28,552.3 ha of unmapped federal
critical habitat. |
| § | Provincial Parks and Protected Areas Barkerville Park, Wendle Park,
Bowron Lake Park, Mount Tinsdale Ecological Reserve, Cariboo River Park, Cariboo Mountains Park, Long Creek Park, Quesnel Lake Park, Cedar
Point Park, Dragon Mountain Park, and Beaver Valley Park. |
| § | Ungulate Winter Ranges (“UWRs”) are mapped areas that
contain habitat that is necessary to meet the winter habitat requirements of an ungulate species (Paige and Darling, 2009). Approximately
1,035 ha and 45,216 ha of the Terrestrial RSA is designated as caribou and mule deer UWR, respectively. |
| § | Wildlife Habitat Areas (“WHAs”) (caribou and grizzly bear)
are mapped areas that are deemed necessary to meet the habitat requirements of an Identified Wildlife species under the Identified Wildlife
Management Strategy (Page and Darling, 2009). Approximately 190,234 ha of designated WHAs for southern mountain caribou are located
in the Terrestrial RSA, including 862 ha within the Terrestrial LSA boundary. Approximately 787 ha of designated WHAs for grizzly bear
are located in the Terrestrial RSA. No grizzly bear WHAs are designated within the Terrestrial LSA. |
| |
Osisko Development Corp.
NI 43-101 Technical Report
Feasibility Study for the Cariboo Gold Project |
|
| § | High Value Wetlands and W1, W3, and W5 Wetlands for Moose in the Cariboo
Region are mapped areas that have been deemed necessary to meet objectives stated in the Cariboo Chilcotin Land Use Plan (“CCLUP”)
(Government of BC, 1996) and the Quesnel Sustainable Resource Management Plan (“QSRMP”) from the Ministry of FLNRORD, (Province
of BC, 2007) to retain vegetation for security and thermal cover for wintering moose. Approximately 2,971 ha of identified high value
wetlands overlap the Terrestrial RSA, including 95.9 ha that overlap the Terrestrial LSA. |
The Project has committed to mitigation measures
to reduce the impacts to wildlife. Project infrastructure will be designed to reduce the potential wildlife impacts, such as prevention
measures to limit bat access to underground mine portals and reducing light pollution. The Project has also developed four management
plans associated with wildlife:
| § | Wildlife Management Plan applicable for all wildlife; |
| § | Caribou Mitigation and Management Plan applicable to caribou-specific management; |
| § | Bat Mitigation and Monitoring Plan applicable to bat-specific management; |
| § | Wildlife Access Management Plan applicable to access management for wildlife. |
The above plans are living documents and will
be updated as new information becomes available and each apply to the Project’s Construction, Operations, and Closure Phases.
The Mine Site RCP and the TL DRP detail prescribed
habitat targets for planning revegetation of Project components.
| 20.1.8 | Fisheries
and Aquatic Resources |
Most of the recent fish and fish habitat surveys
conducted between 2020 and 2021 by Golder include habitat reconnaissance for the TL, fish sampling and hydroacoustic survey on Jack of
Clubs Lake, and review of Resources Information Standards Committee for the TL and Jack of Clubs Lake, and a fish community survey in
Jack of Clubs Lake (Golder, 2021a).
Fish populations and fish habitat are found throughout
the Project area, with fish distribution typically limited by gradient, barriers and obstructions, flows, and habitat quality. The MSC
and Bonanza Ledge Site are located within the Willow River watershed and contain several tributaries, including Slough Creek, Mosquito
Creek, Lowhee Creek, Williams Creek, and Jack of Clubs Creek. Twelve fish species have been recorded in watercourses within the Willow
River watershed, including Bull Trout, which is a provincially blue-listed species (Fisheries Information Data Queries “FIDQ”,
2020; BC CDC, 2011).
| |
Osisko Development Corp.
NI 43-101 Technical Report
Feasibility Study for the Cariboo Gold Project |
|
Implementation of BMPs and management plans
during Construction and Operations are expected to be effective at avoiding instream and riparian habitat at the Mine Site.
Therefore, effects on fish and fish habitat are not expected.
The Willow River watercourse crossing that will
be constructed for the new Mine Site Road will be a clear span bridge, which has no infrastructure in the watercourse, and has been designed
to avoid impacts to instream fish habitat.
The diffuser pipeline and installation of the
Jack of Clubs Lake diffuser will follow standard mitigation measures and best management practices. The diffuser pipeline and diffuser
have been designed to avoid sensitive fish and fish habitat along the shoreline and within the lake, as well as littoral areas and river
habitat that support spawning or rearing fish.
| 20.2 | Environmental
Liabilities |
The Project has been designed with input from
Indigenous nations, local communities, and other stakeholders to limit potential impacts on water, land, and biodiversity during both
construction and operation. ODV aims to integrate and implement relevant technologies and recognized industry practices to address environmental
considerations throughout the Project’s lifecycle, while supporting short- and long-term social and economic benefits for Indigenous
nations, local communities, employees, and shareholders.
The Government of BC requires that a security
bond be provided to address expected environmental liabilities for the Project. The security bond for the Transmission Line will be determined
by the Ministry of Water, Land and resource Stewardship and the Reclamation Liability Cost Estimate.
ODV is not aware of any significant factors and
risks that may affect access, title, or the right or ability to perform the proposed work program on the Project Study Area.
| 20.3 | Environmental
Management and Monitoring |
ODV has established environmental monitoring plans
for a suite of valued components to respond to regulatory requirements and best management practices for the Project. The following subsections
present management and monitoring activities connected to some of the key aspects of the Project such as waste rock, tailings, water,
and other wastes.
| |
Osisko Development Corp.
NI 43-101 Technical Report
Feasibility Study for the Cariboo Gold Project |
|
| 20.3.1 | Ore
Sorter Waste and Waste Rock Geochemistry |
The ore sorter waste and waste rock geochemical
characterization program included static testing and kinetic testing of representative samples collected from drill cores. The geochemical
testing program is discussed in detail in the Geochemical Existing Conditions Report (Golder, 2022f and WSP, 2023a).
The objective of
the geochemical characterization program was to determine the acid rock drainage (“ARD”) and metal leaching (“ML”)
potential of each material type. The results of acid-base accounting (“ABA”) and mine plan tonnages for lithologies were used
to quantify the proportion of potentially acid generating (“PAG”), uncertain and non-potentially acid generating (“NPAG”)
samples. Humidity cell tests (“HCT”) were used assess ML material/lithology by screening for constituent of potential concern
(“COPC”). Screening included comparison of 95th percentile leachate concentrations from HCTs to permit discharge
limits.
The results
of the geochemical tests outlined above were used to interpret ARD / ML potential by material type:
Based on ABA results from Table 15 in Golder (2022f) and
fractions of lithologies in development waste reported by ODV, up to 5% of the waste is classified as PAG, up to 18% are classified as
uncertain, and the remainder is classified as NPAG. Although some rock has potential to generate localized acidic conditions, there is
sufficient neutralization potential within the bulk waste rock material to prevent acidic drainage. Leachates from HCTs representing future
PAG waste have not generated acidic leachates (with pH<4.5) even after 200 weeks of testing. Arsenic and copper were screened as COPC
in HCT leachates from waste rock.
According to the results of ABA, 18% of the ore sorter waste
samples are classified as PAG, 12% are classified as uncertain, and 70% are classified as NPAG (Table 2 in WSP, 2023b). In one of the
four HCTs with uncemented ore sorter waste, arsenic was screened as COPC. Copper and chromium were identified as COPCs in leachates from
HCTs with cemented ore sorter waste.
Quantitative effects
of metal leaching from waste rock and ore sorter waste were evaluated with the integrated water balance and quality model (Section 20.3.3).
The ore material handling strategy can be found
in Section 16.6, and the waste rock management strategy can be found in Section 18.3.5.1.
| |
Osisko Development Corp.
NI 43-101 Technical Report
Feasibility Study for the Cariboo Gold Project |
|
| 20.3.2 | Tailings
Geochemistry |
Rougher and cleaner flotation tailings will be
produced in ratios of 5:1 (rougher:cleaner). Preliminary data indicate that rougher tailings will be NPAG, while cleaner tailings will
likely be PAG with elevated arsenic content. Rougher tailings and cleaner tailings will be combined and sent to the paste plant to be
returned underground as paste backfill. Paste backfill is classified as NPAG based on static and kinetic tests (WSP, 2023b). Leachates
from kinetic tests are alkaline and with 95th percentile concentrations of chromium, copper and arsenic exceeding the respective
discharge limits for the MSC. During mining, these elements will be leached into mine water. Excess mine water will be collected as part
of mine dewatering and treated below the discharge limits before being discharged into the environment.
The paste fill criteria, infrastructure and distribution
can be found in Sections 13.8 and 16.7.
| 20.3.3 | Water
Quantity and Quality |
A water balance
model (“WBM”) was developed by Falkirk (2025) to simulate the proposed water management system. Flow diagrams showing project
components and their connectivity within the water management system are presented on Figure 18-4 (Stage 1) and Figure 18-5
(Stage 2). Stage 1 is the mine development period prior to mine start-up and Stage 2 is when the mine is in full production.
The WBM was run
with daily timesteps for the timeframe covering Stage 1, Stage 2, a two-year closure/reclamation period after operations, followed by
post-closure. Table20-3 summarizes water balance input assumptions.
Ore processing at the mill will start at the beginning
of Stage 2. Mill inflows and outflow estimates were provided by ODV (Table20-4) and incorporated into the site-wide water balance.
A version of the Monte-Carlo method was implemented
to evaluate a realistic range of environmental flow conditions. The model was run using a 123-year long record (1900-2023) of daily temperature
and precipitation from the Barkerville weather station. 123 unique versions of the input dataset were run through the model, generating
123 unique sets of results (i.e., model realizations). For example, the first realization was run using Year 1 of the input dataset at
the beginning of the simulation. The model was run a second time using Year 2 of the input dataset at the beginning of the simulation,
and so on. Model output presented herein is a statistical summary in terms of average and 95th percentile (P95) of the model
of the realizations.
| |
Osisko Development Corp.
NI 43-101 Technical Report
Feasibility Study for the Cariboo Gold Project |
|
Table20-5 shows average monthly treatment rates
for each project stage. The Bonanza Ledge WTP and MSC WTP will operate concurrently for about the second half of Stage 1. ODV is authorized
under the EMA Permit PE-111511 to discharge up to 480 m3/h to Jack of Clubs Lake from the proposed MSC WTP. ODV plans
to amend the permit to 800 m3/h. To account for the time required for permit amendment, ODV assumed the MSC WTP will treat
mine dewatering at a maximum rate of 480 m3/h in Stage 1 while the Bonanza Ledge WTP continues to treat Bonanza Ledge
contact water. Once the permit is amended, the MSC WTP will treat with capacity of 800 m3/h, Bonanza Ledge WTP will be
decommissioned, and Bonanza Ledge contact water will be piped to MSC for treatment at the MSC WTP.
Figure 20-1 is a plot of daily treatment
rate at Bonanza Ledge WTP and MSC WTP. On average, the treatment rate is greatest during spring snowmelt. However, summer and fall storm
events can occur, requiring the WTP to operate at maximum capacity, demonstrated by the P95 statistic. Treatment rate remains relatively
steady through winter months when runoff is minimal and inflow primarily comes from mine dewatering.
| |
Osisko Development Corp.
NI 43-101 Technical Report
Feasibility Study for the Cariboo Gold Project |
|
Table 20-3: Water balance
model input assumptions
| Model Component |
Input Assumption |
Source |
| Hydrology / Drainage |
|
|
| Catchment Areas |
Figure 18-5 (Stage 1 Bonanza Ledge)
Figure 18-6 (Stage 2 Bonanza Ledge)
Figure 18-7 (Stage 2 Mine Site Complex) |
Measured by Falkirk from contour mapping. |
| Temperature and Precipitation |
123-year long record of daily data from Barkerville. |
ECCC climate station at Barkerville (ID 1090660). |
| Runoff Rate |
Calculated from the temperature and precipitation dataset with a runoff model. Calibrated using historical Bonanza Ledge WTP records. |
Runoff model developed
by Falkirk. |
| Non-contact Diversion Channel Efficiency |
90% |
Assumed by Falkirk. |
| Environmental Design Flood |
30-day (duration), 200-year (return period) rainfall plus snowmelt, adjusted for climate change. Total depth = 701 mm. |
Figure 20-2 |
| Storage Capacity |
|
|
| Bonanza Ledge SCP |
10,600 m3 |
KP, 2024 |
| Bonanza Ledge FMR |
84,000 m3 |
WSP, 2023 |
| MSC SCP |
50,600 m3 |
ODV, 2025 |
| Pond A |
710 m3 |
Golder, 2021 |
| Pond B |
390 m3 |
Golder, 2021 |
| Mine Dewatering |
|
|
|
Stage 1 Groundwater Inflow.
Pump
out via Cow Portal to Bonanza Ledge. |
Base case: 800 m3/day (33 m3/h)
Upper bound: 1,300 m3/day (54 m3/h) |
WSP, 2023d |
| Stage 1 Mine Pool Dewatering Volume. |
Initial volume of water in the underground requiring pump out prior to full mine production = 1,090,000 m3. |
ODV, 2024b |
|
Stage 2 Groundwater Inflow
Pump out via Valley Portal to MSC. |
Base case: 6,000 m3/day (250 m3/h)
Upper bound: 8,700 m3/day (363 m3/h) |
WSP, 2023d |
| Tailings Paste Bleed Water |
20% of initial water content of tailings paste backfill. |
Interpretation of results from paste fill testing (WSP, 2023a) |
| Water Treatment |
|
|
| Bonanza Ledge WTP Capacity (Stage 1) |
Maximum treatment rate = 279 m3/h total
28.3% reclaimed for backwash, net treatment = 200 m3/h |
Section 18.3.5.2 |
| MSC WTP Capacity (Stage 1) |
Maximum treatment rate = 480 m3/h
6.8% reclaimed for backwash, net treatment = 447 m3/h |
ODV, 2024c |
| MSC WTP Capacity (Stage 2) |
Maximum treatment rate = 800 m3/h
6.8% reclaimed for backwash, net treatment = 746 m3/h |
Section 18.3.6.4 |
| |
Osisko Development Corp.
NI 43-101 Technical Report
Feasibility Study for the Cariboo Gold Project |
|
Table 20-4: Mill water
balance
| Flow Component |
Flow Rate |
| (m3/day) |
(m3/h) |
| Inflow |
|
|
| Reagent mixing (from MSC WTP effluent) |
148 |
6.2 |
| Gland seal water (from MSC WTP effluent) |
1,194 |
49.8 |
| Ore feed moisture content |
258 |
10.8 |
| Total |
1,600 |
66.7 |
| Outflow |
|
|
| Ore reject moisture content (to WRSF) |
94 |
3.9 |
| Concentrate moisture content (to offsite) |
84 |
3.5 |
| Paste backfill moisture content (to underground) |
910 |
37.9 |
| Surplus (to MSC WTP) |
512 |
21.3 |
| Total |
1,600 |
66.7 |
Table 20-5: Water balance
model results for water treatment plants
| Month |
Average Treatment Rate (m3/h)(1) (2) |
| Stage 1 |
Stage 2 |
Closure |
| BL WTP |
MSC WTP |
MSC WTP |
MSC WTP |
| Jan |
8 |
330 |
253 |
21 |
| Feb |
19 |
348 |
319 |
26 |
| Mar |
28 |
354 |
330 |
32 |
| Apr |
57 |
375 |
402 |
104 |
| May |
109 |
402 |
508 |
209 |
| Jun |
118 |
377 |
475 |
177 |
| Jul |
50 |
359 |
370 |
78 |
| Aug |
53 |
362 |
355 |
53 |
| Sep |
52 |
364 |
377 |
79 |
| Oct |
52 |
381 |
378 |
86 |
| Nov |
27 |
369 |
336 |
53 |
| Dec |
21 |
365 |
319 |
37 |
| Annual |
49 |
365 |
368 |
80 |
| (1) | Results represent total inflow to water treatment plants. |
| (2) | Average of 123 model realizations. |
| |
Osisko Development Corp.
NI 43-101 Technical Report
Feasibility Study for the Cariboo Gold Project |
|
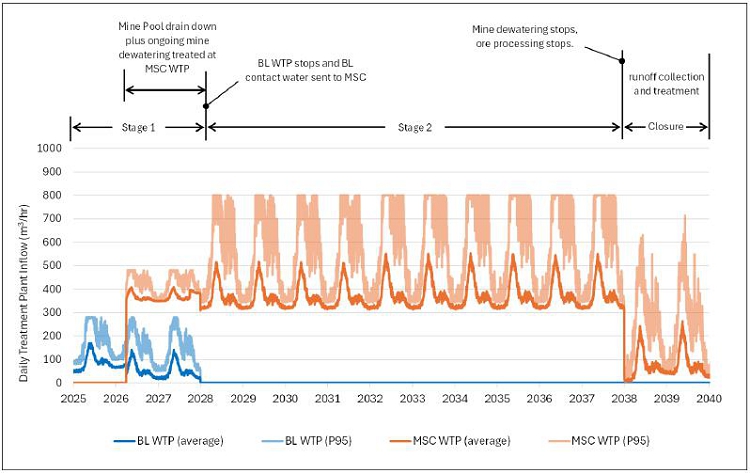
Figure 20-1: WBM results for Bonanza Ledge
WTP and Mine Site Complex WTP daily statistics from 123 unique model realizations
| |
Osisko Development Corp.
NI 43-101 Technical Report
Feasibility Study for the Cariboo Gold Project |
|
The Project will have a combined storage and treatment
capacity to manage the Environmental Design Flood (“EDF”) without uncontrolled release to the environment. The EDF was defined
in this assessment as the runoff generated from a 30-day (duration), 200-year (return period) rain plus snowmelt event, adjusted for climate
change ().
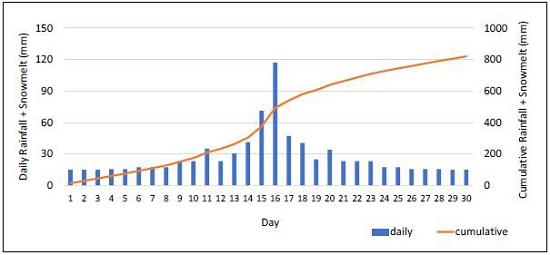
Figure 20-2: Environmental
design storm event: rainfall + snowmelt adjusted for climate change
During the EDF,
runoff will be stored in the Bonanza Ledge SCP, MSC SCP, and Bonanza Ledge Flood Management Reservoir while the MSC WTP treats at
its assumed capacity of 800 m3/h. When the combined storage exceeds a threshold volume, dewatering from the MSC underground
ceases until storage volume in the MSC Pond and Bonanza Ledge Pond can be drawn down. The built-up water in the MSC underground will be
drained down following the EDF when MSC WTP capacity becomes available.
shows results for the base case groundwater inflow
scenario and results in a maximum volume of about 80,000 m3 retained in the MSC underground. If the upper bound groundwater
inflow rate is assumed, the maximum storage volume in the underground during the EDF would be about 150,000 m3.
| |
Osisko Development Corp.
NI 43-101 Technical Report
Feasibility Study for the Cariboo Gold Project |
|
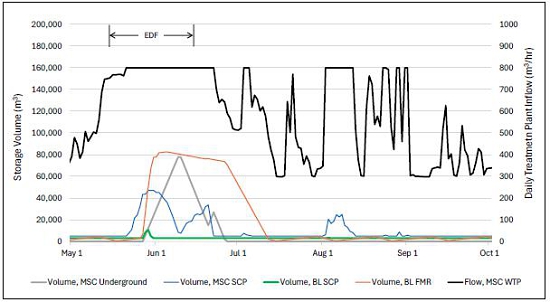
Figure 20-3: WBM results
for the EDF, base case mine groundwater inflow single model realization
The Mine Site water
quality model was integrated with the WBM described above. Water quality modelling approach was generally based on historical water
monitoring at the Bonanza Ledge Mine (Falkirk, 2025). Monitoring datasets used as concentration inputs to represent major sources as follows
(with data source referenced in brackets):
| § | Dewatering of flooded historical workings: mine pool dataset (WSP, 2023c) |
| § | Mine water from Bonanza Ledge and future underground workings: 1400 level
sump monitoring location (ODV, 2024a) |
| § | Paste backfills contact water: kinetic tests on cemented kinetic paste (WSP,
2023c) |
| § | Waste rock storage facility water: PAG WRSF seeps scaled for increase in
pile height (ODV, 2024a) |
| § | Ore stockpile runoff/seepage: dataset of all seeps from WRSFs and the ore
stockpile seep (ODV, 2024a) |
| § | Runoff from reclaimed areas: a sample from reclaimed open pit cover at Bonanza
Ledge (ODV, 2024a) |
| § | Mill effluent (if any): process water from laboratory flotation tests (WSP,
2023c) |
| |
Osisko Development Corp.
NI 43-101 Technical Report
Feasibility Study for the Cariboo Gold Project |
|
| § | Runoff from developed areas (excluding areas noted above): monthly distribution
from the Bonanza Ledge SCP (ODV, 2024a) |
| § | Runoff from undeveloped areas: monthly distribution from EG-0.25 monitoring
location (ODV, 2024a). |
Nitrogen loading in mine water was predicted from
nominal blasting inputs from mine plan and historical dewatering flows rates and concentrations at 1400 level sump. Nitrogen speciation
was predicted from temperatures and concentrations of nitrate, nitrite, and ammonia at 1400 level sump.
A probabilistic
approach, via Monte Carlo simulations, was used to incorporate uncertainty into the water quality model. Statistical inputs (e.g., 10th,
50th and 90th percentiles) and associated probability distributions were derived from the datasets for each source,
where possible. Multiple realizations were run on a daily timestep to generate concentration statistics during mine operations, closure
and post-closure phases. Daily 95th percentile concentrations predicted for untreated discharges from Bonanza Ledge
and MSC sites were compared to respective permit limits to inform Bonanza Ledge WTP upgrade and MSC WTP design (Falkirk, 2025). The predicted
exceedances of the limits can be summarized for mine phases as follows:
| § | In first years of operation, Bonanza Ledge WTP influent was predicted to
exceed the Bonanza Ledge discharge permit limits for total suspended solids, sulphate, total and un-ionized ammonia, nitrate nitrogen,
nitrite nitrogen, total aluminum, total arsenic, total chromium, total cobalt, total iron, total lead, total manganese, total nickel,
total silver, total uranium, total zinc, dissolved cadmium, dissolved copper and dissolved iron. |
| § | During subsequent operations, MSC WTP influent was predicted to exceed the
MSC discharge permit limits for total suspended solids, un-ionized ammonia, nitrate nitrogen, nitrite nitrogen, total aluminum, total
arsenic, total chromium, total cobalt, total iron, total lead, total manganese, total mercury, total nickel, total phosphorous, dissolved
copper dissolved iron and dissolved zinc. |
| § | During closure, MSC WTP influent was predicted to exceed the MSC discharge
permit limits for total suspended solids, chloride, sulphate, nitrite nitrogen, total aluminum, total arsenic, total chromium, total cobalt,
total iron, total lead, total manganese, total mercury, total nickel, total phosphorous, dissolved copper and dissolved iron. |
| § | In post-closure, MSC WTP influent was predicted to exceed the MSC discharge
permit limits for total suspended solids, total aluminum, total chromium, total cobalt, total iron, total manganese, total mercury, total
nickel, total phosphorous, dissolved copper and dissolved iron. |
| |
Osisko Development Corp.
NI 43-101 Technical Report
Feasibility Study for the Cariboo Gold Project |
|
Details of proposed water treatment methods are
summarized in Sections 18.3.5.2 and 18.3.6.4.
Ongoing monitoring will be used to update water
quality model predictions and inform water quality mitigations, particularly for closure and post-closure phases.
| 20.4 | Considerations of Social and Community Impacts |
ODV is committed to meaningful and transparent
engagement with Indigenous nations, the public, local community members, and other stakeholders. ODV has cultivated positive relationships
with the three Participating Indigenous nations, within whose traditional territory the Project is located. ODV intends to maintain these
relationships through all phases of the Project.
The nearest community to the Project is the District
of Wells, where the MSC is located. Other stakeholders include tenure holders (such as trapline holders, guide outfitters, and forestry
proponents), local and regional governments, health authorities, and government regulatory agencies.
The Project is in the Wells-Barkerville area of
the Cariboo Regional District (“CRD”) in British Columbia, with the nearest communities to the Project being the District
of Wells, Barkerville Historic Town & Park, and Quesne. A portion of the Mine Site and other Project components are outside of
the District of Wells and are located in Electoral Areas C and F of the CRD. There are several unincorporated communities in the area,
including New Barkerville and other settlements along Highway 26.
The Participating Indigenous nations for the EA
for the Project are Lhtako Dené Nation, Xatśūll First Nation, and Williams Lake First Nation. Both Nazko First Nation
and the Tsilhqot’in National Government opted not to participate in the EA for the Project; however, are notified on project activities
through the Environmental Assessment Office(“EAO”).
The primary employment industries in the area
closest to the Project are Manufacturing and Construction, Wholesale and Retail Trade, and Accommodation and Food; however, other services
(repair and maintenance, personal and laundry services, private households, religious or social organizations, etc.) also comprise
a large proportion of employment in the Project area (Statistics Canada, 2021).
| |
Osisko Development Corp.
NI 43-101 Technical Report
Feasibility Study for the Cariboo Gold Project |
|
Communities in the CRD, and more specifically
the communities nearest to the Mine Site and Transmission Line have a history of resource development, and as a result have experienced
the positive and negative effects of that development, arising from boom-and-bust cycles that can accompany resource development. Between
the 2001 and 2016 censuses, the population in the areas closest to the Project area has seen an overall decrease, distinct from a population
increase for the province as a whole.
Land and resource use within the broader Project
area includes trapping, guided hunting, commercial recreation, outdoor and adventure tourism, including fishing, hunting, camping, hiking,
cross-country skiing, snowmobiling, dog sledding, and all-terrain vehicle (“ATV”) riding. There are mineral, water and range
tenures, guide outfitters and traplines in the vicinity of the Project. The area is recognized as having visual landscapes associated
with tourism, and over the years, Wells has attracted artists of all types and has encouraged arts creativity. The result is that art
is now an essential part of Wells’ identity and a major attraction to tourists who visit Wells to enjoy visits to art galleries, Island
Mountain Arts, Sunset Theatre, community coffee houses, and restaurants/pubs. Wells is known as the Gateway to Barkerville Historic Town,
the Bowron Lake Chain, and the Gold Rush Trail. Scenic area management of the landscape surrounding the Project area is identified as
an objective in current land and resource planning (i.e., the CCLUP) Integration Report, and the QSRMP (Province of BC, 1998; Province
of BC, 2007).
| 20.4.2 | Engagement and Consultation |
Consultation with Indigenous nations and the public
are components of provincial and federal legislation for both EA processes and permitting activities. As the Province of BC strives to
bring all its legislation into alignment with Bill 41 - Declaration on the Rights of Indigenous Peoples Act (“DRIPA”)
(Province of BC, 2019), provisions for consultation with Indigenous nations will continue to be supported by proponents. The new Environmental
Assessment Act (Province of BC, 2018) was revitalized to ensure the provincial government’s commitment to DRIPA was met,
and reconciliation could be advanced. As a result, the EAO seeks consensus with Participating Indigenous nations throughout the process.
ODV prepared and implemented an Indigenous Nation
Engagement and Collaboration Plan that details the Company’s approach to engagement, capacity funding, protocols, intentions to
incorporate Indigenous knowledge through all phases of the Project, and opportunities identified through engagement. This plan, along
with ODV’s Public Engagement Plan, informed consultation and engagement activities throughout the EA and permitting process.
| |
Osisko Development Corp.
NI 43-101 Technical Report
Feasibility Study for the Cariboo Gold Project |
|
The definition of measures for engagement by ODV
have been developed through collaboration and relationships with the Participating Indigenous nations during the EA, guidance from the
EAO, and in response to community and public inquiries. These measures, at a minimum, comply with federal and provincial regulations and
requirements for consultation and engagement.
ODV has been actively engaging with Indigenous
nations to understand their Indigenous interests in the Project and the areas influenced by the Project. During the Early Engagement Phase
of the Environmental Assessment, the EAO confirmed that the Project is in the asserted traditional territory of Lhtako Dené Nation,
Xatśūll First Nation, and Williams Lake First Nation, and that each of these nations would be Participating Indigenous nations
for the Project, including the Environmental Assessment and permitting processes.
Engagement activities with Lhtako Dené
Nation began in 2016, with Xatśūll First Nation in 2017, and with Williams Lake First Nation in 2018. The focus of engagement
has been to inform Indigenous nations about the Project and respond meaningfully to questions and concerns raised about the Project and
associated studies. ODV is developing an Indigenous Partnership Plan that will guide engagement as we move through all Project phases.
On October 2,
2020, ODV signed a life-of-project agreement to facilitate the development and full build-out of the Project with the ongoing consent
and support of Lhtako Dené Nation during all stages of the Project. On June 10, 2022, a participation agreement was signed
with Williams Lake First Nation. ODV continues to engage with Xatśūll First Nation on a Project agreement.
| 20.4.4 | Federal, Provincial and Municipal Governments |
ODV has engaged with various provincial and local
government agencies, to differing degrees and levels of engagement as part of the EA and permitting processes for the Project. The District
of Wells, City of Quesnel, City of Prince George, City of Williams Lake, CRD and the Regional District of Fraser Fort George, as well
as the North-Central Local Governments Association have been engaged by ODV since 2016, when the Project Planning phase was initiated.
ODV will continue to engage and collaborate with
federal, provincial, regional and municipal government bodies and representatives as necessary, with respect to the Project, land and
resource management, heritage and protected areas, official community plans and associated priorities, infrastructure, land use and access,
employment and training, and any other matters deemed relevant.
| |
Osisko Development Corp.
NI 43-101 Technical Report
Feasibility Study for the Cariboo Gold Project |
|
| 20.4.5 | Public Stakeholders |
Proactive engagement with the public and stakeholders
was undertaken beginning in the Project Planning Phase, initiated in 2016, to build awareness about the Project, understand the priorities
of stakeholders and current conditions in their communities, and to understand interests and concerns around the Project as a means through
which issues could be avoided through design or mitigation.
The following public and stakeholders regularly
receive Project information:
| § | Community and Environmental Organizations and Interest Groups; |
| § | Community Service Providers; |
| § | Business and Economic Development Organizations; |
| § | Landowners along the Transmission Line and other Project components; |
| § | Tenure holders, including traplines, guide outfitters, mineral, forestry
companies and water license holders; |
| § | Heritage and Cultural Stakeholders; |
| § | Tourism-related and other Businesses; |
ODV is developing a Community Involvement Plan
which will guide engagement with the District of Wells and Community of Wells throughout all phases of the Project. Public and stakeholder
engagement to date has included community meetings (in person and virtual), one-on-one meetings with individuals and special interest
groups, workshops and technical meetings, surveys and feedback forms, site visits, community events, industry events and public displays.
Feedback from the community and stakeholders was sought and obtained throughout the Project planning process.
| 20.5 | Mine Closure Requirements |
| 20.5.1 | Mine Reclamation and Closure Plan |
ODV has prepared various Reclamation and Closure
Plans for elements of the Project to detail how the sites will be reclaimed to a safe, stable, and non-polluting condition. An RCP for
the Project was provided as an appendix to the EA Application for the Project and was updated and included in the Joint Application for
permitting. A DRP for the Transmission Line was submitted with the application for License of Occupation for the TL. These plans will
continue to be updated as mine plans evolve, regulatory guidelines change, and as required by permit conditions. These plans provide the
basis to develop an integrated RCP and DRP for the Mine Site and TL, including reclamation cost estimates based on the most current assumptions
regarding reclamation and closure of Project facilities and landforms.
| |
Osisko Development Corp.
NI 43-101 Technical Report
Feasibility Study for the Cariboo Gold Project |
|
| 20.5.2 | Regulatory Framework |
The Project mine closure is guided by several
provincial acts and regulations:
| § | British Columbia Mines Act (Government of BC, 1996) and Health, Safety,
and Reclamation Code for Mines in British Columbia (Government of BC, 2021); |
| § | British Columbia Environmental Management Act (Government of BC, 2003); |
| § | British Columbia Water Sustainability Act (Government of BC, 2014); |
| § | Regional Regulations – The Project is located within the Cariboo Regional
District Electoral Area C (the Mine) and Area F (QR Mill) and is subject to the CCLUP and CRD North Cariboo Area Rural Land Use Bylaw
(CRD, 2000); |
| § | Federal Requirements – Federal Acts and Regulations that apply to the
Project include the Fisheries Act (Government of BC, 1985), the Migratory Birds Convention Act (Government of Canada, 1994),
the Seeds Act (Government of Canada, 1985a), and the Metal and Diamond Mining Effluent Regulations (Government of Canada, 2002)
of the Fisheries Act. |
| 20.5.3 | Mine Closure Planning Approach |
The Project footprint at each site has been divided
into Master Areas by ODV to reflect disturbance types and proposed end land uses. Master Areas are generally divided by facility/landform
types with common approaches to reclamation. Detailed closure and reclamation prescriptions are provided for each Master Area consisting
of the following components:
| § | Scope and Extent: Defines location and extent of the Master Area; |
| § | Current Conditions: Describes the Master Area conditions during operations
including progressive reclamation that has already been done; |
| § | Future Conditions: Describes the plan for the Master Area for future development
and use prior to closure; |
| § | Closure Design Basis: Lists regulations, permits, and CRP/DRP that should
be followed to design the closure activities for the Master Area; |
| § | Closure Design Criteria/Constructability: Presents activities and/or requirements
to implement closure such as site preparation, progressive reclamation if applicable, revegetation, and post-closure monitoring/maintenance,
as well as infrastructure decommissioning, and equipment/materials removal. |
| |
Osisko Development Corp.
NI 43-101 Technical Report
Feasibility Study for the Cariboo Gold Project |
|
| 20.6 | Permitting and Required Approvals |
The Project exceeded the threshold for review
under the new BC Environmental Assessment Act (“BCEAA”); (Province of BC, 2018) as per Part 3 (Table Six)
of the Reviewable Projects Regulation: “A new mine facility that, during operations, will have a production capacity of > 75,000
tonnes per year of mineral ore” (Government of BC, 2020). The Project also requires several permits, approvals, and authorizations
from provincial, federal, and municipal agencies, which are summarized in Sections 20.6.2, 20.6.3, 20.6.4, and 20.6.5, respectively. Further
discussion on regulatory requirements is included in the following sections.
| 20.6.2 | BC Environmental Assessment Regulations |
The Project completed an EA under the BCEAA
(2018) () and was awarded EAC #M23-01 on October 10, 2023.
The assessment of the Project’s potential
effects specifically targets the valued components (“VCs”) of the environment that may be affected by the Project, and the
priorities of the participating Indigenous nations, the public, local governments, provincial and federal government agencies, and stakeholders.
VCs are defined as fundamental elements of the physical, biological, or socio-economic (human) environment, including the air, water,
soil, terrain, vegetation, wildlife, fish, economy, health, heritage, and land use components that may be affected by a proposed project.
Any significant
changes in the way the Project will be undertaken will require an amendment to the EAC, which is expected based on the changes described
in this study update. Amendments to the EAC are categorized into three categories: simple, typical or complex. It is anticipated that
the changes will fall into the typical category, as they are technical in nature and will result in a change to the way the Project
will be implemented. This will be confirmed with BC EAO. The amendment application will assess how the proposed changes alter the Project’s
predicted impacts on the VCs.
| |
Osisko Development Corp.
NI 43-101 Technical Report
Feasibility Study for the Cariboo Gold Project |
|
Table 20-6: Regulations
supporting the BC Environmental Assessment Act (2018)(1)
| Regulation |
Description |
Reviewable Project
Regulation (2020) |
The Reviewable Projects Regulation sets out the criteria and thresholds for projects required to undergo the EA process (Government of BC, [2019b]). Reviewable proposed projects are primarily those with a higher potential for adverse environmental, economic, social, heritage, or health effects. Thresholds for both new projects and modifications to existing projects are provided. |
Protected Areas
Regulation (2019) |
This regulation identifies prescribed protected areas (as defined in other enactments) for the purposes of the Reviewable Projects Regulation, which determines which projects must automatically undergo an EA. This regulation is also related to the Minister of Environment and Climate Change Strategy’s authority to terminate a project from the EA process if it had extraordinarily adverse effects on a listed protected area. |
Environmental
Assessment Fees
Regulation
(Province of BC, 2019a) |
The EAO charges fees for a range of services,
from undertaking EAs, through to compliance inspections.
The fees provide partial recovery of the costs
incurred by the EAO in delivering high-quality and timely EAs. Revenue from fees allows the organization to maintain appropriate staffing
levels. The funding is also used to support other provincial agencies in their participation in the EA process. |
Violation Ticket
Administration and
Fines Regulation
(Province of BC, 2019b) |
This regulation enables EAO Compliance and Enforcement Officers to issue tickets with associated monetary penalties to proponents who are not in compliance with their certificate conditions, or their exemption order conditions. |
Administrative Penalties
Regulation
(Province of BC, 2020a) |
Administrative Monetary Penalties are financial penalties that can be issued for prescribed contraventions of the Act or failures to comply with the Act, including failing to comply with the requirements of an EAC or an exemption order made under the Act. Regulated parties will be given prior notice of the EAO’s intention to issue an administrative penalty and will be provided with an opportunity to respond before an administrative penalty is issued. |
(1) Government
of BC (2018).
| 20.6.3 | Federal Permits, Approvals, Licences, and Authorizations |
Federal permits, approvals and authorizations
that are applicable to the Project are summarized in . Specific permit requirements were determined based on discussions with federal
agencies. ODV does not currently hold any federal permits in relation to their operations in the Project area.
| |
Osisko Development Corp.
NI 43-101 Technical Report
Feasibility Study for the Cariboo Gold Project |
|
Table 20-7: Federal permits
and approvals applicable to the proposed Project
| Permit / Approval |
Responsible Agencies |
Federal
Statute |
Project Activity/Regulatory Context |
Fisheries Act Authorization
(Government of Canada,
1985b) |
Fisheries and
Oceans
Canada
(“DFO”) |
Fisheries Act |
No person shall carry on any work, undertaking, or activity other than fishing that results in the death of fish.
No person shall carry on any work, undertaking, or activity that results in the harmful alteration, disruption, or destruction (“HADD”) of fish habitat.
If the death of fish or a HADD cannot be avoided during any part of the Project, an Authorization under Section 35 may be required. |
Migratory Birds Convention
Act Authorization
(Government of Canada,
1994) |
Environment
and Climate
Change
Canada
(“ECCC”) |
Migratory Birds
Convention
Act |
Deposit of substances harmful to migratory birds or vegetation clearing for the Project during the migratory bird nesting season as outlined by ECCC (May 1 to July 15, Zone A4).
Permits may be issued to eliminate dangerous conditions or damage to property caused by migratory birds or their nests. |
Navigation Protection
Program Notification and/or
Approval |
Transport
Canada |
Canadian
Navigable
Waters Act |
Notification and information to the Minister for works that are in, on, over, under, through, or across any navigable water.
Application for approval from the Minister is required for works (other than minor works) that are in, on, over, under, through, or across any navigable water and that may interfere with navigation. |
Species at Risk Act
Authorizations (if required);
(Government of Canada,
2002a) |
ECCC, DFO,
and Parks
Canada |
Species at Risk
Act (“SARA”) |
The Competent Minister may issue a SARA permit authorizing activity that will affect a listed wildlife species, any part of its critical habitat, or the residences of its individuals. |
Explosive Licences and
Permits
(Government of Canada,
1985) |
Natural
Resources
Canada |
Explosives Act,
and
Regulations |
Explosive Licence required for factories and magazines.
Explosive Permit required for vehicles used for the transportation of explosives. |
Transportation of Dangerous
Goods Regulation
(Government of Canada,
2001) |
Transport
Canada |
Transportation
of Dangerous
Goods Act |
This Act addresses the classification, documentation, marking, means of containment, required training, emergency response, accidental release, protective measures and permits required for the transportation of dangerous goods by road, rail or air. |
| |
Osisko Development Corp.
NI 43-101 Technical Report
Feasibility Study for the Cariboo Gold Project |
|
| 20.6.4 | Provincial Permits, Approvals and Licences |
Provincial permits, approvals, authorizations,
and licences that are applicable to the Project are summarized in . The Project is located on Crown lands as well as on a parcel of private
land owned by ODV at the MSC. ODV holds a valid mining lease for the Mine Site.
Table 20-8: Provincial
permits and approvals applicable to the proposed Project
| Permit / Approval |
Responsible Agency |
Provincial Statute |
| Mines Act Permit |
Ministry of Mines and Critical Minerals |
Mines Act |
| Effluent Discharge Permit |
BC Ministry of Environment and Parks |
Environmental Management Act |
| Emissions Discharge Permit |
BC Ministry of ENV |
Environmental Management Act |
| Refuse Permit and Waste Storage Approval |
BC Ministry of ENV |
Environmental Management Act |
| Heritage Conservation Act Permit |
Ministry of Forests (“MOF”), Archaeology Branch |
Heritage Conservation Act
(Government of BC, 1996a) |
| Heritage Conservation Act Concurrence letters |
MOF, Archaeology Branch |
Heritage Conservation Act |
| License of Occupation |
Ministry of Water, Lands, and Resource Stewardship (“WLRS”) |
Land Act
(Government of BC, 1996b) |
| Statutory Right of Way |
Ministry of WLRS, Surveyor Generals Office, Ministry of Transportation and Infrastructure (“MOTI”) |
Land Act |
| Wildlife Act Permit |
Ministry of WLRS, Resource Stewardship Division |
Wildlife Act
(Government of BC, 1996c) |
| Sewer System Regulation Approval |
BC Ministry of Health, Northern Health Authority (“NHA”) |
Public Health Act
(Government of BC, 2008) |
| Construction Permit for a Potable Water Well |
BC Ministry of Health, NHA |
Drinking Water Protection Act
(Government of BC, 2001) |
| Water System Construction Permit |
BC Ministry of Health, NHA |
Drinking Water Protection Act |
| Drinking Water System Operations Permit |
BC Ministry of Health, NHA |
Drinking Water Protection Act |
|
Short Term Use of Water Permit
Water Sustainability Act
Section 10 |
Ministry of WLRS, Water Stewardship Branch |
Water Sustainability Act
(Government of BC, 2014) |
|
Change Approval (for changes in and about a stream),
Water Sustainability Act
Section 11 |
Ministry of WLRS, Water Stewardship Branch |
Water Sustainability Act |
|
Water Licence
(Diversion, storage, and use of water)
Water Sustainability Act
Sections 7 and 9
(Government of BC, 2014) |
WLRS, Water Stewardship Branch |
Water Sustainability Act |
| Licences to Cut and Special Use Permit |
MOF, Forest Tenures Branch |
Forest Act
(Government of BC, 1996d) |
| Industrial Access Permit |
BC MOTI |
Transportation Act
(Government of BC, 2004) |
| Permit for regulated activities |
Ministry of Health |
Public Health Act |
| Explosives Magazine Storage and Use Permit |
Ministry of MCM |
Mines Act |
| |
Osisko Development Corp.
NI 43-101 Technical Report
Feasibility Study for the Cariboo Gold Project |
|
A Mines Act permit approving the mine plan
and reclamation program is required for the Project, as well as amendments to existing provincial permits (e.g., Mines Act and
Environmental Management Act) for the Bonanza Ledge Site. The JPA and ancillary Permit application packages were submitted on May 31,
2023. The Mines Act permit was received November 21, 2024, with the Environmental Management Act permits received December 11,
2024. Other ancillary authorizations are expected in early 2025.
In addition, two pieces of provincial climate
action legislation have direct impacts on the Project and could impact the operation of the Project. The Climate Change Accountability
Act, 2019 (Government of BC, 2019a) and the Greenhouse Gas Industrial Reporting and Control Act, 2016 (Government of BC, 2014)
and associated reporting regulations. The Project is expected to have annual direct GHG emissions exceeding 25,000 tonnes of carbon dioxide
equivalent (“tCO2e”), meaning that it would be subject to both the emissions reporting and verification requirements
in the above Acts.
| |
Osisko Development Corp.
NI 43-101 Technical Report
Feasibility Study for the Cariboo Gold Project |
|
| 20.6.5 | Local Government Permits |
The Project facilities include areas within the
jurisdictions of the CRD and the District of Wells, for the Mine Site specifically. Both jurisdictions have passed bylaws that may pertain
to Project activities/operations and property ownership or business operations, including:
| § | CRD Invasive Plant Management Regulation Bylaw, No. 4949, 2015, regarding
the management of invasive plants; |
| § | CRD Untidy and Unsightly Premises Regulatory Bylaw, No. 4628, regarding
the management of untidy/unsightly properties; |
| § | District of Wells Noise Control Bylaw, No. 93, 2018 limiting hours of
noise during construction; and |
| § | District of Wells Traffic and Streets Bylaw, No. 68, addressing traffic
and provides load and size restrictions. |
Other Wells bylaws are applicable to utility connections
and municipal service fees related to property development (water, sewer, garbage, etc.). These bylaws would be addressed through
direct applications with the District of Wells as required.
| |
Osisko Development Corp.
NI 43-101 Technical Report
Feasibility Study for the Cariboo Gold Project |
|
| 21. | Capital and Operating Costs |
The capital and operating cost estimates presented
in this Feasibility Study Update for the Cariboo Gold Project are based on the construction of an underground mining operation with an
average throughput of 4,900 tpd once commercial production is achieved.
All capital and operating cost estimates cited
in this Report are referenced in Canadian dollars (“CAD or $”).
The total initial capital costs for the Project
are estimated to be $881M. The total sustaining capital cost is estimated to be $525M. These estimates include the addition of certain
contingencies and indirect costs. The cumulative life of mine capital expenditure (“CAPEX”), including initial and sustaining
capital is estimated to be $1,406M and is summarized in Table 21-1 and in Figure 21-1 on an annual basis. Not included in the
LOM capital costs are $39M of pre-final investment decision capital, which is described in Section 21.1.3.
The main capital cost items are the following:
| § | An underground mine, including a primary and secondary crushing circuit; |
| § | A concentrator consisting of ore sorting, grinding, gravity, flotation, and
a paste backfill plant at the Mine Site Complex (“MSC”) in Wells; |
| § | Ancillary infrastructure at the MSC to support operations, such as offices,
a mine dry, and a water treatment plant; |
| § | Water and waste management infrastructure; |
| § | Capitalized General and Administrative (“G&A”) operating
costs attributable to the construction and underground development activities and workforce. |
| |
Osisko Development Corp.
NI 43-101 Technical Report
Feasibility Study for the Cariboo Gold Project |
|
Table 21-1: Project capital
cost summary (1)(2)
| Area |
Cost
Area Description |
Initial
Capital Cost
($M) |
Sustaining
Capital Cost
($M) |
Total
Cost
($M) |
| 000 |
Surface Mobile Equipment |
-- |
-- |
-- |
| 200 |
Underground Mine |
313 |
397 |
710 |
| 300 |
Water and Waste Management |
98 |
24 |
123 |
| 400 |
Electrical and Communication |
19 |
0 |
19 |
| 500 |
Surface Infrastructure |
42 |
1 |
43 |
| 600 |
Process Plant - Wells |
180 |
0 |
180 |
| 700 |
Construction Indirect Costs |
95 |
0 |
95 |
| 999 |
Contingency (16.5%) |
72 |
4 |
76 |
| |
Total |
819 |
426 |
1,246 |
| - |
Capitalized Revenue |
-150 |
0 |
-150 |
| - |
Capitalized Operating Costs |
212 |
0 |
212 |
| - |
Salvage Value |
0 |
-36 |
-36 |
| - |
Site Reclamation and Closure |
0 |
135 |
135 |
| |
Project Total |
881 |
525 |
1,406 |
| (1) | Does not include pre-final investment decision capital costs total $38.6M. |
| (2) | Totals may differ slightly due to rounding. |
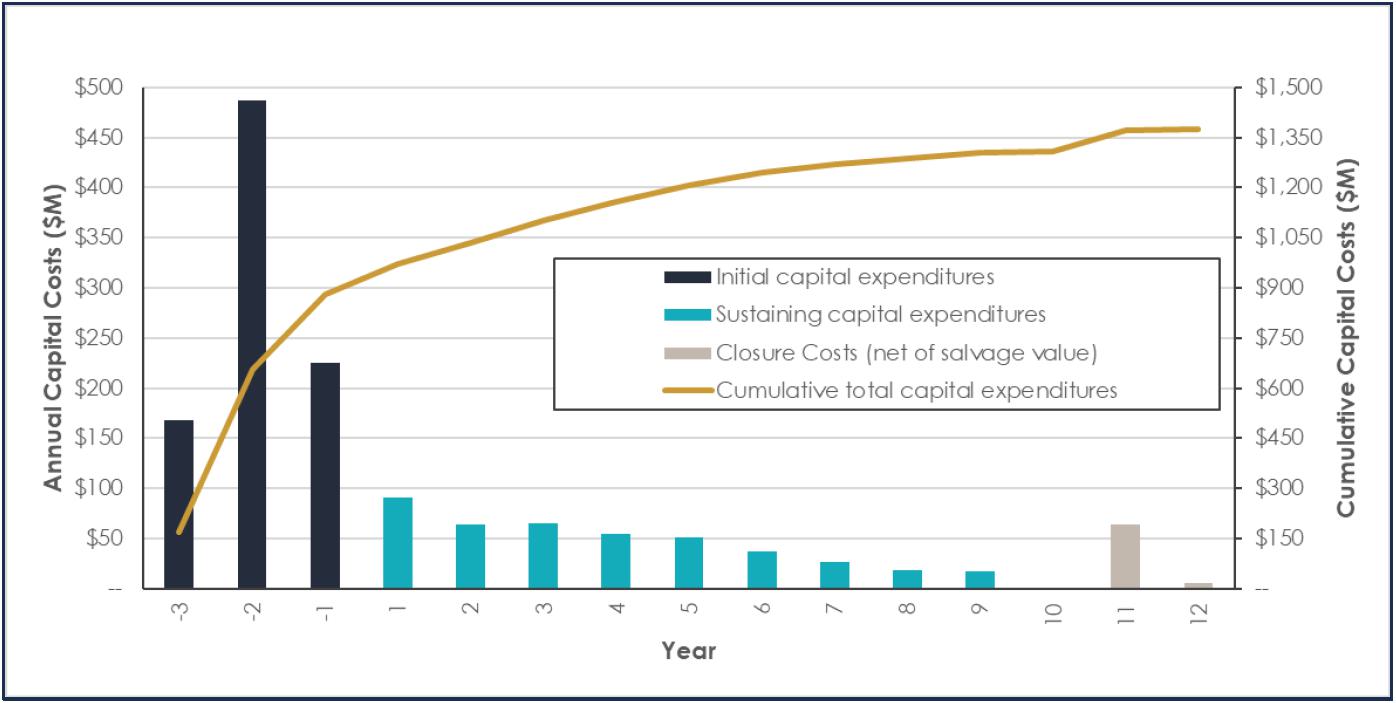
Figure 21-1: Overall Cariboo
Gold Project capital cost profile
| |
Osisko Development Corp.
NI 43-101 Technical Report
Feasibility Study for the Cariboo Gold Project |
|
| 21.1.2 | Scope and Structure of Capital Cost Estimate |
The capital cost estimate pertaining to this 2025
FS is meant to form the basis for an overall Project budget authorization and funding, and as such, it forms the “Control Estimate”
against which subsequent phases of the Project will be compared and monitored. The estimate generally meets American Association of Cost
Engineers (“AACE”) International Class 3 requirements and has an accuracy range of between -20% and +30%.
The capital cost estimate abides by the following
criteria:
| § | It is based on a measurable degree of engineering completion; |
| § | It reflects general accepted practices in the cost engineering profession; |
| § | It assumes that contracts will be awarded to reputable contractors on a cost
reimbursable basis; |
| § | Its labour costs are based on current British Columbia rates; |
| § | The capital costs are expressed in constant Q2 2025 Canadian dollars; |
| § | All costs in the financial cash flow in US dollars were converted to Canadian
using an exchange rate of 0.74 USD/CAD. |
The Project schedule, from detailed engineering
to start-up, was also used in the estimate preparation; refer to Chapter 24 for the execution plan and schedule. First ore will be achieved
after 24 months from start of construction, and full production reached after 34 months from the start of construction. The cost estimate
was divided into the following elements:
| § | Direct costs (Areas 200 to 600): Costs for productive works and permanent
infrastructure. It includes production infrastructure, services, and equipment required; |
| § | Construction Indirect costs (Area 700): Costs required to support the construction
of the facilities included in the direct costs. It includes engineering, procurement, and construction management (“EPCM”)
services, EPCM temporary facilities, capital spares, and services; |
| § | Capitalized operating costs (Area 980): Capital and operating costs incurred
prior to commercial production being declared; |
| § | Contingency (Area 999): Includes variations in quantities and differences
between estimated and actual equipment, material prices, labour costs, and site-specific conditions. In addition, it accounts for variations
resulting from uncertainties that are clarified during detailed engineering, when basic engineering designs and specifications are finalized. |
| |
Osisko Development Corp.
NI 43-101 Technical Report
Feasibility Study for the Cariboo Gold Project |
|
| 21.1.2.1 | Work Breakdown Structure (WBS) and Estimate Responsibilities |
The capital cost estimate was developed in accordance
with ODV’s work breakdown structure (“WBS”) with the estimate responsibilities summarized in Table 21-2.
Table 21-2: Estimate responsibilities
by WBS
| Area |
Cost
Area Description |
Responsible
Entity |
| 200 |
Underground Mine |
InnovExplo, WSP |
| 300 |
Waste and Water Management |
Integrated Sustainability, JDS |
| 400 |
Electrical and Communications |
BBA (for process plant) |
| 500 |
Surface Infrastructure |
JDS |
| 600 |
Process Plant |
BBA |
| 700 |
Construction Indirects |
JDS |
| 980 |
Capitalized Operating Costs |
BBA, InnovExplo |
| 999 |
Contingency |
ODV |
The following items were excluded from the capital
cost estimate:
| § | Licensing, land acquisition, and financing costs; |
| § | Project preparation costs incurred to date, including studies, work programs,
and early works; |
| § | Fluctuation of currency exchange rates; |
| § | Taxes, including carbon taxes, which are included in the financial model; |
| § | Changes to design criteria; |
| § | Hydrological, environmental, or hazardous waste issues; |
| |
Osisko Development Corp.
NI 43-101 Technical Report
Feasibility Study for the Cariboo Gold Project |
|
| 21.1.2.3 | Construction Labour |
Crew Rates
Installation labour rates are calculated on the
assumption of 84 hours worked per week on a single shift, with a rotation of two weeks in, one week out, per worker. The direct component
of the crew rate was benchmarked against budget quotations from multiple contractors covering all key trades. Composite crew wage rates
have been established for each commodity based on a craft mix comprised of foreman, journeymen, apprentices, and general labour across
all construction trades. The composite crew rates include the following costs:
| § | Craft base rates fringe benefits and overtime; |
| § | Mobilization and demobilization of contractor items; |
| § | Non-manual labour (general foreperson, superintendent, project manager, etc.); |
| § | Small tools and consumables; |
| § | Ownership and operational costs of construction equipment (excluding that
supplied by the Owner); |
| § | Health, safety, and environmental requirements; |
| § | Site supervision and administration; |
| § | Contractor temporary site facilities; |
Contractor variable and fixed fees, and overhead
and profit have been capped at a combined rate of 15% to reflect an open book construction strategy with potential contractors. Construction
equipment has been captured in the Construction Indirects noted below in Section 21.1.4.9. Fuel costs are excluded from the construction
equipment portion of the composite crew rates and were calculated separately in the indirect costs.
Construction Equipment is developed and assigned
by specific crew. Hourly equipment costs include the material portion (depreciation, interest, cost of repair and maintenance, insurances
permits, and taxes) and operating portion (lubricants and filters), excluding fuel. The cost of the operator is excluded from the hourly
operating cost and included in the crew mix.
The composite crew rates exclude camp accommodations
and camp catering for contractor manual and non-manual staff. These costs are captured separately in the capitalised operating costs.
Table 21-3 provides a summary of hourly “all-in” crew rates by typical crew type.
| |
Osisko Development Corp.
NI 43-101 Technical Report
Feasibility Study for the Cariboo Gold Project |
|
Table 21-3: Blended rates
per discipline
| Activity |
$/Hour |
| Civil Works |
94.67 |
| Concrete Works |
112.62 |
| Structural Steel |
112.24 |
| Architectural Finishes |
112.24 |
| Mechanical Works |
138.15 |
| Piping/Insulation |
138.15 |
| Electrical |
143.69 |
| Automation/Telecom |
143.69 |
Labour Hours and Productivity
Direct field labour is the skilled and unskilled
labour required to install the permanent plant equipment and bulk materials at the Project site. Unit installation hours are exclusive
of contractor non-manual labour (site supervisors, accountants, and clerks) and indirect manual labour, which are captured in the composite
crew rates.
Installation hours have been adjusted to take
into consideration the following:
| § | Scattered items of work; |
| § | Overcrowded/tight work areas; |
| § | Availability of skilled workers; |
| |
Osisko Development Corp.
NI 43-101 Technical Report
Feasibility Study for the Cariboo Gold Project |
|
Table 21-4: Labour productivity
loss ratio
| Activity |
Factor |
| Civil Works |
0.875 |
| Concrete Works |
0.875 |
| Structural Steel |
0.875 |
| Architectural Finishes |
0.875 |
| Mechanical Works |
0.875 |
| Piping/Insulation |
0.875 |
| Electrical |
0.875 |
| Automation/Telecom |
0.875 |
| 21.1.3 | Pre-final Investment Decision Capital Costs |
The Project capital cost estimate, as summarized
in Table 21-5, pre-final investment decision expenses, which total $38.6M. Those expenditures are defined as costs not yet incurred
but committed to and part of the Project budget prior to this FS being issued. These activities are ongoing and/or will be finalized for
construction.
| § | Engineering for the water treatment plant at Bonanza Ledge; |
| § | Construction costs of the water treatment plant upgrades at Bonanza Ledge; |
| § | Water management infrastructure required to support the operation of the
water treatment plant at Bonanza Ledge; |
| § | Storage of milling equipment for the Project; |
| § | Underground development as part of the Cow Bulk Sample; |
| § | Construction Indirects for the activities listed above (i.e., engineering,
procurement and other early Construction Indirects. |
| 21.1.4 | Initial Capital Costs |
The initial capital costs cover the activities
associated with the period preceding first ore. This includes the activities associated with construction and commissioning at both MSC
and Bonanza Ledge, and the start of underground development. A summary of the initial capital costs is shown in Table 21-5. Note
that the capitalized revenue and capitalized operating costs are not shown in Table 21-5.
| |
Osisko Development Corp.
NI 43-101 Technical Report
Feasibility Study for the Cariboo Gold Project |
|
Table 21-5: Project initial
capital cost summary
| Area |
Cost
Area Description |
Initial
Capital Cost ($M) |
%
of Initial Capital |
| 200 |
Underground Mine(2) |
313 |
38 |
| 300 |
Waste and Water Management |
98 |
12 |
| 400 |
Electrical and Communications |
19 |
2 |
| 500 |
Surface Infrastructure |
42 |
5 |
| 600 |
Process Plant - Wells |
180 |
22 |
| |
Subtotal – Direct Costs |
652 |
79 |
| 700 |
Construction Indirects(1) |
95 |
12 |
| |
Subtotal – Indirect Costs |
747 |
91 |
| 999 |
Contingency (P50) |
72 |
9 |
| |
Total |
819 |
100% |
| (1) | Surface mobile equipment included under construction indirect costs. |
| (2) | Underground Mine (Area 200) shown above is split between the Underground Mine (Area 200), Underground Materials Handling (Area 290),
and Paste Distribution Systems (Area 270) |
| 21.1.4.1 | Underground Mine (Area 200) |
The total initial capital cost for the underground
mine is $312.7M, of which $269.7M is for the underground mining costs listed in this section, as detailed in Table 21-6. The cost
estimates for underground backfill and material handling/processing were provided by WSP, while all other underground mining costs were
developed by InnovExplo.
Table 21-6: Underground
mine initial capital costs (Area 200)
| Cost
Area Description |
Total
Cost ($M) |
| U/G Mobile Equipment |
28.1 |
| U/G Infrastructure |
7.4 |
| U/G Ventilation |
22.8 |
| U/G Water Management |
7.3 |
| U/G Electrical |
17.6 |
| U/G Communication |
1.5 |
| U/G Development |
185.0 |
| Total |
269.7 |
| |
Osisko Development Corp.
NI 43-101 Technical Report
Feasibility Study for the Cariboo Gold Project |
|
| 21.1.4.2 | Underground Materials Handling (Area 290) |
Table 21-7: Underground
materials handling initial capital costs (Area 290)
| Cost
Area Description |
Total
Cost ($M) |
| U/G Backfill |
15.5 |
| U/G Material Handling/Processing |
27.5 |
| Total |
43 |
The underground ore circuit capital estimate contains
the following:
| § | Grizzly and Rockbreaker station to size the raw production; |
| § | Primary jaw crusher and secondary jaw crusher; |
| § | Conveyors to convey crushed ore to underground silos; |
| § | A loading station to the inclined conveyor to surface. |
The ore sorter waste material will be directed
underground and thereafter trucked to surface. The design system will have a:
| § | Waste silo from surface to underground; |
| § | Chute at the bottom of the silo to load trucks. |
The cost estimate for these infrastructures is
based on vendor quotes and similar Project estimates.
| 21.1.4.3 | Paste Distribution Systems (Area 270) |
The total capital cost for the underground paste
fill distribution include:
| § | All vertical bore holes from surface and underground interlevel; |
| § | Tow high-pressure booster stations underground; |
| § | All piping, couplings, valves, pipe supports and other miscellaneous items. |
The estimated cost for materials is based on budgetary
quote from suppliers. The estimate cost included the labour for the underground installation.
The estimated capital will be spread over the
life of mine.
| |
Osisko Development Corp.
NI 43-101 Technical Report
Feasibility Study for the Cariboo Gold Project |
|
| 21.1.4.4 | Waste and Water Infrastructure (Area 300) |
The total initial capital cost for waste and water
management infrastructure is $69.52M, as described in Table 21-8. All costs were provided by JDS with the exception of WSP providing
the cost for the effluent discharge diffuser into the Jack of Clubs Lake.
Table 21-8: Waste and water
infrastructure initial capital costs (Area 300)
| Cost
Area Description |
Total
Cost ($M) |
| Bonanza Ledge WRSF Phase 1 |
10.15 |
| Bonanza Ledge WRSF Phase 2 |
15.50 |
| Bonanza Ledge WRSF Phase 3 |
2.63 |
| Raw Water Wells |
0.70 |
| Potable WTP |
0.62 |
| MSC Sedimentation Pond |
5.01 |
| WRSF Sediment Control Pond |
6.59 |
| MSC Non-Contact Water Diversion |
0.91 |
| MSC Contact Water Diversion |
3.12 |
| Bonanza Ledge Water Pipelines |
3.00 |
| MSC Water Pipelines |
9.03 |
| Bonanza Ledge Non-Contact Water Diversion |
2.48 |
| Bonanza Ledge Contact Water Diversion |
1.37 |
| Bonanza Ledge Pit Cover System |
2.59 |
| MSC WTP Civil Prep Work |
2.05 |
| Effluent Discharge |
3.20 |
| Sewage Treatment Plant |
0.57 |
| Total |
69.52 |
| 21.1.4.5 | Water Treatment Plant (Area 300) |
Capital costs associated with the water treatment
infrastructure were developed by Integrated Sustainability for both the Bonanza Ledge and MSC locations. These estimates were prepared
using first-principles engineering methods and factored equipment costs. Values are expressed in Q1 2025 Canadian dollars and reflect
Class 4 cost accuracy, with an expected range of -22.2% to +37%.
| |
Osisko Development Corp.
NI 43-101 Technical Report
Feasibility Study for the Cariboo Gold Project |
|
The Bonanza Ledge WTP has not been included in
the capital cost as his construction is underway and part of the pre-final investment decision costs while the MSC WTP direct capital
cost total approximately $49.97M.
Table 21-9: Mine Site Complex
WTP – Capital cost estimate (Area 300)
| Cost
Area Description |
Total
Cost ($M) |
| Chemical Injection Systems (external to HDS) |
0.35 |
| HDS |
8.51 |
| Clarifier |
3.60 |
| MBBR |
2.86 |
| Oxidation System |
0.97 |
| Post-filtration |
4.50 |
| Solids Handling |
1.47 |
| Effluent System |
2.49 |
| Utilities |
0.09 |
| Electrical, Instrumentation and Controls |
9.57 |
| Piping, Piperacks, Supports |
4.60 |
| Site Preparation and Building |
9.59 |
| Equipment Freight |
1.36 |
| Total Capital Cost |
49.97 |
| 21.1.4.6 | Electrical and Communications (Area 400) |
The total electrical and communications initial
capital costs required within the process plant amounts to $19.11M. The process plant costs include the following items, which are also
summarized in Table 21-10:
| § | Electrical equipment required in the process plant paste backfill E-room; |
| § | G&A Information Systems; |
Note, for the power supply and distribution costs,
and explanation on their contribution to the overall financial cashflow, please see Section 21.2.4.
| |
Osisko Development Corp.
NI 43-101 Technical Report
Feasibility Study for the Cariboo Gold Project |
|
Table 21-10: Electrical
and communication initial capital costs (Area 400)
| Cost
Area Description |
Total
Cost ($M) |
| WAN Link (via HV powerline) |
0.13 |
| E-room |
9.69 |
| IT and Communications |
2.57 |
| IT Hardware |
3.10 |
| Network, Wireless and Telecom |
0.39 |
| Security Systems |
0.40 |
| G&A Information Systems |
1.72 |
| Television Systems |
0.17 |
| Communication Towers |
0.61 |
| Site Radio Systems |
0.33 |
| Total |
19.11 |
| 21.1.4.7 | Site Infrastructure (Area 500) |
The total initial capital cost for site infrastructure
is $42.2M, as described in Table 21-11. All costs were provided by JDS.
| |
Osisko Development Corp.
NI 43-101 Technical Report
Feasibility Study for the Cariboo Gold Project |
|
Table 21-11: Surface infrastructure
initial capital costs (Area 500)
| Cost
Area Description |
Total
Cost ($M) |
| MSC Surface Infrastructure |
10.22 |
| MSC Main Access Road |
6.33 |
| Haul Roads |
1.39 |
| Highway 26 Intersection Bridge |
3.08 |
| MSC Offices |
2.54 |
| Mine Dry |
4.20 |
| ERT Garage |
1.10 |
| Ballarat Camp |
10.35 |
| Lowhee Air Intake |
0.29 |
| Shaft Air Intake |
0.72 |
| Fuel Storage |
0.33 |
| Propane Storage |
0.33 |
| MSC General Site Preparation |
1.17 |
| Gate House |
0.22 |
| Total |
42.2 |
| 21.1.4.8 | Process Plant (Area 600) |
The process plant initial capital costs were estimated
by BBA, excluding site preparation costs ($10M in site preparation associate to JDS’ costs). The capital cost includes all unit
operations, ranging from underground conveying to the paste plant, the gravity concentrate gold room, and the flotation concentrate bagging
system. The 3D model, general arrangement drawings, and site layouts were used to estimate quantities and generate MTOs for all commodities.
Major mechanical and electrical equipment costs were estimated using budgetary proposals from 2024 and early 2025. Equipment of lower
monetary value were estimated based on BBA’s recent project data.
Table 21-12 summarizes the initial capital
costs for the process plant.
| |
Osisko Development Corp.
NI 43-101 Technical Report
Feasibility Study for the Cariboo Gold Project |
|
Table 21-12: Process plant
initial capital costs (Area 600)
| Cost
Area Description |
Total
Cost ($M) |
| Process Plant General |
72.91 |
| Ore sorting and Crushing |
21.89 |
| Grinding |
13.39 |
| Gravity Recovery |
3.41 |
| Flotation |
10.74 |
| Regrind |
6.55 |
| Concentrate Thickening and Filtration |
8.13 |
| Tailings Thickening |
4.62 |
| Paste Backfill |
15.58 |
| Gold Room |
1.12 |
| Reagents |
3.98 |
| Services |
8.00 |
| Total Area 600 (BBA)(1) |
170.32 |
| Site Preparation (JDS) |
10.22 |
| Total Area 600 |
180.27 |
| (1) | BBA’s process plant electrical and communications (Area 400) are shown under Section 21.1.4.6. JDS has one cost line item
under cost Area 600, which is the site preparation cost required for the process plant area. |
| 21.1.4.9 | Construction Indirect Costs (Area 700) |
The Construction Indirects (Area 700) includes
all the costs needed to conduct the engineering, procurement, and project and construction management services for the Project. Other
construction indirect costs were estimated based on the Project Execution Plan (Chapter 24), and include:
| § | Construction Temporary facilities (washrooms, lunchrooms, etc.); |
| § | Quality control and quality assurance, and commissioning support; |
| § | Shop inspections during the manufacturing of equipment; |
| § | Construction equipment rental for surface support (cranes, material handling,
personnel lifts, site service and road maintenance, heaters & light plants, light trucks, etc.); |
| |
Osisko Development Corp.
NI 43-101 Technical Report
Feasibility Study for the Cariboo Gold Project |
|
Table 21-13: Construction
indirect costs (Area 700)
| Scope |
Total
Cost ($M) |
| Construction Indirects |
9.25 |
| Site CM staff and Consultants |
31.80 |
| Engineering |
28.00 |
| Toilets / Ablution Units |
2.25 |
| Temporary Construction Office |
0.40 |
| Temporary Electrical Power |
3.13 |
| QA/QC / Commissioning |
2.08 |
| Vendor Reps |
0.75 |
| Inspections |
0.25 |
| Construction Equipment |
12.63 |
| Construction Tools |
2.14 |
| Capital Spares |
2.45 |
| Total |
95.12 |
| 21.1.4.10 | Capitalized Operating Costs (Area 980) |
Capitalized operating costs represent the operating
and capital expenditures necessary to achieve commercial production. As such, the following components are included in these costs:
| § | Mine development capitalized operating cost expenditures (“OPEX”); |
| § | Process plant capitalized OPEX; |
| § | Water and waste management capitalized OPEX; |
| § | Pre-staffing and training; |
| § | Hot-commissioning and ramp-up; |
| § | Electrical transmission line usage. |
The capitalized operating costs are estimated
to be $211.80M, as summarized in Table 21-14.
| |
Osisko Development Corp.
NI 43-101 Technical Report
Feasibility Study for the Cariboo Gold Project |
|
Table 21-14: Capitalized
initial capital costs (Area 980)
| Cost
Area Description |
Total
Cost ($M) |
| Mining |
99.81 |
| General & Administration |
62.49 |
| Waste & Water Management |
25.05 |
| Processing |
15.06 |
| Transmission Line |
9.40 |
| Total |
211.80 |
| 21.1.4.11 | Contingency (Area 999) |
Contingency is an allowance included in the initial
capital cost estimate that is expected to be spent to cover the known but undefined items within the scope of the estimate. These can
arise due to currently undefined items of work or equipment, or to uncertainty in the estimated quantities and unit prices for labour,
equipment, and materials. Contingency does not cover scope changes, project exclusions, or project risk reserve costs.
Contingency was calculated for the Project using
a Monte Carlo probabilistic approach based on execution philosophy, historic data, level of project definition, and advancement of engineering
as well as contributions from the various firms according to their scope of work. Mining capital costs were excluded from the contingency
calculation as these costs already include contingency.
ODV selected a contingency of $72M, which is the
P50 of the Monte Carlo simulation. This represents approximately 16.5% of the initial capital costs.
It is expected that sufficiently developed engineering,
adequate project management, and tight construction cost controls will be implemented to meet the budget for the Project.
| 21.1.5 | Sustaining Capital Cost |
Sustaining capital costs were estimated using
the same estimation basis as outlined for the initial and expansion direct costs. The sustaining capital is incurred to maintain a 4,900
tpd throughout of the Project. It consists mainly of underground mine development costs, waste and water management costs, and contingency.
The 16.5% contingency is only applied to the water and waste capital costs, as well as the infrastructure costs. The mine development
capital costs have their own contingency included. Total sustaining capital costs incurred over the approximate 10 years of production
are $426M of project-related capital expenditures, excluding end-of-mine site reclamation and closure costs. The sustaining capital costs,
including site closure, restoration, and net of salvage value is $525M. The breakdown of LOM sustaining capital expenditures by area is
provided in Table 21-15, while a detailed sustaining capital cost schedule is provided in Table 21-16.
| |
Osisko Development Corp.
NI 43-101 Technical Report
Feasibility Study for the Cariboo Gold Project |
|
Table 21-15: Project sustaining
capital cost summary
| Area |
Description |
Sustaining
Capital
Cost ($M) |
% |
| 200 |
Underground Mine |
396.88 |
76 |
| 300 |
Waste & Water Management |
24.38 |
5 |
| 400 |
Electrical & Communication |
- |
- |
| 500 |
Surface Infrastructure |
0.70 |
- |
| 600 |
Process Plant - Wells |
- |
- |
| 700 |
Construction Indirect Costs |
- |
- |
| 999 |
Contingency |
4.14 |
1 |
| |
Total |
426.10 |
81 |
| |
Site Reclamation and Closure |
134.81 |
26 |
| |
Salvage Value |
(35.98) |
(7) |
| |
Total – Forecast to Spend |
524.93 |
100 |
| |
Osisko Development Corp.
NI 43-101 Technical Report
Feasibility Study for the Cariboo Gold Project |
|
Table 21-16: Sustaining
capital costs by year summary ($M)
| Area |
Cost
Area Description |
1 |
2 |
3 |
4 |
5 |
6 |
7 |
8 |
9 |
10 |
11-44 |
Total |
% |
| 200 |
Underground Mine |
65.86 |
63.68 |
65.34 |
54.06 |
47.69 |
36.65 |
26.41 |
18.38 |
17.59 |
1.23 |
- |
396.89 |
76 |
| 300 |
Water and Waste Management |
21.75 |
- |
- |
- |
2.63 |
- |
- |
- |
- |
- |
- |
24.38 |
5 |
| 400 |
Electrical & Communications |
- |
- |
- |
- |
- |
- |
- |
- |
- |
- |
- |
- |
- |
| 500 |
Surface Infrastructure |
- |
0.57 |
0.13 |
- |
- |
- |
- |
- |
- |
- |
- |
0.70 |
0 |
| 600 |
Process Plant |
- |
- |
- |
- |
- |
- |
- |
- |
- |
- |
- |
- |
- |
| 700 |
Construction Indirect Costs |
- |
- |
- |
- |
- |
- |
- |
- |
- |
- |
- |
- |
- |
| 999 |
Contingency |
3.59 |
0.09 |
0.02 |
- |
0.43 |
- |
- |
- |
- |
- |
- |
4.13 |
1 |
| |
Subtotal |
91.19 |
64.34 |
65.49 |
54.06 |
50.75 |
36.65 |
26.41 |
18.38 |
17.59 |
1.23 |
0 |
426.10 |
81 |
| |
Site Reclamation and Closure |
- |
- |
- |
- |
- |
- |
- |
- |
- |
- |
134.81 |
134.81 |
26 |
| |
Salvage Value |
- |
- |
- |
- |
- |
- |
- |
- |
- |
- |
(35.98) |
(35.98) |
(7) |
| |
Total |
91.19 |
64.34 |
65.49 |
54.06 |
50.75 |
36.65 |
26.41 |
18.38 |
17.59 |
1.23 |
98.83 |
524.93 |
100 |
| |
Osisko Development Corp.
NI 43-101 Technical Report
Feasibility Study for the Cariboo Gold Project |
|
| 21.1.5.1 | Underground Mine (Area 200) |
A large portion of sustaining capital costs is
attributable to the underground mining operation. The sustaining capital costs related to the underground mine are estimated to be $396.9M.
Significant sustaining capital is required as mining progresses, which includes drifts, ventilation raises, ramp extension, underground
infrastructure, underground electrical and communications, underground material handling, paste backfill network, and mobile equipment.
The underground mining sustaining capital costs are summarized in Table 21-17. InnovExplo provided the estimates for all underground
mining sustaining capital costs, except for the underground material handling and paste network costs that were estimated by WSP.
Table 21-17: Underground
sustaining capital costs – Area 200
| Cost
Area Description |
Total
Cost ($M) |
| U/G Mobile Equipment |
155.5 |
| U/G Infrastructure |
5.4 |
| U/G Ventilation |
16.1 |
| U/G Water Management |
4.5 |
| U/G Electrical |
16.7 |
| U/G Communication |
1.8 |
| U/G Backfill |
16.3 |
| U/G Development |
180.6 |
| U/G Material Handling/Processing |
0.0 |
| Total |
396.9 |
| 21.1.5.2 | Underground Materials Handling (Area 290) |
No sustaining capital will be required for the
underground material handling system. The majority of the cost is related to wearing parts and maintaining the crushing and conveying
the infrastructure, which is included in the operating costs.
| 21.1.5.3 | Underground Backfill (Area 270) |
The estimate sustaining capital for the underground
backfill relates to the paste fill distribution network is associated to the mining progresses. The capital required will be the installation
of high-pressure booster pump, drill and equip paste fill boreholes and paste fill line extension to the initial infrastructure.
| |
Osisko Development Corp.
NI 43-101 Technical Report
Feasibility Study for the Cariboo Gold Project |
|
| 21.1.5.4 | Waste and Water Infrastructure (Area 300) |
Sustaining capital will be required for the Bonanza
Ledge WRSF, which is broken down into three phased installations. Phase one of the WRSF will occur during the construction phase. Phase
two expansion of the Bonanza Ledge WRSF will occur in Year 1, with phase three occurring in Year 5. Prior to decommissioning of the Bonanza
Ledge WTP, a pipeline will be installed to pump water from the Bonanza Ledge SCP to the newly constructed MSC WTP, which will be the sole
source for treating mine contact water on the property. Summarized capital costs are listed in Table 21-18.
Table 21-18: Waste and
water infrastructure sustaining capital costs – Area 300
| Cost
Area Description |
Total
Cost ($M) |
| Bonanza Ledge WRSF – phase two |
15.50 |
| Bonanza Ledge WRSF – phase three |
2.63 |
| Water Pipeline |
6.24 |
| Total |
24.38 |
| 21.1.5.5 | Surface Infrastructure (Area 500) |
Sustaining capital will be required for both the
Cow portal and Mosquito fresh air intakes. These will be constructed in Year 2 and Year 3 respectively. In the year leading up to the
Mosquito portal fresh air intake, construction of an access road will be required. Summarized capital costs are listed in Table 21-19.
Table 21-19: Surface infrastructure
sustaining capital costs
| Cost
Area Description |
Total
Cost ($M) |
| Mosquito Creek Access Road |
0.06 |
| Cow Portal Fresh Air Intake |
0.51 |
| Mosquito Portal Fresh Air Intake |
0.13 |
| Total |
0.70 |
| |
Osisko Development Corp.
NI 43-101 Technical Report
Feasibility Study for the Cariboo Gold Project |
|
| 21.1.5.6 | Contingency (Area 999) |
As for the initial capital cost estimate, a contingency
was calculated for the sustaining capital cost estimate. ODV selected a contingency of $4.14M, which represents approximately 1% of the
sustaining capital costs. Note that 16.5% contingency was applied to Areas 300 and 500 sustaining costs, but was not applied to the Area
200, as those items included their own contingency.
| 21.1.5.7 | Rehabilitation and Site Closure |
Total rehabilitation and closure costs over the
LOM amount to $134.81M. Most of the costs ($123M) occur over the 6 years following end of production, which include bulk site infrastructure
decommissioning, WRSF closure cover construction as well as reflooding of the underground and water treatment of any contact water unsafe
for release. The remaining costs spanning 30 years account for long term monitoring required by the permit. All cost included are in line
with the Project permits.
| 21.1.5.8 | Mining Salvage Value |
The salvage value associated with the mining component
consists of the residual value of the mining equipment fleet, excluding light vehicles. A residual value equivalent to 20% of the original
purchase price has been applied to the entire fleet, except for the two Roadheader mining units. Due to their relatively low utilization
over the course of the Project, a higher residual value of 65% has been assigned to these two units. The total estimated salvage value
for the mining equipment is $19.6M.
| 21.1.5.9 | Processing Salvage Value |
The salvage value of the processing plant’s
mechanical and electrical equipment is estimated based on the percentage of depreciation over each asset’s expected useful life.
For the plant’s structural components, the residual value is based on the weight of recoverable steel, assuming it is sold as scrap
metal. The total estimated salvage value for the process plant equipment and structures is $16.3M.
| |
Osisko Development Corp.
NI 43-101 Technical Report
Feasibility Study for the Cariboo Gold Project |
|
The average OPEX over the mine life is estimated
to be 110.7 per tonne (“$/t”) processed, or 1,014 per ounce (“$/oz”). Table 21-20 provides the breakdown
of the projected operating costs by phase and cost area for the Project.
Table 21-20: Operating
cost summary
| Area |
Cost
Area Description(1) |
LOM
Unit Cost
($/t processed) |
LOM
($M) |
Annual
Average Cost
($M/year) |
Average
LOM
($/oz) |
OPEX
(%) |
| 200 |
Underground Mining |
62.3 |
1,080 |
98 |
570 |
56 |
| 300 |
Water and Waste Management |
5.0 |
86 |
8 |
45 |
4 |
| 400 |
Electrical Transmission Line |
4.9 |
86 |
8 |
45 |
4 |
| 600 |
Processing |
23.2 |
403 |
37 |
213 |
21 |
| 800 |
General and Administration |
15.4 |
266 |
24 |
141 |
14 |
| |
Total |
110.7 |
1,921 |
175 |
1,014 |
100% |
| (1) | Underground mining, Water and Waste Management, Processing and G&A operating costs do not include
a portion of the expenditures that have been capitalized – refer to Section 21.1.4.10. |
| 21.2.2 | Basis of Operating Cost Estimate |
The operating cost estimate was based on Q2 2025
assumptions. The estimate targeted an accuracy of ±15%. All operating cost estimates are in CAD. Costs were generally itemized
in detail; however, some items of lesser significance are calculated estimates, or have been included as an allowance. Many items of the
operating cost estimate are based on budget quotations; allowances are based on in-house data, and salaries are based on ODV’s current &
projected salary chart.
The operating cost estimate is based on the mine
schedule indicative tonnage per time that was produced by ODV and InnovExplo for the FS and it is inclusive of site costs to the final
Project close-out, including the waste management facilities; see Chapter 16 for more details related to the mine plan.
| |
Osisko Development Corp.
NI 43-101 Technical Report
Feasibility Study for the Cariboo Gold Project |
|
| 21.2.2.1 | Assumptions and Exclusions |
The following items were assumed:
| § | Some existing equipment and materials will be reused; |
| § | The labour rate build-up will be based on the statutory laws governing benefits
to workers that were in effect at the time of the estimate; |
| § | No cost of commissioning assistance post C3 certificate issuance is included
in the operating cost estimate; |
| § | Freight estimates are based on vendor supplied freight quotations or in-house
data. Freight for reagents is included in the price of those commodities. Freight for steel consumables is included in the price of that
material. Freight for spare parts is calculated as a percentage of equipment cost expected to be used annually; |
| § | No contingency is assumed; |
| § | No cost escalation (or de-escalation) is assumed. |
The following items were specifically excluded
from the operating cost estimate, unless identified by the Owner’s team and included in the General Services:
| § | Cost of financing and interest; |
| § | Pre-start-up operations and maintenance training; |
| § | Transport, insurance, and refining of doré from the plant (deducted
from sales in calculating gross revenue). |
| 21.2.2.2 | Estimate Responsibilities |
The overall operating cost estimate combined inputs
from several sources, including InnovExplo, WSP, JDS, Integrated Sustainability and BBA as summarized in Table 21-21.
Table 21-21: Operating
cost estimate responsibilities
| Cost
Area Description |
Responsible
Entity |
| Mineralized Material Transport |
InnovExplo |
| Underground Mining |
InnovExplo |
| Underground Materials Handling and Paste Systems |
WSP |
| Water and Waste Management |
Okane, BBA |
| Electrical and Communication |
Clean Energy Consulting |
| Processing (MSC) |
BBA |
| General and Administration |
ODV |
| |
Osisko Development Corp.
NI 43-101 Technical Report
Feasibility Study for the Cariboo Gold Project |
|
| 21.2.2.3 | General Unit Rates |
The general unit rates used in the operating cost
estimate are summarized in Table 21-22. Propane, liquified natural gas and diesel unit prices do not consider the carbon tax, which
was calculated separately along with mining taxes and corporate income taxes (Chapter 22).
Table 21-22: General rate
and unit cost assumptions
| Parameter |
Unit |
Value |
| Average Daily LOM Tonnage |
tpd |
4,900 |
| Years of Operation |
year |
10 |
| LOM Total Ore Tonnes Mined |
Mt |
17,815 |
| LOM Average Gold Grade |
Au g/t |
3.62 |
| Lom Total Gold Recovered |
koz |
1,894 |
| BC Hydro Grid Power Unit Cost (MSC) |
$/kWh |
0.067 |
| Generator Power Unit Cost |
$/kWh |
0.32 |
| Propane Unit Cost |
$/litre |
0.65 |
| Diesel Unit Cost |
$/litre |
1.37 |
InnovExplo provided estimates for all underground
mine operating costs. The total underground mine operating cost is $1,080 M for the Project. The operating unit costs were calculated
over the total ore mined from development and from production, excluding the tonnages during pre-production. The unit cost is $62.3/t
mined. Mining operating costs are mostly composed of wages, electric power, consumables, fuel, and equipment maintenance. Equipment lease
payments have not been included in operating costs, as they have been included as sustaining capital expenditures. All stope access development
has been allocated to the operating cost. An average of 169 employees per rotation related to underground mining for operation and maintenance
are anticipated when full production will be achieved. Table 21-23 summarizes the underground operating costs for the Project and
provide a breakdown per item.
| |
Osisko Development Corp.
NI 43-101 Technical Report
Feasibility Study for the Cariboo Gold Project |
|
Table 21-23: Mining operating
cost
| Cost Area |
Average
Annual Cost |
LOM Cost |
Cost per
Tonne Mined |
OPEX |
| ($M) |
($M) |
($/t) |
(%) |
| Definition Drilling |
8.4 |
86.6 |
4.99 |
8% |
| Mine Development |
21.0 |
215.8 |
12.44 |
20% |
| Production - Stope Preparation |
3.2 |
33.1 |
1.91 |
3% |
| Production - Drilling and Blasting |
15.9 |
163.3 |
9.41 |
15% |
| Production - Mucking and Hauling |
22.5 |
231.1 |
13.32 |
21% |
| Production - Backfill |
3.1 |
32.2 |
1.85 |
3% |
| UG Services |
9.4 |
95.9 |
5.53 |
9% |
| Maintenance |
10.4 |
107.1 |
6.17 |
10% |
| Energy Cost |
7.3 |
75.3 |
4.34 |
7% |
| Material Handling |
3.9 |
39.7 |
2.29 |
4% |
| Total |
105.3 |
1,080.2 |
62.3 |
100% |
| 21.2.3.1 | Definition Drilling |
The costs associated with definition drilling
account for the diamond drilling activities required to enable final stope design prior to mining. These costs include:
| ■ | Contractor drilling costs, estimated at $140.00/m, based on drilling work
conducted during the 2024 bulk sample program; |
| ■ | Analytical costs, estimated at $10.00/m, assuming that 50% of drilled metres
are analyzed at a rate of $20.00/sample; |
| ■ | Labour costs for geological interpretation, estimated at $7.61/m; |
| ■ | Miscellaneous expenses, estimated at $5.00/m. |
This results in a total unit cost of $162.61/m.
The estimated drilling requirement was established
based on the drilling completed to date, the extent of the mineralized zones, and the spacing of the planned drill pattern. A total of
548,000 m of definition drilling is anticipated across the different zones.
The total cost for the definition drilling program
during the production period is estimated at $86.8M, which corresponds to $4.99 per tonne of processed material.
| |
Osisko Development Corp.
NI 43-101 Technical Report
Feasibility Study for the Cariboo Gold Project |
|
Development costs encompass all direct expenditures
related to labour, materials, and equipment maintenance required for the excavation of operational drifts, as well as the transport of
development-associated ore.
Material costs, including drilling accessories,
ground support, explosives, fuel, and related consumables, were based on budgetary quotations provided by suppliers. Labour cost estimates
were provided by ODV based on projected staffing requirements. Overall unit cost per metres of development was estimated at $2,194 for
OPEX excavations.
A total of 94.3 km of operational drifts is planned
for excavation, resulting in a total development cost of $215.8M, which includes $8.8M allocated for ore transport. This corresponds to
a unit cost of $12.44/t mined.
| 21.2.3.3 | Production - Stope Preparation |
Stope preparation costs include expenditures related
to the installation of secondary ground support ($0.87/t), such as cable bolts and shotcrete, rehabilitation of mineralized drifts ($0.93/t),
and an allowance for probe drilling ($0.11/t).
| 21.2.3.4 | Production - Drilling and Blasting |
Drilling and blasting costs include labour, equipment,
and materials required for production drilling, slot raise (opening raise) drilling and charging operations. Unit costs for drilling consumables,
explosives, and detonators are based on budgetary quotations provided by suppliers.
A 30-inch opening raise is planned for each stope.
Drilling estimates were developed based on a typical drill pattern aligned with the stope geometry and design parameters. Explosives costs
include the use of emulsion, packaged explosives (sticks), and electronic detonators.
The average unit costs across all zones are as
follows: $3.79/t for production drilling, $3.47/t for blasting, and $3.42/t for slot raise, resulting in a total unit cost of $10.68/t
of production. For the Project, the total cost associated with drilling and blasting activities is estimated at $163.3M, corresponding
to a unit cost of $9.41/t mined.
| |
Osisko Development Corp.
NI 43-101 Technical Report
Feasibility Study for the Cariboo Gold Project |
|
| 21.2.3.5 | Production - Mucking and Hauling |
The costs associated with the “Mucking and
Hauling” cost centre include mucking operations, truck haulage of broken material, trucking between the Shaft Zone silos and the
primary crusher feed point, as well as the transport of waste material from the ore sorter from the loading point to the surface waste
stockpile.
The estimated unit costs incorporate labour, fuel,
and maintenance expenses. For mucking operations, costs also include ore sample analysis. Mucking costs were assessed based on haul distances
by zone, considering the mucking method used, manual or automated (with one operator for every two LHD units).
For haulage, the number of truck units required
over time was estimated through simulations of travel distances associated with various tasks outlined in the mine plan.
Overall, the unit cost for mucking activities
is estimated at $4.45/t, while unit costs for all truck haulage activities total $8.87/t mined, resulting in a combined unit cost of $13.32/t.
The total cost attributed to this cost centre amounts to $231.1M.
| 21.2.3.6 | Production – Backfill |
The "Production – Backfill" cost
centre includes labour, equipment, and material costs, where applicable, for waste rockfill operations, as well as the installation, dismantling,
and relocation of the paste backfill distribution system.
The backfilling activities are supported by one
crew of two workers on a rotating day/night shift, and an additional crew of two workers on the day shift.
Additional costs have been included for the construction
of paste barricades, as well as for supplemental drilling required to implement the two-pass backfilling method (Doyon Method).
The unit cost for rock backfill has been estimated
at $4.00/t, while the unit cost for paste backfill-related activities is estimated at $2.00/t of paste fill. In total, backfilling activities
are projected to cost $32.2M, resulting in a blended unit cost of $1.85/t mined.
The “Underground Services” cost centre
encompasses support activities essential to underground operations, including material supply, levelling, general labour (handyman duties),
and operational supervision.
| |
Osisko Development Corp.
NI 43-101 Technical Report
Feasibility Study for the Cariboo Gold Project |
|
The estimated costs include labour, maintenance
of service equipment, and consumables required for these activities. A total of 19 personnel per rotation has been allocated to ensure
consistent underground support.
The total estimated cost for this cost centre
is $95.9M, representing a unit cost of $5.53/t mined.
The “Maintenance” cost centre includes
hourly labour (mechanics, electricians, etc.) responsible for maintaining fixed equipment, as well as staff personnel such as supervisors,
planners, reliability technicians, and instrumentation technicians.
It also covers maintenance costs for service equipment,
along with annual maintenance costs for underground infrastructure, including the maintenance shop, dewatering systems, ventilation network,
and communication systems.
A total of 22 personnel per rotation has been
allocated to ensure the delivery of maintenance services.
The total estimated cost for this cost centre
is $107.1M, representing a unit cost of $6.17/t mined.
The “Energy Cost” centre includes
all energy-related expenses for the Project. This encompasses propane consumption for heating the underground ventilation air using burner
systems, as well as electricity consumption by fixed infrastructure (such as pumping systems, ventilation network, lighting, etc.)
and mobile equipment (including production drills, Jumbo drills, bolters, roadheaders, and others).
Energy consumption estimates were based on the
power requirements per unit, aligned with the mine plan and operational schedule.
A total of 53.6M litres of propane is projected
to be consumed over the production period, at a unit cost of $0.65/L Electricity usage is estimated at 604,000 MWh, at a unit cost of
$0.067/kWh.
In total, the estimated cost for the Energy Cost
centre is $75.3M, corresponding to a unit cost of $4.34/t mined.
| |
Osisko Development Corp.
NI 43-101 Technical Report
Feasibility Study for the Cariboo Gold Project |
|
| 21.2.3.10 | Material Handling & Crushing |
Material Handling and Crushing cost are made up
of the following major costs on an average annual basis (Table 21-24).
Table 21-24: Material handling
and crushing operating cost
| Cost
Area |
Average
Annual Cost |
Cost
per Tonne Mined |
| ($M) |
($/t) |
| Energy |
0.3 |
0.18 |
| Maintenance |
0.3 |
0.17 |
| Mobile Equipment |
0.5 |
0.27 |
| Labour |
2.8 |
1.54 |
| Consultant/Contractor Support |
0.1 |
0.05 |
| Total |
3.9 |
2.21 |
| 21.2.4 | Electrical and Communications |
The capital costs for the substation, substation
electrical and transmission line systems were estimated by Clean Energy Consulting. Power supply and distribution, as well as Information
Technology (“IT”) and communication comprise the main costs. The estimates were based on recent projects of similar size,
power rating and layout as well as on pricing from suppliers for major electrical equipment. The capital costs were used to form the basis
of the third-party agreement to own and operate the line, and ODV will be charged an annual fee (representing the operating cost in the
paragraphs below).
| |
Osisko Development Corp.
NI 43-101 Technical Report
Feasibility Study for the Cariboo Gold Project |
|
Table 21-25: Electrical
costs
| Description |
Total
Cost ($M) |
| 69 kV Power Line – Mobilization, Clearing, Access Roads and Surveying |
9.96 |
| 69 kV Power Line – Supply and Installation incl. Post Construction Services |
24.00 |
| 69 kV Power Line – Safety and Environmental |
3.15 |
| Site Substation, Wells – Electrical Equipment |
6.10 |
| Site Substation, Wells – Civil and Structures |
2.21 |
| Site Substation, Wells – Engineering and Commissioning |
0.53 |
| Main Site Electrical Room - Equipment |
7.01 |
| Main Site Electrical Room – Civil and Commissioning |
0.62 |
| Emergency Power |
0.20 |
| Total |
53.78 |
A contingency of 15% has been added to the costs,
giving a total of $61.85M.
The power line costs have been included as an
operating cost under a separate infrastructure agreement, whereby the power infrastructure is built and operated by an independent third
party, which charges the Project an annual usage fee. An annual operating cost of $9.4M has been allocated over a 10-year repayment period
following electrification of the line, after which the third party is expected to charge a reduced rate of $1M per year for the remainder
of the operating life of the Project. In the event of any potential future mine life extension beyond the 10 years envisioned in this
FS, the reduced annual rate usage fee would remain applicable.
The average processing operating costs for processing
were calculated over the LOM. The operating cost was estimated to be $23.16/t mined. The steady-state operating costs for the mill and
paste plant includes reagents, maintenance parts and material, major equipment consumables, grinding media, personnel and contractors,
utilities (i.e. electricity and propane), and other miscellaneous fees such as mobile equipment and laboratory costs. A breakdown of the
steady-state processing operating costs, without contingency, is presented in Table 21-26.
| |
Osisko Development Corp.
NI 43-101 Technical Report
Feasibility Study for the Cariboo Gold Project |
|
Table 21-26: Mill operating
costs
| Cost
Area |
Average
Annual Cost |
LOM
Cost |
Cost
per
Tonne Mined |
OPEX |
| ($M) |
($M) |
($/t) |
(%) |
| Reagents |
1.4 |
15.6 |
0.89 |
3.9% |
| Maintenance, Parts, and Materials |
3.2 |
35.3 |
2.03 |
8.8% |
| Major equipment Consumables |
1.0 |
10.6 |
0.61 |
2.6% |
| Grinding Media |
1.0 |
11.1 |
0.64 |
2.8% |
| Personnel and Contractors |
10.1 |
110.7 |
6.36 |
27.5% |
| Utilities |
4.5 |
49.1 |
2.82 |
12.2% |
| Miscellaneous |
0.3 |
2.9 |
0.17 |
0.7% |
| Total Processing Plant |
21.4 |
235.3 |
13.53 |
58.4% |
| Paste Plant |
15.2 |
167.5 |
9.63 |
41.6% |
| Total |
36.6 |
402.8 |
23.16 |
100% |
| 21.2.5.1 | Reagents and Cement |
Reagent and cement consumptions are reported in
Chapter 17. Budget quotes were obtained from suppliers in 2024. A factor was added to the budgetary prices to cover transportation expenses.
A summary of the average annual reagent and cement costs is presented in Table 21-27. The average annual cost of reagents and cement
is calculated to be $15.4M ($1.4M for reagents, and $14.0M for cement), or $9.77/t mined ($0.89/t mined for reagents, and $8.88/t mined
for cement), which represents 42.2% of the processing operating costs (3.9% for reagents, and 38.3% for cement).
| |
Osisko Development Corp.
NI 43-101 Technical Report
Feasibility Study for the Cariboo Gold Project |
|
Table 21-27: Reagents and
cement costs
| Cost
Area |
Average
Annual Cost |
LOM
Cost |
Cost
per
Tonne Mined |
OPEX |
| ($M) |
($M) |
($/t) |
(%) |
| PAX |
0.2 |
2.1 |
0.12 |
0.5% |
| MIBC |
0.9 |
10.2 |
0.59 |
2.5% |
| Polyfloat 7040 |
0.2 |
1.9 |
0.11 |
0.5% |
| Flocculant |
0.1 |
1.3 |
0.07 |
0.3% |
| Refinery Reagents |
0.002 |
0.02 |
0.001 |
0.005% |
| Total Reagents |
1.4 |
15.6 |
0.89 |
3.9% |
| Cement (Paste Plant) |
14.0 |
154.4 |
8.88 |
38.3% |
| Total |
15.4 |
169.9 |
9.77 |
42.2% |
| 21.2.5.2 | Personnel and Contractors |
A total of 88 workers are required for processing,
which includes 16 salaried staff and 72 hourly workers divided amongst management and technical services, operations, and maintenance
departments. The list of personnel, along with the salaries and benefits, including bonuses where applicable, associated with each position
was provided by ODV. The contractor and consultant costs for processing include items such as special projects and research and development
(“R&D”), which were added to the operation and maintenance personnel cost. The labour and contractor cost is estimated
at an average of $10.1M per year or $6.36/t mined, which represents 27.5% of the processing operating costs.
| 21.2.5.3 | Maintenance Materials and Consumables |
Maintenance materials and consumables for the
process plant were estimated based on the equipment capital cost per area and supplier data. Allowances were added for general materials,
miscellaneous mechanical, piping, electrical, and instrumentation materials. The total cost for these items was estimated to average $4.2M
per year or $2.64/t mined, which represents 11.4% of the processing operating costs.
The Project process flowsheet requires two different
types of steel media: balls for the ball mill and the for the regrind mill. The consumption rates for the media were calculated based
on similar operations, whereas budgetary quotations were obtained for each type of media used. The average annual cost of media was estimated
to be $1.0M or $0.64/t mined, which represents 2.8% of the processing operating costs.
| |
Osisko Development Corp.
NI 43-101 Technical Report
Feasibility Study for the Cariboo Gold Project |
|
An estimate of the electrical energy consumption
was reported in Chapter 17, and it is based on the load list. The cost of electricity was calculated based on BC Hydro average cost of
6.7 cents per kilowatt hour (“¢/kWh”). Propane consumption for heating was calculated using estimated monthly heating
energy requirements derived from historical weather data. The energy costs represent approximately 12.2% of the total process operating
costs, at an average yearly cost of $4.5M or $2.82/t mined.
| 21.2.5.6 | Plant Mobile Equipment and Laboratory Fees |
Mobile equipment will be required at the site
for operations and maintenance. The average of yearly laboratory fees is estimated at $243,800, and at $18,600 for mobile equipment. The
samples collected include slurries from various stages of the flowsheet or the metallurgical laboratory, both high- and low-grade solution
samples, bullion, and slag. The mobile equipment and laboratory costs represent approximately 0.7% of the total process operating costs,
at an average yearly cost of $262,400 or $0.17/t mined.
Annual operating costs for the WTPs at Bonanza
Ledge and the MSC were estimated by Integrated Sustainability using a first-principles approach. These values reflect Q1 2025 Canadian
dollars and exclude contingency, escalation, and Owner’s indirect costs.
The estimates consider full design throughput,
year-round operation, and include chemical consumption, labour, utilities, maintenance, and insurance. Unit pricing was developed from
vendor quotes, industry benchmarks, and internal cost libraries.
The Bonanza Ledge WTP is expected to operate during
the early development period (Stage 1), while the MSC WTP will commence in Stage 2 and remain active through operations and into closure.
Costs have been normalized to annual values for consistency with other operating areas in this chapter.
| |
Osisko Development Corp.
NI 43-101 Technical Report
Feasibility Study for the Cariboo Gold Project |
|
Table 21-28: Bonanza Ledge
WTP – Annual operating cost summary
| Cost
Category |
Annual
Cost ($M) |
%
of Total |
| Chemical Consumption |
1.53 |
30% |
| Operating Labour |
1.71 |
33% |
| Utilities |
0.06 |
1% |
| Maintenance & Rentals |
1.69 |
33% |
| Insurance & Other |
0.15 |
3% |
| Total |
5.14 |
100 |
Table 21-29: MSC WTP –
Annual operating cost summary
| Cost
Category |
Annual
Cost ($M) |
%
of Total |
| Chemical Consumption |
1.85 |
29% |
| Operating Labour |
1.02 |
16% |
| Utilities |
0.43 |
7% |
| Maintenance |
2.21 |
35% |
| Insurance & Other |
0.83 |
13% |
| Total |
6.35 |
100 |
| 21.2.7 | Waste & Water Management |
The remainder of the Waste & Water Management
operating costs include the following, as shown in below:
| § | Labour to monitor and maintain water management on site; |
| § | Equipment and maintenance required to ensure placement and rehandling of
the waste on the WRSF once deposited from the underground operation; |
| § | Consumables required for maintenance of pumps, pipelines and lining; |
| § | Contracting services required for Air, Noise and construction monitoring. |
| |
Osisko Development Corp.
NI 43-101 Technical Report
Feasibility Study for the Cariboo Gold Project |
|
Table 21-30: Waste and
water management operating cost
| Cost
Category |
Annual
Cost
($M) |
LOM
Total
($M) |
| Labour |
0.93 |
11.0 |
| Equipment & Maintenance |
0.38 |
4.79 |
| Fuel |
0.16 |
2.03 |
| Consumables |
0.31 |
4.57 |
| Contractor Support |
0.51 |
6.27 |
| Total |
2.28 |
28.67 |
| 21.2.8 | General and Administration |
G&A costs are expenses not directly related
to the production of goods and encompass items not included in the mining, processing, water and waste management, refining, and transportation
costs of the Project. These costs were developed based on ODV and BBA’s past project experience, and on that of similar sized operations.
The G&A cost area includes the following items:
| ■ | Site administration and management labour; |
| ■ | Camp and administration buildings electricity and heating, both at the mine
site and in the nearest town of Quesnel; |
| ■ | Human resources and community support: |
| - | Community and Impact Benefit Agreement (“IBA”) commitments; |
| - | Sponsorships and association fees. |
| - | Communication service fees; |
| - | IT equipment and supplies. |
| |
Osisko Development Corp.
NI 43-101 Technical Report
Feasibility Study for the Cariboo Gold Project |
|
| - | Personal protective equipment and first aid supplies and industrial hygiene supplies; |
| - | Mine rescue team training. |
| - | Equipment and software licenses; |
| - | Specialized consultants. |
| - | Roads and building maintenance; |
| - | Waste and sewage collection and disposal services; |
| - | Mobile equipment, operations and maintenance. |
| - | Management and maintenance; |
| ■ | Employee land transport; |
| ■ | Closure liability (bonding); |
A portion of G&A operating costs ($62M) attributable
to the construction and underground development workforce was capitalized and included within sustaining capital cost estimates.
The overall G&A services labour will total
approximately 84 employees at its peak. The peak headcount will include nine mine administration employees, four finance employees, two
IT employees, nine site services employees, four human resources employees, 10 health and safety employees, and 46 technical services
employees (surveying, mining engineering, and geology).
In general, the management and administrative
staff will work on a 5/2 basis, mostly based out of the Quesnel office, while much of the technical services, and health and safety staff
will work 14/14 rotations at the mine site
| |
Osisko Development Corp.
NI 43-101 Technical Report
Feasibility Study for the Cariboo Gold Project |
|
On an annual basis and net of G&A costs transferred
to capital expenditures, the G&A operating costs are estimated to be $23M/year or approximately $329M over the LOM (prior to capitalization).
The average G&A operating cost on a per tonne mined basis is $15.4/t. The operating costs within the G&A category are shown by
activity in Table 21-31. The greatest cost within the G&A category is the administrative costs due to the closure bonding and
permitting contributing a large portion at 38%, followed by Transportation, camp and food services, representing 23%.
Table 21-31: General and
administrative costs by activity
| Item |
Total
Cost |
Average
Annual Cost |
Cost
per Tonne
Mined |
Percentage
of Total(1) |
| ($M) |
($M/year) |
($/t) |
(%) |
| Administration |
125.2 |
8.9 |
7.03 |
38 |
| Human Resources, Finance, IT and Community Support |
11.5 |
0.8 |
0.64 |
3 |
| Health and Safety |
16.2 |
1.2 |
0.91 |
5 |
| Technical Services |
58.9 |
4.2 |
3.31 |
18 |
| Site Surface Services |
36.3 |
2.6 |
2.04 |
11 |
| Transportation, Camp and Food Services |
75.4 |
5.4 |
4.23 |
23 |
| Security Services |
5.5 |
0.4 |
0.31 |
2 |
| Subtotal |
328.9 |
23.5 |
18.46 |
100 |
| Transfer to Capital Expenditures |
(62.5) |
|
(3.60) |
|
| Total |
266.5 |
|
15.4 |
|
| (1) | Percent distribution taken on total amount before capitalization of initial years. |
| 21.3 | Site Personnel Summary –
All Areas |
It is anticipated that 340 employees (staff and
labour) will be required on site at the peak of construction, See Figure 21-2. A summary of labour in all areas is shown in Table 21-32.
| |
Osisko Development Corp.
NI 43-101 Technical Report
Feasibility Study for the Cariboo Gold Project |
|
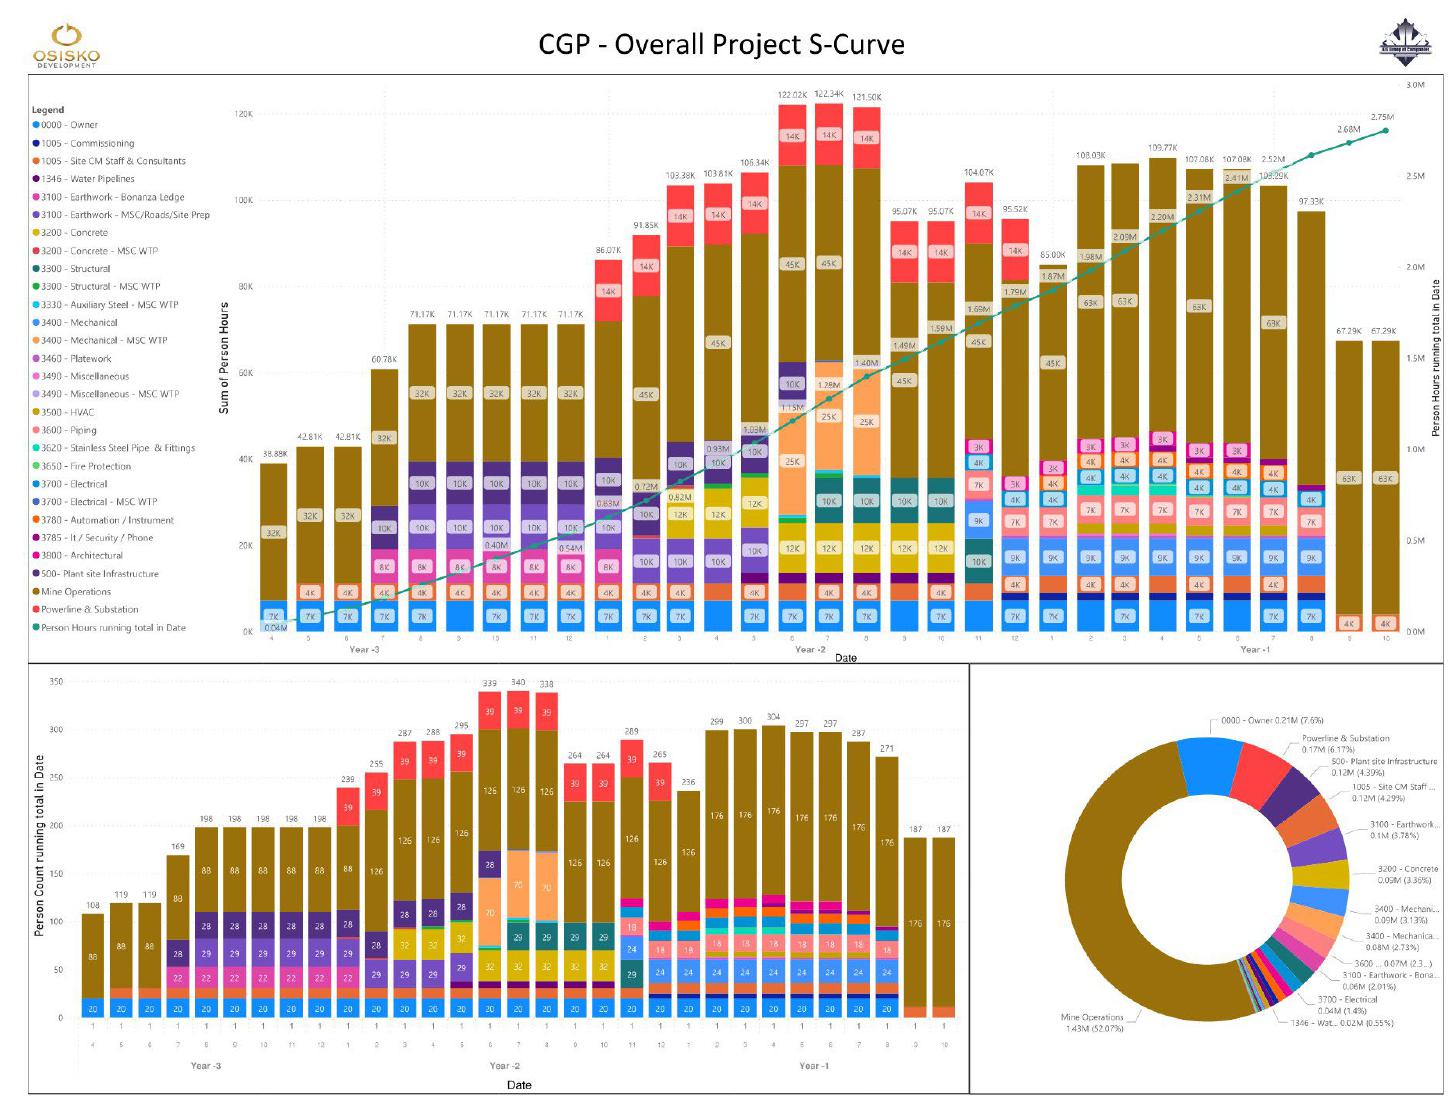
Figure 21-2: Overall construction
Project labour S-Curve
| |
Osisko Development Corp.
NI 43-101 Technical Report
Feasibility Study for the Cariboo Gold Project |
|
Table 21-32: Peak labour
by discipline for Construction and LOM
| Area |
Activity |
Construction |
LOM |
| General and Administration |
Mine Administration |
13 |
15 |
| Human Resources |
4 |
4 |
| Health and Safety |
9 |
10 |
| Technical Services |
36 |
46 |
| Site and Camp Services |
35 |
37 |
| Subtotal |
97 |
112 |
| Underground Mine |
Staff and supervision |
16 |
16 |
| Operations |
193 |
200 |
| Maintenance and services |
74 |
94 |
| Subtotal |
283 |
310 |
| Process Plant |
Staff and Supervision |
9 |
16 |
| Operations |
20 |
40 |
| Maintenance and Services |
16 |
32 |
| Subtotal |
45 |
88 |
| Water and Waste Management |
Operations |
15 |
15 |
| Subtotal |
15 |
15 |
| Construction |
Construction staff |
129 |
0 |
| Total |
|
613 |
525 |
| |
Osisko Development Corp.
NI 43-101 Technical Report
Feasibility Study for the Cariboo Gold Project |
|
The economic assessment of the Cariboo Gold Project
for Osisko Development Corp. was carried out using a discounted cash flow approach on a pre-tax and after-tax basis, based on consensus
equity research on long-term commodity price projections in United States dollars and cost estimates in the currency in which they are
incurred. An exchange rate of USD 0.74 per CAD 1.00 was assumed to convert USD projections and particular components of the capital cost
estimates into CAD. No provision was made for the effects of inflation. Current Canadian tax regulations were applied to assess the corporate
tax liabilities, while the most recent provincial regulations were applied to assess the British Columbia mining and carbon tax liabilities.
The IRR on total investment was calculated based
on 100% equity financing, even though ODV may decide in the future to finance part of the Project with debt financing. The NPV was calculated
from the cash flow generated by the Project, using a discount rate of 5%. The simple payback period and the payback period after the start
of operations are based on the undiscounted annual cash flow of the Project and they are also indicated as a financial measure. Furthermore,
a sensitivity analysis has been performed for the after-tax base case to assess the impact of variations in the Project capital costs,
USD:CAD exchange rate, price of gold, and operating costs.
The economic analysis presented in this chapter
contains forward-looking information with regards to the commodity prices, exchange rates, proposed mine production plan, projected metal
recoveries, operating costs, construction costs, and the Project schedule. The results of the economic analysis are subject to a number
of known and unknown risks, uncertainties, and other factors that may cause actual results to differ materially from those presented here.
Osisko Gold Royalties retains a 5.0% net smelter
return royalty on the Project.
| 22.2 | Assumptions and Basis |
The economic analysis was performed using the
following assumptions and basis:
| ■ | The Project Execution Schedule developed in Chapter 24, taking into consideration
key Project milestones; |
| ■ | Commercial production is scheduled to be achieved 30 months after the start
of construction, with first ore achieved 24 months after the start of construction. Operations are estimated to span a period of approximately
10 years; |
| ■ | The base case gold price is USD 2,400/oz; |
| |
Osisko Development Corp.
NI 43-101 Technical Report
Feasibility Study for the Cariboo Gold Project |
|
| ■ | The long-term price of gold was estimated on the basis of discussions with
experts, consensus analyst estimates, and recently-published economic studies. The forecasts used are meant to reflect the average metal
price expectation over the life of the Project. No price inflation or escalation factors were taken into account. It is understood that
commodity prices can be volatile and that there is the potential for deviation from the LOM forecasts; |
| ■ | The United States to Canadian dollar exchange rate has been assumed to be
USD 0.74: CAD 1.00 over the life of mine (CAD:USD exchange rate of 1.35); |
| ■ | All cost estimates are in constant Q2 2025 Canadian dollars with no inflation
or escalation factors taken into account; |
| ■ | All metal products are assumed to be sold in the same year that they are
produced; |
| ■ | Class specific Capital Cost Allowance rates are used for the purpose
of determining the allowable taxable income; |
| ■ | Final rehabilitation and closure costs are set to begin being incurred in
Year 11; |
| ■ | An overall salvage value of $36.0M based on the estimated residual values
of mobile equipment, processing equipment, and electrical equipment was considered; |
| ■ | Project revenue is derived from the sale of gold doré and gold flotation
concentrate into the international marketplace. No contractual arrangements for doré exist at this time (see Section 19.5).
ODV has a preliminary offer in place to purchase the gold concentrate. This financial analysis was performed on both a pre-tax basis and
after-tax basis. The general assumptions used for this financial model, LOM plan tonnage, and grade estimates are summarized in Table 22-1. |
Table 22-1: Financial model
parameters
| Description |
Unit |
Value |
| Long Term Gold Price |
USD/oz |
2,400 |
| Exchange Rate |
USD:CAD |
0.74 |
| Discount Rate |
% |
5.0 |
| Mine Life |
year |
10 |
| Total Ore Mined |
Mt |
17.8 |
| Average Gold Grade |
g/t |
3.62 |
| Overall Gold Metallurgical Recovery |
% |
92.6 |
| Gold Recovered in Doré |
koz |
884.0 |
| Gold Recovered in Flotation Concentrate |
koz |
1,033.5 |
| Flotation Concentrate Produced |
kt |
240.8 |
| Underground Mining Operating Cost |
$/t |
62.25 |
| |
Osisko Development Corp.
NI 43-101 Technical Report
Feasibility Study for the Cariboo Gold Project |
|
| Description |
Unit |
Value |
| Processing Operating Cost |
$/t |
23.21 |
| Waste and Water Management Operating Cost |
$/t |
4.97 |
| Electrical Transmission Line Operating Cost |
$/t |
4.93 |
| General and Administrative Operating Cost |
$/t |
15.36 |
| Total Operating Cost |
$/t |
110.73 |
| Royalties |
% NSR |
5.0 |
| Initial Capital Cost |
$M |
880.8 |
| Sustaining Capital Cost |
$M |
426.1 |
| Reclamation Cost |
$M |
134.8 |
| Salvage Value |
$M |
-36.0 |
Over the life of the mine, a total of 1.92 million
ounces (“Moz”) of gold will be recovered. Figure 22-1 provides the annual and cumulative production profile.
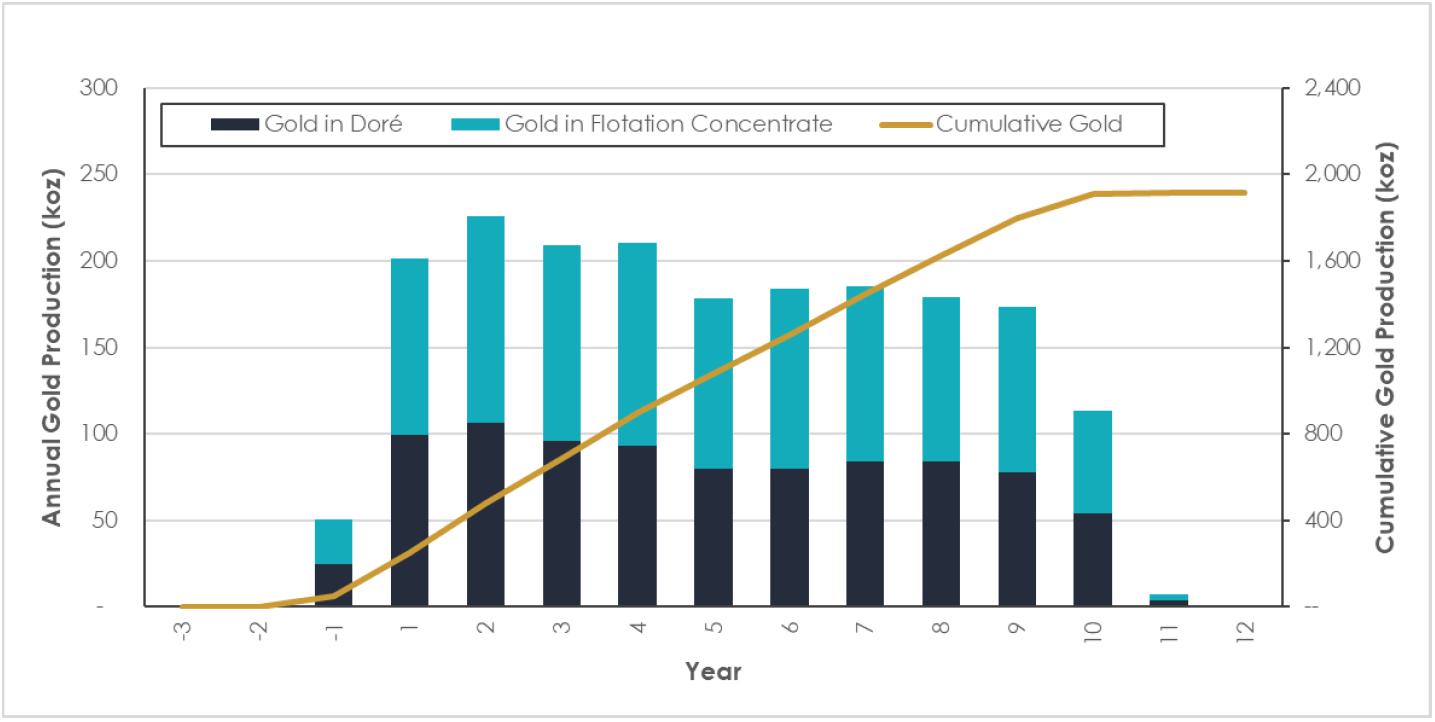
Figure 22-1: Annual and
cumulative gold production
| |
Osisko Development Corp.
NI 43-101 Technical Report
Feasibility Study for the Cariboo Gold Project |
|
All capital costs (pre-production, sustaining,
reclamation, and closure) for the Project have been distributed against the Project schedule to support the economic cash flow model.
Figure 22-2 presents the planned annual and cumulative LOM capital cost profile, excluding sunk costs and pre-permit expenses totalling
$38.6M. Closure costs are presented net of salvage value.
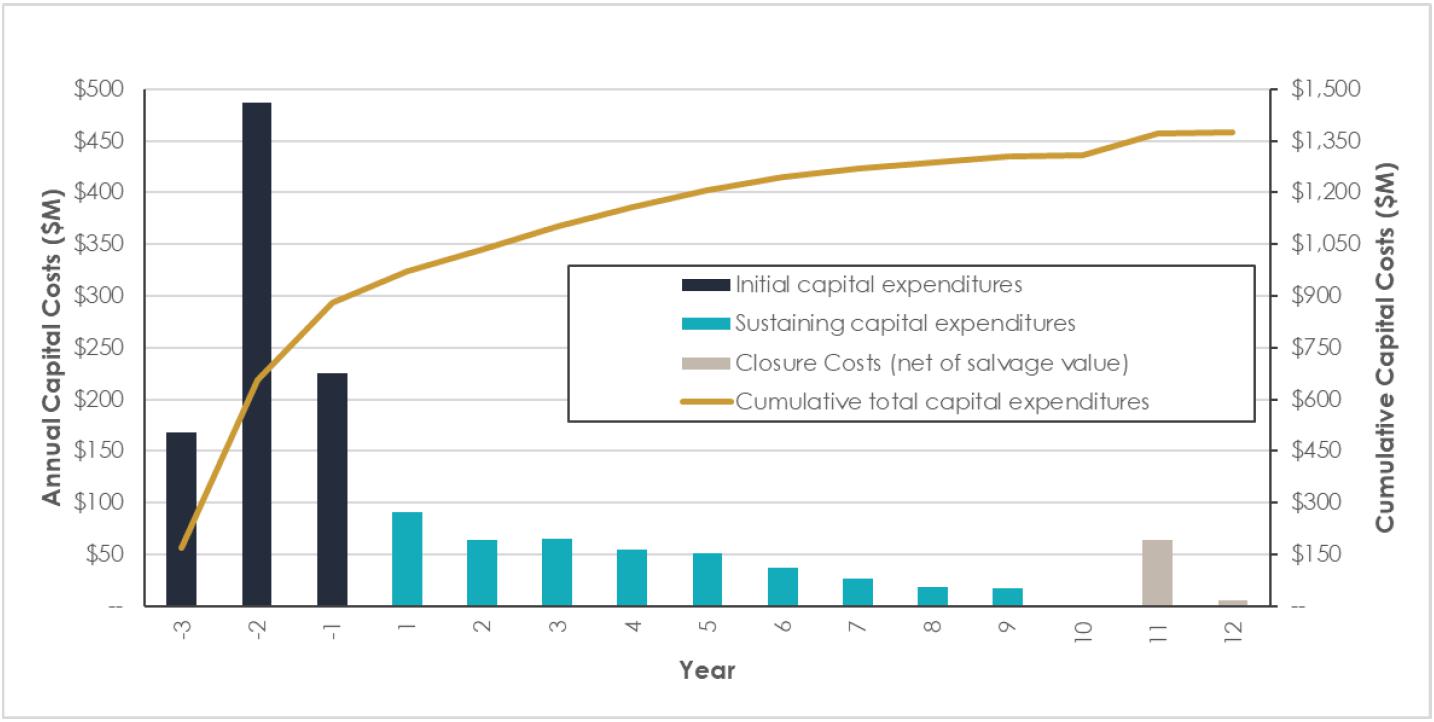
Figure 22-2: Overall Cariboo
Gold Project capital cost profile
Over the life of the Project, based on the agreement
in place with OGR, a 5.0% NSR royalty is in place for the Project. It is estimated that approximately $291.7M in royalties is to be paid
based on the base case metal prices and project assumptions.
| |
Osisko Development Corp.
NI 43-101 Technical Report
Feasibility Study for the Cariboo Gold Project |
|
The taxation calculations for the Project were
compiled with the assistance of ODV and their financial advisors. At the time of the effective date of this Report, the Project was subject
to the following tax regimes:
| ■ | The Canadian Corporate Income Tax system, consisting of the federal income
tax (modelled at a rate of 15%) and the provincial (British Columbia) income tax (modelled at a rate of 12%); |
| ■ | The British Columbia Mineral Tax, which was modelled using a net current
proceeds rate of 2% and a net revenue tax rate of 13%. |
The tax calculations are underpinned by the following
key assumptions:
| ■ | Calculations are based on the tax regimes valid at the date of the FS. Future
changes in tax laws could impact the calculations; |
| ■ | Tax attribute opening balances are based on information provided by ODV and
include Project-related sunk costs and pre-permit expenses, which total $38.6M; |
| ■ | The Project is held 100% by a corporate entity and the after-tax analysis
does not attempt to reflect any future changes in corporate structure or property ownership; |
| ■ | A total of 100% equity financing is assumed and, therefore, it does not consider
interest and financing expenses; |
| ■ | The BC carbon tax is deductible for BC mining tax purposes; |
| ■ | The BC mineral and carbon taxes are deductible for federal and provincial
income tax purposes; |
| ■ | Payments projected relating to NSR royalties are allowed as a deduction for
federal and provincial income tax purposes, but are added back for BC mineral tax purposes; |
| ■ | Actual taxes payable will be affected by corporate activities and current
and future tax benefits; however, these activities have not been considered. |
The combined effect on the Project of the mining
and income taxes including the elements described above, is an approximate cumulative effective tax rate of 29%, based on Project earnings
before interest and tax (“EBIT”). It is anticipated, based on the Project assumptions, that ODV will pay approximately $213.3M
in Canadian Corporate income tax, $170.7M in British Columbia Corporate income tax and $233.3M in British Columbia mineral tax over the
life of the Project. Companies operating in British Columbia are subject to a carbon tax based on their annual greenhouse gas emissions.
Carbon taxes for Scope 1 emissions have been applied to the tonnes of carbon dioxide equivalent (“t CO2eq”)
amounts of the consumed fossil fuels such as diesel, gasoline, propane, and emulsion. The carbon tax rate is $95/t CO2eq
in 2025 and was assumed to escalate by $15 per year, up to a maximum of $170/t CO2eq. A total of approximately 271,000 t CO2eq
in attributable emissions and 140,000 t CO2eq in net emissions will be produced over the LOM, costing $21.4M in carbon
taxes. The carbon tax amount is applied against the gross revenue when calculating federal and BC provincial income taxes, as well as
when calculating the BC mining tax.
| |
Osisko Development Corp.
NI 43-101 Technical Report
Feasibility Study for the Cariboo Gold Project |
|
| 22.7 | Financial Analysis Summary |
A 5% discount rate was applied to the cash flow
to derive the NPV for the Project on a pre-tax and after-tax basis. Cash flows have been discounted to the middle of Year -3 under the
assumption that the Project will be financed and its construction will be initiated at that time. The summary of the financial evaluation
for the base case of the Project is presented in Table 22-2.
Table 22-2: Financial analysis
summary (pre-tax and after-tax)
| Description |
Unit |
Value |
| Pre-tax |
Net Present Value (0% discount rate) |
$M |
2,216.1 |
| Net Present Value (5% discount rate) |
$M |
1,371.4 |
| Internal Rate of Return |
% |
26.5 |
| Simple Payback Period |
year |
5.6 |
| Payback Period (after start of operations) |
year |
2.6 |
| After-tax |
Net Present Value (0% discount rate) |
$M |
1,577.4 |
| Net Present Value (5% discount rate) |
$M |
943.5 |
| Internal Rate of Return |
% |
22.1 |
| Simple Payback Period |
year |
5.8 |
| Payback Period (after start of operations) |
year |
2.8 |
The pre-tax base case financial model resulted
in an IRR of 27% and a NPV of $1,371M, based on a discount rate of 5%. The simple pre-tax payback period from first production is 2.6
years. On an after-tax basis, the base case financial model resulted in an IRR of 22% and a NPV of $943M based on a discount rate of 5%.
The simple after-tax payback period from first production is 2.8 years. The summary of the Project discounted cash flow financial model
(pre-tax and after-tax) is presented in Table 22-3.
| |
Osisko Development Corp.
NI 43-101 Technical Report
Feasibility Study for the Cariboo Gold Project |
|
Table 22-3: Summary of
the Project cash flow financial model
| Year |
Unit |
Year
-3 |
Year
-2 |
Year
-1 |
Year
1 |
Year
2 |
Year
3 |
Year
4 |
Year
5 |
Year
6 |
Year
7 |
Year
8 |
Year
9 |
Year
10 |
Year
11 |
Year
12 |
Total
(to Year 12) |
| Production
Summary |
|
|
|
|
|
|
|
|
|
|
|
|
|
|
|
|
|
| Total
Tonnes Mined |
kt |
1.7 |
43.2 |
419.8 |
1,695.1 |
1,788.6 |
1,789.0 |
1,786.9 |
1,793.4 |
1,783.1 |
1,788.5 |
1,788.6 |
1,793.4 |
1,272.7 |
71.5 |
- |
17,815.4 |
| Total
Tonnes Processed |
kt |
1.7 |
43.2 |
419.8 |
1,695.1 |
1,788.6 |
1,789.0 |
1,786.9 |
1,793.4 |
1,783.1 |
1,788.5 |
1,788.6 |
1,793.4 |
1,272.7 |
71.5 |
- |
17,815.4 |
| Head
Grade Au |
g/t |
1.86 |
3.92 |
3.90 |
3.80 |
4.16 |
3.91 |
3.96 |
3.36 |
3.52 |
3.50 |
3.40 |
3.29 |
3.00 |
3.55 |
- |
3.62 |
| Gold
Recovered in Doré |
koz |
- |
- |
25.01 |
99.66 |
106.61 |
96.10 |
93.51 |
79.85 |
79.64 |
84.10 |
83.92 |
77.99 |
54.02 |
3.59 |
- |
884.0 |
| Gold
Recovered in Flotation Concentrate |
koz |
- |
- |
25.59 |
101.50 |
119.07 |
113.06 |
116.62 |
98.55 |
103.99 |
101.49 |
95.25 |
95.23 |
59.34 |
3.81 |
- |
1,033.5 |
| Flotation
Concentrate Tonnage |
kt |
- |
- |
6.17 |
25.04 |
24.72 |
24.31 |
23.82 |
24.14 |
23.58 |
23.68 |
23.85 |
23.81 |
16.78 |
0.91 |
- |
240.8 |
| Payable
Gold |
koz |
- |
- |
50.0 |
198.8 |
223.0 |
206.6 |
207.5 |
176.2 |
181.3 |
183.3 |
177.0 |
171.1 |
112.0 |
7.3 |
- |
1,894.0 |
| Revenue |
|
|
|
|
|
|
|
|
|
|
|
|
|
|
|
|
|
| Exchange
Rate |
USD:CAD |
1.35 |
1.35 |
1.35 |
1.35 |
1.35 |
1.35 |
1.35 |
1.35 |
1.35 |
1.35 |
1.35 |
1.35 |
1.35 |
1.35 |
1.35 |
1.35 |
| Gross
Revenue |
$M |
- |
- |
- |
644.2 |
722.4 |
669.3 |
672.2 |
570.7 |
587.3 |
593.8 |
573.5 |
554.2 |
362.9 |
23.7 |
- |
5,974.4 |
| Doré
Refining Charge |
$M |
- |
- |
- |
0.3 |
0.4 |
0.3 |
0.3 |
0.3 |
0.3 |
0.3 |
0.3 |
0.3 |
0.2 |
0.0 |
- |
3.0 |
| Flotation
Concentrate Transportation Charge |
$M |
- |
- |
- |
6.6 |
6.5 |
6.4 |
6.2 |
6.3 |
6.2 |
6.2 |
6.2 |
6.2 |
4.4 |
0.2 |
- |
61.5 |
| Flotation
Concentrate Treatment Charge |
$M |
- |
- |
- |
6.6 |
6.5 |
6.4 |
6.3 |
6.4 |
6.2 |
6.2 |
6.3 |
6.3 |
4.4 |
0.2 |
- |
61.8 |
| Flotation
Concentrate Refining Charge |
$M |
- |
- |
- |
1.3 |
1.6 |
1.5 |
1.5 |
1.3 |
1.4 |
1.3 |
1.3 |
1.3 |
0.8 |
0.1 |
- |
13.3 |
| Net
Smelter Return (NSR) Revenue |
$M |
- |
- |
- |
629.4 |
707.5 |
654.7 |
657.9 |
556.5 |
573.3 |
579.8 |
559.4 |
540.2 |
353.1 |
23.2 |
- |
5,834.9 |
| Operating
Expenses |
|
|
|
|
|
|
|
|
|
|
|
|
|
|
|
|
|
| Mining |
$M |
- |
- |
- |
113.3 |
118.9 |
119.6 |
114.1 |
106.8 |
111.1 |
111.8 |
104.1 |
106.8 |
68.8 |
4.9 |
- |
1,080.2 |
| Processing |
$M |
- |
- |
- |
40.1 |
42.0 |
41.2 |
39.9 |
39.9 |
38.8 |
40.2 |
40.3 |
39.1 |
35.4 |
6.0 |
- |
402.8 |
| Waste
and Water Management |
$M |
- |
- |
- |
8.5 |
8.1 |
8.6 |
8.6 |
8.6 |
8.6 |
8.6 |
8.6 |
8.6 |
8.5 |
0.7 |
- |
86.3 |
| Electrical
Transmission Line |
$M |
- |
- |
- |
9.4 |
9.4 |
9.4 |
9.4 |
9.4 |
9.4 |
9.4 |
9.4 |
9.4 |
0.5 |
0.5 |
- |
85.6 |
| General
and Administration |
$M |
- |
- |
- |
28.2 |
25.6 |
26.8 |
26.6 |
26.4 |
26.4 |
26.3 |
26.1 |
26.1 |
24.7 |
3.3 |
- |
266.5 |
| Total
Operating Expenses |
$M |
- |
- |
- |
199.4 |
204.1 |
205.6 |
198.6 |
191.2 |
194.3 |
196.3 |
188.5 |
189.9 |
137.9 |
15.3 |
- |
1,921.3 |
| Royalty
Payments |
$M |
- |
- |
- |
31.5 |
35.4 |
32.7 |
32.9 |
27.8 |
28.7 |
29.0 |
28.0 |
27.0 |
17.7 |
1.2 |
- |
291.7 |
| Total
Cash Costs |
USD/oz |
- |
- |
- |
1,070 |
857 |
900 |
876 |
961 |
972 |
969 |
959 |
997 |
1,016 |
-621 |
- |
947 |
| All-in
Sustaining Costs |
USD/oz |
- |
- |
- |
1,409 |
1,071 |
1,135 |
1,069 |
1,175 |
1,122 |
1,076 |
1,036 |
1,073 |
1,024 |
5,840 |
- |
1,157 |
| Capital
Expenditures |
|
|
|
|
|
|
|
|
|
|
|
|
|
|
|
|
|
| Initial |
$M |
168.2 |
487.3 |
225.3 |
- |
- |
- |
- |
- |
- |
- |
- |
- |
- |
- |
- |
880.8 |
| Sustaining |
$M |
- |
- |
- |
91.2 |
64.3 |
65.5 |
54.1 |
50.8 |
36.6 |
26.4 |
18.4 |
17.6 |
1.2 |
- |
- |
426.1 |
| Reclamation |
$M |
- |
- |
- |
- |
- |
- |
- |
- |
- |
- |
- |
- |
- |
99.8 |
5.7 |
105.5 |
| Salvage
Value |
$M |
- |
- |
- |
- |
- |
- |
- |
- |
- |
- |
- |
- |
- |
-36.0 |
- |
-36.0 |
| Total
Capital Expenditures |
$M |
168.2 |
487.3 |
225.3 |
91.2 |
64.3 |
65.5 |
54.1 |
50.8 |
36.6 |
26.4 |
18.4 |
17.6 |
1.2 |
63.9 |
5.7 |
1,376.5 |
| Changes
in Working Capital |
$M |
- |
- |
- |
41.4 |
3.5 |
-2.0 |
-0.5 |
-4.6 |
0.9 |
0.4 |
-1.5 |
-0.6 |
-11.7 |
-23.2 |
-2.2 |
- |
| |
Osisko Development Corp.
NI 43-101 Technical Report
Feasibility Study for the Cariboo Gold Project |
|
| Year |
Unit |
Year
-3 |
Year
-2 |
Year
-1 |
Year
1 |
Year
2 |
Year
3 |
Year
4 |
Year
5 |
Year
6 |
Year
7 |
Year
8 |
Year
9 |
Year
10 |
Year
11 |
Year
12 |
Total
(to Year 12) |
| Pre-Tax
Cash Flow |
|
|
|
|
|
|
|
|
|
|
|
|
|
|
|
|
|
| Pre-Tax
Cash Flow |
$M |
-168.2 |
-487.3 |
-225.3 |
265.9 |
400.1 |
352.9 |
372.8 |
291.4 |
312.7 |
327.6 |
326.0 |
306.3 |
208.0 |
-34.0 |
-3.5 |
2,245.4 |
| Cumulative
Pre-Tax Cash Flow |
$M |
-168.2 |
-655.5 |
-880.8 |
-614.9 |
-214.8 |
138.1 |
510.9 |
802.2 |
1,114.9 |
1,442.6 |
1,768.5 |
2,074.8 |
2,282.9 |
2,248.9 |
2,245.4 |
|
| Taxes
and Duties |
|
|
|
|
|
|
|
|
|
|
|
|
|
|
|
|
|
| British
Columbia Mining Duties |
$M |
- |
- |
0.4 |
8.6 |
10.0 |
8.9 |
9.2 |
7.3 |
26.6 |
46.1 |
45.6 |
43.0 |
27.6 |
- |
- |
233.3 |
| Federal
Corporate Income Tax |
$M |
- |
- |
- |
- |
- |
15.2 |
39.6 |
30.3 |
32.7 |
33.3 |
34.1 |
33.6 |
19.1 |
-18.6 |
-5.2 |
214.1 |
| Provincial
(BC) Corporate Income Tax |
$M |
- |
- |
- |
- |
- |
12.2 |
31.7 |
24.3 |
26.1 |
26.7 |
27.3 |
26.9 |
15.2 |
-14.9 |
-4.2 |
171.3 |
| Carbon
Tax |
$M |
0.5 |
1.6 |
1.9 |
1.1 |
1.4 |
1.7 |
1.5 |
2.0 |
2.0 |
1.9 |
1.8 |
1.9 |
1.5 |
0.3 |
- |
21.4 |
| Total
Taxes and Duties |
$M |
0.5 |
1.6 |
2.3 |
9.7 |
11.4 |
38.1 |
81.9 |
63.9 |
87.5 |
108.0 |
108.8 |
105.4 |
63.4 |
-33.1 |
-9.4 |
640.1 |
| After-Tax
Cash Flow |
|
|
|
|
|
|
|
|
|
|
|
|
|
|
|
|
|
| After-Tax
Cash Flow |
$M |
-168.8 |
-488.9 |
-227.7 |
256.2 |
388.7 |
314.8 |
290.8 |
227.5 |
225.3 |
219.6 |
217.1 |
200.9 |
144.6 |
-0.9 |
6.0 |
1,605.3 |
| Cumulative
After-Tax Cash Flow |
$M |
-168.8 |
-657.7 |
-885.3 |
-629.1 |
-240.4 |
74.4 |
365.2 |
592.7 |
818.0 |
1,037.6 |
1,254.7 |
1,455.6 |
1,600.2 |
1,599.3 |
1,605.3 |
|
| |
Osisko Development Corp.
NI 43-101 Technical Report
Feasibility Study for the Cariboo Gold Project |
|
Figure 22-3 shows the cumulative cash flows
for the Project as projected for the LOM on a pre-tax and after-tax basis.
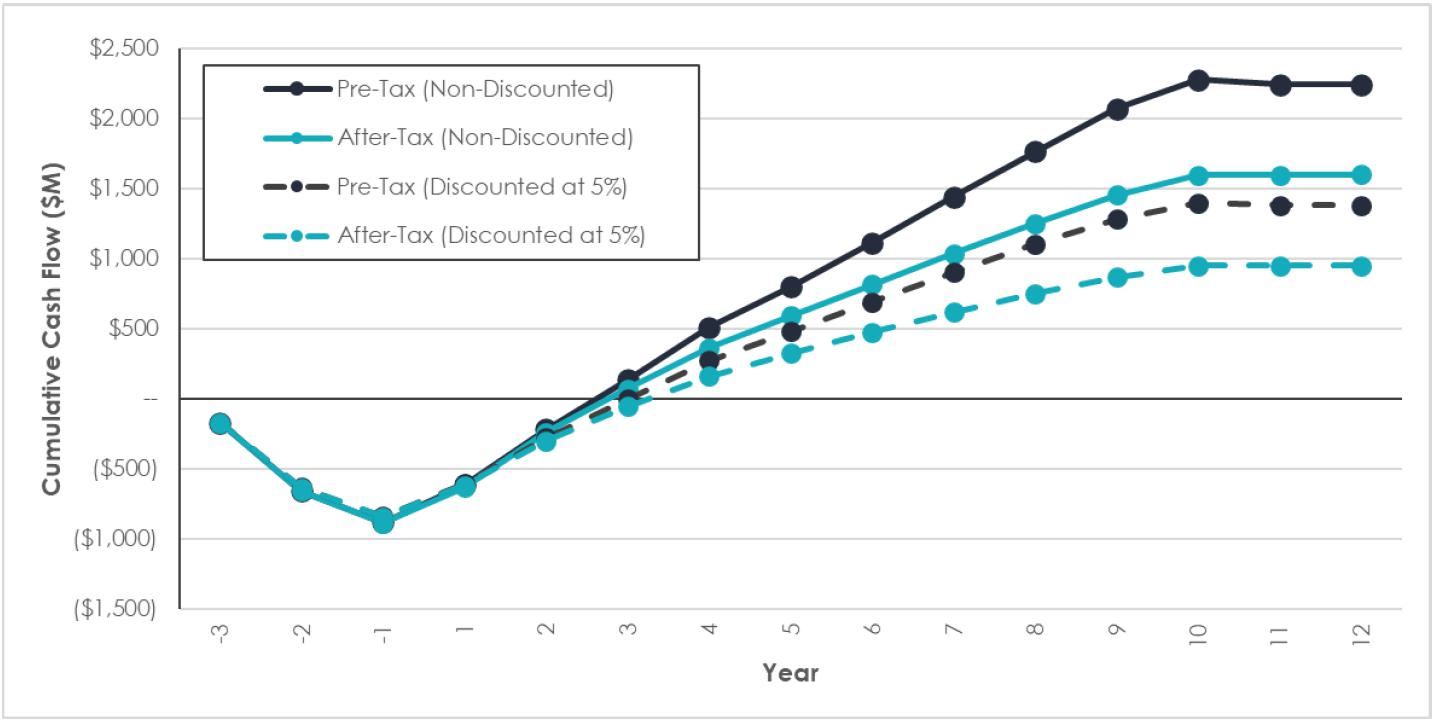
Figure 22-3: Life of mine
cash flow projection (cumulative, pre-tax and after-tax)
A summary of the Project’s production costs
is provided in Table 22-4. All costs are in USD. Total cash costs are calculated per ounce on a payable basis using the costs of
mining, material transport, processing, tailings, waste and water treatment, on-site general and administrative (“G&A”)
expenses, refining and smelting, and royalties. The LOM operating cash cost per ounce is USD 947/oz gold. The LOM all-in sustaining
cost (“AISC”1) per ounce is USD 1,157/oz gold derived from the total cash costs plus sustaining capital,
and closure costs. The operating margin over the LOM has been estimated to be USD 1,243/oz gold, based on a gold price of USD 2,400/oz.
1
All-in Sustaining Costs are presented as defined by the World Gold Council ("WGC") less corporate G&A costs.
| |
Osisko Development Corp.
NI 43-101 Technical Report
Feasibility Study for the Cariboo Gold Project |
|
Table 22-4: Production
cost summary
| Description |
Unit |
Value |
| Metal Payable |
|
|
| Gold |
koz |
1,843.9 |
| Offsite Charges, Operating Costs and Royalties |
|
|
| Doré Refining Charge |
USD M |
2.3 |
| Flotation Concentrate Transportation Charge |
USD M |
46.7 |
| Flotation Concentrate Treatment Charge |
USD M |
47.0 |
| Flotation Concentrate Refining Charge |
USD M |
10.1 |
| Mining |
USD M |
800.1 |
| Processing |
USD M |
298.4 |
| Waste and Water Management |
USD M |
63.9 |
| Electrical Transmission Line |
USD M |
63.4 |
| General and Administration |
USD M |
197.4 |
| Royalties |
USD M |
216.1 |
| Total Offsite Charges, Operating Costs and Royalties |
USD M |
1,745.3 |
| AISC and Profit Margin (per oz payable) |
|
|
| Gold Price |
USD/oz |
2,400 |
| Cash Cost (Operating) |
USD/oz |
946.5 |
| Sustaining and Closure Costs |
USD M |
388.8 |
| Total Costs (Operating and Sustaining) |
USD M |
2,134.1 |
| AISC |
USD/oz |
1,157.4 |
| Operating Margin |
USD/oz |
1,242.6 |
| |
Osisko Development Corp.
NI 43-101 Technical Report
Feasibility Study for the Cariboo Gold Project |
|
Figure 22-4 presents the primary Project
value drivers in the form of a waterfall chart discounted at 5%. The main value drivers of the Project are processing recovery losses,
mining operating expenses, processing operating costs, mining capital expenditures and taxes.
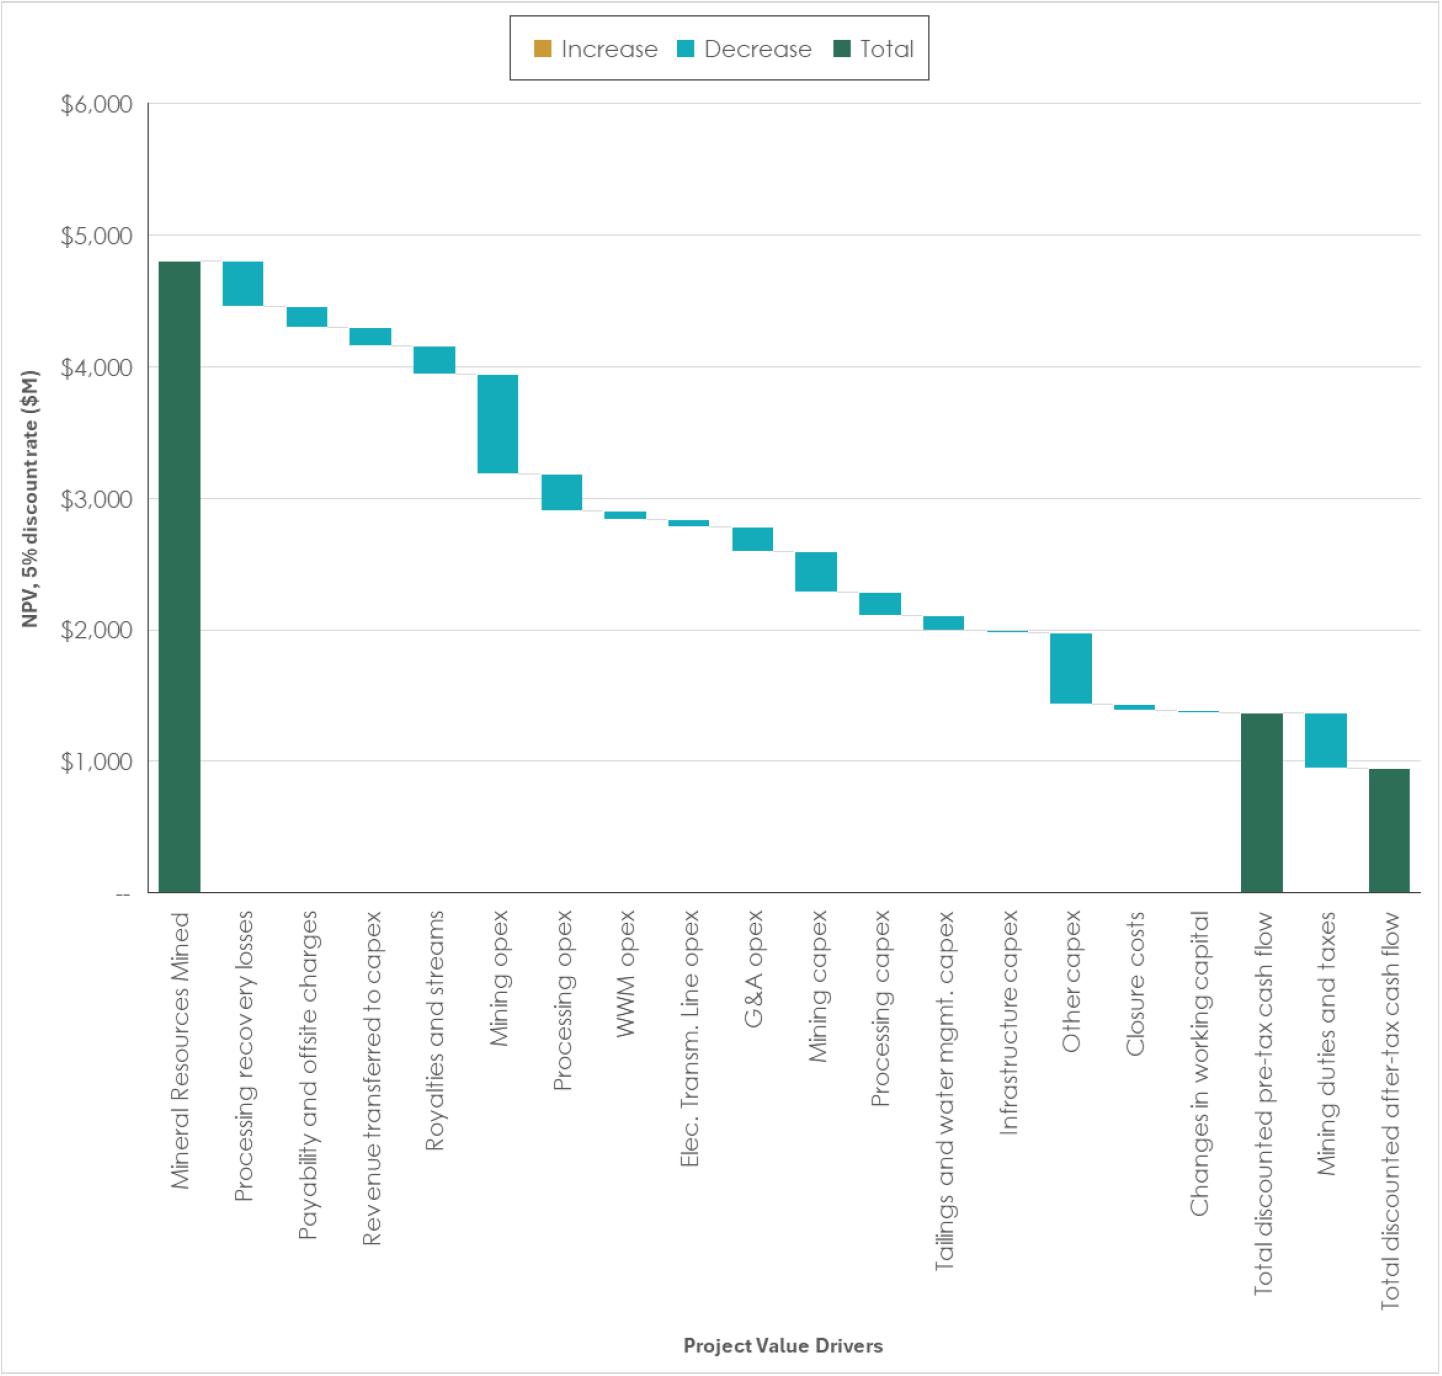
Figure 22-4: Main value
drivers (discounted at 5%)
| |
Osisko Development Corp.
NI 43-101 Technical Report
Feasibility Study for the Cariboo Gold Project |
|
| 22.10 | Sensitivity Analysis |
A financial sensitivity analysis was conducted
on the base case after-tax cash flow NPV ($M) and IRR of the Project, using the following variables: capital costs, operating costs, USD:CAD
exchange rate, price of gold, and discount rate. The after-tax results for the Project IRR and NPV ($M) based on the sensitivity analysis
are summarized in Table 22-5 through Table 22-9.
Table 22-5: NPV ($M) sensitivity
results (after-tax) for metal price and exchange rate variations
| USD:CAD |
Gold Price (USD/ounce) |
| 1,800 |
2,000 |
2,200 |
2,400 |
2,600 |
2,800 |
3,000 |
| 0.68 |
449.3 |
693.4 |
935.0 |
1,175.9 |
1,415.1 |
1,654.6 |
1,893.9 |
| 0.70 |
383.2 |
625.5 |
861.0 |
1,095.0 |
1,328.0 |
1,560.3 |
1,793.1 |
| 0.72 |
316.6 |
561.6 |
790.7 |
1,018.4 |
1,245.6 |
1,471.4 |
1,697.6 |
| 0.74 |
251.0 |
498.2 |
721.8 |
943.5 |
1,164.6 |
1,384.3 |
1,604.1 |
| 0.76 |
192.7 |
442.3 |
661.0 |
877.6 |
1,093.1 |
1,307.9 |
1,521.8 |
| 0.78 |
132.2 |
382.8 |
601.0 |
812.5 |
1,022.5 |
1,232.2 |
1,440.6 |
| 0.80 |
59.5 |
322.9 |
543.9 |
750.3 |
955.5 |
1,160.3 |
1,363.8 |
Table 22-6: IRR sensitivity
results (after-tax) for metal price and exchange rate variations
| USD:CAD |
Gold Price (USD/ounce) |
| 1,800 |
2,000 |
2,200 |
2,400 |
2,600 |
2,800 |
3,000 |
| 0.68 |
13.6% |
17.9% |
22.0% |
25.8% |
29.2% |
32.6% |
35.8% |
| 0.70 |
12.4% |
16.8% |
20.8% |
24.5% |
28.0% |
31.3% |
34.5% |
| 0.72 |
11.1% |
15.6% |
19.6% |
23.3% |
26.8% |
30.0% |
33.2% |
| 0.74 |
9.9% |
14.5% |
18.4% |
22.1% |
25.6% |
28.8% |
31.9% |
| 0.76 |
8.8% |
13.4% |
17.4% |
21.0% |
24.5% |
27.7% |
30.8% |
| 0.78 |
7.6% |
12.3% |
16.3% |
20.0% |
23.4% |
26.6% |
29.6% |
| 0.80 |
6.2% |
11.2% |
15.3% |
18.9% |
22.3% |
25.5% |
28.5% |
| |
Osisko Development Corp.
NI 43-101 Technical Report
Feasibility Study for the Cariboo Gold Project |
|
Table 22-7: NPV ($M) sensitivity
results (after-tax) for capital (LOM) and operating costs variations
| OPEX |
CAPEX |
| -30% |
-20% |
-10% |
0% |
10% |
20% |
30% |
| -30% |
1,461.7 |
1,389.3 |
1,316.6 |
1,244.5 |
1,171.8 |
1,098.7 |
1,025.8 |
| -20% |
1,366.5 |
1,292.4 |
1,218.6 |
1,144.4 |
1,069.7 |
995.2 |
920.6 |
| -10% |
1,271.2 |
1,195.7 |
1,120.0 |
1,044.0 |
967.8 |
891.6 |
815.6 |
| 0% |
1,175.9 |
1,098.8 |
1,021.2 |
943.5 |
865.8 |
788.1 |
709.7 |
| 10% |
1,080.5 |
1,001.5 |
922.2 |
843.1 |
763.6 |
683.6 |
603.9 |
| 20% |
984.8 |
904.1 |
823.4 |
742.2 |
660.7 |
579.5 |
497.5 |
| 30% |
889.0 |
806.7 |
723.9 |
640.9 |
558.1 |
474.4 |
382.5 |
Table 22-8: IRR sensitivity
results (after-tax) for capital (LOM) and operating costs variations
| OPEX |
CAPEX |
| -30% |
-20% |
-10% |
0% |
10% |
20% |
30% |
| -30% |
39.1% |
34.6% |
30.8% |
27.6% |
24.9% |
22.4% |
20.3% |
| -20% |
37.0% |
32.6% |
28.9% |
25.8% |
23.1% |
20.7% |
18.7% |
| -10% |
34.9% |
30.6% |
27.0% |
23.9% |
21.3% |
19.1% |
17.1% |
| 0% |
32.7% |
28.5% |
25.1% |
22.1% |
19.6% |
17.4% |
15.5% |
| 10% |
30.6% |
26.5% |
23.1% |
20.3% |
17.8% |
15.7% |
13.9% |
| 20% |
28.4% |
24.5% |
21.2% |
18.4% |
16.1% |
14.0% |
12.2% |
| 30% |
26.2% |
22.4% |
19.2% |
16.6% |
14.3% |
12.4% |
10.5% |
Table 22-9: NPV sensitivity
results (after-tax) for discount rate
| |
Discount rate |
| 0.0% |
2.5% |
5.0% |
7.5% |
10.0% |
| NPV (M$) |
1,577.4 |
1,226.3 |
943.5 |
714.7 |
528.6 |
| |
Osisko Development Corp.
NI 43-101 Technical Report
Feasibility Study for the Cariboo Gold Project |
|
The graphical representations of the financial
sensitivity analysis are depicted in Figure 22-5 for the Project’s NPV and Figure 22-6 for the Project’s IRR.
The sensitivity analysis reveals that the USD:CAD
exchange rate and gold price have the most significant influence on both NPV and IRR compared to the other parameters, based on the range
of values evaluated. After the USD:CAD exchange rates and gold price, NPV was most impacted by changes in operating costs and then, to
a lesser extent, capital costs. After the USD:CAD exchange rate and gold price, the Project’s IRR was most impacted by variations
in capital costs and, to a lesser extent, by the operating costs. Overall, the NPV of the Project is positive over all of the range of
values used for the sensitivity analysis.
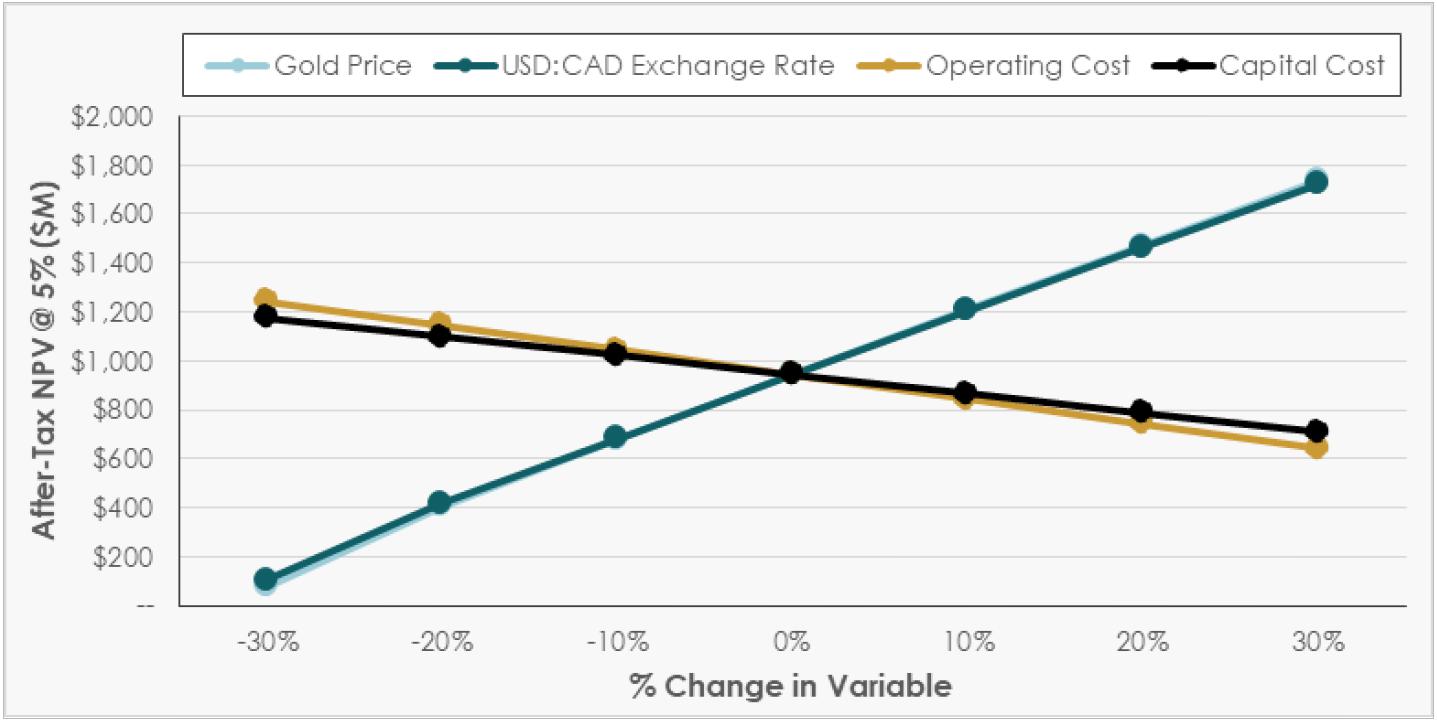
Figure 22-5: Sensitivity
of the net present value (after-tax) to financial variables
| |
Osisko Development Corp.
NI 43-101 Technical Report
Feasibility Study for the Cariboo Gold Project |
|
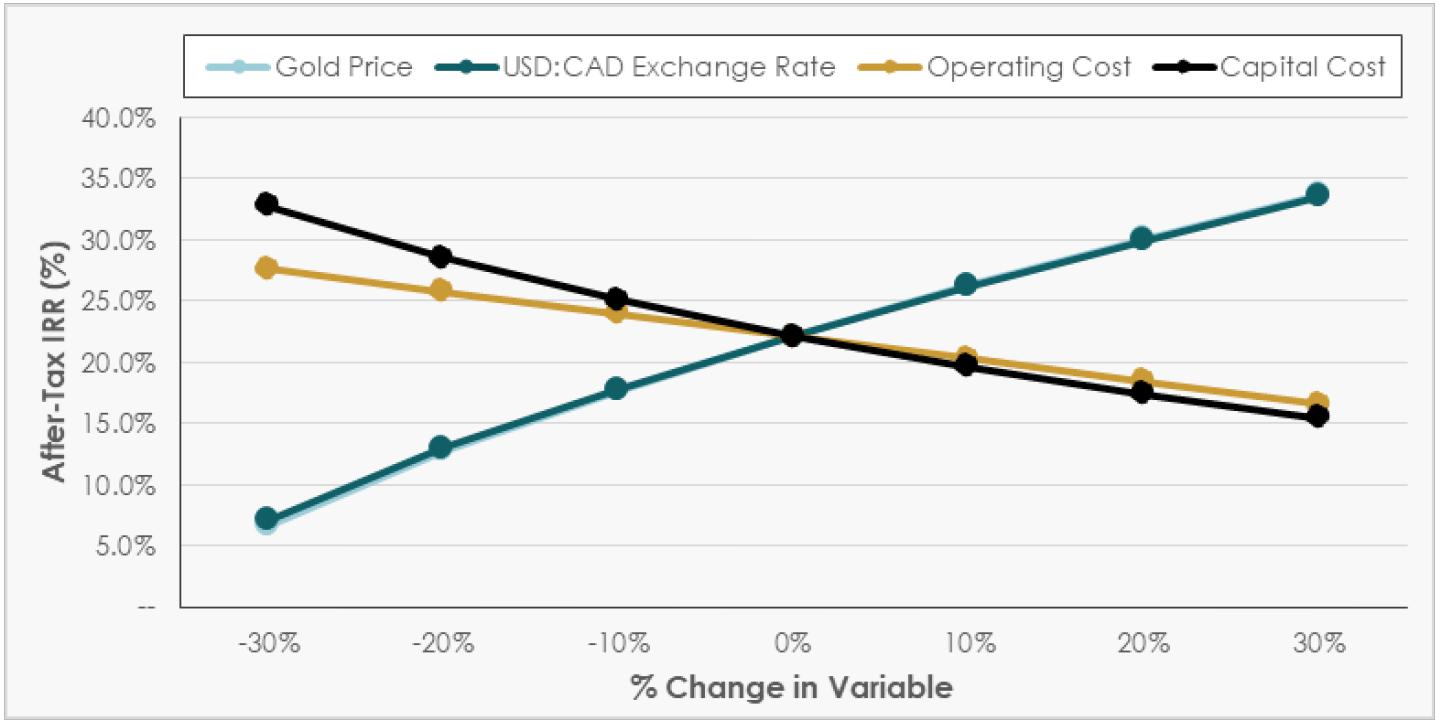
Figure 22-6: Sensitivity
of the internal rate of return (after-tax) to financial variables
| |
Osisko Development Corp.
NI 43-101 Technical Report
Feasibility Study for the Cariboo Gold Project |
|
There are no adjacent properties that would provide
significant information relating to the Cariboo Gold Project. ODV maintains a significant land position in the Cariboo Regional District
of BC, and the District of Wells’ historical lode mines are located mainly within the boundaries of the Project.
The descriptions in this section are drawn from
information publicly disclosed by the owners of the adjacent properties.
The information about mineralization on adjacent
properties is not necessarily indicative of mineralization on the Project. The authors have not verified the mineral resource estimates
or published geological information pertaining to the adjacent properties.
Figure 23-1 shows all the current owners
of mining titles adjacent to the Project.
| |
Osisko Development Corp.
NI 43-101 Technical Report
Feasibility Study for the Cariboo Gold Project |
|
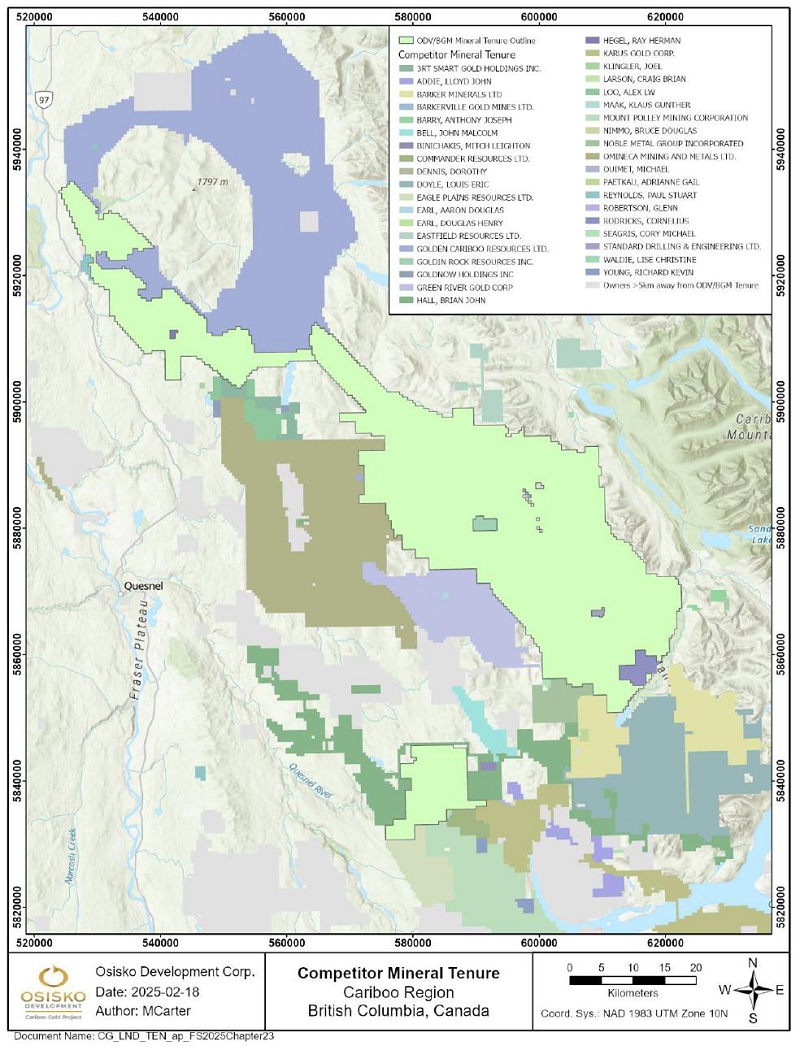
Figure 23-1: Adjacent
properties
| |
Osisko Development Corp.
NI 43-101 Technical Report
Feasibility Study for the Cariboo Gold Project |
|
| 24. | Other Relevant Data and Information |
| 24.1 | Project Execution Plan |
The Cariboo Gold Project will be developed by
Osisko Development Corp. to favour early production and reduce initial financing requirements. Upgrading of the Bonanza Ledge site infrastructure
and development of the Mine Site Complex site near the town of Wells, BC will occur over a period of 24 months, with a 10-month ramp up
period to follow completion of construction to achieve full production rates. The construction of the Bonanza Ledge site will consist
of water management infrastructure and a Waste Rock Storage Facility. The construction at the MSC will consist of supporting site infrastructure
such as potable water and sewage treatment plants, water treatment plant, electrical substation, fuel farm, mine dry and offices. A 4,900-tpd
concentrator building will be located at the MSC, producing gold flotation concentrate and doré, which will then be bagged and
transported to port for shipping. The Project is fully permitted, with detailed engineering and construction activities set to commence
Q3 2025, subject to available financing.
The Project’s organization and construction
execution philosophy benefits from certain existing facilities, expansion of the Ballarat camp, and experience gained with the current
operations at the Bonanza Ledge site.
| 24.1.2 | Main Project Activities |
The main activities associated with the technical
development of the Project are:
| ■ | Pre-production activities: |
| - | Various key components of the Project outside the scope of the FS will require planning resources to implement strategies that are
critical, ahead of the execution phase. The pre-production activities will require engineering, procurement, and construction activities
to prepare the Bonanza Ledge site for the successful deployment of the Project’s execution plan. These activities include the expansion
of the Bonanza Ledge WTP to increase throughput capacity in addition to improving underground working dewatering capacity through installation
of submersible pumps and water conveyance pipelines. Additional activities are discussed in Section 24.3 below. |
| |
Osisko Development Corp.
NI 43-101 Technical Report
Feasibility Study for the Cariboo Gold Project |
|
| - | The execution stage will cover the detailed engineering, procurement, and construction management. Engineering will generate technical
specifications and increase the accuracy and definition of the requests for proposals (“RFP”) issued during the FS for final
and T&M bids from vendors. Technical and economic evaluations of the T&M quotations will be performed, and the procurement process
for equipment, material, and services contracts will be finalized. Construction Management will then, with the support of the engineering
and procurement teams, proceed with the installation of the materials and equipment under the quality standards established in the engineering
documents. |
The main development and construction activities
associated with the Project are:
| - | To support the expanded water management requirements at the Bonanza Ledge site, there will be upgrades to the water management infrastructure
and water treatment plant, and the construction of a new WRSF. |
| - | A new Process Plant will be constructed to process 4,900 tpd ROM material. To support the operation, new surface, and water management
infrastructure will be required, as well as an upgrade of the existing Ballarat camp to support the workforce required to execute on construction.
A main electrical substation and site electrical distribution will be constructed to support the operation. |
| - | A 69 kilovolt (“kV”) transmission line from the Barlow Substation near Quesnel, BC, to the MSC will be constructed and
will include the clearing of the right-of-way over a distance of 69 km. The transmission line will connect into the MSC main electrical
substation for transformation and distribution. |
| 24.1.3 | Project Organization |
The Integrated Owner’s Team has the personnel
and experience to bring the Project from exploration through production. All upcoming Project activities, including detailed engineering,
procurement, pre-production, and construction will be under the direction of the Chief Operating Officer (“COO”) of ODV.
| |
Osisko Development Corp.
NI 43-101 Technical Report
Feasibility Study for the Cariboo Gold Project |
|
ODV will establish an Integrated Operations Team
(“IOT”), consisting of the ODV Project Development Team (“PDT”), the Construction Management Team (“CMT”),
and the Site Services Team (“SST”). The PDT is responsible for the management, engineering, procurement, environment, permitting,
and financing activities of the Project. The Project design and development strategy is under the PDT’s supervision. The CMT will
be responsible for the execution of construction activities on site, both underground and on surface. Finally, the SST will provide services
during the execution phase on site, such as managing infrastructure maintenance, lodging, logistics, and personnel travelling. The SST
will leverage the experience gained from existing operational personnel to support the PDT and the CMT.
Additional support will be provided by ODV’s
senior management, which benefits from an experienced technical and construction team that has successfully designed and built several
projects in Canada, Latin America, Africa, and Europe. The IOT will be comprised of direct employees, contractors, and consultants overseeing
the successful execution of the Project.
| 24.1.4 | Project Development Team |
The PDT will supervise all aspects of the Project,
including engineering, procurement, logistics, project controls, as well as ensuring adherence to active permits. The requirement for
an early works program will be evaluated and planned during the early stages of the Project development. Specialized engineering firms
will be selected for each portion of the Project to assemble a strong integrated design and execution team.
The PDT is responsible for the following activities
in the respective phases:
| - | Management of engineering activities for all Project components. |
| ■ | Procurement and Logistics: |
| - | RFPs for equipment and material; |
| - | Purchasing and contracting. |
| ■ | Project Controls and Execution: |
| - | Scheduling and establishment of critical paths; |
| - | Earned Value Management for Project performance assessment. |
| - | Adherence to Project permits. |
| - | Integration to operations; |
| ■ | Environmental Assessment: |
| - | Adherence to BC Environmental Act permits; |
| |
Osisko Development Corp.
NI 43-101 Technical Report
Feasibility Study for the Cariboo Gold Project |
|
| 24.1.5 | Construction Management Team |
In the detailed engineering phase of the Project,
the CMT will contribute to the Project design with constructability reviews. The CMT will be responsible for the following services:
| ■ | Constructability reviews; |
| ■ | Site supervision of construction activities; |
| ■ | Health, safety, and environment (“HSE”); |
| ■ | Contract administration. |
It is recognized that an effective health and
safety program during the Project is a necessity. The success of the Construction Safety Program is contingent upon its enforcement at
all stages of the Project, including design, construction planning, construction execution, and start-up and commissioning. The CMT will
work closely with each group to ensure proper implementation and functional results.
The CMT will follow ODV’s procedures and
work methods to guarantee the protection of the environment. Furthermore, the CMT will work closely with each department of the operations
group to ensure proper installation and functional results. During the construction phase, personnel from operations will be integrated
into the construction team as coordinators and supervisors. Upon commissioning, the operations team will be integrated into the commissioning
team, where they will work with equipment vendors and construction team alike, to gain familiarization and understanding of the equipment
and process being used.
The existing operations group will support the
CMT for the following services during the construction phase:
| ■ | Environmental and permitting; |
| |
Osisko Development Corp.
NI 43-101 Technical Report
Feasibility Study for the Cariboo Gold Project |
|
| 24.1.7 | Pre-staffing and Training |
The care and maintenance program engaged at the
Bonanza Ledge site still employs key personnel that were involved in the management of the previous operations, and their experience on
site will be leveraged in the pre-staffing and training programs required before the start of commercial production. The objective will
be to develop a comprehensive set of Standard Operating Procedures (“SOPs”) to achieve the key performance indicators set
forth in the FS.
| 24.2 | Key Project Execution Activities |
The Project’s Execution Schedule comprehensively
integrates the various requirements of the closure plans of the previous operations as well as the deployment of the Project. More specifically,
the construction of the MSC site will be undertaken in such a way as to turn over key process components progressively, so that the path
to delivering first ore and, subsequently, first gold operational milestones are streamlined.
Earthworks excavation shall be sequenced to allow
steady flow of work fronts available for concrete works. Successful sequencing of the excavation flowing through to concrete will allow
for the concentrator building structural steel erection to commence ahead of schedule.
| 24.3 | Project Execution Schedule |
The Project execution plan and schedule have been
developed to a FS level. The execution plan and schedule will be further advanced and detailed during the next stages of the Project development.
Major Project milestones emerging from the Project’s
master schedule are shown in Table 24-1.
Table 24-1: Project key
milestones (preliminary)
| Activity |
Months
from start of
construction |
| Permitting |
| Receipt of BC Mines Act permits - Q4 2024 |
Complete |
| Receipt of BC Environmental Management Act Permits - Q4 2024 |
Complete |
| Main Construction Permits |
Complete |
| EA/Permit Amendment for Water Management Granted |
23 months |
| |
Osisko Development Corp.
NI 43-101 Technical Report
Feasibility Study for the Cariboo Gold Project |
|
| Activity |
Months
from start of
construction |
| Detailed Engineering |
| FMR |
Complete |
| MSC SCP |
Complete |
| Pit Reclamation |
Complete |
| WRSF Stage 1 |
Complete |
| MSC Pad Earthworks |
1 month |
| Bonanza Ledge WTP Upgrade |
2 months |
| Main Access Bridge |
3 months |
| Camp & Offices |
3 months |
| MSC WTP |
6 months |
| 69 kV/138 kV Powerline & Substation |
6 months |
| Ventilation & Dewatering |
6 months |
| Electrical & Communications |
9 months |
| Paste Backfill |
9 months |
| Crusher Stations |
12 months |
| Process Plant Mill Building |
15 months |
| WRSF Stage 2 |
24 months |
| Procurement |
| MSC SCP |
-6 months |
| WRSF Stage 1 |
2 months |
| MSC pad earthworks |
2 months |
| Ventilation |
2 months |
| Bonanza Ledge WTP Upgrades |
3 months |
| Lowhee Raise Construction |
3 months |
| Main Access Bridge |
3 months |
| Camp |
4 months |
| 69 kV/138 kV Powerline & Substation |
8 months |
| Offices |
9 months |
| Electrical & Communications |
9 months |
| Crusher Stations |
12 months |
| MSC WTP |
12 months |
| Paste Backfill |
12 months |
| |
Osisko Development Corp.
NI 43-101 Technical Report
Feasibility Study for the Cariboo Gold Project |
|
| Activity |
Months
from start of
construction |
| Pit Reclamation |
12 months |
| Process Plant Mill Building |
15 months |
| Construction |
| MSC Water Management Infrastructure |
5 months |
| Bonanza Ledge SCP Upgrade |
6 months |
| Bonanza Ledge WTP Upgrade |
6 months |
| Bonanza Ledge Water Management Infrastructure |
6 months |
| WRSF Stage 1 |
6 months |
| MSC SCP |
7 months |
| Main Access Bridge |
9 months |
| MSC Pad Earthworks |
10 months |
| MSC WTP Concrete Foundations |
11 months |
| Pit Reclamation |
15 months |
| Process Plant Mill Building Superstructure & Envelope |
16 months |
| Process Plant Mill Building Concrete Foundations & Slab |
17 months |
| MSC WTP – Structural, Mechanical, Piping, Electrical, Instrumentation |
17 months |
| 69 kV/138 kV Powerline |
19 months |
| 69 kV/138 kV Substation |
19 months |
| Crusher Stations |
24 months |
| First Ore & Process Plant C3 |
24 months |
| First Production Stoping |
24 months |
| Process Plant Mill Building – Mechanical, Piping, Electrical, Instrumentation |
24 months |
| Potable WTP & STP |
30 months |
| Full Production Reached |
34 months |
| WRSF Stage 2 |
36 months |
| |
Osisko Development Corp.
NI 43-101 Technical Report
Feasibility Study for the Cariboo Gold Project |
|
The Project’s execution schedule and costs
were based on front-end detailed engineering activities, which are necessary to de-risk the Project’s critical components, such
as allowing the company to purchase long lead items. The Project benefits from having permits in hand already. Therefore, detailed engineering
for specific project components, such as the Processing Plant, the waste rock storage facility at Bonanza Ledge, and the water treatment
plant at the MSC will need to be initiated by Q4 Year -3.
| 24.4.1 | Construction Labour |
The Project’s construction labour requirements
profile was derived from the Master Schedule.
The construction activities were planned in close
coordination with pre-production activities and with the aim of respecting the existing lodging facilities of the Ballarat Camp in Wells.
During construction execution, given the substantially higher construction labour requirements at the MSC, the construction activities
were planned to respect the new lodging capacity at Wells with the expansion of the Ballarat Camp from 76 to 264 rooms and the existing
satellite facilities.
Construction labour will be sourced through established
contractors on a regional level. When required, specific skills will be drawn from a wider area. The Project location benefits from its
relative proximity to large industrial centres with known skilled labour within the Cariboo region, such as Prince George, Quesnel, Williams
Lake and 100 Mile.
The following graph summarizes the lodging requirements
and capacities at the Ballarat Camp adjacent to the town of Wells, BC, and to the MSC.
| |
Osisko Development Corp.
NI 43-101 Technical Report
Feasibility Study for the Cariboo Gold Project |
|
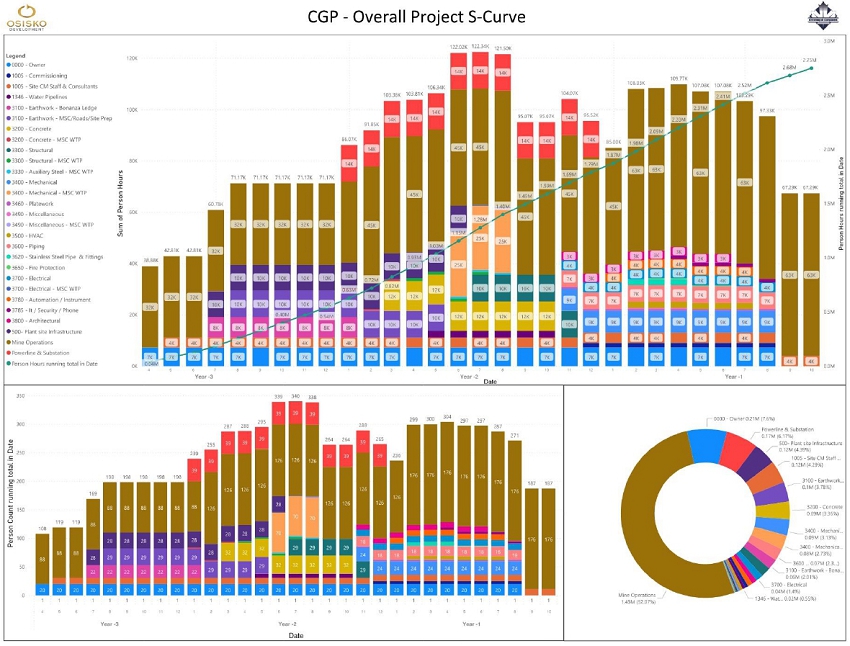
Figure 24-1: Ballarat Camp
lodging requirements (by department)
| |
Osisko Development Corp.
NI 43-101 Technical Report
Feasibility Study for the Cariboo Gold Project |
|
| 25. | Interpretation and Conclusions |
This NI 43-101 Technical Report Feasibility Study
for the Cariboo Gold Project (the “Report”) was prepared and compiled by BBA at the request of ODV, with the support of experienced
and competent independent consultants using accepted engineering methodologies and standards.
The Report provides a summary of the results and
findings from each major area of investigation including exploration, geological modelling, mineral resource, plant feed estimations,
mine design, metallurgy, process design, infrastructure, environmental management, waste and water management, capital and operating costs
and economic analysis.
This 2025 FS provides updates and changes from the last published FS
for the Cariboo Gold Property (2023). This FS incorporates several de-risking initiatives that include an accelerated development sequence,
streamlined processing, improved flowsheet design, and increased average stope size of the underground mine. The Project has obtained
the BC Mines Act and Environmental Management Act permits in Q4 2024 and is expected to be shovel-ready, subject to available
financing.
The mutual conclusion of the QPs is that the Project,
as summarized in this FS, contains adequate detail and information to support the positive economic outcome. The results of this FS indicate
that the Project is technically feasible and has financial merit at the base case assumptions considered. The individual conclusions are
summarized in the sections below.
| 25.1 | Data Verification and Mineral |
The Project combines the deposits of three contiguous
mountains separated by valleys: Cow Mountain (Cow and Valley), Island Mountain (Shaft and Mosquito) and Barkerville Mountain (Bonanza
Ledge, BC Vein, KL, and Lowhee). The QPs consider the 2025 Feasibility Mineral Resource Estimate (“2025 FS MRE”) to be reliable,
thorough, and based on quality data, reasonable hypotheses, and parameters.
The following conclusions are based on the QPs
detailed review of all pertinent information and the 2025 MRE results:
| ■ | The Mineral Resource Estimate has not been updated since the 2022 FS MRE
as there has been no new drilling; |
| ■ | The bulk sample at Lowhee has been completed and results are pending. The
bulk sample has been depleted from the 2025 FS MRE; |
| ■ | The 2025 MRE demonstrate the geological and grade continuities for all eight
gold deposits in the Cow-Island-Barkerville Mountain Corridor; |
| |
Osisko Development Corp.
NI 43-101 Technical Report
Feasibility Study for the Cariboo Gold Project |
|
| ■ | In an underground scenario, the Project contains an estimated Measured
Mineral Resource of 8,000 ounces of gold, an Indicated Mineral Resource of 1,604,000 ounces, and an Inferred Mineral Resource of 1,864,000
ounces. These Mineral Resources are exclusive of the Mineral Reserves; |
| ■ | To report the 2025 FS MRE for the Project, conceptual mining shapes were
used as constraints to demonstrate that the “reasonable prospects for eventual economic extraction” criteria is met; |
| ■ | Additional diamond drilling on multiple zones would likely increase
the Inferred Resources and it is uncertain, but reasonably expected, that Inferred Mineral Resources could be upgraded to Indicated Mineral
Resources with continued exploration. |
Table 25-1
displays the results of the 2025 FS MRE exclusive of Mineral Reserves for the Project for all eight deposits: Cow, Valley, Shaft, Mosquito,
KL, Lowhee, BC Vein, and Bonanza Ledge.
Table 25-1: Cariboo Gold Project 2025
FS MRE reported at a 1.8 g/t Au cut-off grade
(except for Bonanza Ledge reported
at a 3.5 g/t Au cut-off grade)
| Category |
Deposit |
Tonne |
Au
Grade |
Au
Ounce |
| '000 |
(Au g/t) |
'000 |
| Measured |
Bonanza Ledge |
47 |
5.06 |
8 |
| Indicated |
Bonanza Ledge |
32 |
4.02 |
4 |
| BC Vein |
1,057 |
3.00 |
102 |
| KL |
527 |
2.80 |
47 |
| Lowhee |
1,333 |
2.76 |
118 |
| Mosquito |
1,553 |
2.96 |
148 |
| Shaft |
6,121 |
2.92 |
575 |
| Valley |
2,718 |
2.70 |
236 |
| Cow |
3,991 |
2.91 |
374 |
| Total Indicated Mineral Resources |
17,332 |
2.88 |
1,604 |
| Inferred |
BC Vein |
596 |
3.17 |
61 |
| KL |
2,514 |
2.53 |
205 |
| Lowhee |
486 |
3.01 |
47 |
| Mosquito |
1,883 |
3.08 |
186 |
| Shaft |
7,457 |
3.44 |
826 |
| Valley |
2,470 |
3.01 |
239 |
| Cow |
3,368 |
2.78 |
301 |
| Total Measured and Indicated Mineral Resources |
17,380 |
2.88 |
1,612 |
| Total Inferred Mineral Resources |
18,774 |
3.09 |
1,864 |
| |
Osisko Development Corp.
NI 43-101 Technical Report
Feasibility Study for the Cariboo Gold Project |
|
Mineral Resource Estimate notes (Table 25-1):
| 1. | The independent and qualified persons for the Mineral Resources estimates, as defined by NI 43-101, are
Carl Pelletier, P.Geo., and Tessa Scott, P.Geo. of InnovExplo Ltd. The effective date of the 2025 FS MRE is April 22, 2025. |
| 2. | These Mineral Resources, exclusive of the reserves, are not Mineral Reserves as they do not have demonstrated
economic viability. |
| 3. | The Mineral Resource Estimate follows the 2014 CIM Definition Standards on Mineral Resources and Reserves
and the 2019 CIM Estimation of Mineral Resources and Mineral Reserves Best Practice Guidelines. |
| 4. | A total of 481 vein zones were modelled for the Cow Mountain (Cow and Valley), Island Mountain (Shaft
and Mosquito), Barkerville Mountain (BC Vein, KL, and Lowhee) deposits and one gold zone for Bonanza Ledge. A minimum true thickness
of 2.0 m was applied, using the gold grade of the adjacent material when assayed or a value of zero when not assayed. |
| 5. | The estimate is reported for a potential underground scenario at a cut-off grade of 1.8 g/t Au, except
for Bonanza Ledge at a cut-off grade of 3.5 g/t Au. The cut-off grade for the Cow, Valley, Shaft, Mosquito, BC Vein, KL, and Lowhee deposits
was calculated using a gold price of USD 2,400/oz; a USD:CAD exchange rate of 1.35; an underground mining cost of $66.3/t; a processing
and transport cost of $30.80/t; a G&A plus Environmental cost of $22.40/t; and a sustaining CAPEX cost of $45.6/t. No changes have
been applied for the Bonanza Ledge. The cut-off grade for the Bonanza Ledge deposit was calculated using a gold price of USD 1,700/oz;
a USD:CAD exchange rate of 1.27; a global mining cost of $79.13/t; a processing and transport cost of $65.00/t; and a G&A plus Environmental
cost of $51.65/t. The cut-off grades should be re-evaluated in light of future prevailing market conditions (metal prices, exchange rate,
mining cost, etc.). |
| 6. | Density values for Cow, Shaft, Lowhee, and BC Vein were estimated using the ID2 interpolation
method, with a value applied for the non-estimated blocks of 2.80 g/cm3 for Cow, 2.78 g/cm3 for Shaft, 2.74
g/cm3 for Lowhee, and 2.69 g/cm3 for BC Vein. Median densities were applied for Valley (2.81 g/cm3),
Mosquito (2.79 g/cm3), and KL (2.81 g/cm3). A density of 3.20 g/cm3 was applied for
Bonanza Ledge. |
| 7. | A four-step capping procedure was applied to composited data for Cow (3.0 m), Valley (1.5 m),
Shaft (2.0 m), Mosquito (2.5 m), BC Vein (2.0 m), KL (1.75 m), and Lowhee (1.5 m). Restricted search ellipsoids ranged
from 7 to 50 g/t Au at four different distances ranging from 25 m to 250 m for each deposit. High-grades at Bonanza
Ledge were capped at 70 g/t Au on 2.0 m composited data. |
| 8. | The gold Mineral Resources for the Cow, Valley, Shaft, Mosquito, BC Vein, KL, and Lowhee vein zones
were estimated using Datamine StudioTM RM 1.9 software using hard boundaries on composited assays. The OK method was used to
interpolate a sub-blocked model (parent block size = 5 m x 5 m x 5 m). Mineral Resources for Bonanza Ledge were estimated using GEOVIA
GEMSTM 6.7 software using hard boundaries on composited assays. The OK method was used to interpolate a block model (block
size = 2 m x 2 m x 5 m). |
| 9. | Results are presented in-situ. Ounce (troy) = metric tons x grade / 31.10348. Calculations used metric
units (metres, tonnes, g/t). The number of tonnes was rounded to the nearest thousand. Any discrepancies in the totals are due to rounding
effects. Rounding followed the recommendations as per NI 43-101. |
| 10. | The QPs responsible for this section of the technical report are not aware of any environmental, permitting,
legal, title, taxation, socio-economic, marketing, political, or other relevant factors that could materially affect the Mineral Resource
Estimate other than as disclosed in this Report. |
| |
Osisko Development Corp.
NI 43-101 Technical Report
Feasibility Study for the Cariboo Gold Project |
|
The Project encompasses a range of ground conditions,
from Very Poor to Good rock mass quality. A geotechnical classification system (Classes 1 to 5, with Class 1 representing competent
ground conditions and Class 5 representing the least competent ground) was used to categorize stopes. Stope dimensions were defined
for each class, typically 30 m in height, less than 8 m in width, and 15 m to 25 m in strike length, depending on
anticipated rock mass quality. Design guidelines for Classes 1 to 3 were developed using industry-accepted empirical methods, while guidelines
for Classes 3L and 4 were validated through a back-analysis of 21 stopes from the Bonanza Ledge Mine, demonstrating their applicability
under similar geotechnical conditions.
| 25.2.2 | Mine Design and Planning |
The Project is planned to produce
approximately 4,900 tpd of ore from narrow vein gold mineralization, utilizing a longitudinal retreat long-hole stoping method with
30-metre sublevel spacing and paste backfill. This mining method was selected based on the geometry of the deposit—including
its narrow width and sub-vertical orientation—as well as the metal content and anticipated ground conditions. The property has
a history of mining activity from 1877 to 1969, resulting in legacy excavations and locally variable ground conditions that may pose
geotechnical challenges. The current mine design encompasses a strike length of approximately 4,400 m and an average vertical extent
of 660 m, with the depth from surface varying significantly due to topographic relief. The total scheduled lateral development is
estimated at 179 km. The projected life of mine is 10 years. Underground development will be executed using a combination of Jumbo
drills and roadheader equipment, while production mucking and haulage will be carried out using 10-t LHD units and 51-t underground
trucks. At peak production, the underground workforce is expected to total 201 workers per rotation to support mining operations and
development activities. Total Mineral Reserves (i.e., Probable Reserves) have been estimated at 17.8 million tonnes
(“Mt”) at 3.6 g/t Au. Table 25-2 shows details of the Mineral Reserve Statement.
| |
Osisko Development Corp.
NI 43-101 Technical Report
Feasibility Study for the Cariboo Gold Project |
|
Table 25-2: Cariboo Gold
Statement of Mineral Reserves, effective date of April 10, 2025
| Category |
Tonnage |
Grade |
Contained Gold |
| (t) |
Au (g/t) |
(oz) |
| Proven |
| - |
- |
- |
- |
| Probable |
| Cow |
3,999,971 |
3.35 |
430,548 |
| Valley |
3,238,636 |
3.59 |
374,058 |
| Shaft |
8,548,295 |
3.72 |
1,021,599 |
| Mosquito |
1,105,370 |
3.94 |
140,102 |
| Lowhee |
923,162 |
3.52 |
104,491 |
| Total Proven & Probable |
17,815,435 |
3.62 |
2,070,798 |
Notes:
| 1. | The Qualified Person for the Mineral Reserve Estimate is Eric Lecomte, P.Eng. (InnovExplo, a subsidiary
of Norda Stelo). |
| 2. | The Mineral Reserve Estimate has an effective date of April 10, 2025. |
| 3. | Estimated at USD 1,915/oz Au using an exchange rate of USD 1.32:CAD 1.00, variable cut-off value
from 1.70 g/t to 2.0 g/t Au. |
| 4. | Mineral Reserve tonnage and mined metal have been rounded to reflect the accuracy of the estimate and
numbers may not add due to rounding. |
| 5. | Mineral Reserves include both internal and external dilution along with mining recovery. The average external
dilution is estimated to be 10.1%. The average mining recovery factor is 91.3% to account for mineralized material left in each block
in the margins of the deposit. |
The mineable inventory exists within 435 discrete
mineralized lenses spread across five zones, each requiring development access to accommodate the longitudinal extraction method. The
Project’s mine layout demonstrates a development-intensive stope access requirement and, therefore, it has a high development metre
per tonne of ore ratio.
These factors may pose a challenge to the successful
implementation of the mine plan given the challenging geotechnical parameters and intrinsically lower productivities of the mining method,
which will translate into a rapid production sequence. However, through diligent planning and adherence to proper work procedures, sufficient
active headings and stoping areas should meet daily production requirements.
| |
Osisko Development Corp.
NI 43-101 Technical Report
Feasibility Study for the Cariboo Gold Project |
|
| 25.2.3 | Mine Materials Handling and Paste Distribution System |
Underground
Material Handling
The primary and secondary underground jaw crusher
has been selected by Osisko Development based on ore size for the surface ore sorter that will feed the process treatment plant. The primary
crusher is a jaw crusher designed to reduce ore to a size less than 100 mm. The system is designed for 284 tph. All the systems have been
sized for a nominal production of 4,900 tpd.
The crushing system is completed by a network of ore silos and chutes,
to provide seamless rehandling of the material throughout the long lateral mine area.
Paste Fill Distribution Network
Paste network is essential to the Project as it
is the only permitted method to dispose of the mill flotation tailings. Therefore, a robust system with redundancy has been planned for
the operation.
The conclusions and recommendations that can be
drawn from the flow model analysis.
| - | The
entire mine can b e backfilled with a paste slump range of 263 mm to 254 mm (8 inch
to 10 inch) using two booster pump stations, one at 1275L for Lowhee mining area, and one
at 1230L for the Mosquito mining area; |
| - | If
the slump is reduced to 254 mm, the Paste Plant can fill the entire Shaft Zone of the mine; |
| - | With
a paste slump of 229 mm: |
| o | The
Shaft Zone can be filled, using the Mosquito Booster station; |
| o | The
Paste Plant can fill the Cow Zone. |
| - | With
a paste slump of 203 mm: |
| o | The
Cow Zone can be filled using the Lowhee Booster Station; |
| o | The
Valley Zone can be filled from the Paste Plant. |
| - | Both the Paste Plant surface pumps and booster station’s paste pump need to be rated for 120 Bar operating pressure; |
| - | DN200 pipe was selected as DN150 pipe’s friction factors were too high resulting in ether additional booster stations or requiring
filling significant amounts of the mine with 254 mm slump thereby necessitating increased binder consumption. |
| |
Osisko Development Corp.
NI 43-101 Technical Report
Feasibility Study for the Cariboo Gold Project |
|
| 25.3 | Mineral Processing and Metallurgical Testing |
The Project's process plant has been designed
with an integrated, efficient flowsheet that prioritizes high recovery rates. Located outside of Wells, at the Mine Site Complex, the
facility will employ a combination of gravity and flotation circuits to produce two gold concentrates.
Crushing operations will take place underground, with material being
conveyed from the secondary crusher to the surface ore sorter. The crushed material is then screened, allowing fines to bypass the tertiary
crusher and be sent directly to the mill feed bin. Coarser material will be separated into two feed streams for sorting. The sorted material
will then undergo tertiary crushing before being returned to the mill feed bin.
Within the grinding circuit, centrifugal gravity
separators have been incorporated to further enhance gold recovery. These separators are expected to recover a significant portion of
the gold during the gravity separation phase. After gravity separation, the milled product will be subjected to flotation to produce a
concentrate. All flotation tails will be disposed of as paste backfill into the underground.
The average metallurgical recovery per site is
reported in Table 25-3. Based on the test work results and the proposed mine plan at the time, the overall projected Au recovery is 92.6%.
The annual recovery projections are expected to differ from the average test work results according to the final mine proportions of ore
zones.
Table 25-3: Average Gold Recovery
and Process Step
| Process Step |
Average Au Stage
Recovery (%) |
| Gravity Au Recovery - LOM |
42.7 |
| Flotation Au Recovery - LOM |
49.9 |
| Overall Au Recovery - LOM |
92.6 |
The paste fill testing programs have provided
critical insights into the material properties and performance characteristics of the paste. Over the course of the mine’s life,
the average binder consumption is projected to be 4%.
The objective of the water management system is
to meet water supply requirements, protect infrastructure from interruptions and damage from flooding, and ensure discharge of surplus
water to the environment meets regulatory requirements.
| |
Osisko Development Corp.
NI 43-101 Technical Report
Feasibility Study for the Cariboo Gold Project |
|
A site-wide water balance model was developed
to simulate the proposed water management system performance. Water balance results showed that WTP demand will be highest during spring
snowmelt. Summer and fall storm events may require the WTP to operate at maximum capacity to manage runoff. During winter, when runoff
is minimal, inflow primarily originates from mine dewatering, resulting in steady treatment rates.
The system will be designed to manage extreme
wet periods up to the EDF. When combined storage exceeds a threshold level, dewatering from the MSC underground will cease until pond
volumes are reduced. After EDF conditions subside, the accumulated water will be drained from the MSC underground as capacity becomes
available at the MSC WTP.
The Mine Site water
quality model (“WQM”) was developed to predict influent water quality and inform water treatment design. The following
exceedances of the draft permit limits are predicted in influents of WTP for following mine phases:
| ■ | Construction and mine development: The Bonanza Ledge WTP influent is predicted
to exceed the Bonanza Ledge discharge limits for total suspended solids, sulphate, total and un-ionized ammonia, nitrate nitrogen, nitrite
nitrogen, total aluminum, total arsenic, total chromium, total cobalt, total iron, total lead, total manganese, total nickel, total silver,
total uranium, total zinc, dissolved cadmium, dissolved copper, and dissolved iron. |
| ■ | Mine production and ore processing: The MSC WTP influent is predicted to
exceed the MSC discharge limits for total suspended solids, un-ionized ammonia, nitrate nitrogen, nitrite nitrogen, total aluminum, total
arsenic, total chromium, total cobalt, total iron, total lead, total manganese, total mercury, total nickel, total phosphorous, dissolved
copper dissolved iron and dissolved zinc. |
| ■ | Closure: The MSC WTP influent is predicted to exceed the MSC discharge limits
for total suspended solids, chloride, sulphate, nitrite nitrogen, total aluminum, total arsenic, total chromium, total cobalt, total iron,
total lead, total manganese, total mercury, total nickel, total phosphorous, dissolved copper, and dissolved iron. |
| ■ | Post-closure: The MSC WTP influent is predicted to exceed the MSC discharge
limits for total suspended solids, total aluminum, total chromium, total cobalt, total iron, total manganese, total mercury, total nickel,
total phosphorous, dissolved copper, and dissolved iron. |
These WTP concepts, in Section 25.6.3, have been designed to treat
to levels such that the discharge effluent meets all water quality discharge requirements, as set out in the permit conditions.
| |
Osisko Development Corp.
NI 43-101 Technical Report
Feasibility Study for the Cariboo Gold Project |
|
The Project’s surface infrastructure and
services are designed to support the operations at the MSC and Bonanza Ledge Site. The Project also includes offsite infrastructure, such
as a new 69 kV TL between the Barlow substation, near Quesnel, BC, and the MSC.
The Project will be comprised of three different
areas, together referred to as the Mine Site:
| ■ | The
MSC, near the District of Wells, BC and build on a historic mining site that has been abandoned.
At the MSC, there will be the new Process Plant, new Water Treatment Plant, water management
infrastructure, main substation, and ancillary facilities; |
| ■ | The
Bonanza Ledge Site will include the Waste Rock Storage Facility, and will use the water treatment
infrastructure for the first 3 years of the Project; |
| ■ | Offsite
infrastructure to support the operations of the Project. |
A distance of 3.5 km separates the MSC from the
Bonanza Ledge site.
| 25.6.1 | Mine Site Complex Operational |
The Bonanza Ledge
site has existing infrastructure that includes contact water collection channels, a water treatment plant to the south of the WRSF, an
overburden stockpile, a WRSF, contact water collection ponds and sumps; and an existing modular office building will be reused
for the operation at Bonanza Ledge. Additionally, the existing workshop, warehouse, electrical distribution infrastructure, and fuel storages
(diesel and propane) will be reused for the Project.
The MSC has existing access roads, bulk explosives
storage and magazines, and IT and telecommunications services, such as an existing communications tower.
The key proposed infrastructure to meet the Project
needs are described below:
| ■ | Raw
water well and potable water treatment plant; |
| ■ | Fuel
Farm – diesel, gasoline, propane; |
| |
Osisko Development Corp.
NI 43-101 Technical Report
Feasibility Study for the Cariboo Gold Project |
|
| 25.6.2 | Water
Management Infrastructure |
The design of the water management infrastructure
– Inclusive of contact and non-contact water channels, culverts, French drains, dissipation sumps, and sediment control ponds –
was completed to meet robust performance criteria and sized to adequately manage runoff, minimize flood risks and ensure environmental
protection. The design criteria used for the water management infrastructure includes considerations for climate change. Where possible,
existing water management infrastructure is reused and upgraded, as needed.
Overall, the water infrastructure at the MSC and
Bonanza Ledge areas supports the site’s water management strategy and achieves the following objectives:
| ■ | Intercept
and divert non-contact runoff; |
| ■ | Collect
and manage contact water through water treatment. |
| 25.6.3 | Water
Treatment Facilities |
Water treatment infrastructure is a critical component
of the Project, supporting environmental compliance for discharge, operational water reuse, and closure planning. Two treatment facilities
have been designed to manage contact water and mine dewatering flows: a temporary system at Bonanza Ledge and a permanent facility at
MSC. Each system reflects the phased development schedule and site-specific hydrological and regulatory conditions.
The Bonanza Ledge WTP is an interim system intended
to support early works and underground development (Stage 1). It includes a main WTP with chemical precipitation using barium hydroxide,
clarification, multimedia filtration, and a containerized membrane treatment system. The membrane system comprises ultrafiltration (“UF”)
followed by nanofiltration (“NF”) or reverse osmosis (“RO”), with final membrane selection remaining flexible
at the time of final equipment specifications. The current design favours NF to avoid the need for downstream remineralization or post-treatment
conditioning. A small-scale MBBR unit is also in service at Bonanza Ledge, used to supplement nitrogen removal locally, but it is not
rated for full plant flow and is not part of the main Bonanza Ledge WTP.
The MSC WTP, scheduled for commissioning in Stage
2, will provide long-term treatment capacity for the full site. Designed for up to 800 m³/h, it includes HDS precipitation,
moving bed biofilm reactors (MBBRs) for ammonia and nitrate removal, and polishing filtration. Treated effluent will be reused where possible,
with surplus water discharged to Jack of Clubs Lake via a submerged diffuser. The MSC WTP facility is designed to remain operational through
active closure and into post-closure care.
Both systems incorporate features to handle seasonally variable flow,
cold temperatures, and complex influent chemistry. Redundancy, heat tracing, and modularity are integrated to ensure resiliency and compliance
under all operating scenarios. The water treatment strategy is fully embedded within the Project’s overall water management plan
and supports key environmental performance objectives and meets permit requirements.
| |
Osisko Development Corp.
NI 43-101 Technical Report
Feasibility Study for the Cariboo Gold Project |
|
| 25.6.4 | Water
Treatment Conveyance Infrastructure |
A range of submersible and centrifugal pumps,
varying in size and capacity, will be implemented to meet site-specific seasonal flow rates and pressure requirements. Larger pumps were
used for high-volume fluid transfer and dewatering operations, while smaller units provided precise control in lower-demand areas. This
approach allowed for efficient, scalable pumping solutions adaptable to changing operational conditions. Pumps will be run on VFDs to
allow for flow variation.
A range of HDPE pipe diameters and pressure ratings were utilized to
match the varying flow rate and pressure requirements across the different pipeline systems. Pipe sizes were selected based on hydraulic
performance criteria, ensuring optimal flow velocity and minimal head loss, while pressure classes were chosen to withstand the specific
operating conditions of each pipeline segment. This approach ensured reliability, efficiency, and long-term durability of the piping network
under diverse service demands and is adequate for handling the water anticipated in the Project.
| 25.6.5 | Power
Supply (Transmission Line and Substation) |
The transmission line and mine site substation will provide the required
electrical power at 69 kV, based on what is available at the Barlow Substation. The mine site substation will be designed to 138 kV
to accommodate future loads but will initially operate at 69 kV, which is sufficient to service the mining operations laid out in this
2025 FS. The transmission line will require a step-up substation to meet the future case. The line will be built and operated by a third
party.
| 25.6.6 | Waste
Rock Storage Facility |
A geotechnical slope stability assessment was performed on the proposed
WRSF representing long-term conditions, as well as sensitivities considering seismic loading conditions and an increased water table.
Modelling inputs were determined based on previous investigations, laboratory testing, instrumentation data and experience. Based on modelling
results, the stability of the proposed WRSF meets the minimum FoS requirements for all scenarios and has sufficient capacity for the waste
planned for surface storage in this 2025 FS.
| |
Osisko Development Corp.
NI 43-101 Technical Report
Feasibility Study for the Cariboo Gold Project |
|
| 25.7 | Environmental
Studies |
The environmental baseline work completed to date,
in addition to ongoing environmental monitoring requirements in the EAC, Mines Act permit, and Environmental Management Act
permits, is aligned with this FS update. The feasibility study follows BC regulations and permits, pending future permit amendments. ODV
has provided a closure plan and posted the required reclamation liability security bond with the BC Minister of Finance. Updates to the
closure plan and estimated closure costs will proceed through the permit amendment processes, planned to follow this feasibility plan
update.
| 25.8 | Market
Studies and Contracts |
The Project will produce two saleable gold products:
gold doré bars (produced from the gravity concentrate) and a high-grade flotation concentrate from a single processing facility
in Wells, at the MSC. Doré bars will be sold and refined through a certified North American refinery, with numerous options available
in both Canada and the United States.
In parallel, a high-grade flotation concentrate
ranging between 110-150 g/t and averaging ~133 g/t Au over the LOM, estimated at approximately 65 tpd to 70 tpd, will also be
produced. The concentrate input parameters for the sale of the flotation concentrate were based on a preliminary purchase offer agreement
established with a well-known international metals trading firm. The flotation concentrate will be bagged and transported by truck from
the MSC in Wells to the Port of Vancouver, where it will be shipped via ocean freight to a smelting partner.
No market studies have been conducted by ODV or
its consultants in relation to the gold doré and flotation concentrate that will be produced by the Project.
In the past, ODV’s Barkerville Gold Mines
worked with an American refiner; there are no refining agreements, sales contracts or other contracts currently in place for the gold
doré. The doré to be eventually produced by the Project will be shipped to a North American precious-metals refinery for
recovery of the gold into high purity bars meeting the minimum LBMA delivery standards. There is a preliminary offer in place to purchase
the gold concentrate with a well-known international metals trading firm.
There is a significant contract /agreement with
Sandvik Financial Services Canada for the Roadheader Capital Lease.
| |
Osisko Development Corp.
NI 43-101 Technical Report
Feasibility Study for the Cariboo Gold Project |
|
| 25.9 | Execution and Construction |
The Project construction and execution is structured
allowing for a controlled and scalable development timeline. Work will commence at the Bonanza Ledge site with the mine development and
the construction of the SCP and WRSF facilities. While building these facilities additional rooms will be installed to increase capacity
to support the construction of the Project.
Once additional rooms are made available, focus
will be on the full development of the MSC area. Major construction activities will include the excavation and concrete work, process
plant construction and a permanent WTP will be installed to meet the requirement of the mine development.
A new 69KV transmission line will be constructed
from the Barlow substation near Quesnel to the MSC area. This work will start in Year -3, to be completed in time to support the commissioning
of the process plant of the Project.
Construction planning emphasizes modular and
climate resilient infrastructure, reuse of existing structures where feasible and integration with long term closure environmental management
plans. Execution is paced to align with regulatory approvals and permit amendments, allowing the project to transition smoothly from
construction to sustained production.
| 25.10 | Capital and Operating Costs |
The total capital costs (initial, sustaining and closure) for the Project
were estimated at $1,406M. The initial capital costs were estimated at $881M. Sustaining capital costs were estimated at $426M. The total
initial capital costs include a contingency of $72M, which represents 16.5% of initial capital, and was selected by ODV based on the Monte
Carlo simulation (P50). Tight project controls will be required to execute the Project within the allocated budget. Closure costs net
of salvage value was evaluated at $99M.
The overall capital cost estimate developed in
this study generally meets the AACE Class 3 requirements. Items such as sales taxes, land acquisition, permitting, licensing, feasibility
studies, and financing costs are not included in the cost estimate.
The Project capital cost summary is outlined in
Table 25-4.
| |
Osisko Development Corp.
NI 43-101 Technical Report
Feasibility Study for the Cariboo Gold Project |
|
Table 25-4: Capital cost
summary (1)(2)
| Area |
Cost area Description |
Initial capital cost ($M) |
Sustaining capital cost ($M) |
Total cost ($M) |
| 000 |
Surface Mobile Equipment |
-- |
-- |
-- |
| 200 |
Underground Mine |
313 |
397 |
710 |
| 300 |
Water and Waste Management |
98 |
24 |
123 |
| 400 |
Electrical and Communication |
19 |
0 |
19 |
| 500 |
Surface Infrastructure |
42 |
1 |
43 |
| 600 |
Process Plant - Wells |
180 |
0 |
180 |
| 700 |
Construction Indirect Costs |
95 |
0 |
95 |
| 999 |
Contingency (16.5%) |
72 |
4 |
76 |
| |
Total |
819 |
426 |
1,246 |
| - |
Capitalized Revenue |
-150 |
0 |
-150 |
| - |
Capitalized Operating Costs |
212 |
0 |
212 |
| - |
Salvage Value |
0 |
-36 |
-36 |
| - |
Site Reclamation and Closure |
0 |
135 |
135 |
| |
Project Total |
881 |
525 |
1,406 |
| (1) | Does not include Pre-final investment decision costs of $39M. |
| (2) | Totals may differ slightly due to rounding. |
The OPEX is based on a combination of experience,
site data, reference projects, budgetary quotations, and factors as appropriate with a feasibility study. The target accuracy of the operating
cost is +/-15%. The average operating cost over the 10-year mine life is estimated to be $110.7 per tonne mined. Table 25-5 presents the
breakdown of the projected per-tonne mined operating costs for the Project.
| |
Osisko Development Corp.
NI 43-101 Technical Report
Feasibility Study for the Cariboo Gold Project |
|
Table 25-5: Operating cost summary
| Area |
Cost Area Description(1) |
LOM Unit Cost
($/t processed) |
LOM
($M) |
Annual Average
Cost ($M/y) |
Average
LOM ($/oz) |
OPEX
(%) |
| 200 |
Underground Mining |
62.3 |
1,080 |
98 |
570 |
56 |
| 300 |
Water and Waste Management |
5.0 |
86 |
8 |
45 |
4 |
| 400 |
Electrical Transmission Line |
4.9 |
86 |
8 |
45 |
4 |
| 600 |
Processing |
23.2 |
403 |
37 |
213 |
21 |
| 800 |
General and Administration |
15.4 |
266 |
24 |
141 |
14 |
| |
Total |
110.7 |
1,921 |
175 |
1,014 |
100% |
| (1) | Underground mining, water and waste management, processing and G&A operating cost do not include a
portion of the expenditures which have been capitalized – refer to Section 21.1.4.10. |
| (2) | The total capitalized operating costs amount to $212M and are not included in the operating cost summary. |
It is anticipated that 613 personnel (administration,
supervision, operations and maintenance [“O&M”]) will be required at the peak of the construction period, and 525 will
be required for the Project during peak operations. At the peak of operations there will be 112 G&A personnel, 310 underground mine
personnel, and 88 process plant personnel.
| 25.10.1 | Indicative Economic Results |
The financial analysis
performed as part of this feasibility study using the base case assumptions results in an after-tax NPV 5% of $943M and an internal rate
of return of 22.1% (unlevered) (base case exchange rate1.00:0.74 CAD:USD . There is a $1,577M cumulative after-tax LOM Free Cash
Flow (“FCF”), and the payback period, from start of commercial production, is 2.8 years, over the planned mine life of 10 years.
The Project was subject to the following tax regimes:
| ■ | The Canadian Corporate Income Tax system, consisting of the federal income
tax (modelled at a rate of 15%) and the provincial (British Columbia) income tax (modelled at a rate of 12%); |
| ■ | The British Columbia Mineral Tax, which was modelled using net current proceeds
rate of 2% and a net revenue tax rate of 13%. |
The financial analysis
summary (pre-tax and after-tax) is shown in Table 25-6:
| |
Osisko Development Corp.
NI 43-101 Technical Report
Feasibility Study for the Cariboo Gold Project |
|
Table 25-6: Financial analysis
summary (pre-tax and after-tax)
| Description |
Unit |
Value |
| Pre-tax |
Net Present Value (0% discount rate) |
$M |
2,216.1 |
| Net Present Value (5% discount rate) |
$M |
1,371.4 |
| Internal Rate of Return |
% |
26.5 |
| Simple Payback Period |
year |
5.6 |
| Payback Period (after start of operations) |
year |
2.6 |
| After-tax |
Net Present Value (0% discount rate) |
$M |
1,577.4 |
| Net Present Value (5% discount rate) |
$M |
943.5 |
| Internal Rate of Return |
% |
22.1 |
| Simple Payback Period |
year |
5.8 |
| Payback Period (from commercial production) |
year |
2.8 |
The total taxes and duties over the life of the
Project amount to $640.1M, total AISC amount to US$1,157/oz, with total royalties over the life of $291.7M.
Sensitivity analyses
were performed on both NPV, and IRR, shown in Figure 25-1 and Figure 25-2 on an after-tax basis. The sensitivity analysis
reveals that the USD:CAD exchange rate and gold price have the most significant influence on both NPV and IRR compared to the other parameters,
based on the range of values evaluated. After the USD:CAD exchange rates and gold price, NPV was most impacted by changes in operating
costs and then, to a lesser extent, capital costs. After the USD:CAD exchange rate and gold price, the Project’s IRR was most impacted
by variations in capital costs and, to a lesser extent, by the operating costs. Overall, the NPV of the Project is positive over all of
the range of values used for the sensitivity analysis.
Based on this analysis, the Project is sufficiently robust (from an
economic perspective) to support advancing to detailed engineering and construction financing, as per the recommendations set out in Chapter
26.
| |
Osisko Development Corp.
NI 43-101 Technical Report
Feasibility Study for the Cariboo Gold Project |
|
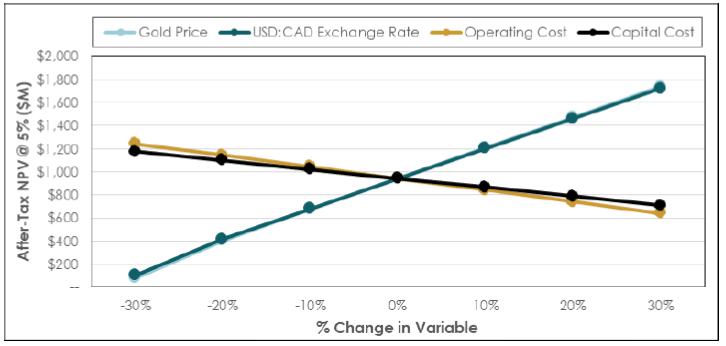
Figure 25-1: Sensitivity
of the net present value (after-tax) to financial variables
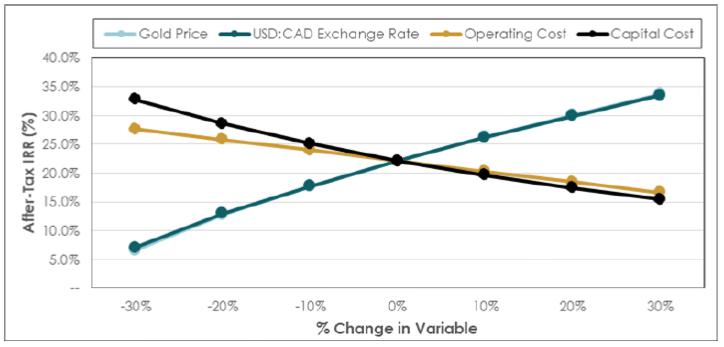
Figure 25-2: Sensitivity
of the internal rate of return (after-tax) to financial variables
| |
Osisko Development Corp.
NI 43-101 Technical Report
Feasibility Study for the Cariboo Gold Project |
|
| 25.11 | Project Risks and Opportunities |
As with most mining projects, there are risks that could affect the
economic viability of the Project. Many of these risks are based on a lack of detailed knowledge and can be managed as more sampling,
testing, and design are conducted during the detailed engineering phase. Table 25-7 identifies what are currently deemed to be the
most significant internal project risks, potential impacts, and possible mitigation approaches that could affect the technical feasibility
and economic outcome of the Project.
External risks are, to a certain extent, beyond
the control of the Project proponents and are much more difficult to anticipate and mitigate, although, in many instances, some risk reduction
can be achieved. External risks are factors such as the political situation in the Project’s region, metal prices, exchange rates,
and government legislation. These external risks are generally applicable to all mining projects. Negative variance to these items from
the assumptions made in the economic model would reduce the profitability of the mine and the mineral resource estimates.
There are significant
opportunities not included that could improve the economics, timing, and/or permitting potential of the Project. The major opportunities
that have been identified at this time are summarized in Table 25-8, excluding those typical to all mining projects, such
as changes in metal prices, exchange rates, etc. Further information and assessments are needed before these opportunities should
be included in the Project economics.
| |
Osisko Development Corp.
NI 43-101 Technical Report
Feasibility Study for the Cariboo Gold Project |
|
Table 25-7: Project risks
(preliminary risk assessment)
| Area |
Risk Description and Potential Impact |
Mitigation Approach |
| Geology and Mineral Resources |
If the geological interpretations and assumptions (geometry and continuity of mineralized zones) used to generate the estimation domains are inaccurate, then there is potential lack of gold grade continuity. |
Continue infill drilling to upgrade a larger proportion of the mineral
inventory to Indicated and Measured resources to have an overall better resolution of the deposits.
Complete evaluation of the bulk sample on Lowhee and continue with
the program. Complete a bulk sample on the deposits (Cow, Mosquito, Shaft, Valley, and KL) to have reconciliation data to improve the
confidence in the block model and the overall understanding of the deposits. |
| If technical knowledge of the historic mine infrastructures is incomplete, then this deficiency could lead to local inaccuracy of the mineral resource. |
Conduct drilling and underground surveying to validate void locations throughout the historic underground workings. |
| Underground Mine and Geotechnical |
Ground conditions may be worse than anticipated, leading to dilution, lower grades, and delays. |
Collect additional geotechnical data during early development. |
| Labour shortages could limit the availability of skilled workers, increasing costs and reducing performance. |
Begin recruiting early and implement internal training programs. |
| Unrecorded historical workings may be encountered, leading to delays and higher paste fill costs. |
Conduct probe drilling, monitor water, and add dewatering contingencies. |
| Insufficient ventilation airflow delays development before the primary system is commissioned. |
Phase ventilation installation with development; prioritize critical headings; use auxiliary fans/ventilation raises. |
| Target zone production rates may not be achieved, increasing dilution and cost. |
Develop ahead of production and open multiple mining zones. |
| Roadheader performance is below expectations, delaying development and increasing costs. |
Implement and closely monitor adherence to work procedures, prepare Jumbo contingency and confirm contractor/equipment availability. |
| Automated mucking underperforms, requiring manual operation and raising labour costs. |
Conduct full automation testing during pre-production. |
| Two-pass (Doyon) method proves less effective, reducing recovery. |
Review past case studies and establish a validated operating protocol. |
| |
Osisko Development Corp.
NI 43-101 Technical Report
Feasibility Study for the Cariboo Gold Project |
|
| Area |
Risk Description and Potential Impact |
Mitigation Approach |
| |
The dewatering strategy for historic underground workings has not been evaluated in detail, and significant uncertainty remains regarding the exact volume and location of these excavations. Additionally, pumping rates will be constrained until the permanent water treatment plant is commissioned. These factors could delay mine development and execution of the mine plan. |
Conduct detailed hydrogeological and mine void modelling to refine dewatering estimates. Initiate early mapping and verification drilling to better define historic excavation boundaries. Evaluate the possibility of accelerating the construction schedule of the permanent water treatment facility and consider temporary water management solutions to support early mine development phase. |
| Dewatering of old workings takes longer, affecting the Project schedule. |
Increase pumping capacity and build buffer time into the schedule. |
| Pressurized water or localized flooding near flooded old workings may cause safety incidents or flooding. |
Use systematic cover/probe drilling; monitor water pressure; implement reinforced water control and emergency protocols. |
| Paste backfilling of old voids takes longer than planned, delaying development. |
Develop alternate mining sequences and maintain scheduling flexibility. |
| No void is available underground for paste backfill, causing possible production delay |
Permit emergency surface containment; align backfill and stope schedules; develop underground buffer storage. |
| Plant tailing (paste backfill) volume exceeds available UG voids, potentially lowering ore sorter recovery. |
Initiate permitting for surface deposition; refine void model; maintain flexibility in mining/backfill schedules. |
| |
|
| Electrical |
Power Exceedance |
Due to inaccurate load estimations, mitigated by the 138 kV design of the substation and transmission line, power factor correction and scalable distribution equipment. |
| Site infrastructure |
Mine waste rock quality impacting the quality of crushed aggregate to be utilized for engineered fill on the MSC pad infrastructure. |
Utilizing screening to separate mine waste rock; local quarry material availability in Quesnel. |
| Inability to utilize cut material at the MSC or the construction of civil infrastructure. |
Further define geochemical characterization of the MSC materials. |
| Final potable water supply location to be confirmed and permitted. |
Complete investigations to select final location and complete permit application. |
| Willow River Bridge foundation: its abutment foundations consist of weak soils. |
Consider bridge foundation using pilings. Artesian conditions encountered while executing geotechnical drilling on the north side of Willow River. Strategy to be developed to investigate this area without environmental issues. |
| |
Osisko Development Corp.
NI 43-101 Technical Report
Feasibility Study for the Cariboo Gold Project |
|
| Area |
Risk Description and Potential Impact |
Mitigation Approach |
| |
Site clearing and levelling may encounter historic contamination and will require removal of historic structures, including headframe, tanks, and concrete foundation materials. |
Dismantle structural elements and disposal of materials. |
| Surface water quality: MSC area foundation materials include historic waste rock and mill tailings and known groundwater contamination from metal leaching. |
Establish a comprehensive water management plan during construction and integrate it in the final design of facilities and constructability reviews. |
| Water Management |
Holding back (i.e., slowing or stopping pumping) mine dewatering during an extreme wet event results in an unacceptable interruption to production. |
Seek alternative flood management methods such as increased WTP capacity or increased pond storage capacity on surface. |
| The access road non-contact water channels at MSC area are constructed in the legacy tailings, potentially causing instability in the channels or affecting the water quality of the water that collects in the channels |
Construct the channels above ground and reinforce the channel invert. Use of liners to prevent seepage from legacy tailings. |
| Mineral Processing and Metallurgy |
The ore sorter mass pull is lower than the design value. The amount of ore sorter waste sent to UG will then increase. |
A bulk sample will be collected and pilot scale test work will help validate assumptions. Adjustments can be done in the ramp-up period. |
| Due to delays in stope development, there is a risk that no stope will be available in the underground mine to place tailings, which could lead to production delays. |
Implement emergency tailings storage at the mill to manage temporary lack of underground stope availability. Adjust processing strategy to increase ore rejection, thereby reducing the volume of tailings generated. |
| Fluctuations in concentrate volume from the flotation circuit may result in increased transportation and smelting costs. This is primarily due to the recovery model not being based on sulphur, compounded by the absence of sulphur grades in the block model, which limits the accuracy of concentrate volume predictions. |
Sulphur assays will be conducted during mining operations to improve the understanding of sulphur distribution enabling future updates recovery model. |
| The vacuum filtration of the flotation tailings is less efficient than anticipated. The binder consumption for the lower tailings solid percentage will then increase for compensation. |
Do a test program for paste backfill recipes.
Use standard operating procedures to help ensure efficient operation
of filter. |
| |
Osisko Development Corp.
NI 43-101 Technical Report
Feasibility Study for the Cariboo Gold Project |
|
| Area |
Risk Description and Potential Impact |
Mitigation Approach |
| Geochemistry and Water Quality Predictions |
The underground mine water quality is not represented by groundwater samples collected from deep mine workings, and then the influent predictions may not be representative, and the water treatment design may need to be re-evaluated. |
Collect deep mine water samples and use sensitivity analysis for “mine pool” source term to define parameters that may affect the WTP design. |
| Source terms change due to model updates resulting in different water quality predictions, which may lead to re-evaluation of the water management, WTP design and closure plan. |
Use sensitivity analysis to account for uncertainties and run different scenarios for water management and closure to address the most sensitive parameters of concern. |
| The dewatering of the underground will result in the formation of downward hydraulic gradients, and then the existing contamination in the near surface aquifers might potentially migrate into the underlying aquifers. |
Update the groundwater quality model to evaluate potential impacts and mitigations. |
| The reflooding of the underground at closure alters the quality of groundwater, including the discharges to receiving environment and potentially the Wells aquifer, which is used by the community of Wells for drinking water. |
Refine the groundwater quality model to evaluate potential impacts and mitigations for closure/post-closure. |
| Water Treatment |
Ammonia and Nitrate concentration fluctuations |
The MBBRs will ideally operate throughout the year without any interruptions. If hydraulic and/or nitrogen loading to the system is lower than expected, there is potential to starve the biological community in the MBBR’s. A supplementary source of nitrogen such as urea or calcium nitrate may be used to maintain a minimum concentration of nitrogen in the source water or recycled effluent. This will ensure the bacteria will remain active throughout the year. |
| Extreme winter freezing conditions at the mines geographical location can affect operations. |
All the pipelines exposed to outdoor conditions will be insulated and heat traced. The process tanks are insulated to prevent excessive heat loss. A heating system will need to be provided on a temporary basis or permanent to prevent freezing conditions in the MBBRs. Blowing air and agitation will be maximized to prevent freezing and media clogging. |
| High solids loading to the WTP from mine workings |
Ensure that loading of solids from mine workings is managed using correctly designed sumps, flocculation systems etc. to ensure that excess grit and solids is not delivered to the WTP. |
| |
Osisko Development Corp.
NI 43-101 Technical Report
Feasibility Study for the Cariboo Gold Project |
|
| Area |
Risk Description and Potential Impact |
Mitigation Approach |
| |
Plant upset and restart |
Operation spares and design allowances are made for any process upsets and mechanical failure. This WTP is designed for 95% operational availability. Standard operational procedure will be in place to plan for WTP restarts as well as water management. |
| Lack of availability of critical reagents. |
Chemical reagents will be stored with minimum 14 days of storage to accommodate any availability concerns. |
| Construction (Costs and Schedule) |
Inability to utilize cut material at the MSC or the construction of civil infrastructure. |
Sourcing material from the Quesnel area |
| Inability to utilize cut material at the MSC or the construction of civil infrastructure. |
Further define geochemical characterization of the MSC materials. |
| Noise constraint is limiting the work at the MSC area to single shift until building is enclosed |
Actual plan is considering the site conditions. |
| Labour shortages could limit the availability of skilled workers, increasing costs and reducing performance. |
Actual plan is considering bringing labour from outside the area. |
| Environmental, Permitting and Social License |
Schedule risk - changes proposed to the Project will require amendments to existing certificates and permits. Timelines for regulatory processes may be lengthy and could impact construction and operational schedule targets. |
Proceed with construction of approved activities as per current authorizations.
Utilize regulatory mechanisms (notice of departures) as appropriate
to authorize changes as necessary.
Discuss project changes to key regulators, first nations and other
stakeholders to develop a streamlined regulatory process schedule.
Prepare and submit amendment applications in line with required processes
under BC EAO, the BC Ministry of Mining and Critical Minerals, and the BC Ministry of Environment and Parks well in advance of schedule
requirements. |
| Compliance risk - implementation of water treatment technology is required to achieve water discharge limits within the permits. |
Robust WTP design.
Establish OMS manuals and SOPs to support compliance with required
limits. |
| Rehabilitation and Closure |
Compliance risk – water quality predictions at closure may not meet discharge limits. |
Update modelling and mitigation planning for long term water quality management. |
| |
Osisko Development Corp.
NI 43-101 Technical Report
Feasibility Study for the Cariboo Gold Project |
|
Table 25-8: Project opportunities
| Area |
Opportunity Explanation |
Benefit |
| Geology and Mineral Resources |
Surface and underground definition diamond drilling: Potential to upgrade Inferred resources to the indicated category. |
Adding Indicated resources and conversion to reserves increases the
economic value of the mining Project. |
| Surface exploration drilling: Potential to identify additional Inferred resources. |
Adding Inferred resources and subsequent conversion to Indicated and/or
Measured and then reserves, would increase the economic value of the mining Project. |
| Geotechnical and Underground Mine |
Assessing the economic viability of extracting ore from geotechnical Class 5 category using a selective mining method, such as cut-and-fill |
Increase mineral resource recovery and enhance project value, particularly in areas previously considered uneconomic due to ground stability constraints. |
| Further evaluation of the potential to merge stopes associated with closely spaced parallel lenses may lead to increased operational efficiency. |
By consolidating these mining areas, the Project could benefit from reduced development and production costs through economies of scale and more efficient use of equipment and manpower. |
| Ground conditions are better than anticipated based on the geotechnical model. This could impact schedule because of a reduction in additional support / rehab being required. |
Less ground support than estimated will be required, and larger stopes
may be possible, reducing cost and improving the schedule. |
| Geochemistry and Water Quality Predictions |
If exploration drilling is triggered, collect deep mine water samples from historical working to reduce uncertainty related to “mine pool” water quality. |
Reduction of uncertainty in “mine pool” water quality will result in better predictions of influent concentrations improving the WTP design. |
| While there is time, update the groundwater quality model to evaluate potential impacts and mitigations on receptors. |
Groundwater quality update is required to meet draft permit requirements, evaluate potential impacts and mitigations. |
| On-going metallurgical testing allows to prepare paste backfill casts and evaluate metal leaching rates from cemented backfill. |
Knowing leaching rates from cemented backfill reduces uncertainty in prediction of mine water quality. |
| Mineral Processing and Metallurgy |
Dispose of rougher flotation tailings co-mingled with the ore sorter and development waste on surface. |
Increase flexibility in the ore sorter mass pull by removing the constraint that requires all tailings to be placed under the grouped end, thereby improving overall gold recovery |
| Test work showed strong potential for cyanide leaching of the flotation concentrate |
Opportunity to eliminate smelting charges and concentrate transportation costs |
| |
Osisko Development Corp.
NI 43-101 Technical Report
Feasibility Study for the Cariboo Gold Project |
|
| Area |
Opportunity Explanation |
Benefit |
| Water Treatment |
Underground water inflow potentially overestimated |
Opportunity to reduce design and costs associated. |
| Simplify MSC WTP water treatment system at Stage 2 if water quality is better than model predictions |
Lower CAPEX and OPEX |
| Reuse Bonanza Ledge WTP equipment at MSC during Stage 2 if schedule and permit conditions allow |
Lower CAPEX, reduce waste |
| Optimize chemical dosing using real-time monitoring and automated control systems |
Lower OPEX |
| Downrate Bonanza Ledge membrane system operation (e.g., reduce runtime or remove NF stage) if upstream performance allows |
Lower OPEX |
| Repurpose modular components from Bonanza Ledge for closure or other site water uses |
Lower CAPEX, reduce waste |
| Centralize sludge handling between Bonanza Ledge and MSC to reduce transport and O&M costs |
Lower OPEX |
| Expand internal reuse of treated water for reagent mixing, dust suppression, and gland seal water |
Lower OPEX |
| Evaluate semi-passive or hybrid polishing options for Stage 2 and low-flow closure period treatment |
Lower CAPEX and OPEX |
| Electrical |
Addition of a step-up substation to allow the transmission line to expand to 138 kV. |
This will limit the line losses with the increased voltage required for mine site load increases. |
| Construction (Costs and Schedule) |
Opportunity to blend contract for scopes of similar disciplines of work in the RFP process. |
Enhances coordination and efficiency of the work being performed in addition to opportunities in cost savings due to having minimal project mobilization costs with additional contractors. |
| Environmental, Permitting and Social License |
Synergies for environmental monitoring and management through geographic consolidation of site. |
Reduction in complexity, cost and reporting. Improved compliance management. |
| Rehabilitation and Closure |
Reassessment of the Reclamation Liability Cost Estimate (“RLCE”) for the Project through permit amendment process. |
Possible reduction in required security bond held by the Finance Minister. |
| |
Osisko Development Corp.
NI 43-101 Technical Report
Feasibility Study for the Cariboo Gold Project |
|
Upside Potential
There are opportunities, beyond the scope of this FS, that could enhance
the Project’s economics, timing, and/or permitting—beyond those typical to all mining projects (such as changes in metals
prices, exchange rates, and other variables). Additional information and further assessments are recommended to fully understand, quantify
and potentially incorporate these opportunities into the Project's feasibility-level economics. Key recommendations and actions have been
outlined in the Recommendations section to support a data-driven evaluation of the opportunities described below.
| ■ | Significant conversion potential of existing Mineral Resources to Mineral Reserves
with sufficient drilling density and incorporating appropriate modifying factors. Priority focus areas include such Mineral Resources
that are not in the current mine plan, but which are located directly adjacent to or, in some cases, as extensions of planned Mineral
Reserve stopes. By leveraging existing planned infrastructure, this could potentially increase recoverable ounces with minimal additional
capital expenditures and potentially have a positive material impact on Project economics. Total Measured and Indicated Mineral Resources
outside of the Mineral Reserves include 17.38 Mt at an average grade of 2.88 g/t for contained 1.61 Moz of gold. Total Inferred Resources
outside of the Mineral Reserves include 18.77 Mt at an average grade of 3.09 g/t for contained 1.86 Moz of gold. |
| ■ | The planned processing plant and surface infrastructure design have been
designed with flexibility to accommodate potential future expansion. Opportunities for low capital cost expansion scenarios aimed at increasing
throughput within the planned Project footprint, and enabling filtered tailings co-disposal to enhance recovery, will be explored and
evaluated, subject to sufficient Mineral Reserves being defined to support such an expansion, and the receipt of any required permit amendments. |
Other opportunities include:
| ■ | Potential extension of mineralization along the Barkerville Trend and Lightning
Creek Trend. Major prospects include Proserpine, Cariboo Hudson Mine, Burns-Nelson Mountain, and Yanks Peak; |
| ■ | Pre-production ore toll milling of development material to generate revenue
during the construction; |
| ■ | Utilize pre-owned equipment to reduce upfront capital costs and development
timelines; |
| ■ | Explore alternative funding sources for certain off-site infrastructure. |
| |
Osisko Development Corp.
NI 43-101 Technical Report
Feasibility Study for the Cariboo Gold Project |
|
This NI 43-101 Technical Report Feasibility Study
for the Cariboo Gold Project was prepared and compiled by BBA at the request of ODV, with the support of experienced and competent independent
consultants using accepted engineering methodologies and standards. It provides a summary of the results and findings from each major
area of investigation, including:
| ■ | Mineral Resource Estimate; |
| ■ | Mineral Reserves Estimate; |
| ■ | Environmental Management; |
| ■ | Waste and Water Management; |
| ■ | Capital and Operating Costs; |
The mutual conclusion of the QPs is that the Project,
as summarized in this FS, contains adequate detail and information to support the positive economic outcome. The results of this FS indicate
that the Project is technically feasible and has financial merit at the base case assumptions considered. Analysis of the results and
findings from each major area of investigation completed as part of this FS suggests numerous recommendations for further investigations
to mitigate risks and/or improve the base case designs.
| |
Osisko Development Corp.
NI 43-101 Technical Report
Feasibility Study for the Cariboo Gold Project |
|
In summary, the QPs recommend that ODV executes
the work planned in Section 26.9 below, which includes, but is not limited to:
| § | The detailed engineering and construction schedule including the purchase
of long lead time equipment, advance various construction readiness activities; |
| § | Undertake exploration drilling with the objective of converting Inferred
Mineral Resources within and around the mine area to Mineral Reserves; |
| § | Define additional potential Mineral Reserves that could feed into the current
or expanded mineral processing facilities; |
| § | Detail mine planning, characterization and testing related to paste flow
loop, as well as early supplier engagement; |
| § | Perform additional test work will support a more comprehensive understanding
of the lithological influence on metallurgical performance; |
| § | Conduct a sensitivity analysis for parameters of concern for water quality/balance
and reduce uncertainty related to inputs for parameters of concern, if possible; |
| § | Commence with preparation for surface infrastructure. |
Based on the results of the 2025 FS MRE, it is
recommended that the Project deposit be advanced to the next phase. Additional exploration and delineation drilling, as well as further
geological and structural interpretation are recommended to determine the extents of the gold mineralization. The recommended geology
work program is detailed below.
Recommended Work Program
| § | Underground infill drilling in vein corridors at close proximity from planned
underground workings is recommended to convert resources currently categorized as Inferred to the Indicated category. A budget of 100,000 m
of drilling is recommended for this program. |
| § | Surface drilling at Proserpine, Cariboo Hudson and Yanks Peak prospects with
the objective of expanding the geological understanding and mineralization to the southeast. A budget of 30,000 m of drilling is
recommended for this program; |
| § | An update on the Project is recommended to incorporate the results of the
proposed drilling program; |
| |
Osisko Development Corp.
NI 43-101 Technical Report
Feasibility Study for the Cariboo Gold Project |
|
| § | Underground infill drilling in vein corridors at close proximity from planned
underground workings is recommended with the objective of supporting the conversion of Mineral Resources currently categorized as Inferred
to the Indicated category. A budget of 100,000 m of drilling is recommended for this program. |
Operational Recommendations
| § | Continue geological mapping and surface sampling programs to define and identify
new targets is recommended; |
| § | Assess the results of the underground bulk sample(s) and continue the
bulk sample program. Continued testing of geological and grade continuities, metallurgical, and geotechnical parameters is recommended. |
Recommended Work Program
| § | For rock engineering, it is recommended that ODV acquires supplementary geotechnical
data to improve rock mass characterization, particularly in areas where no previous logging was conducted and in zones hosting major underground
infrastructure. This includes targeted underground geotechnical drilling in critical areas such as vent raise locations, the crusher chamber,
and other large excavations. Core should be systematically logged for geotechnical parameters, and representative samples submitted for
laboratory strength testing. This should be conducted during the detailed engineering phase. |
| § | Once additional underground access is established, perform site-specific
in situ stress measurements to validate current design assumptions and inform ground support strategies for large excavations and
stress-sensitive zones. |
| § | Before mining near-surface stopes (e.g., those beneath crown pillars), obtain
high-resolution topographic and bedrock surface data to support accurate modelling and assess potential surface stability concerns. |
Operational Recommendations
| § | Implement systematic geotechnical and geological mapping throughout underground
development, similar to practices employed at the Bonanza Ledge Mine. These observations should be used to continuously refine the geological
and geotechnical understanding of the rock mass. |
| |
Osisko Development Corp.
NI 43-101 Technical Report
Feasibility Study for the Cariboo Gold Project |
|
| § | Conduct additional geological and structural interpretation to better understand
the role of faults and discontinuities on mine stability. This work should be supported by further data collected through mapping and
targeted drilling |
| § | Survey all blasted stopes, both during mining and after mucking, to compare
actual stope geometry with planned designs. These reconciliations should be used to evaluate dilution and recovery in relation to the
geotechnical conditions encountered and to calibrate design assumptions accordingly. |
| 26.3.2 | Mine Design and Planning |
To strengthen the mine planning process and ensure
technical and economic robustness, the following recommendations are proposed:
Recommended Work Program
| § | Advance mine design and production scheduling through further engineering
work, including: |
| - | Optimize of the development sequence during the pre-production period, prior to the commissioning of the main ventilation network.
A thorough validation of the planned equipment in each sector, as well as the available ventilation capacity, is essential. This phase
is critical to ensuring the successful implementation of the development sequence during the ramp-up period. |
| - | Optimize the development sequence during the latter stages of the mine life. Strategic deferral of certain development activities
or a potential reduction in workforce may improve the Project’s NPV. |
| - | Evaluate the potential impact on the mine sequencing and design if Inferred Mineral Resources material disseminated between current
vein structures are converted into Indicated Mineral Resources. |
| § | Carry out detailed engineering studies for critical underground infrastructure,
specifically: |
| - | Electrical power and underground communication distribution systems; |
| - | Paste backfill distribution systems. |
| § | Continue engagement with equipment and service suppliers to refine cost estimates,
evaluate availability, and secure commercial terms through binding quotations or negotiated agreements. |
| |
Osisko Development Corp.
NI 43-101 Technical Report
Feasibility Study for the Cariboo Gold Project |
|
Operational Recommendations
| § | Conduct detailed mapping and verification of historical underground workings
(drifts and stopes) once underground access is safe and possible, to improve the understanding of dewatering requirements and reduce geotechnical
uncertainty in mine design. |
| § | Assess the technical feasibility of a top-down mining sequence using up-hole
longhole drilling techniques to potentially enhance recovery and scheduling flexibility. |
| 26.3.3 | Mine
Materials Handling and Paste Distribution |
It is recommended that ODV performs additional
work to validate and advance the design of the material handling and paste distribution networks. The main areas of optimization and de-risking
are listed below.
Recommended Work Program
| § | Advance the primary and secondary comminution model to optimize equipment
selection and sizing. Opportunities to remove the secondary crusher and replace the primary by a smaller sized jaw should be investigated
as it would have significant beneficial cost impact to the underground space required and construction timeline. |
| § | Perform flow modelling on the silos and chutes to ensure proper design and
material transfers. |
| § | Perform flow loop testing on the paste mixture to advance detail engineering,
and full sizing equipment. |
Operational Recommendations
| § | Along with the mine planning, detailed paste contingency scenarios and plans
should be developed in order to ensure functionality and continuous disposal underground. |
| 26.4 | Mineral
Processing and Metallurgical Test Work |
It is recommended that the metallurgical test
program be continued to validate the results obtained during the FS test work campaigns. Additional test work will support a more comprehensive
understanding of the lithological influence on metallurgical performance. The following test programs are recommended:
Recommended Work Program
| § | Conduct additional ore sorting test work on each deposit, including LOM composites
and variability samples. |
| § | Characterize fines generation during the crushing process. |
| |
Osisko Development Corp.
NI 43-101 Technical Report
Feasibility Study for the Cariboo Gold Project |
|
| § | Perform fines grinding tests to improve the characterization of flotation
concentrate. |
| § | Carry out full flowsheet testing for any newly defined deposit. |
| § | Undertake equipment-specific testing to support the sizing of key process
equipment (e.g., settling, filtration). |
| § | Perform a paste backfill UCS test program to confirm binder concentration
and binder selection. |
These items will inform complete detail engineering
and process optimization.
Operational Recommendations
| § | Assess the impact of dilution on mineral sorting performance and downstream
processing efficiency. |
Recommendations related to the next stages of
the water balance on the Project are as follows:
Recommended Work Program
| § | Flood mitigation includes holding back mine water in the underground to manage
extreme wet events with magnitude up to the EDF. Detail the effect of holding back the mine water to ensure the proposed mitigation is
executable year to year. |
| § | Validate and calibrate the hydrogeology model with information collected
from underground active dewatering and pumping out of historical flooded workings. |
| § | Expand the scope of the water balance model to include downstream watercourses
and the Jack of Clubs Lake. |
Operational Recommendations
| § | Continue collecting the following field data to support future model calibration
and verification: |
| - | Bonanza Ledge WTP flow rate; |
| - | Bonanza Ledge FMR pump out rate; |
| - | Hydrometric monitoring in downstream watercourses. |
| § | Modify the water balance model to reflect design
changes as the Project progresses. Use the model as tool to evaluate the expected performance of the water management system while considering
design options and refinements. |
| |
Osisko Development Corp.
NI 43-101 Technical Report
Feasibility Study for the Cariboo Gold Project |
|
The following updates of the water quality model
are recommended:
Recommended Work Program
| § | Obtain more data from deep underground workings and update mine pool inputs. |
| § | Add discharge locations and nodes for receiving environment (Lowhee Creek
and Jack of Clubs Lake) to the model and include subsurface/groundwater inputs to these nodes. |
| § | Calibrate and validate model using historical data. |
| § | Conduct a sensitivity analysis for parameters of concern and reduce uncertainty
related to inputs for parameters of concern if possible. |
Operational Recommendations
| § | Update the water quality model to reflect project changes and refinements. |
| 26.7 | Surface Infrastructure |
| 26.7.1 | Mine Site Operational Infrastructure |
The following infrastructure is proposed for the
needs of the Project. The items below highlight work required to advance these to detail engineering and construction.
| - | Willow River Bridge foundations should be designed to clarify uncertainty in foundation design and capital cost. The geotechnical
investigation should include Electronic Cose method, Seismic information (CPTu), review of lateral spreading and settlement, and the complete
survey to confirm grade line. In addition, the environmental information/constraints should be well defined. |
| - | Evaluate bearing capacity of foundation materials along the length of the road to determine if soil reinforcement is required to establish
a stable road prism, where poor subgrade conditions exist. |
| - | Validate the requirements to dismantle and dispose of historic structures, if any. |
| - | Undertake further assessment on the geochemical characterization of the material to be excavated at the MSC to finalize the earthworks
development strategy and assess potential and optional sources of structural backfill materials to ensure suitability for construction,
improve certainty of unit cost, and initiate permitting or negotiation of rights of access to the source area. |
| |
Osisko Development Corp.
NI 43-101 Technical Report
Feasibility Study for the Cariboo Gold Project |
|
| - | Further characterize the waste rock material geotechnical parameters to confirm stability and configuration
and conduct further geochemical characterization. |
| - | Finalize the assessment of the suitability of using underground development waste as construction material
for the waste rock storage facility. |
| § | Structural Foundations at the MSC: |
| - | Undertake an additional geotechnical investigation to map the bedrock profile better and the assessment of volumes of overburden and
historical waste material. |
| - | Conduct the additional assessment of the bearing capacity of the bedrock at the location of the concentrator. |
| § | Surface water management for the MSC and Bonanza Ledge: |
| - | Assess the surface water management concept according to the results of the environmental site assessment, and compliance with the
Project permitting or table of comments must be respected. |
| - | Perform the detailed design of the sediment water pond, and diversion, collection and spillway channels required to ensure stability
and certainty of arrangement and material quantities. |
| § | Advance the design of the underground FMR in order to confirm the viability
and constraints associated with the concept. |
| - | For the MSC sediment pond construction, develop an instrumentation and monitoring plan to be followed during the dam fill placement
to avoid rapid loading and allow for increased foundation pore water pressure to dissipate. |
| § | For the MSC sediment pond construction, update estimates of differential
settlement by confirming thickness of glaciolacustrine foundation under the dam and pond, and prepare an instrumentation and monitoring
program for the construction and operations. |
| § | Lodging Capacity in Wells: |
| - | Further develop the Project schedule to a Level 3 to gain deeper granularity on labour curves and validate the lodging requirements
versus the planned lodging capacity. |
| 26.7.2 | Water Management Infrastructure |
Recommendations related to the next stages of
water management infrastructure design are as follows:
Recommended Work Program
| § | Confirm contributing watershed areas to ensure channel and sumps/pond sizing
is adequate. |
| |
Osisko Development Corp.
NI 43-101 Technical Report
Feasibility Study for the Cariboo Gold Project |
|
| § | Conduct detailed design and Issue for Construction (“IFC”) drawings
for contact and non-contact water management infrastructure at both Bonanza Ledge and MSC areas to meet the Project schedule requirements
and construction timelines. |
| § | Conduct field surveys of channels alignment to confirm grades, ground truth
and support detailed design and IFC drawings, and identify potential construction challenges and opportunities. Key areas of focus include
areas with steep slopes or major change in slope gradation. |
| § | Conduct field surveys of existing water channels in the Bonanza Ledge area
to confirm that these channels can meet design criteria, to plan for upgrades if necessary, and to support integration into the broader
water infrastructure network. |
| § | Investigate the Legacy tailings material at the MSC area and assess the risk
of potential stability and contamination risks. The study would evaluate the ability to support excavation works and channel construction,
as well as the potential for leaching constituents of concerns into the channel, presenting contamination risks. The study should also
support construction alternatives such as constructing the channels above ground, over the Legacy tailings. |
Operational Recommendations
| § | Optimize the Bonanza Ledge approach to manage flood events. In particular,
evaluate improvements to the current design that consists of pumping water from the east side of the WRSF (Pond A) up across the WRSF
and back down towards the SCP and then back up the WRSF to the FMR. Alternative approaches could be explored to minimize energy use and
operational complexity. |
| 26.7.3 | Water Treatment Facilities |
Recommendations related to the next stages of
the water treatment design are as follows:
| § | Complete preliminary Issued for Approval (“IFA”) design of the
MSC WTP to support permit amendment for a combined Mine site and Bonanza Ledge WTP. |
| § | Complete detailed design IFC design of the MSC WTP to meet the Project schedule
requirements and construction timelines. |
| § | Construct the MSC WTP as per the Project construction schedule. |
| § | Conduct bench or pilot testing on influent water to: |
| - | Validate that the treatment approach can achieve the proposed treatment targets. |
| - | Validate the design assumptions. |
| - | Refine estimates of the reagent consumption and sludge generation rates. |
| - | Generate water treatment solids for geochemical testing to support the development of waste disposal options. |
| |
Osisko Development Corp.
NI 43-101 Technical Report
Feasibility Study for the Cariboo Gold Project |
|
| 26.7.4 | Water treatment Conveyance Infrastructure Pumping and Piping Systems |
Recommendations related to the pumping and piping
systems are as follows:
| § | Complete additional engineering work to optimize the pumping systems used
across the Bonanza Ledge and MSC sites. Current use of submersible pumps installed in parallel to be reviewed and improved upon with consideration
to alternative options. |
| § | Further assess seasonal flow rates and review cost benefit analysis to running
twinned pipelines should high flow rate fluctuations be seen from season to season. |
| 26.7.5 | Power Supply (Transmission Line and Substation |
Recommendations related to the TL and site power
distribution include:
| § | Advance procurement of long lead items. |
| § | Compile an accurate load list. |
| § | Finalize and obtain the license of occupation for the TL and follow up with
obtaining the occupant license to cut. |
| § | Continue to have discussions with private landowners and overlapping tenure
holders along the route on land usage planning. |
| § | Determine the operations requirements for forestry service roads along the
route and future plans. |
| § | Ground truth the wetland areas and structure placements along the line route. |
| 26.7.6 | Waste Rock Storage Facility |
The stability analyses conducted for the proposed
WRSF design, as well as sensitivities, meet the minimum required FoS. The following is a list of recommendations to further reduce uncertainty
and confirm assumptions:
| § | Sample and test the development waste rock to confirm the strength of the
material. |
| § | Test liner cover and liner bedding for strength parameters as soon as they
are available. This will be used to confirm the parameters used in this stability analysis and future analyses. |
| § | Install instrumentation to measure and monitor the phreatic surface within
the footprint of the WRSF. |
| 26.8 | Environment and Permitting |
The Project has received authorization to proceed
with construction of the major components and aspects of the mine operations. Under Section 19 of the British Columbia Environmental
Assessment Act, the holder of an EAC may apply to the Executive Director of EAO for an amendment. An application for amendment is
necessary when a Certificate Holder proposes to change any aspect of the certificate, e.g., design, location, construction, operation
or decommissioning of the Project. Changes to the Project will require Amendment to the Environmental Assessment Certificate, Mines
Act permit, and Environmental Management Act permits.
| |
Osisko Development Corp.
NI 43-101 Technical Report
Feasibility Study for the Cariboo Gold Project |
|
A fulsome assessment of the changes as it relates
to the existing permits, and development of a permitting strategy to address the required amendments should be completed, with input from
regulatory agencies.
A work program summarized in Table 26-1 has
been developed based on the Project needs and the QP’s recommendations described above. The work program includes additional and
included activities to advance the Project through detail engineering and construction.
Table 26-1: Work program
budget
| Work
Program Recommendations |
Cost
Estimate
($000s) |
| Drilling &
Geology |
| Regional Exploration Drilling - Proserpine (12,900 m) |
6,500 |
| Regional Exploration Drilling - Cariboo Hudson (10,000 m) |
5,000 |
| Regional Exploration Drilling - Yanks Peak (6,300 m) |
3,000 |
| Underground Infill Drilling (100,000 m) |
30,000 |
| Drilling & Geology Total |
45,000 |
| Mine
Design & Geotechnical |
| Underground Major Infrastructure Detailed Geotechnical Characterization |
250 |
| Site Specific In Situ Stress Measurements |
50 |
| Crown Pillar Definition |
150 |
| Detailed Construction Mine Plan(1) |
350 |
| Detailed Underground Infrastructure Engineering(1) |
500 |
| Supplier Engagement |
15 |
| Underground Crushing and Material Handling Detail Engineering and Modelling(1) |
350 |
| Paste Mixture Flow Loop Testing(1) |
50 |
| Mine Design & Geotechnical Total |
1,715 |
| |
Osisko Development Corp.
NI 43-101 Technical Report
Feasibility Study for the Cariboo Gold Project |
|
| Work
Program Recommendations |
Cost
Estimate
($000s) |
| Mineral
Processing & Metallurgy |
| Variability Testing(1) |
800 |
| Fines Testing |
100 |
| Full Process Pilot(1) |
500 |
| Equipment Specific Testing(1) |
200 |
| Paste USC Testing |
100 |
| Mineral Processing & Metallurgy Total |
1,700 |
| Water
Balance & Water Quality |
| EDF Management Planning |
50 |
| Hydrogeological Model Calibration |
250 |
| Expanded Water Balance Model(1) |
350 |
| Mine Pool Characterization |
25 |
| Add Discharge Nodes, Calibrate and Add Sensitivities to the Model(1) |
200 |
| Water Balance & Water Quality Total |
875 |
| Surface
Infrastructure |
| MSC Access Road Testing and Engineering(1) |
150 |
| MSC Site Preparation(1) |
50 |
| Bonanza Ledge WRSF(1) |
150 |
| MSC Foundation(1) |
50 |
| Surface Water Management Detail Engineering(1) |
250 |
| MSC Sediment Pond(1) |
350 |
| Construction Housing(1) |
25 |
| MSC WTP Detail Engineering and Pilot Testing(1) |
4,500 |
| Power Supply Engineering & Permitting(1) |
700 |
| Surface Infrastructure Total |
6,225 |
| Environment &
Permitting |
| Permitting Change Assessment(1) |
250 |
| Environment & Permitting Total |
250 |
| Recommendation & Work Program Total |
55,765 |
| (1) | Cost included as part of the 2025 FS CAPEX estimate, or pre-final investment decision cost. |
| |
Osisko Development Corp.
NI 43-101 Technical Report
Feasibility Study for the Cariboo Gold Project |
|
Amanda Fitch, QP, finds the recommendations and
budgets to be reasonable and justified based on the studies and observations made to date. It is recommended that ODV conducts the planned
activities subject to funding availability and any other matters that may cause the objectives to be altered in the normal course of the
Project development. The exploration program is discretionary and can be staged or deferred until funding or operational cash flow is
available. The other work streams are essential to achieve construction readiness in anticipation of construction financing and a final
investment decision and should be advanced expeditiously so as not to jeopardize the projected timelines.
| |
Osisko Development Corp.
NI 43-101 Technical Report
Feasibility Study for the Cariboo Gold Project |
|
| 27.1. | Mineral
Resources and Geology |
Allan, M.M., Rhys, D.A. and Hart, C.J.R.
(2017). Orogenic gold mineralization of the eastern Cordilleran gold belt, British Columbia: Structural ore controls in the Cariboo (093A/H),
Cassiar (104P) and Sheep Creek (082F) mining districts: Geoscience BC Report 2017-15, 108 pages.
Andrew, A., Godwin, C. I. and Sinclair,
A. J. (1983). Age and genesis of Cariboo gold mineralization determined by isotope methods (93H). In Geological Fieldwork 1982, BC Ministry
of Energy, Mines and Petroleum Resources, Paper 1983-1, pp. 305-313.
Ash, C. H. (2001). Relationship between
ophiolites and gold-quartz veins in the North American Cordillera. BC Ministry of Energy, Mines and Petroleum Resources, Bulletin 108,
140 pages.
Beausoleil, C. and Pelletier, C. (2018).
NI 43-101 Technical Report and Mineral Resource Estimate Update for the Cariboo Gold Project, B.C., Canada. Prepared by InnovExplo Inc.
for Barkerville Gold Mine Ltd. Published on SEDAR website (Barkerville Gold Mines Ltd.) on June 14, 2018. 268 pages.
Beausoleil, C., Pelletier, C. and Dorval,
A. (2019). NI 43 101 Technical Report and Mineral Resource Estimate Update for the Cariboo Gold Project, British Columbia, Canada. Prepared
by InnovExplo Inc. for Barkerville Gold Mine Ltd. Published on SEDAR website (Barkerville Gold Mines Ltd.) on Sept 17, 2019. 486 pages.
Beausoleil, C. and Pelletier, C. (2020).
NI 43-101 Technical Report and Mineral Resource Estimate Update for the Cariboo Gold Project, British Columbia, Canada. Prepared by InnovExplo
Inc. for Barkerville Gold Mine Ltd. Published on SEDAR website (Barkerville Gold Mines Ltd.) on November 25, 2020. 196 pages
Bolin, D. S. (1984). Report to Wharf
Resources Ltd on the Cariboo Gold Quartz Mine, Wells, British Columbia, Canada. Report prepared by Golder Associates for Wharf Resources
Ltd., 17 pages. Internal report.
British Columbia Mine Waste Rock Pile
Research Committee (BC MWRPRC) (1991). Mined Rock and Overburden Pile – Investigation and Design Manual, Interim Guidelines.
Brousseau, K., Faure, S. and Pelletier,
C. (2017). Technical report for the Cariboo Gold Project and Mineral Resource Estimate on the Barkerville Mountain Deposit. NI 43 101
Technical Report prepared by InnovExplo for Barkerville Gold Mine Ltd. Published on SEDAR website (Barkerville Gold Mines Ltd.) on May 17,
2017, 250 pages.
| |
Osisko Development Corp.
NI 43-101 Technical Report
Feasibility Study for the Cariboo Gold Project |
|
Brown, J.A. (2009). Technical Report
for the Cariboo Gold Project, Barkerville/Wells, B. C. Cariboo MD. NI 43101 Technical Report prepared by Giroux Consultants Ltd for
International Wayside Gold Mines Limited and Barkerville Gold Mines Limited. Report published on SEDAR website (Barkerville Gold Mines
Ltd.) on December 18, 2009, 90 pages.
Campbell, D. D. (1969). Summary Report
of 1968 Surface Exploration and Production Potential of Cariboo Gold-Quartz Mine, Wells, B. C. Report prepared by Dolmage, Campbell &
Associates for Cariboo Gold Quartz Mines Ltd. BC Ministry of Energy, Mines and Petroleum Resources, Property File 014868, 24 pages.
Chapman, J. (1996a). Mineral Exploration
Report, Diamond Drilling, Welbar Gold Project, Cariboo-Hudson Property, Cariboo Mining Division, Wells, B. C. Works done by Gold City
Mining Corporation. BC Ministry of Energy, Mines and Petroleum Resources, Assessment Report 24 791, 5 pages.
Chapman, J. (1996b). Mineral Exploration
Report, Diamond Drilling, Welbar Gold Project, William Creek Property, Cariboo Mining Division, Wells, B. C. Works done by Gold City Mining
Corporation. BC Ministry of Energy, Mines and Petroleum Resources, Assessment Report 24 722, 4 pages.
Chapman, J. (1997). Mineral Exploration
Report, Diamond Drilling, Welbar Gold Project, Island Mountain Property, Cariboo Mining Division, Wells, B. C. Works done by Gold
City Mining Corporation. BC Ministry of Energy, Mines and Petroleum Resources, Assessment Report 24 723, 4 pages.
Chapman, R.J. and Mortensen, J.K. (2016).
Characterization of Gold Mineralization in the Northern Cariboo Gold District, British Columbia, Canada, Through Integration of Compositional
Studies of Lode and Detrital Gold with Historical Placer Production: a template for Evaluation of Orogenic Gold Districts. Economic Geology,
v. 111, pp. 1321-1345.
CIM Definition Standards (2014). CIM
Definition Standards on Mineral Resources and Reserves; May 10, 2014.
Cook, F.A. (1995). The Southern Canadian
Cordillera Transect of Lithoprobe: Introduction. Canadian Journal of Earth Sciences, v. 24(10), pp. 1483-1484.
Cox, S.F. (2005). Coupling between Deformation,
Fluid Pressures, and Fluid Flow in Ore-Producing Hydrothermal Systems at Depth in the Crust. Economic Geology 100th Anniversary Volume,
pp. 39-75.
Daignault, P. M., and Moore, C. (2006).
Report on the 2005 Exploration Program on the Cariboo Gold Project (Lowhee Creek Area), Wells, British Columbia. Works done by International
Wayside Gold Mines Ltd. BC Ministry of Energy, Mines and Petroleum Resources, Assessment Report 28 148C-1, 15 pages.
| |
Osisko Development Corp.
NI 43-101 Technical Report
Feasibility Study for the Cariboo Gold Project |
|
Duba, D. (2005). Report on 2004 Diamond
Drilling on the Myrtle Claim Group, Wells, British Columbia. International Wayside Gold Mines Limited. BC Ministry of Energy, Mines and
Petroleum Resources, Assessment Report 27 757G, 20 pages.
Dubé, B., and Gosselin, P. (2007),
Greenstone-hosted quartz-carbonate vein deposits, in Goodfellow, W.D., ed., Mineral Deposits of Canada: A Synthesis of Major Deposit-Types,
District Metallogeny, the Evolution of Geological Provinces, and Exploration Methods: Geological Association of Canada, Mineral Deposits
Division, Special Publication No. 5, pp. 49-73.
Dykes, S. (1999). New Mineral Inventory
Calculation. International Wayside Gold Mines Ltd. 6 pages. Internal Report.
Dzick, W. (2015). Cow Mountain NI43-101
Technical Report (Project No. V1458), Cariboo Gold Project. Report prepared by Snowden Mining Industry Consultants for Barkerville
Gold Mines Ltd. Report published on SEDAR website (Barkerville Gold Mines Ltd.) on May 15, 2015. 159 pages.
Ferri, F. and O’Brien, B. H. (2002).
Preliminary geology of the Cariboo Lake area, central British Columbia (093A/11, 12, 13 and 14). In Geological Fieldwork 2001, B.C. Ministry
of Energy and Mines, Paper 2002-1, pp. 59-81.
Ferri, F. and Schiarizza, P. (2006).
Reinterpretation of the Snowshoe Group stratigraphy across a south west-verging nappe structure and its implications for regional correlations
within the Kootenay Terrane. In Paleozoic Evolution and Metallogeny of Pericratonic Terranes at the Ancient Pacific Margin of North America.
M. Colpron and J. L. Nelson (ed.), Canadian and Alaskan Cordillera, Geological Association of Canada, Special Paper 45, pp. 415–432.
Fier, N. E., Reggin, L., Martin, S.,
Wright, F., Arik, A. (2009). Pre-Feasibility Study of the Bonanza Ledge Deposit, Wells, BC, Canada. NI 43 101 Technical Report prepared
by EBA Engineering Consultants Ltd for International Wayside Gold Mines Limited. Report published on SEDAR website (Barkerville Gold Mines
Ltd.) on October 23, 2009; 119 pages.
Filgate, M. (2018). Exploration Proposal
for the Grouse Creek Property, Cariboo Mining District Central British Columbia. Barkerville Gold Mines Ltd., 10 pages. Internal Report.
Gabrielse, H., Murphy, D., and Mortenson,
J. (2006). Cretaceous and Cenozoic dextral orogen-parallel displacements, magmatism, and paleogeography, north-central Canadian Cordillera.
In Paleogeography of the North American Cordillera: Evidence for and Against Large-Scale Displacements. J.W. Haggart, R.J. Enkin, and
Monger J.W.H (eds.), Geological Association of Canada Special Paper 46, pp. 255-276
Gates, E. E., Ridell, J., and Duba,
D. (2005). Report on the 2004 Exploration and Development Program on the Cariboo Gold Project, Wells, British Columbia. International
Wayside Gold Mines Limited. BC Ministry of Energy, Mines and Petroleum Resources, Assessment Report 27 757A, 29 pages.
| |
Osisko Development Corp.
NI 43-101 Technical Report
Feasibility Study for the Cariboo Gold Project |
|
Georges, P. T. (2012). Technical Report
Mineral resources and Potential, Cariboo Gold Project, Cariboo Mining District, British Columbia. Report prepared by GEOEX Limited for
Barkerville Gold Mines Limited. Report published on SEDAR website (Barkerville Gold Mines Ltd.) on August 13, 2012, 52 pages.
Georges, P. T., Jones, I. W. O.,
McCarthy, R., and Dufresne, M. B. (2013). Technical Report Cariboo Gold Project, Cariboo Mining District, British Columbia. Report prepared
by EBA Engineering Consultants Ltd. for Barkerville Gold Mines Limited. Report published on SEDAR website (Barkerville Gold Mines Ltd.)
on June 18, 2013; 160 pages.
Giroux, G.H. (2000). A Resource estimate
on the Cariboo Gold Project, Wells, B.C.: internal company report for International Wayside Gold Mines Ltd.
Giroux, G. H. (2002). A Resource Estimate
on the BC Vein and Bonanza Ledge Deposits, Wells, British Columbia. NI 43 101 Technical Report prepared by Giroux Consultants Ltd for
International Wayside Gold Mines Limited. Report published on SEDAR website (Barkerville Gold Mines Ltd.) on April 9, 2003, 50 pages.
Giroux, G. H. (2006). Resource Estimate
on the Cariboo Gold Project, Wells, British Columbia. Amended NI 43 101 Technical Report prepared by Giroux Consultants Ltd for International
Wayside Gold Mines Limited. Report published on SEDAR website (Barkerville Gold Mines Ltd.) on July 17, 2006, 57 pages.
Golder (2022).
(Golder Associates Ltd.) Cariboo Gold Project. Bulk Fill Area and Waste Rock Storage Facility 2021 Geotechnical Site Investigation Report.
Goldfarb R.J. Groves D.I., and Gardoll,
S. (2001). Orogenic gold and geologic time: a global synthesis. Ore Geology Reviews 18: 1-75.
Goldfarb R.J., Baker, T., Dubé,
B., Groves, D.I., and Hart, C.J.R. (2005). Distribution, character, and genesis of gold deposits in metamorphic terranes. Economic Geology
100th Anniversary Volume: 407-450.
Groves, D.I., Goldfarb, R.J., Gebre-Mariam,
H., Hagemann, S.G., Robert, F. (1998). Orogenic gold deposits—a proposed classification in the context of their crustal distribution
and relationship to other gold deposit type. Ore Geology Reviews, 13, 7–27.
Groves D.I., Goldfarb R.J., Robert,
F., and Hart, C.J.R. (2003). Gold deposits in metamorphic belts: Overview of current understanding, outstanding problems, future research,
and exploration significance. Economic Geology, 98: 1-29.
Hall, R. D. (1999). Cariboo gold project
at Wells, British Columbia. International Wayside Gold Mines Limited. Report published on SEDAR website (Barkerville Gold Mines Ltd.)
on October 5, 2000, 42 pages.
Harbort, T. A. (2017). Island Mountain
Tectonostratigraphic Facies Model. Barkerville Gold Mines Internal Company Report.
| |
Osisko Development Corp.
NI 43-101 Technical Report
Feasibility Study for the Cariboo Gold Project |
|
Harbort, T. A. (2018). A New Kinematic
Mechanism for Orogenic Vein Formation: The Application of a Laminated Thin Plate Curvature Model to Explain Vein Genesis in the Cariboo
Gold District, Canada. Abstract with Programs, SEG Metals, Minerals and Society Conference, Keystone, Colorado.
Hardie, C., Belisle, M., Pelletier,
C, Nadeau-Benoit, V., Lecomte, E., Coleman, T., Gauthier, P., Göksu, A., Rutkowski, T., Cunning, J., Salzsauler, K., Poirier, É.,
Willms, D., Liew, M., and Muller, K. (2022). NI 43-101 Technical Report - Preliminary Economic Assessment for the Cariboo Gold
Project. Prepared for Osisko Development Corp., dated May 24, 2022; 546 pages.
Hardie, C., Belisle, M., Mueller, K,
Cunning, J., Gauthier, P., Göksu, A., Singh, S., Lecomte, E., Nadeau-Benoit, V., Pelletier, C.,
Maillé, J.-F., Mountjoy, K., Liew, M., Willms, D., Coleman, T., Rutkowski, T., and Verburg, L. (2023).
NI 43-101 Technical Report - Feasibility Study for the Cariboo Gold Project. Prepared for Osisko Development Corp., dated January 10,
2023 and amended January 12, 2023 (effective date of December 30, 2022); 733 pages.
Hoffman, P.F. (1991). Did the breakout
of Laurentia turn Gondwanaland inside-out? Science, v. 252(5011); pp. 1409-1412.
Johnson, D. L. (2005). Report on the
2004 Diamond Drilling Program on the Island Mountain Gold Property, Wells, British Colombia. Works done by Island Mountain Gold Mines
Ltd. BC Ministry of Energy, Mines and Petroleum Resources, Assessment Report 27 757F, 24 pages.
Layman, M. E. (2015). Report on the
2014 Diamond Drilling on the Cariboo Gold Project, Wells, British Columbia. Report prepared for Barkerville Gold Mines Ltd. BC Ministry
of Energy, Mines and Petroleum Resources, Assessment Report 35 452, 17 pages.
Lord, K., and Reid, R. (1997). Geochemical
Survey and Prospecting Report for Assessment Cariboo Gold Project at Wells, B. C. Report prepared for International Wayside Gold Mines
Ltd. BC Ministry of Energy, Mines and Petroleum Resources, Assessment Report 25 241, 25 pages.
Lord, K., and Hall, R. (2001). Report
for Assessment, Cariboo Gold Project, Wells, B. C. Report prepared for International Wayside Gold Mines Ltd. BC Ministry of Energy, Mines
and Petroleum Resources, Assessment Report 26 604, 43 pages.
MD&A reports from Island Mountain
Gold Mines Ltd., International Wayside Gold Mines Ltd., and Barkerville Gold Mines Ltd.
Monger, J. W. H. and Berg,
H. C. (1984). Lithotectonic terrane map of western Canada and southeastern Alaska. In Silberling, N.J. and Jones, D.L., eds., Lithotectonic
terrane maps of the North American Cordillera, part B: U.S. Geological Survey, Open-File Report 84-523, pp. B1-B31.
Monger, J. W. H. and Price,
R. (2002). The Canferriadian Cordillera: Geology and Tectonic Evolution. Canadian Society of Geophysicists Recorder. (27) 2: pp. 17-36.
Monger, J.W.H., and Price, R. (2003).
A Transect of the Canadian Cordillera from Calgary to Vancouver. Geological Association of Canada Field Trip Guide.
| |
Osisko Development Corp.
NI 43-101 Technical Report
Feasibility Study for the Cariboo Gold Project |
|
Moore, C. (2006). Report on the 2005
Diamond Drilling Program on the Island Mountain Gold Property, Wells, British Colombia. Works done by Island Mountain Gold Mines Ltd.
BC Ministry of Energy, Mines and Petroleum Resources, Assessment Report 28 148D, 23 pages.
Morgan, G.J., Dorval, A., Hardie, C.,
Bratty, M., Jones, E., Tremblay, M., Beausoleil, C., Pelletier, C., Allwright, Z., Coleman, T., Bélisle, M., Fontaine, R., and
Lemaire, D. (2019). NI 43-101 Technical Report – Preliminary economic assessment of the Cariboo Gold Project, District of Wells,
British Columbia, Canada. Prepared by for Barkerville Gold Mine Ltd. Published on SEDAR website (Barkerville Gold Mines Ltd.) on September 17,
2019. 486 pages.
Mortensen, J. K., Montgomery, J. R.
and Fillipone, J. (1987). U-Pb zircon, monazite and sphene ages for granitic orthogneiss of the Barkerville Terrane, east-central British
Columbia. Canadian Journal of Earth Sciences, v. 24, pp. 1261-1266.
Mortensen, J. K., Rhys, D. A. and Ross,
K. (2011). Investigations of orogenic gold deposits in the Cariboo gold district, east-central British Columbia (parts of NTS 093A, H):
final report. In Geoscience BC Summary of Activities 2010, Geoscience BC, Report 2011-1, pp. 97–108.
Moynihan, D. P., & Logan, J.
M. (2009). Geological Relationships on the Western Margin of the Naver Pluton, Central British Columbia (NTS 093G / 08). In Geological
Fieldwork 2008, central British Columbia, British Columbia Ministry of Energy, Mines, and Petroleum Resources, Paper 2009-1, p.153–162.
MRMR Best Practice Guidelines (2019).
CIM Estimation of Mineral Resources and Mineral Reserves Best Practice Guidelines, November 29, 2019.
Mineral Titles Online (2025). Mineral
Titles Online of British Columbia government. Available at <http://www2.gov.bc.ca/gov/content/industry/mineral-exploration-mining/mineral-titles/mineral-placer-titles/mineraltitlesonline>
Nelson, J.L. (1993). The Sylvester Allochthon:
Upper Paleozoic Marginal-basin and island-arc terranes in northern British Columbia. Canadian Journal of Earth Sciences, v.30(3), pp. 631-643.
Panteleyev, A., Bailey, D. G., Bloodgood,
M. A. and Hancock, K. D. (1996). Geology and mineral deposits of the Quesnel River–Horsefly map area, central Quesnel Trough, British
Columbia (NTS map sheets 93A/5, 6, 7, 11, 12, 13; 93B/9, 16; 93G/1; 93H/4). BC Ministry of Energy, Mines and Petroleum Resources, Bulletin
97, 156 pages.
Pautler, J. W. (2003). Report on the
2003 Diamond Drill and Trenching Program on the Island Mountain Gold Property, Wells, British Columbia. Report published on SEDAR website
(Starr Peak Exploration Ltd.) on December 31, 2003, 30 pages.
| |
Osisko Development Corp.
NI 43-101 Technical Report
Feasibility Study for the Cariboo Gold Project |
|
Pautler, J. (2004). Report on the 2003
Diamond Drill and Trenching Program on the Cariboo Gold Project, Wells, British Columbia. International Wayside Gold Mines Ltd. BC Ministry
of Energy, Mines and Petroleum Resources, Assessment Report 27 386, 15 pages.
Phillips, G.N. and Powell, R. (2010).
Formation of gold deposits: a metamorphic devolatilization model. Journal of Metamorphic Geology, 28: 689-718.
Pickett, J. W. (2000). Report on the
Mosquito Creek and Island Mountain Claims Groups, Cariboo Mining Division, British Columbia, Canada. Report published on SEDAR website
(Starr Peak Exploration Ltd.) on April 5, 2001, 18 pages.
Pickett, J. W. (2001). Diamond drilling
and geochemical soil sampling report on a portion of the IGM Group of mineral claims. Works done by Island Mountain Gold Mines Ltd and
International Wayside Gold Mines Ltd. BC Ministry of Energy, Mines and Petroleum Resources, Assessment Report 26 492A, 57 pages.
Pickett, J. W. (2002). Diamond Drilling,
Geochemical Soil Sampling, Induced Polarization Geophysics, and Rock Sampling, report on a portion of the IGM Group of mineral claims.
Works done by Island Mountain Gold Mines Ltd and International Wayside Gold Mines Ltd. BC Ministry of Energy, Mines and Petroleum Resources,
Assessment Report 26 888A, 24 pages.
Pickett, J. W. (2003). Technical Report
on the 2002 Exploration Program of Island Mountain Gold Mines Ltd, Wells Area, BC. Report published on SEDAR website (Starr Peak Exploration
Ltd.) on February 10, 2003, 30 pages.
Pow, D. J. (2003). A Preliminary Assessment
Report on the Cow Mountain and Bonanza Ledge Deposits, Wells, British Columbia for International Wayside Gold Mines Limited. Report published
on SEDAR website (Barkerville Gold Mines Ltd.) on April 14, 2003, 42 pages.
Ray, G. E., Webster, I. C. L.,
Ross, K. and Hall, R. (2001). Geochemistry of auriferous pyrite mineralization at the Bonanza Ledge, Mosquito Creek mine and other properties
in the Wells-Barkerville area, British Columbia. In Geological Fieldwork 2000, BC Ministry of Energy and Mines, Paper 2001-1, pp. 135–167.
Reid, R. (1999). Underground Percussion
Drilling and Surface Diamond Drilling, Cariboo Gold Project at Wells, B. C. Report prepared for International Wayside Gold Mines Ltd.
BC Ministry of Energy, Mines and Petroleum Resources, Assessment Report 25 940, 25 pages.
Rhys, D.A., and Ross, K.V. (2001). Evaluation
of the geology and exploration potential of the Bonanza Ledge Zone, and adjacent areas between Wells and Barkerville, east central British
Columbia: Surrey, BC, Panterra Geoservices Inc. Unpublished report, 113 pages.
Rhys, D. A., Mortensen, J. K. and Ross,
K. (2009). Investigations of orogenic gold deposits in the Cariboo gold district, east-central British Columbia (parts of NTS 093A, H):
progress report. In Geoscience BC Summary of Activities 2008, Geoscience BC, Report 2009-1, pp. 49–74.
| |
Osisko Development Corp.
NI 43-101 Technical Report
Feasibility Study for the Cariboo Gold Project |
|
Sandefur, R. L., and Stone, D. M. (2006).
Preliminary Assessment Report The Bonanza Ledge Mine, Wells, British Columbia. Report prepared by Chlumsky, Armbrust & Meyer,
LLC for International Wayside Gold Mines Ltd. Report published on SEDAR website (Barkerville Gold Mines Ltd.) on May 2, 2006, 88
pages.
Schiarizza, P.A., Ferri, F. (2003).
Barkerville Terrane, Cariboo Lake to Wells; A New Look at Stratigraphy, Structure and Regional Correlation of the Snowshoe Group. In Geological
Fieldwork 2002, British Columbia Ministry of Energy and Mines, British Columbia Geological Survey Paper 2003-01, pp. 77-96.
Shaw, J., and Prince, J. K. G. (2018).
Report on the 2018 Regional Mapping Program: Barkerville, Cow, Island Mountain, and Proserpine Exploration Areas, Cariboo Gold District.
Barkerville Gold Mines Internal Report, 88 p.
Shaw, J., and Prince, J. K. G. (2019).
Report on the 2019 Regional Mapping Program: Barkerville, Cow, Island Mountain, and Proserpine Exploration Areas, Cariboo Gold District.
Barkerville Gold Mines Internal Report, 88 p.
Shaw, J., and Prince, J. K. G. (2022).
Internal Report - 2019-2021 Mount Burns and Mount Nelson Mapping, 50 pages.
Skerl, A.C. (1948). Geology of the Cariboo
Gold Quartz Mine Wells, BC: Economic Geology, v. 43, pp. 571-597.
Struik, L.C. (1986). Imbricated terranes
of the Cariboo gold belt with correlations and implications for tectonics in southeastern British Columbia; Canadian Journal of Earth
Sciences, Volume 23, pp. 1047-1061.
Struik, L. C. (1988). Structural geology
of the Cariboo Gold Mining District, east-central British Columbia. Geological Survey of Canada, Memoir 421, 100 pages.
Struik, L. C., Parrish, R. R., and Gerasimoff,
M. D. (1992). Geology and age of the Naver and Ste Marie plutons, central British Columbia. Radiogenic Age and Isotopic Studies, v. 5,
p. 1551.
Sutherland Brown, A. (1957): Geology
of the Antler Creek area, Cariboo District, British Columbia; BC Ministry of Energy, Mines and Petroleum Resources, Bulletin 38, 105 pages.
Walton, G. (2002a). Report for Assessment
Cariboo Gold Project, Wells, B. C. International Wayside Gold Mines Limited. BC Ministry of Energy, Mines and Petroleum Resources, Assessment
Report 26 906, 13 pages.
Walton, G. (2002b). Report on the 2001
Exploration Program on the Cariboo Gold Properties, Central British Columbia. International Wayside Gold Mines Limited. Report published
on SEDAR website (Barkerville Gold Mines Ltd.) on August 27, 2002, 38 pages.
| |
Osisko Development Corp.
NI 43-101 Technical Report
Feasibility Study for the Cariboo Gold Project |
|
Walton, G. (2003a). Report for Assessment
Cariboo Gold Project, Wells, B. C. International Wayside Gold Mines Limited, Island Mountain Gold Mines Ltd, Golden Cariboo Resources
Ltd. BC Ministry of Energy, Mines and Petroleum Resources, Assessment Report 27 146, 31 pages.
Walton, G. (2003b). Report for Assessment
Cariboo Gold Project, Wells, B. C. International Wayside Gold Mines Limited. BC Ministry of Energy, Mines and Petroleum Resources, Assessment
Report 27 211, 26 pages.
Yao, S., E, Doyle. (2020). 2020 Drilling
Summary for Proserpine. Sep. 13 – Nov. 16, Cariboo Mining District Central British Columbia. Barkerville Gold Mines Ltd.,
11 pages. Internal Report.
Yin, J. and Daignault, P. (2007). Report
on the 2006 exploration program on the Cariboo Gold project, Wells, B.C. International Wayside Gold Mines Limited. BC Ministry of Energy,
Mines and Petroleum Resources, Assessment Report 28 990B, 44 pages.
Yin, J. and Daignault, P. (2008). Report
on the 2007 exploration program on the Cariboo Gold project, Wells, B.C. International Wayside Gold Mines Limited. BC Ministry of Energy,
Mines and Petroleum Resources, Assessment Report 29 803, 29 pages
Yin, J. (2010a). Assessment Report on
the 2008 exploration program on the Cariboo Gold project, Wells, B.C. International Wayside Gold Mines Limited. BC Ministry of Energy,
Mines and Petroleum Resources, Assessment Report 30 662A, 40 pages.
Yin, J. (2010b). Assessment Report on
the 2009 drill program on the Cariboo Gold project, Wells, B.C. International Wayside Gold Mines Limited. BC Ministry of Energy, Mines
and Petroleum Resources, Assessment Report 31 464A, 28 pages.
Yin, J. (2011). Assessment Report on
the 2010 drill program on the Cariboo Gold project, Wells, British Columbia. Barkervile Gold Mines Limited. BC Ministry of Energy, Mines
and Petroleum Resources, Assessment Report 32 282, 32 pages.
Yin, J. (2013). Report on the 2011 exploration
program on the Cariboo Gold project, Wells, British Columbia. International Wayside Gold Mines Limited. BC Ministry of Energy, Mines and
Petroleum Resources, Assessment Report 29 803, 29 pages.
Zhu, Y., An, F., & Tan, J.
(2011). Geochemistry of Hydrothermal Gold Deposits. Geoscience Frontiers, v. 2(3), pp. 367–374.
A2GC (2024). Backfill Strength Assessment
in Support of Cariboo Project Permitting. Technical memorandum 2306-CAO-002-M-20240130-vF, 31 pages.
Barton N., Lien R., Lunde J. (1974).
Engineering classification of rock masses for the design of tunnel support. Rock Mech. May, 189-236.
| |
Osisko Development Corp.
NI 43-101 Technical Report
Feasibility Study for the Cariboo Gold Project |
|
Bieniawski, Z.T. (1989). Engineering
rock mass classification. New York: Wiley.
Carter, T.G., Cottrell, B.E., Carvalho,
J.L., and Steed, C.M. (2008). Logistic Regression improvements to the Scaled Span Method for dimensioning Surface Crown Pillars over civil
or mining openings
Clark, L.M. (1998). Minimizing Dilution
in Open Stope Mining with a Focus on Stope Design and Narrow Vein Longhole Blasting (Master’s thesis, University of British Columbia)
Grimstad, E., Barton, N. (1993). Updating
the Q-System for NMT. Proceedings of the International Symposium on Sprayed Concrete – modern use of wet mix sprayed concrete for
underground support, Fagernes. 46-66. Oslo: Norwegian Concrete Assn.
Hardie, C., Belisle, M., Pelletier,
C, Nadeau-Benoit, V., Lecomte, E., Coleman, T., Gauthier, P., Göksu, A., Rutkowski, T., Cunning, J., Salzsauler, K., Poirier, É.,
Willms, D., Liew, M., and Muller, K. (2022). Preliminary Economic Assessment for the Cariboo Gold Project prepared for Osisko Development
Corp., dated May 24, 2022, 546 pages.
Li, L., & Aubertin, M. (2012).
A modified solution to assess the required strength of exposed backfill in mine stopes. Canadian Geotechnical Journal, 49(8),
994-1002.
Mawdesley, C., Trueman, R., &
Whiten, W. J. (2001). Extending the Mathews stability graph for open–stope design. Mining Technology, 110(1), 27-39.
ODV (2024b). Personal communication,
with email attachment of file titled “CACG_ Updated (2022) Old Workings Volume_v0.xlsx” containing a calculated volume of
existing underground working requiring pump out down prior full mine production. Email dated October 10, 2024.
Potvin (1988). Potvin, Y. (1988). Empirical
open stope design in Canada (Doctoral dissertation, University of British Columbia).
Potvin, Y., & Hadjigeorgiou,
J. (2016). Selection of ground support for mining drives based on the Q-system. In 8th International Symposium on Ground Support in Mining
and Underground Construction (pp. 1-16). Ground Support 2016.
Stewart S. B.V., Forsyth W.W. (1995).
The Matthews method for open stope design. CIM Bull., 88, no. 992, pp. 45-53.
SRK (2023). Cariboo Gold Project –
Technical Feasibility Report (Geotechnical). Technical Report prepared for Osisko Development Corporation, Wells, BC, Canada. Project
number: CAPR002084. Issued May.
Williams, E., & Denoncourt,
L. (2004). A Two-phase Backfill Approach to Dilution Control at the Doyon Mine. Techniques d’extraction des gisements filoniens
/ Mining Techniques of Narrow-Vein Deposits.
WSP (2019a). PEA Hydrogeological Study,
Barkerville Gold Mines, Wells, British Columbia.
| |
Osisko Development Corp.
NI 43-101 Technical Report
Feasibility Study for the Cariboo Gold Project |
|
WSP (2023d). Cariboo Gold Project. Mine
Site Hydrogeology Model Report in Support of the Joint Application for a Mines Act and Environmental Management Act Permit. Prepared for
Osisko Development Corp. Prepared by WSP Canada Inc. May 26, 2023.
| 27.3. | Mineral
Processing and Metallurgical Testing |
AMTEL (2024). Deportment of Gold in
Three Ores from the Cariboo Deposit. Report prepared by AMTEL Ltd. (report 24/48), for Osisko Development Corp., dated November 20,
2024; 32 pages.
Base Met Labs (2025). Metallurgical
Testing of the Barkerville Gold Cariboo Project including XRT Sorting – BL1573 APPENDICES. May 23, 2025; 546 pages.
De Paula, R. (2022). Dewatering Studies,
Oracle Project Reference 9232514156, prepared by FLSmidth Inc. for Barkerville Gold – Cariboo, April 5, 2022, 30 pages.
Golder Golder Associates Ltd. (2022).
Cariboo Gold Project – Feasibility Paste Fill Testing Report, Prepared by Golder Associates Ltd. for Osisko Development Corporation,
Vancouver, BC. Doc. No GAL678-1774160-50000-R-RevA; April 2022.
Hansuld, R. and Gajo, M. (2019). An
investigation into metallurgical testing on ore sorting samples from the Cariboo Gold Project, prepared by SGS Canada Inc. for Barkerville
Gold Mines Ltd. Project 15400-02M – draft - August 29, 2019, 52 pages.
Keckes, T. (2024a). Technical Memorandum
- Osisko – Cariboo Gold Project – Summary of Thickening Testing Results, prepared by Metso Canada Inc., Metso No 3500371-TM-Rev0,
December 4, 2024, 4 pages.
Keckes, T. (2024b). Test Report –
Dewatering - 8:1 tail blend, 5:1 tail blend, gold bulk concentrate, prepared by Metso Canada Inc., Metso test case No. 3500369, November 27,
2024, 33 pages.
Kojovic, T., 2016. HIT - A Portable
Field Device for Rapid Hardness Index Testing at Site. Proceedings AusIMM Mill Operators’ Conference 2016, October, Perth WA, pp.
9–16.
Liu, S. and Ashbury, M. (2022a). Slurry
rheology test results for a flotation concentrate sample from the Cariboo, prepared by SGS Canada Inc. (Natural Resources), Rheology Test
Results-Interim Report No.1. SGS Project No. CA20M-00000-110-18880-01, April 11, 2022, 32 pages.
Liu, S. and Ashbury, M. (2022). Slurry
Rheology Test Results for a Flotation Concentrate and a CIP Detoxification Tailings from the Cariboo Project for Barkerville Gold Mines,
prepared by SGS Canada Inc., SGS Project No, CA20M-00000-110-18880-01, April 25, 2022, 64 pages.
Napier-Munn, T J, Morrell, S, Morrison,
R D and Kojovic, T, 1996. Mineral Comminution Circuits: Operation and Optimization, (Julius Kruttschnitt Mineral Research Centre: Brisbane.
| |
Osisko Development Corp.
NI 43-101 Technical Report
Feasibility Study for the Cariboo Gold Project |
|
Pocock Industrials Inc. (2019). Flocculant
Screening, Gravity Sedimentation, Pulp Rheology and Pressure Filtration Studies, conducted for BBA Inc. and Barkerville Cariboo Gold,
May, 2019, 126 pages.
Steinert (2019). TRE-10130-XRT-624 742,
Rev. 02 – XRT Test Work Report, Barkerville Gold Mines – Cariboo Project Waste Rock Sorting Test Work, January 14, 2019,
45 pages.
Sun, B. (2022a). An Investigation into
Metallurgical Testing on Ore Sorting Test Products from the Cariboo Gold Project, prepared by SGS Canada Inc. for Barkerville Gold Mines
Ltd. SGS Project No. 18086-03 – Final Report, dated April 25, 2022, 230 pages.
Sun, B. (2022b). An Investigation into
metallurgical testing on ore sorting test products from the Lowhee project prepared by SGS Canada Inc. for Barkerville Gold Mines Ltd.,
November 11, 2022, 64 pages
Ting, B., Pascual, A. (2024), Cariboo
Gold Project Laboratory Report, prepared by T-Engineering. T-Engineering document No. 24514-RPT-001 rev C, March 11, 2025, 46
pages.
von Ketelhodt, L., and Karem V.
(2022). TRE-18285-KSS-1069, Rev. 0 – XRT Test Work Report, Osisko BGM Lowhee Sample, prepared by Steinert for Barkerville Gold Mines
– Cariboo Ore Sorting Test Work, September 9, 2022, 19 pages.
Zhou, H., and Kapusianyk, L. (2022).
Quantitative X-Ray Diffraction by Rietveld Refinement. Prepared for SGS Met Ops (Osisko – Lowhee). Project No. 18086-06. October 5,
2022.
| 27.4. | Project
Infrastructure |
BCMWRPRC (1991). British Columbia Mine
Waste Rock Pile Research Committee.
Golder (2022a). (Golder Associates Ltd.)
Cariboo Gold Project: Mine Site - Climate Existing Conditions Report. Prepared by Golder Associates Ltd. for Osisko Development Corporation,
WSP Golder Doc. No. GAL137-1774160-30000-R-Rev3, April 2022.
| 27.5. | Environmental
Studies, Permitting, and Social or Community Impact |
BC CDC (2011). Species Summary: Salvelinus
confluentus. BC Ministry of Environment. Available: http://a100.gov.bc.ca/pub/eswp/. Accessed 20 September 2019.
CRD (2000). Cariboo Regional District
North Cariboo Area Rural Land Use Bylaw 3505. Cariboo Regional District. Retrieved from https://cariboord.ic10.esolg.ca//Modules/Bylaws//Bylaw/Details/65a64e0a-b881-47a6-a0d1-8506b85b3474
| |
Osisko Development Corp.
NI 43-101 Technical Report
Feasibility Study for the Cariboo Gold Project |
|
FIDQ (2020). Fisheries
Information Data Query. Retrieved from https://a100.gov.bc.ca/pub/fidq/welcome.do
Golder (2021a). Cariboo Gold Project:
Fish and Fish Habitat Existing Conditions Report. Prepared for Osisko Development Corp. Vancouver, Doc. No. GAL199-1774160-30000-R-Rev1;
May 2021.
Golder (2021b). Cariboo Gold Project:
Vegetation and Ecosystems Existing Conditions Report. Prepared for Osisko Development Corp. Vancouver, Doc. No. GAL240-1774160-30000-R-Rev1;
June 2021.
Golder (2022a). Cariboo Gold Project:
Mine Site - Climate Existing Conditions Report. Prepared by Golder Associates Ltd. for Osisko Development Corporation, WSP Golder Doc.
No. GAL137-1774160-30000-R-Rev3; April, 2022.
Golder (2022f). Cariboo Gold Project:
Geochemistry Existing Conditions Report. Prepared for Osisko Development Corp. Vancouver, Doc. No. GAL093-1774160-30000-R-Rev2; March,
2022.
Golder (2022h). (Golder Associates Ltd.)
Cariboo Gold Project: Mine Site Detailed Climate Change Dataset. Prepared by Golder Associates Ltd. for Osisko Development Corporation,
Vancouver, BC. June 2022.
Golder (2022i). (Golder Associates Ltd.
Cariboo Gold Project: Daily Future Climate Timeseries for Detailed Mine Site Assessments. Prepared by Golder Associates Ltd. for Osisko
Development Corporation, Vancouver, BC. May 2022.
Government of
BC (1985). Fisheries Act. Ottawa: Department of Fisheries and Oceans. Retrieved December 2024, from https://www.google.com/laws-lois.justice.gc.ca
Government of
BC (1996). Mines Act. BC Ministry of Energy and Mines. Retrieved December 2024, from https://www.google.com.bclaws.gov.bc.ca
Government of BC (2024). Mines Act
permit M-247. BGM (Barkerville Gold Mines Ltd.) November 20, 2024.
Government of
BC. Environmental Assessment Certificate M23-01. Retrieved from EAC M23-01 - Cariboo Gold.pdf. October 10, 2023.
Government of BC (1996a). Heritage
Conservation Act. BC Ministry of Forests, Lands, Natural Resource Operations and Rural Development, Archaeology Branch. Retrieved
December 2024, from http://www.bclaws.ca/bclaws_new.
Government of BC (1996b). Land Act.
(FLNRORD, Ed.) BC Ministry of Forests, Lands, Natural Resource Operations, and Rural Development. Retrieved December 2024, from https://www.bclaws.gov.bc.ca/civix/document
| |
Osisko Development Corp.
NI 43-101 Technical Report
Feasibility Study for the Cariboo Gold Project |
|
Government of BC (1996c). Wildlife
Act. (FLNRORD, Ed.) BC Ministry of Forests, Lands, Natural Resource Operations, and Rural Development. Retrieved from https://www.bclaws.gov.bc.ca/civix/document
Government of
BC (1996d). Forest Act. (FLNRORD, Ed.) BC Ministry of Forests, Lands, Natural Resource Operations, and Rural Development. Retrieved
December 2024, from https://www.bclaws.gov.bc.ca/civix/document
Government of
BC (2001). Drinking Water Protection Act. BC Ministry of Health. Retrieved December 2024, from https://www.bclaws.gov.bc.ca/civix/document
Government of
BC (2003). Environmental Management Act. BC Ministry of Environment. Retrieved December 2024, from https://www.google.com/bclaws.gov.bc.ca
Government of
BC (2004). Transportation Act. (MoTI, Ed.) BC Ministry of Transportation and Infrastructure. Retrieved December 2024, from
https://www.bclaws.gov.bc.ca/civix/document
Government of
BC (2008). Public Health Act. BC Ministry of Health. Retrieved December 2024, from https://www.bclaws.gov.bc.ca/civix/document
Government of
BC (2014). Greenhouse Gas Industrial Reporting and Control Act. Retrieved December 2024, from https://www.google.com/bclaws.gov.bc.ca
Government of
BC (2014). Water Sustainability Act. ([. 2. 15, Ed.) BC Ministry of Environment. Retrieved December 2024, from https://www.google.com/bclaws.gov.bc.ca
Government of
BC (2014). Water Sustainability Act. (W. S. Branch, Ed.) BC Ministry of Environment. Retrieved December 2024, from https://www.bclaws.gov.bc.ca/civix/document
Government of BC (2018). Environmental
Assessment Act, Environmental Assessment Act (gov.bc.ca), www.bclaws.gov.bc.ca/civix/document/id/complete/statreg/18051. Accessed
2024. Accessed 2022.
Government of
BC (2019a). Climate Change Accountability Act. https://www.bclaws.gov.bc.ca/civix/document/id/lc/statreg/07042_01. Accessed
April 2021.
Government of
BC (2019b). BC Reg 243/2019. Reviewable Projects Regulation, https://www.bclaws.gov.bc.ca/civix/document/id/complete/statreg/243_2019#part3.
Accessed December 2020.
Government of
BC (2020). Reviewable Projects Regulation. BC Ministry of Environment and Climate Change Strategy. Retrieved December 2024,
from https://www.google.com/bclaws.gov.bc.ca
| |
Osisko Development Corp.
NI 43-101 Technical Report
Feasibility Study for the Cariboo Gold Project |
|
Government of
BC (2021). Health, Safety and Reclamation Code for Mines in British Columbia. BC Ministry of Energy, Mines and Low Carbon Innovation.
Retrieved December 2024, from https://www2.gov.bc.ca/assets/mineral-exploration-mining.pdf
Government of Canada (1985). Explosives
Act (R.S.C., 1985, c. E-17). https://laws-lois.justice.gc.ca/eng/acts/E-17/index.html
Government of
Canada (1985a). Seeds Act. Ottawa. Retrieved December 2024, from https://www.google.com/laws-lois.justice.gc.ca
Government of
Canada (1994). Migratory Birds Convention Act. Retrieved December 2024, from https://www.google.com/laws.justice.gc.ca
Government of
Canada (2001). Transportation of Dangerous Goods Regulation. Retrieved December 2024, from https://laws-lois.justice.gc.ca/eng/regulations/SOR-2001-286/index.html
Government of
Canada (2002). Metal and Diamond Mining Effluent Regulations. Ottawa. Retrieved December 2024, from https://www.google.com/laws-lois.justice.gc.ca
Government of Canada (2002a). Species
at Risk Act. S.C. 2002, c.29. Current to June 30, 2021. https://laws-lois.justice.gc.ca/eng/acts/s-15.3/
InnovExplo (2025a). Complete list of
references for all available records relating to historical work on the regional mineral claims of the Cariboo Gold Project by previous
owners for the period 1949 to 2024.
InnovExplo (2025b). MINFILEs - Summary
table of mineralized occurrences.
Klohn Crippen Berger Ltd. (KCB) (2021).
Cariboo Gold Project Alternatives Assessment for Tailings Management at QR Mill. February 23, 2021.
Mavin Terra Solutions (2020). Bonanza
Ledge Mine. Water Balance and Water Quality Model. 2020 Update. Prepared for Barkerville Gold Mine Ltd. May 2020.
Ministry of Mining and Critical Minerals,
Mines Act.
Ministry of Energy, Mines and Low Carbon
Innovation (2024). Health, Safety and Reclamation Code for Mines in British Columbia. Ministry of Energy and Mines. Victoria, British
Columbia. Revised April 2024.
Morgan, C. and Wright, P. (2020). Wells-Barkerville
Community Forest Mapping Project. Natural Resources and Environmental Studies Institute. Technical Report Series No. 3, University
of Northern British Columbia, Prince George, B.C., Canada.
ODV, 2023. Cariboo Gold Project Joint
Permit Application for Mines Act and Environmental Management Act Permits. Appendix 9-06A Mine Site Water Management Plan, Section 6.2.6
Backwash. May 2023.
| |
Osisko Development Corp.
NI 43-101 Technical Report
Feasibility Study for the Cariboo Gold Project |
|
ODV (2024a). Water quality and flow
rate monitoring datasets provided by Kayly Phipps (ODV’s Environmental superintendent) via e-mails sent to Falkirk Environmental
Consultants between March and December of 2024.
ODV (2024c). Personal communication,
meeting with Rob Griffith (Falkirk) and Victor Gauthier (ODV) related to WTP capacities in a WTP design update meeting with Falkirk, ODV, Integrated
Sustainability. December 5, 2024.
ODV (2025). Personal communication between
Rob Griffith (Falkirk) and Victor Gauthier (ODV), Email dated Feb 3, 2025.
Paige and Darling
(2009). A Framework for Monitoring & Evaluating Wildlife Resource Values. BC Ministry of Environment and Ministry of Forests
and Range. 2009. Retrieved from https://www2.gov.bc.ca/assets/gov/farming-natural-resources-and-industry/forestry/frep/frep-docs/wildlife_framework_paper.pdf
Province of BC (1998). Cariboo Chilcotin
Regional Land Use Plan Integration Report. BC Ministry of Forests, Lands, Natural Resource Operations and Rural Development.
Retrieved March 2022, from https://www2.gov.bc.ca/assets/download/9A4DBA0C02834A07878B78FB3C8DE80E
Province of BC (2007). Quesnel Sustainable
Resource Management Plan (QSRMP). BC Ministry of Forests, Lands, Natural Resource Operations, and Rural Development (FLNRORD).
Retrieved March 2022, from https://www2.gov.bc.ca/gov/content/industry/crown-land-water/land-use-planning/regions/cariboo/cariboochilcotin-rlup/quesnel-srmp
Province of BC
(2018). BC Environmental Assessment Act (BCEAA). Victoria: BC Ministry of Environment. Retrieved March 2022, from
https://www.google.com/url?sa=t&rct=j&q=&esrc=s&source=web&cd=&cad=rja&uact=8&ved=2ahUKEwjUh9KhhPv2AhXCIDQIHWF8CD8QFnoECAoQAQ&url=https%3A%2F%2Fwww.bclaws.gov.bc.ca%2Fcivix%2Fdocument%2Fid%2Fcomplete%2Fstatreg%2F18051&usg=AOvVaw0Qir0XoS63-jn_tEVTI4g4
Province of BC (2019). Declaration
on the Rights of Indigenous Peoples Act. Victoria. Retrieved March 2022, from https://www.bclaws.gov.bc.ca/civix/document/id/complete/statreg/19044
Province of BC (2019a). Environmental
Assessment Fees Regulation. BC Ministry of Environment and Climate Change Strategy. Retrieved March 2022, from http://www.bclaws.ca/civix/document/id/complete/statreg/246_2019
Province of BC (2019b). Violation
Ticket Administration and Fines Regulation. BC Ministry of Environment and Climate Change Strategy. Retrieved March 2022, from
http://www.bclaws.ca/civix/document/id/complete/statreg/89_97_00
| |
Osisko Development Corp.
NI 43-101 Technical Report
Feasibility Study for the Cariboo Gold Project |
|
Province of BC (2020a). Administrative
Penalties Regulation. BC Ministry of Environment and Climate Change Strategy. Retrieved March 2022, from http://www.bclaws.ca/civix/document/id/complete/statreg/64_2020
Statistics Canada (2021). Labour Force
Characteristics by Industry Retrieved from Labour force characteristics by industry, annual (statcan.gc.ca) Accessed 2021.
Wang, T., Hamann,
A., Spittlehouse, D., Carroll, C. (2016). Locally downscaled and spatially customizable climate data for historical and future periods
for North America. PLoS ONE 11(6): e0156720. https://doi.org/10.1371/journal.pone.0156720
WSP (2021). WSP Tech Memo 11 Chapter
7.2 Air Quality Comment ID#ENV-37 and ENV-84. December 10, 2021.
WSP (2022a). Cariboo Gold Project -
Contemporary Land and Resource Use Existing Conditions Report. Prepared by Golder Associates Ltd. for Osisko Development Corporation,
Vancouver, BC.
WSP (2022b). Technical Memo 6 Section 7.9
- Freshwater Fish, January, 2022.
WSP (2023). Clarification regarding
the Cariboo Gold Project mine site water management plan. Reference No. GAL1078-1774160-50000-L-Rev1. November 10, 2023.
| 27.6. | Mine
Reclamation and Closure |
British Columbia Ministry of Energy,
Mines and Low Carbon Innovation (2024). Health, Safety and Reclamation Code for Mines in British Columbia. Ministry of Energy and Mines.
Victoria, British Columbia. Revised April 2024.
Golder (2022j). (Golder Associates Ltd.)
Cariboo Gold Project – Bonding Level Cost Estimate for the Proposed Cariboo gold Mine Project. Prepared by Golder Associates Ltd.
for Osisko Development Corporation, Vancouver, BC. Doc. No GAL857-1774160-50000-L-Rev 1; November 2022.
Government of BC (1996). BC Mines
Act, RSBC 1996, c 293. Queen’s Printer, Victoria, BC.
Government of BC (2003). Environmental
Management Act. SBC 2003, c. 53. Queen’s Printer, Victoria, BC.
Government of BC (2014). Water Sustainability
Act. SBC 2014, c 15. Queen’s Printer, Victoria, BC.
Government of Canada (1985a). Fisheries
Act. R.S.C., 1985, c. F-14. Available at https://laws-lois.justice.gc.ca/eng/acts/f-14/.
Government of Canada (1985b). Fisheries
Act Authorization.
Government of Canada (1985b). Canada
Seeds Act. R.S.C., 1985, c.S-8, 13 pages.
| |
Osisko Development Corp.
NI 43-101 Technical Report
Feasibility Study for the Cariboo Gold Project |
|
Government of Canada (1994). Migratory
Birds Convention Act. R.S.C., 1994, c. 22. Available at https://laws-lois.justice.gc.ca/eng/acts/m-7.01/).
Government of Canada (2002). Metal and
Diamond Mining Effluent Regulations. R.S.C., 2002, SOR/2002-222. Available at https://laws-lois.justice.gc.ca/PDF/SOR-2002-222.pdf.
| 27.7. | Surface
Water Management |
ECCC (2019) Environment Canada Climate
Change. Historical Climate Data. Accessed January 2019. http://climate.weather.gc.ca.
Falkirk (2025). Cariboo Gold Project
– Water and Load Balance in Support of a Feasibility Study. Prepared for Osisko Development Corp. May 2025.
Golder (2021). Bonanza Ledge Phase II.
Joint Permit Amendment Application BL Mine Water Management Plan. Submitted to Barkerville Gold Mines Ltd. Submitted by Golder Associates
Ltd. GAL311-1774160-60000-R-Rev1. July 7, 2021.
Golder (2022h). (Golder Associates Ltd.)
Cariboo Gold Project: Mine Site Detailed Climate Change Dataset. Prepared by Golder Associates Ltd. for Osisko Development Corporation,
Golder Doc. No. GAL726-1774160-50000-R-Rev0; December 2022.
Golder (2022i). (Golder Associates Ltd.)
Cariboo Gold Project: Daily Future Climate Timeseries for Detailed Mine Site Assessments. Prepared by Golder Associates Ltd. for Osisko
Development Corporation, Golder Doc. No. GAL711-1774160-50000-TM-Rev0 2022; December 2022.
KP (2024). Cariboo Gold Project. Bonanza
Ledge Sediment Control Pond and Underdrain Design Report. Prepared by Knight Piesold. Rev 0. November 27, 2024.
WSP (2023). Cariboo Gold Project Bonanza
Ledge Flood Management Reservoir Concept Assessment. Prepared for ODV. May 24, 2023. GAL992-1774160-50000-TM-Rev0.
WSP (2023a). Cariboo Gold Project: Supplemental
Geochemistry Existing Conditions Report. Prepared for Osisko Development Corp. Vancouver, Doc. No. GAL920-1774160-50000-R-Rev0; May,
2023.
WSP (2023b). Cariboo Gold Project. Feasibility
Paste Fill Testing. Prepared for ODV. March 21, 2023. GAL678-1774160-50000-R-Rev0.
WSP (2023c). Cariboo Gold Mine Project:
Mine Site and Receiving Environment Water Quality Model Report. Prepared for Osisko Development Corp. Doc. No. GAL924-1774160-50000-R-Rev0;
May 2023.
| |
Osisko Development Corp.
NI 43-101 Technical Report
Feasibility Study for the Cariboo Gold Project |
|
APPENDIX
1: List of Mineral Claims and Leases (as of April 30, 2025)
| |
Osisko Development Corp.
NI 43-101 Technical Report
Feasibility Study for the Cariboo Gold Project |
|
| #
Title |
Title
Type |
Property |
Owner |
Issue
Date |
Good
To Date |
Area
(Ha) |
Royalties |
| 203991 |
Mineral
Claim |
Cariboo
Gold |
BGM
(50%) and Imperial Metals Corp. (50%) |
07-Sep-76 |
13-Nov-32 |
75.00 |
Osisko
Gold Royalties Ltd. (5%) |
| 204176 |
Mineral
Claim |
Cariboo
Gold |
BGM
(50%) and Imperial Metals Corp. (50%) |
14-Aug-79 |
13-Nov-32 |
25.00 |
Osisko
Gold Royalties Ltd. (5%) |
| 204177 |
Mineral
Claim |
Cariboo
Gold |
BGM
(50%) and Imperial Metals Corp. (50%) |
14-Aug-79 |
13-Nov-32 |
25.00 |
Osisko
Gold Royalties Ltd. (5%) |
| 204753 |
Mineral
Claim |
Cariboo
Gold |
BGM
(50%) and Imperial Metals Corp. (50%) |
11-Jul-83 |
13-Nov-32 |
25.00 |
Osisko
Gold Royalties Ltd. (5%) |
| 204754 |
Mineral
Claim |
Cariboo
Gold |
BGM
(50%) and Imperial Metals Corp. (50%) |
11-Jul-83 |
13-Nov-32 |
25.00 |
Osisko
Gold Royalties Ltd. (5%) |
| 204755 |
Mineral
Claim |
Cariboo
Gold |
BGM
(50%) and Imperial Metals Corp. (50%) |
11-Jul-83 |
13-Nov-32 |
25.00 |
Osisko
Gold Royalties Ltd. (5%) |
| 205247 |
Mineral
Claim |
Cariboo
Gold |
BGM
(50%) and Imperial Metals Corp. (50%) |
19-Aug-86 |
13-Nov-32 |
500.00 |
Osisko
Gold Royalties Ltd. (5%) |
| 205267 |
Mineral
Claim |
Cariboo
Gold |
BGM
(50%) and Imperial Metals Corp. (50%) |
18-Sep-86 |
13-Nov-32 |
300.00 |
Osisko
Gold Royalties Ltd. (5%) |
| 367954 |
Mineral
Claim |
Cariboo
Gold |
BGM
(100%) |
23-Feb-99 |
18-Apr-33 |
25.00 |
Osisko
Gold Royalties Ltd. (5%), Melvin Lee Zeiler (2%) (whole) |
| 367955 |
Mineral
Claim |
Cariboo
Gold |
BGM
(100%) |
23-Feb-99 |
18-Apr-33 |
25.00 |
Osisko
Gold Royalties Ltd. (5%), Melvin Lee Zeiler (2%) (whole) |
| 369917 |
Mineral
Claim |
Cariboo
Gold |
BGM
(100%) |
03-Jul-99 |
18-Apr-32 |
25.00 |
Osisko
Gold Royalties Ltd. (5%), Osisko Gold Royalties Ltd. (whole) (2.5%) |
| 369918 |
Mineral
Claim |
Cariboo
Gold |
BGM
(100%) |
03-Jul-99 |
18-Apr-32 |
25.00 |
Osisko
Gold Royalties Ltd. (5%), Osisko Gold Royalties Ltd. (whole) (2.5%) |
| 370010 |
Mineral
Claim |
Cariboo
Gold |
BGM
(100%) |
07-Jul-99 |
18-Apr-32 |
500.00 |
Osisko
Gold Royalties Ltd. (5%), Osisko Gold Royalties Ltd. (whole) (2.5%) |
| 370011 |
Mineral
Claim |
Cariboo
Gold |
BGM
(100%) |
06-Jul-99 |
18-Apr-32 |
25.00 |
Osisko
Gold Royalties Ltd. (5%), Osisko Gold Royalties Ltd. (whole) (2.5%) |
| 370012 |
Mineral
Claim |
Cariboo
Gold |
BGM
(100%) |
06-Jul-99 |
18-Apr-32 |
25.00 |
Osisko
Gold Royalties Ltd. (5%), Osisko Gold Royalties Ltd. (whole) (2.5%) |
| 370013 |
Mineral
Claim |
Cariboo
Gold |
BGM
(100%) |
06-Jul-99 |
18-Apr-32 |
25.00 |
Osisko
Gold Royalties Ltd. (5%), Osisko Gold Royalties Ltd. (whole) (2.5%) |
| 370014 |
Mineral
Claim |
Cariboo
Gold |
BGM
(100%) |
06-Jul-99 |
18-Apr-32 |
25.00 |
Osisko
Gold Royalties Ltd. (5%), Osisko Gold Royalties Ltd. (whole) (2.5%) |
| 370015 |
Mineral
Claim |
Cariboo
Gold |
BGM
(100%) |
06-Jul-99 |
18-Apr-32 |
25.00 |
Osisko
Gold Royalties Ltd. (5%), Osisko Gold Royalties Ltd. (whole) (2.5%) |
| 370016 |
Mineral
Claim |
Cariboo
Gold |
BGM
(100%) |
08-Jul-99 |
18-Apr-32 |
25.00 |
Osisko
Gold Royalties Ltd. (5%), Osisko Gold Royalties Ltd. (whole) (2.5%) |
| 370028 |
Mineral
Claim |
Cariboo
Gold |
BGM
(100%) |
06-Jul-99 |
18-Apr-32 |
25.00 |
Osisko
Gold Royalties Ltd. (5%), Osisko Gold Royalties Ltd. (whole) (2.5%) |
| 370029 |
Mineral
Claim |
Cariboo
Gold |
BGM
(100%) |
06-Jul-99 |
18-Apr-32 |
25.00 |
Osisko
Gold Royalties Ltd. (5%), Osisko Gold Royalties Ltd. (whole) (2.5%) |
| 370030 |
Mineral
Claim |
Cariboo
Gold |
BGM
(100%) |
07-Jul-99 |
18-Apr-32 |
25.00 |
Osisko
Gold Royalties Ltd. (5%), Osisko Gold Royalties Ltd. (whole) (2.5%) |
| 370230 |
Mineral
Claim |
Cariboo
Gold |
BGM
(100%) |
14-Jul-99 |
18-Apr-32 |
25.00 |
Osisko
Gold Royalties Ltd. (5%), Osisko Gold Royalties Ltd. (whole) (2.5%) |
| 370234 |
Mineral
Claim |
Cariboo
Gold |
BGM
(100%) |
15-Jul-99 |
18-Apr-32 |
25.00 |
Osisko
Gold Royalties Ltd. (5%), Osisko Gold Royalties Ltd. (whole) (2.5%) |
| 374225 |
Mineral
Claim |
Cariboo
Gold |
BGM
(100%) |
13-Jan-00 |
18-Apr-33 |
25.00 |
Osisko
Gold Royalties Ltd. (5%) |
| 374226 |
Mineral
Claim |
Cariboo
Gold |
BGM
(100%) |
13-Jan-00 |
18-Apr-33 |
25.00 |
Osisko
Gold Royalties Ltd. (5%) |
| 374227 |
Mineral
Claim |
Cariboo
Gold |
BGM
(100%) |
13-Jan-00 |
18-Apr-33 |
25.00 |
Osisko
Gold Royalties Ltd. (5%) |
| 374228 |
Mineral
Claim |
Cariboo
Gold |
BGM
(100%) |
13-Jan-00 |
18-Apr-33 |
25.00 |
Osisko
Gold Royalties Ltd. (5%) |
| 374229 |
Mineral
Claim |
Cariboo
Gold |
BGM
(100%) |
13-Jan-00 |
18-Apr-33 |
25.00 |
Osisko
Gold Royalties Ltd. (5%) |
| 374230 |
Mineral
Claim |
Cariboo
Gold |
BGM
(100%) |
13-Jan-00 |
18-Apr-33 |
25.00 |
Osisko
Gold Royalties Ltd. (5%) |
| 374231 |
Mineral
Claim |
Cariboo
Gold |
BGM
(100%) |
13-Jan-00 |
18-Apr-33 |
25.00 |
Osisko
Gold Royalties Ltd. (5%) |
| 374232 |
Mineral
Claim |
Cariboo
Gold |
BGM
(100%) |
13-Jan-00 |
18-Apr-33 |
25.00 |
Osisko
Gold Royalties Ltd. (5%) |
| 374233 |
Mineral
Claim |
Cariboo
Gold |
BGM
(100%) |
13-Jan-00 |
18-Apr-33 |
25.00 |
Osisko
Gold Royalties Ltd. (5%) |
| 374234 |
Mineral
Claim |
Cariboo
Gold |
BGM
(100%) |
13-Jan-00 |
18-Apr-33 |
25.00 |
Osisko
Gold Royalties Ltd. (5%) |
| 374706 |
Mineral
Claim |
Cariboo
Gold |
BGM
(100%) |
08-Mar-00 |
18-Apr-33 |
25.00 |
Osisko
Gold Royalties Ltd. (5%) |
| 374707 |
Mineral
Claim |
Cariboo
Gold |
BGM
(100%) |
08-Mar-00 |
18-Apr-33 |
25.00 |
Osisko
Gold Royalties Ltd. (5%) |
| 374708 |
Mineral
Claim |
Cariboo
Gold |
BGM
(100%) |
08-Mar-00 |
18-Apr-33 |
25.00 |
Osisko
Gold Royalties Ltd. (5%) |
| 374709 |
Mineral
Claim |
Cariboo
Gold |
BGM
(100%) |
08-Mar-00 |
18-Apr-33 |
25.00 |
Osisko
Gold Royalties Ltd. (5%) |
| 374710 |
Mineral
Claim |
Cariboo
Gold |
BGM
(100%) |
08-Mar-00 |
18-Apr-33 |
25.00 |
Osisko
Gold Royalties Ltd. (5%) |
| |
Osisko Development Corp.
NI 43-101 Technical Report
Feasibility Study for the Cariboo Gold Project |
|
| #
Title |
Title
Type |
Property |
Owner |
Issue
Date |
Good
To Date |
Area
(Ha) |
Royalties |
| 374711 |
Mineral
Claim |
Cariboo
Gold |
BGM
(100%) |
08-Mar-00 |
18-Apr-33 |
25.00 |
Osisko
Gold Royalties Ltd. (5%) |
| 374712 |
Mineral
Claim |
Cariboo
Gold |
BGM
(100%) |
08-Mar-00 |
18-Apr-33 |
25.00 |
Osisko
Gold Royalties Ltd. (5%) |
| 374713 |
Mineral
Claim |
Cariboo
Gold |
BGM
(100%) |
08-Mar-00 |
18-Apr-33 |
25.00 |
Osisko
Gold Royalties Ltd. (5%) |
| 375260 |
Mineral
Claim |
Cariboo
Gold |
BGM
(50%) and Imperial Metals Corp. (50%) |
09-Apr-00 |
13-Nov-32 |
400.00 |
Osisko
Gold Royalties Ltd. (5%) |
| 384112 |
Mineral
Claim |
Cariboo
Gold |
BGM
(100%) |
19-Feb-01 |
18-Apr-33 |
300.00 |
Osisko
Gold Royalties Ltd. (5%), Melvin Lee Zeiler (2%) (whole) |
| 384113 |
Mineral
Claim |
Cariboo
Gold |
BGM
(100%) |
19-Feb-01 |
18-Apr-33 |
400.00 |
Osisko
Gold Royalties Ltd. (5%), Melvin Lee Zeiler (2%) (whole) |
| 412065 |
Mineral
Claim |
Cariboo
Gold |
BGM
(100%) |
08-Jul-04 |
18-Apr-32 |
500.00 |
Osisko
Gold Royalties Ltd. (5%), & Estate of Bryan Muloin (whole) (3% of 2% NSR) |
| 412066 |
Mineral
Claim |
Cariboo
Gold |
BGM
(100%) |
08-Jul-04 |
18-Apr-32 |
375.00 |
Osisko
Gold Royalties Ltd. (5%), Osisko Gold Royalties Ltd. (97% of 2% NSR) & Estate of Bryan Muloin (whole) (3% of 2% NSR) |
| 505901 |
Mineral
Claim |
Cariboo
Gold |
BGM
(100%) |
04-Feb-05 |
18-Apr-32 |
349.67 |
Osisko
Gold Royalties Ltd. (5%) |
| 505905 |
Mineral
Claim |
Cariboo
Gold |
BGM
(100%) |
04-Feb-05 |
18-Apr-33 |
972.78 |
Osisko
Gold Royalties Ltd. (5%) |
| 505910 |
Mineral
Claim |
Cariboo
Gold |
BGM
(100%) |
04-Feb-05 |
18-Apr-32 |
1,265.76 |
Osisko
Gold Royalties Ltd. (5%) |
| 505914 |
Mineral
Claim |
Cariboo
Gold |
BGM
(100%) |
04-Feb-05 |
18-Apr-33 |
1,399.53 |
Osisko
Gold Royalties Ltd. (5%) |
| 505916 |
Mineral
Claim |
Cariboo
Gold |
BGM
(100%) |
04-Feb-05 |
18-Apr-33 |
1,164.10 |
Osisko
Gold Royalties Ltd. (5%), Douglas Merrick & Harold Merrick (partial) (2%) |
| 505917 |
Mineral
Claim |
Cariboo
Gold |
BGM
(100%) |
04-Feb-05 |
18-Apr-33 |
658.93 |
Osisko
Gold Royalties Ltd. (5%), Douglas Merrick & Harold Merrick (partial) (2%) |
| 505921 |
Mineral
Claim |
Cariboo
Gold |
BGM
(100%) |
04-Feb-05 |
18-Apr-33 |
914.78 |
Osisko
Gold Royalties Ltd. (5%) |
| 505922 |
Mineral
Claim |
Cariboo
Gold |
BGM
(100%) |
04-Feb-05 |
18-Apr-33 |
583.13 |
Osisko
Gold Royalties Ltd. (5%) |
| 505924 |
Mineral
Claim |
Cariboo
Gold |
BGM
(100%) |
04-Feb-05 |
18-Apr-32 |
543.58 |
Osisko
Gold Royalties Ltd. (5%) |
| 505925 |
Mineral
Claim |
Cariboo
Gold |
BGM
(100%) |
04-Feb-05 |
18-Apr-33 |
1,066.31 |
Osisko
Gold Royalties Ltd. (5%), Douglas Merrick & Harold Merrick (partial) (2%) |
| 505926 |
Mineral
Claim |
Cariboo
Gold |
BGM
(100%) |
04-Feb-05 |
18-Apr-33 |
310.41 |
Osisko
Gold Royalties Ltd. (5%), Douglas Merrick & Harold Merrick (partial) (2%) |
| 505927 |
Mineral
Claim |
Cariboo
Gold |
BGM
(100%) |
04-Feb-05 |
18-Apr-32 |
738.06 |
Osisko
Gold Royalties Ltd. (5%) |
| 505936 |
Mineral
Claim |
Cariboo
Gold |
BGM
(100%) |
04-Feb-05 |
18-Apr-33 |
426.62 |
Osisko
Gold Royalties Ltd. (5%), Douglas Merrick & Harold Merrick (partial) (2%) |
| 506154 |
Mineral
Claim |
Cariboo
Gold |
BGM
(100%) |
07-Feb-05 |
18-Apr-32 |
155.56 |
Osisko
Gold Royalties Ltd. (5%) |
| 506315 |
Mineral
Claim |
Cariboo
Gold |
BGM
(100%) |
08-Feb-05 |
18-Apr-33 |
894.11 |
Osisko
Gold Royalties Ltd. (5%) |
| 506436 |
Mineral
Claim |
Cariboo
Gold |
BGM
(100%) |
09-Feb-05 |
18-Apr-33 |
408.28 |
Osisko
Gold Royalties Ltd. (5%) |
| 506440 |
Mineral
Claim |
Cariboo
Gold |
BGM
(100%) |
09-Feb-05 |
18-Apr-33 |
972.35 |
Osisko
Gold Royalties Ltd. (5%), Osisko Gold Royalties Ltd. (partial) (2%) |
| 506489 |
Mineral
Claim |
Cariboo
Gold |
BGM
(100%) |
09-Feb-05 |
18-Apr-32 |
388.47 |
Osisko
Gold Royalties Ltd. (5%) |
| 506493 |
Mineral
Claim |
Cariboo
Gold |
BGM
(100%) |
09-Feb-05 |
13-Nov-32 |
1,549.54 |
Osisko
Gold Royalties Ltd. (5%) |
| 506497 |
Mineral
Claim |
Cariboo
Gold |
BGM
(100%) |
09-Feb-05 |
18-Apr-33 |
853.84 |
Osisko
Gold Royalties Ltd. (5%), Osisko Gold Royalties Ltd. (partial) (2%) |
| 506614 |
Mineral
Claim |
Cariboo
Gold |
BGM
(100%) |
10-Feb-05 |
18-Apr-32 |
1,167.70 |
Osisko
Gold Royalties Ltd. (5%) |
| 506618 |
Mineral
Claim |
Cariboo
Gold |
BGM
(100%) |
10-Feb-05 |
18-Apr-32 |
622.63 |
Osisko
Gold Royalties Ltd. (5%) |
| 506620 |
Mineral
Claim |
Cariboo
Gold |
BGM
(100%) |
10-Feb-05 |
18-Apr-33 |
933.89 |
Osisko
Gold Royalties Ltd. (5%), Osisko Gold Royalties Ltd. (partial) (2%), Osisko Gold Royalties Ltd. (partial) (2%), Osisko Gold Royalties
Ltd. (partial) (2%) |
| 506630 |
Mineral
Claim |
Cariboo
Gold |
BGM
(100%) |
10-Feb-05 |
18-Apr-32 |
350.79 |
Osisko
Gold Royalties Ltd. (5%), Osisko Gold Royalties Ltd. (partial) (2%) |
| 506637 |
Mineral
Claim |
Cariboo
Gold |
BGM
(100%) |
10-Feb-05 |
13-Nov-32 |
1,131.33 |
Osisko
Gold Royalties Ltd. (5%), Osisko Gold Royalties Ltd. (partial) (2%), Osisko Gold Royalties Ltd. (partial) (2.5%) |
| 506658 |
Mineral
Claim |
Cariboo
Gold |
BGM
(100%) |
10-Feb-05 |
18-Apr-32 |
506.36 |
Osisko
Gold Royalties Ltd. (5%), Osisko Gold Royalties Ltd. (partial) (2%) |
| 506720 |
Mineral
Claim |
Cariboo
Gold |
BGM
(100%) |
10-Feb-05 |
18-Apr-33 |
1,085.46 |
Osisko
Gold Royalties Ltd. (5%), Charnobay/Wells Syndicate (partial) (3%) |
| 506721 |
Mineral
Claim |
Cariboo
Gold |
BGM
(100%) |
10-Feb-05 |
18-Apr-33 |
1,070.04 |
Osisko
Gold Royalties Ltd. (5%), Osisko Gold Royalties Ltd. (partial) (2%), Osisko Gold Royalties Ltd. (partial) (2%) |
| 506956 |
Mineral
Claim |
Cariboo
Gold |
BGM
(100%) |
11-Feb-05 |
18-Apr-33 |
1,247.95 |
Osisko
Gold Royalties Ltd. (5%), Osisko Gold Royalties Ltd. (partial) (2%), Osisko Gold Royalties Ltd. (partial) (2.5%) |
| |
Osisko Development Corp.
NI 43-101 Technical Report
Feasibility Study for the Cariboo Gold Project |
|
| #
Title |
Title
Type |
Property |
Owner |
Issue
Date |
Good
To Date |
Area
(Ha) |
Royalties |
| 507131 |
Mineral
Claim |
Cariboo
Gold |
BGM
(85%), Standard Drilling & Engineering Ltd. (12.5%), Shane Morgan Williams (2.5%) |
14-Feb-05 |
18-Apr-32 |
562.74 |
Osisko
Gold Royalties Ltd. (5%) |
| 507132 |
Mineral
Claim |
Cariboo
Gold |
BGM
(97.5%), Shane Morgan Williams (2.5%) |
14-Feb-05 |
18-Apr-32 |
931.38 |
Osisko
Gold Royalties Ltd. (5%), William G. Timmins (partial) (2.5%) |
| 507133 |
Mineral
Claim |
Cariboo
Gold |
BGM
(97.5%), Shane Morgan Williams (2.5%) |
14-Feb-05 |
18-Apr-32 |
1,339.02 |
Osisko
Gold Royalties Ltd. (5%) |
| 507134 |
Mineral
Claim |
Cariboo
Gold |
BGM
(97.5%), Shane Morgan Williams (2.5%) |
14-Feb-05 |
18-Apr-32 |
543.03 |
Osisko
Gold Royalties Ltd. (5%), William G. Timmins (partial) (2.5), Osisko Gold Royalties Ltd. (partial) (2%) |
| 507135 |
Mineral
Claim |
Cariboo
Gold |
BGM
(97.5%), Shane Morgan Williams (2.5%) |
14-Feb-05 |
18-Apr-32 |
911.60 |
Osisko
Gold Royalties Ltd. (5%) |
| 507136 |
Mineral
Claim |
Cariboo
Gold |
BGM
(97.5%), Shane Morgan Williams (2.5%) |
14-Feb-05 |
18-Apr-32 |
872.37 |
Osisko
Gold Royalties Ltd. (5%), . & Osisko Gold Royalties Ltd. (partial) (2%) |
| 507247 |
Mineral
Claim |
Cariboo
Gold |
BGM
(100%) |
15-Feb-05 |
18-Apr-32 |
698.82 |
Osisko
Gold Royalties Ltd. (5%) |
| 507248 |
Mineral
Claim |
Cariboo
Gold |
BGM
(100%) |
15-Feb-05 |
18-Apr-33 |
621.30 |
Osisko
Gold Royalties Ltd. (5%) |
| 507259 |
Mineral
Claim |
Cariboo
Gold |
BGM
(100%) |
15-Feb-05 |
18-Apr-33 |
252.33 |
Osisko
Gold Royalties Ltd. (5%) |
| 507260 |
Mineral
Claim |
Cariboo
Gold |
BGM
(100%) |
15-Feb-05 |
18-Apr-32 |
19.41 |
Osisko
Gold Royalties Ltd. (5%) |
| 507261 |
Mineral
Claim |
Cariboo
Gold |
BGM
(100%) |
15-Feb-05 |
18-Apr-33 |
620.63 |
Osisko
Gold Royalties Ltd. (5%) |
| 507264 |
Mineral
Claim |
Cariboo
Gold |
BGM
(100%) |
15-Feb-05 |
18-Apr-33 |
1,026.62 |
Osisko
Gold Royalties Ltd. (5%), Charnobay/Wells Syndicate (partial) (3%) |
| 507265 |
Mineral
Claim |
Cariboo
Gold |
BGM
(100%) |
15-Feb-05 |
18-Apr-32 |
542.59 |
Osisko
Gold Royalties Ltd. (5%), . & Osisko Gold Royalties Ltd. (partial) (2%) |
| 507288 |
Mineral
Claim |
Cariboo
Gold |
BGM
(100%) |
16-Feb-05 |
18-Apr-32 |
426.36 |
Osisko
Gold Royalties Ltd. (5%), . & Osisko Gold Royalties Ltd. (partial) (2%) |
| 507304 |
Mineral
Claim |
Cariboo
Gold |
BGM
(100%) |
16-Feb-05 |
18-Apr-32 |
388.20 |
Osisko
Gold Royalties Ltd. (5%), Osisko Gold Royalties Ltd. (partial) (2%) |
| 507309 |
Mineral
Claim |
Cariboo
Gold |
BGM
(100%) |
16-Feb-05 |
18-Apr-32 |
1,030.24 |
Osisko
Gold Royalties Ltd. (5%), Osisko Gold Royalties Ltd. (partial) (1%) |
| 508778 |
Mineral
Claim |
Cariboo
Gold |
BGM
(100%) |
11-Mar-05 |
18-Apr-32 |
775.28 |
Osisko
Gold Royalties Ltd. (5%), . & Osisko Gold Royalties Ltd. (partial) (2%) |
| 508905 |
Mineral
Claim |
Cariboo
Gold |
BGM
(100%) |
14-Mar-05 |
13-Nov-32 |
871.72 |
Osisko
Gold Royalties Ltd. (5%) |
| 509015 |
Mineral
Claim |
Cariboo
Gold |
BGM
(100%) |
16-Mar-05 |
18-Apr-32 |
193.86 |
Osisko
Gold Royalties Ltd. (5%), . & Osisko Gold Royalties Ltd. (partial) (2%) |
| 509017 |
Mineral
Claim |
Cariboo
Gold |
BGM
(100%) |
16-Mar-05 |
18-Apr-32 |
639.85 |
Osisko
Gold Royalties Ltd. (5%), William G. Timmins (partial) (2.5), Osisko Gold Royalties Ltd. (partial) (2%) |
| 509179 |
Mineral
Claim |
Cariboo
Gold |
BGM
(100%) |
17-Mar-05 |
13-Nov-32 |
833.23 |
Osisko
Gold Royalties Ltd. (5%), . & Osisko Gold Royalties Ltd. (partial) (2%) |
| 512571 |
Mineral
Claim |
Cariboo
Gold |
BGM
(85%), Standard Drilling & Engineering Ltd. (12.5%), Shane Morgan Williams (2.5%) |
14-May-05 |
18-Apr-32 |
484.93 |
Osisko
Gold Royalties Ltd. (5%), William G. Timmins (partial) (2.5%) |
| 512739 |
Mineral
Claim |
Cariboo
Gold |
BGM
(100%) |
16-May-05 |
18-Apr-32 |
877.72 |
Osisko
Gold Royalties Ltd. (5%), Osisko Gold Royalties Ltd. (partial) (2.5%), Roundtop Exploration Inc. (partial) (2%), Osisko Gold Royalties
Ltd. (partial) (2%) |
| 512795 |
Mineral
Claim |
Cariboo
Gold |
BGM
(97.5%), Shane Morgan Williams (2.5%) |
17-May-05 |
18-Apr-32 |
155.22 |
Osisko
Gold Royalties Ltd. (5%) |
| 513739 |
Mineral
Claim |
Cariboo
Gold |
BGM
(100%) |
01-Jun-05 |
18-Apr-32 |
484.88 |
Osisko
Gold Royalties Ltd. (5%), William G. Timmins (partial) (2.5%) |
| 514442 |
Mineral
Claim |
Cariboo
Gold |
BGM
(100%) |
13-Jun-05 |
18-Apr-32 |
155.75 |
Osisko
Gold Royalties Ltd. (5%) |
| 514446 |
Mineral
Claim |
Cariboo
Gold |
BGM
(100%) |
13-Jun-05 |
18-Apr-33 |
291.87 |
Osisko
Gold Royalties Ltd. (5%), Osisko Gold Royalties Ltd. (partial) (2%) |
| 517260 |
Mineral
Claim |
Cariboo
Gold |
BGM
(100%) |
12-Jul-05 |
18-Apr-32 |
38.87 |
Osisko
Gold Royalties Ltd. (5%), Osisko Gold Royalties Ltd. (partial) (1%) |
| 517416 |
Mineral
Claim |
Cariboo
Gold |
BGM
(100%) |
12-Jul-05 |
18-Apr-33 |
58.28 |
Osisko
Gold Royalties Ltd. (5%) |
| 517423 |
Mineral
Claim |
Cariboo
Gold |
BGM
(100%) |
12-Jul-05 |
18-Apr-33 |
252.39 |
Osisko
Gold Royalties Ltd. (5%) |
| 517433 |
Mineral
Claim |
Cariboo
Gold |
BGM
(100%) |
12-Jul-05 |
18-Apr-32 |
19.41 |
Osisko
Gold Royalties Ltd. (5%) |
| 519556 |
Mineral
Claim |
Cariboo
Gold |
BGM
(100%) |
31-Aug-05 |
18-Apr-33 |
485.01 |
Osisko
Gold Royalties Ltd. (5%) |
| 519559 |
Mineral
Claim |
Cariboo
Gold |
BGM
(100%) |
31-Aug-05 |
18-Apr-32 |
484.79 |
Osisko
Gold Royalties Ltd. (5%) |
| 519563 |
Mineral
Claim |
Cariboo
Gold |
BGM
(100%) |
31-Aug-05 |
18-Apr-33 |
484.60 |
Osisko
Gold Royalties Ltd. (5%) |
| 521241 |
Mineral
Claim |
Cariboo
Gold |
BGM
(100%) |
15-Oct-05 |
18-Apr-32 |
485.66 |
Osisko
Gold Royalties Ltd. (5%), Osisko Gold Royalties Ltd. (partial) (1%) |
| 521242 |
Mineral
Claim |
Cariboo
Gold |
BGM
(100%) |
15-Oct-05 |
18-Apr-33 |
486.17 |
Osisko
Gold Royalties Ltd. (5%) |
| 521329 |
Mineral
Claim |
Cariboo
Gold |
BGM
(100%) |
19-Oct-05 |
18-Apr-33 |
486.72 |
Osisko
Gold Royalties Ltd. (5%) |
| 521330 |
Mineral
Claim |
Cariboo
Gold |
BGM
(100%) |
19-Oct-05 |
18-Apr-32 |
486.84 |
Osisko
Gold Royalties Ltd. (5%) |
| |
Osisko Development Corp.
NI 43-101 Technical Report
Feasibility Study for the Cariboo Gold Project |
|
| #
Title |
Title
Type |
Property |
Owner |
Issue
Date |
Good
To Date |
Area
(Ha) |
Royalties |
| 521331 |
Mineral
Claim |
Cariboo
Gold |
BGM
(100%) |
19-Oct-05 |
18-Apr-32 |
487.11 |
Osisko
Gold Royalties Ltd. (5%) |
| 521332 |
Mineral
Claim |
Cariboo
Gold |
BGM
(100%) |
19-Oct-05 |
18-Apr-33 |
487.40 |
Osisko
Gold Royalties Ltd. (5%) |
| 521333 |
Mineral
Claim |
Cariboo
Gold |
BGM
(100%) |
19-Oct-05 |
18-Apr-33 |
487.63 |
Osisko
Gold Royalties Ltd. (5%) |
| 521336 |
Mineral
Claim |
Cariboo
Gold |
BGM
(100%) |
19-Oct-05 |
18-Apr-33 |
487.79 |
Osisko
Gold Royalties Ltd. (5%) |
| 521337 |
Mineral
Claim |
Cariboo
Gold |
BGM
(100%) |
19-Oct-05 |
18-Apr-32 |
486.69 |
Osisko
Gold Royalties Ltd. (5%) |
| 521338 |
Mineral
Claim |
Cariboo
Gold |
BGM
(100%) |
19-Oct-05 |
18-Apr-32 |
486.69 |
Osisko
Gold Royalties Ltd. (5%) |
| 521339 |
Mineral
Claim |
Cariboo
Gold |
BGM
(100%) |
19-Oct-05 |
18-Apr-33 |
488.08 |
Osisko
Gold Royalties Ltd. (5%) |
| 521340 |
Mineral
Claim |
Cariboo
Gold |
BGM
(100%) |
19-Oct-05 |
18-Apr-32 |
487.96 |
Osisko
Gold Royalties Ltd. (5%) |
| 521342 |
Mineral
Claim |
Cariboo
Gold |
BGM
(100%) |
19-Oct-05 |
18-Apr-32 |
486.75 |
Osisko
Gold Royalties Ltd. (5%) |
| 521346 |
Mineral
Claim |
Cariboo
Gold |
BGM
(100%) |
19-Oct-05 |
18-Apr-33 |
487.06 |
Osisko
Gold Royalties Ltd. (5%) |
| 521348 |
Mineral
Claim |
Cariboo
Gold |
BGM
(100%) |
19-Oct-05 |
18-Apr-33 |
487.04 |
Osisko
Gold Royalties Ltd. (5%) |
| 521349 |
Mineral
Claim |
Cariboo
Gold |
BGM
(100%) |
19-Oct-05 |
18-Apr-32 |
486.93 |
Osisko
Gold Royalties Ltd. (5%) |
| 521350 |
Mineral
Claim |
Cariboo
Gold |
BGM
(100%) |
19-Oct-05 |
18-Apr-32 |
486.94 |
Osisko
Gold Royalties Ltd. (5%) |
| 521351 |
Mineral
Claim |
Cariboo
Gold |
BGM
(100%) |
19-Oct-05 |
18-Apr-32 |
487.17 |
Osisko
Gold Royalties Ltd. (5%) |
| 521352 |
Mineral
Claim |
Cariboo
Gold |
BGM
(100%) |
19-Oct-05 |
18-Apr-33 |
487.35 |
Osisko
Gold Royalties Ltd. (5%) |
| 521353 |
Mineral
Claim |
Cariboo
Gold |
BGM
(100%) |
19-Oct-05 |
18-Apr-32 |
487.35 |
Osisko
Gold Royalties Ltd. (5%) |
| 521356 |
Mineral
Claim |
Cariboo
Gold |
BGM
(100%) |
19-Oct-05 |
18-Apr-32 |
487.43 |
Osisko
Gold Royalties Ltd. (5%) |
| 521357 |
Mineral
Claim |
Cariboo
Gold |
BGM
(100%) |
19-Oct-05 |
18-Apr-32 |
487.19 |
Osisko
Gold Royalties Ltd. (5%) |
| 521358 |
Mineral
Claim |
Cariboo
Gold |
BGM
(100%) |
19-Oct-05 |
18-Apr-32 |
428.52 |
Osisko
Gold Royalties Ltd. (5%) |
| 521829 |
Mineral
Claim |
Cariboo
Gold |
BGM
(100%) |
02-Nov-05 |
18-Apr-33 |
488.14 |
Osisko
Gold Royalties Ltd. (5%) |
| 521839 |
Mineral
Claim |
Cariboo
Gold |
BGM
(100%) |
02-Nov-05 |
18-Apr-32 |
488.20 |
Osisko
Gold Royalties Ltd. (5%) |
| 521844 |
Mineral
Claim |
Cariboo
Gold |
BGM
(100%) |
02-Nov-05 |
18-Apr-32 |
488.43 |
Osisko
Gold Royalties Ltd. (5%) |
| 521852 |
Mineral
Claim |
Cariboo
Gold |
BGM
(100%) |
02-Nov-05 |
18-Apr-32 |
488.19 |
Osisko
Gold Royalties Ltd. (5%) |
| 521872 |
Mineral
Claim |
Cariboo
Gold |
BGM
(100%) |
02-Nov-05 |
18-Apr-32 |
488.16 |
Osisko
Gold Royalties Ltd. (5%) |
| 521877 |
Mineral
Claim |
Cariboo
Gold |
BGM
(100%) |
02-Nov-05 |
18-Apr-32 |
488.45 |
Osisko
Gold Royalties Ltd. (5%) |
| 521880 |
Mineral
Claim |
Cariboo
Gold |
BGM
(100%) |
02-Nov-05 |
18-Apr-32 |
488.32 |
Osisko
Gold Royalties Ltd. (5%) |
| 521881 |
Mineral
Claim |
Cariboo
Gold |
BGM
(100%) |
02-Nov-05 |
18-Apr-32 |
488.65 |
Osisko
Gold Royalties Ltd. (5%) |
| 521883 |
Mineral
Claim |
Cariboo
Gold |
BGM
(100%) |
02-Nov-05 |
18-Apr-32 |
390.78 |
Osisko
Gold Royalties Ltd. (5%) |
| 522125 |
Mineral
Claim |
Cariboo
Gold |
BGM
(100%) |
08-Nov-05 |
18-Apr-33 |
581.01 |
Osisko
Gold Royalties Ltd. (5%), Charnobay/Wells Syndicate (partial) (3%) |
| 528996 |
Mineral
Claim |
Cariboo
Gold |
BGM
(100%) |
27-Feb-06 |
18-Apr-32 |
466.26 |
Osisko
Gold Royalties Ltd. (5%) |
| 529036 |
Mineral
Claim |
Cariboo
Gold |
BGM
(100%) |
27-Feb-06 |
18-Apr-33 |
19.41 |
Osisko
Gold Royalties Ltd. (5%) |
| 529712 |
Mineral
Claim |
Cariboo
Gold |
BGM
(100%) |
07-Mar-06 |
18-Apr-33 |
330.14 |
Osisko
Gold Royalties Ltd. (5%) |
| 529713 |
Mineral
Claim |
Cariboo
Gold |
BGM
(100%) |
07-Mar-06 |
18-Apr-33 |
720.92 |
Osisko
Gold Royalties Ltd. (5%), Osisko Gold Royalties Ltd. (partial) (2%), Osisko Gold Royalties Ltd. (partial) (2.5%), Osisko Gold Royalties
Ltd. (partial) (2%) |
| 529715 |
Mineral
Claim |
Cariboo
Gold |
BGM
(100%) |
07-Mar-06 |
18-Apr-33 |
835.61 |
Osisko
Gold Royalties Ltd. (5%) |
| 529717 |
Mineral
Claim |
Cariboo
Gold |
BGM
(100%) |
07-Mar-06 |
18-Apr-32 |
545.68 |
Osisko
Gold Royalties Ltd. (5%), Osisko Gold Royalties Ltd. (partial) (2.5%) |
| 529719 |
Mineral
Claim |
Cariboo
Gold |
BGM
(100%) |
07-Mar-06 |
18-Apr-33 |
757.72 |
Osisko
Gold Royalties Ltd. (5%), Osisko Gold Royalties Ltd. (partial) (1%), Osisko Gold Royalties Ltd. (partial) (2%) |
| 529720 |
Mineral
Claim |
Cariboo
Gold |
BGM
(100%) |
07-Mar-06 |
18-Apr-32 |
603.80 |
Osisko
Gold Royalties Ltd. (5%), Osisko Gold Royalties Ltd. (partial) (2%) |
| 529721 |
Mineral
Claim |
Cariboo
Gold |
BGM
(100%) |
07-Mar-06 |
13-Nov-32 |
1,615.57 |
Osisko
Gold Royalties Ltd. (5%), Osisko Gold Royalties Ltd. (partial) (2%), Osisko Gold Royalties Ltd. (partial) (2%) |
| |
Osisko Development Corp.
NI 43-101 Technical Report
Feasibility Study for the Cariboo Gold Project |
|
| #
Title |
Title
Type |
Property |
Owner |
Issue
Date |
Good
To Date |
Area
(Ha) |
Royalties |
| 529722 |
Mineral
Claim |
Cariboo
Gold |
BGM
(100%) |
07-Mar-06 |
18-Apr-32 |
507.38 |
Osisko
Gold Royalties Ltd. (5%) |
| 535526 |
Mineral
Claim |
Cariboo
Gold |
BGM
(100%) |
13-Jun-06 |
18-Apr-33 |
465.85 |
Osisko
Gold Royalties Ltd. (5%) |
| 535671 |
Mineral
Claim |
Cariboo
Gold |
BGM
(100%) |
14-Jun-06 |
18-Apr-33 |
953.05 |
Osisko
Gold Royalties Ltd. (5%) |
| 535855 |
Mineral
Claim |
Cariboo
Gold |
BGM
(100%) |
17-Jun-06 |
18-Apr-32 |
39.02 |
Osisko
Gold Royalties Ltd. (5%) |
| 536691 |
Mineral
Claim |
Cariboo
Gold |
BGM
(100%) |
07-Jul-06 |
18-Apr-33 |
467.11 |
Osisko
Gold Royalties Ltd. (5%) |
| 537354 |
Mineral
Claim |
Cariboo
Gold |
BGM
(100%) |
17-Jul-06 |
18-Apr-32 |
19.50 |
Osisko
Gold Royalties Ltd. (5%), Osisko Gold Royalties Ltd. (partial) (2.5%) |
| 546306 |
Mineral
Claim |
Cariboo
Gold |
BGM
(100%) |
01-Dec-06 |
18-Apr-33 |
331.89 |
Osisko
Gold Royalties Ltd. (5%) |
| 546307 |
Mineral
Claim |
Cariboo
Gold |
BGM
(100%) |
01-Dec-06 |
18-Apr-33 |
815.89 |
Osisko
Gold Royalties Ltd. (5%) |
| 546309 |
Mineral
Claim |
Cariboo
Gold |
BGM
(100%) |
01-Dec-06 |
13-Nov-32 |
1,438.50 |
Osisko
Gold Royalties Ltd. (5%), Osisko Gold Royalties Ltd. (partial) (1%), Osisko Gold Royalties Ltd. (partial) (2%) |
| 546310 |
Mineral
Claim |
Cariboo
Gold |
BGM
(100%) |
01-Dec-06 |
18-Apr-33 |
854.59 |
Osisko
Gold Royalties Ltd. (5%), Osisko Gold Royalties Ltd. (partial) (1%) |
| 546311 |
Mineral
Claim |
Cariboo
Gold |
BGM
(100%) |
01-Dec-06 |
18-Apr-33 |
563.12 |
Osisko
Gold Royalties Ltd. (5%), Osisko Gold Royalties Ltd. (partial) (2%) |
| 546314 |
Mineral
Claim |
Cariboo
Gold |
BGM
(100%) |
01-Dec-06 |
18-Apr-33 |
1,299.19 |
Osisko
Gold Royalties Ltd. (5%), Osisko Gold Royalties Ltd. (partial) (2%), Osisko Gold Royalties Ltd. (partial) (2%) |
| 546315 |
Mineral
Claim |
Cariboo
Gold |
BGM
(100%) |
01-Dec-06 |
18-Apr-33 |
1,027.11 |
Osisko
Gold Royalties Ltd. (5%), Charnobay/Wells Syndicate (partial) (3%) |
| 546611 |
Mineral
Claim |
Cariboo
Gold |
BGM
(100%) |
05-Dec-06 |
18-Apr-33 |
604.62 |
Osisko
Gold Royalties Ltd. (5%) |
| 546612 |
Mineral
Claim |
Cariboo
Gold |
BGM
(100%) |
05-Dec-06 |
18-Apr-33 |
719.15 |
Osisko
Gold Royalties Ltd. (5%) |
| 546613 |
Mineral
Claim |
Cariboo
Gold |
BGM
(100%) |
05-Dec-06 |
18-Apr-33 |
663.22 |
Osisko
Gold Royalties Ltd. (5%) |
| 546614 |
Mineral
Claim |
Cariboo
Gold |
BGM
(100%) |
05-Dec-06 |
18-Apr-33 |
619.46 |
Osisko
Gold Royalties Ltd. (5%) |
| 546617 |
Mineral
Claim |
Cariboo
Gold |
BGM
(100%) |
05-Dec-06 |
18-Apr-32 |
955.51 |
Osisko
Gold Royalties Ltd. (5%), Osisko Gold Royalties Ltd. (97% of 2% NSR) & Estate of Bryan Muloin (whole) (3% of 2% NSR) |
| 546620 |
Mineral
Claim |
Cariboo
Gold |
BGM
(100%) |
05-Dec-06 |
18-Apr-32 |
954.67 |
Osisko
Gold Royalties Ltd. (5%), Osisko Gold Royalties Ltd. (97% of 2% NSR) & Estate of Bryan Muloin (whole) (3% of 2% NSR) |
| 546722 |
Mineral
Claim |
Cariboo
Gold |
BGM
(100%) |
06-Dec-06 |
13-Nov-32 |
1,147.58 |
Osisko
Gold Royalties Ltd. (5%), Osisko Gold Royalties Ltd. (partial) (2%), Osisko Gold Royalties Ltd. (partial) (2%) |
| 546723 |
Mineral
Claim |
Cariboo
Gold |
BGM
(100%) |
06-Dec-06 |
18-Apr-32 |
702.56 |
Osisko
Gold Royalties Ltd. (5%) |
| 546724 |
Mineral
Claim |
Cariboo
Gold |
BGM
(100%) |
06-Dec-06 |
18-Apr-33 |
837.09 |
Osisko
Gold Royalties Ltd. (5%), Osisko Gold Royalties Ltd. (partial) (2%) |
| 546725 |
Mineral
Claim |
Cariboo
Gold |
BGM
(100%) |
06-Dec-06 |
18-Apr-33 |
953.60 |
Osisko
Gold Royalties Ltd. (5%) |
| 546726 |
Mineral
Claim |
Cariboo
Gold |
BGM
(100%) |
06-Dec-06 |
18-Apr-33 |
971.93 |
Osisko
Gold Royalties Ltd. (5%) |
| 546727 |
Mineral
Claim |
Cariboo
Gold |
BGM
(100%) |
06-Dec-06 |
18-Apr-33 |
952.84 |
Osisko
Gold Royalties Ltd. (5%) |
| 554735 |
Mineral
Claim |
Cariboo
Gold |
BGM
(100%) |
20-Mar-07 |
18-Apr-33 |
484.18 |
Osisko
Gold Royalties Ltd. (5%) |
| 554737 |
Mineral
Claim |
Cariboo
Gold |
BGM
(100%) |
20-Mar-07 |
18-Apr-33 |
484.18 |
Osisko
Gold Royalties Ltd. (5%) |
| 554739 |
Mineral
Claim |
Cariboo
Gold |
BGM
(100%) |
20-Mar-07 |
18-Apr-33 |
483.95 |
Osisko
Gold Royalties Ltd. (5%) |
| 554740 |
Mineral
Claim |
Cariboo
Gold |
BGM
(100%) |
20-Mar-07 |
18-Apr-33 |
483.95 |
Osisko
Gold Royalties Ltd. (5%) |
| 554741 |
Mineral
Claim |
Cariboo
Gold |
BGM
(100%) |
20-Mar-07 |
18-Apr-33 |
484.16 |
Osisko
Gold Royalties Ltd. (5%) |
| 554742 |
Mineral
Claim |
Cariboo
Gold |
BGM
(100%) |
20-Mar-07 |
18-Apr-33 |
483.93 |
Osisko
Gold Royalties Ltd. (5%) |
| 554743 |
Mineral
Claim |
Cariboo
Gold |
BGM
(100%) |
20-Mar-07 |
18-Apr-33 |
484.16 |
Osisko
Gold Royalties Ltd. (5%) |
| 554745 |
Mineral
Claim |
Cariboo
Gold |
BGM
(100%) |
20-Mar-07 |
18-Apr-33 |
483.70 |
Osisko
Gold Royalties Ltd. (5%) |
| 554746 |
Mineral
Claim |
Cariboo
Gold |
BGM
(100%) |
20-Mar-07 |
18-Apr-33 |
483.98 |
Osisko
Gold Royalties Ltd. (5%) |
| 554747 |
Mineral
Claim |
Cariboo
Gold |
BGM
(100%) |
20-Mar-07 |
18-Apr-33 |
484.12 |
Osisko
Gold Royalties Ltd. (5%) |
| 554748 |
Mineral
Claim |
Cariboo
Gold |
BGM
(100%) |
20-Mar-07 |
18-Apr-33 |
483.96 |
Osisko
Gold Royalties Ltd. (5%) |
| 554749 |
Mineral
Claim |
Cariboo
Gold |
BGM
(100%) |
20-Mar-07 |
18-Apr-33 |
483.74 |
Osisko
Gold Royalties Ltd. (5%) |
| |
Osisko Development Corp.
NI 43-101 Technical Report
Feasibility Study for the Cariboo Gold Project |
|
| #
Title |
Title
Type |
Property |
Owner |
Issue
Date |
Good
To Date |
Area
(Ha) |
Royalties |
| 554750 |
Mineral
Claim |
Cariboo
Gold |
BGM
(100%) |
20-Mar-07 |
18-Apr-33 |
483.99 |
Osisko
Gold Royalties Ltd. (5%) |
| 554802 |
Mineral
Claim |
Cariboo
Gold |
BGM
(100%) |
21-Mar-07 |
18-Apr-33 |
38.71 |
Osisko
Gold Royalties Ltd. (5%) |
| 564597 |
Mineral
Claim |
Cariboo
Gold |
BGM
(100%) |
15-Aug-07 |
18-Apr-32 |
19.52 |
Osisko
Gold Royalties Ltd. (5%) |
| 564598 |
Mineral
Claim |
Cariboo
Gold |
BGM
(100%) |
15-Aug-07 |
18-Apr-32 |
19.50 |
Osisko
Gold Royalties Ltd. (5%) |
| 567677 |
Mineral
Claim |
Cariboo
Gold |
BGM
(100%) |
09-Oct-07 |
18-Apr-32 |
39.00 |
Osisko
Gold Royalties Ltd. (5%), Osisko Gold Royalties Ltd. (partial) (2.5%) |
| 567678 |
Mineral
Claim |
Cariboo
Gold |
BGM
(100%) |
09-Oct-07 |
18-Apr-32 |
19.50 |
Osisko
Gold Royalties Ltd. (5%), Osisko Gold Royalties Ltd. (partial) (2.5%) |
| 572001 |
Mineral
Claim |
Cariboo
Gold |
BGM
(100%) |
15-Dec-07 |
18-Apr-32 |
19.51 |
Osisko
Gold Royalties Ltd. (5%) |
| 572011 |
Mineral
Claim |
Cariboo
Gold |
BGM
(100%) |
16-Dec-07 |
18-Apr-32 |
19.51 |
Osisko
Gold Royalties Ltd. (5%) |
| 572348 |
Mineral
Claim |
Cariboo
Gold |
BGM
(100%) |
21-Dec-07 |
18-Apr-32 |
19.51 |
Osisko
Gold Royalties Ltd. (5%) |
| 572437 |
Mineral
Claim |
Cariboo
Gold |
BGM
(100%) |
23-Dec-07 |
18-Apr-32 |
19.50 |
Osisko
Gold Royalties Ltd. (5%) |
| 573880 |
Mineral
Claim |
Cariboo
Gold |
BGM
(100%) |
16-Jan-08 |
18-Apr-32 |
38.98 |
Osisko
Gold Royalties Ltd. (5%), Osisko Gold Royalties Ltd. (partial) (2.5%) |
| 577422 |
Mineral
Claim |
Cariboo
Gold |
BGM
(100%) |
28-Feb-08 |
18-Apr-33 |
349.90 |
Osisko
Gold Royalties Ltd. (5%), Osisko Gold Royalties Ltd. (partial) (2%) |
| 581059 |
Mineral
Claim |
Cariboo
Gold |
BGM
(100%) |
12-Apr-08 |
18-Apr-33 |
468.39 |
Osisko
Gold Royalties Ltd. (5%), Dustin Alsager Rivard (whole) (2%) |
| 592159 |
Mineral
Claim |
Cariboo
Gold |
BGM
(100%) |
29-Sep-08 |
18-Apr-32 |
350.74 |
Osisko
Gold Royalties Ltd. (5%), Osisko Gold Royalties Ltd. (partial) (1%), Osisko Gold Royalties Ltd. (97% of 2% NSR) & Estate
of Bryan Muloin (partial) (3% of 2 % NSR) |
| 593162 |
Mineral
Claim |
Cariboo
Gold |
BGM
(100%) |
20-Oct-08 |
18-Apr-33 |
58.29 |
Osisko
Gold Royalties Ltd. (5%) |
| 593959 |
Mineral
Claim |
Cariboo
Gold |
BGM
(100%) |
06-Nov-08 |
18-Apr-33 |
485.28 |
Osisko
Gold Royalties Ltd. (5%) |
| 593960 |
Mineral
Claim |
Cariboo
Gold |
BGM
(100%) |
06-Nov-08 |
18-Apr-33 |
485.04 |
Osisko
Gold Royalties Ltd. (5%) |
| 593961 |
Mineral
Claim |
Cariboo
Gold |
BGM
(100%) |
06-Nov-08 |
18-Apr-33 |
484.80 |
Osisko
Gold Royalties Ltd. (5%) |
| 593962 |
Mineral
Claim |
Cariboo
Gold |
BGM
(100%) |
06-Nov-08 |
18-Apr-33 |
484.79 |
Osisko
Gold Royalties Ltd. (5%) |
| 593963 |
Mineral
Claim |
Cariboo
Gold |
BGM
(100%) |
06-Nov-08 |
18-Apr-33 |
485.03 |
Osisko
Gold Royalties Ltd. (5%) |
| 593965 |
Mineral
Claim |
Cariboo
Gold |
BGM
(100%) |
06-Nov-08 |
18-Apr-33 |
485.27 |
Osisko
Gold Royalties Ltd. (5%) |
| 593966 |
Mineral
Claim |
Cariboo
Gold |
BGM
(100%) |
06-Nov-08 |
18-Apr-33 |
466.03 |
Osisko
Gold Royalties Ltd. (5%) |
| 593967 |
Mineral
Claim |
Cariboo
Gold |
BGM
(100%) |
06-Nov-08 |
18-Apr-33 |
465.87 |
Osisko
Gold Royalties Ltd. (5%) |
| 593968 |
Mineral
Claim |
Cariboo
Gold |
BGM
(100%) |
06-Nov-08 |
18-Apr-33 |
465.68 |
Osisko
Gold Royalties Ltd. (5%) |
| 593969 |
Mineral
Claim |
Cariboo
Gold |
BGM
(100%) |
06-Nov-08 |
18-Apr-33 |
465.50 |
Osisko
Gold Royalties Ltd. (5%) |
| 593970 |
Mineral
Claim |
Cariboo
Gold |
BGM
(100%) |
06-Nov-08 |
18-Apr-33 |
465.21 |
Osisko
Gold Royalties Ltd. (5%) |
| 593971 |
Mineral
Claim |
Cariboo
Gold |
BGM
(100%) |
06-Nov-08 |
18-Apr-33 |
466.00 |
Osisko
Gold Royalties Ltd. (5%) |
| 593972 |
Mineral
Claim |
Cariboo
Gold |
BGM
(100%) |
06-Nov-08 |
18-Apr-33 |
465.34 |
Osisko
Gold Royalties Ltd. (5%) |
| 593973 |
Mineral
Claim |
Cariboo
Gold |
BGM
(100%) |
06-Nov-08 |
18-Apr-33 |
387.63 |
Osisko
Gold Royalties Ltd. (5%) |
| 593974 |
Mineral
Claim |
Cariboo
Gold |
BGM
(100%) |
06-Nov-08 |
18-Apr-33 |
77.64 |
Osisko
Gold Royalties Ltd. (5%) |
| 593975 |
Mineral
Claim |
Cariboo
Gold |
BGM
(100%) |
06-Nov-08 |
18-Apr-33 |
155.26 |
Osisko
Gold Royalties Ltd. (5%) |
| 593979 |
Mineral
Claim |
Cariboo
Gold |
BGM
(100%) |
06-Nov-08 |
18-Apr-33 |
485.22 |
Osisko
Gold Royalties Ltd. (5%) |
| 593980 |
Mineral
Claim |
Cariboo
Gold |
BGM
(100%) |
06-Nov-08 |
18-Apr-33 |
485.00 |
Osisko
Gold Royalties Ltd. (5%) |
| 593981 |
Mineral
Claim |
Cariboo
Gold |
BGM
(100%) |
06-Nov-08 |
18-Apr-33 |
484.77 |
Osisko
Gold Royalties Ltd. (5%) |
| 593982 |
Mineral
Claim |
Cariboo
Gold |
BGM
(100%) |
06-Nov-08 |
18-Apr-33 |
484.62 |
Osisko
Gold Royalties Ltd. (5%) |
| 593983 |
Mineral
Claim |
Cariboo
Gold |
BGM
(100%) |
06-Nov-08 |
18-Apr-33 |
484.62 |
Osisko
Gold Royalties Ltd. (5%) |
| 593984 |
Mineral
Claim |
Cariboo
Gold |
BGM
(100%) |
06-Nov-08 |
18-Apr-33 |
484.87 |
Osisko
Gold Royalties Ltd. (5%) |
| 593985 |
Mineral
Claim |
Cariboo
Gold |
BGM
(100%) |
06-Nov-08 |
18-Apr-33 |
484.87 |
Osisko
Gold Royalties Ltd. (5%) |
| 593986 |
Mineral
Claim |
Cariboo
Gold |
BGM
(100%) |
06-Nov-08 |
18-Apr-33 |
465.72 |
Osisko
Gold Royalties Ltd. (5%) |
| |
Osisko Development Corp.
NI 43-101 Technical Report
Feasibility Study for the Cariboo Gold Project |
|
| #
Title |
Title
Type |
Property |
Owner |
Issue
Date |
Good
To Date |
Area
(Ha) |
Royalties |
| 593987 |
Mineral
Claim |
Cariboo
Gold |
BGM
(100%) |
06-Nov-08 |
18-Apr-33 |
485.19 |
Osisko
Gold Royalties Ltd. (5%) |
| 593988 |
Mineral
Claim |
Cariboo
Gold |
BGM
(100%) |
06-Nov-08 |
18-Apr-33 |
252.34 |
Osisko
Gold Royalties Ltd. (5%) |
| 594001 |
Mineral
Claim |
Cariboo
Gold |
BGM
(100%) |
07-Nov-08 |
18-Apr-33 |
58.18 |
Osisko
Gold Royalties Ltd. (5%) |
| 594002 |
Mineral
Claim |
Cariboo
Gold |
BGM
(100%) |
07-Nov-08 |
18-Apr-33 |
38.80 |
Osisko
Gold Royalties Ltd. (5%) |
| 594003 |
Mineral
Claim |
Cariboo
Gold |
BGM
(100%) |
07-Nov-08 |
18-Apr-33 |
38.81 |
Osisko
Gold Royalties Ltd. (5%) |
| 595151 |
Mineral
Claim |
Cariboo
Gold |
BGM
(100%) |
01-Dec-08 |
18-Apr-33 |
116.51 |
Osisko
Gold Royalties Ltd. (5%) |
| 595157 |
Mineral
Claim |
Cariboo
Gold |
BGM
(100%) |
01-Dec-08 |
18-Apr-33 |
388.25 |
Osisko
Gold Royalties Ltd. (5%) |
| 595164 |
Mineral
Claim |
Cariboo
Gold |
BGM
(100%) |
01-Dec-08 |
18-Apr-33 |
427.12 |
Osisko
Gold Royalties Ltd. (5%) |
| 595165 |
Mineral
Claim |
Cariboo
Gold |
BGM
(100%) |
01-Dec-08 |
18-Apr-33 |
116.53 |
Osisko
Gold Royalties Ltd. (5%) |
| 595166 |
Mineral
Claim |
Cariboo
Gold |
BGM
(100%) |
01-Dec-08 |
18-Apr-33 |
38.83 |
Osisko
Gold Royalties Ltd. (5%) |
| 595167 |
Mineral
Claim |
Cariboo
Gold |
BGM
(100%) |
01-Dec-08 |
18-Apr-33 |
77.68 |
Osisko
Gold Royalties Ltd. (5%) |
| 595168 |
Mineral
Claim |
Cariboo
Gold |
BGM
(100%) |
01-Dec-08 |
18-Apr-33 |
58.23 |
Osisko
Gold Royalties Ltd. (5%) |
| 596023 |
Mineral
Claim |
Cariboo
Gold |
BGM
(100%) |
13-Dec-08 |
18-Apr-33 |
77.50 |
Osisko
Gold Royalties Ltd. (5%) |
| 596024 |
Mineral
Claim |
Cariboo
Gold |
BGM
(100%) |
13-Dec-08 |
18-Apr-33 |
464.96 |
Osisko
Gold Royalties Ltd. (5%), Douglas Merrick & Harold Merrick (partial) (2%) |
| 596025 |
Mineral
Claim |
Cariboo
Gold |
BGM
(100%) |
13-Dec-08 |
18-Apr-33 |
58.13 |
Osisko
Gold Royalties Ltd. (5%), Douglas Merrick & Harold Merrick (partial) (2%) |
| 596144 |
Mineral
Claim |
Cariboo
Gold |
BGM
(100%) |
16-Dec-08 |
18-Apr-33 |
350.60 |
Osisko
Gold Royalties Ltd. (5%) |
| 598430 |
Mineral
Claim |
Cariboo
Gold |
BGM
(100%) |
01-Feb-09 |
08-Mar-26 |
97.64 |
Osisko
Gold Royalties Ltd. (5%) |
| 600139 |
Mineral
Claim |
Cariboo
Gold |
BGM
(100%) |
28-Feb-09 |
18-Apr-33 |
155.27 |
Osisko
Gold Royalties Ltd. (5%) |
| 600140 |
Mineral
Claim |
Cariboo
Gold |
BGM
(100%) |
28-Feb-09 |
18-Apr-33 |
38.82 |
Osisko
Gold Royalties Ltd. (5%) |
| 600141 |
Mineral
Claim |
Cariboo
Gold |
BGM
(100%) |
28-Feb-09 |
18-Apr-33 |
19.41 |
Osisko
Gold Royalties Ltd. (5%) |
| 600142 |
Mineral
Claim |
Cariboo
Gold |
BGM
(100%) |
28-Feb-09 |
18-Apr-33 |
135.93 |
Osisko
Gold Royalties Ltd. (5%) |
| 600143 |
Mineral
Claim |
Cariboo
Gold |
BGM
(100%) |
28-Feb-09 |
18-Apr-33 |
213.54 |
Osisko
Gold Royalties Ltd. (5%) |
| 600144 |
Mineral
Claim |
Cariboo
Gold |
BGM
(100%) |
28-Feb-09 |
18-Apr-33 |
19.41 |
Osisko
Gold Royalties Ltd. (5%) |
| 600145 |
Mineral
Claim |
Cariboo
Gold |
BGM
(100%) |
28-Feb-09 |
18-Apr-33 |
77.66 |
Osisko
Gold Royalties Ltd. (5%) |
| 624892 |
Mineral
Claim |
Cariboo
Gold |
BGM
(100%) |
27-Aug-09 |
18-Apr-33 |
116.51 |
Osisko
Gold Royalties Ltd. (5%) |
| 624894 |
Mineral
Claim |
Cariboo
Gold |
BGM
(100%) |
27-Aug-09 |
18-Apr-33 |
38.84 |
Osisko
Gold Royalties Ltd. (5%) |
| 624895 |
Mineral
Claim |
Cariboo
Gold |
BGM
(100%) |
27-Aug-09 |
18-Apr-33 |
19.42 |
Osisko
Gold Royalties Ltd. (5%) |
| 625567 |
Mineral
Claim |
Cariboo
Gold |
BGM
(100%) |
29-Aug-09 |
18-Apr-33 |
19.42 |
Osisko
Gold Royalties Ltd. (5%) |
| 667163 |
Mineral
Claim |
Cariboo
Gold |
BGM
(100%) |
10-Nov-09 |
18-Apr-33 |
77.77 |
Osisko
Gold Royalties Ltd. (5%) |
| 755342 |
Mineral
Claim |
Cariboo
Gold |
BGM
(100%) |
23-Apr-10 |
18-Apr-32 |
389.34 |
Osisko
Gold Royalties Ltd. (5%) |
| 755362 |
Mineral
Claim |
Cariboo
Gold |
BGM
(100%) |
23-Apr-10 |
18-Apr-32 |
389.53 |
Osisko
Gold Royalties Ltd. (5%) |
| 755382 |
Mineral
Claim |
Cariboo
Gold |
BGM
(100%) |
23-Apr-10 |
18-Apr-32 |
467.64 |
Osisko
Gold Royalties Ltd. (5%) |
| 755402 |
Mineral
Claim |
Cariboo
Gold |
BGM
(100%) |
23-Apr-10 |
18-Apr-32 |
486.70 |
Osisko
Gold Royalties Ltd. (5%) |
| 755422 |
Mineral
Claim |
Cariboo
Gold |
BGM
(100%) |
23-Apr-10 |
18-Apr-32 |
486.94 |
Osisko
Gold Royalties Ltd. (5%) |
| 755442 |
Mineral
Claim |
Cariboo
Gold |
BGM
(100%) |
23-Apr-10 |
18-Apr-32 |
486.88 |
Osisko
Gold Royalties Ltd. (5%) |
| 755462 |
Mineral
Claim |
Cariboo
Gold |
BGM
(100%) |
23-Apr-10 |
18-Apr-32 |
467.43 |
Osisko
Gold Royalties Ltd. (5%) |
| 780562 |
Mineral
Claim |
Cariboo
Gold |
BGM
(100%) |
27-May-10 |
18-Apr-33 |
193.97 |
Osisko
Gold Royalties Ltd. (5%) |
| 835729 |
Mineral
Claim |
Cariboo
Gold |
BGM
(100%) |
12-Oct-10 |
18-Apr-32 |
448.31 |
Osisko
Gold Royalties Ltd. (5%) |
| 835730 |
Mineral
Claim |
Cariboo
Gold |
BGM
(100%) |
12-Oct-10 |
18-Apr-32 |
487.49 |
Osisko
Gold Royalties Ltd. (5%) |
| 835731 |
Mineral
Claim |
Cariboo
Gold |
BGM
(100%) |
12-Oct-10 |
18-Apr-32 |
487.47 |
Osisko
Gold Royalties Ltd. (5%) |
| |
Osisko Development Corp.
NI 43-101 Technical Report
Feasibility Study for the Cariboo Gold Project |
|
| #
Title |
Title
Type |
Property |
Owner |
Issue
Date |
Good
To Date |
Area
(Ha) |
Royalties |
| 835733 |
Mineral
Claim |
Cariboo
Gold |
BGM
(100%) |
12-Oct-10 |
18-Apr-32 |
390.22 |
Osisko
Gold Royalties Ltd. (5%) |
| 835734 |
Mineral
Claim |
Cariboo
Gold |
BGM
(100%) |
12-Oct-10 |
18-Apr-32 |
487.72 |
Osisko
Gold Royalties Ltd. (5%) |
| 853622 |
Mineral
Claim |
Cariboo
Gold |
BGM
(100%) |
05-May-11 |
18-Apr-33 |
116.56 |
Osisko
Gold Royalties Ltd. (5%) |
| 856509 |
Mineral
Claim |
Cariboo
Gold |
BGM
(100%) |
09-Jun-11 |
18-Apr-33 |
407.82 |
Osisko
Gold Royalties Ltd. (5%) |
| 856510 |
Mineral
Claim |
Cariboo
Gold |
BGM
(100%) |
09-Jun-11 |
18-Apr-33 |
155.41 |
Osisko
Gold Royalties Ltd. (5%) |
| 896709 |
Mineral
Claim |
Cariboo
Gold |
BGM
(100%) |
13-Sep-11 |
18-Apr-33 |
913.22 |
Osisko
Gold Royalties Ltd. (5%), Osisko Gold Royalties Ltd. (partial) (1%) |
| 928311 |
Mineral
Claim |
Cariboo
Gold |
BGM
(100%) |
06-Nov-11 |
18-Apr-32 |
487.33 |
Osisko
Gold Royalties Ltd. (5%) |
| 1014607 |
Mineral
Claim |
Cariboo
Gold |
BGM
(100%) |
19-Nov-12 |
18-Apr-33 |
19.52 |
Osisko
Gold Royalties Ltd. (5%) |
| 1028446 |
Mineral
Claim |
Cariboo
Gold |
BGM
(100%) |
23-May-14 |
18-Apr-33 |
19.52 |
Osisko
Gold Royalties Ltd. (5%) |
| 1028453 |
Mineral
Claim |
Cariboo
Gold |
BGM
(100%) |
23-May-14 |
18-Apr-33 |
19.52 |
Osisko
Gold Royalties Ltd. (5%) |
| 1028454 |
Mineral
Claim |
Cariboo
Gold |
BGM
(100%) |
23-May-14 |
18-Apr-33 |
78.08 |
Osisko
Gold Royalties Ltd. (5%) |
| 1028464 |
Mineral
Claim |
Cariboo
Gold |
BGM
(100%) |
23-May-14 |
18-Apr-33 |
175.33 |
Osisko
Gold Royalties Ltd. (5%) |
| 1029935 |
Mineral
Claim |
Cariboo
Gold |
BGM
(100%) |
30-Jul-14 |
18-Apr-32 |
19.49 |
Osisko
Gold Royalties Ltd. (5%), Osisko Gold Royalties Ltd. (partial) (2.5%) |
| 1033303 |
Mineral
Claim |
Cariboo
Gold |
BGM
(100%) |
11-Jan-15 |
18-Apr-33 |
19.52 |
Osisko
Gold Royalties Ltd. (5%) |
| 1033403 |
Mineral
Claim |
Cariboo
Gold |
BGM
(100%) |
16-Apr-14 |
18-Apr-33 |
97.64 |
Osisko
Gold Royalties Ltd. (5%) |
| 1033404 |
Mineral
Claim |
Cariboo
Gold |
BGM
(100%) |
16-Apr-14 |
18-Apr-33 |
136.67 |
Osisko
Gold Royalties Ltd. (5%) |
| 1039381 |
Mineral
Claim |
Cariboo
Gold |
BGM
(100%) |
18-Oct-15 |
18-Apr-33 |
19.52 |
Osisko
Gold Royalties Ltd. (5%) |
| 1042345 |
Mineral
Claim |
Cariboo
Gold |
BGM
(100%) |
26-Feb-16 |
18-Apr-33 |
1,798.94 |
Osisko
Gold Royalties Ltd. (5%) |
| 1042346 |
Mineral
Claim |
Cariboo
Gold |
BGM
(100%) |
26-Feb-16 |
18-Apr-33 |
1,933.33 |
Osisko
Gold Royalties Ltd. (5%) |
| 1042347 |
Mineral
Claim |
Cariboo
Gold |
BGM
(100%) |
26-Feb-16 |
18-Apr-33 |
1,932.17 |
Osisko
Gold Royalties Ltd. (5%) |
| 1042348 |
Mineral
Claim |
Cariboo
Gold |
BGM
(100%) |
26-Feb-16 |
18-Apr-33 |
1,351.80 |
Osisko
Gold Royalties Ltd. (5%) |
| 1045261 |
Mineral
Claim |
Cariboo
Gold |
BGM
(100%) |
11-Jul-16 |
18-Apr-33 |
38.87 |
Osisko
Gold Royalties Ltd. (5%) |
| 1045698 |
Mineral
Claim |
Cariboo
Gold |
BGM
(100%) |
31-Jul-16 |
18-Apr-33 |
19.52 |
Osisko
Gold Royalties Ltd. (5%) |
| 1045814 |
Mineral
Claim |
Cariboo
Gold |
BGM
(100%) |
07-Aug-16 |
18-Apr-33 |
78.11 |
Osisko
Gold Royalties Ltd. (5%) |
| 1049349 |
Mineral
Claim |
Cariboo
Gold |
BGM
(100%) |
20-Jan-17 |
13-Nov-32 |
19.41 |
Osisko
Gold Royalties Ltd. (5%) |
| 1050434 |
Mineral
Claim |
Cariboo
Gold |
BGM
(100%) |
28-Feb-17 |
18-Apr-33 |
330.42 |
Osisko
Gold Royalties Ltd. (5%) |
| 1050437 |
Mineral
Claim |
Cariboo
Gold |
BGM
(100%) |
28-Feb-17 |
18-Apr-33 |
58.29 |
Osisko
Gold Royalties Ltd. (5%) |
| 1050442 |
Mineral
Claim |
Cariboo
Gold |
BGM
(100%) |
28-Feb-17 |
18-Apr-33 |
252.61 |
Osisko
Gold Royalties Ltd. (5%) |
| 1050747 |
Mineral
Claim |
Cariboo
Gold |
BGM
(100%) |
14-Mar-17 |
18-Apr-33 |
408.25 |
Osisko
Gold Royalties Ltd. (5%) |
| 1050748 |
Mineral
Claim |
Cariboo
Gold |
BGM
(100%) |
14-Mar-17 |
18-Apr-33 |
525.22 |
Osisko
Gold Royalties Ltd. (5%) |
| 1050749 |
Mineral
Claim |
Cariboo
Gold |
BGM
(100%) |
14-Mar-17 |
18-Apr-33 |
583.41 |
Osisko
Gold Royalties Ltd. (5%) |
| 1050750 |
Mineral
Claim |
Cariboo
Gold |
BGM
(100%) |
14-Mar-17 |
18-Apr-33 |
233.36 |
Osisko
Gold Royalties Ltd. (5%) |
| 1050753 |
Mineral
Claim |
Cariboo
Gold |
BGM
(100%) |
14-Mar-17 |
18-Apr-33 |
291.72 |
Osisko
Gold Royalties Ltd. (5%) |
| 1050754 |
Mineral
Claim |
Cariboo
Gold |
BGM
(100%) |
14-Mar-17 |
18-Apr-33 |
1,186.57 |
Osisko
Gold Royalties Ltd. (5%) |
| 1050755 |
Mineral
Claim |
Cariboo
Gold |
BGM
(100%) |
14-Mar-17 |
18-Apr-33 |
641.95 |
Osisko
Gold Royalties Ltd. (5%) |
| 1050768 |
Mineral
Claim |
Cariboo
Gold |
BGM
(100%) |
15-Mar-17 |
18-Apr-33 |
680.35 |
Osisko
Gold Royalties Ltd. (5%) |
| 1050769 |
Mineral
Claim |
Cariboo
Gold |
BGM
(100%) |
15-Mar-17 |
18-Apr-33 |
116.65 |
Osisko
Gold Royalties Ltd. (5%) |
| 1052290 |
Mineral
Claim |
Cariboo
Gold |
BGM
(100%) |
01-Jun-17 |
18-Apr-33 |
78.13 |
Osisko
Gold Royalties Ltd. (5%) |
| 1055004 |
Mineral
Claim |
Cariboo
Gold |
BGM
(100%) |
19-Sep-17 |
18-Apr-33 |
19.53 |
Osisko
Gold Royalties Ltd. (5%) |
| 1055005 |
Mineral
Claim |
Cariboo
Gold |
BGM
(100%) |
19-Sep-17 |
18-Apr-33 |
58.60 |
Osisko
Gold Royalties Ltd. (5%) |
| |
Osisko Development Corp.
NI 43-101 Technical Report
Feasibility Study for the Cariboo Gold Project |
|
| #
Title |
Title
Type |
Property |
Owner |
Issue
Date |
Good
To Date |
Area
(Ha) |
Royalties |
| 1055083 |
Mineral
Claim |
Cariboo
Gold |
BGM
(100%) |
21-Sep-17 |
18-Apr-33 |
195.30 |
Osisko
Gold Royalties Ltd. (5%) |
| 1055084 |
Mineral
Claim |
Cariboo
Gold |
BGM
(100%) |
21-Sep-17 |
18-Apr-33 |
214.87 |
Osisko
Gold Royalties Ltd. (5%) |
| 1057242 |
Mineral
Claim |
Cariboo
Gold |
BGM
(100%) |
26-Dec-17 |
18-Apr-33 |
58.28 |
Osisko
Gold Royalties Ltd. (5%) |
| 1060121 |
Mineral
Claim |
Cariboo
Gold |
BGM
(100%) |
18-Apr-18 |
18-Apr-33 |
1,942.27 |
Osisko
Gold Royalties Ltd. (5%) |
| 1060157 |
Mineral
Claim |
Cariboo
Gold |
BGM
(100%) |
19-Apr-18 |
18-Apr-33 |
58.61 |
Osisko
Gold Royalties Ltd. (5%) |
| 1060160 |
Mineral
Claim |
Cariboo
Gold |
BGM
(100%) |
19-Apr-18 |
18-Apr-33 |
716.90 |
Osisko
Gold Royalties Ltd. (5%) |
| 1060183 |
Mineral
Claim |
Cariboo
Gold |
BGM
(100%) |
20-Apr-18 |
18-Apr-33 |
175.75 |
Osisko
Gold Royalties Ltd. (5%) |
| 1069588 |
Mineral
Claim |
Cariboo
Gold |
BGM
(100%) |
10-Jul-19 |
18-Apr-32 |
19.50 |
Osisko
Gold Royalties Ltd. (5%) |
| 1072306 |
Mineral
Claim |
Cariboo
Gold |
BGM
(100%) |
31-Oct-19 |
18-Apr-33 |
19.40 |
Osisko
Gold Royalties Ltd. (5%) |
| 1072307 |
Mineral
Claim |
Cariboo
Gold |
BGM
(100%) |
31-Oct-19 |
18-Apr-33 |
19.40 |
Osisko
Gold Royalties Ltd. (5%) |
| 1095306 |
Mineral
Claim |
Cariboo
Gold |
BGM
(100%) |
07-Feb-05 |
18-Apr-33 |
718.73 |
Osisko
Gold Royalties Ltd. (5%) |
| 1095308 |
Mineral
Claim |
Cariboo
Gold |
BGM
(100%) |
01-Dec-06 |
18-Apr-33 |
446.60 |
Osisko
Gold Royalties Ltd. (5%) |
| 1100534 |
Mineral
Claim |
Cariboo
Gold |
BGM
(100%) |
16-Jan-23 |
13-Nov-32 |
465.07 |
Osisko
Gold Royalties Ltd. (5%) |
| ML-1105995 |
Mineral
Lease |
Cariboo
Gold |
BGM
(100%) |
13-Jul-23 |
13-Jul-25 |
155.20 |
|
| |
Osisko Development Corp.
NI 43-101 Technical Report
Feasibility Study for the Cariboo Gold Project |
|
APPENDIX
2: List of Placer Claims and Leases (as of April 30, 2025)
| |
Osisko Development Corp.
NI 43-101 Technical Report
Feasibility Study for the Cariboo Gold Project |
|
| #
Title |
Title
Type |
Property |
Holder |
Issue
Date |
Good
To Date |
Area
(Ha) |
Royalties |
| 560453 |
Placer
Claim |
Cariboo
Gold |
BGM
(100%) |
11-Jun-07 |
15-Nov-25 |
19.43 |
Osisko
Gold Royalties Ltd. (5%) |
| 645923 |
Placer
Claim |
Cariboo
Gold |
BGM
(100%) |
02-Oct-09 |
02-Apr-26 |
19.41 |
Osisko
Gold Royalties Ltd. (5%) |
| 839402 |
Placer
Claim |
Cariboo
Gold |
BGM
(100%) |
01-Dec-10 |
31-Dec-25 |
19.41 |
Osisko
Gold Royalties Ltd. (5%) |
| 1038243 |
Placer
Claim |
Cariboo
Gold |
BGM
(100%) |
28-Aug-15 |
26-Aug-25 |
213.66 |
Osisko
Gold Royalties Ltd. (5%) |
| 1042111 |
Placer
Claim |
Cariboo
Gold |
BGM
(100%) |
17-Feb-16 |
13-Oct-25 |
174.75 |
Osisko
Gold Royalties Ltd. (5%) |
| 1042112 |
Placer
Claim |
Cariboo
Gold |
BGM
(100%) |
17-Feb-16 |
13-Oct-25 |
58.26 |
Osisko
Gold Royalties Ltd. (5%) |
| 1045734 |
Placer
Claim |
Cariboo
Gold |
BGM
(100%) |
03-Aug-16 |
03-Aug-25 |
38.8 |
Osisko
Gold Royalties Ltd. (5%) |
| 1046530 |
Placer
Claim |
Cariboo
Gold |
BGM
(100%) |
08-Sep-16 |
08-Sep-25 |
19.4 |
Osisko
Gold Royalties Ltd. (5%) |
| 1048024 |
Placer
Claim |
Cariboo
Gold |
BGM
(100%) |
24-Nov-16 |
24-Nov-25 |
19.4 |
Osisko
Gold Royalties Ltd. (5%) |
| 1049379 |
Placer
Claim |
Cariboo
Gold |
BGM
(100%) |
22-Jan-17 |
22-Jan-26 |
38.82 |
Osisko
Gold Royalties Ltd. (5%) |
| 1049537 |
Placer
Claim |
Cariboo
Gold |
BGM
(100%) |
27-Jan-17 |
27-Jan-26 |
19.43 |
Osisko
Gold Royalties Ltd. (5%) |
| 1050158 |
Placer
Claim |
Cariboo
Gold |
BGM
(100%) |
20-Feb-17 |
20-Feb-26 |
19.42 |
Osisko
Gold Royalties Ltd. (5%) |
| 1052277 |
Placer
Claim |
Cariboo
Gold |
BGM
(100%) |
31-May-17 |
31-May-26 |
19.41 |
Osisko
Gold Royalties Ltd. (5%) |
| 1052361 |
Placer
Claim |
Cariboo
Gold |
BGM
(100%) |
04-Jun-17 |
04-Jun-26 |
38.8 |
Osisko
Gold Royalties Ltd. (5%) |
| 1052637 |
Placer
Claim |
Cariboo
Gold |
BGM
(100%) |
18-Jun-17 |
18-Jun-26 |
19.42 |
Osisko
Gold Royalties Ltd. (5%) |
| 1055510 |
Placer
Claim |
Cariboo
Gold |
BGM
(100%) |
13-Oct-17 |
13-Oct-25 |
38.8 |
Osisko
Gold Royalties Ltd. (5%) |
| 1055674 |
Placer
Claim |
Cariboo
Gold |
BGM
(100%) |
20-Oct-17 |
20-Oct-25 |
19.42 |
Osisko
Gold Royalties Ltd. (5%) |
| 1057397 |
Placer
Claim |
Cariboo
Gold |
BGM
(100%) |
02-Jan-18 |
18-Oct-25 |
174.78 |
Osisko
Gold Royalties Ltd. (5%) |
| 1058336 |
Placer
Claim |
Cariboo
Gold |
BGM
(100%) |
06-Feb-18 |
06-Feb-26 |
19.42 |
Osisko
Gold Royalties Ltd. (5%) |
| 1058337 |
Placer
Claim |
Cariboo
Gold |
BGM
(100%) |
06-Feb-18 |
06-Feb-26 |
19.43 |
Osisko
Gold Royalties Ltd. (5%) |
| 1063142 |
Placer
Claim |
Cariboo
Gold |
BGM
(100%) |
16-Sep-18 |
16-Sep-25 |
19.41 |
Osisko
Gold Royalties Ltd. (5%) |
| 1063186 |
Placer
Claim |
Cariboo
Gold |
BGM
(100%) |
19-Sep-18 |
19-May-26 |
38.83 |
Osisko
Gold Royalties Ltd. (5%) |
| 1063528 |
Placer
Claim |
Cariboo
Gold |
BGM
(100%) |
02-Oct-18 |
02-Oct-25 |
38.85 |
Osisko
Gold Royalties Ltd. (5%) |
| |
Osisko Development Corp.
NI 43-101 Technical Report
Feasibility Study for the Cariboo Gold Project |
|
| #
Title |
Title
Type |
Property |
Holder |
Issue
Date |
Good
To Date |
Area
(Ha) |
Royalties |
| 1063975 |
Placer
Claim |
Cariboo
Gold |
BGM
(100%) |
22-Oct-18 |
22-Oct-25 |
19.41 |
Osisko
Gold Royalties Ltd. (5%) |
| 1064016 |
Placer
Claim |
Cariboo
Gold |
BGM
(100%) |
24-Oct-18 |
24-Oct-25 |
19.41 |
Osisko
Gold Royalties Ltd. (5%) |
| 1064017 |
Placer
Claim |
Cariboo
Gold |
BGM
(100%) |
24-Oct-18 |
24-Oct-25 |
19.42 |
Osisko
Gold Royalties Ltd. (5%) |
| 1064018 |
Placer
Claim |
Cariboo
Gold |
BGM
(100%) |
24-Oct-18 |
24-Oct-25 |
19.41 |
Osisko
Gold Royalties Ltd. (5%) |
| 1067277 |
Placer
Claim |
Cariboo
Gold |
BGM
(100%) |
17-Mar-19 |
17-Mar-26 |
19.42 |
Osisko
Gold Royalties Ltd. (5%) |
| 1067348 |
Placer
Claim |
Cariboo
Gold |
BGM
(100%) |
20-Mar-19 |
10-Jan-26 |
698.63 |
Osisko
Gold Royalties Ltd. (5%) |
| 1068909 |
Placer
Claim |
Cariboo
Gold |
BGM
(100%) |
04-Jun-19 |
04-Jun-26 |
58.31 |
Osisko
Gold Royalties Ltd. (5%) |
| 1072073 |
Placer
Claim |
Cariboo
Gold |
BGM
(100%) |
23-Oct-19 |
17-Jul-25 |
58.23 |
Osisko
Gold Royalties Ltd. (5%) |
| 1072331 |
Placer
Claim |
Cariboo
Gold |
BGM
(100%) |
01-Nov-19 |
01-Nov-25 |
58.32 |
Osisko
Gold Royalties Ltd. (5%) |
| 1072332 |
Placer
Claim |
Cariboo
Gold |
BGM
(100%) |
01-Nov-19 |
01-Nov-25 |
19.43 |
Osisko
Gold Royalties Ltd. (5%) |
| 1072333 |
Placer
Claim |
Cariboo
Gold |
BGM
(100%) |
01-Nov-19 |
01-Nov-25 |
19.44 |
Osisko
Gold Royalties Ltd. (5%) |
| 1072334 |
Placer
Claim |
Cariboo
Gold |
BGM
(100%) |
01-Nov-19 |
01-Nov-25 |
19.43 |
Osisko
Gold Royalties Ltd. (5%) |
| 1072335 |
Placer
Claim |
Cariboo
Gold |
BGM
(100%) |
01-Nov-19 |
01-Nov-25 |
19.44 |
Osisko
Gold Royalties Ltd. (5%) |
| 1072336 |
Placer
Claim |
Cariboo
Gold |
BGM
(100%) |
01-Nov-19 |
01-Nov-25 |
19.44 |
Osisko
Gold Royalties Ltd. (5%) |
| 1072337 |
Placer
Claim |
Cariboo
Gold |
BGM
(100%) |
01-Nov-19 |
01-Nov-25 |
19.43 |
Osisko
Gold Royalties Ltd. (5%) |
| 1072338 |
Placer
Claim |
Cariboo
Gold |
BGM
(100%) |
01-Nov-19 |
01-Nov-25 |
19.43 |
Osisko
Gold Royalties Ltd. (5%) |
| 1074530 |
Placer
Claim |
Cariboo
Gold |
BGM
(100%) |
11-Feb-20 |
10-Jan-26 |
1,340.98 |
Osisko
Gold Royalties Ltd. (5%) |
| 1074531 |
Placer
Claim |
Cariboo
Gold |
BGM
(100%) |
11-Feb-20 |
10-Jan-26 |
873.86 |
Osisko
Gold Royalties Ltd. (5%) |
| 1076725 |
Placer
Claim |
Cariboo
Gold |
BGM
(100%) |
12-Jun-20 |
12-Dec-25 |
19.41 |
Osisko
Gold Royalties Ltd. (5%) |
| 1079815 |
Placer
Claim |
Cariboo
Gold |
BGM
(100%) |
29-Nov-20 |
29-Nov-25 |
19.41 |
Osisko
Gold Royalties Ltd. (5%) |
| 1094668 |
Placer
Claim |
Cariboo
Gold |
BGM
(100%) |
30-Mar-22 |
30-Mar-26 |
19.41 |
Osisko
Gold Royalties Ltd. (5%) |
| 1099731 |
Placer
Claim |
Cariboo
Gold |
BGM
(100%) |
07-Dec-22 |
07-Dec-25 |
38.85 |
Osisko
Gold Royalties Ltd. (5%) |
| 1099735 |
Placer
Claim |
Cariboo
Gold |
BGM
(100%) |
07-Dec-22 |
07-Dec-25 |
19.43 |
Osisko
Gold Royalties Ltd. (5%) |
| 1101383 |
Placer
Claim |
Cariboo
Gold |
BGM
(100%) |
28-Jan-23 |
28-Jan-26 |
19.43 |
Osisko
Gold Royalties Ltd. (5%) |
| |
Osisko Development Corp.
NI 43-101 Technical Report
Feasibility Study for the Cariboo Gold Project |
|
| #
Title |
Title
Type |
Property |
Holder |
Issue
Date |
Good
To Date |
Area
(Ha) |
Royalties |
| 1101408 |
Placer
Claim |
Cariboo
Gold |
BGM
(100%) |
28-Jan-23 |
28-Jan-26 |
19.43 |
Osisko
Gold Royalties Ltd. (5%) |
| 1102992 |
Placer
Claim |
Cariboo
Gold |
BGM
(100%) |
11-Mar-23 |
11-Mar-26 |
19.41 |
Osisko
Gold Royalties Ltd. (5%) |
| 514441 |
Placer
Lease |
Cariboo
Gold |
BGM
(100%) |
13-Jun-05 |
13-Jun-25 |
104.8 |
Osisko
Gold Royalties Ltd. (5%) |
| 541435 |
Placer
Lease |
Cariboo
Gold |
BGM
(100%) |
15-Sep-06 |
15-Sep-25 |
24.76 |
Osisko
Gold Royalties Ltd. (5%) |
| 545967 |
Placer
Lease |
Cariboo
Gold |
BGM
(100%) |
27-Nov-06 |
27-Nov-26 |
35.69 |
Osisko
Gold Royalties Ltd. (5%) |
| 367303 |
Placer
Lease |
Cariboo
Gold |
BGM
(100%) |
05-Feb-99 |
05-Feb-26 |
161.77 |
Osisko
Gold Royalties Ltd. (5%) |
| 370373 |
Placer
Lease |
Cariboo
Gold |
BGM
(100%) |
19-Oct-99 |
19-Oct-25 |
46.26 |
Osisko
Gold Royalties Ltd. (5%) |
| 384442 |
Placer
Lease |
Cariboo
Gold |
BGM
(100%) |
15-May-01 |
15-May-26 |
254.86 |
Osisko
Gold Royalties Ltd. (5%) |
| 394333 |
Placer
Lease |
Cariboo
Gold |
BGM
(100%) |
19-Aug-02 |
19-Aug-25 |
518.8 |
Osisko
Gold Royalties Ltd. (5%) |
| 395284 |
Placer
Lease |
Cariboo
Gold |
BGM
(100%) |
28-Aug-02 |
28-Aug-25 |
524.7 |
Osisko
Gold Royalties Ltd. (5%) |
| 396850 |
Placer
Lease |
Cariboo
Gold |
BGM
(100%) |
20-Jan-03 |
20-Jan-26 |
271.1 |
Osisko
Gold Royalties Ltd. (5%) |
| 401340 |
Placer
Lease |
Cariboo
Gold |
BGM
(100%) |
16-May-03 |
16-May-23 |
17 |
Osisko
Gold Royalties Ltd. (5%) |
| 401342 |
Placer
Lease |
Cariboo
Gold |
BGM
(100%) |
16-May-03 |
16-May-23 |
124.55 |
Osisko
Gold Royalties Ltd. (5%) |
| 401442 |
Placer
Lease |
Cariboo
Gold |
BGM
(100%) |
16-May-03 |
16-May-23 |
282.36 |
Osisko
Gold Royalties Ltd. (5%) |
| 404854 |
Placer
Lease |
Cariboo
Gold |
BGM
(100%) |
24-Nov-03 |
24-Nov-23 |
29.1 |
Osisko
Gold Royalties Ltd. (5%) |
| |
Osisko Development Corp.
NI 43-101 Technical Report
Feasibility Study for the Cariboo Gold Project |
|
APPENDIX
3: Crown-Granted Mineral Claims (as of April 30, 2025)
| |
Osisko Development Corp.
NI 43-101 Technical Report
Feasibility Study for the Cariboo Gold Project |
|
| PID |
Title
# |
CG
# |
Original
grantee |
Fee
simple owner |
UNDERSURFACE
OWNER |
Area
(Acres) |
Royalty |
| 023-747-692 |
BB2009650 |
4215/55 |
ADA
JANE BRUCE MASON |
DAVID
JORGENSON, BUSINESSMAN/RESTAURANT OWNER |
BARKERVILLE
GOLD MINES LTD. |
0.20 |
OGR
(5%) |
| 023-747-676 |
PS36983 |
4215/55 |
ADA
JANE BRUCE MASON |
CHERYL
KATHERYN MACARTHY, BUSINESSWOMAN |
BARKERVILLE
GOLD MINES LTD. |
0.21 |
OGR
(5%) |
| 023-677-104 |
PL8364 |
4215/55 |
ADA
JANE BRUCE MASON |
THE
CROWN IN RIGHT OF BRITISH COLUMBIA, AS REPRESENTED BY THE MINISTER OF ENVIRONMENT LANDS AND PARKS |
BARKERVILLE
GOLD MINES LTD. |
0.52 |
OGR
(5%) |
| 023-677-091 |
PL8363 |
4215/55 |
ADA
JANE BRUCE MASON |
THE
CROWN IN RIGHT OF BRITISH COLUMBIA, AS REPRESENTED BY THE MINISTER OF ENVIRONMENT LANDS AND PARKS |
BARKERVILLE
GOLD MINES LTD. |
0.18 |
OGR
(5%) |
| 023-677-074 |
PL8361 |
4215/55 |
ADA
JANE BRUCE MASON |
THE
CROWN IN RIGHT OF BRITISH COLUMBIA, AS REPRESENTED BY THE MINISTER OF ENVIRONMENT LANDS AND PARKS |
BARKERVILLE
GOLD MINES LTD. |
0.14 |
OGR
(5%) |
| 023-677-066 |
PL8360 |
4215/55 |
ADA
JANE BRUCE MASON |
THE
CROWN IN RIGHT OF BRITISH COLUMBIA, AS REPRESENTED BY THE MINISTER OF ENVIRONMENT LANDS AND PARKS |
BARKERVILLE
GOLD MINES LTD. |
0.15 |
OGR
(5%) |
| 023-677-058 |
PL8359 |
4215/55 |
ADA
JANE BRUCE MASON |
THE
CROWN IN RIGHT OF BRITISH COLUMBIA, AS REPRESENTED BY THE MINISTER OF ENVIRONMENT LANDS AND PARKS |
BARKERVILLE
GOLD MINES LTD. |
0.20 |
OGR
(5%) |
| 023-677-031 |
PL8357 |
4215/55 |
ADA
JANE BRUCE MASON |
THE
CROWN IN RIGHT OF BRITISH COLUMBIA, AS REPRESENTED BY THE MINISTER OF ENVIRONMENT LANDS AND PARKS |
BARKERVILLE
GOLD MINES LTD. |
0.39 |
OGR
(5%) |
| 023-677-023 |
PL8356 |
4215/55 |
ADA
JANE BRUCE MASON |
THE
CROWN IN RIGHT OF BRITISH COLUMBIA, AS REPRESENTED BY THE MINISTER OF ENVIRONMENT LANDS AND PARKS |
BARKERVILLE
GOLD MINES LTD. |
0.30 |
OGR
(5%) |
| 023-677-015 |
PL8355 |
4215/55 |
ADA
JANE BRUCE MASON |
THE
CROWN IN RIGHT OF BRITISH COLUMBIA, AS REPRESENTED BY THE MINISTER OF ENVIRONMENT LANDS AND PARKS |
BARKERVILLE
GOLD MINES LTD. |
0.24 |
OGR
(5%) |
| 023-677-007 |
PM47667 |
4215/55 |
ADA
JANE BRUCE MASON |
BARKERVILLE
GOLD MINES LTD. |
BARKERVILLE
GOLD MINES LTD. / THE CROWN IN RIGHT OF BRITISH COLUMBIA |
1.25 |
OGR
(5%) |
| 023-207-655 |
CA1027296 |
4215/55 |
ADA
JANE BRUCE MASON |
STANDARD
DRILLING & ENGINEERING LTD. |
BARKERVILLE
GOLD MINES LTD. |
0.29 |
OGR
(5%) |
| |
Osisko Development Corp.
NI 43-101 Technical Report
Feasibility Study for the Cariboo Gold Project |
|
| PID |
Title
# |
CG
# |
Original
grantee |
Fee
simple owner |
UNDERSURFACE
OWNER |
Area
(Acres) |
Royalty |
| 018-856-870 |
CA9850205 |
4215/55 |
ADA
JANE BRUCE MASON |
BARKERVILLE
GOLD MINES LTD. |
BARKERVILLE
GOLD MINES LTD. |
0.60 |
OGR
(5%) |
| 018-329-705 |
CA3679841 |
4215/55 |
ADA
JANE BRUCE MASON |
DARYLE
WAYNE NESIMUIK, SECURITY GUARD |
BARKERVILLE
GOLD MINES LTD. |
0.39 |
OGR
(5%) |
| 018-329-683 |
PT14010 |
4215/55 |
ADA
JANE BRUCE MASON |
567093
B.C. LTD. AS TO AN UNDIVIDED 1/2 INTEREST & 567102 B.C. LTD. AS TO AN UNDIVIDED 1/2 INTEREST |
BARKERVILLE
GOLD MINES LTD. |
0.76 |
OGR
(5%) |
| 018-172-792 |
CA4250001 |
4215/55 |
ADA
JANE BRUCE MASON |
RICHARD
THOMAS WRIGHT, AUTHOR |
BARKERVILLE
GOLD MINES LTD. |
0.29 |
OGR
(5%) |
| 014-982-056 |
PD28740 |
4215/55 |
ADA
JANE BRUCE MASON |
THE
LOWHEE MINING COMPANY LIMITED (NON-PERSONAL LIABILITY) |
BARKERVILLE
GOLD MINES LTD. |
246.00 |
OGR
(5%) |
| 014-543-575 |
PC37299 |
4215/55 |
ADA
JANE BRUCE MASON |
ERNEST.
H. BELLAVANCE & ORPHIR CHARLES BELLAVANCE (FORFEITED TO CROWN) |
BARKERVILLE
GOLD MINES LTD. |
0.10 |
OGR
(5%) |
| 014-543-567 |
PC37298 |
4215/55 |
ADA
JANE BRUCE MASON |
ERNEST.
H. BELLAVANCE & ORPHIR CHARLES BELLAVANCE (FORFEITED TO CROWN) |
BARKERVILLE
GOLD MINES LTD. |
0.10 |
OGR
(5%) |
| 013-914-740 |
PC21461 |
4215/55 |
ADA
JANE BRUCE MASON |
THE
SOUTH WELLS DEVELOPMENT COMPANY LIMITED (FORFEITED TO CROWN) |
BARKERVILLE
GOLD MINES LTD. |
1.32 |
OGR
(5%) |
| 013-900-111 |
CA6737987 |
4215/55 |
ADA
JANE BRUCE MASON |
NESTEL
CONTRACTING LTD. |
BARKERVILLE
GOLD MINES LTD. |
0.12 |
OGR
(5%) |
| 013-900-064 |
CA6737986 |
4215/55 |
ADA
JANE BRUCE MASON |
NESTEL
CONTRACTING LTD. |
BARKERVILLE
GOLD MINES LTD. |
0.23 |
OGR
(5%) |
| 013-864-653 |
PS39105 |
4215/55 |
ADA
JANE BRUCE MASON |
ROBERT
LISLE BUXTON, BUSINESSMAN |
BARKERVILLE
GOLD MINES LTD. |
0.12 |
OGR
(5%) |
| 013-864-645 |
PS39106 |
4215/55 |
ADA
JANE BRUCE MASON |
ROBERT
LISLE BUXTON, BUSINESSMAN |
BARKERVILLE
GOLD MINES LTD. |
0.12 |
OGR
(5%) |
| 013-864-629 |
PS39104 |
4215/55 |
ADA
JANE BRUCE MASON |
ROBERT
LISLE BUXTON, BUSINESSMAN |
BARKERVILLE
GOLD MINES LTD. |
0.12 |
OGR
(5%) |
| 013-864-611 |
PS39103 |
4215/55 |
ADA
JANE BRUCE MASON |
ROBERT
LISLE BUXTON, BUSINESSMAN |
BARKERVILLE
GOLD MINES LTD. |
0.13 |
OGR
(5%) |
| 013-864-599 |
CA4717816 |
4215/55 |
ADA
JANE BRUCE MASON |
JACK
O CLUBS GENERAL INC. |
BARKERVILLE
GOLD MINES LTD. |
0.14 |
OGR
(5%) |
| 013-840-100 |
PM29333 |
4215/55 |
ADA
JANE BRUCE MASON |
THE
CROWN IN RIGHT OF BRITISH COLUMBIA, AS REPRESENTED BY THE MINISTER OF ENVIRONMENT LANDS AND PARKS |
BARKERVILLE
GOLD MINES LTD. |
51.14 |
OGR
(5%) |
| 013-840-088 |
PC20358 |
4215/55 |
ADA
JANE BRUCE MASON |
HER
MAJESTY THE QUEEN IN RIGHT OF THE PROVINCE OF BRITISH COLUMBIA |
BARKERVILLE
GOLD MINES LTD. |
6.25 |
OGR
(5%) |
| 013-839-969 |
PC20351 |
4215/55 |
ADA
JANE BRUCE MASON |
HER
MAJESTY THE QUEEN IN RIGHT OF THE PROVINCE OF BRITISH COLUMBIA |
BARKERVILLE
GOLD MINES LTD. |
0.17 |
OGR
(5%) |
| |
Osisko Development Corp.
NI 43-101 Technical Report
Feasibility Study for the Cariboo Gold Project |
|
| PID |
Title
# |
CG
# |
Original
grantee |
Fee
simple owner |
UNDERSURFACE
OWNER |
Area
(Acres) |
Royalty |
| 013-839-951 |
PC20350 |
4215/55 |
ADA
JANE BRUCE MASON |
HER
MAJESTY THE QUEEN IN RIGHT OF THE PROVINCE OF BRITISH COLUMBIA |
BARKERVILLE
GOLD MINES LTD. |
0.12 |
OGR
(5%) |
| 013-839-926 |
PC20184 |
4215/55 |
ADA
JANE BRUCE MASON |
THE
SOUTH WELLS DEVELOPMENT COMPANY LIMITED (FORFEITED TO CROWN) |
BARKERVILLE
GOLD MINES LTD. |
0.12 |
OGR
(5%) |
| 013-839-918 |
PS39107 |
4215/55 |
ADA
JANE BRUCE MASON |
ROBERT
LISLE BUXTON, BUSINESSMAN |
BARKERVILLE
GOLD MINES LTD. |
0.12 |
OGR
(5%) |
| 013-820-354 |
CA16656 |
4215/55 |
ADA
JANE BRUCE MASON |
BRENDAN
MORRIS WOODMAN, BAKER & TERRY ANNE WOODMAN, COMPUTER TECHNICIAN AS JOINT TENANTS |
BARKERVILLE
GOLD MINES LTD. |
0.12 |
OGR
(5%) |
| 013-820-346 |
CA16655 |
4215/55 |
ADA
JANE BRUCE MASON |
BRENDAN
MORRIS WOODMAN, BAKER & TERRY ANNE WOODMAN, COMPUTER TECHNICIAN AS JOINT TENANTS |
BARKERVILLE
GOLD MINES LTD. |
0.12 |
OGR
(5%) |
| 013-820-338 |
CA16654 |
4215/55 |
ADA
JANE BRUCE MASON |
BRENDAN
MORRIS WOODMAN, BAKER & TERRY ANNE WOODMAN, COMPUTER TECHNICIAN AS JOINT TENANTS |
BARKERVILLE
GOLD MINES LTD. |
0.12 |
OGR
(5%) |
| 013-820-320 |
CA16653 |
4215/55 |
ADA
JANE BRUCE MASON |
BRENDAN
MORRIS WOODMAN, BAKER & TERRY ANNE WOODMAN, COMPUTER TECHNICIAN AS JOINT TENANTS |
BARKERVILLE
GOLD MINES LTD. |
0.10 |
OGR
(5%) |
| 013-820-231 |
CA16652 |
4215/55 |
ADA
JANE BRUCE MASON |
BRENDAN
MORRIS WOODMAN, BAKER & TERRY ANNE WOODMAN, COMPUTER TECHNICIAN AS JOINT TENANTS |
BARKERVILLE
GOLD MINES LTD. |
0.55 |
OGR
(5%) |
| 013-817-931 |
PS39102 |
4215/55 |
ADA
JANE BRUCE MASON |
ROBERT
LISLE BUXTON, BUSINESSMAN |
BARKERVILLE
GOLD MINES LTD. |
0.13 |
OGR
(5%) |
| 013-817-680 |
27591M |
4215/55 |
ADA
JANE BRUCE MASON |
FREDERICK
THOMASSON (FORFEITED TO CROWN) |
BARKERVILLE
GOLD MINES LTD. |
0.10 |
OGR
(5%) |
| 013-817-655 |
19149M |
4215/55 |
ADA
JANE BRUCE MASON |
FREDERICK
W. BECKER (FORFEITED TO CROWN) |
BARKERVILLE
GOLD MINES LTD. |
0.10 |
OGR
(5%) |
| 013-817-647 |
11460M |
4215/55 |
ADA
JANE BRUCE MASON |
JOSEPH
HAROLD SMYTH (FORFEITED TO CROWN) |
BARKERVILLE
GOLD MINES LTD. |
0.10 |
OGR
(5%) |
| 013-814-966 |
PS39101 |
4215/55 |
ADA
JANE BRUCE MASON |
ROBERT
LISLE BUXTON, BUSINESSMAN |
BARKERVILLE
GOLD MINES LTD. |
0.27 |
OGR
(5%) |
| 013-813-951 |
BA89358 |
4215/55 |
ADA
JANE BRUCE MASON |
CHERYL
KATHERYN MACCARTHY, BUSINESSWOMAN & DAVID GORDON JORGENSON, BUSINESSMAN AS JOINT TENANTS |
BARKERVILLE
GOLD MINES LTD. |
0.11 |
OGR
(5%) |
| 013-778-935 |
CA3662739 |
4215/55 |
ADA
JANE BRUCE MASON |
BRITISH
COLUMBIA EMERGENCY HEALTH SERVICES |
BARKERVILLE
GOLD MINES LTD. |
0.08 |
OGR
(5%) |
| 013-778-927 |
CA3662734 |
4215/55 |
ADA
JANE BRUCE MASON |
BRITISH
COLUMBIA EMERGENCY HEALTH SERVICES |
BARKERVILLE
GOLD MINES LTD. |
0.08 |
OGR
(5%) |
| |
Osisko Development Corp.
NI 43-101 Technical Report
Feasibility Study for the Cariboo Gold Project |
|
| PID |
Title
# |
CG
# |
Original
grantee |
Fee
simple owner |
UNDERSURFACE
OWNER |
Area
(Acres) |
Royalty |
| 013-778-919 |
CA3662725 |
4215/55 |
ADA
JANE BRUCE MASON |
BRITISH
COLUMBIA EMERGENCY HEALTH SERVICES |
BARKERVILLE
GOLD MINES LTD. |
0.27 |
OGR
(5%) |
| 012-180-491 |
PT17982 |
4215/55 |
ADA
JANE BRUCE MASON |
GEORGE
WILLIAM HARTFORD, DIAMOND DRILLER |
BARKERVILLE
GOLD MINES LTD. |
0.24 |
OGR
(5%) |
| 008-466-424 |
PP6789 |
4215/55 |
ADA
JANE BRUCE MASON |
JOY
MARGUERITE STEPAN, BUSINESSWOMAN |
BARKERVILLE
GOLD MINES LTD. |
0.29 |
OGR
(5%) |
| 008-466-416 |
BB3013093 |
4215/55 |
ADA
JANE BRUCE MASON |
HER
MAJESTY THE QUEEN IN RIGHT OF CANADA AS REPRESENTED BY THE MINISTER OF PUBLIC SAFETY AND EMERGENCY PREPAREDNESS C/O ROYAL CANADIAN
MOUNTED POLICE |
BARKERVILLE
GOLD MINES LTD. |
0.25 |
OGR
(5%) |
| 007-813-678 |
CA8737090 |
4215/55 |
ADA
JANE BRUCE MASON |
MERIDIAN
VENTURES LTD., INC.NO. 1196928 |
BARKERVILLE
GOLD MINES LTD. |
0.17 |
OGR
(5%) |
| 007-530-692 |
BA142314 |
4215/55 |
ADA
JANE BRUCE MASON |
TIMOTHY
JOHN HINDSON, PICKER TRUCK SWAMPER |
BARKERVILLE
GOLD MINES LTD. |
1.43 |
OGR
(5%) |
| 007-527-331 |
CA7206272 |
4215/55 |
ADA
JANE BRUCE MASON |
CHRISTINA
ROSE MARIA SCHIEN, SR. BUSINESS SYSTEMS ANALYST & EVELYN CAROLYN WATT, ASSOCIATE DIRECTOR HUMAN RESOURCES AS JOINT TENANTS |
BARKERVILLE
GOLD MINES LTD. |
0.92 |
OGR
(5%) |
| 006-787-592 |
CA3322184 |
4215/55 |
ADA
JANE BRUCE MASON |
BARKERVILLE
GOLD MINES LTD. |
BARKERVILLE
GOLD MINES LTD. |
0.42 |
OGR
(5%) |
| 006-342-281 |
Y5870 |
4215/55 |
ADA
JANE BRUCE MASON |
METOD
NOVAK, MILLWORKER & MARIA NOVAK, HIS WIFE AS JOINT TENANTS |
BARKERVILLE
GOLD MINES LTD. |
0.33 |
OGR
(5%) |
| 010-403-060 |
PP20687 |
4215/55,
2517/101 |
ADA
JANE BRUCE MASON (DL 131) / MARY AGNES MASON (TRANSFERRED TO LOWHEE MINING COMPANY LTD.) (DL 391) |
DISTRICT
OF WELLS |
BARKERVILLE
GOLD MINES LTD. |
0.10 |
OGR
(5%) |
| 013-820-150 |
PC19612 |
1036/97,
2517/101 |
ARCHIBALD
MCINTYRE |
THE
SOUTH WELLS DEVELOPMENT COMPANY LIMITED (FORFEITED TO CROWN) |
BARKERVILLE
GOLD MINES LTD. |
0.08 |
OGR
(5%) |
| 013-820-125 |
PC19611 |
1036/97,
2517/101 |
ARCHIBALD
MCINTYRE |
THE
SOUTH WELLS DEVELOPMENT COMPANY LIMITED (FORFEITED TO CROWN) |
BARKERVILLE
GOLD MINES LTD. |
0.07 |
OGR
(5%) |
| 013-820-117 |
PC19610 |
1036/97,
2517/101 |
ARCHIBALD
MCINTYRE |
THE
SOUTH WELLS DEVELOPMENT COMPANY LIMITED (FORFEITED TO CROWN) |
BARKERVILLE
GOLD MINES LTD. |
0.06 |
OGR
(5%) |
| 031-410-839 |
CA9850175 |
1036/97 |
ARCHIBALD
MCINTYRE |
BARKERVILLE
GOLD MINES LTD. |
BARKERVILLE
GOLD MINES LTD. |
0.14 |
OGR
(5%) |
| 031-410-821 |
CA9850164 |
1036/97 |
ARCHIBALD
MCINTYRE |
BARKERVILLE
GOLD MINES LTD. |
BARKERVILLE
GOLD MINES LTD. |
0.14 |
OGR
(5%) |
| 031-410-812 |
CA9850203 |
1036/97 |
ARCHIBALD
MCINTYRE |
BARKERVILLE
GOLD MINES LTD. |
BARKERVILLE
GOLD MINES LTD. |
0.10 |
OGR
(5%) |
| |
Osisko Development Corp.
NI 43-101 Technical Report
Feasibility Study for the Cariboo Gold Project |
|
| PID |
Title
# |
CG
# |
Original
grantee |
Fee
simple owner |
UNDERSURFACE
OWNER |
Area
(Acres) |
Royalty |
| 031-288-812 |
CA8702236 |
1036/97 |
ARCHIBALD
MCINTYRE |
DAWN
MARIE LEROY, REVENUE CLERK & PHILLIP OLIVER LEROY, PLOW TRUCK DRIVER AS JOINT TENANTS |
BARKERVILLE
GOLD MINES LTD. |
0.08 |
OGR
(5%) |
| 031-288-804 |
CA8702235 |
1036/97 |
ARCHIBALD
MCINTYRE |
DAWN
MARIE LEROY, REVENUE CLERK & PHILLIP OLIVER LEROY, PLOW TRUCK DRIVER AS JOINT TENANTS |
BARKERVILLE
GOLD MINES LTD. |
0.14 |
OGR
(5%) |
| 030-119-731 |
CA6363142 |
1036/97 |
ARCHIBALD
MCINTYRE |
DAVID
GORDON JORGENSON, BUSINESSMAN |
BARKERVILLE
GOLD MINES LTD. |
0.17 |
OGR
(5%) |
| 029-934-532 |
CA5512752 |
1036/97 |
ARCHIBALD
MCINTYRE |
DISTRICT
OF WELLS |
BARKERVILLE
GOLD MINES LTD. |
0.16 |
OGR
(5%) |
| 029-311-161 |
CA6501520 |
1036/97 |
ARCHIBALD
MCINTYRE |
CHRISTOPHER
ROBERT RANDALL, MAINTENANCE-SECURITY |
BARKERVILLE
GOLD MINES LTD. |
0.25 |
OGR
(5%) |
| 028-952-341 |
BB1500919 |
1036/97 |
ARCHIBALD
MCINTYRE |
MARILYN
LEIGH TURNER, CASHIER-HOST |
BARKERVILLE
GOLD MINES LTD. |
0.36 |
OGR
(5%) |
| 028-116-925 |
WX2103600 |
1036/97 |
ARCHIBALD
MCINTYRE |
KATHLEEN
ANNE KINAKIN, PHOTOGRAPHIC RENTALS MANAGER |
BARKERVILLE
GOLD MINES LTD. |
0.22 |
OGR
(5%) |
| 027-312-861 |
CA670439 |
1036/97 |
ARCHIBALD
MCINTYRE |
PAUL
GUIGUET, SURVEYOR |
BARKERVILLE
GOLD MINES LTD. |
0.08 |
OGR
(5%) |
| 027-146-570 |
BB535428 |
1036/97 |
ARCHIBALD
MCINTYRE |
LYNDA
JEAN MOON, BUSINESSWOMAN |
BARKERVILLE
GOLD MINES LTD. |
0.29 |
OGR
(5%) |
| 026-468-891 |
WX2049866 |
1036/97 |
ARCHIBALD
MCINTYRE |
CAROLINE
CONSTANCE BARBARA VON SCHILLING |
BARKERVILLE
GOLD MINES LTD. |
0.07 |
OGR
(5%) |
| 026-468-883 |
CA6677331 |
1036/97 |
ARCHIBALD
MCINTYRE |
TIM
GORDON ARTHUR HURLEY EXECUTOR OF THE WILL OF PATRICIA KATHLEEN CHAUNCEY, DECEASED (CA6677331) |
BARKERVILLE
GOLD MINES LTD. |
0.07 |
OGR
(5%) |
| 025-268-902 |
PS32266 |
1036/97 |
ARCHIBALD
MCINTYRE |
BRIAN
JAMES WEST, SECURITY PATROLMAN |
BARKERVILLE
GOLD MINES LTD. |
0.28 |
OGR
(5%) |
| 024-815-781 |
PP20686 |
1036/97 |
ARCHIBALD
MCINTYRE |
DISTRICT
OF WELLS |
BARKERVILLE
GOLD MINES LTD. |
0.30 |
OGR
(5%) |
| 024-633-321 |
BV28062 |
1036/97 |
ARCHIBALD
MCINTYRE |
DISTRICT
OF WELLS |
BARKERVILLE
GOLD MINES LTD. |
0.53 |
OGR
(5%) |
| 024-633-313 |
BV280661 |
1036/97 |
ARCHIBALD
MCINTYRE |
DISTRICT
OF WELLS |
BARKERVILLE
GOLD MINES LTD. |
0.81 |
OGR
(5%) |
| 024-633-305 |
BV280660 |
1036/97 |
ARCHIBALD
MCINTYRE |
DISTRICT
OF WELLS |
BARKERVILLE
GOLD MINES LTD. |
2.09 |
OGR
(5%) |
| 024-577-961 |
PN30753 |
1036/97 |
ARCHIBALD
MCINTYRE |
GARY
ANTHONY CIROTTO, GUIDE & BARBARA ANGELA CIROTTO, HOMEMAKER AS JOINT TENANTS |
BARKERVILLE
GOLD MINES LTD. |
0.22 |
OGR
(5%) |
| 024-309-231 |
CA754311 |
1036/97 |
ARCHIBALD
MCINTYRE |
JANE
MCDOUGAL ATKINSON, SELF EMPLOYED |
BARKERVILLE
GOLD MINES LTD. |
0.12 |
OGR
(5%) |
| 024-238-635 |
PM37394 |
1036/97 |
ARCHIBALD
MCINTYRE |
WELLS
HOTEL LTD. |
BARKERVILLE
GOLD MINES LTD. |
0.45 |
OGR
(5%) |
| |
Osisko Development Corp.
NI 43-101 Technical Report
Feasibility Study for the Cariboo Gold Project |
|
| PID |
Title
# |
CG
# |
Original
grantee |
Fee
simple owner |
UNDERSURFACE
OWNER |
Area
(Acres) |
Royalty |
| 023-612-428 |
CA7445575 |
1036/97 |
ARCHIBALD
MCINTYRE |
CARRIE-LEE
DAWNE CHARD, PRODUCTION WORKER & TAMMY DOROTHY GAYLENE CHARD, CUSTODIAL & SPECIAL EVENTS AS JOINT TENANTS |
BARKERVILLE
GOLD MINES LTD. |
0.22 |
OGR
(5%) |
| 023-544-970 |
PN32150 |
1036/97 |
ARCHIBALD
MCINTYRE |
BRADLEY
KANE PETER CHUDIAK, BARRISTER AND SOLICITOR & PATRICIA LEAH SCHMIT, BARRISTER AND SOLICITOR AS JOINT TENANTS |
BARKERVILLE
GOLD MINES LTD. |
0.38 |
OGR
(5%) |
| 023-437-545 |
CA589225 |
1036/97 |
ARCHIBALD
MCINTYRE |
PETER
NORTH, MUSIC DIRECTOR |
BARKERVILLE
GOLD MINES LTD. |
0.12 |
OGR
(5%) |
| 023-304-626 |
CA1276916 |
1036/97 |
ARCHIBALD
MCINTYRE |
PHILLIP
LEROY, TRUCK DRIVER & DAWN LEROY, REVENUE CLERK |
BARKERVILLE
GOLD MINES LTD. |
0.11 |
OGR
(5%) |
| 023-266-481 |
CA4347724 |
1036/97 |
ARCHIBALD
MCINTYRE |
DAVID
JACOB HARDER, PRODUCER/CURATOR & CARLEIGH CHRISTIANE BRIDGE DREW, MARKETING OFFICER AS JOINT TENANTS |
BARKERVILLE
GOLD MINES LTD. |
0.12 |
OGR
(5%) |
| 023-242-281 |
CA2162580 |
1036/97 |
ARCHIBALD
MCINTYRE |
KARA
ERMINA SONJA HAACK, RETAIL MANAGER |
BARKERVILLE
GOLD MINES LTD. |
0.09 |
OGR
(5%) |
| 023-216-395 |
PJ39337 |
1036/97 |
ARCHIBALD
MCINTYRE |
THE
CROWN IN RIGHT OF BRITISH COLUMBIA, AS REPRESENTED BY THE MINISTER OF ENVIRONMENT LANDS AND PARKS |
BARKERVILLE
GOLD MINES LTD. |
0.14 |
OGR
(5%) |
| 023-216-387 |
PJ39336 |
1036/97 |
ARCHIBALD
MCINTYRE |
THE
CROWN IN RIGHT OF BRITISH COLUMBIA, AS REPRESENTED BY THE MINISTER OF ENVIRONMENT LANDS AND PARKS |
BARKERVILLE
GOLD MINES LTD. |
0.14 |
OGR
(5%) |
| 023-216-271 |
BB1350286 |
1036/97 |
ARCHIBALD
MCINTYRE |
BRIAN
DOUGLAS RUMMEL, SELF EMPLOYED BUSINESSMAN & PATRICIA DONNA ANGELA RUMMEL, SALES CLERK AS JOINT TENANTS |
BARKERVILLE
GOLD MINES LTD. |
0.11 |
OGR
(5%) |
| 023-213-833 |
PL42582 |
1036/97 |
ARCHIBALD
MCINTYRE |
S.L.R.
DEVELOPMENTS LTD. |
BARKERVILLE
GOLD MINES LTD. |
0.12 |
OGR
(5%) |
| 023-203-935 |
CA4715819 |
1036/97 |
ARCHIBALD
MCINTYRE |
MANDY
DANIELLE KILSBY, CURATOR & DONALD ERNSET ALEXANDER NELSON, ACTOR/MAINTENANCE AS JOINT TENANTS |
BARKERVILLE
GOLD MINES LTD. |
0.31 |
OGR
(5%) |
| 023-195-291 |
CA6750676 |
1036/97 |
ARCHIBALD
MCINTYRE |
JULIE
ELLEN BOWLBY, RETIRED |
BARKERVILLE
GOLD MINES LTD. |
0.10 |
OGR
(5%) |
| 023-189-941 |
CA3934472 |
1036/97 |
ARCHIBALD
MCINTYRE |
WAYNE
RANDOLPH HOLMES, PURCHASER & VICKY LYNN HOLMES, HOMEMAKER AS JOINT TENANTS |
BARKERVILLE
GOLD MINES LTD. |
0.11 |
OGR
(5%) |
| 023-080-817 |
PJ16775 |
1036/97 |
ARCHIBALD
MCINTYRE |
RODGER
DAVID BOYCHUK, RETIRED |
BARKERVILLE
GOLD MINES LTD. |
0.10 |
OGR
(5%) |
| |
Osisko Development Corp.
NI 43-101 Technical Report
Feasibility Study for the Cariboo Gold Project |
|
| PID |
Title
# |
CG
# |
Original
grantee |
Fee
simple owner |
UNDERSURFACE
OWNER |
Area
(Acres) |
Royalty |
| 019-012-055 |
CA4109683 |
1036/97 |
ARCHIBALD
MCINTYRE |
ISLAND
MOUNTAIN ARTS SOCIETY |
BARKERVILLE
GOLD MINES LTD. |
0.38 |
OGR
(5%) |
| 018-968-635 |
CA7038884 |
1036/97 |
ARCHIBALD
MCINTYRE |
KARA
ERMINA SONJA HAACK, RCMP DISPATCHER |
BARKERVILLE
GOLD MINES LTD. |
0.13 |
OGR
(5%) |
| 018-962-327 |
CA9077660 |
1036/97 |
ARCHIBALD
MCINTYRE |
MATTHEW
CRAWFORD LEES, HR MANAGER & KRISTA RAE WALLACE, SINGER AS JOINT TENANTS |
BARKERVILLE
GOLD MINES LTD. |
0.11 |
OGR
(5%) |
| 018-959-911 |
CA5417040 |
1036/97 |
ARCHIBALD
MCINTYRE |
SHANE
STEPHEN LARSON, BLACKSMITH & ANA MICHELLE LARSON, FLIGHT ATTENDANT AS JOINT TENANTS |
BARKERVILLE
GOLD MINES LTD. |
0.10 |
OGR
(5%) |
| 018-959-903 |
CA5249337 |
1036/97 |
ARCHIBALD
MCINTYRE |
RICHARD
ANTON WESTERN, SELF EMPLOYED |
BARKERVILLE
GOLD MINES LTD. |
0.10 |
OGR
(5%) |
| 018-959-890 |
CA5249336 |
1036/97 |
ARCHIBALD
MCINTYRE |
RICHARD
ANTON WESTERN, SELF EMPLOYED |
BARKERVILLE
GOLD MINES LTD. |
0.10 |
OGR
(5%) |
| 018-947-824 |
PJ4417 |
1036/97 |
ARCHIBALD
MCINTYRE |
JODY
ANNE HUNTER, GOVERNMENT EMPLOYEE |
BARKERVILLE
GOLD MINES LTD. |
0.14 |
OGR
(5%) |
| 018-847-421 |
BX202773 |
1036/97 |
ARCHIBALD
MCINTYRE |
KATHLEEN
SHARON LANDRY, SELF-EMPLOYED |
BARKERVILLE
GOLD MINES LTD. |
0.11 |
OGR
(5%) |
| 018-847-391 |
CA4483505 |
1036/97 |
ARCHIBALD
MCINTYRE |
JOHN
DAVID PAGET, RETIRED & HEDY TAMLAY CONWRIGHT, NURSE AS JOINT TENANTS |
BARKERVILLE
GOLD MINES LTD. |
0.14 |
OGR
(5%) |
| 018-847-374 |
CA5940055 |
1036/97 |
ARCHIBALD
MCINTYRE |
JOEY
JAMES CONNOR, HEAVY EQUIPMENT OPERATOR & CANDICE ERIN CONNOR, OFFICE ADMINISTRATOR AS JOINT TENANTS |
BARKERVILLE
GOLD MINES LTD. |
0.12 |
OGR
(5%) |
| 018-847-366 |
CA3715088 |
1036/97 |
ARCHIBALD
MCINTYRE |
IAN
BRUCE MACDONALD, LOG HOME BUILDER |
BARKERVILLE
GOLD MINES LTD. |
0.11 |
OGR
(5%) |
| 018-847-340 |
BX36213 |
1036/97 |
ARCHIBALD
MCINTYRE |
BARKERVILLE
GOLD MINES LTD. |
THE
CROWN IN RIGHT OF BRITISH COLUMBIA |
0.13 |
|
| 018-847-331 |
CA6301440 |
1036/97 |
ARCHIBALD
MCINTYRE |
THOMAS
EDWIN COOLEN, AUTOMOTIVE MECHANIC & JENNA MAUREEN COOLEN, HOMEMAKER AS JOINT TENANTS |
BARKERVILLE
GOLD MINES LTD. |
0.13 |
OGR
(5%) |
| 018-847-323 |
BB1110089 |
1036/97 |
ARCHIBALD
MCINTYRE |
LINDA
ETHEL DAVIS, TEACHER |
BARKERVILLE
GOLD MINES LTD. |
0.19 |
OGR
(5%) |
| 018-847-129 |
CA4862227 |
1036/97 |
ARCHIBALD
MCINTYRE |
LINDSAY
KAY READ, FINANCIAL DIRECTOR |
BARKERVILLE
GOLD MINES LTD. |
0.16 |
OGR
(5%) |
| 018-685-056 |
CA6190280 |
1036/97 |
ARCHIBALD
MCINTYRE |
BARKERVILLE
GOLD MINES LTD. |
BARKERVILLE
GOLD MINES LTD. / HER MAJESTY THE QUEEN IN RIGHT OF THE PROVINCE OF BRITISH COLUMBIA |
0.36 |
OGR
(5%) |
| 017-971-403 |
PS7390 |
1036/97 |
ARCHIBALD
MCINTYRE |
ROBERT
LISLE BUXTON, CHARTERED ACCOUNTANT |
BARKERVILLE
GOLD MINES LTD. |
0.37 |
OGR
(5%) |
| |
Osisko Development Corp.
NI 43-101 Technical Report
Feasibility Study for the Cariboo Gold Project |
|
| PID |
Title
# |
CG
# |
Original
grantee |
Fee
simple owner |
UNDERSURFACE
OWNER |
Area
(Acres) |
Royalty |
| 016-234-871 |
CA4986782 |
1036/97 |
ARCHIBALD
MCINTYRE |
JANET
LYNN AITKEN, CUSTOMER SERVICE & JOHN BARRETT AITKEN, PUBLIC WORKS SUPERINTENDENT AS JOINT TENANTS |
BARKERVILLE
GOLD MINES LTD. |
0.14 |
OGR
(5%) |
| 016-234-863 |
CA6887422 |
1036/97 |
ARCHIBALD
MCINTYRE |
SAMANTHA
JOYCE ROGERS CONTRACTOR & GEORGE EDWARD ROGERS, MINER AS JOINT TENANTS |
BARKERVILLE
GOLD MINES LTD. |
0.15 |
OGR
(5%) |
| 016-122-691 |
CA784202 |
1036/97 |
ARCHIBALD
MCINTYRE |
MARK
DAVID DAWSON, PERFORMING ARTS |
BARKERVILLE
GOLD MINES LTD. |
0.15 |
OGR
(5%) |
| 015-810-194 |
PP20693 |
1036/97 |
ARCHIBALD
MCINTYRE |
DISTRICT
OF WELLS |
BARKERVILLE
GOLD MINES LTD. |
0.07 |
OGR
(5%) |
| 015-810-186 |
PP20694 |
1036/97 |
ARCHIBALD
MCINTYRE |
DISTRICT
OF WELLS |
BARKERVILLE
GOLD MINES LTD. |
0.14 |
OGR
(5%) |
| 015-332-438 |
8407M |
1036/97 |
ARCHIBALD
MCINTYRE |
THE
LOWHEE MINING COMPANY LIMITED (NON-PERSONAL LIABILITY) (FORFEITED TO CROWN) |
BARKERVILLE
GOLD MINES LTD. |
205.72 |
OGR
(5%) |
| 014-998-211 |
PJ8473 |
1036/97 |
ARCHIBALD
MCINTYRE |
AMBRUS
LOGGING LTD. |
BARKERVILLE
GOLD MINES LTD. |
34.33 |
OGR
(5%) |
| 013-820-206 |
PC19614 |
1036/97 |
ARCHIBALD
MCINTYRE |
THE
SOUTH WELLS DEVELOPMENT COMPANY LIMITED (FORFEITED TO CROWN) |
BARKERVILLE
GOLD MINES LTD. |
0.19 |
OGR
(5%) |
| 013-820-184 |
PC19613 |
1036/97 |
ARCHIBALD
MCINTYRE |
THE
SOUTH WELLS DEVELOPMENT COMPANY LIMITED (FORFEITED TO CROWN) |
BARKERVILLE
GOLD MINES LTD. |
0.09 |
OGR
(5%) |
| 013-820-036 |
PC19616 |
1036/97 |
ARCHIBALD
MCINTYRE |
THE
SOUTH WELLS DEVELOPMENT COMPANY LIMITED (FORFEITED TO CROWN) |
BARKERVILLE
GOLD MINES LTD. |
1.50 |
OGR
(5%) |
| 013-817-817 |
CA8915858 |
1036/97 |
ARCHIBALD
MCINTYRE |
DANIEL
MICHAEL LORNE SERVICE, MECHANIC |
BARKERVILLE
GOLD MINES LTD. |
0.15 |
OGR
(5%) |
| 013-817-710 |
CA6668811 |
1036/97 |
ARCHIBALD
MCINTYRE |
TERESITA
ESTRADA BOPP, TEACHER |
BARKERVILLE
GOLD MINES LTD. |
0.08 |
OGR
(5%) |
| 013-816-098 |
PG32297 |
1036/97 |
ARCHIBALD
MCINTYRE |
ARTHUR
JAMES OLSON, TRUCK DRIVER |
BARKERVILLE
GOLD MINES LTD. |
0.08 |
OGR
(5%) |
| 013-789-571 |
PC19512 |
1036/97 |
ARCHIBALD
MCINTYRE |
VICTOR
KARL BOPP, DISTRICT PARTS MANAGER & VICTOR KARL BOPP, DISTRICT PARTS MANAGER
TERISITA BOPP, HIS WIFE AS JOINT TENANTS (FORFEITED TO CROWN) |
BARKERVILLE
GOLD MINES LTD. |
0.07 |
OGR
(5%) |
| 013-789-546 |
CA4130472 |
1036/97 |
ARCHIBALD
MCINTYRE |
CATRINA
ISABELL PENROSE, CHAMBERMAID & COLLEEN ISABELL PENROSE, RETIRED & BARRY WILLFORD, RETIRED AS JOINT TENANTS |
BARKERVILLE
GOLD MINES LTD. |
0.15 |
OGR
(5%) |
| |
Osisko Development Corp.
NI 43-101 Technical Report
Feasibility Study for the Cariboo Gold Project |
|
| PID |
Title
# |
CG
# |
Original
grantee |
Fee
simple owner |
UNDERSURFACE
OWNER |
Area
(Acres) |
Royalty |
| 013-789-520 |
CA4130471 |
1036/97 |
ARCHIBALD
MCINTYRE |
CATRINA
ISABELL PENROSE, CHAMBERMAID & COLLEEN ISABELL PENROSE, RETIRED & BARRY WILLFORD, RETIRED AS JOINT TENANTS |
BARKERVILLE
GOLD MINES LTD. |
0.07 |
OGR
(5%) |
| 013-779-281 |
PC19453 |
1036/97 |
ARCHIBALD
MCINTYRE |
MURIAL
QUIRING, HEATHER CORNFIELD & FLORENCE IONE JONES (FORFEITED TO CROWN) |
BARKERVILLE
GOLD MINES LTD. |
0.07 |
OGR
(5%) |
| 013-779-265 |
PC19452 |
1036/97 |
ARCHIBALD
MCINTYRE |
MURIAL
QUIRING, HEATHER CORNFIELD & FLORENCE IONE JONES (FORFEITED TO CROWN) |
BARKERVILLE
GOLD MINES LTD. |
0.07 |
OGR
(5%) |
| 013-779-249 |
PC19451 |
1036/97 |
ARCHIBALD
MCINTYRE |
MURIAL
QUIRING, HEATHER CORNFIELD & FLORENCE IONE JONES (FORFEITED TO CROWN) |
BARKERVILLE
GOLD MINES LTD. |
0.07 |
OGR
(5%) |
| 013-779-133 |
CA1259383 |
1036/97 |
ARCHIBALD
MCINTYRE |
JOSEPH
WILLIAM MARTIN JOHNSON, SOCIAL WORKER AS TO AN UNDIVIDED 1/3 INTEREST & LEAH MARTIN, SOCIAL WORKER AS TO AN UNDIVIDED 1/3
INTEREST & JOSHUA JEREMY TROTTER-WANNER, ENGINEER AS TO AN UNDIVIDED 1/3 INTEREST |
BARKERVILLE
GOLD MINES LTD. |
0.25 |
OGR
(5%) |
| 013-779-117 |
CA1259384 |
1036/97 |
ARCHIBALD
MCINTYRE |
JOSEPH
WILLIAM MARTIN JOHNSON, SOCIAL WORKER AS TO AN UNDIVIDED 1/3 INTEREST & LEAH MARTIN, SOCIAL WORKER AS TO AN UNDIVIDED 1/3
INTEREST & JOSHUA JEREMY TROTTER-WANNER, ENGINEER AS TO AN UNDIVIDED 1/3 INTEREST |
BARKERVILLE
GOLD MINES LTD. |
0.25 |
OGR
(5%) |
| 013-778-374 |
BB419321 |
1036/97 |
ARCHIBALD
MCINTYRE |
HEDY
TAMLAY CONWRIGHT, REGISTERED NURSE |
BARKERVILLE
GOLD MINES LTD. |
0.15 |
OGR
(5%) |
| 013-778-366 |
CA9229300 |
1036/97 |
ARCHIBALD
MCINTYRE |
BARKERVILLE
GOLD MINES LTD. |
BARKERVILLE
GOLD MINES LTD. |
0.15 |
OGR
(5%) |
| 013-778-358 |
CA6779575 |
1036/97 |
ARCHIBALD
MCINTYRE |
KSENYA
ANN DORWART, COMMUNITY OUTREACH MANAGER |
BARKERVILLE
GOLD MINES LTD. |
0.15 |
OGR
(5%) |
| 013-778-340 |
CA3359504 |
1036/97 |
ARCHIBALD
MCINTYRE |
ERIN
LEE DE ZWART, MENTAL HEALTH WORKER & MARY LEAH DE ZWART, RETIRED AS JOINT TENANTS |
BARKERVILLE
GOLD MINES LTD. |
0.14 |
OGR
(5%) |
| 013-714-791 |
FB512633 |
1036/97 |
ARCHIBALD
MCINTYRE |
JACK
O CLUBS GENERAL INC. |
BARKERVILLE
GOLD MINES LTD. |
1.26 |
OGR
(5%) |
| 013-229-133 |
PJ19357 |
1036/97 |
ARCHIBALD
MCINTYRE |
WILLIAM
HUGH ALEXANDER HORNE, ARTIST & CLAIRE MARIA KUJUNDZIC, ARTIST AS JOINT TENANTS |
BARKERVILLE
GOLD MINES LTD. |
0.17 |
OGR
(5%) |
| |
Osisko Development Corp.
NI 43-101 Technical Report
Feasibility Study for the Cariboo Gold Project |
|
| PID |
Title
# |
CG
# |
Original
grantee |
Fee
simple owner |
UNDERSURFACE
OWNER |
Area
(Acres) |
Royalty |
| 013-176-889 |
PC7350 |
1036/97 |
ARCHIBALD
MCINTYRE |
THOMAS
CHARLES HATTON, PLACER MINER & JUDITH JEAN MOORING, FIRST AID ATTENDANT AS JOINT TENANTS |
BARKERVILLE
GOLD MINES LTD. |
0.35 |
OGR
(5%) |
| 013-176-871 |
PC7349 |
1036/97 |
ARCHIBALD
MCINTYRE |
THOMAS
CHARLES HATTON, PLACER MINER & JUDITH JEAN MOORING, FIRST AID ATTENDANT AS JOINT TENANTS |
BARKERVILLE
GOLD MINES LTD. |
0.08 |
OGR
(5%) |
| 013-176-854 |
PC7348 |
1036/97 |
ARCHIBALD
MCINTYRE |
THOMAS
CHARLES HATTON, PLACER MINER & JUDITH JEAN MOORING, FIRST AID ATTENDANT AS JOINT TENANTS |
BARKERVILLE
GOLD MINES LTD. |
0.35 |
OGR
(5%) |
| 012-572-306 |
PH30389 |
1036/97 |
ARCHIBALD
MCINTYRE |
SHARON
PATRICIA STREICEK, HOMEMAKER (FORFEITED TO CROWN) |
BARKERVILLE
GOLD MINES LTD. |
0.33 |
OGR
(5%) |
| 011-970-022 |
CA5969432 |
1036/97 |
ARCHIBALD
MCINTYRE |
EDWARD
ALLAN TIPMAN, ENGINEER & MARIANNE TIPMAN, RETIRED AS JOINT TENANTS |
BARKERVILLE
GOLD MINES LTD. |
0.15 |
OGR
(5%) |
| 011-279-192 |
BB783081 |
1036/97 |
ARCHIBALD
MCINTYRE |
THE
BITRAD INTERNATIONAL GROUP CORPORATION |
BARKERVILLE
GOLD MINES LTD. |
0.10 |
OGR
(5%) |
| 011-095-326 |
PB21723 |
1036/97 |
ARCHIBALD
MCINTYRE |
BRITISH
COLUMBIA TELEPHONE COMPANY |
BARKERVILLE
GOLD MINES LTD. |
0.10 |
OGR
(5%) |
| 011-095-300 |
PB21722 |
1036/97 |
ARCHIBALD
MCINTYRE |
BRITISH
COLUMBIA TELEPHONE COMPANY |
BARKERVILLE
GOLD MINES LTD. |
0.10 |
OGR
(5%) |
| 011-095-261 |
CA2913103 |
1036/97 |
ARCHIBALD
MCINTYRE |
DARYLE
WAYNE NESIMUIK, SECURITY GUARD |
BARKERVILLE
GOLD MINES LTD. |
0.27 |
OGR
(5%) |
| 011-095-245 |
CA2913104 |
1036/97 |
ARCHIBALD
MCINTYRE |
DARYLE
WAYNE NESIMUIK, SECURITY GUARD |
BARKERVILLE
GOLD MINES LTD. |
0.08 |
OGR
(5%) |
| 011-095-237 |
CA2913105 |
1036/97 |
ARCHIBALD
MCINTYRE |
DARYLE
WAYNE NESIMUIK, SECURITY GUARD |
BARKERVILLE
GOLD MINES LTD. |
0.07 |
OGR
(5%) |
| 011-095-211 |
PG34020 |
1036/97 |
ARCHIBALD
MCINTYRE |
RODGER
DAVID BOYCHUK, BUSINESSMAN |
BARKERVILLE
GOLD MINES LTD. |
0.06 |
OGR
(5%) |
| 011-095-199 |
PG34021 |
1036/97 |
ARCHIBALD
MCINTYRE |
RODGER
DAVID BOYCHUK, BUSINESSMAN |
BARKERVILLE
GOLD MINES LTD. |
0.03 |
OGR
(5%) |
| 011-095-181 |
PG34022 |
1036/97 |
ARCHIBALD
MCINTYRE |
RODGER
DAVID BOYCHUK, BUSINESSMAN |
BARKERVILLE
GOLD MINES LTD. |
0.15 |
OGR
(5%) |
| 011-095-148 |
CA1552305 |
1036/97 |
ARCHIBALD
MCINTYRE |
MARK
RIMMINGTON NORMAN, BUSINESSMAN |
BARKERVILLE
GOLD MINES LTD. |
0.09 |
OGR
(5%) |
| 011-095-113 |
CA1552304 |
1036/97 |
ARCHIBALD
MCINTYRE |
MARK
RIMMINGTON NORMAN, BUSINESSMAN |
BARKERVILLE
GOLD MINES LTD. |
0.19 |
OGR
(5%) |
| 011-094-630 |
BV270444 |
1036/97 |
ARCHIBALD
MCINTYRE |
KAREN
JENNIFER JEFFERY, HOMEMAKER |
BARKERVILLE
GOLD MINES LTD. |
0.09 |
OGR
(5%) |
| 011-094-613 |
BV270443 |
1036/97 |
ARCHIBALD
MCINTYRE |
KAREN
JENNIFER JEFFERY, HOMEMAKER |
BARKERVILLE
GOLD MINES LTD. |
0.07 |
OGR
(5%) |
| 011-094-583 |
BV270442 |
1036/97 |
ARCHIBALD
MCINTYRE |
KAREN
JENNIFER JEFFERY, HOMEMAKER |
BARKERVILLE
GOLD MINES LTD. |
0.22 |
OGR
(5%) |
| 011-094-532 |
PP20690 |
1036/97 |
ARCHIBALD
MCINTYRE |
DISTRICT
OF WELLS |
BARKERVILLE
GOLD MINES LTD. |
0.07 |
OGR
(5%) |
| |
Osisko Development Corp.
NI 43-101 Technical Report
Feasibility Study for the Cariboo Gold Project |
|
| PID |
Title
# |
CG
# |
Original
grantee |
Fee
simple owner |
UNDERSURFACE
OWNER |
Area
(Acres) |
Royalty |
| 011-094-516 |
PP20689 |
1036/97 |
ARCHIBALD
MCINTYRE |
DISTRICT
OF WELLS |
BARKERVILLE
GOLD MINES LTD. |
0.14 |
OGR
(5%) |
| 011-047-542 |
CA586990 |
1036/97 |
ARCHIBALD
MCINTYRE |
ROBERT
ANDREW HAMILTON, SELF EMPLOYED |
BARKERVILLE
GOLD MINES LTD. |
0.13 |
OGR
(5%) |
| 011-047-526 |
CA2340860 |
1036/97 |
ARCHIBALD
MCINTYRE |
FAITH
MOOSANG, ARTIST |
BARKERVILLE
GOLD MINES LTD. |
0.17 |
OGR
(5%) |
| 011-047-518 |
CA7014671 |
1036/97 |
ARCHIBALD
MCINTYRE |
SHAYNA
DAWN FERGUSON, JANITOR & AUSTIN REED FREDERICK, EQUIPMENT OPERATOR |
BARKERVILLE
GOLD MINES LTD. |
0.14 |
OGR
(5%) |
| 011-047-500 |
BW109803 |
1036/97 |
ARCHIBALD
MCINTYRE |
DISTRICT
OF WELLS |
BARKERVILLE
GOLD MINES LTD. |
0.32 |
OGR
(5%) |
| 011-047-470 |
PL47763 |
1036/97 |
ARCHIBALD
MCINTYRE |
BARBARA
AUDREY SCHMODE, COOK |
BARKERVILLE
GOLD MINES LTD. |
0.14 |
OGR
(5%) |
| 011-047-461 |
CA2024968 |
1036/97 |
ARCHIBALD
MCINTYRE |
KAREN
JEFFERY, THEATRE PRODUCER AS TO AN UNDIVIDED 99/100 INTEREST & DAVID JEFFERY, RETIRED AS TO AN UNDIVIDED 1/100 INTEREST |
BARKERVILLE
GOLD MINES LTD. |
0.08 |
OGR
(5%) |
| 011-047-453 |
PP20688 |
1036/97 |
ARCHIBALD
MCINTYRE |
DISTRICT
OF WELLS |
BARKERVILLE
GOLD MINES LTD. |
0.07 |
OGR
(5%) |
| 011-047-411 |
PJ47181 |
1036/97 |
ARCHIBALD
MCINTYRE |
THE
CROWN IN RIGHT OF BRITISH COLUMBIA REPRESENTED BY THE MINISTER OF ENVIRONMENT, LANDS AND PARKS |
BARKERVILLE
GOLD MINES LTD. |
0.09 |
OGR
(5%) |
| 011-047-399 |
CA8464066 |
1036/97 |
ARCHIBALD
MCINTYRE |
DONNA
MERLE WILLIAMS, HEAD OF MUSIC |
BARKERVILLE
GOLD MINES LTD. |
0.17 |
OGR
(5%) |
| 011-047-348 |
CA7065170 |
1036/97 |
ARCHIBALD
MCINTYRE |
IAN
JAMES DOUGLAS, DISABLED & ELIZABETH CLAIRE ISAAC, RETIRED AS JOINT TENANTS |
BARKERVILLE
GOLD MINES LTD. |
0.15 |
OGR
(5%) |
| 011-047-330 |
PB25618 |
1036/97 |
ARCHIBALD
MCINTYRE |
ISLAND
MOUNTAIN ARTS SOCIETY |
BARKERVILLE
GOLD MINES LTD. |
0.06 |
OGR
(5%) |
| 011-047-305 |
T11197,
T9510 |
1036/97 |
ARCHIBALD
MCINTYRE |
ROBERT
WALLACE ERIC NORTH, BUSINESSMAN AS TO AN UNDIVIDED 1/2 INTEREST (FORFEITED TO CROWN) & JAMES KENDALL SHIELDS, SHIPPER RECEIVER)
AS TO AN UNDIVIDED 1/2 INTEREST (FORFEITED TO CROWN) |
BARKERVILLE
GOLD MINES LTD. |
0.10 |
OGR
(5%) |
| 011-047-267 |
PN36895 |
1036/97 |
ARCHIBALD
MCINTYRE |
KAREN
JENNIFER PLANDEN, EXECUTIVE ARTISTIC DIRECTOR |
BARKERVILLE
GOLD MINES LTD. |
0.10 |
OGR
(5%) |
| 011-047-259 |
S27810 |
1036/97 |
ARCHIBALD
MCINTYRE |
TREVOR
BRADLEY DAVIES, FALLER |
BARKERVILLE
GOLD MINES LTD. |
0.06 |
OGR
(5%) |
| 011-047-241 |
68931M |
1036/97 |
ARCHIBALD
MCINTYRE |
SHELAGH
CAROL MATHEWS (FORFEITED TO CROWN) |
BARKERVILLE
GOLD MINES LTD. |
0.10 |
OGR
(5%) |
| 011-047-232 |
16118M |
1036/97 |
ARCHIBALD
MCINTYRE |
GEORGE
CHARNQUIST AS TO AN UNDIVIDED 1/2 INTEREST (FORFEITED TO CROWN) |
BARKERVILLE
GOLD MINES LTD. |
0.08 |
OGR
(5%) |
| |
Osisko Development Corp.
NI 43-101 Technical Report
Feasibility Study for the Cariboo Gold Project |
|
| PID |
Title
# |
CG
# |
Original
grantee |
Fee
simple owner |
UNDERSURFACE
OWNER |
Area
(Acres) |
Royalty |
| 011-047-224 |
27825M |
1036/97 |
ARCHIBALD
MCINTYRE |
MAXWELL
ARTHUR ANSLEY (FORFEITED TO CROWN) |
BARKERVILLE
GOLD MINES LTD. |
0.08 |
OGR
(5%) |
| 011-047-208 |
R31537 |
1036/97 |
ARCHIBALD
MCINTYRE |
DARLEEN
MARY MCLENNAN, HOUSEWIFE (FORFEITED TO CROWN) |
BARKERVILLE
GOLD MINES LTD. |
0.07 |
OGR
(5%) |
| 011-047-194 |
17436M |
1036/97 |
ARCHIBALD
MCINTYRE |
EDWARD
PIKE (FORFEITED TO CROWN) |
BARKERVILLE
GOLD MINES LTD. |
0.08 |
OGR
(5%) |
| 011-047-160 |
BB365920 |
1036/97 |
ARCHIBALD
MCINTYRE |
DISTRICT
OF WELLS |
BARKERVILLE
GOLD MINES LTD. |
0.04 |
OGR
(5%) |
| 011-047-151 |
CA10179 |
1036/97 |
ARCHIBALD
MCINTYRE |
WILLIAM
IAN RUMMEL, SELF-EMPLOYED |
BARKERVILLE
GOLD MINES LTD. |
0.07 |
OGR
(5%) |
| 011-047-143 |
BB629960 |
1036/97 |
ARCHIBALD
MCINTYRE |
GARY
WAYNE FIEGEHEN, PHOTOGRAPHER |
BARKERVILLE
GOLD MINES LTD. |
0.05 |
OGR
(5%) |
| 011-047-135 |
CA5807889 |
1036/97 |
ARCHIBALD
MCINTYRE |
PETER
JOHN CORBETT, FISH BIOLOGIST |
BARKERVILLE
GOLD MINES LTD. |
0.04 |
OGR
(5%) |
| 011-047-119 |
PC28252 |
1036/97 |
ARCHIBALD
MCINTYRE |
MICHAEL
DUANE DEWEESE, MINER & MARION DEWEESE, SECRETARY AS JOINT TENANTS |
BARKERVILLE
GOLD MINES LTD. |
0.08 |
OGR
(5%) |
| 011-047-101 |
PG47433 |
1036/97 |
ARCHIBALD
MCINTYRE |
CATHERINE
GARNETT, SPEECH LANGUAGE PATHOLOGIST |
BARKERVILLE
GOLD MINES LTD. |
0.06 |
OGR
(5%) |
| 011-025-514 |
CA425359 |
1036/97 |
ARCHIBALD
MCINTYRE |
ANTHONY
JOSEPH MCDONALD, QUESNEL SR. GOLF CHAMPION & DEANNA JOAN WINDSOR, GIS ANALYST AS JOINT TENANTS |
BARKERVILLE
GOLD MINES LTD. |
0.08 |
OGR
(5%) |
| 011-025-395 |
PM2898A |
1036/97 |
ARCHIBALD
MCINTYRE |
THE
CROWN IN RIGHT OF THE PROVINCE OF BRITISH COLUMBIA |
BARKERVILLE
GOLD MINES LTD. |
0.08 |
OGR
(5%) |
| 011-025-361 |
BB225529 |
1036/97 |
ARCHIBALD
MCINTYRE |
NORMA
ELIZABETH JEE, TEACHER & HELMUTH RUDOLF EWERT, SELF EMPLOYED BUSINESSMAN |
BARKERVILLE
GOLD MINES LTD. |
0.09 |
OGR
(5%) |
| 011-025-255 |
CA670589 |
1036/97 |
ARCHIBALD
MCINTYRE |
LORI
ANN CARIFELLE, PROGRAM DIRECTOR & DWAYNE MICHAEL SALES, LOGGER AS TO AN UNDIVIDED 1/2 INTEREST AS JOINT TENANTS AND KARA
TALULAH CARIFELLE, NURSERY WORKER & DARYL RAYMOND NELSON, MILLWORKER AS TO AN UNDIVIDED 1/2 INTEREST AS JOINT TENANTS |
BARKERVILLE
GOLD MINES LTD. |
0.09 |
OGR
(5%) |
| 011-025-221 |
027726 |
1036/97 |
ARCHIBALD
MCINTYRE |
MARJORIE
NEEDS, BUSINESSWOMAN (FORFEITED TO CROWN) |
BARKERVILLE
GOLD MINES LTD. |
0.08 |
OGR
(5%) |
| 011-025-182 |
CA7139136 |
1036/97 |
ARCHIBALD
MCINTYRE |
BRENDAN
JAMES BAILEY, SELF-EMPLOYED |
BARKERVILLE
GOLD MINES LTD. |
0.08 |
OGR
(5%) |
| 011-024-941 |
R39682 |
1036/97 |
ARCHIBALD
MCINTYRE |
THOMAS
NEIL VANT, CLERGYMAN |
BARKERVILLE
GOLD MINES LTD. |
0.16 |
OGR
(5%) |
| 011-024-925 |
CA7413903 |
1036/97 |
ARCHIBALD
MCINTYRE |
CAROLINE
RUTH ZINZ, ARCHIVIST |
BARKERVILLE
GOLD MINES LTD. |
0.11 |
OGR
(5%) |
| |
Osisko Development Corp.
NI 43-101 Technical Report
Feasibility Study for the Cariboo Gold Project |
|
| PID |
Title
# |
CG
# |
Original
grantee |
Fee
simple owner |
UNDERSURFACE
OWNER |
Area
(Acres) |
Royalty |
| 011-024-895 |
PN39701 |
1036/97 |
ARCHIBALD
MCINTYRE |
THOMAS
NEIL VANT, MANAGER |
BARKERVILLE
GOLD MINES LTD. |
0.08 |
OGR
(5%) |
| 011-024-887 |
CA2758497 |
1036/97 |
ARCHIBALD
MCINTYRE |
STEWART
LLOYD SCOTT MOTTERAM, SILVACULTURIST |
BARKERVILLE
GOLD MINES LTD. |
0.08 |
OGR
(5%) |
| 011-024-879 |
BB1341717 |
1036/97 |
ARCHIBALD
MCINTYRE |
ROBERT
ANDREW HAMILTON, HISTORICAL INTERPRETER |
BARKERVILLE
GOLD MINES LTD. |
0.07 |
OGR
(5%) |
| 011-024-861 |
BB1965670 |
1036/97 |
ARCHIBALD
MCINTYRE |
JOHN
ROBERT RAINEY, MECHANIC & MELANIE ANN RAINEY, SELF EMPLOYED AS JOINT TENANTS |
BARKERVILLE
GOLD MINES LTD. |
0.07 |
OGR
(5%) |
| 011-024-721 |
PG30879 |
1036/97 |
ARCHIBALD
MCINTYRE |
DOROTHEA
LYNETTE FUNK, RADIO ANNOUNCER |
BARKERVILLE
GOLD MINES LTD. |
0.08 |
OGR
(5%) |
| 011-024-712 |
CA562166 |
1036/97 |
ARCHIBALD
MCINTYRE |
RICHARD
NESS EZOWSKI, BUSINESSMAN & NADIA EZOWSKI, BUSINESSWOMAN AS JOINT TENANTS |
BARKERVILLE
GOLD MINES LTD. |
0.08 |
OGR
(5%) |
| 011-024-542 |
N22940 |
1036/97 |
ARCHIBALD
MCINTYRE |
JULES
PAUL GUIGUET, MINING TECHNOLOGIST |
BARKERVILLE
GOLD MINES LTD. |
0.08 |
OGR
(5%) |
| 011-023-180 |
BV280666 |
1036/97 |
ARCHIBALD
MCINTYRE |
DISTRICT
OF WELLS |
BARKERVILLE
GOLD MINES LTD. |
0.09 |
OGR
(5%) |
| 011-023-171 |
BV280665 |
1036/97 |
ARCHIBALD
MCINTYRE |
DISTRICT
OF WELLS |
BARKERVILLE
GOLD MINES LTD. |
0.08 |
OGR
(5%) |
| 011-023-163 |
BV280664 |
1036/97 |
ARCHIBALD
MCINTYRE |
DISTRICT
OF WELLS |
BARKERVILLE
GOLD MINES LTD. |
0.08 |
OGR
(5%) |
| 011-023-155 |
BV280663 |
1036/97 |
ARCHIBALD
MCINTYRE |
DISTRICT
OF WELLS |
BARKERVILLE
GOLD MINES LTD. |
0.06 |
OGR
(5%) |
| 011-022-922 |
PP20691 |
1036/97 |
ARCHIBALD
MCINTYRE |
DISTRICT
OF WELLS |
BARKERVILLE
GOLD MINES LTD. |
0.09 |
OGR
(5%) |
| 010-450-092 |
64053M |
1036/97 |
ARCHIBALD
MCINTYRE |
HENRY
WANNER (FORFEITED TO CROWN) |
BARKERVILLE
GOLD MINES LTD. |
0.08 |
OGR
(5%) |
| 008-406-766 |
CA6435401 |
1036/97 |
ARCHIBALD
MCINTYRE |
CAPRI
MARIA ASPE, HEAVY EQUIPMENT OPERATOR & JEFFERY BERNARD WANNOP, GEOLOGIST AS JOINT TENANTS |
BARKERVILLE
GOLD MINES LTD. |
0.11 |
OGR
(5%) |
| 008-406-723 |
CA6435387 |
1036/97 |
ARCHIBALD
MCINTYRE |
CAPRI
MARIA ASPE, HEAVY EQUIPMENT OPERATOR & JEFFERY BERNARD WANNOP, GEOLOGIST AS JOINT TENANTS |
BARKERVILLE
GOLD MINES LTD. |
0.13 |
OGR
(5%) |
| 007-789-939 |
CA1385835 |
1036/97 |
ARCHIBALD
MCINTYRE |
GREGORY
NORMAN SOUW, CAMP GROUND ATTENDANT |
BARKERVILLE
GOLD MINES LTD. |
0.08 |
OGR
(5%) |
| 007-789-891 |
Y25816 |
1036/97 |
ARCHIBALD
MCINTYRE |
RONALD
MARTIN YOUNG, PHOTOGRAPHER |
BARKERVILLE
GOLD MINES LTD. |
0.08 |
OGR
(5%) |
| 006-911-765 |
PM7978 |
1036/97 |
ARCHIBALD
MCINTYRE |
JULIA
HENRIETTA WHEATLEY, ATTENDANT |
BARKERVILLE
GOLD MINES LTD. |
0.23 |
OGR
(5%) |
| 006-816-118 |
CA9405747 |
1036/97 |
ARCHIBALD
MCINTYRE |
WELLS-BARKERVILLE
COMMUNITY FOREST LTD. |
BARKERVILLE
GOLD MINES LTD. |
1.30 |
OGR
(5%) |
| 006-816-070 |
CA1997684 |
1036/97 |
ARCHIBALD
MCINTYRE |
ISLAND
MOUNTAIN ARTS SOCIETY |
BARKERVILLE
GOLD MINES LTD. |
1.12 |
OGR
(5%) |
| |
Osisko Development Corp.
NI 43-101 Technical Report
Feasibility Study for the Cariboo Gold Project |
|
| PID |
Title
# |
CG
# |
Original
grantee |
Fee
simple owner |
UNDERSURFACE
OWNER |
Area
(Acres) |
Royalty |
| 006-816-045 |
CA5970174 |
1036/97 |
ARCHIBALD
MCINTYRE |
MANDELA
WANI, PRODUCTION WORKER |
BARKERVILLE
GOLD MINES LTD. |
1.07 |
OGR
(5%) |
| 006-816-002 |
N12139 |
1036/97 |
ARCHIBALD
MCINTYRE |
RODGER
BOYCHUK, HANDYMAN |
BARKERVILLE
GOLD MINES LTD. |
1.12 |
OGR
(5%) |
| 006-773-931 |
CA9231853 |
1036/97 |
ARCHIBALD
MCINTYRE |
BARKERVILLE
GOLD MINES LTD. |
BARKERVILLE
GOLD MINES LTD. |
0.27 |
OGR
(5%) |
| 006-455-476 |
PL66224 |
1036/97 |
ARCHIBALD
MCINTYRE |
STEPHEN
JOHN OLIVER, LAWYER & ANN BROOKS OLIVER, BOOKKEEPER AS JOINT TENANTS |
BARKERVILLE
GOLD MINES LTD. |
0.08 |
OGR
(5%) |
| 006-455-468 |
PL66223 |
1036/97 |
ARCHIBALD
MCINTYRE |
STEPHEN
JOHN OLIVER, LAWYER & ANN BROOKS OLIVER, BOOKKEEPER AS JOINT TENANTS |
BARKERVILLE
GOLD MINES LTD. |
0.08 |
OGR
(5%) |
| 006-455-417 |
PL66222 |
1036/97 |
ARCHIBALD
MCINTYRE |
STEPHEN
JOHN OLIVER, LAWYER & ANN BROOKS OLIVER, BOOKKEEPER AS JOINT TENANTS |
BARKERVILLE
GOLD MINES LTD. |
0.30 |
OGR
(5%) |
| 006-455-395 |
PL66221 |
1036/97 |
ARCHIBALD
MCINTYRE |
STEPHEN
JOHN OLIVER, LAWYER & ANN BROOKS OLIVER, BOOKKEEPER AS JOINT TENANTS |
BARKERVILLE
GOLD MINES LTD. |
0.30 |
OGR
(5%) |
| 006-342-418 |
CA2925850 |
1036/97 |
ARCHIBALD
MCINTYRE |
CLIFFORD
CECIL COLLINS, SELF-EMPLOYED & NORMA JEAN COLLINS, SELF-EMPLOYED AS JOINT TENANTS |
BARKERVILLE
GOLD MINES LTD. |
0.15 |
OGR
(5%) |
| 006-261-477 |
CA8221260 |
1036/97 |
ARCHIBALD
MCINTYRE |
JILLIAN
LEAH MERRICK, MUSEUM MANAGER |
BARKERVILLE
GOLD MINES LTD. |
0.23 |
OGR
(5%) |
| 005-856-931 |
PE30745 |
1036/97 |
ARCHIBALD
MCINTYRE |
WELLS
RECREATION SOCIETY, INC. |
BARKERVILLE
GOLD MINES LTD. |
1.00 |
OGR
(5%) |
| 005-761-620 |
CA6891406 |
1036/97 |
ARCHIBALD
MCINTYRE |
MIA
ANGELA CIROTTO, EDUCATION ASSISTANT |
BARKERVILLE
GOLD MINES LTD. |
1.00 |
OGR
(5%) |
| 005-657-512 |
PP20692 |
1036/97 |
ARCHIBALD
MCINTYRE |
DISTRICT
OF WELLS |
BARKERVILLE
GOLD MINES LTD. |
4.01 |
OGR
(5%) |
| 005-042-551 |
PM21600 |
1036/97 |
ARCHIBALD
MCINTYRE |
JOHN
ROBERT BYRNS, BUSINESSMAN & ROBERT GIBB, BUSINESSMAN AS JOINT TENANTS |
BARKERVILLE
GOLD MINES LTD. |
1.00 |
OGR
(5%) |
| 004-885-635 |
CA1552303 |
1036/97 |
ARCHIBALD
MCINTYRE |
MARK
RIMMINGTON NORMAN, BUSINESSMAN |
BARKERVILLE
GOLD MINES LTD. |
0.14 |
OGR
(5%) |
| 004-885-627 |
CA1552302 |
1036/97 |
ARCHIBALD
MCINTYRE |
MARK
RIMMINGTON NORMAN, BUSINESSMAN |
BARKERVILLE
GOLD MINES LTD. |
0.14 |
OGR
(5%) |
| 004-820-860 |
PK38330 |
1036/97 |
ARCHIBALD
MCINTYRE |
ROBERT
BLAINE RUMMEL, SELF EMPLOYED & LINDA MADELINE RUMMEL, TEACHER AS JOINT TENANTS |
BARKERVILLE
GOLD MINES LTD. |
0.08 |
OGR
(5%) |
| 004-820-851 |
PK38329 |
1036/97 |
ARCHIBALD
MCINTYRE |
ROBERT
BLAINE RUMMEL, SELF EMPLOYED & LINDA MADELINE RUMMEL, TEACHER AS JOINT TENANTS |
BARKERVILLE
GOLD MINES LTD. |
0.15 |
OGR
(5%) |
| 004-800-079 |
BB693105 |
1036/97 |
ARCHIBALD
MCINTYRE |
TYLER
BRIAN DOERKSEN, FORESTRY TECHNICIAN |
BARKERVILLE
GOLD MINES LTD. |
0.07 |
OGR
(5%) |
| 004-595-424 |
CA6719840 |
1036/97 |
ARCHIBALD
MCINTYRE |
DANIELLE
LYNN CLOUTIER, GEOTECHNICIAN |
BARKERVILLE
GOLD MINES LTD. |
0.14 |
OGR
(5%) |
| |
Osisko Development Corp.
NI 43-101 Technical Report
Feasibility Study for the Cariboo Gold Project |
|
| PID |
Title
# |
CG
# |
Original
grantee |
Fee
simple owner |
UNDERSURFACE
OWNER |
Area
(Acres) |
Royalty |
| 004-595-416 |
CA6719839 |
1036/97 |
ARCHIBALD
MCINTYRE |
DANIELLE
LYNN CLOUTIER, GEOTECHNICIAN |
BARKERVILLE
GOLD MINES LTD. |
0.06 |
OGR
(5%) |
| 004-300-840 |
CA6335205 |
1036/97 |
ARCHIBALD
MCINTYRE |
ELLEN
IRENE JOAN PARTNOY, HEAVY DUTY MECHANIC |
BARKERVILLE
GOLD MINES LTD. |
0.10 |
OGR
(5%) |
| 004-187-041 |
CA5292798 |
1036/97 |
ARCHIBALD
MCINTYRE |
BRIAN
CAMERON LEWIS, TECHNICIAN & MURRY RUSSEL KRAUSE, EXECUTIVE DIRECTOR AS JOINT TENANTS |
BARKERVILLE
GOLD MINES LTD. |
0.07 |
OGR
(5%) |
| 004-183-878 |
PT14262 |
1036/97 |
ARCHIBALD
MCINTYRE |
TAMMY
MICHELE BROWN, GRAPHIC DESIGNER |
BARKERVILLE
GOLD MINES LTD. |
0.19 |
OGR
(5%) |
| 004-133-188 |
CA9149300 |
1036/97 |
ARCHIBALD
MCINTYRE |
ROCKY
JAMES NENKA, COMMERCE LEAD & TYLER FRANCIS MACDONALD BURNSON, ADMINISTRATOR AS JOINT TENANTS |
BARKERVILLE
GOLD MINES LTD. |
0.07 |
OGR
(5%) |
| 004-133-170 |
CA9149299 |
1036/97 |
ARCHIBALD
MCINTYRE |
ROCKY
JAMES NENKA, COMMERCE LEAD & TYLER FRANCIS MACDONALD BURNSON, ADMINISTRATOR AS JOINT TENANTS |
BARKERVILLE
GOLD MINES LTD. |
0.15 |
OGR
(5%) |
| 003-834-085 |
CA5843285 |
1036/97 |
ARCHIBALD
MCINTYRE |
ANTHONY
TRENT RADELET, LEAD CORE CUTTER & HOLLY ELIZABETH MCRAE, CORE CUTTER AS JOINT TENANTS |
BARKERVILLE
GOLD MINES LTD. |
0.15 |
OGR
(5%) |
| 013-818-635 |
PC19615 |
1036/97,
2517/101 |
ARCHIBALD
MCINTYRE (DL289), MARY AGNES MASON (TRANSFERRED TO LOWHEE MINING CO. LTD. (DL391) |
THE
SOUTH WELLS DEVELOPMENT COMPANY LIMITED (FORFEITED TO CROWN) |
BARKERVILLE
GOLD MINES LTD. |
0.07 |
OGR
(5%) |
| 013-700-863 |
PC17214 |
8772/858 |
BARKERVILLE
MINING COMPANY LIMITED (NON-PERSONAL LIABILITY) |
HER
MAJESTY THE QUEEN IN RIGHT OF THE PROVINCE OF BRITISH COLUMBIA |
BARKERVILLE
GOLD MINES LTD. |
33.76 |
OGR
(5%) |
| 013-700-847 |
PC17213 |
8771/858 |
BARKERVILLE
MINING COMPANY LIMITED (NON-PERSONAL LIABILITY) |
HER
MAJESTY THE QUEEN IN RIGHT OF THE PROVINCE OF BRITISH COLUMBIA |
BARKERVILLE
GOLD MINES LTD. |
19.60 |
OGR
(5%) |
| 013-700-839 |
PC17212 |
8770/858 |
BARKERVILLE
MINING COMPANY LIMITED (NON-PERSONAL LIABILITY) |
HER
MAJESTY THE QUEEN IN RIGHT OF THE PROVINCE OF BRITISH COLUMBIA |
BARKERVILLE
GOLD MINES LTD. |
47.37 |
OGR
(5%) |
| 013-700-812 |
PC17211 |
8769/858 |
BARKERVILLE
MINING COMPANY LIMITED (NON-PERSONAL LIABILITY) |
HER
MAJESTY THE QUEEN IN RIGHT OF THE PROVINCE OF BRITISH COLUMBIA |
BARKERVILLE
GOLD MINES LTD. |
38.10 |
OGR
(5%) |
| 013-700-880 |
PC17216 |
8768/858 |
BARKERVILLE
MINING COMPANY LIMITED (NON-PERSONAL LIABILITY) |
HER
MAJESTY THE QUEEN IN RIGHT OF THE PROVINCE OF BRITISH COLUMBIA |
BARKERVILLE
GOLD MINES LTD. |
27.08 |
OGR
(5%) |
| |
Osisko Development Corp.
NI 43-101 Technical Report
Feasibility Study for the Cariboo Gold Project |
|
| PID |
Title
# |
CG
# |
Original
grantee |
Fee
simple owner |
UNDERSURFACE
OWNER |
Area
(Acres) |
Royalty |
| 013-700-871 |
PC17215 |
8767/858 |
BARKERVILLE
MINING COMPANY LIMITED (NON-PERSONAL LIABILITY) |
HER
MAJESTY THE QUEEN IN RIGHT OF THE PROVINCE OF BRITISH COLUMBIA |
BARKERVILLE
GOLD MINES LTD. |
36.41 |
OGR
(5%) |
| 015-282-163 |
31938M |
8766/858 |
BARKERVILLE
MINING COMPANY LIMITED (NON-PERSONAL LIABILITY) |
HER
MAJESTY THE QUEEN IN RIGHT OF THE PROVINCE OF BRITISH COLUMBIA |
BARKERVILLE
GOLD MINES LTD. |
13.03 |
OGR
(5%) |
| 015-360-211 |
PD703 |
8765/858 |
BARKERVILLE
MINING COMPANY LIMITED (NON-PERSONAL LIABILITY) |
HER
MAJESTY THE QUEEN IN RIGHT OF THE PROVINCE OF BRITISH COLUMBIA |
BARKERVILLE
GOLD MINES LTD. |
33.95 |
OGR
(5%) |
| 015-360-202 |
PD704 |
8764/858 |
BARKERVILLE
MINING COMPANY LIMITED (NON-PERSONAL LIABILITY) |
HER
MAJESTY THE QUEEN IN RIGHT OF THE PROVINCE OF BRITISH COLUMBIA |
BARKERVILLE
GOLD MINES LTD. |
36.07 |
OGR
(5%) |
| 015-360-172 |
PD705 |
8763/858 |
BARKERVILLE
MINING COMPANY LIMITED (NON-PERSONAL LIABILITY) |
HER
MAJESTY THE QUEEN IN RIGHT OF THE PROVINCE OF BRITISH COLUMBIA |
BARKERVILLE
GOLD MINES LTD. |
25.30 |
OGR
(5%) |
| 015-359-891 |
PD706 |
8762/858 |
BARKERVILLE
MINING COMPANY LIMITED (NON-PERSONAL LIABILITY) |
HER
MAJESTY THE QUEEN IN RIGHT OF THE PROVINCE OF BRITISH COLUMBIA |
BARKERVILLE
GOLD MINES LTD. |
42.64 |
OGR
(5%) |
| 015-359-786 |
PD707 |
8761/858 |
BARKERVILLE
MINING COMPANY LIMITED (NON-PERSONAL LIABILITY) |
HER
MAJESTY THE QUEEN IN RIGHT OF THE PROVINCE OF BRITISH COLUMBIA |
BARKERVILLE
GOLD MINES LTD. |
26.53 |
OGR
(5%) |
| 013-699-709 |
PC17217 |
461/675 |
CARIBOO
AMALGAMATED GOLD MINES LIMITED (NON-PERSONAL LIABILITY) |
HER
MAJESTY THE QUEEN IN RIGHT OF THE PROVINCE OF BRITISH COLUMBIA |
BARKERVILLE
GOLD MINES LTD. |
26.04 |
OGR
(5%) |
| 013-700-162 |
PC17222 |
428/675 |
CARIBOO
AMALGAMATED GOLD MINES LIMITED (NON-PERSONAL LIABILITY) |
HER
MAJESTY THE QUEEN IN RIGHT OF THE PROVINCE OF BRITISH COLUMBIA |
BARKERVILLE
GOLD MINES LTD. |
24.80 |
OGR
(5%) |
| 013-699-903 |
PC17221 |
427/675 |
CARIBOO
AMALGAMATED GOLD MINES LIMITED (NON-PERSONAL LIABILITY) |
HER
MAJESTY THE QUEEN IN RIGHT OF THE PROVINCE OF BRITISH COLUMBIA |
BARKERVILLE
GOLD MINES LTD. |
43.42 |
OGR
(5%) |
| 013-699-822 |
PC17220 |
426/675 |
CARIBOO
AMALGAMATED GOLD MINES LIMITED (NON-PERSONAL LIABILITY) |
HER
MAJESTY THE QUEEN IN RIGHT OF THE PROVINCE OF BRITISH COLUMBIA |
BARKERVILLE
GOLD MINES LTD. |
32.23 |
OGR
(5%) |
| 013-699-784 |
PC17219 |
425/675 |
CARIBOO
AMALGAMATED GOLD MINES LIMITED (NON-PERSONAL LIABILITY) |
HER
MAJESTY THE QUEEN IN RIGHT OF THE PROVINCE OF BRITISH COLUMBIA |
BARKERVILLE
GOLD MINES LTD. |
42.15 |
OGR
(5%) |
| |
Osisko Development Corp.
NI 43-101 Technical Report
Feasibility Study for the Cariboo Gold Project |
|
| PID |
Title
# |
CG
# |
Original
grantee |
Fee
simple owner |
UNDERSURFACE
OWNER |
Area
(Acres) |
Royalty |
| 013-699-733 |
PC17218 |
424/675 |
CARIBOO
AMALGAMATED GOLD MINES LIMITED (NON-PERSONAL LIABILITY) |
HER
MAJESTY THE QUEEN IN RIGHT OF THE PROVINCE OF BRITISH COLUMBIA |
BARKERVILLE
GOLD MINES LTD. |
51.64 |
OGR
(5%) |
| 013-699-695 |
PC17204 |
423/675 |
CARIBOO
AMALGAMATED GOLD MINES LIMITED (NON-PERSONAL LIABILITY) |
HER
MAJESTY THE QUEEN IN RIGHT OF THE PROVINCE OF BRITISH COLUMBIA |
BARKERVILLE
GOLD MINES LTD. |
51.65 |
OGR
(5%) |
| 013-699-652 |
PC17203 |
422/675 |
CARIBOO
AMALGAMATED GOLD MINES LIMITED (NON-PERSONAL LIABILITY) |
HER
MAJESTY THE QUEEN IN RIGHT OF THE PROVINCE OF BRITISH COLUMBIA |
BARKERVILLE
GOLD MINES LTD. |
51.65 |
OGR
(5%) |
| 013-699-598 |
PC17202 |
421/675 |
CARIBOO
AMALGAMATED GOLD MINES LIMITED (NON-PERSONAL LIABILITY) |
HER
MAJESTY THE QUEEN IN RIGHT OF THE PROVINCE OF BRITISH COLUMBIA |
BARKERVILLE
GOLD MINES LTD. |
40.89 |
OGR
(5%) |
| 013-699-253 |
PC17191 |
420/675 |
CARIBOO
AMALGAMATED GOLD MINES LIMITED (NON-PERSONAL LIABILITY) |
HER
MAJESTY THE QUEEN IN RIGHT OF THE PROVINCE OF BRITISH COLUMBIA |
BARKERVILLE
GOLD MINES LTD. |
9.50 |
OGR
(5%) |
| 015-360-971 |
PD718 |
1193/682 |
CARIBOO
CONSOLIDATED MINING COMPANY LIMITED (NON-PERSONAL LIABILITY) |
HER
MAJESTY THE QUEEN IN RIGHT OF THE PROVINCE OF BRITISH COLUMBIA |
BARKERVILLE
GOLD MINES LTD. |
39.83 |
OGR
(5%) |
| 015-361-225 |
PD717 |
1192/682 |
CARIBOO
CONSOLIDATED MINING COMPANY LIMITED (NON-PERSONAL LIABILITY) |
HER
MAJESTY THE QUEEN IN RIGHT OF THE PROVINCE OF BRITISH COLUMBIA |
BARKERVILLE
GOLD MINES LTD. |
18.66 |
OGR
(5%) |
| 015-361-233 |
PD716 |
1191/682 |
CARIBOO
CONSOLIDATED MINING COMPANY LIMITED (NON-PERSONAL LIABILITY) |
HER
MAJESTY THE QUEEN IN RIGHT OF THE PROVINCE OF BRITISH COLUMBIA |
BARKERVILLE
GOLD MINES LTD. |
30.10 |
OGR
(5%) |
| 015-361-276 |
PD715 |
1190/682 |
CARIBOO
CONSOLIDATED MINING COMPANY LIMITED (NON-PERSONAL LIABILITY) |
HER
MAJESTY THE QUEEN IN RIGHT OF THE PROVINCE OF BRITISH COLUMBIA |
BARKERVILLE
GOLD MINES LTD. |
45.17 |
OGR
(5%) |
| 015-361-322 |
PD714 |
1189/682 |
CARIBOO
CONSOLIDATED MINING COMPANY LIMITED (NON-PERSONAL LIABILITY) |
HER
MAJESTY THE QUEEN IN RIGHT OF THE PROVINCE OF BRITISH COLUMBIA |
BARKERVILLE
GOLD MINES LTD. |
31.76 |
OGR
(5%) |
| |
Osisko Development Corp.
NI 43-101 Technical Report
Feasibility Study for the Cariboo Gold Project |
|
| PID |
Title
# |
CG
# |
Original
grantee |
Fee
simple owner |
UNDERSURFACE
OWNER |
Area
(Acres) |
Royalty |
| 015-361-373 |
PD713 |
1188/682 |
CARIBOO
CONSOLIDATED MINING COMPANY LIMITED (NON-PERSONAL LIABILITY) |
HER
MAJESTY THE QUEEN IN RIGHT OF THE PROVINCE OF BRITISH COLUMBIA |
BARKERVILLE
GOLD MINES LTD. |
7.02 |
OGR
(5%) |
| 015-361-403 |
PD712 |
1187/682 |
CARIBOO
CONSOLIDATED MINING COMPANY LIMITED (NON-PERSONAL LIABILITY) |
HER
MAJESTY THE QUEEN IN RIGHT OF THE PROVINCE OF BRITISH COLUMBIA |
BARKERVILLE
GOLD MINES LTD. |
37.62 |
OGR
(5%) |
| 015-307-425 |
PC58826 |
3302/504 |
CHARLES
JOHN SEYMOUR BAKER |
HER
MAJESTY THE QUEEN IN RIGHT OF THE PROVINCE OF BRITISH COLUMBIA |
BARKERVILLE
GOLD MINES LTD. |
51.21 |
OGR
(5%), Franco Nevada (3%) |
| 015-307-000 |
PC58825 |
3301/504 |
CHARLES
JOHN SEYMOUR BAKER |
HER
MAJESTY THE QUEEN IN RIGHT OF THE PROVINCE OF BRITISH COLUMBIA |
BARKERVILLE
GOLD MINES LTD. |
51.14 |
OGR
(5%), Franco Nevada (3%) |
| 015-307-751 |
PC58829 |
3300/503 |
CHARLES
JOHN SEYMOUR BAKER |
HER
MAJESTY THE QUEEN IN RIGHT OF THE PROVINCE OF BRITISH COLUMBIA |
BARKERVILLE
GOLD MINES LTD. |
51.30 |
OGR
(5%), Franco Nevada (3%) |
| 015-307-743 |
PC58828 |
3299/503 |
CHARLES
JOHN SEYMOUR BAKER |
HER
MAJESTY THE QUEEN IN RIGHT OF THE PROVINCE OF BRITISH COLUMBIA |
BARKERVILLE
GOLD MINES LTD. |
51.19 |
OGR
(5%), Franco Nevada (3%) |
| 015-307-727 |
PC58827 |
3298/503 |
CHARLES
JOHN SEYMOUR BAKER |
HER
MAJESTY THE QUEEN IN RIGHT OF THE PROVINCE OF BRITISH COLUMBIA |
BARKERVILLE
GOLD MINES LTD. |
48.92 |
OGR
(5%), Franco Nevada (3%) |
| 006-411-215 |
Y6523 |
2188/792 |
DALBY
B. MORKILL |
HER
MAJESTY THE QUEEN IN RIGHT OF THE PROVINCE OF BRITISH COLUMBIA |
BARKERVILLE
GOLD MINES LTD. |
43.54 |
OGR
(5%) |
| 006-411-193 |
Y6522 |
2187/792 |
DALBY
B. MORKILL |
HER
MAJESTY THE QUEEN IN RIGHT OF THE PROVINCE OF BRITISH COLUMBIA |
BARKERVILLE
GOLD MINES LTD. |
44.16 |
OGR
(5%) |
| 006-411-070 |
Y6521 |
2186/792 |
DALBY
B. MORKILL |
HER
MAJESTY THE QUEEN IN RIGHT OF THE PROVINCE OF BRITISH COLUMBIA |
BARKERVILLE
GOLD MINES LTD. |
49.76 |
OGR
(5%) |
| 006-410-987 |
Y6520 |
2185/792 |
DALBY
B. MORKILL |
HER
MAJESTY THE QUEEN IN RIGHT OF THE PROVINCE OF BRITISH COLUMBIA |
BARKERVILLE
GOLD MINES LTD. |
27.63 |
OGR
(5%) |
| 024-954-527 |
FB488576 |
3417/306 |
FRANK
W. KIBBEE |
BARKERVILLE
GOLD MINES LTD. |
BARKERVILLE
GOLD MINES LTD. |
2.56 |
OGR
(5%) |
| |
Osisko Development Corp.
NI 43-101 Technical Report
Feasibility Study for the Cariboo Gold Project |
|
| PID |
Title
# |
CG
# |
Original
grantee |
Fee
simple owner |
UNDERSURFACE
OWNER |
Area
(Acres) |
Royalty |
| 015-939-375 |
PD15662 |
9497/665 |
FREDERICK
JAMES TREGILLUS |
HER
MAJESTY THE QUEEN IN RIGHT OF THE PROVINCE OF BRITISH COLUMBIA C/O MINISTER RESPONSIBLE FOR THE HERITAGE CONSERVATION ACT |
BARKERVILLE
GOLD MINES LTD. |
39.34 |
OGR
(5%) |
| 015-939-324 |
PD15661 |
9497/665 |
FREDERICK
JAMES TREGILLUS |
HER
MAJESTY THE QUEEN IN RIGHT OF THE PROVINCE OF BRITISH COLUMBIA C/O MINISTER RESPONSIBLE FOR THE HERITAGE CONSERVATION ACT |
BARKERVILLE
GOLD MINES LTD. |
39.29 |
OGR
(5%) |
| 015-292-312 |
11510M |
9496/665 |
FREDERICK
JAMES TREGILLUS |
HER
MAJESTY THE QUEEN IN RIGHT OF THE PROVINCE OF BRITISH COLUMBIA |
BARKERVILLE
GOLD MINES LTD. |
35.78 |
OGR
(5%) |
| 015-939-197 |
11509M |
9495/665 |
FREDERICK
JAMES TREGILLUS |
HER
MAJESTY THE QUEEN IN RIGHT OF THE PROVINCE OF BRITISH COLUMBIA |
BARKERVILLE
GOLD MINES LTD. |
49.08 |
OGR
(5%) |
| 015-939-278 |
PD15660 |
9494/665 |
FREDERICK
JAMES TREGILLUS |
HER
MAJESTY THE QUEEN IN RIGHT OF THE PROVINCE OF BRITISH COLUMBIA C/O MINISTER RESPONSIBLE FOR THE HERITAGE CONSERVATION ACT |
BARKERVILLE
GOLD MINES LTD. |
29.90 |
OGR
(5%) |
| 015-939-251 |
PD15660 |
9494/665 |
FREDERICK
JAMES TREGILLUS |
HER
MAJESTY THE QUEEN IN RIGHT OF THE PROVINCE OF BRITISH COLUMBIA C/O MINISTER RESPONSIBLE FOR THE HERITAGE CONSERVATION ACT |
BARKERVILLE
GOLD MINES LTD. |
29.82 |
OGR
(5%) |
| 015-939-201 |
11508M |
9493/665 |
FREDERICK
JAMES TREGILLUS |
HER
MAJESTY THE QUEEN IN RIGHT OF THE PROVINCE OF BRITISH COLUMBIA |
BARKERVILLE
GOLD MINES LTD. |
31.72 |
OGR
(5%) |
| 015-291-481 |
12079M |
389/674 |
FREDERICK
JAMES TREGILLUS |
HER
MAJESTY THE QUEEN IN RIGHT OF THE PROVINCE OF BRITISH COLUMBIA |
BARKERVILLE
GOLD MINES LTD. |
21.68 |
OGR
(5%) |
| 015-291-413 |
12077M |
388/674 |
FREDERICK
JAMES TREGILLUS |
HER
MAJESTY THE QUEEN IN RIGHT OF THE PROVINCE OF BRITISH COLUMBIA |
BARKERVILLE
GOLD MINES LTD. |
33.15 |
OGR
(5%) |
| 015-291-391 |
12076M |
387/674 |
FREDERICK
JAMES TREGILLUS |
HER
MAJESTY THE QUEEN IN RIGHT OF THE PROVINCE OF BRITISH COLUMBIA |
BARKERVILLE
GOLD MINES LTD. |
31.39 |
OGR
(5%) |
| 015-292-509 |
12075M |
386/674 |
FREDERICK
JAMES TREGILLUS |
HER
MAJESTY THE QUEEN IN RIGHT OF THE PROVINCE OF BRITISH COLUMBIA C/O MINISTER RESPONSIBLE FOR THE HERITAGE CONSERVATION ACT |
BARKERVILLE
GOLD MINES LTD. |
47.11 |
OGR
(5%) |
| |
Osisko Development Corp.
NI 43-101 Technical Report
Feasibility Study for the Cariboo Gold Project |
|
| PID |
Title
# |
CG
# |
Original
grantee |
Fee
simple owner |
UNDERSURFACE
OWNER |
Area
(Acres) |
Royalty |
| 015-289-681 |
CA4347921 |
385/674 |
FREDERICK
JAMES TREGILLUS |
BARKERVILLE
GOLD MINES LTD. |
BARKERVILLE
GOLD MINES LTD. |
20.22 |
OGR
(5%) |
| 013-614-941 |
PC17398 |
2882/799 |
FREDERICK
JAMES TREGILLUS |
HER
MAJESTY THE QUEEN IN RIGHT OF THE PROVINCE OF BRITISH COLUMBIA MINISTER RESPONSIBLE FOR THE HERITAGE CONSERVATION ACT |
BARKERVILLE
GOLD MINES LTD. |
26.14 |
OGR
(5%) |
| 013-724-541 |
PC18149 |
216/673 |
FREDERICK
JAMES TREGILLUS |
HER
MAJESTY THE QUEEN IN RIGHT OF THE PROVINCE OF BRITISH COLUMBIA C/O MINISTER RESPONSIBLE FOR THE HERITAGE CONSERVATION ACT |
BARKERVILLE
GOLD MINES LTD. |
47.78 |
OGR
(5%) |
| 013-724-631 |
PC18148 |
215/673 |
FREDERICK
JAMES TREGILLUS |
HER
MAJESTY THE QUEEN IN RIGHT OF THE PROVINCE OF BRITISH COLUMBIA |
BARKERVILLE
GOLD MINES LTD. |
29.08 |
OGR
(5%) |
| 015-292-304 |
11956M |
214/673 |
FREDERICK
JAMES TREGILLUS |
HER
MAJESTY THE QUEEN IN RIGHT OF THE PROVINCE OF BRITISH COLUMBIA C/O MINISTER RESPONSIBLE FOR THE HERITAGE CONSERVATION ACT |
BARKERVILLE
GOLD MINES LTD. |
35.46 |
OGR
(5%) |
| 015-939-243 |
PD15664 |
9498/665 |
FREDERICK
JAMES TREGILLUS AND ALBERT JAMES BLAIR |
HER
MAJESTY THE QUEEN IN RIGHT OF THE PROVINCE OF BRITISH COLUMBIA MINISTER RESPONSIBLE FOR THE HERITAGE CONSERVATION ACT |
BARKERVILLE
GOLD MINES LTD. |
4.61 |
OGR
(5%) |
| 015-939-235 |
PD15663 |
9498/665 |
FREDERICK
JAMES TREGILLUS AND THOMAS ALBERT BLAIR |
HER
MAJESTY THE QUEEN IN RIGHT OF THE PROVINCE OF BRITISH COLUMBIA MINISTER RESPONSIBLE FOR THE HERITAGE CONSERVATION ACT |
BARKERVILLE
GOLD MINES LTD. |
4.69 |
OGR
(5%) |
| 015-291-537 |
12080M |
383/674 |
FREDERICK
JAMES TREGILLUS AND THOMAS ALBERT BLAIR |
HER
MAJESTY THE QUEEN IN RIGHT OF THE PROVINCE OF BRITISH COLUMBIA |
BARKERVILLE
GOLD MINES LTD. |
2.16 |
OGR
(5%) |
| 015-384-586 |
12073M |
382/674 |
FREDERICK
JAMES TREGILLUS AND THOMAS ALBERT BLAIR |
HER
MAJESTY THE QUEEN IN RIGHT OF THE PROVINCE OF BRITISH COLUMBIA MINISTER RESPONSIBLE FOR THE HERITAGE CONSERVATION ACT |
BARKERVILLE
GOLD MINES LTD. |
42.49 |
OGR
(5%) |
| 004-056-710 |
CA6623323 |
1F/34 |
GEORGE
TRUMAN, GEORGE W. ROBINSON, FELIX NEUFELDER, A. COUTTS, JOHN JORDAN, FREDERICK STERITRY AND P. MANETTA |
BARKERVILLE
GOLD MINES LTD. |
BARKERVILLE
GOLD MINES LTD. |
36.20 |
OGR
(5%) |
| |
Osisko Development Corp.
NI 43-101 Technical Report
Feasibility Study for the Cariboo Gold Project |
|
| PID |
Title
# |
CG
# |
Original
grantee |
Fee
simple owner |
UNDERSURFACE
OWNER |
Area
(Acres) |
Royalty |
| 004-086-872 |
PT5233,
PC16246 |
20F/34 |
HILAIRE
MOLLEUR, ANGELO PENDOLA, OLIVIER D'ARPENTIGNY AND ALEXANFDER GARANT |
BARKERVILLE
GOLD MINES LTD. |
BARKERVILLE
GOLD MINES LTD. |
35.91 |
OGR
(5%) |
| 013-724-533 |
PC18150 |
8910/760 |
ISLAND
MOUNTAIN MINES COMPANY LIMITED (NON-PERSONAL LIABILITY) |
HER
MAJESTY THE QUEEN IN RIGHT OF THE PROVINCE OF BRITISH COLUMBIA |
BARKERVILLE
GOLD MINES LTD. |
23.80 |
OGR
(5%), Franco Nevada (3%) |
| 015-292-096 |
19027M |
8396/754 |
ISLAND
MOUNTAIN MINES COMPANY LIMITED (NON-PERSONAL LIABILITY) |
HER
MAJESTY THE QUEEN IN RIGHT OF THE PROVINCE OF BRITISH COLUMBIA |
BARKERVILLE
GOLD MINES LTD. |
6.35 |
OGR
(5%), Franco Nevada (3%) |
| 013-699-326 |
PC17193 |
8323/654 |
ISLAND
MOUNTAIN MINES COMPANY LIMITED (NON-PERSONAL LIABILITY) |
HER
MAJESTY THE QUEEN IN RIGHT OF THE PROVINCE OF BRITISH COLUMBIA |
BARKERVILLE
GOLD MINES LTD. |
14.16 |
OGR
(5%) |
| 015-292-045 |
12368M |
790/678 |
ISLAND
MOUNTAIN MINES COMPANY LIMITED (NON-PERSONAL LIABILITY) |
HER
MAJESTY THE QUEEN IN RIGHT OF THE PROVINCE OF BRITISH COLUMBIA |
BARKERVILLE
GOLD MINES LTD. |
49.17 |
OGR
(5%), Franco Nevada (3%) |
| 015-292-347 |
9756M |
6437/635 |
ISLAND
MOUNTAIN MINES COMPANY LIMITED (NON-PERSONAL LIABILITY) |
HER
MAJESTY THE QUEEN IN RIGHT OF THE PROVINCE OF BRITISH COLUMBIA |
BARKERVILLE
GOLD MINES LTD. |
19.16 |
OGR
(5%), Franco Nevada (3%) |
| 015-292-274 |
9758M |
6436/635 |
ISLAND
MOUNTAIN MINES COMPANY LIMITED (NON-PERSONAL LIABILITY) |
HER
MAJESTY THE QUEEN IN RIGHT OF THE PROVINCE OF BRITISH COLUMBIA |
BARKERVILLE
GOLD MINES LTD. |
43.33 |
OGR
(5%), Franco Nevada (3%) |
| 015-292-363 |
9757M |
6435/635 |
ISLAND
MOUNTAIN MINES COMPANY LIMITED (NON-PERSONAL LIABILITY) |
HER
MAJESTY THE QUEEN IN RIGHT OF THE PROVINCE OF BRITISH COLUMBIA |
BARKERVILLE
GOLD MINES LTD. |
31.78 |
OGR
(5%), Franco Nevada (3%) |
| 015-342-824 |
PD349 |
6434/635 |
ISLAND
MOUNTAIN MINES COMPANY LIMITED (NON-PERSONAL LIABILITY) |
HER
MAJESTY THE QUEEN IN RIGHT OF THE PROVINCE OF BRITISH COLUMBIA |
BARKERVILLE
GOLD MINES LTD. |
49.36 |
OGR
(5%), Franco Nevada (3%) |
| 015-342-778 |
PD348 |
6433/635 |
ISLAND
MOUNTAIN MINES COMPANY LIMITED (NON-PERSONAL LIABILITY) |
HER
MAJESTY THE QUEEN IN RIGHT OF THE PROVINCE OF BRITISH COLUMBIA |
BARKERVILLE
GOLD MINES LTD. |
44.60 |
OGR
(5%), Franco Nevada (3%) |
| |
Osisko Development Corp.
NI 43-101 Technical Report
Feasibility Study for the Cariboo Gold Project |
|
| PID |
Title
# |
CG
# |
Original
grantee |
Fee
simple owner |
UNDERSURFACE
OWNER |
Area
(Acres) |
Royalty |
| 013-708-066 |
PC17251 |
5989/630 |
ISLAND
MOUNTAIN MINES COMPANY LIMITED (NON-PERSONAL LIABILITY) |
HER
MAJESTY THE QUEEN IN RIGHT OF THE PROVINCE OF BRITISH COLUMBIA |
BARKERVILLE
GOLD MINES LTD. |
15.49 |
OGR
(5%) |
| 013-708-058 |
PC17250 |
5988/630 |
ISLAND
MOUNTAIN MINES COMPANY LIMITED (NON-PERSONAL LIABILITY) |
HER
MAJESTY THE QUEEN IN RIGHT OF THE PROVINCE OF BRITISH COLUMBIA |
BARKERVILLE
GOLD MINES LTD. |
19.32 |
OGR
(5%) |
| 013-708-023 |
PC17249 |
5988/630 |
ISLAND
MOUNTAIN MINES COMPANY LIMITED (NON-PERSONAL LIABILITY) |
HER
MAJESTY THE QUEEN IN RIGHT OF THE PROVINCE OF BRITISH COLUMBIA |
BARKERVILLE
GOLD MINES LTD. |
19.32 |
OGR
(5%) |
| 013-707-965 |
PC17248 |
5987/630 |
ISLAND
MOUNTAIN MINES COMPANY LIMITED (NON-PERSONAL LIABILITY) |
HER
MAJESTY THE QUEEN IN RIGHT OF THE PROVINCE OF BRITISH COLUMBIA |
BARKERVILLE
GOLD MINES LTD. |
4.63 |
OGR
(5%) |
| 013-708-210 |
PC17246 |
5986/630 |
ISLAND
MOUNTAIN MINES COMPANY LIMITED (NON-PERSONAL LIABILITY) |
HER
MAJESTY THE QUEEN IN RIGHT OF THE PROVINCE OF BRITISH COLUMBIA |
BARKERVILLE
GOLD MINES LTD. |
29.56 |
OGR
(5%) |
| 013-708-198 |
PC17244 |
5985/630 |
ISLAND
MOUNTAIN MINES COMPANY LIMITED (NON-PERSONAL LIABILITY) |
HER
MAJESTY THE QUEEN IN RIGHT OF THE PROVINCE OF BRITISH COLUMBIA |
BARKERVILLE
GOLD MINES LTD. |
2.79 |
OGR
(5%) |
| 013-708-180 |
PC17243 |
5984/630 |
ISLAND
MOUNTAIN MINES COMPANY LIMITED (NON-PERSONAL LIABILITY) |
HER
MAJESTY THE QUEEN IN RIGHT OF THE PROVINCE OF BRITISH COLUMBIA |
BARKERVILLE
GOLD MINES LTD. |
46.32 |
OGR
(5%) |
| 013-708-171 |
PC17242 |
5984/630 |
ISLAND
MOUNTAIN MINES COMPANY LIMITED (NON-PERSONAL LIABILITY) |
HER
MAJESTY THE QUEEN IN RIGHT OF THE PROVINCE OF BRITISH COLUMBIA |
BARKERVILLE
GOLD MINES LTD. |
46.31 |
OGR
(5%) |
| 013-708-163 |
PC17241 |
5983/630 |
ISLAND
MOUNTAIN MINES COMPANY LIMITED (NON-PERSONAL LIABILITY) |
HER
MAJESTY THE QUEEN IN RIGHT OF THE PROVINCE OF BRITISH COLUMBIA |
BARKERVILLE
GOLD MINES LTD. |
44.80 |
OGR
(5%) |
| 013-708-155 |
PC17240 |
5983/630 |
ISLAND
MOUNTAIN MINES COMPANY LIMITED (NON-PERSONAL LIABILITY) |
HER
MAJESTY THE QUEEN IN RIGHT OF THE PROVINCE OF BRITISH COLUMBIA |
BARKERVILLE
GOLD MINES LTD. |
44.80 |
OGR
(5%) |
| |
Osisko Development Corp.
NI 43-101 Technical Report
Feasibility Study for the Cariboo Gold Project |
|
| PID |
Title
# |
CG
# |
Original
grantee |
Fee
simple owner |
UNDERSURFACE
OWNER |
Area
(Acres) |
Royalty |
| 013-708-139 |
PC17239 |
5982/630 |
ISLAND
MOUNTAIN MINES COMPANY LIMITED (NON-PERSONAL LIABILITY) |
HER
MAJESTY THE QUEEN IN RIGHT OF THE PROVINCE OF BRITISH COLUMBIA |
BARKERVILLE
GOLD MINES LTD. |
32.52 |
OGR
(5%) |
| 017-164-923 |
PC17236 |
5981/630 |
ISLAND
MOUNTAIN MINES COMPANY LIMITED (NON-PERSONAL LIABILITY) |
HER
MAJESTY THE QUEEN IN RIGHT OF THE PROVINCE OF BRITISH COLUMBIA |
BARKERVILLE
GOLD MINES LTD. |
51.68 |
OGR
(5%) |
| 013-708-121 |
PC17235 |
5980/630 |
ISLAND
MOUNTAIN MINES COMPANY LIMITED (NON-PERSONAL LIABILITY) |
HER
MAJESTY THE QUEEN IN RIGHT OF THE PROVINCE OF BRITISH COLUMBIA |
BARKERVILLE
GOLD MINES LTD. |
34.76 |
OGR
(5%) |
| 013-708-112 |
PC17234 |
5979/630 |
ISLAND
MOUNTAIN MINES COMPANY LIMITED (NON-PERSONAL LIABILITY) |
HER
MAJESTY THE QUEEN IN RIGHT OF THE PROVINCE OF BRITISH COLUMBIA |
BARKERVILLE
GOLD MINES LTD. |
45.11 |
OGR
(5%) |
| 013-708-104 |
PC17233 |
5978/630 |
ISLAND
MOUNTAIN MINES COMPANY LIMITED (NON-PERSONAL LIABILITY) |
HER
MAJESTY THE QUEEN IN RIGHT OF THE PROVINCE OF BRITISH COLUMBIA |
BARKERVILLE
GOLD MINES LTD. |
37.95 |
OGR
(5%) |
| 013-708-091 |
PC17232 |
5977/630 |
ISLAND
MOUNTAIN MINES COMPANY LIMITED (NON-PERSONAL LIABILITY) |
HER
MAJESTY THE QUEEN IN RIGHT OF THE PROVINCE OF BRITISH COLUMBIA |
BARKERVILLE
GOLD MINES LTD. |
49.75 |
OGR
(5%) |
| 013-700-791 |
PC17210 |
5976/630 |
ISLAND
MOUNTAIN MINES COMPANY LIMITED (NON-PERSONAL LIABILITY) |
HER
MAJESTY THE QUEEN IN RIGHT OF THE PROVINCE OF BRITISH COLUMBIA |
BARKERVILLE
GOLD MINES LTD. |
46.64 |
OGR
(5%) |
| 013-700-758 |
PC17209 |
5975/630 |
ISLAND
MOUNTAIN MINES COMPANY LIMITED (NON-PERSONAL LIABILITY) |
HER
MAJESTY THE QUEEN IN RIGHT OF THE PROVINCE OF BRITISH COLUMBIA |
BARKERVILLE
GOLD MINES LTD. |
45.38 |
OGR
(5%) |
| 013-700-740 |
PC17208 |
5974/630 |
ISLAND
MOUNTAIN MINES COMPANY LIMITED (NON-PERSONAL LIABILITY) |
HER
MAJESTY THE QUEEN IN RIGHT OF THE PROVINCE OF BRITISH COLUMBIA |
BARKERVILLE
GOLD MINES LTD. |
25.22 |
OGR
(5%) |
| 013-700-731 |
PC17207 |
5973/630 |
ISLAND
MOUNTAIN MINES COMPANY LIMITED (NON-PERSONAL LIABILITY) |
HER
MAJESTY THE QUEEN IN RIGHT OF THE PROVINCE OF BRITISH COLUMBIA |
BARKERVILLE
GOLD MINES LTD. |
24.33 |
OGR
(5%) |
| |
Osisko Development Corp.
NI 43-101 Technical Report
Feasibility Study for the Cariboo Gold Project |
|
| PID |
Title
# |
CG
# |
Original
grantee |
Fee
simple owner |
UNDERSURFACE
OWNER |
Area
(Acres) |
Royalty |
| 013-700-715 |
PC17206 |
5972/630 |
ISLAND
MOUNTAIN MINES COMPANY LIMITED (NON-PERSONAL LIABILITY) |
HER
MAJESTY THE QUEEN IN RIGHT OF THE PROVINCE OF BRITISH COLUMBIA |
BARKERVILLE
GOLD MINES LTD. |
34.63 |
OGR
(5%) |
| 013-707-906 |
PC17231 |
5323/624 |
ISLAND
MOUNTAIN MINES COMPANY LIMITED (NON-PERSONAL LIABILITY) |
HER
MAJESTY THE QUEEN IN RIGHT OF THE PROVINCE OF BRITISH COLUMBIA |
BARKERVILLE
GOLD MINES LTD. |
0.71 |
OGR
(5%) |
| 013-707-850 |
PC17230 |
5322/624 |
ISLAND
MOUNTAIN MINES COMPANY LIMITED (NON-PERSONAL LIABILITY) |
HER
MAJESTY THE QUEEN IN RIGHT OF THE PROVINCE OF BRITISH COLUMBIA |
BARKERVILLE
GOLD MINES LTD. |
0.49 |
OGR
(5%) |
| 013-708-236 |
PC17238 |
5321/624 |
ISLAND
MOUNTAIN MINES COMPANY LIMITED (NON-PERSONAL LIABILITY) |
HER
MAJESTY THE QUEEN IN RIGHT OF THE PROVINCE OF BRITISH COLUMBIA |
BARKERVILLE
GOLD MINES LTD. |
38.40 |
OGR
(5%) |
| 013-708-228 |
PC17237 |
5320/624 |
ISLAND
MOUNTAIN MINES COMPANY LIMITED (NON-PERSONAL LIABILITY) |
HER
MAJESTY THE QUEEN IN RIGHT OF THE PROVINCE OF BRITISH COLUMBIA |
BARKERVILLE
GOLD MINES LTD. |
38.40 |
OGR
(5%) |
| 013-707-914 |
PC17247 |
5320/624 |
ISLAND
MOUNTAIN MINES COMPANY LIMITED (NON-PERSONAL LIABILITY) |
HER
MAJESTY THE QUEEN IN RIGHT OF THE PROVINCE OF BRITISH COLUMBIA |
BARKERVILLE
GOLD MINES LTD. |
35.21 |
OGR
(5%) |
| 013-707-892 |
PC17229 |
5319/624 |
ISLAND
MOUNTAIN MINES COMPANY LIMITED (NON-PERSONAL LIABILITY) |
HER
MAJESTY THE QUEEN IN RIGHT OF THE PROVINCE OF BRITISH COLUMBIA |
BARKERVILLE
GOLD MINES LTD. |
4.17 |
OGR
(5%) |
| 013-707-922 |
PC17228 |
5318/624 |
ISLAND
MOUNTAIN MINES COMPANY LIMITED (NON-PERSONAL LIABILITY) |
HER
MAJESTY THE QUEEN IN RIGHT OF THE PROVINCE OF BRITISH COLUMBIA |
BARKERVILLE
GOLD MINES LTD. |
26.61 |
OGR
(5%) |
| 013-707-884 |
PC17227 |
5317/624 |
ISLAND
MOUNTAIN MINES COMPANY LIMITED (NON-PERSONAL LIABILITY) |
HER
MAJESTY THE QUEEN IN RIGHT OF THE PROVINCE OF BRITISH COLUMBIA |
BARKERVILLE
GOLD MINES LTD. |
38.13 |
OGR
(5%) |
| 013-707-876 |
PC17226 |
5316/624 |
ISLAND
MOUNTAIN MINES COMPANY LIMITED (NON-PERSONAL LIABILITY) |
HER
MAJESTY THE QUEEN IN RIGHT OF THE PROVINCE OF BRITISH COLUMBIA |
BARKERVILLE
GOLD MINES LTD. |
51.11 |
OGR
(5%) |
| |
Osisko Development Corp.
NI 43-101 Technical Report
Feasibility Study for the Cariboo Gold Project |
|
| PID |
Title
# |
CG
# |
Original
grantee |
Fee
simple owner |
UNDERSURFACE
OWNER |
Area
(Acres) |
Royalty |
| 013-708-074 |
PC17225 |
5315/624 |
ISLAND
MOUNTAIN MINES COMPANY LIMITED (NON-PERSONAL LIABILITY) |
HER
MAJESTY THE QUEEN IN RIGHT OF THE PROVINCE OF BRITISH COLUMBIA |
BARKERVILLE
GOLD MINES LTD. |
48.22 |
OGR
(5%) |
| 013-707-868 |
PC17224 |
5314/624 |
ISLAND
MOUNTAIN MINES COMPANY LIMITED (NON-PERSONAL LIABILITY) |
HER
MAJESTY THE QUEEN IN RIGHT OF THE PROVINCE OF BRITISH COLUMBIA |
BARKERVILLE
GOLD MINES LTD. |
51.09 |
OGR
(5%) |
| 008-218-803 |
CA3393918 |
5313/624
(U), 5763/628 (S) |
ISLAND
MOUNTAIN MINES COMPANY LIMITED (NON-PERSONAL LIABILITY) |
BARKERVILLE
GOLD MINES LTD. |
BARKERVILLE
GOLD MINES LTD. |
30.05 |
OGR
(5%) |
| 005-537-541 |
CA9850196 |
5313/624
(U), 5763/628 (S) |
ISLAND
MOUNTAIN MINES COMPANY LIMITED (NON-PERSONAL LIABILITY) |
BARKERVILLE
GOLD MINES LTD. |
BARKERVILLE
GOLD MINES LTD. |
1.00 |
OGR
(5%) |
| 013-700-367 |
PC17223 |
5312/624 |
ISLAND
MOUNTAIN MINES COMPANY LIMITED (NON-PERSONAL LIABILITY) |
HER
MAJESTY THE QUEEN IN RIGHT OF THE PROVINCE OF BRITISH COLUMBIA |
BARKERVILLE
GOLD MINES LTD. |
51.65 |
OGR
(5%) |
| 016-016-114 |
15203M |
4609/717 |
ISLAND
MOUNTAIN MINES COMPANY LIMITED (NON-PERSONAL LIABILITY) |
HER
MAJESTY THE QUEEN IN RIGHT OF THE PROVINCE OF BRITISH COLUMBIA |
BARKERVILLE
GOLD MINES LTD. |
13.37 |
OGR
(5%), Franco Nevada (3%) |
| 016-563-051 |
13460M |
2686/697 |
ISLAND
MOUNTAIN MINES COMPANY LIMITED (NON-PERSONAL LIABILITY) |
HER
MAJESTY THE QUEEN IN RIGHT OF THE PROVINCE OF BRITISH COLUMBIA C/O MINISTER RESPONSIBLE FOR THE HERITAGE CONSERVATION ACT |
BARKERVILLE
GOLD MINES LTD. |
18.50 |
OGR
(5%), Franco Nevada (3%) |
| 016-562-895 |
13459M |
2685/697 |
ISLAND
MOUNTAIN MINES COMPANY LIMITED (NON-PERSONAL LIABILITY) |
HER
MAJESTY THE QUEEN IN RIGHT OF THE PROVINCE OF BRITISH COLUMBIA |
BARKERVILLE
GOLD MINES LTD. |
4.83 |
OGR
(5%), Franco Nevada (3%) |
| 015-291-839 |
13458M |
2684/697 |
ISLAND
MOUNTAIN MINES COMPANY LIMITED (NON-PERSONAL LIABILITY) |
HER
MAJESTY THE QUEEN IN RIGHT OF THE PROVINCE OF BRITISH COLUMBIA |
BARKERVILLE
GOLD MINES LTD. |
29.87 |
OGR
(5%), Franco Nevada (3%) |
| 015-343-634 |
PD456 |
2683/697 |
ISLAND
MOUNTAIN MINES COMPANY LIMITED (NON-PERSONAL LIABILITY) |
HER
MAJESTY THE QUEEN IN RIGHT OF THE PROVINCE OF BRITISH COLUMBIA MINISTER RESPONSIBLE FOR THE HERITAGE CONSERVATION ACT |
BARKERVILLE
GOLD MINES LTD. |
50.80 |
OGR
(5%), Franco Nevada (3%) |
| |
Osisko Development Corp.
NI 43-101 Technical Report
Feasibility Study for the Cariboo Gold Project |
|
| PID |
Title
# |
CG
# |
Original
grantee |
Fee
simple owner |
UNDERSURFACE
OWNER |
Area
(Acres) |
Royalty |
| 010-422-862 |
PB12572 |
2683/697 |
ISLAND
MOUNTAIN MINES COMPANY LIMITED (NON-PERSONAL LIABILITY) |
HER
MAJESTY THE QUEEN IN RIGHT OF THE PROVINCE OF BRITISH COLUMBIA MINISTER RESPONSIBLE FOR THE HERITAGE CONSERVATION ACT |
BARKERVILLE
GOLD MINES LTD. |
50.80 |
OGR
(5%), Franco Nevada (3%) |
| 015-291-812 |
13456M |
2682/697 |
ISLAND
MOUNTAIN MINES COMPANY LIMITED (NON-PERSONAL LIABILITY) |
HER
MAJESTY THE QUEEN IN RIGHT OF THE PROVINCE OF BRITISH COLUMBIA |
BARKERVILLE
GOLD MINES LTD. |
51.62 |
OGR
(5%), Franco Nevada (3%) |
| 015-291-804 |
13455M |
2681/697 |
ISLAND
MOUNTAIN MINES COMPANY LIMITED (NON-PERSONAL LIABILITY) |
HER
MAJESTY THE QUEEN IN RIGHT OF THE PROVINCE OF BRITISH COLUMBIA |
BARKERVILLE
GOLD MINES LTD. |
20.29 |
OGR
(5%), Franco Nevada (3%) |
| 015-291-791 |
13454M |
2680/697 |
ISLAND
MOUNTAIN MINES COMPANY LIMITED (NON-PERSONAL LIABILITY) |
HER
MAJESTY THE QUEEN IN RIGHT OF THE PROVINCE OF BRITISH COLUMBIA |
BARKERVILLE
GOLD MINES LTD. |
20.31 |
OGR
(5%), Franco Nevada (3%) |
| 015-291-766 |
13453M |
2679/697 |
ISLAND
MOUNTAIN MINES COMPANY LIMITED (NON-PERSONAL LIABILITY) |
HER
MAJESTY THE QUEEN IN RIGHT OF THE PROVINCE OF BRITISH COLUMBIA |
BARKERVILLE
GOLD MINES LTD. |
51.65 |
OGR
(5%), Franco Nevada (3%) |
| 015-291-723 |
13452M |
2678/697 |
ISLAND
MOUNTAIN MINES COMPANY LIMITED (NON-PERSONAL LIABILITY) |
HER
MAJESTY THE QUEEN IN RIGHT OF THE PROVINCE OF BRITISH COLUMBIA |
BARKERVILLE
GOLD MINES LTD. |
46.66 |
OGR
(5%), Franco Nevada (3%) |
| 015-291-685 |
13451M |
2677/697 |
ISLAND
MOUNTAIN MINES COMPANY LIMITED (NON-PERSONAL LIABILITY) |
HER
MAJESTY THE QUEEN IN RIGHT OF THE PROVINCE OF BRITISH COLUMBIA |
BARKERVILLE
GOLD MINES LTD. |
48.47 |
OGR
(5%), Franco Nevada (3%) |
| 013-708-201 |
PC17245 |
5986/630 |
ISLAND
MOUNTAIN MINES COMPANY LIMITED (NON-PERSONAL LIABILITY) |
HER
MAJESTY THE QUEEN IN RIGHT OF THE PROVINCE OF BRITISH COLUMBIA |
BARKERVILLE
GOLD MINES LTD. |
29.56 |
OGR
(5%) |
| 015-300-226 |
CA9850174 |
2099/1091 |
JAMES
THOMAS WATT |
BARKERVILLE
GOLD MINES LTD. |
NONE |
1.60 |
|
| 004-078-632 |
CA9850189 |
5F/34 |
JOHN
BOWRON, DANIEL CAREY, ANDREW FLETCHER, WESLEY HALL, WILLIAM JEFFARES, JOHN MCALISTER, DONALD MCEWEN, ARCHIBALD MCNAUGHTON, JOHN MUNROE, ALEXANDER
MUNROE AND FELIX NEUFELDER |
BARKERVILLE
GOLD MINES LTD. |
BARKERVILLE
GOLD MINES LTD. |
47.30 |
OGR
(5%) |
| |
Osisko Development Corp.
NI 43-101 Technical Report
Feasibility Study for the Cariboo Gold Project |
|
| PID |
Title
# |
CG
# |
Original
grantee |
Fee
simple owner |
UNDERSURFACE
OWNER |
Area
(Acres) |
Royalty |
| 004-086-902 |
PT5234,
PC16247 |
30F/34 |
JOHN
LAUYON, MICHAEL DRISCOLL AND WILLIAM P. WILLIAMS |
BARKERVILLE
GOLD MINES LTD. |
BARKERVILLE
GOLD MINES LTD. |
5.32 |
OGR
(5%) |
| 015-038-688 |
W21719 |
3268/154 |
JOHN
PINKERTON |
HER
MAJESTY THE QUEEN IN RIGHT OF THE PROVINCE OF BRITISH COLUMBIA |
BARKERVILLE
GOLD MINES LTD. |
36.92 |
OGR
(5%) |
| 015-286-649 |
S28511 |
3925/510 |
LAURENT
MULLER |
HER
MAJESTY THE QUEEN IN RIGHT OF THE PROVINCE OF BRITISH COLUMBIA |
BARKERVILLE
GOLD MINES LTD. |
51.07 |
OGR
(5%) |
| 005-910-595 |
Y1636 |
3922/510 |
LAURENT
MULLER |
HER
MAJESTY THE QUEEN IN RIGHT OF THE PROVINCE OF BRITISH COLUMBIA C/O MINISTRY OF LANDS PARKS AND HOUSING |
BARKERVILLE
GOLD MINES LTD. |
0.14 |
OGR
(5%) |
| 005-910-552 |
Y1635 |
3922/510 |
LAURENT
MULLER |
HER
MAJESTY THE QUEEN IN RIGHT OF THE PROVINCE OF BRITISH COLUMBIA C/O MINISTRY OF LANDS PARKS AND HOUSING |
BARKERVILLE
GOLD MINES LTD. |
0.14 |
OGR
(5%) |
| 005-910-412 |
Y1634 |
3922/510 |
LAURENT
MULLER |
HER
MAJESTY THE QUEEN IN RIGHT OF THE PROVINCE OF BRITISH COLUMBIA C/O MINISTRY OF LANDS PARKS AND HOUSING |
BARKERVILLE
GOLD MINES LTD. |
0.14 |
OGR
(5%) |
| 005-910-391 |
Y1633 |
3922/510 |
LAURENT
MULLER |
HER
MAJESTY THE QUEEN IN RIGHT OF THE PROVINCE OF BRITISH COLUMBIA C/O MINISTRY OF LANDS PARKS AND HOUSING |
BARKERVILLE
GOLD MINES LTD. |
0.14 |
OGR
(5%) |
| 005-910-293 |
Y1632 |
3922/510 |
LAURENT
MULLER |
HER
MAJESTY THE QUEEN IN RIGHT OF THE PROVINCE OF BRITISH COLUMBIA C/O MINISTRY OF LANDS PARKS AND HOUSING |
BARKERVILLE
GOLD MINES LTD. |
0.14 |
OGR
(5%) |
| 005-910-277 |
Y1631 |
3922/510 |
LAURENT
MULLER |
HER
MAJESTY THE QUEEN IN RIGHT OF THE PROVINCE OF BRITISH COLUMBIA C/O MINISTRY OF LANDS PARKS AND HOUSING |
BARKERVILLE
GOLD MINES LTD. |
0.01 |
OGR
(5%) |
| 005-910-188 |
Y1630 |
3922/510 |
LAURENT
MULLER |
HER
MAJESTY THE QUEEN IN RIGHT OF THE PROVINCE OF BRITISH COLUMBIA C/O MINISTRY OF LANDS PARKS AND HOUSING |
BARKERVILLE
GOLD MINES LTD. |
0.14 |
OGR
(5%) |
| 005-910-161 |
Y1629 |
3922/510 |
LAURENT
MULLER |
HER
MAJESTY THE QUEEN IN RIGHT OF THE PROVINCE OF BRITISH COLUMBIA C/O MINISTRY OF LANDS PARKS AND HOUSING |
BARKERVILLE
GOLD MINES LTD. |
0.14 |
OGR
(5%) |
| |
Osisko Development Corp.
NI 43-101 Technical Report
Feasibility Study for the Cariboo Gold Project |
|
| PID |
Title
# |
CG
# |
Original
grantee |
Fee
simple owner |
UNDERSURFACE
OWNER |
Area
(Acres) |
Royalty |
| 005-910-153 |
Y1628 |
3922/510 |
LAURENT
MULLER |
HER
MAJESTY THE QUEEN IN RIGHT OF THE PROVINCE OF BRITISH COLUMBIA C/O MINISTRY OF LANDS PARKS AND HOUSING |
BARKERVILLE
GOLD MINES LTD. |
0.14 |
OGR
(5%) |
| 005-910-137 |
Y1627 |
3922/510 |
LAURENT
MULLER |
HER
MAJESTY THE QUEEN IN RIGHT OF THE PROVINCE OF BRITISH COLUMBIA C/O MINISTRY OF LANDS PARKS AND HOUSING |
BARKERVILLE
GOLD MINES LTD. |
0.04 |
OGR
(5%) |
| 005-910-111 |
Y1626 |
3922/510 |
LAURENT
MULLER |
HER
MAJESTY THE QUEEN IN RIGHT OF THE PROVINCE OF BRITISH COLUMBIA C/O MINISTRY OF LANDS PARKS AND HOUSING |
BARKERVILLE
GOLD MINES LTD. |
0.14 |
OGR
(5%) |
| 005-910-099 |
Y1625 |
3922/510 |
LAURENT
MULLER |
HER
MAJESTY THE QUEEN IN RIGHT OF THE PROVINCE OF BRITISH COLUMBIA C/O MINISTRY OF LANDS PARKS AND HOUSING |
BARKERVILLE
GOLD MINES LTD. |
0.14 |
OGR
(5%) |
| 005-910-048 |
Y1623 |
3922/510 |
LAURENT
MULLER |
HER
MAJESTY THE QUEEN IN RIGHT OF THE PROVINCE OF BRITISH COLUMBIA C/O MINISTRY OF LANDS PARKS AND HOUSING |
BARKERVILLE
GOLD MINES LTD. |
0.14 |
OGR
(5%) |
| 005-910-021 |
Y1622 |
3922/510 |
LAURENT
MULLER |
HER
MAJESTY THE QUEEN IN RIGHT OF THE PROVINCE OF BRITISH COLUMBIA C/O MINISTRY OF LANDS PARKS AND HOUSING |
BARKERVILLE
GOLD MINES LTD. |
0.14 |
OGR
(5%) |
| 005-909-953 |
Y1609 |
3922/510 |
LAURENT
MULLER |
HER
MAJESTY THE QUEEN IN RIGHT OF THE PROVINCE OF BRITISH COLUMBIA C/O MINISTRY OF LANDS PARKS AND HOUSING |
BARKERVILLE
GOLD MINES LTD. |
0.14 |
OGR
(5%) |
| 005-909-911 |
Y1608 |
3922/510 |
LAURENT
MULLER |
HER
MAJESTY THE QUEEN IN RIGHT OF THE PROVINCE OF BRITISH COLUMBIA |
BARKERVILLE
GOLD MINES LTD. |
0.14 |
OGR
(5%) |
| 005-909-881 |
Y1607 |
3922/510 |
LAURENT
MULLER |
HER
MAJESTY THE QUEEN IN RIGHT OF THE PROVINCE OF BRITISH COLUMBIA |
BARKERVILLE
GOLD MINES LTD. |
0.14 |
OGR
(5%) |
| 005-909-864 |
Y1606 |
3922/510 |
LAURENT
MULLER |
HER
MAJESTY THE QUEEN IN RIGHT OF THE PROVINCE OF BRITISH COLUMBIA C/O MINISTRY OF LANDS PARKS AND HOUSING |
BARKERVILLE
GOLD MINES LTD. |
0.14 |
OGR
(5%) |
| 005-909-813 |
Y1605 |
3922/510 |
LAURENT
MULLER |
HER
MAJESTY THE QUEEN IN RIGHT OF THE PROVINCE OF BRITISH COLUMBIA C/O MINISTRY OF LANDS PARKS AND HOUSING |
BARKERVILLE
GOLD MINES LTD. |
0.14 |
OGR
(5%) |
| |
Osisko Development Corp.
NI 43-101 Technical Report
Feasibility Study for the Cariboo Gold Project |
|
| PID |
Title
# |
CG
# |
Original
grantee |
Fee
simple owner |
UNDERSURFACE
OWNER |
Area
(Acres) |
Royalty |
| 005-890-519 |
S28504 |
3922/510 |
LAURENT
MULLER |
HER
MAJESTY THE QUEEN IN RIGHT OF THE PROVINCE OF BRITISH COLUMBIA C/O MINISTRY OF LANDS PARKS AND HOUSING |
BARKERVILLE
GOLD MINES LTD. |
0.14 |
OGR
(5%) |
| 005-890-471 |
S28507 |
3922/510 |
LAURENT
MULLER |
HER
MAJESTY THE QUEEN IN RIGHT OF THE PROVINCE OF BRITISH COLUMBIA C/O MINISTRY OF LANDS PARKS AND HOUSING |
BARKERVILLE
GOLD MINES LTD. |
0.14 |
OGR
(5%) |
| 004-056-752 |
CA4347922 |
32F/34 |
LEWIS
WINTRIP |
BARKERVILLE
GOLD MINES LTD. |
HER
MAJESTY THE QUEEN IN RIGHT OF THE PROVINCE OF BRITISH COLUMBIA, MINISTER RESPONSIBLE FOR THE HERITAGE CONSERVATION ACT |
82.23 |
|
| 026-025-906 |
BB1991819 |
2517/101 |
MARY
AGNES MASON (TRANSFERRED TO LOWHEE MINING CO. LTD.) |
BARKERVILLE
GOLD MINES LTD. |
BARKERVILLE
GOLD MINES LTD. |
0.38 |
OGR
(5%) |
| 024-317-497 |
PS24541 |
2517/101 |
MARY
AGNES MASON (TRANSFERRED TO LOWHEE MINING CO. LTD.) |
STEPHEN
EMANUEL MARKS, CONSULTANT |
BARKERVILLE
GOLD MINES LTD. |
0.44 |
OGR
(5%) |
| 019-209-495 |
PJ13778 |
2517/101 |
MARY
AGNES MASON (TRANSFERRED TO LOWHEE MINING CO. LTD.) |
ROYAL
CANADIAN LEGION (PACIFIC) WELLS AND DISTRICT #128 |
BARKERVILLE
GOLD MINES LTD. |
0.37 |
OGR
(5%) |
| 019-184-204 |
PT15157 |
2517/101 |
MARY
AGNES MASON (TRANSFERRED TO LOWHEE MINING CO. LTD.) |
LEVERNE
HELEN RAY, BUSINESSWOMAN |
BARKERVILLE
GOLD MINES LTD. |
0.24 |
OGR
(5%) |
| 019-113-854 |
CA6881775 |
2517/101 |
MARY
AGNES MASON (TRANSFERRED TO LOWHEE MINING CO. LTD.) |
BARKERVILLE
GOLD MINES LTD. |
BARKERVILLE
GOLD MINES LTD. |
0.08 |
OGR
(5%) |
| 019-065-612 |
PH49893 |
2517/101 |
MARY
AGNES MASON (TRANSFERRED TO LOWHEE MINING CO. LTD.) |
STEPAN
BAZIUK, RETIRED & ROSE ELIZABETH BAZIUK, HOMEMAKER AS JOINT TENANTS |
BARKERVILLE
GOLD MINES LTD. |
0.11 |
OGR
(5%) |
| 017-589-517 |
CA9850206 |
2517/101 |
MARY
AGNES MASON (TRANSFERRED TO LOWHEE MINING CO. LTD.) |
BARKERVILLE
GOLD MINES LTD. |
BARKERVILLE
GOLD MINES LTD. |
4.94 |
OGR
(5%) |
| |
Osisko Development Corp.
NI 43-101 Technical Report
Feasibility Study for the Cariboo Gold Project |
|
| PID |
Title
# |
CG
# |
Original
grantee |
Fee
simple owner |
UNDERSURFACE
OWNER |
Area
(Acres) |
Royalty |
| 017-589-509 |
CA3473810 |
2517/101 |
MARY
AGNES MASON (TRANSFERRED TO LOWHEE MINING CO. LTD.) |
NUGGET
HILL RV PARK LTD. |
BARKERVILLE
GOLD MINES LTD. |
4.85 |
OGR
(5%) |
| 016-171-985 |
CA6255616 |
2517/101 |
MARY
AGNES MASON (TRANSFERRED TO LOWHEE MINING CO. LTD.) |
CASEY
LEIGH ROBINSON, EARLY CHILDHOOD EDUCATOR & GABRIEL LAKOTA FOURCHALK, RESTAURANT MANAGER AS JOINT TENANTS |
BARKERVILLE
GOLD MINES LTD. |
0.19 |
OGR
(5%) |
| 015-389-481 |
PT3046 |
2517/101 |
MARY
AGNES MASON (TRANSFERRED TO LOWHEE MINING CO. LTD.) |
GARY
STEPHEN CHAMPAGNE, WELLS ADMINISTRATOR & LINDA MAE CHAMPAGNE, PRE SCHOOL TEACHER AS JOINT TENANTS |
BARKERVILLE
GOLD MINES LTD. |
0.19 |
OGR
(5%) |
| 014-997-347 |
CA4769286 |
2517/101 |
MARY
AGNES MASON (TRANSFERRED TO LOWHEE MINING CO. LTD.) |
HER
MAJESTY THE QUEEN IN RIGHT OF THE PROVINCE OF BRITISH COLUMBIA |
BARKERVILLE
GOLD MINES LTD. |
43.60 |
OGR
(5%) |
| 014-385-732 |
CA3322183 |
2517/101 |
MARY
AGNES MASON (TRANSFERRED TO LOWHEE MINING CO. LTD.) |
BARKERVILLE
GOLD MINES LTD. |
BARKERVILLE
GOLD MINES LTD. |
6.58 |
OGR
(5%) |
| 014-018-853 |
M35643 |
2517/101 |
MARY
AGNES MASON (TRANSFERRED TO LOWHEE MINING CO. LTD.) |
RICHARD
ALLAN CARPENTER, LANDSCAPER (FORFEITED TO CROWN) |
BARKERVILLE
GOLD MINES LTD. |
0.02 |
OGR
(5%) |
| 014-018-829 |
M35643 |
2517/101 |
MARY
AGNES MASON (TRANSFERRED TO LOWHEE MINING CO. LTD.) |
RICHARD
ALLAN CARPENTER, LANDSCAPER (FORFEITED TO CROWN |
BARKERVILLE
GOLD MINES LTD. |
0.11 |
OGR
(5%) |
| 014-004-721 |
19939M |
2517/101 |
MARY
AGNES MASON (TRANSFERRED TO LOWHEE MINING CO. LTD.) |
NICHOLAS
BIRD (FORFEITED TO CROWN) |
BARKERVILLE
GOLD MINES LTD. |
0.09 |
OGR
(5%) |
| 013-853-503 |
PK41041 |
2517/101 |
MARY
AGNES MASON (TRANSFERRED TO LOWHEE MINING CO. LTD.) |
DORTHELO
M. WHITE (FORFEITED TO CROWN) |
BARKERVILLE
GOLD MINES LTD. |
0.10 |
OGR
(5%) |
| 013-853-481 |
PK41040 |
2517/101 |
MARY
AGNES MASON (TRANSFERRED TO LOWHEE MINING CO. LTD.) |
DORTHELO
M. WHITE (FORFEITED TO CROWN) |
BARKERVILLE
GOLD MINES LTD. |
0.19 |
OGR
(5%) |
| |
Osisko Development Corp.
NI 43-101 Technical Report
Feasibility Study for the Cariboo Gold Project |
|
| PID |
Title
# |
CG
# |
Original
grantee |
Fee
simple owner |
UNDERSURFACE
OWNER |
Area
(Acres) |
Royalty |
| 013-818-597 |
PT14019 |
2517/101 |
MARY
AGNES MASON (TRANSFERRED TO LOWHEE MINING CO. LTD.) |
DOROTHY
KATHLEEN JACOBSON, RETIRED |
BARKERVILLE
GOLD MINES LTD. |
0.02 |
OGR
(5%) |
| 013-818-520 |
CA7037415 |
2517/101 |
MARY
AGNES MASON (TRANSFERRED TO LOWHEE MINING CO. LTD.) |
ALEXANDRA
ROSEANN CLARKE, GEOTECHNICIAN |
BARKERVILLE
GOLD MINES LTD. |
0.11 |
OGR
(5%) |
| 013-817-906 |
11837M |
2517/101 |
MARY
AGNES MASON (TRANSFERRED TO LOWHEE MINING CO. LTD.) |
OLIVE
ESTHER BRADSHAW (FORFEITED TO CROWN) |
BARKERVILLE
GOLD MINES LTD. |
0.09 |
OGR
(5%) |
| 013-817-884 |
23986M |
2517/101 |
MARY
AGNES MASON (TRANSFERRED TO LOWHEE MINING CO. LTD.) |
ALBERT
JOHN TAYLOR (FORFEITED TO CROWN) |
BARKERVILLE
GOLD MINES LTD. |
0.06 |
OGR
(5%) |
| 013-817-876 |
37991M |
2517/101 |
MARY
AGNES MASON (TRANSFERRED TO LOWHEE MINING CO. LTD.) |
WILLIAM
ALFRED FOSTER (FORFEITED TO CROWN) |
BARKERVILLE
GOLD MINES LTD. |
0.08 |
OGR
(5%) |
| 013-817-868 |
24646M |
2517/101 |
MARY
AGNES MASON (TRANSFERRED TO LOWHEE MINING CO. LTD.) |
EDWARD
KENNETH INCH (FORFEITED TO CROWN) |
BARKERVILLE
GOLD MINES LTD. |
0.11 |
OGR
(5%) |
| 013-814-877 |
PH38121 |
2517/101 |
MARY
AGNES MASON (TRANSFERRED TO LOWHEE MINING CO. LTD.) |
MARGARET
KEIBEL, REGISTERED NURSE |
BARKERVILLE
GOLD MINES LTD. |
0.19 |
OGR
(5%) |
| 013-814-818 |
CA7841104 |
2517/101 |
MARY
AGNES MASON (TRANSFERRED TO LOWHEE MINING CO. LTD.) |
PATRICIA
DONNA ANGELA RUMMEL, SALES CLERK &BRIAN DOUGLAS RUMMEL, RETAIL STORE OWNER AS JOINT TENANTS |
BARKERVILLE
GOLD MINES LTD. |
0.19 |
OGR
(5%) |
| 013-814-796 |
CA49803 |
2517/101 |
MARY
AGNES MASON (TRANSFERRED TO LOWHEE MINING CO. LTD.) |
DANIEL
PETER UNGER, ELECTRICIAN |
BARKERVILLE
GOLD MINES LTD. |
0.29 |
OGR
(5%) |
| 013-814-745 |
CA7592468 |
2517/101 |
MARY
AGNES MASON (TRANSFERRED TO LOWHEE MINING CO. LTD.) |
HER
MAJESTY THE QUEEN IN RIGHT OF THE PROVINCE OF BRITISH COLUMBIA AS REPRESENTED BY THE MINISTER OF CITIZENS' SERVICES |
BARKERVILLE
GOLD MINES LTD. |
1.65 |
OGR
(5%) |
| |
Osisko Development Corp.
NI 43-101 Technical Report
Feasibility Study for the Cariboo Gold Project |
|
| PID |
Title
# |
CG
# |
Original
grantee |
Fee
simple owner |
UNDERSURFACE
OWNER |
Area
(Acres) |
Royalty |
| 013-814-478 |
U6752 |
2517/101 |
MARY
AGNES MASON (TRANSFERRED TO LOWHEE MINING CO. LTD.) |
HOWARD
JAMES WEBER, RETIRED & HELEN MOLLAT WEBER, HIS WIFE AS JOINT TENANTS (FORFEITED) |
BARKERVILLE
GOLD MINES LTD. |
0.08 |
OGR
(5%) |
| 013-814-338 |
CA3562944 |
2517/101 |
MARY
AGNES MASON (TRANSFERRED TO LOWHEE MINING CO. LTD.) |
NORTHWOODS
INN RESTAURANT LTD. |
BARKERVILLE
GOLD MINES LTD. |
0.11 |
OGR
(5%) |
| 013-814-125 |
PD43489 |
2517/101 |
MARY
AGNES MASON (TRANSFERRED TO LOWHEE MINING CO. LTD.) |
KATHLEEN
FRANCIS WILLIAMS, ADMINISTRATIVE CLERK (FORFEITED TO CROWN) |
BARKERVILLE
GOLD MINES LTD. |
0.10 |
OGR
(5%) |
| 013-807-137 |
S28189 |
2517/101 |
MARY
AGNES MASON (TRANSFERRED TO LOWHEE MINING CO. LTD.) |
VIRGINIA
BARREDO FERRIER, MANAGERESS (FORFEITED TO CROWN) |
BARKERVILLE
GOLD MINES LTD. |
0.33 |
OGR
(5%) |
| 013-789-759 |
PM17115 |
2517/101 |
MARY
AGNES MASON (TRANSFERRED TO LOWHEE MINING CO. LTD.) |
LEO
NOEL LANDRIAULT, TRUCK DRIVER |
BARKERVILLE
GOLD MINES LTD. |
0.10 |
OGR
(5%) |
| 013-789-741 |
CA6852256 |
2517/101 |
MARY
AGNES MASON (TRANSFERRED TO LOWHEE MINING CO. LTD.) |
CASEY
LEIGH ROBINSON, EARLY CHILDHOOD EDUCATOR |
BARKERVILLE
GOLD MINES LTD. |
0.19 |
OGR
(5%) |
| 013-789-708 |
BA114340 |
2517/101 |
MARY
AGNES MASON (TRANSFERRED TO LOWHEE MINING CO. LTD.) |
LAUREEN
CARRIE LIVINGSTONE, SCREENING OFFICER |
BARKERVILLE
GOLD MINES LTD. |
0.10 |
OGR
(5%) |
| 013-789-651 |
BA127519 |
2517/101 |
MARY
AGNES MASON (TRANSFERRED TO LOWHEE MINING CO. LTD.) |
LAUREEN
CARRIE LIVINGSTONE, SCREENING OFFICER |
BARKERVILLE
GOLD MINES LTD. |
0.11 |
OGR
(5%) |
| 013-215-469 |
PP3825 |
2517/101 |
MARY
AGNES MASON (TRANSFERRED TO LOWHEE MINING CO. LTD.) |
BC
TRANSPORTATION FINANCING AUTHORITY |
BARKERVILLE
GOLD MINES LTD. |
0.33 |
OGR
(5%) |
| 013-100-572 |
CA6670546 |
2517/101 |
MARY
AGNES MASON (TRANSFERRED TO LOWHEE MINING CO. LTD.) |
BARKERVILLE
GOLD MINES LTD. |
BARKERVILLE
GOLD MINES LTD. / THE CROWN IN RIGHT OF BRITISH COLUMBIA |
0.16 |
OGR
(5%) |
| |
Osisko Development Corp.
NI 43-101 Technical Report
Feasibility Study for the Cariboo Gold Project |
|
| PID |
Title
# |
CG
# |
Original
grantee |
Fee
simple owner |
UNDERSURFACE
OWNER |
Area
(Acres) |
Royalty |
| 011-186-330 |
CA1607931 |
2517/101 |
MARY
AGNES MASON (TRANSFERRED TO LOWHEE MINING CO. LTD.) |
JANET
RUBY SAMSON, HOMEMAKER |
BARKERVILLE
GOLD MINES LTD. |
0.10 |
OGR
(5%) |
| 009-497-463 |
CA6851547 |
2517/101 |
MARY
AGNES MASON (TRANSFERRED TO LOWHEE MINING CO. LTD.) |
BARKERVILLE
GOLD MINES LTD. |
BARKERVILLE
GOLD MINES LTD. |
0.29 |
OGR
(5%) |
| 008-942-994 |
BB1970531 |
2517/101 |
MARY
AGNES MASON (TRANSFERRED TO LOWHEE MINING CO. LTD.) |
BRITISH
COLUMBIA BUILDINGS CORPORATION |
BARKERVILLE
GOLD MINES LTD. |
1.29 |
OGR
(5%) |
| 008-466-386 |
BB3013092 |
2517/101 |
MARY
AGNES MASON (TRANSFERRED TO LOWHEE MINING CO. LTD.) |
HER
MAJESTY THE QUEEN IN RIGHT OF CANADA AS REPRESENTED BY THE MINISTER OF PUBLIC SAFETY AND EMERGENCY PREPAREDNESS C/O ROYAL CANADIAN
MOUNTED POLICE |
BARKERVILLE
GOLD MINES LTD. |
0.24 |
OGR
(5%) |
| 008-447-756 |
CA1598791 |
2517/101 |
MARY
AGNES MASON (TRANSFERRED TO LOWHEE MINING CO. LTD.) |
DARYL
TERENCE BRACKETT, MILLWORKER & SURESH MITTER KERAM, STEAM PLANT OPERATOR |
BARKERVILLE
GOLD MINES LTD. |
5.02 |
OGR
(5%) |
| 008-425-817 |
PC11498 |
2517/101 |
MARY
AGNES MASON (TRANSFERRED TO LOWHEE MINING CO. LTD.) |
VIRGINIA
BARREDO FERRIER, PROPRIETOR (FORFEITED TO CROWN) |
BARKERVILLE
GOLD MINES LTD. |
0.30 |
OGR
(5%) |
| 008-421-595 |
PB52550 |
2517/101 |
MARY
AGNES MASON (TRANSFERRED TO LOWHEE MINING CO. LTD.) |
VIRGINIA
BARREDO FERRIER, PROPRIETOR (FORFEITED TO CROWN) |
BARKERVILLE
GOLD MINES LTD. |
0.05 |
OGR
(5%) |
| 007-932-073 |
PK30489 |
2517/101 |
MARY
AGNES MASON (TRANSFERRED TO LOWHEE MINING CO. LTD.) |
LARMA
HOLDINGS LTD. |
BARKERVILLE
GOLD MINES LTD. |
1.34 |
OGR
(5%) |
| 007-486-421 |
CA3401899 |
2517/101 |
MARY
AGNES MASON (TRANSFERRED TO LOWHEE MINING CO. LTD.) |
PEGGY-ANNE
LILLIAN CROTEAU, BUSINESSWOMAN & MARCEL CHARLES FENTON GUIGUET, MACHINE OPERATOR AS JOINT TENANTS |
BARKERVILLE
GOLD MINES LTD. |
0.10 |
OGR
(5%) |
| 007-486-405 |
CA3401898 |
2517/101 |
MARY
AGNES MASON (TRANSFERRED TO LOWHEE MINING CO. LTD.) |
PEGGY-ANNE
LILLIAN CROTEAU, BUSINESSWOMAN & MARCEL CHARLES FENTON GUIGUET, MACHINE OPERATOR AS JOINT TENANTS |
BARKERVILLE
GOLD MINES LTD. |
0.19 |
OGR
(5%) |
| |
Osisko Development Corp.
NI 43-101 Technical Report
Feasibility Study for the Cariboo Gold Project |
|
| PID |
Title
# |
CG
# |
Original
grantee |
Fee
simple owner |
UNDERSURFACE
OWNER |
Area
(Acres) |
Royalty |
| 005-363-900 |
PP3703 |
2517/101 |
MARY
AGNES MASON (TRANSFERRED TO LOWHEE MINING CO. LTD.) |
BC
TRANSPORTATION FINANCING AUTHORITY |
BARKERVILLE
GOLD MINES LTD. |
0.06 |
OGR
(5%) |
| 004-956-460 |
X29283 |
2517/101 |
MARY
AGNES MASON (TRANSFERRED TO LOWHEE MINING CO. LTD.) |
HERBERT
WALTER KIEBEL, CONTRACTOR (FORFEITED TO CROWN) |
BARKERVILLE
GOLD MINES LTD. |
0.10 |
OGR
(5%) |
| 004-956-451 |
X29282 |
2517/101 |
MARY
AGNES MASON (TRANSFERRED TO LOWHEE MINING CO. LTD.) |
HERBERT
WALTER KIEBEL, CONTRACTOR (FORFEITED TO CROWN) |
BARKERVILLE
GOLD MINES LTD. |
0.10 |
OGR
(5%) |
| 004-933-206 |
CA71100 |
2517/101 |
MARY
AGNES MASON (TRANSFERRED TO LOWHEE MINING CO. LTD.) |
CLIFFORD
CECIL COLLINS, SMALL ENGINE PROGRAM COORDINATOR & NORMA JEAN COLLINS, COMMUNITY SUPPORT WORKER AS JOINT TENANTS |
BARKERVILLE
GOLD MINES LTD. |
1.88 |
OGR
(5%) |
| 004-426-142 |
CA879575 |
2517/101 |
MARY
AGNES MASON (TRANSFERRED TO LOWHEE MINING CO. LTD.) |
MARILYN
LEIGH TURNER, BUSINESSWOMAN |
BARKERVILLE
GOLD MINES LTD. |
0.19 |
OGR
(5%) |
| 003-902-170 |
PD14585 |
2517/101 |
MARY
AGNES MASON (TRANSFERRED TO LOWHEE MINING CO. LTD.) |
NORTHWOODS
INN RESTAURANT LTD. |
BARKERVILLE
GOLD MINES LTD. |
0.38 |
OGR
(5%) |
| 003-815-986 |
BB658631 |
2517/101 |
MARY
AGNES MASON (TRANSFERRED TO LOWHEE MINING CO. LTD.) |
ROBERT
VERNON ST. JOHN, BUSINESSMAN |
BARKERVILLE
GOLD MINES LTD. |
0.16 |
OGR
(5%) |
| 005-076-081 |
CA3473811 |
2517/101,
4215/55 |
MARY
AGNES MASON (TRANSFERRED TO LOWHEE MINING CO. LTD.), ADA JANE BRUCE MASON |
NUGGET
HILL RV PARK LTD. |
BARKERVILLE
GOLD MINES LTD. |
0.19 |
OGR
(5%) |
| 004-078-560 |
CA332187 |
42F/34 |
PHILIP
RICHARD TAYLOR LEACY AND JOHN BUTTS |
BARKERVILLE
GOLD MINES LTD. |
BARKERVILLE
GOLD MINES LTD. |
10.00 |
OGR
(5%) |
| 004-078-608 |
CA9850190 |
35F/34 |
ROBERT
DRIUKALL |
BARKERVILLE
GOLD MINES LTD. |
BARKERVILLE
GOLD MINES LTD. |
58.00 |
OGR
(5%) |
| 004-087-054 |
PT5232,
PC16245 |
39F/34 |
ROBERT
JOHUS AND GEORGE HENRY JOHUS |
BARKERVILLE
GOLD MINES LTD. |
BARKERVILLE
GOLD MINES LTD. |
3.78 |
OGR
(5%) |
| |
Osisko Development Corp.
NI 43-101 Technical Report
Feasibility Study for the Cariboo Gold Project |
|
| PID |
Title
# |
CG
# |
Original
grantee |
Fee
simple owner |
UNDERSURFACE
OWNER |
Area
(Acres) |
Royalty |
| 008-801-908 |
CA9850181 |
35/36
(B), 2672/597 (U) |
THE
BRITISH COLUMBIA MILLING AND MINING COMPANY (LIMITED) |
BARKERVILLE
GOLD MINES LTD. |
BARKERVILLE
GOLD MINES LTD. |
20.60 |
OGR
(5%) |
| 014-982-013 |
CA3322181 |
35/36 |
THE
BRITISH COLUMBIA MILLING AND MINING COMPANY (LIMITED) |
BARKERVILLE
GOLD MINES LTD. |
BARKERVILLE
GOLD MINES LTD. |
20.00 |
OGR
(5%) |
| 015-306-992 |
PC58824 |
126/47 |
THE
BRITISH COLUMBIA MILLING AND MINING COMPANY (LIMITED) |
HER
MAJESTY THE QUEEN IN RIGHT OF THE PROVINCE OF BRITISH COLUMBIA |
BARKERVILLE
GOLD MINES LTD. |
20.53 |
OGR
(5%), Franco Nevada (3%) |
| 014-385-759 |
CA9850179 |
4614/617
(S), 35/36 (B) |
THE
BRITISH COLUMBIA MILLING AND MINING COMPANY LIMITED (CG 36/36); CARIBOO GOLD QUARTZ MINING COMPANY LIMITED (NON-PERSONAL LIABILITY)
(CG 4614/617) |
BARKERVILLE
GOLD MINES LTD. |
BARKERVILLE
GOLD MINES LTD. |
19.88 |
OGR
(5%) |
| 005-890-578 |
S28501 |
211/673 |
THE
CARIBOO GOLD QUARTZ MINING COMPANY (NON-PERSONAL LIABILITY) |
HER
MAJESTY THE QUEEN IN RIGHT OF THE PROVINCE OF BRITISH COLUMBIA C/O MINISTRY OF LANDS PARKS AND HOUSING |
BARKERVILLE
GOLD MINES LTD. |
0.65 |
OGR
(5%) |
| 015-134-954 |
W21843 |
9418/665 |
THE
CARIBOO GOLD QUARTZ MINING COMPANY LIMITED (NON-PERSONAL LIABILITY) |
HER
MAJESTY THE QUEEN IN RIGHT OF THE PROVINCE OF BRITISH COLUMBIA |
BARKERVILLE
GOLD MINES LTD. |
12.19 |
OGR
(5%) |
| 015-134-971 |
W21841 |
9417/665 |
THE
CARIBOO GOLD QUARTZ MINING COMPANY LIMITED (NON-PERSONAL LIABILITY) |
HER
MAJESTY THE QUEEN IN RIGHT OF THE PROVINCE OF BRITISH COLUMBIA |
BARKERVILLE
GOLD MINES LTD. |
51.49 |
OGR
(5%) |
| 015-135-021 |
W21838 |
9416/665 |
THE
CARIBOO GOLD QUARTZ MINING COMPANY LIMITED (NON-PERSONAL LIABILITY) |
HER
MAJESTY THE QUEEN IN RIGHT OF THE PROVINCE OF BRITISH COLUMBIA |
BARKERVILLE
GOLD MINES LTD. |
37.87 |
OGR
(5%) |
| 015-135-004 |
W21840 |
9415/665 |
THE
CARIBOO GOLD QUARTZ MINING COMPANY LIMITED (NON-PERSONAL LIABILITY) |
HER
MAJESTY THE QUEEN IN RIGHT OF THE PROVINCE OF BRITISH COLUMBIA |
BARKERVILLE
GOLD MINES LTD. |
29.10 |
OGR
(5%) |
| 015-135-039 |
W21854 |
9414/665 |
THE
CARIBOO GOLD QUARTZ MINING COMPANY LIMITED (NON-PERSONAL LIABILITY) |
HER
MAJESTY THE QUEEN IN RIGHT OF THE PROVINCE OF BRITISH COLUMBIA |
BARKERVILLE
GOLD MINES LTD. |
30.50 |
OGR
(5%) |
| |
Osisko Development Corp.
NI 43-101 Technical Report
Feasibility Study for the Cariboo Gold Project |
|
| PID |
Title
# |
CG
# |
Original
grantee |
Fee
simple owner |
UNDERSURFACE
OWNER |
Area
(Acres) |
Royalty |
| 015-134-792 |
W21849 |
9413/665 |
THE
CARIBOO GOLD QUARTZ MINING COMPANY LIMITED (NON-PERSONAL LIABILITY) |
HER
MAJESTY THE QUEEN IN RIGHT OF THE PROVINCE OF BRITISH COLUMBIA |
BARKERVILLE
GOLD MINES LTD. |
51.76 |
OGR
(5%) |
| 015-133-991 |
W21853 |
9412/665 |
THE
CARIBOO GOLD QUARTZ MINING COMPANY LIMITED (NON-PERSONAL LIABILITY) |
HER
MAJESTY THE QUEEN IN RIGHT OF THE PROVINCE OF BRITISH COLUMBIA |
BARKERVILLE
GOLD MINES LTD. |
51.65 |
OGR
(5%) |
| 015-134-806 |
W21842 |
9411/665 |
THE
CARIBOO GOLD QUARTZ MINING COMPANY LIMITED (NON-PERSONAL LIABILITY) |
HER
MAJESTY THE QUEEN IN RIGHT OF THE PROVINCE OF BRITISH COLUMBIA |
BARKERVILLE
GOLD MINES LTD. |
0.84 |
OGR
(5%) |
| 015-135-055 |
W21837 |
6969/640 |
THE
CARIBOO GOLD QUARTZ MINING COMPANY LIMITED (NON-PERSONAL LIABILITY) |
HER
MAJESTY THE QUEEN IN RIGHT OF THE PROVINCE OF BRITISH COLUMBIA |
BARKERVILLE
GOLD MINES LTD. |
0.03 |
OGR
(5%) |
| 015-152-049 |
PC54227 |
6968/640 |
THE
CARIBOO GOLD QUARTZ MINING COMPANY LIMITED (NON-PERSONAL LIABILITY) |
HER
MAJESTY THE QUEEN IN RIGHT OF THE PROVINCE OF BRITISH COLUMBIA |
BARKERVILLE
GOLD MINES LTD. |
34.57 |
OGR
(5%) |
| 015-151-450 |
PC54222 |
6967/640 |
THE
CARIBOO GOLD QUARTZ MINING COMPANY LIMITED (NON-PERSONAL LIABILITY) |
HER
MAJESTY THE QUEEN IN RIGHT OF THE PROVINCE OF BRITISH COLUMBIA C/O MINISTER RESPONSIBLE FOR THE HERITAGE CONSERVATION ACT |
BARKERVILLE
GOLD MINES LTD. |
51.65 |
OGR
(5%) |
| 015-151-417 |
PC54221 |
6966/640 |
THE
CARIBOO GOLD QUARTZ MINING COMPANY LIMITED (NON-PERSONAL LIABILITY) |
HER
MAJESTY THE QUEEN IN RIGHT OF THE PROVINCE OF BRITISH COLUMBIA C/O MINISTER RESPONSIBLE FOR THE HERITAGE CONSERVATION ACT |
BARKERVILLE
GOLD MINES LTD. |
32.43 |
OGR
(5%) |
| 015-151-301 |
PC54220 |
6965/640 |
THE
CARIBOO GOLD QUARTZ MINING COMPANY LIMITED (NON-PERSONAL LIABILITY) |
HER
MAJESTY THE QUEEN IN RIGHT OF THE PROVINCE OF BRITISH COLUMBIA |
BARKERVILLE
GOLD MINES LTD. |
49.74 |
OGR
(5%) |
| 015-151-174 |
PC54219 |
6964/640 |
THE
CARIBOO GOLD QUARTZ MINING COMPANY LIMITED (NON-PERSONAL LIABILITY) |
HER
MAJESTY THE QUEEN IN RIGHT OF THE PROVINCE OF BRITISH COLUMBIA C/O MINISTER RESPONSIBLE FOR THE HERITAGE CONSERVATION ACT |
BARKERVILLE
GOLD MINES LTD. |
49.59 |
OGR
(5%) |
| 015-151-093 |
PC54218 |
6963/640 |
THE
CARIBOO GOLD QUARTZ MINING COMPANY LIMITED (NON-PERSONAL LIABILITY) |
HER
MAJESTY THE QUEEN IN RIGHT OF THE PROVINCE OF BRITISH COLUMBIA C/O MINISTER RESPONSIBLE FOR THE HERITAGE CONSERVATION ACT |
BARKERVILLE
GOLD MINES LTD. |
47.52 |
OGR
(5%) |
| |
Osisko Development Corp.
NI 43-101 Technical Report
Feasibility Study for the Cariboo Gold Project |
|
| PID |
Title
# |
CG
# |
Original
grantee |
Fee
simple owner |
UNDERSURFACE
OWNER |
Area
(Acres) |
Royalty |
| 015-151-999 |
PC54226 |
6962/640 |
THE
CARIBOO GOLD QUARTZ MINING COMPANY LIMITED (NON-PERSONAL LIABILITY) |
HER
MAJESTY THE QUEEN IN RIGHT OF THE PROVINCE OF BRITISH COLUMBIA |
BARKERVILLE
GOLD MINES LTD. |
51.66 |
OGR
(5%) |
| 015-151-930 |
PC54225 |
6961/640 |
THE
CARIBOO GOLD QUARTZ MINING COMPANY LIMITED (NON-PERSONAL LIABILITY) |
HER
MAJESTY THE QUEEN IN RIGHT OF THE PROVINCE OF BRITISH COLUMBIA |
BARKERVILLE
GOLD MINES LTD. |
19.96 |
OGR
(5%) |
| 015-151-905 |
PC54224 |
6960/640 |
THE
CARIBOO GOLD QUARTZ MINING COMPANY LIMITED (NON-PERSONAL LIABILITY) |
HER
MAJESTY THE QUEEN IN RIGHT OF THE PROVINCE OF BRITISH COLUMBIA |
BARKERVILLE
GOLD MINES LTD. |
43.99 |
OGR
(5%) |
| 015-134-911 |
W21839 |
6959/640 |
THE
CARIBOO GOLD QUARTZ MINING COMPANY LIMITED (NON-PERSONAL LIABILITY) |
HER
MAJESTY THE QUEEN IN RIGHT OF THE PROVINCE OF BRITISH COLUMBIA |
BARKERVILLE
GOLD MINES LTD. |
9.33 |
OGR
(5%) |
| 015-134-008 |
W21852 |
6958/640 |
THE
CARIBOO GOLD QUARTZ MINING COMPANY LIMITED (NON-PERSONAL LIABILITY) |
HER
MAJESTY THE QUEEN IN RIGHT OF THE PROVINCE OF BRITISH COLUMBIA |
BARKERVILLE
GOLD MINES LTD. |
12.65 |
OGR
(5%) |
| 015-151-859 |
PC54223 |
6957/640 |
THE
CARIBOO GOLD QUARTZ MINING COMPANY LIMITED (NON-PERSONAL LIABILITY) |
HER
MAJESTY THE QUEEN IN RIGHT OF THE PROVINCE OF BRITISH COLUMBIA |
BARKERVILLE
GOLD MINES LTD. |
51.04 |
OGR
(5%) |
| 015-133-702 |
W21889 |
6802/639 |
THE
CARIBOO GOLD QUARTZ MINING COMPANY LIMITED (NON-PERSONAL LIABILITY) |
HER
MAJESTY THE QUEEN IN RIGHT OF THE PROVINCE OF BRITISH COLUMBIA |
BARKERVILLE
GOLD MINES LTD. |
48.16 |
OGR
(5%) |
| 015-151-026 |
PC54212 |
6801/639 |
THE
CARIBOO GOLD QUARTZ MINING COMPANY LIMITED (NON-PERSONAL LIABILITY) |
HER
MAJESTY THE QUEEN IN RIGHT OF THE PROVINCE OF BRITISH COLUMBIA |
BARKERVILLE
GOLD MINES LTD. |
51.62 |
OGR
(5%) |
| 015-151-018 |
PC54211 |
6800/638 |
THE
CARIBOO GOLD QUARTZ MINING COMPANY LIMITED (NON-PERSONAL LIABILITY) |
HER
MAJESTY THE QUEEN IN RIGHT OF THE PROVINCE OF BRITISH COLUMBIA |
BARKERVILLE
GOLD MINES LTD. |
51.65 |
OGR
(5%) |
| 015-151-000 |
PC54210 |
6799/638 |
THE
CARIBOO GOLD QUARTZ MINING COMPANY LIMITED (NON-PERSONAL LIABILITY) |
HER
MAJESTY THE QUEEN IN RIGHT OF THE PROVINCE OF BRITISH COLUMBIA |
BARKERVILLE
GOLD MINES LTD. |
40.99 |
OGR
(5%) |
| |
Osisko Development Corp.
NI 43-101 Technical Report
Feasibility Study for the Cariboo Gold Project |
|
| PID |
Title
# |
CG
# |
Original
grantee |
Fee
simple owner |
UNDERSURFACE
OWNER |
Area
(Acres) |
Royalty |
| 015-150-640 |
PC54209 |
6798/638 |
THE
CARIBOO GOLD QUARTZ MINING COMPANY LIMITED (NON-PERSONAL LIABILITY) |
HER
MAJESTY THE QUEEN IN RIGHT OF THE PROVINCE OF BRITISH COLUMBIA |
BARKERVILLE
GOLD MINES LTD. |
51.65 |
OGR
(5%) |
| 015-151-794 |
PC54232 |
6797/638 |
THE
CARIBOO GOLD QUARTZ MINING COMPANY LIMITED (NON-PERSONAL LIABILITY) |
HER
MAJESTY THE QUEEN IN RIGHT OF THE PROVINCE OF BRITISH COLUMBIA |
BARKERVILLE
GOLD MINES LTD. |
51.66 |
OGR
(5%) |
| 015-151-727 |
PC54231 |
6796/638 |
THE
CARIBOO GOLD QUARTZ MINING COMPANY LIMITED (NON-PERSONAL LIABILITY) |
HER
MAJESTY THE QUEEN IN RIGHT OF THE PROVINCE OF BRITISH COLUMBIA |
BARKERVILLE
GOLD MINES LTD. |
51.60 |
OGR
(5%) |
| 015-151-590 |
PC54229 |
6795/638 |
THE
CARIBOO GOLD QUARTZ MINING COMPANY LIMITED (NON-PERSONAL LIABILITY) |
HER
MAJESTY THE QUEEN IN RIGHT OF THE PROVINCE OF BRITISH COLUMBIA |
BARKERVILLE
GOLD MINES LTD. |
21.11 |
OGR
(5%) |
| 015-151-557 |
PC54228 |
6794/638 |
THE
CARIBOO GOLD QUARTZ MINING COMPANY LIMITED (NON-PERSONAL LIABILITY) |
HER
MAJESTY THE QUEEN IN RIGHT OF THE PROVINCE OF BRITISH COLUMBIA |
BARKERVILLE
GOLD MINES LTD. |
36.70 |
OGR
(5%) |
| 015-150-470 |
PC54208 |
6793/638 |
THE
CARIBOO GOLD QUARTZ MINING COMPANY LIMITED (NON-PERSONAL LIABILITY) |
HER
MAJESTY THE QUEEN IN RIGHT OF THE PROVINCE OF BRITISH COLUMBIA C/O MINISTER RESPONSIBLE FOR THE HERITAGE CONSERVATION ACT |
BARKERVILLE
GOLD MINES LTD. |
49.59 |
OGR
(5%) |
| 015-152-405 |
PC54217 |
6792/638 |
THE
CARIBOO GOLD QUARTZ MINING COMPANY LIMITED (NON-PERSONAL LIABILITY) |
HER
MAJESTY THE QUEEN IN RIGHT OF THE PROVINCE OF BRITISH COLUMBIA |
BARKERVILLE
GOLD MINES LTD. |
39.16 |
OGR
(5%) |
| 015-152-367 |
PC54216 |
6791/638 |
THE
CARIBOO GOLD QUARTZ MINING COMPANY LIMITED (NON-PERSONAL LIABILITY) |
HER
MAJESTY THE QUEEN IN RIGHT OF THE PROVINCE OF BRITISH COLUMBIA |
BARKERVILLE
GOLD MINES LTD. |
37.01 |
OGR
(5%) |
| 015-152-341 |
PC54215 |
6790/638 |
THE
CARIBOO GOLD QUARTZ MINING COMPANY LIMITED (NON-PERSONAL LIABILITY) |
HER
MAJESTY THE QUEEN IN RIGHT OF THE PROVINCE OF BRITISH COLUMBIA |
BARKERVILLE
GOLD MINES LTD. |
51.58 |
OGR
(5%) |
| 015-152-294 |
PC54214 |
6789/638 |
THE
CARIBOO GOLD QUARTZ MINING COMPANY LIMITED (NON-PERSONAL LIABILITY) |
HER
MAJESTY THE QUEEN IN RIGHT OF THE PROVINCE OF BRITISH COLUMBIA |
BARKERVILLE
GOLD MINES LTD. |
51.65 |
OGR
(5%) |
| |
Osisko Development Corp.
NI 43-101 Technical Report
Feasibility Study for the Cariboo Gold Project |
|
| PID |
Title
# |
CG
# |
Original
grantee |
Fee
simple owner |
UNDERSURFACE
OWNER |
Area
(Acres) |
Royalty |
| 015-152-103 |
PC54213 |
6788/638 |
THE
CARIBOO GOLD QUARTZ MINING COMPANY LIMITED (NON-PERSONAL LIABILITY) |
HER
MAJESTY THE QUEEN IN RIGHT OF THE PROVINCE OF BRITISH COLUMBIA |
BARKERVILLE
GOLD MINES LTD. |
49.59 |
OGR
(5%) |
| 015-151-697 |
PC54230 |
6712/638 |
THE
CARIBOO GOLD QUARTZ MINING COMPANY LIMITED (NON-PERSONAL LIABILITY) |
HER
MAJESTY THE QUEEN IN RIGHT OF THE PROVINCE OF BRITISH COLUMBIA |
BARKERVILLE
GOLD MINES LTD. |
17.73 |
OGR
(5%) |
| 013-699-563 |
PC17201 |
6527/636 |
THE
CARIBOO GOLD QUARTZ MINING COMPANY LIMITED (NON-PERSONAL LIABILITY) |
HER
MAJESTY THE QUEEN IN RIGHT OF THE PROVINCE OF BRITISH COLUMBIA |
BARKERVILLE
GOLD MINES LTD. |
38.89 |
OGR
(5%) |
| 013-699-539 |
PC17200 |
6218/633 |
THE
CARIBOO GOLD QUARTZ MINING COMPANY LIMITED (NON-PERSONAL LIABILITY) |
HER
MAJESTY THE QUEEN IN RIGHT OF THE PROVINCE OF BRITISH COLUMBIA |
BARKERVILLE
GOLD MINES LTD. |
51.50 |
OGR
(5%) |
| 013-699-491 |
PC17199 |
6217/633 |
THE
CARIBOO GOLD QUARTZ MINING COMPANY LIMITED (NON-PERSONAL LIABILITY) |
HER
MAJESTY THE QUEEN IN RIGHT OF THE PROVINCE OF BRITISH COLUMBIA |
BARKERVILLE
GOLD MINES LTD. |
51.65 |
OGR
(5%) |
| 013-699-440 |
PC17198 |
6216/633 |
THE
CARIBOO GOLD QUARTZ MINING COMPANY LIMITED (NON-PERSONAL LIABILITY) |
HER
MAJESTY THE QUEEN IN RIGHT OF THE PROVINCE OF BRITISH COLUMBIA |
BARKERVILLE
GOLD MINES LTD. |
51.65 |
OGR
(5%) |
| 013-699-415 |
PC17197 |
6215/633 |
THE
CARIBOO GOLD QUARTZ MINING COMPANY LIMITED (NON-PERSONAL LIABILITY) |
HER
MAJESTY THE QUEEN IN RIGHT OF THE PROVINCE OF BRITISH COLUMBIA |
BARKERVILLE
GOLD MINES LTD. |
31.67 |
OGR
(5%) |
| 013-699-393 |
PC17196 |
6214/633 |
THE
CARIBOO GOLD QUARTZ MINING COMPANY LIMITED (NON-PERSONAL LIABILITY) |
HER
MAJESTY THE QUEEN IN RIGHT OF THE PROVINCE OF BRITISH COLUMBIA |
BARKERVILLE
GOLD MINES LTD. |
40.02 |
OGR
(5%) |
| 013-699-385 |
PC17195 |
6213/633 |
THE
CARIBOO GOLD QUARTZ MINING COMPANY LIMITED (NON-PERSONAL LIABILITY) |
HER
MAJESTY THE QUEEN IN RIGHT OF THE PROVINCE OF BRITISH COLUMBIA |
BARKERVILLE
GOLD MINES LTD. |
43.95 |
OGR
(5%) |
| 013-699-369 |
PC17194 |
6212/633 |
THE
CARIBOO GOLD QUARTZ MINING COMPANY LIMITED (NON-PERSONAL LIABILITY) |
HER
MAJESTY THE QUEEN IN RIGHT OF THE PROVINCE OF BRITISH COLUMBIA |
BARKERVILLE
GOLD MINES LTD. |
35.94 |
OGR
(5%) |
| |
Osisko Development Corp.
NI 43-101 Technical Report
Feasibility Study for the Cariboo Gold Project |
|
| PID |
Title
# |
CG
# |
Original
grantee |
Fee
simple owner |
UNDERSURFACE
OWNER |
Area
(Acres) |
Royalty |
| 015-287-131 |
U40874 |
6211/633 |
THE
CARIBOO GOLD QUARTZ MINING COMPANY LIMITED (NON-PERSONAL LIABILITY) |
HER
MAJESTY THE QUEEN IN RIGHT OF THE PROVINCE OF BRITISH COLUMBIA |
BARKERVILLE
GOLD MINES LTD. |
20.90 |
OGR
(5%) |
| 013-699-202 |
PC17190 |
6210/633 |
THE
CARIBOO GOLD QUARTZ MINING COMPANY LIMITED (NON-PERSONAL LIABILITY) |
HER
MAJESTY THE QUEEN IN RIGHT OF THE PROVINCE OF BRITISH COLUMBIA |
BARKERVILLE
GOLD MINES LTD. |
2.83 |
OGR
(5%) |
| 013-699-181 |
PC17189 |
6209/633 |
THE
CARIBOO GOLD QUARTZ MINING COMPANY LIMITED (NON-PERSONAL LIABILITY) |
HER
MAJESTY THE QUEEN IN RIGHT OF THE PROVINCE OF BRITISH COLUMBIA |
BARKERVILLE
GOLD MINES LTD. |
41.34 |
OGR
(5%) |
| 013-699-172 |
PC17205 |
6208/633 |
THE
CARIBOO GOLD QUARTZ MINING COMPANY LIMITED (NON-PERSONAL LIABILITY) |
HER
MAJESTY THE QUEEN IN RIGHT OF THE PROVINCE OF BRITISH COLUMBIA |
BARKERVILLE
GOLD MINES LTD. |
42.00 |
OGR
(5%) |
| 013-699-148 |
PC17188 |
6207/633 |
THE
CARIBOO GOLD QUARTZ MINING COMPANY LIMITED (NON-PERSONAL LIABILITY) |
HER
MAJESTY THE QUEEN IN RIGHT OF THE PROVINCE OF BRITISH COLUMBIA |
BARKERVILLE
GOLD MINES LTD. |
50.34 |
OGR
(5%) |
| 008-222-762 |
PD44700 |
6206/633,
5313/624 (U), 5763/628 (S) |
THE
CARIBOO GOLD QUARTZ MINING COMPANY LIMITED (NON-PERSONAL LIABILITY) |
WELLS
HISTORICAL SOCIETY |
BARKERVILLE
GOLD MINES LTD. |
0.23 |
OGR
(5%) |
| 013-699-288 |
PC17192 |
5448/625 |
THE
CARIBOO GOLD QUARTZ MINING COMPANY LIMITED (NON-PERSONAL LIABILITY) |
HER
MAJESTY THE QUEEN IN RIGHT OF THE PROVINCE OF BRITISH COLUMBIA |
BARKERVILLE
GOLD MINES LTD. |
9.78 |
OGR
(5%) |
| 015-193-845 |
U40887 |
5447/625 |
THE
CARIBOO GOLD QUARTZ MINING COMPANY LIMITED (NON-PERSONAL LIABILITY) |
HER
MAJESTY THE QUEEN IN RIGHT OF THE PROVINCE OF BRITISH COLUMBIA |
BARKERVILLE
GOLD MINES LTD. |
51.15 |
OGR
(5%) |
| 015-193-934 |
U40886 |
5446/625 |
THE
CARIBOO GOLD QUARTZ MINING COMPANY LIMITED (NON-PERSONAL LIABILITY) |
HER
MAJESTY THE QUEEN IN RIGHT OF THE PROVINCE OF BRITISH COLUMBIA |
BARKERVILLE
GOLD MINES LTD. |
44.89 |
OGR
(5%) |
| 015-193-942 |
U40885 |
5445/625 |
THE
CARIBOO GOLD QUARTZ MINING COMPANY LIMITED (NON-PERSONAL LIABILITY) |
HER
MAJESTY THE QUEEN IN RIGHT OF THE PROVINCE OF BRITISH COLUMBIA |
BARKERVILLE
GOLD MINES LTD. |
2.90 |
OGR
(5%) |
| |
Osisko Development Corp.
NI 43-101 Technical Report
Feasibility Study for the Cariboo Gold Project |
|
| PID |
Title
# |
CG
# |
Original
grantee |
Fee
simple owner |
UNDERSURFACE
OWNER |
Area
(Acres) |
Royalty |
| 015-193-951 |
U40884 |
5444/625 |
THE
CARIBOO GOLD QUARTZ MINING COMPANY LIMITED (NON-PERSONAL LIABILITY) |
HER
MAJESTY THE QUEEN IN RIGHT OF THE PROVINCE OF BRITISH COLUMBIA |
BARKERVILLE
GOLD MINES LTD. |
39.80 |
OGR
(5%) |
| 015-193-969 |
U40883 |
5443/625 |
THE
CARIBOO GOLD QUARTZ MINING COMPANY LIMITED (NON-PERSONAL LIABILITY) |
HER
MAJESTY THE QUEEN IN RIGHT OF THE PROVINCE OF BRITISH COLUMBIA |
BARKERVILLE
GOLD MINES LTD. |
34.46 |
OGR
(5%) |
| 015-193-977 |
U40882 |
5442/625 |
THE
CARIBOO GOLD QUARTZ MINING COMPANY LIMITED (NON-PERSONAL LIABILITY) |
HER
MAJESTY THE QUEEN IN RIGHT OF THE PROVINCE OF BRITISH COLUMBIA |
BARKERVILLE
GOLD MINES LTD. |
35.77 |
OGR
(5%) |
| 015-193-985 |
U40881 |
5441/625 |
THE
CARIBOO GOLD QUARTZ MINING COMPANY LIMITED (NON-PERSONAL LIABILITY) |
HER
MAJESTY THE QUEEN IN RIGHT OF THE PROVINCE OF BRITISH COLUMBIA |
BARKERVILLE
GOLD MINES LTD. |
44.59 |
OGR
(5%) |
| 015-194-027 |
U40880 |
5440/625 |
THE
CARIBOO GOLD QUARTZ MINING COMPANY LIMITED (NON-PERSONAL LIABILITY) |
HER
MAJESTY THE QUEEN IN RIGHT OF THE PROVINCE OF BRITISH COLUMBIA |
BARKERVILLE
GOLD MINES LTD. |
51.33 |
OGR
(5%) |
| 014-385-686 |
CA9850193 |
5439/625 |
THE
CARIBOO GOLD QUARTZ MINING COMPANY LIMITED (NON-PERSONAL LIABILITY) |
BARKERVILLE
GOLD MINES LTD. |
BARKERVILLE
GOLD MINES LTD. |
23.02 |
OGR
(5%) |
| 015-194-116 |
U40879 |
5438/625 |
THE
CARIBOO GOLD QUARTZ MINING COMPANY LIMITED (NON-PERSONAL LIABILITY) |
HER
MAJESTY THE QUEEN IN RIGHT OF THE PROVINCE OF BRITISH COLUMBIA |
BARKERVILLE
GOLD MINES LTD. |
34.34 |
OGR
(5%) |
| 015-194-141 |
U40875 |
5437/625 |
THE
CARIBOO GOLD QUARTZ MINING COMPANY LIMITED (NON-PERSONAL LIABILITY) |
HER
MAJESTY THE QUEEN IN RIGHT OF THE PROVINCE OF BRITISH COLUMBIA |
BARKERVILLE
GOLD MINES LTD. |
32.09 |
OGR
(5%) |
| 014-385-643 |
CA3322188 |
5436/625 |
THE
CARIBOO GOLD QUARTZ MINING COMPANY LIMITED (NON-PERSONAL LIABILITY) |
BARKERVILLE
GOLD MINES LTD. |
BARKERVILLE
GOLD MINES LTD. |
49.41 |
OGR
(5%) |
| 015-194-167 |
U40878 |
5435/625 |
THE
CARIBOO GOLD QUARTZ MINING COMPANY LIMITED (NON-PERSONAL LIABILITY) |
HER
MAJESTY THE QUEEN IN RIGHT OF THE PROVINCE OF BRITISH COLUMBIA |
BARKERVILLE
GOLD MINES LTD. |
51.65 |
OGR
(5%) |
| |
Osisko Development Corp.
NI 43-101 Technical Report
Feasibility Study for the Cariboo Gold Project |
|
| PID |
Title
# |
CG
# |
Original
grantee |
Fee
simple owner |
UNDERSURFACE
OWNER |
Area
(Acres) |
Royalty |
| 015-194-183 |
U40877 |
5434/625 |
THE
CARIBOO GOLD QUARTZ MINING COMPANY LIMITED (NON-PERSONAL LIABILITY) |
HER
MAJESTY THE QUEEN IN RIGHT OF THE PROVINCE OF BRITISH COLUMBIA |
BARKERVILLE
GOLD MINES LTD. |
22.05 |
OGR
(5%) |
| 016-292-987 |
PD30176 |
5433/625 |
THE
CARIBOO GOLD QUARTZ MINING COMPANY LIMITED (NON-PERSONAL LIABILITY) |
HER
MAJESTY THE QUEEN IN RIGHT OF THE PROVINCE OF BRITISH COLUMBIA |
BARKERVILLE
GOLD MINES LTD. |
0.12 |
OGR
(5%) |
| 015-282-155 |
15499M |
4883/719 |
THE
CARIBOO GOLD QUARTZ MINING COMPANY LIMITED (NON-PERSONAL LIABILITY) |
HER
MAJESTY THE QUEEN IN RIGHT OF THE PROVINCE OF BRITISH COLUMBIA |
BARKERVILLE
GOLD MINES LTD. |
0.56 |
OGR
(5%) |
| 013-724-509 |
PC18151 |
4882/719 |
THE
CARIBOO GOLD QUARTZ MINING COMPANY LIMITED (NON-PERSONAL LIABILITY) |
HER
MAJESTY THE QUEEN IN RIGHT OF THE PROVINCE OF BRITISH COLUMBIA |
BARKERVILLE
GOLD MINES LTD. |
0.30 |
OGR
(5%) |
| 015-282-147 |
15497M |
4881/719 |
THE
CARIBOO GOLD QUARTZ MINING COMPANY LIMITED (NON-PERSONAL LIABILITY) |
HER
MAJESTY THE QUEEN IN RIGHT OF THE PROVINCE OF BRITISH COLUMBIA |
BARKERVILLE
GOLD MINES LTD. |
0.17 |
OGR
(5%) |
| 015-282-104 |
15496M |
4880/719 |
THE
CARIBOO GOLD QUARTZ MINING COMPANY LIMITED (NON-PERSONAL LIABILITY) |
HER
MAJESTY THE QUEEN IN RIGHT OF THE PROVINCE OF BRITISH COLUMBIA C/O MINISTER RESPONSIBLE FOR THE HERITAGE CONSERVATION ACT |
BARKERVILLE
GOLD MINES LTD. |
0.23 |
OGR
(5%) |
| 015-282-082 |
15495M |
4879/719 |
THE
CARIBOO GOLD QUARTZ MINING COMPANY LIMITED (NON-PERSONAL LIABILITY) |
HER
MAJESTY THE QUEEN IN RIGHT OF THE PROVINCE OF BRITISH COLUMBIA C/O MINISTER RESPONSIBLE FOR THE HERITAGE CONSERVATION ACT |
BARKERVILLE
GOLD MINES LTD. |
4.91 |
OGR
(5%) |
| 015-282-074 |
15494M |
4878/719 |
THE
CARIBOO GOLD QUARTZ MINING COMPANY LIMITED (NON-PERSONAL LIABILITY) |
HER
MAJESTY THE QUEEN IN RIGHT OF THE PROVINCE OF BRITISH COLUMBIA |
BARKERVILLE
GOLD MINES LTD. |
0.05 |
OGR
(5%) |
| 015-289-800 |
W21851 |
211/673 |
THE
CARIBOO GOLD QUARTZ MINING COMPANY LIMITED (NON-PERSONAL LIABILITY) |
HER
MAJESTY THE QUEEN IN RIGHT OF THE PROVINCE OF BRITISH COLUMBIA |
BARKERVILLE
GOLD MINES LTD. |
16.49 |
OGR
(5%) |
| 014-385-741 |
CA3322182 |
535/92 |
THE
ORIOLE SYNDICATE LIMITED |
BARKERVILLE
GOLD MINES LTD. |
BARKERVILLE
GOLD MINES LTD. |
42.42 |
OGR
(5%) |
| 015-307-654 |
PC58844 |
2088/130 |
THE
ORIOLE SYNDICATE LIMITED |
HER
MAJESTY THE QUEEN IN RIGHT OF THE PROVINCE OF BRITISH COLUMBIA |
BARKERVILLE
GOLD MINES LTD. |
29.87 |
OGR
(5%) |
| |
Osisko Development Corp.
NI 43-101 Technical Report
Feasibility Study for the Cariboo Gold Project |
|
| PID |
Title
# |
CG
# |
Original
grantee |
Fee
simple owner |
UNDERSURFACE
OWNER |
Area
(Acres) |
Royalty |
| 015-307-662 |
PC58845 |
2087/130 |
THE
ORIOLE SYNDICATE LIMITED |
HER
MAJESTY THE QUEEN IN RIGHT OF THE PROVINCE OF BRITISH COLUMBIA |
BARKERVILLE
GOLD MINES LTD. |
47.59 |
OGR
(5%) |
| 015-307-603 |
PC58843 |
2085/130 |
THE
ORIOLE SYNDICATE LIMITED |
HER
MAJESTY THE QUEEN IN RIGHT OF THE PROVINCE OF BRITISH COLUMBIA |
BARKERVILLE
GOLD MINES LTD. |
49.63 |
OGR
(5%) |
| 015-291-448 |
12078M |
384/674 |
THOMAS
ALBERT BLAIR |
HER
MAJESTY THE QUEEN IN RIGHT OF THE PROVINCE OF BRITISH COLUMBIA C/O MINISTER RESPONSIBLE FOR THE HERITAGE CONSERVATION ACT |
BARKERVILLE
GOLD MINES LTD. |
37.21 |
OGR
(5%) |
| 004-056-787 |
CA4347919 |
4B/35 |
UNKNOWN
(PRE-TANTALIS) |
BARKERVILLE
GOLD MINES LTD. |
BARKERVILLE
GOLD MINES LTD. |
10.00 |
OGR
(5%) |
| 004-056-582 |
BB1960681 |
41F/34 |
UNKNOWN
(PRE-TANTALIS) |
BARKERVILLE
GOLD MINES LTD. |
BARKERVILLE
GOLD MINES LTD. |
13.81 |
OGR
(5%), Franco Nevada (3%) |
| 004-086-627 |
CA9850166 |
2B/35 |
UNKNOWN
(PRE-TANTALIS) |
BARKERVILLE
GOLD MINES LTD. |
NONE
ON TITLE (UNDERSURFACE RIGHTS GRANTED GMA 1873) |
23.00 |
|
| 004-056-736 |
CA6623292 |
1B/35 |
UNKNOWN
(PRE-TANTALIS) |
BARKERVILLE
GOLD MINES LTD. |
BARKERVILLE
GOLD MINES LTD. |
12.00 |
OGR
(5%) |
| 007-794-037 |
CA3322178 |
2460/595 |
WAYSIDE
CONSOLOIDATED GOLD MINES (NON-PERSONAL LIABILITY) |
BARKERVILLE
GOLD MINES LTD. & AMAZON PETROLEUM CORP. |
NONE |
33.73 |
|
| 007-794-029 |
CA3322177 |
1245/583
(U), 6228/633(S) |
WAYSIDE
CONSOLOIDATED GOLD MINES (NON-PERSONAL LIABILITY) |
BARKERVILLE
GOLD MINES LTD. & AMAZON PETROLEUM CORP. |
NONE |
51.65 |
|
| 015-329-437 |
PD39 |
6295/633 |
WILLIAM
A. SIMKINS |
HER
MAJESTY THE QUEEN IN RIGHT OF THE PROVINCE OF BRITISH COLUMBIA |
BARKERVILLE
GOLD MINES LTD. |
51.16 |
OGR
(5%), Franco Nevada (3%) |
| 015-329-411 |
PD38 |
6294/633 |
WILLIAM
A. SIMKINS |
HER
MAJESTY THE QUEEN IN RIGHT OF THE PROVINCE OF BRITISH COLUMBIA |
BARKERVILLE
GOLD MINES LTD. |
0.50 |
OGR
(5%), Franco Nevada (3%) |
| 015-329-402 |
PD37 |
6293/633 |
WILLIAM
A. SIMKINS |
HER
MAJESTY THE QUEEN IN RIGHT OF THE PROVINCE OF BRITISH COLUMBIA |
BARKERVILLE
GOLD MINES LTD. |
22.40 |
OGR
(5%), Franco Nevada (3%) |
| 015-329-399 |
PD36 |
6292/633 |
WILLIAM
A. SIMKINS |
HER
MAJESTY THE QUEEN IN RIGHT OF THE PROVINCE OF BRITISH COLUMBIA |
BARKERVILLE
GOLD MINES LTD. |
25.07 |
OGR
(5%), Franco Nevada (3%) |
| |
Osisko Development Corp.
NI 43-101 Technical Report
Feasibility Study for the Cariboo Gold Project |
|
| PID |
Title
# |
CG
# |
Original
grantee |
Fee
simple owner |
UNDERSURFACE
OWNER |
Area
(Acres) |
Royalty |
| 015-329-381 |
PD35 |
6291/633 |
WILLIAM
A. SIMKINS |
HER
MAJESTY THE QUEEN IN RIGHT OF THE PROVINCE OF BRITISH COLUMBIA |
BARKERVILLE
GOLD MINES LTD. |
18.93 |
OGR
(5%), Franco Nevada (3%) |
| 015-329-372 |
PD34 |
6290/633 |
WILLIAM
A. SIMKINS |
HER
MAJESTY THE QUEEN IN RIGHT OF THE PROVINCE OF BRITISH COLUMBIA |
BARKERVILLE
GOLD MINES LTD. |
39.78 |
OGR
(5%), Franco Nevada (3%) |
| 015-329-356 |
PD33 |
6289/633 |
WILLIAM
A. SIMKINS |
HER
MAJESTY THE QUEEN IN RIGHT OF THE PROVINCE OF BRITISH COLUMBIA |
BARKERVILLE
GOLD MINES LTD. |
11.32 |
OGR
(5%), Franco Nevada (3%) |
| 015-329-330 |
PD32 |
6288/633 |
WILLIAM
A. SIMKINS |
HER
MAJESTY THE QUEEN IN RIGHT OF THE PROVINCE OF BRITISH COLUMBIA |
BARKERVILLE
GOLD MINES LTD. |
51.52 |
OGR
(5%), Franco Nevada (3%) |
| 015-329-313 |
PD31 |
6287/633 |
WILLIAM
A. SIMKINS |
HER
MAJESTY THE QUEEN IN RIGHT OF THE PROVINCE OF BRITISH COLUMBIA |
BARKERVILLE
GOLD MINES LTD. |
51.65 |
OGR
(5%), Franco Nevada (3%) |
| 004-078-543 |
CA3322186 |
2F/34 |
WILLIAM
ANDREW MEACHAM AND ITHIEL BLAKE MASON |
BARKERVILLE
GOLD MINES LTD. |
BARKERVILLE
GOLD MINES LTD. |
25.26 |
OGR
(5%) |
| 004-078-578 |
CA9850168 |
17F/34 |
WILLIAM
BOSWELL STEELE, THOMAS BELL, ANGELO PENDOLA, PETER MANETTA, JOSEPH HUOT DE ST. LAURENT, WILLIAM H. THOMPSON, OLIVIER D'ARPENTIGNY,
NICOLAS CUNIO, JAMES BOYCE, JOHN MCLEAN, ANGUS MCPHERSON AND ISAAC BIRCH FISHER |
BARKERVILLE
GOLD MINES LTD. & GOLDEN CARIBOO RESOURCES LTD. |
NONE
ON TITLE (UNDERSURFACE RIGHTS GRANTED GMA 1873) |
125.00 |
|
| 004-087-097 |
PT5235,
PC16248 |
38F/34 |
WILLIAM
SAUDERS AND EDWARD COLLINS NEUFELDER |
BARKERVILLE
GOLD MINES LTD. |
BARKERVILLE
GOLD MINES LTD. |
3.18 |
OGR
(5%) |
| 013-614-959 |
24187M |
213/673
(U), 2882/799 (S) |
WILLIAMS
CREEK GOLD QUARTZ MINING COMPANY LIMITED (NON-PERSONAL LIABILITY) |
WILLIAMS
CREEK GOLD QUARTZ MINING CO. LIMITED (FORFEITED TO CROWN L35148) |
BARKERVILLE
GOLD MINES LTD. |
25.99 |
OGR
(5%) |