Our Compensation Committee approves and administers our executive compensation program, which it designs to attract, incentivize, reward, and retain our executive officers. Our program aligns executive pay with stockholder interests and links pay to performance through a blend of short-term and long-term performance measures. As required by Section 953(a) of the Dodd-Frank Act, and Item 402(v) of Regulation S-K, we are providing the following information about the relationship between the "Compensation Actually Paid" to our named executive officers and certain aspects of our financial performance. For further information regarding our executive compensation program, our compensation philosophy, and how the Company aligns executive compensation with performance, please refer to the "Compensation Discussion and Analysis" beginning on page 17. The 2024 compensation and financial information reflects figures following the Closing, whereas all prior years reflect pre-combination compensation and financial information for Former TechTarget.
Pay-Versus-Performance Table |
|
||||||||||||||||||||||||||||||
|
|
|
|
|
|
|
|
|
|
|
|
|
|
Value of Initial Fixed $100 Investment Based On: |
|
|
|
|
|
||||||||||||
Year |
|
Summary Compen-sation Table Total for First PEO |
|
Summary Compen-sation Table Total for Second PEO |
|
Compen-sation Actually Paid to First PEO |
|
Compen-sation Actually Paid to Second PEO |
|
Average Summary Compen-sation Table Total for Non-PEO Named Executive Officers |
|
Average Compen-sation Actually Paid to Non-PEO Named Executive Officers |
|
Total Stock-holder Return |
|
Peer Group Total Stock-holder Return |
|
Net Income |
|
Company-Selected Measure (Revenue) |
|
||||||||||
(a) |
|
(b) |
|
(b) |
|
(c) |
|
(c) |
|
(d) |
|
(e) |
|
(f) |
|
(g) |
|
(h) |
|
(i) |
|
||||||||||
2024 |
|
|
3,309,863 |
|
|
871,293 |
|
|
2,128,063 |
|
|
871,293 |
|
|
3,092,951 |
|
|
2,703,612 |
|
|
76 |
|
|
82 |
|
|
(151,336,000 |
) |
|
492,180,000 |
|
2023 |
|
|
1,989,300 |
|
N/A |
|
|
(449,438 |
) |
N/A |
|
|
2,629,398 |
|
|
1,507,369 |
|
|
134 |
|
|
90 |
|
|
4,461,000 |
|
|
229,963,000 |
|
||
2022 |
|
|
10,645,438 |
|
N/A |
|
|
379,378 |
|
N/A |
|
|
3,207,079 |
|
|
1,315,373 |
|
|
169 |
|
|
77 |
|
|
41,609,000 |
|
|
297,488,000 |
|
||
2021 |
|
|
10,534,913 |
|
N/A |
|
|
17,835,652 |
|
N/A |
|
|
5,844,045 |
|
|
6,474,584 |
|
|
367 |
|
|
112 |
|
|
949,000 |
|
|
263,427,000 |
|
||
2020 |
|
|
6,485,932 |
|
N/A |
|
|
16,571,387 |
|
N/A |
|
|
1,335,313 |
|
|
3,463,405 |
|
|
226 |
|
|
113 |
|
|
17,068,000 |
|
|
148,376,000 |
|
||
Mr. Cotoia (First PEO)
Year |
|
Reported |
|
|
Less Reported Grant Date Fair Value of Equity Awards in Summary Compensation |
|
|
Plus (Less) Equity |
|
|
Average Compensation Actually Paid to PEO($) |
|
||||
2024 |
|
|
3,309,863 |
|
|
— |
|
|
|
(1,181,800 |
) |
|
|
2,128,063 |
|
|
2023 |
|
|
1,989,300 |
|
|
|
1,374,300 |
|
|
|
(1,064,438 |
) |
|
|
(449,438 |
) |
2022 |
|
|
10,645,438 |
|
|
|
9,841,938 |
|
|
|
(424,122 |
) |
|
|
379,378 |
|
2021 |
|
|
10,534,913 |
|
|
|
9,731,413 |
|
|
|
17,032,152 |
|
|
|
17,835,652 |
|
2020 |
|
|
6,485,932 |
|
|
|
5,725,932 |
|
|
|
15,811,387 |
|
|
|
16,571,387 |
|
Mr. Nugent (Second PEO)
Year |
|
Reported |
|
|
Less Reported Grant Date Fair Value of Equity Awards in Summary Compensation |
|
Plus (Less) Equity |
|
Average Compensation Actually Paid to PEO($) |
|
||
2024 |
|
|
871,293 |
|
|
— |
|
— |
|
|
871,293 |
|
2023 |
|
N/A |
|
|
N/A |
|
N/A |
|
N/A |
|
||
2022 |
|
N/A |
|
|
N/A |
|
N/A |
|
N/A |
|
||
2021 |
|
N/A |
|
|
N/A |
|
N/A |
|
N/A |
|
||
2020 |
|
N/A |
|
|
N/A |
|
N/A |
|
N/A |
|
||
(a) The reported grant date fair value of equity awards represents the total of the amounts reported in the "Stock Awards" columns in the Summary Compensation Table for each covered fiscal year including bonus amounts earned in excess of target that were paid in common stock.
(b) The equity award adjustments for each covered fiscal year include the addition (or subtraction, as applicable) of the following: (i) the year-end fair value of all equity awards granted during the covered fiscal year that are outstanding and unvested as of the end of the covered fiscal year; (ii) the amount equal to the change as of the end of the covered fiscal year (from the end of the prior fiscal year) in fair value of any equity awards granted in any prior fiscal year that are outstanding and unvested as of the end of the covered fiscal year; (iii) for equity awards that are granted and vest in the same covered fiscal year, the fair value as
of the vesting date; (iv) for equity awards granted in any prior fiscal year for which all applicable vesting conditions were satisfied at the end of or during the covered fiscal year, the amount equal to the change as of the vesting date (from the end of the prior fiscal year) in fair value; (v) for equity awards granted in any prior fiscal year that fail to meet the applicable vesting conditions during the covered fiscal year, the amount equal to the fair value at the end of the prior fiscal year; and (vi) the dollar value of any dividends or other earnings paid on stock or option awards in the covered fiscal year prior to the vesting date that are not otherwise included in the total compensation for the covered fiscal year. The amounts deducted or added in calculating the equity award adjustments are as follows:
Mr. Cotoia (First PEO)
Year |
|
Year End Fair Value of All Outstanding and Unvested Equity Awards Granted during Covered Fiscal Year as of End of Covered Fiscal Year($) |
|
|
Year over Year Change in Fair Value of Any Outstanding and Unvested Equity Awards Granted in Any Prior Fiscal Year as of End of Covered Fiscal Year($) |
|
|
Fair Value as of Vesting Date of Equity Awards Granted and Vested in Same Covered Fiscal Year($) |
|
|
Year over Year Change in Fair Value of Outstanding and Unvested Equity Awards Granted in Any Prior Fiscal Year that Vested in Covered Fiscal Year($) |
|
|
Fair Value at End of Prior Fiscal Year of Outstand- |
|
|
Dollar Value of Dividends or other Earnings Paid on Stock or Option Awards in Covered Fiscal Year Prior to Vesting Date Not Otherwise Included in Total Compensation for Covered Fiscal Year($) |
|
|
Total |
|
|||||||
2024 |
|
|
0 |
|
|
|
0 |
|
|
|
0 |
|
|
|
(1,181,800 |
) |
|
|
0 |
|
|
|
0 |
|
|
|
(1,181,800 |
) |
2023 |
|
|
1,568,700 |
|
|
|
(1,196,000 |
) |
|
|
63,462 |
|
|
|
(1,500,600 |
) |
|
|
0 |
|
|
|
0 |
|
|
|
(1,064,438 |
) |
2022 |
|
|
6,609,000 |
|
|
|
(5,676,000 |
) |
|
|
3,154,228 |
|
|
|
(4,511,350 |
) |
|
|
0 |
|
|
|
0 |
|
|
|
(424,122 |
) |
2021 |
|
|
8,609,400 |
|
|
|
6,396,250 |
|
|
|
282,502 |
|
|
|
1,744,000 |
|
|
|
0 |
|
|
|
0 |
|
|
|
17,032,152 |
|
2020 |
|
|
8,866,500 |
|
|
|
4,951,500 |
|
|
|
651,137 |
|
|
|
1,342,250 |
|
|
|
0 |
|
|
|
0 |
|
|
|
15,811,387 |
|
Mr. Nugent (Second PEO)
Year |
|
Year End Fair Value of All Outstanding and Unvested Equity Awards Granted during Covered Fiscal Year as of End of Covered Fiscal Year($) |
|
|
Year over Year Change in Fair Value of Any Outstanding and Unvested Equity Awards Granted in Any Prior Fiscal Year as of End of Covered Fiscal Year($) |
|
|
Fair Value as of Vesting Date of Equity Awards Granted and Vested in Same Covered Fiscal Year($) |
|
|
Year over Year Change in Fair Value of Outstanding and Unvested Equity Awards Granted in Any Prior Fiscal Year that Vested in Covered Fiscal Year($) |
|
|
Fair Value at End of Prior Fiscal Year of Outstand- |
|
|
Dollar Value of Dividends or other Earnings Paid on Stock or Option Awards in Covered Fiscal Year Prior to Vesting Date Not Otherwise Included in Total Compensation for Covered Fiscal Year($) |
|
|
Total |
|
|||||||
2024 |
|
|
0 |
|
|
|
0 |
|
|
|
0 |
|
|
|
0 |
|
|
|
0 |
|
|
|
0 |
|
|
|
0 |
|
2023 |
|
N/A |
|
|
N/A |
|
|
N/A |
|
|
N/A |
|
|
N/A |
|
|
N/A |
|
|
N/A |
|
|||||||
2022 |
|
N/A |
|
|
N/A |
|
|
N/A |
|
|
N/A |
|
|
N/A |
|
|
N/A |
|
|
N/A |
|
|||||||
2021 |
|
N/A |
|
|
N/A |
|
|
N/A |
|
|
N/A |
|
|
N/A |
|
|
N/A |
|
|
N/A |
|
|||||||
2020 |
|
N/A |
|
|
N/A |
|
|
N/A |
|
|
N/A |
|
|
N/A |
|
|
N/A |
|
|
N/A |
|
|||||||
Equity Award Valuations - PEO: Time-based RSU award grant date fair values are calculated using the stock price as of date of grant. The valuation assumptions used to calculate the fair values of the time-based RSU awards held by our PEOs that vested during or were outstanding as of the end of each covered fiscal year have been adjusted using the stock price as of each vesting date and as of year-end.
Year |
|
|
Average Reported Summary Compensation Table Total for Non-PEO Named Executive Officers($) |
|
|
Less Average Reported Grant Date Fair Value of Equity Awards in Summary Compensation Table(a)($) |
|
|
Plus Equity Award Adjust-ments |
|
|
Average Compensation Actually Paid to Non-PEO Named Executive Officers($) |
|
|||||
2024 |
|
|
|
3,092,951 |
|
|
|
1,181,426 |
|
|
|
792,087 |
|
|
|
2,703,612 |
|
|
|
2023 |
|
|
|
2,629,398 |
|
|
|
2,192,398 |
|
|
|
1,070,369 |
|
|
|
1,507,369 |
|
|
2022 |
|
|
|
3,207,079 |
|
|
|
2,646,246 |
|
|
|
754,540 |
|
|
|
1,315,373 |
|
|
2021 |
|
|
|
5,844,045 |
|
|
|
5,283,212 |
|
|
|
5,913,751 |
|
|
|
6,474,584 |
|
|
2020 |
|
|
|
1,335,313 |
|
|
|
788,979 |
|
|
|
2,917,072 |
|
|
|
3,463,405 |
|
(a) The reported grant date fair value of equity awards represents the total of the amounts reported in the "Stock Awards" column in the Summary Compensation Table for each covered fiscal year including bonus amounts earned in excess of target that were paid in equity which is fully vested upon grant.
(b) The equity award adjustments for each covered fiscal year include the addition (or subtraction, as applicable) of the following: (i) the average year-end fair value of all equity awards granted during the covered fiscal year that are outstanding and unvested as of the end of the covered fiscal year; (ii) the amount equal to the average change as of the end of the covered fiscal year (from the end of the prior fiscal year) in fair value of any equity awards granted in any prior fiscal year that are outstanding and unvested as of the end of the covered fiscal year; (iii) for equity awards that are granted and vest in same covered fiscal year, the average fair value as of the vesting date; (iv) for equity awards granted in prior fiscal years for which all applicable vesting conditions were satisfied at the end of or during the covered fiscal year, the amount equal to the average change as of the vesting date (from the end of the prior fiscal year) in fair value; (v) for equity awards that are granted in any prior fiscal year that fail to meet the applicable vesting conditions during the covered fiscal year, the amount equal to the average fair value at the end of the prior fiscal year; and (vi) the average dollar value of any dividends or other earnings paid on stock or option awards in the covered fiscal year prior to the vesting date that are not otherwise included in the total compensation for the covered fiscal year. The amounts deducted or added in calculating the equity award adjustments are as follows:
Year |
|
|
Average Year End Fair Value of All Outstanding and Unvested Equity Awards Granted in Covered Fiscal Year as of End of Covered Fiscal Year($) |
|
|
Year over Year Average Change in Fair Value of Outstanding and Unvested Equity Awards Granted during Prior Fiscal Year as of End of Covered Fiscal Year($) |
|
|
Average Fair Value as of Vesting Date of Equity Awards Granted and Vested in Same Covered Fiscal Year($) |
|
|
Year over Year Average Change in Fair Value of Outstanding and Unvested Equity Awards Granted in Prior Fiscal Years that Vested in Covered Fiscal Year($) |
|
|
Average Fair Value at End of Prior Fiscal Year of Outstanding and Unvested Equity Awards Granted in Prior Fiscal Years that Failed to Meet Vesting Conditions during Covered Fiscal Year($) |
|
|
Dollar Value of Dividends or other Earnings Paid on Stock or Option Awards in Covered Fiscal Year Prior to Vesting Date Not Otherwise Included in Total Compensation for Covered Fiscal Year ($) |
|
|
Total Average Equity Award Adjust-ments($) |
|
||||||||
2024 |
|
|
|
1,346,753 |
|
|
0 |
|
|
|
6,818 |
|
|
|
(561,484 |
) |
|
0 |
|
|
0 |
|
|
|
792,087 |
|
||||
|
2023 |
|
|
|
1,843,223 |
|
|
|
(381,800 |
) |
|
|
32,831 |
|
|
|
(423,885 |
) |
|
|
0 |
|
|
|
0 |
|
|
|
1,070,369 |
|
|
2022 |
|
|
|
1,762,400 |
|
|
|
(1,874,800 |
) |
|
|
1,921,560 |
|
|
|
(1,054,620 |
) |
|
|
0 |
|
|
|
0 |
|
|
|
754,540 |
|
|
2021 |
|
|
|
4,400,360 |
|
|
|
962,483 |
|
|
|
172,111 |
|
|
|
378,797 |
|
|
|
0 |
|
|
|
0 |
|
|
|
5,913,751 |
|
|
2020 |
|
|
|
1,004,870 |
|
|
|
1,210,367 |
|
|
|
396,675 |
|
|
|
305,160 |
|
|
|
0 |
|
|
|
0 |
|
|
|
2,917,072 |
|
Equity Award Valuations - Non-PEO NEOs: Time-based RSU award grant date fair values are calculated using the stock price as of date of grant. The valuation assumptions used to calculate the fair values of the time-based RSU awards held by the other NEOs as a group (excluding Mr. Cotoia (for 2024, 2023, 2022, 2021, and 2020) and Mr. Nugent (for 2024)) that vested during or were outstanding as of the end of each covered fiscal year have been adjusted using the stock price as of each vesting date and as of year-end.
Mr. Cotoia (First PEO)
Year |
|
Reported |
|
|
Less Reported Grant Date Fair Value of Equity Awards in Summary Compensation |
|
|
Plus (Less) Equity |
|
|
Average Compensation Actually Paid to PEO($) |
|
||||
2024 |
|
|
3,309,863 |
|
|
— |
|
|
|
(1,181,800 |
) |
|
|
2,128,063 |
|
|
2023 |
|
|
1,989,300 |
|
|
|
1,374,300 |
|
|
|
(1,064,438 |
) |
|
|
(449,438 |
) |
2022 |
|
|
10,645,438 |
|
|
|
9,841,938 |
|
|
|
(424,122 |
) |
|
|
379,378 |
|
2021 |
|
|
10,534,913 |
|
|
|
9,731,413 |
|
|
|
17,032,152 |
|
|
|
17,835,652 |
|
2020 |
|
|
6,485,932 |
|
|
|
5,725,932 |
|
|
|
15,811,387 |
|
|
|
16,571,387 |
|
Mr. Nugent (Second PEO)
Year |
|
Reported |
|
|
Less Reported Grant Date Fair Value of Equity Awards in Summary Compensation |
|
Plus (Less) Equity |
|
Average Compensation Actually Paid to PEO($) |
|
||
2024 |
|
|
871,293 |
|
|
— |
|
— |
|
|
871,293 |
|
2023 |
|
N/A |
|
|
N/A |
|
N/A |
|
N/A |
|
||
2022 |
|
N/A |
|
|
N/A |
|
N/A |
|
N/A |
|
||
2021 |
|
N/A |
|
|
N/A |
|
N/A |
|
N/A |
|
||
2020 |
|
N/A |
|
|
N/A |
|
N/A |
|
N/A |
|
||
(a) The reported grant date fair value of equity awards represents the total of the amounts reported in the "Stock Awards" columns in the Summary Compensation Table for each covered fiscal year including bonus amounts earned in excess of target that were paid in common stock.
(b) The equity award adjustments for each covered fiscal year include the addition (or subtraction, as applicable) of the following: (i) the year-end fair value of all equity awards granted during the covered fiscal year that are outstanding and unvested as of the end of the covered fiscal year; (ii) the amount equal to the change as of the end of the covered fiscal year (from the end of the prior fiscal year) in fair value of any equity awards granted in any prior fiscal year that are outstanding and unvested as of the end of the covered fiscal year; (iii) for equity awards that are granted and vest in the same covered fiscal year, the fair value as
of the vesting date; (iv) for equity awards granted in any prior fiscal year for which all applicable vesting conditions were satisfied at the end of or during the covered fiscal year, the amount equal to the change as of the vesting date (from the end of the prior fiscal year) in fair value; (v) for equity awards granted in any prior fiscal year that fail to meet the applicable vesting conditions during the covered fiscal year, the amount equal to the fair value at the end of the prior fiscal year; and (vi) the dollar value of any dividends or other earnings paid on stock or option awards in the covered fiscal year prior to the vesting date that are not otherwise included in the total compensation for the covered fiscal year. The amounts deducted or added in calculating the equity award adjustments are as follows:
Mr. Cotoia (First PEO)
Year |
|
Year End Fair Value of All Outstanding and Unvested Equity Awards Granted during Covered Fiscal Year as of End of Covered Fiscal Year($) |
|
|
Year over Year Change in Fair Value of Any Outstanding and Unvested Equity Awards Granted in Any Prior Fiscal Year as of End of Covered Fiscal Year($) |
|
|
Fair Value as of Vesting Date of Equity Awards Granted and Vested in Same Covered Fiscal Year($) |
|
|
Year over Year Change in Fair Value of Outstanding and Unvested Equity Awards Granted in Any Prior Fiscal Year that Vested in Covered Fiscal Year($) |
|
|
Fair Value at End of Prior Fiscal Year of Outstand- |
|
|
Dollar Value of Dividends or other Earnings Paid on Stock or Option Awards in Covered Fiscal Year Prior to Vesting Date Not Otherwise Included in Total Compensation for Covered Fiscal Year($) |
|
|
Total |
|
|||||||
2024 |
|
|
0 |
|
|
|
0 |
|
|
|
0 |
|
|
|
(1,181,800 |
) |
|
|
0 |
|
|
|
0 |
|
|
|
(1,181,800 |
) |
2023 |
|
|
1,568,700 |
|
|
|
(1,196,000 |
) |
|
|
63,462 |
|
|
|
(1,500,600 |
) |
|
|
0 |
|
|
|
0 |
|
|
|
(1,064,438 |
) |
2022 |
|
|
6,609,000 |
|
|
|
(5,676,000 |
) |
|
|
3,154,228 |
|
|
|
(4,511,350 |
) |
|
|
0 |
|
|
|
0 |
|
|
|
(424,122 |
) |
2021 |
|
|
8,609,400 |
|
|
|
6,396,250 |
|
|
|
282,502 |
|
|
|
1,744,000 |
|
|
|
0 |
|
|
|
0 |
|
|
|
17,032,152 |
|
2020 |
|
|
8,866,500 |
|
|
|
4,951,500 |
|
|
|
651,137 |
|
|
|
1,342,250 |
|
|
|
0 |
|
|
|
0 |
|
|
|
15,811,387 |
|
Mr. Nugent (Second PEO)
Year |
|
Year End Fair Value of All Outstanding and Unvested Equity Awards Granted during Covered Fiscal Year as of End of Covered Fiscal Year($) |
|
|
Year over Year Change in Fair Value of Any Outstanding and Unvested Equity Awards Granted in Any Prior Fiscal Year as of End of Covered Fiscal Year($) |
|
|
Fair Value as of Vesting Date of Equity Awards Granted and Vested in Same Covered Fiscal Year($) |
|
|
Year over Year Change in Fair Value of Outstanding and Unvested Equity Awards Granted in Any Prior Fiscal Year that Vested in Covered Fiscal Year($) |
|
|
Fair Value at End of Prior Fiscal Year of Outstand- |
|
|
Dollar Value of Dividends or other Earnings Paid on Stock or Option Awards in Covered Fiscal Year Prior to Vesting Date Not Otherwise Included in Total Compensation for Covered Fiscal Year($) |
|
|
Total |
|
|||||||
2024 |
|
|
0 |
|
|
|
0 |
|
|
|
0 |
|
|
|
0 |
|
|
|
0 |
|
|
|
0 |
|
|
|
0 |
|
2023 |
|
N/A |
|
|
N/A |
|
|
N/A |
|
|
N/A |
|
|
N/A |
|
|
N/A |
|
|
N/A |
|
|||||||
2022 |
|
N/A |
|
|
N/A |
|
|
N/A |
|
|
N/A |
|
|
N/A |
|
|
N/A |
|
|
N/A |
|
|||||||
2021 |
|
N/A |
|
|
N/A |
|
|
N/A |
|
|
N/A |
|
|
N/A |
|
|
N/A |
|
|
N/A |
|
|||||||
2020 |
|
N/A |
|
|
N/A |
|
|
N/A |
|
|
N/A |
|
|
N/A |
|
|
N/A |
|
|
N/A |
|
|||||||
Year |
|
|
Average Reported Summary Compensation Table Total for Non-PEO Named Executive Officers($) |
|
|
Less Average Reported Grant Date Fair Value of Equity Awards in Summary Compensation Table(a)($) |
|
|
Plus Equity Award Adjust-ments |
|
|
Average Compensation Actually Paid to Non-PEO Named Executive Officers($) |
|
|||||
2024 |
|
|
|
3,092,951 |
|
|
|
1,181,426 |
|
|
|
792,087 |
|
|
|
2,703,612 |
|
|
|
2023 |
|
|
|
2,629,398 |
|
|
|
2,192,398 |
|
|
|
1,070,369 |
|
|
|
1,507,369 |
|
|
2022 |
|
|
|
3,207,079 |
|
|
|
2,646,246 |
|
|
|
754,540 |
|
|
|
1,315,373 |
|
|
2021 |
|
|
|
5,844,045 |
|
|
|
5,283,212 |
|
|
|
5,913,751 |
|
|
|
6,474,584 |
|
|
2020 |
|
|
|
1,335,313 |
|
|
|
788,979 |
|
|
|
2,917,072 |
|
|
|
3,463,405 |
|
(a) The reported grant date fair value of equity awards represents the total of the amounts reported in the "Stock Awards" column in the Summary Compensation Table for each covered fiscal year including bonus amounts earned in excess of target that were paid in equity which is fully vested upon grant.
(b) The equity award adjustments for each covered fiscal year include the addition (or subtraction, as applicable) of the following: (i) the average year-end fair value of all equity awards granted during the covered fiscal year that are outstanding and unvested as of the end of the covered fiscal year; (ii) the amount equal to the average change as of the end of the covered fiscal year (from the end of the prior fiscal year) in fair value of any equity awards granted in any prior fiscal year that are outstanding and unvested as of the end of the covered fiscal year; (iii) for equity awards that are granted and vest in same covered fiscal year, the average fair value as of the vesting date; (iv) for equity awards granted in prior fiscal years for which all applicable vesting conditions were satisfied at the end of or during the covered fiscal year, the amount equal to the average change as of the vesting date (from the end of the prior fiscal year) in fair value; (v) for equity awards that are granted in any prior fiscal year that fail to meet the applicable vesting conditions during the covered fiscal year, the amount equal to the average fair value at the end of the prior fiscal year; and (vi) the average dollar value of any dividends or other earnings paid on stock or option awards in the covered fiscal year prior to the vesting date that are not otherwise included in the total compensation for the covered fiscal year. The amounts deducted or added in calculating the equity award adjustments are as follows:
Year |
|
|
Average Year End Fair Value of All Outstanding and Unvested Equity Awards Granted in Covered Fiscal Year as of End of Covered Fiscal Year($) |
|
|
Year over Year Average Change in Fair Value of Outstanding and Unvested Equity Awards Granted during Prior Fiscal Year as of End of Covered Fiscal Year($) |
|
|
Average Fair Value as of Vesting Date of Equity Awards Granted and Vested in Same Covered Fiscal Year($) |
|
|
Year over Year Average Change in Fair Value of Outstanding and Unvested Equity Awards Granted in Prior Fiscal Years that Vested in Covered Fiscal Year($) |
|
|
Average Fair Value at End of Prior Fiscal Year of Outstanding and Unvested Equity Awards Granted in Prior Fiscal Years that Failed to Meet Vesting Conditions during Covered Fiscal Year($) |
|
|
Dollar Value of Dividends or other Earnings Paid on Stock or Option Awards in Covered Fiscal Year Prior to Vesting Date Not Otherwise Included in Total Compensation for Covered Fiscal Year ($) |
|
|
Total Average Equity Award Adjust-ments($) |
|
||||||||
2024 |
|
|
|
1,346,753 |
|
|
0 |
|
|
|
6,818 |
|
|
|
(561,484 |
) |
|
0 |
|
|
0 |
|
|
|
792,087 |
|
||||
|
2023 |
|
|
|
1,843,223 |
|
|
|
(381,800 |
) |
|
|
32,831 |
|
|
|
(423,885 |
) |
|
|
0 |
|
|
|
0 |
|
|
|
1,070,369 |
|
|
2022 |
|
|
|
1,762,400 |
|
|
|
(1,874,800 |
) |
|
|
1,921,560 |
|
|
|
(1,054,620 |
) |
|
|
0 |
|
|
|
0 |
|
|
|
754,540 |
|
|
2021 |
|
|
|
4,400,360 |
|
|
|
962,483 |
|
|
|
172,111 |
|
|
|
378,797 |
|
|
|
0 |
|
|
|
0 |
|
|
|
5,913,751 |
|
|
2020 |
|
|
|
1,004,870 |
|
|
|
1,210,367 |
|
|
|
396,675 |
|
|
|
305,160 |
|
|
|
0 |
|
|
|
0 |
|
|
|
2,917,072 |
|
Equity Award Valuations - PEO: Time-based RSU award grant date fair values are calculated using the stock price as of date of grant. The valuation assumptions used to calculate the fair values of the time-based RSU awards held by our PEOs that vested during or were outstanding as of the end of each covered fiscal year have been adjusted using the stock price as of each vesting date and as of year-end.
Equity Award Valuations - Non-PEO NEOs: Time-based RSU award grant date fair values are calculated using the stock price as of date of grant. The valuation assumptions used to calculate the fair values of the time-based RSU awards held by the other NEOs as a group (excluding Mr. Cotoia (for 2024, 2023, 2022, 2021, and 2020) and Mr. Nugent (for 2024)) that vested during or were outstanding as of the end of each covered fiscal year have been adjusted using the stock price as of each vesting date and as of year-end.
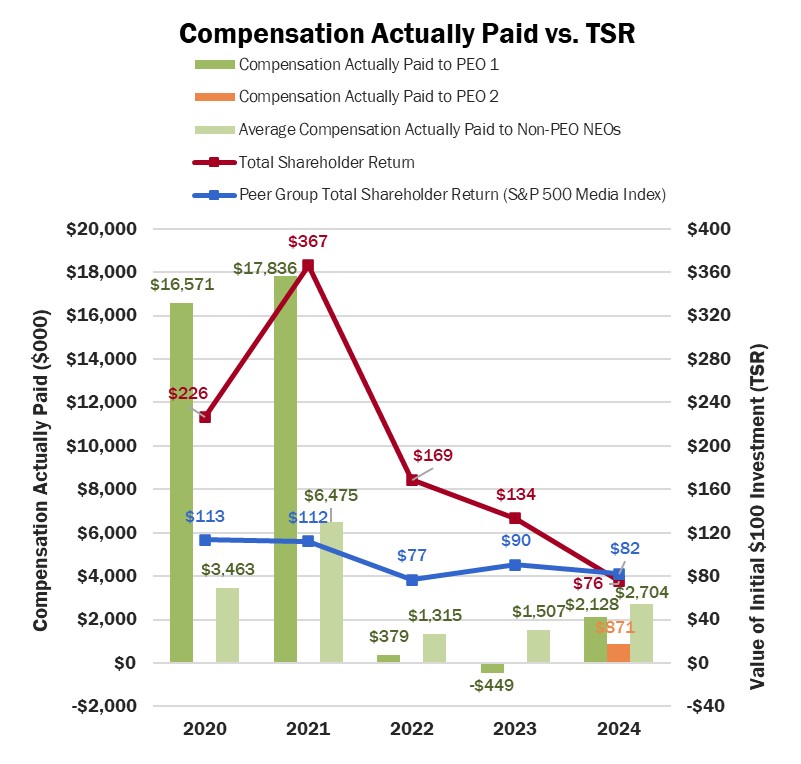
Compensation Actually Paid and Company TSR and Peer Group TSR. As demonstrated by the following graph, the amount of compensation actually paid to our PEOs and the average amount of compensation actually paid to our other NEOs as a group (except our PEOs) increased in 2024 however, the peer group TSR decreased. For more information regarding our performance and the companies that the Compensation Committee considers when determining compensation, refer to "Executive Compensation - Compensation Discussion and Analysis."
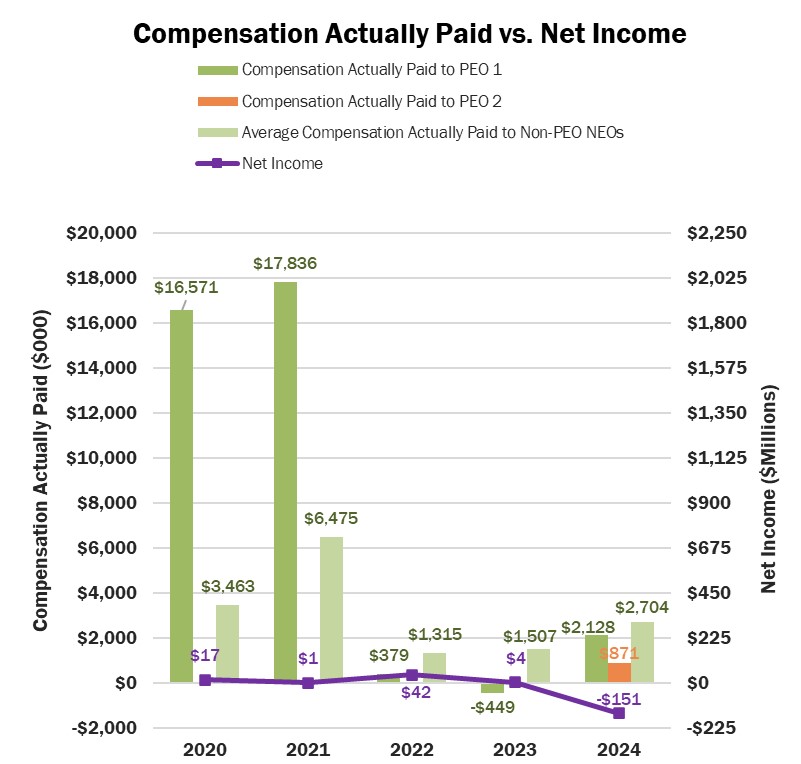
Compensation Actually Paid and Net Income. As reflected in the following graph, the amount of compensation actually paid to our PEOs and the average amount of compensation actually paid to our other NEOs as a group (except our PEOs) increased in 2024 and our net income decreased during that period. We do not use GAAP or non-GAAP net income as a financial performance measure in our overall executive compensation program, so there is, at best, only an indirect correlation between our profitability and the various financial performance measures which we use when setting goals in our short-term incentive compensation program. The 2024 compensation and financial information reflects figures following the Closing, whereas all prior years reflect pre-combination compensation and financial information for Former TechTarget.
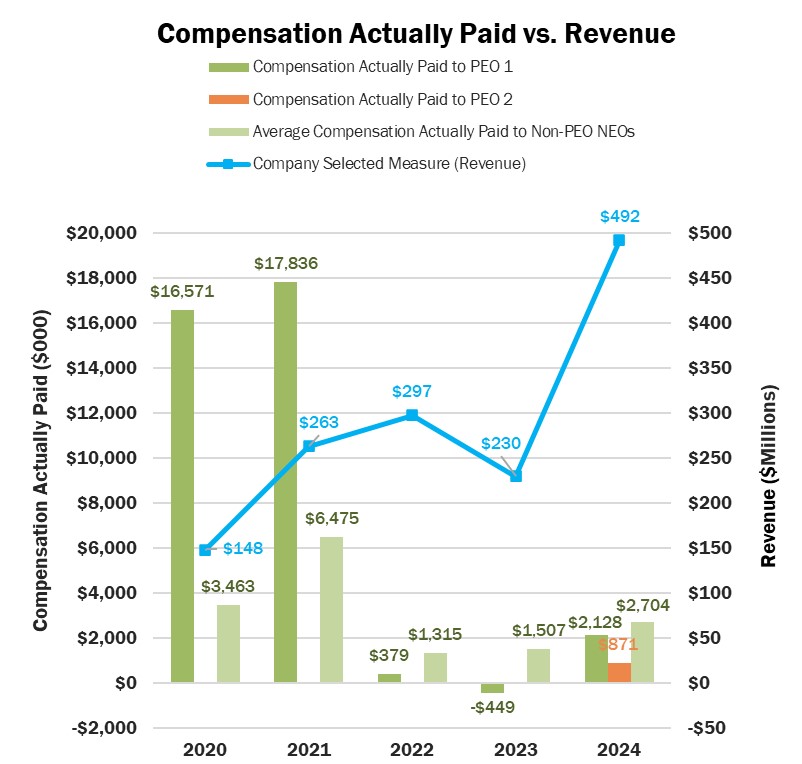
Compensation Actually Paid and Company Selected Measure (Revenue). As demonstrated by the following graph, both the amount of compensation actually paid to our PEOs and the average amount of compensation actually paid to our other NEOs as a group (except our PEOs) and our revenue increased in 2024. As described above, "revenue" is our Company-Selected Measure. While we use various performance measures for the purpose of evaluating the effectiveness of our executive compensation program, we have determined that revenue is the financial performance measure that, in our assessment, represents the most important performance measure (that is not otherwise required to be disclosed in the Pay-Versus-Performance table) used by us to link compensation actually paid to our PEOs and our other NEOs for the most recently completed fiscal year, to our financial performance. We use revenue when setting goals in our short-term incentive compensation program. The 2024 compensation and financial information reflects figures following the Closing, whereas all prior years reflect pre-combination compensation and financials for Former TechTarget.
Compensation Actually Paid and Company TSR and Peer Group TSR. As demonstrated by the following graph, the amount of compensation actually paid to our PEOs and the average amount of compensation actually paid to our other NEOs as a group (except our PEOs) increased in 2024 however, the peer group TSR decreased. For more information regarding our performance and the companies that the Compensation Committee considers when determining compensation, refer to "Executive Compensation - Compensation Discussion and Analysis."
Financial Performance Measures. As described in greater detail in "Executive Compensation - Compensation Discussion and Analysis," our executive compensation program is designed to reflect our variable "pay-for-performance" philosophy. The performance measures that we use for our short-term incentive award programs are selected based on an objective of incentivizing our NEOs to increase the value of our enterprise for our stockholders. The most important performance measures used by us to link executive compensation actually paid to our NEOs, for the most recently completed fiscal year, to our performance are as follows:
Revenue |
Adjusted EBITDA |
Percentage of Revenue under Longer-Term Contract |
The Compensation Committee designed the relevant Revenue, Adjusted EBIDTA, and Longer-Term Contract targets used in the 2024 Bonus Plan by taking into consideration the 2024 budget as well as projected revenue. The Compensation Committee determined that the financial targets should, as in past years, be based on the Company's current year budget and also took into consideration the Company's actual performance against its budget. The Committee determined that the Longer-Term Contract target should be based on projected revenue and anticipated product mix. Based on these factors, the Committee established the 2024 targets against the prior year period. For more information on the 2024 Bonus Plan, see "Executive Compensation - Executive Incentive Bonus Plan" above.