PAY VERSUS PERFORMANCE
As required by Section 953(a) of the Dodd-Frank Wall Street Reform and Consumer Protection Act, and Item 402(v) of Regulation S-K, we are providing the following information about the relationship between executive compensation actually paid (as defined in Item 402(v) of Regulation S-K) and certain financial performance of the Company. For the most recently completed fiscal year, the Company did not use any “financial performance measures” as defined in Item 402(v) of Regulation S-K to link compensation paid to our Named Executive Officers, or NEOs, to the Company’s performance. We are also permitted to report as a “smaller reporting company” as defined under the U.S. federal securities laws. Accordingly, we have not included a tabular list of financial performance measures, and the table below does not include a column for a “Company-Selected Measure” as defined in Item 402(v) of Regulation S-K. The Compensation Committee did not consider the pay versus performance disclosure when making its incentive compensation decisions.
| Year | Summary | Compensation | Summary | Compensation | Average | Compensation | Value of | Net Loss(8) | |||||||||||||||||
| (a) | (b) | (c) | (d) | (e) | (f) | (g) | (h) | (i) | |||||||||||||||||
| 2024 | $ | 976,339 | $ | 823,533 | $ |
| $ |
| $ | 352,307 | $ | 322,161 | $ | 1.50 | $ | (13,197,000 | ) | ||||||||
| 2023 | $ | 801,621 | $ | 575,598 | $ |
| $ |
| $ | 412,017 | $ | 400,427 | $ | 2.76 | $ | (5,123,341 | ) | ||||||||
(1) The dollar amounts reported in column (b) are the amounts of total compensation reported for Cary Claiborne, the Corporation’s Chief Executive Officer for each corresponding year in the “Total” column of the Summary Compensation Table. Refer to “Executive Compensation — Summary Compensation Table.”
(2) The dollar amounts under column (c) represent the amount of “compensation actually paid” to Cary Claiborne, as computed in accordance with Item 402(v) of Regulation S-K. The dollar amounts do not reflect the actual amount of compensation earned by or paid to Mr. Claiborne during the applicable year. In accordance with the requirements of Item 402(v) of Regulation S-K, the adjustments in the table below were made to Mr. Claiborne’s total compensation for each year to determine the compensation actually paid:
| Year | Summary | Deduct: | Add: Fair | Add: Fair | Add: | Add: | Compensation | ||||||||||
| 2024 | 976,339 | (415,008 | ) | 324,847 | 25,328 | (77,482 | ) | (10,491 | ) | 823,533 | |||||||
| 2023 | 801,621 | (73,314 | ) | 10,973 | 9,915 | (85,513 | ) | (88,084 | ) | 575,598 | |||||||
The equity award adjustments for each applicable year include the addition (or subtraction, as applicable) of the following:
(a) The grant date fair value of equity-based awards, as reported in the Summary Compensation Table.
(b) The year-end fair value of any equity awards granted in the applicable year that are outstanding and unvested as of the end of the year.
(c) The year-end fair value of any equity awards granted in the applicable year that are outstanding and vested as of the end of the year.
(d) The amount of change as of the end of the applicable year (from the end of the prior fiscal year) in fair value of any awards granted in prior years that are outstanding and unvested as of the end of the applicable year.
(e) For awards granted in prior years that vest in the applicable year, the amount equal to the change as of the vesting date (from the end of the prior fiscal year) in fair value.
(5) The dollar amounts reported in column (f) are the amounts of total compensation reported for NEOs. The non-PEO NEOs for the 2024 period were Joseph A. M. Truluck, the Corporation’s Former Chief Financial Officer and Tony Goodman, the Corporation’s Chief Operating Officer. The non-PEO NEO for the 2023 period were Joseph A. M. Truluck, the Corporation’s former Chief Financial Officer and Bankole A. Johnson, the Corporation’s former Chief Medical Officer. Refer to “Executive Compensation — Summary Compensation Table.”
(6) The dollar amounts under column (g) represent the amount of “compensation actually paid” to Joseph A. M. Truluck, Bankole A. Johnson and Tony Goodman, the Non-PEO NEOs within the applicable years, as computed in accordance with Item 402(v) of Regulation S-K. The dollar amounts do not reflect the actual amount of compensation earned by or paid to Mr. Truluck, Johnson and Goodman during the applicable year. In accordance with the requirements of Item 402(v) of Regulation S-K, the adjustments in the table below were made to Mr. Truluck, Johnson and Goodman’s total compensation for each year to determine the compensation actually paid:
| Year | Summary | Deduct: | Add: Fair | Add: Fair | Add: | Add: | Compensation | ||||||||||
| 2024 | 352,307 | (38,045 | ) | 19,680 | 8,970 | (20,285 | ) | (465 | ) | 322,161 | |||||||
| 2023 | 412,017 | (15,274 | ) | 3,017 | 2,727 | (2,521 | ) | 462 | ) | 400,427 | |||||||
The equity award adjustments for each applicable year include the addition (or subtraction, as applicable) of the following:
(a) The grant date fair value of equity-based awards, as reported in the Summary Compensation Table.
(b) The year-end fair value of any equity awards granted in the applicable year that are outstanding and unvested as of the end of the year.
(c) The year-end fair value of any equity awards granted in the applicable year that are outstanding and vested as of the end of the year.
(d) The amount of change as of the end of the applicable year (from the end of the prior fiscal year) in fair value of any awards granted in prior years that are outstanding and unvested as of the end of the applicable year.
(e) For awards granted in prior years that vest in the applicable year, the amount equal to the change as of the vesting date (from the end of the prior fiscal year) in fair value.
(7) Pursuant to SEC rules, the total shareholder return (“TSR”) figures assume an initial investment of $100 on December 31, 2021. Cumulative TSR is calculated by dividing the sum of the cumulative amount of dividends for the measurement period, assuming dividend reinvestment, and the difference between the Company’s share price at the end and the beginning of the measurement period by the Company’s share price at the beginning of the measurement period. The calculation of TSR was based upon the closing price of a share of the Corporation’s common shares on the last day of its 2024, 2023 and 2022 fiscal years, which prices were $1.01, $1.86, $5.38, respectively.
(8) Refer to the Corporation’s Consolidated Statements of Operations as presented in its Annual Report on Form 10-K filed on December 31, 2024.
| Year | Summary | Deduct: | Add: Fair | Add: Fair | Add: | Add: | Compensation | ||||||||||
| 2024 | 976,339 | (415,008 | ) | 324,847 | 25,328 | (77,482 | ) | (10,491 | ) | 823,533 | |||||||
| 2023 | 801,621 | (73,314 | ) | 10,973 | 9,915 | (85,513 | ) | (88,084 | ) | 575,598 | |||||||
The equity award adjustments for each applicable year include the addition (or subtraction, as applicable) of the following:
(a) The grant date fair value of equity-based awards, as reported in the Summary Compensation Table.
(b) The year-end fair value of any equity awards granted in the applicable year that are outstanding and unvested as of the end of the year.
(c) The year-end fair value of any equity awards granted in the applicable year that are outstanding and vested as of the end of the year.
(d) The amount of change as of the end of the applicable year (from the end of the prior fiscal year) in fair value of any awards granted in prior years that are outstanding and unvested as of the end of the applicable year.
(e) For awards granted in prior years that vest in the applicable year, the amount equal to the change as of the vesting date (from the end of the prior fiscal year) in fair value.
| Year | Summary | Deduct: | Add: Fair | Add: Fair | Add: | Add: | Compensation | ||||||||||
| 2024 | 352,307 | (38,045 | ) | 19,680 | 8,970 | (20,285 | ) | (465 | ) | 322,161 | |||||||
| 2023 | 412,017 | (15,274 | ) | 3,017 | 2,727 | (2,521 | ) | 462 | ) | 400,427 | |||||||
The equity award adjustments for each applicable year include the addition (or subtraction, as applicable) of the following:
(a) The grant date fair value of equity-based awards, as reported in the Summary Compensation Table.
(b) The year-end fair value of any equity awards granted in the applicable year that are outstanding and unvested as of the end of the year.
(c) The year-end fair value of any equity awards granted in the applicable year that are outstanding and vested as of the end of the year.
(d) The amount of change as of the end of the applicable year (from the end of the prior fiscal year) in fair value of any awards granted in prior years that are outstanding and unvested as of the end of the applicable year.
(e) For awards granted in prior years that vest in the applicable year, the amount equal to the change as of the vesting date (from the end of the prior fiscal year) in fair value.
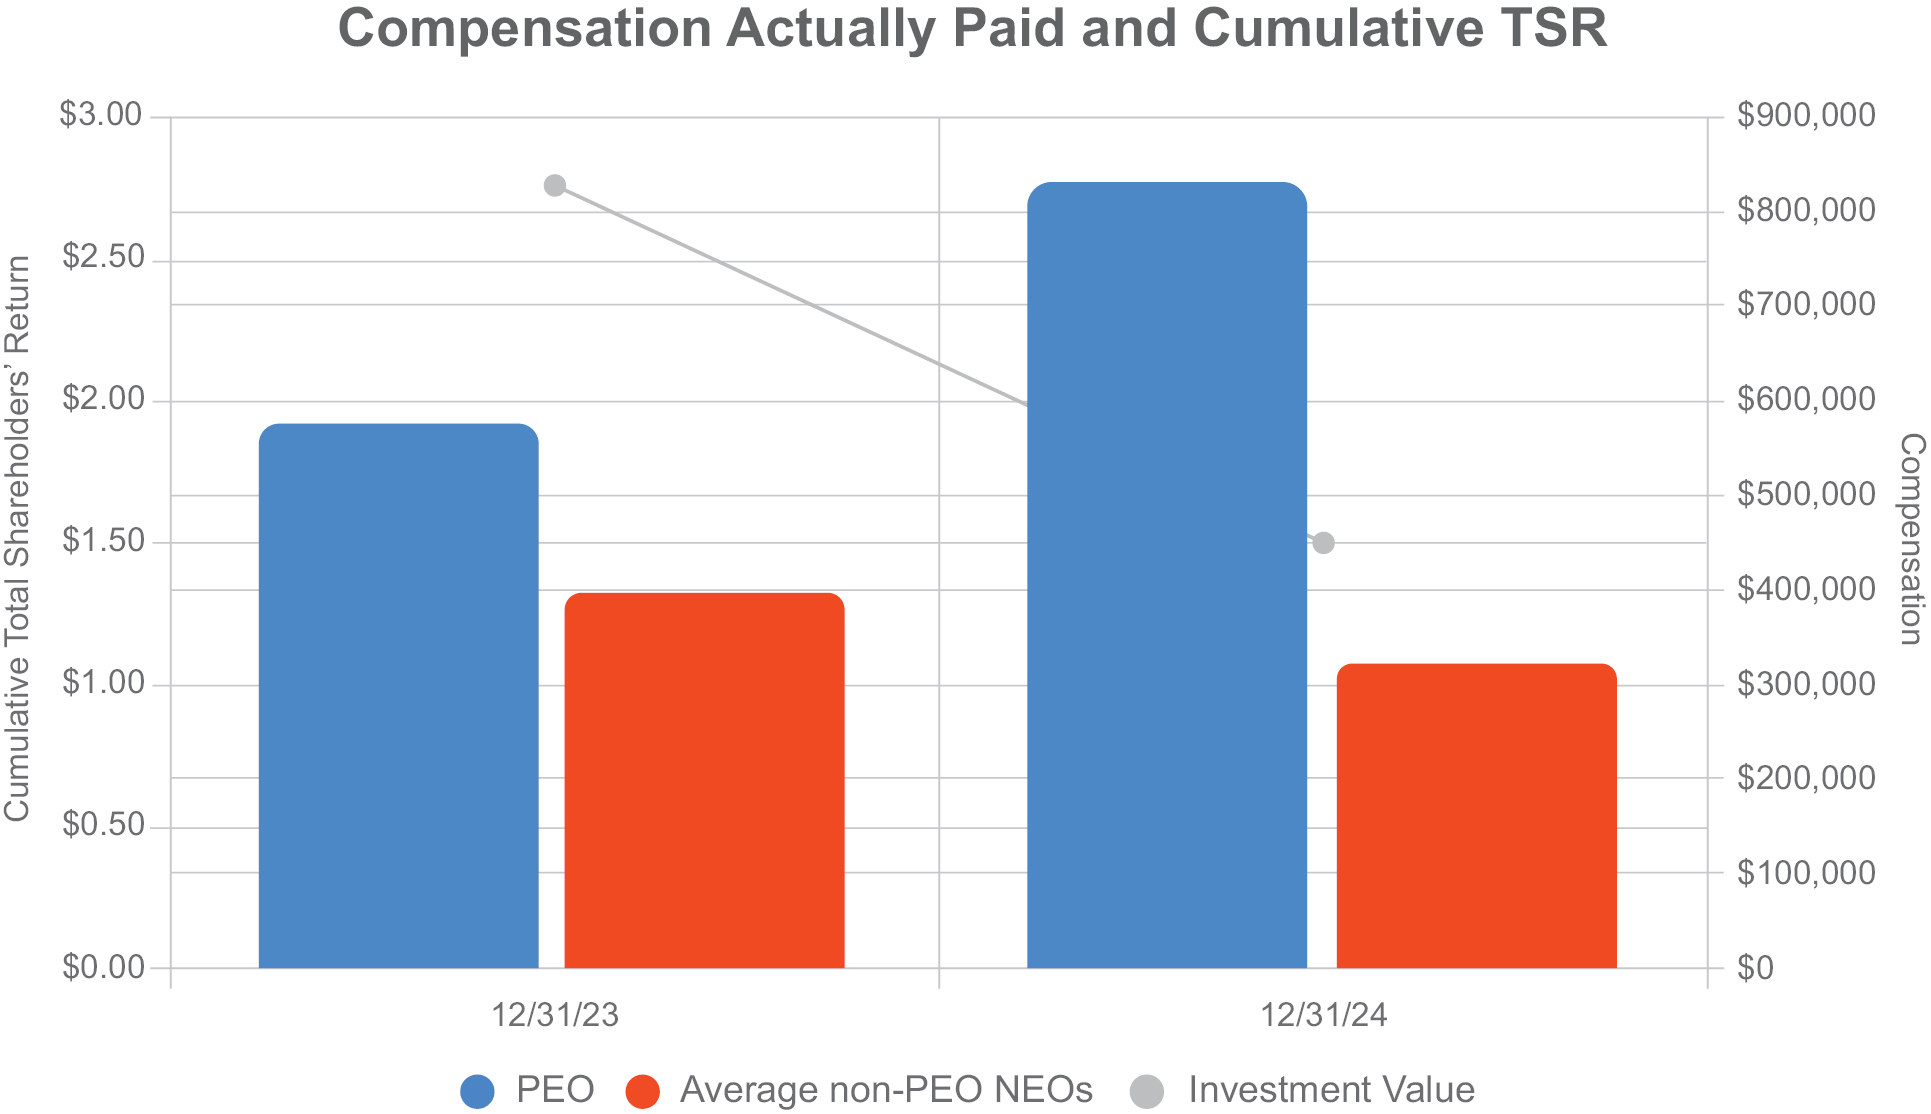
Compensation Actually Paid and Cumulative TSR
The chart below shows the relationship between the compensation actually paid to our PEO and the average compensation actually paid to our non-PEO NEOs, on the one hand, to the Company’s cumulative TSR over the three years presented in the table, on the other.
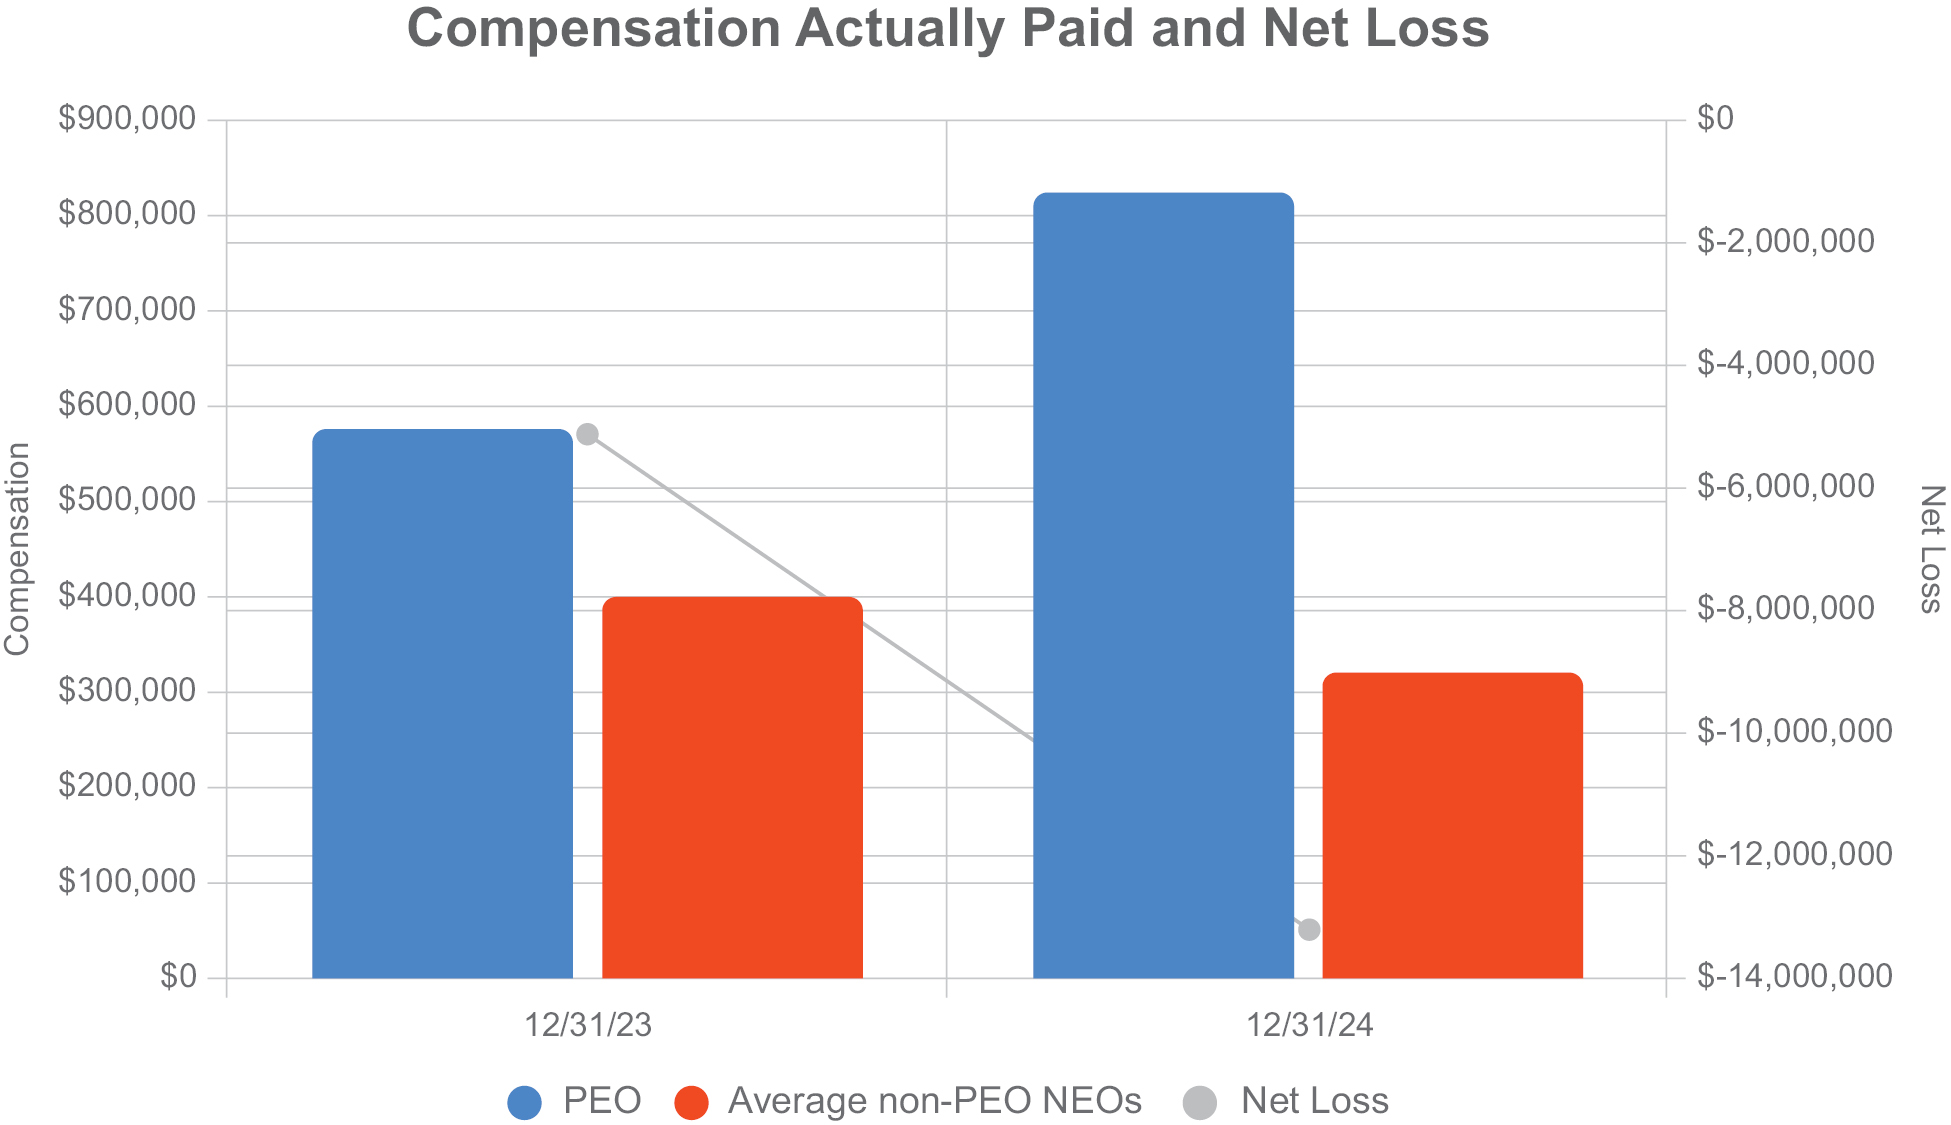
Compensation Actually Paid and Net Loss
The chart below shows the relationship between the compensation actually paid to our PEO and the average compensation actually paid to our non-PEO NEOs, on the one hand, to the Company’s net (loss), on the other hand.
| [1] | The dollar amounts reported in column (b) are the amounts of total compensation reported for Cary Claiborne, the Corporation’s Chief Executive Officer for each corresponding year in the “Total” column of the Summary Compensation Table. Refer to “Executive Compensation — Summary Compensation Table.” | ||||||||||||||||||||||||||||||||||||||||||||||||||||||
| [2] | The dollar amounts under column (c) represent the amount of “compensation actually paid” to Cary Claiborne, as computed in accordance with Item 402(v) of Regulation S-K. The dollar amounts do not reflect the actual amount of compensation earned by or paid to Mr. Claiborne during the applicable year. In accordance with the requirements of Item 402(v) of Regulation S-K, the adjustments in the table below were made to Mr. Claiborne’s total compensation for each year to determine the compensation actually paid:
The equity award adjustments for each applicable year include the addition (or subtraction, as applicable) of the following: (a) The grant date fair value of equity-based awards, as reported in the Summary Compensation Table. (b) The year-end fair value of any equity awards granted in the applicable year that are outstanding and unvested as of the end of the year. (c) The year-end fair value of any equity awards granted in the applicable year that are outstanding and vested as of the end of the year. (d) The amount of change as of the end of the applicable year (from the end of the prior fiscal year) in fair value of any awards granted in prior years that are outstanding and unvested as of the end of the applicable year. (e) For awards granted in prior years that vest in the applicable year, the amount equal to the change as of the vesting date (from the end of the prior fiscal year) in fair value. |
||||||||||||||||||||||||||||||||||||||||||||||||||||||
| [3] | The dollar amounts reported in column (f) are the amounts of total compensation reported for NEOs. The non-PEO NEOs for the 2024 period were Joseph A. M. Truluck, the Corporation’s Former Chief Financial Officer and Tony Goodman, the Corporation’s Chief Operating Officer. The non-PEO NEO for the 2023 period were Joseph A. M. Truluck, the Corporation’s former Chief Financial Officer and Bankole A. Johnson, the Corporation’s former Chief Medical Officer. Refer to “Executive Compensation — Summary Compensation Table.” | ||||||||||||||||||||||||||||||||||||||||||||||||||||||
| [4] | The dollar amounts under column (g) represent the amount of “compensation actually paid” to Joseph A. M. Truluck, Bankole A. Johnson and Tony Goodman, the Non-PEO NEOs within the applicable years, as computed in accordance with Item 402(v) of Regulation S-K. The dollar amounts do not reflect the actual amount of compensation earned by or paid to Mr. Truluck, Johnson and Goodman during the applicable year. In accordance with the requirements of Item 402(v) of Regulation S-K, the adjustments in the table below were made to Mr. Truluck, Johnson and Goodman’s total compensation for each year to determine the compensation actually paid:
The equity award adjustments for each applicable year include the addition (or subtraction, as applicable) of the following: (a) The grant date fair value of equity-based awards, as reported in the Summary Compensation Table. (b) The year-end fair value of any equity awards granted in the applicable year that are outstanding and unvested as of the end of the year. (c) The year-end fair value of any equity awards granted in the applicable year that are outstanding and vested as of the end of the year. (d) The amount of change as of the end of the applicable year (from the end of the prior fiscal year) in fair value of any awards granted in prior years that are outstanding and unvested as of the end of the applicable year. (e) For awards granted in prior years that vest in the applicable year, the amount equal to the change as of the vesting date (from the end of the prior fiscal year) in fair value. |
||||||||||||||||||||||||||||||||||||||||||||||||||||||
| [5] | Pursuant to SEC rules, the total shareholder return (“TSR”) figures assume an initial investment of $100 on December 31, 2021. Cumulative TSR is calculated by dividing the sum of the cumulative amount of dividends for the measurement period, assuming dividend reinvestment, and the difference between the Company’s share price at the end and the beginning of the measurement period by the Company’s share price at the beginning of the measurement period. The calculation of TSR was based upon the closing price of a share of the Corporation’s common shares on the last day of its 2024, 2023 and 2022 fiscal years, which prices were $1.01, $1.86, $5.38, respectively. | ||||||||||||||||||||||||||||||||||||||||||||||||||||||
| [6] | Refer to the Corporation’s Consolidated Statements of Operations as presented in its Annual Report on Form 10-K filed on December 31, 2024. | ||||||||||||||||||||||||||||||||||||||||||||||||||||||
| [7] | The grant date fair value of equity-based awards, as reported in the Summary Compensation Table. | ||||||||||||||||||||||||||||||||||||||||||||||||||||||
| [8] | The year-end fair value of any equity awards granted in the applicable year that are outstanding and unvested as of the end of the year. | ||||||||||||||||||||||||||||||||||||||||||||||||||||||
| [9] | The year-end fair value of any equity awards granted in the applicable year that are outstanding and vested as of the end of the year. | ||||||||||||||||||||||||||||||||||||||||||||||||||||||
| [10] | The amount of change as of the end of the applicable year (from the end of the prior fiscal year) in fair value of any awards granted in prior years that are outstanding and unvested as of the end of the applicable year. | ||||||||||||||||||||||||||||||||||||||||||||||||||||||
| [11] | For awards granted in prior years that vest in the applicable year, the amount equal to the change as of the vesting date (from the end of the prior fiscal year) in fair value. | ||||||||||||||||||||||||||||||||||||||||||||||||||||||