Pay vs Performance Disclosure - USD ($)
Jan. 12, 2023
Dec. 31, 2023
Aug. 10, 2023
Dec. 31, 2024
Dec. 31, 2023
Dec. 31, 2022
Pay Versus Performance Disclosure
In accordance with rules adopted by the SEC pursuant to the Dodd-Frank Wall Street Reform and Consumer Protection Act of 2010, we provide the following disclosure regarding executive compensation for our principal executive officer (“PEO”) and non-PEO named executive officers (“NEOs”) and Company performance for the fiscal years listed below. The compensation committee did not consider the pay versus performance disclosure below in making its pay decisions for any of the years shown.
Year | Summary Compensation Table Total for PEO 1(1) | Compensation Actually Paid to PEO 1(2) | Summary Compensation Table Total for PEO 2(1) | Compensation Actually Paid to PEO 2(2) | Summary Compensation Table Total for PEO 3(1) | Compensation Actually Paid to PEO 3(2) | Average Summary Compensation Table Totals for non-PEO NEOs(1) | Average Compensation Actually Paid to non-PEO NEOs(2) | Value of Initial Fixed $100 Investment Based On: | Net Income (Loss) (thousands) | ||||||||||||||||||||
Total Shareholder Return | ||||||||||||||||||||||||||||||
2024 | — | — | — | — | $716,404 | $647,143 | $774,699 | $633,681 | $0.69 | $(27,592) | ||||||||||||||||||||
2023 | $116,807 | $116,341 | $432,000 | $432,000 | $664,055 | $565,998 | $154,500 | $154,500 | $1.26 | $(12,470) | ||||||||||||||||||||
2022 | $501,579 | $72,820 | — | — | — | — | — | — | $1.96 | $(13,967) |
(1) | Dr. Gil Price (PEO 1) was appointed as our President and Chief Executive Officer and became our PEO as of November 3, 2021 and through January 2023. Joseph Hooker (PEO 2) served as our Interim President and Chief Executive Officer from January 2023 to August 2023 and was contracted to us from Korn Ferry. Hyung Heon Kim (PEO 3) was appointed as our Chief Executive Officer and President in August 2023. The Summary Compensation Total for PEO 1, PEO 2 and PEO 3 and the Average Summary Compensation Table Totals for non-PEO NEOs are derived from the dollar amounts of total compensation paid for each individual in the corresponding fiscal year in the “Total” column of the Summary Compensation Table in this Proxy Statement and in the Company’s proxy statement for the fiscal year ended December 31, 2023. The non-PEO NEO for whom the average compensation is presented in this table for 2023 and 2024 is Marshall H. Woodworth, who served as our Acting Chief Financial Officer from October 25, 2023 until his appointment as our Chief Financial Officer on March 1, 2024. |
(2) | The amounts shown as Compensation Actually Paid have been calculated in accordance with Item 402(v) of Regulation S-K and do not reflect compensation actually realized or received by the applicable PEO or non-PEO NEOs. These amounts reflect total compensation as set forth in the Summary Compensation Table for each year, adjusted with respect to Dr. Price, Mr. Kim and Mr. Woodworth as set forth below. Equity values are calculated in accordance with FASB ASC Topic 718. |
PEO 1 | |||||||||
Prior FYE Current FYE Fiscal Year | 12/31/2021 12/31/2022 2022 | 12/31/2022 12/31/2023 2023 | 12/31/2023 12/31/2024 2024 | ||||||
SCT Total | $501,579 | $116,807 | — | ||||||
Minus Grant Date Fair Value of Option Awards and Stock Awards Granted in Fiscal Year | — | — | — | ||||||
Plus Fair Value at Fiscal Year-End of Outstanding and Unvested Option Awards and Stock Awards Granted in Fiscal Year | — | — | — | ||||||
Plus Change in Fair Value of Outstanding and Unvested Options Awards and Stock Awards Granted in Prior Fiscal Years | $(255,112) | — | — | ||||||
Plus Fair Value at Vesting of Option Awards and Stock Awards Granted in Fiscal Year That Vested During Fiscal Year | $10,527 | — | — | ||||||
Plus Changes in Fair Values as of Vesting Date of Option Awards and Stock Awards Granted in Prior Fiscal Years For Which Applicable Vesting Conditions Were Satisfied During Fiscal Year | $(184,174) | — | — | ||||||
Minus Fair Value as of Prior Fiscal Year-End of Option Awards and Stock Awards Granted in Prior Fiscal Years That Failed to Meet Applicable Vesting Conditions During Fiscal Year | — | $(466) | — | ||||||
Compensation Actually Paid | $72,820 | $116,341 | — | ||||||
PEO 3 | |||||||||
Prior FYE Current FYE Fiscal Year | 12/31/2021 12/31/2022 2022 | 12/31/2022 12/31/2023 2023 | 12/31/2023 12/31/2024 2024 | ||||||
SCT Total | — | $664,055 | $716,404 | ||||||
Minus Grant Date Fair Value of Option Awards and Stock Awards Granted in Fiscal Year | — | $(386,915) | — | ||||||
Plus Fair Value at Fiscal Year-End of Outstanding and Unvested Option Awards and Stock Awards Granted in Fiscal Year | — | $288,858 | — | ||||||
Plus Change in Fair Value of Outstanding and Unvested Options Awards and Stock Awards Granted in Prior Fiscal Years | — | — | $(48,840) | ||||||
Plus Changes in Fair Values as of Vesting Date of Option Awards and Stock Awards Granted in Prior Fiscal Years For Which Applicable Vesting Conditions Were Satisfied During Fiscal Year | — | — | $(20,421) | ||||||
Compensation Actually Paid | — | $565,998 | $647,143 | ||||||
Non-PEO NEO | |||||||||
Prior FYE Current FYE Fiscal Year | 12/31/2021 12/31/2022 2022 | 12/31/2022 12/31/2023 2023 | 12/31/2023 12/31/2024 2024 | ||||||
SCT Total | — | $154,500 | $774,699 | ||||||
Minus Grant Date Fair Value of Option Awards and Stock Awards Granted in Fiscal Year | — | — | $(209,015) | ||||||
Plus Fair Value at Fiscal Year-End of Outstanding and Unvested Options Awards and Stock Awards Granted in Fiscal Year | — | — | $67,997 | ||||||
Plus Change in Fair Value of Outstanding and Unvested Options Awards and Stock Awards Granted in Prior Fiscal Years | — | — | — | ||||||
Plus Changes in Fair Values as of Vesting Date of Option Awards and Stock Awards Granted in Prior Fiscal Years For Which Applicable Vesting Conditions Were Satisfied During Fiscal Year | — | — | — | ||||||
Compensation Actually Paid | — | $154,500 | $633,681 | ||||||
(1) | Dr. Gil Price (PEO 1) was appointed as our President and Chief Executive Officer and became our PEO as of November 3, 2021 and through January 2023. Joseph Hooker (PEO 2) served as our Interim President and Chief Executive Officer from January 2023 to August 2023 and was contracted to us from Korn Ferry. Hyung Heon Kim (PEO 3) was appointed as our Chief Executive Officer and President in August 2023. The Summary Compensation Total for PEO 1, PEO 2 and PEO 3 and the Average Summary Compensation Table Totals for non-PEO NEOs are derived from the dollar amounts of total compensation paid for each individual in the corresponding fiscal year in the “Total” column of the Summary Compensation Table in this Proxy Statement and in the Company’s proxy statement for the fiscal year ended December 31, 2023. The non-PEO NEO for whom the average compensation is presented in this table for 2023 and 2024 is Marshall H. Woodworth, who served as our Acting Chief Financial Officer from October 25, 2023 until his appointment as our Chief Financial Officer on March 1, 2024. |
(2) | The amounts shown as Compensation Actually Paid have been calculated in accordance with Item 402(v) of Regulation S-K and do not reflect compensation actually realized or received by the applicable PEO or non-PEO NEOs. These amounts reflect total compensation as set forth in the Summary Compensation Table for each year, adjusted with respect to Dr. Price, Mr. Kim and Mr. Woodworth as set forth below. Equity values are calculated in accordance with FASB ASC Topic 718. |
PEO 1 | |||||||||
Prior FYE Current FYE Fiscal Year | 12/31/2021 12/31/2022 2022 | 12/31/2022 12/31/2023 2023 | 12/31/2023 12/31/2024 2024 | ||||||
SCT Total | $501,579 | $116,807 | — | ||||||
Minus Grant Date Fair Value of Option Awards and Stock Awards Granted in Fiscal Year | — | — | — | ||||||
Plus Fair Value at Fiscal Year-End of Outstanding and Unvested Option Awards and Stock Awards Granted in Fiscal Year | — | — | — | ||||||
Plus Change in Fair Value of Outstanding and Unvested Options Awards and Stock Awards Granted in Prior Fiscal Years | $(255,112) | — | — | ||||||
Plus Fair Value at Vesting of Option Awards and Stock Awards Granted in Fiscal Year That Vested During Fiscal Year | $10,527 | — | — | ||||||
Plus Changes in Fair Values as of Vesting Date of Option Awards and Stock Awards Granted in Prior Fiscal Years For Which Applicable Vesting Conditions Were Satisfied During Fiscal Year | $(184,174) | — | — | ||||||
Minus Fair Value as of Prior Fiscal Year-End of Option Awards and Stock Awards Granted in Prior Fiscal Years That Failed to Meet Applicable Vesting Conditions During Fiscal Year | — | $(466) | — | ||||||
Compensation Actually Paid | $72,820 | $116,341 | — | ||||||
PEO 3 | |||||||||
Prior FYE Current FYE Fiscal Year | 12/31/2021 12/31/2022 2022 | 12/31/2022 12/31/2023 2023 | 12/31/2023 12/31/2024 2024 | ||||||
SCT Total | — | $664,055 | $716,404 | ||||||
Minus Grant Date Fair Value of Option Awards and Stock Awards Granted in Fiscal Year | — | $(386,915) | — | ||||||
Plus Fair Value at Fiscal Year-End of Outstanding and Unvested Option Awards and Stock Awards Granted in Fiscal Year | — | $288,858 | — | ||||||
Plus Change in Fair Value of Outstanding and Unvested Options Awards and Stock Awards Granted in Prior Fiscal Years | — | — | $(48,840) | ||||||
Plus Changes in Fair Values as of Vesting Date of Option Awards and Stock Awards Granted in Prior Fiscal Years For Which Applicable Vesting Conditions Were Satisfied During Fiscal Year | — | — | $(20,421) | ||||||
Compensation Actually Paid | — | $565,998 | $647,143 | ||||||
(2) | The amounts shown as Compensation Actually Paid have been calculated in accordance with Item 402(v) of Regulation S-K and do not reflect compensation actually realized or received by the applicable PEO or non-PEO NEOs. These amounts reflect total compensation as set forth in the Summary Compensation Table for each year, adjusted with respect to Dr. Price, Mr. Kim and Mr. Woodworth as set forth below. Equity values are calculated in accordance with FASB ASC Topic 718. |
Non-PEO NEO | |||||||||
Prior FYE Current FYE Fiscal Year | 12/31/2021 12/31/2022 2022 | 12/31/2022 12/31/2023 2023 | 12/31/2023 12/31/2024 2024 | ||||||
SCT Total | — | $154,500 | $774,699 | ||||||
Minus Grant Date Fair Value of Option Awards and Stock Awards Granted in Fiscal Year | — | — | $(209,015) | ||||||
Plus Fair Value at Fiscal Year-End of Outstanding and Unvested Options Awards and Stock Awards Granted in Fiscal Year | — | — | $67,997 | ||||||
Plus Change in Fair Value of Outstanding and Unvested Options Awards and Stock Awards Granted in Prior Fiscal Years | — | — | — | ||||||
Plus Changes in Fair Values as of Vesting Date of Option Awards and Stock Awards Granted in Prior Fiscal Years For Which Applicable Vesting Conditions Were Satisfied During Fiscal Year | — | — | — | ||||||
Compensation Actually Paid | — | $154,500 | $633,681 | ||||||
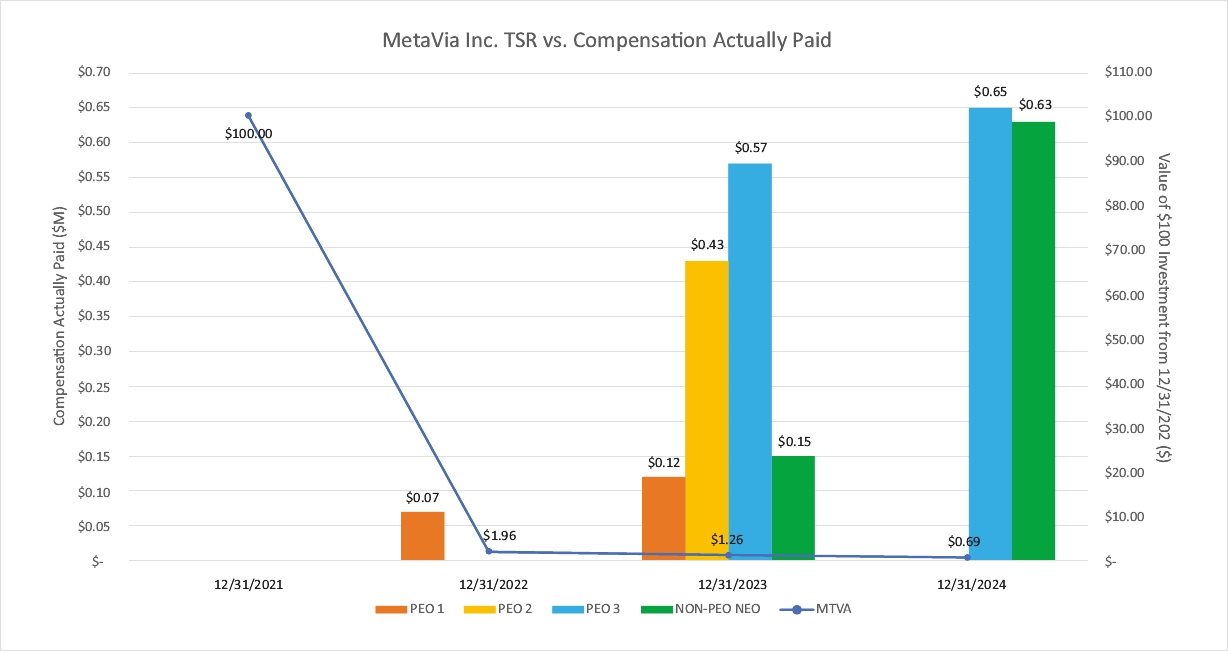
Relationship Between PEO and Non-PEO NEO Compensation Actually Paid and Company Total Shareholder Return (“TSR”)
The following chart sets forth the relationship between Compensation Actually Paid (“CAP”) to our PEOs, the average CAP to our non-PEO NEOs in 2022 and 2024, and the Company’s TSR over the three most recently completed fiscal years.
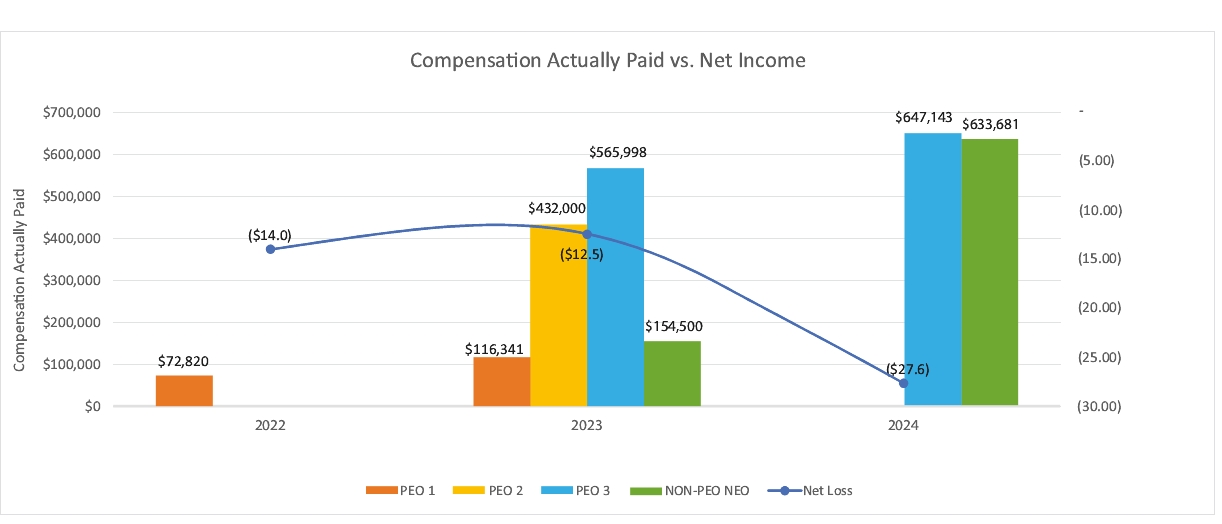
Description of Relationship Between PEO and Non-PEO NEO Compensation Actually Paid and Net Income
The following chart sets forth the relationship between CAP to our PEOs, the average of CAP to our non-PEO NEOs in 2022 and 2024, and the Company’s net income over the three most recently completed fiscal years.