Shareholder Report
|
6 Months Ended |
|
Mar. 31, 2025
USD ($)
Holding
|
|---|
| Shareholder Report [Line Items] |
|
|
| Document Type |
N-CSRS
|
|
| Amendment Flag |
false
|
|
| Registrant Name |
SEI INSTITUTIONAL INTERNATIONAL TRUST
|
|
| Entity Central Index Key |
0000835597
|
|
| Entity Investment Company Type |
N-1A
|
|
| Document Period End Date |
Mar. 31, 2025
|
|
| C000017607 |
|
|
| Shareholder Report [Line Items] |
|
|
| Fund Name |
International Equity Fund
|
|
| Class Name |
Class F
|
|
| Trading Symbol |
SEITX
|
|
| Annual or Semi-Annual Statement [Text Block] |
This semi-annual shareholder report contains important information about Class F Shares of the International Equity Fund (the "Fund") for the period from October 1, 2024 to March 31, 2025.
|
|
| Shareholder Report Annual or Semi-Annual |
Semi-Annual Shareholder Report
|
|
| Additional Information [Text Block] |
You can find additional information about the Fund at https://www.seic.com/mutual-fund-documentation/prospectuses-and-reports. You can also request this information by contacting us at 610-676-1000.
|
|
| Additional Information Phone Number |
610-676-1000
|
|
| Additional Information Website |
https://www.seic.com/mutual-fund-documentation/prospectuses-and-reports
|
|
| Expenses [Text Block] |
What were the Fund costs for the last six months?(based on a hypothetical $10,000 investment) Fund Name | Costs of a $10,000 investment | Costs paid as a percentage of a $10,000 investment |
|---|
International Equity Fund, Class F Shares | $55 | 1.09%Footnote Reference(1) |
|---|
| Footnote | Description | Footnote(1) | The expense ratio includes a proxy fee expense. Had this expense been excluded the ratio would have been 1.07%. |
|
|
| Expenses Paid, Amount |
$ 55
|
|
| Expense Ratio, Percent |
1.09%
|
[1] |
| AssetsNet |
$ 3,445,653,000
|
|
| Holdings Count | Holding |
744
|
|
| Advisory Fees Paid, Amount |
$ 8,828
|
|
| InvestmentCompanyPortfolioTurnover |
45.00%
|
|
| Additional Fund Statistics [Text Block] |
Key Fund Statistics as of March 31, 2025 | Total Net Assets (000's) | Number of Holdings | Total Advisory Fees Paid (000's) | Portfolio Turnover Rate |
|---|
| $3,445,653 | 744 | $8,828 | 45% |
|---|
|
|
| Holdings [Text Block] |
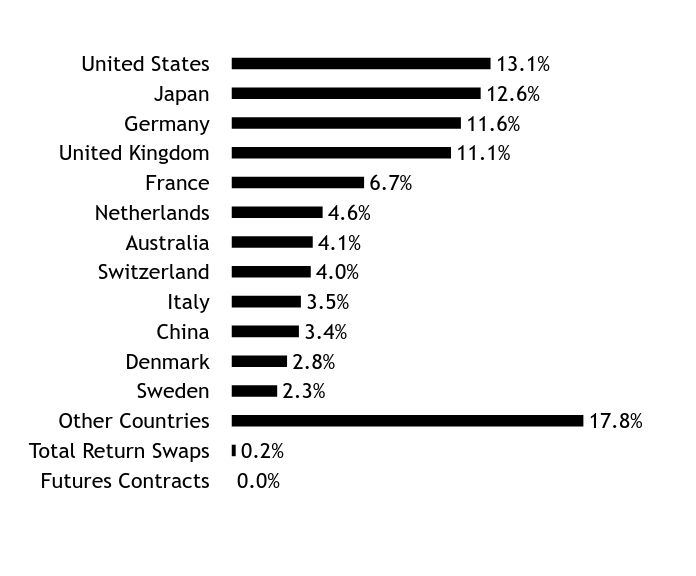
Country WeightingsFootnote Reference*Value | Value |
|---|
Futures Contracts | 0.0% | Total Return Swaps | 0.2% | Other Countries | 17.8% | Sweden | 2.3% | Denmark | 2.8% | China | 3.4% | Italy | 3.5% | Switzerland | 4.0% | Australia | 4.1% | Netherlands | 4.6% | France | 6.7% | United Kingdom | 11.1% | Germany | 11.6% | Japan | 12.6% | United States | 13.1% |
| Footnote | Description | Footnote* | Percentages are calculated based on total net assets. |
|
|
| Largest Holdings [Text Block] |
Holding Name | | | Percentage of
Total Net AssetsFootnote Reference(A) |
|---|
U.S. Treasury Bill, 4.26%, 8/28/2025 | | | 3.0% | Roche Holding AG | | | 2.4% | SAP SE | | | 1.8% | Alibaba Group Holding Ltd | | | 0.9% | Equinor ASA | | | 0.9% | ING Groep NV | | | 0.9% | Sea Ltd ADR | | | 0.9% | Daimler Truck Holding AG | | | 0.9% | Novartis AG | | | 0.9% | GSK PLC | | | 0.9% |
| Footnote | Description | Footnote(A) | Short-Term Investments are not shown in the top ten chart. |
|
|
| C000017606 |
|
|
| Shareholder Report [Line Items] |
|
|
| Fund Name |
International Equity Fund
|
|
| Class Name |
Class I
|
|
| Trading Symbol |
SEEIX
|
|
| Annual or Semi-Annual Statement [Text Block] |
This semi-annual shareholder report contains important information about Class I Shares of the International Equity Fund (the "Fund") for the period from October 1, 2024 to March 31, 2025.
|
|
| Shareholder Report Annual or Semi-Annual |
Semi-Annual Shareholder Report
|
|
| Additional Information [Text Block] |
You can find additional information about the Fund at https://www.seic.com/mutual-fund-documentation/prospectuses-and-reports. You can also request this information by contacting us at 610-676-1000.
|
|
| Additional Information Phone Number |
610-676-1000
|
|
| Additional Information Website |
https://www.seic.com/mutual-fund-documentation/prospectuses-and-reports
|
|
| Expenses [Text Block] |
What were the Fund costs for the last six months?(based on a hypothetical $10,000 investment) Fund Name | Costs of a $10,000 investment | Costs paid as a percentage of a $10,000 investment |
|---|
International Equity Fund, Class I Shares | $67 | 1.34%Footnote Reference(1) |
|---|
| Footnote | Description | Footnote(1) | The expense ratio includes a proxy fee expense. Had this expense been excluded the ratio would have been 1.32%. |
|
|
| Expenses Paid, Amount |
$ 67
|
|
| Expense Ratio, Percent |
1.34%
|
[2] |
| AssetsNet |
$ 3,445,653,000
|
|
| Holdings Count | Holding |
744
|
|
| Advisory Fees Paid, Amount |
$ 8,828
|
|
| InvestmentCompanyPortfolioTurnover |
45.00%
|
|
| Additional Fund Statistics [Text Block] |
Key Fund Statistics as of March 31, 2025 | Total Net Assets (000's) | Number of Holdings | Total Advisory Fees Paid (000's) | Portfolio Turnover Rate |
|---|
| $3,445,653 | 744 | $8,828 | 45% |
|---|
|
|
| Holdings [Text Block] |
Country WeightingsFootnote Reference*Value | Value |
|---|
Futures Contracts | 0.0% | Total Return Swaps | 0.2% | Other Countries | 17.8% | Sweden | 2.3% | Denmark | 2.8% | China | 3.4% | Italy | 3.5% | Switzerland | 4.0% | Australia | 4.1% | Netherlands | 4.6% | France | 6.7% | United Kingdom | 11.1% | Germany | 11.6% | Japan | 12.6% | United States | 13.1% |
| Footnote | Description | Footnote* | Percentages are calculated based on total net assets. |
|
|
| Largest Holdings [Text Block] |
Holding Name | | | Percentage of
Total Net AssetsFootnote Reference(A) |
|---|
U.S. Treasury Bill, 4.26%, 8/28/2025 | | | 3.0% | Roche Holding AG | | | 2.4% | SAP SE | | | 1.8% | Alibaba Group Holding Ltd | | | 0.9% | Equinor ASA | | | 0.9% | ING Groep NV | | | 0.9% | Sea Ltd ADR | | | 0.9% | Daimler Truck Holding AG | | | 0.9% | Novartis AG | | | 0.9% | GSK PLC | | | 0.9% |
| Footnote | Description | Footnote(A) | Short-Term Investments are not shown in the top ten chart. |
|
|
| C000147407 |
|
|
| Shareholder Report [Line Items] |
|
|
| Fund Name |
International Equity Fund
|
|
| Class Name |
Class Y
|
|
| Trading Symbol |
SEFCX
|
|
| Annual or Semi-Annual Statement [Text Block] |
This semi-annual shareholder report contains important information about Class Y Shares of the International Equity Fund (the "Fund") for the period from October 1, 2024 to March 31, 2025.
|
|
| Shareholder Report Annual or Semi-Annual |
Semi-Annual Shareholder Report
|
|
| Additional Information [Text Block] |
You can find additional information about the Fund at https://www.seic.com/mutual-fund-documentation/prospectuses-and-reports. You can also request this information by contacting us at 610-676-1000.
|
|
| Additional Information Phone Number |
610-676-1000
|
|
| Additional Information Website |
https://www.seic.com/mutual-fund-documentation/prospectuses-and-reports
|
|
| Expenses [Text Block] |
What were the Fund costs for the last six months?(based on a hypothetical $10,000 investment) Fund Name | Costs of a $10,000 investment | Costs paid as a percentage of a $10,000 investment |
|---|
International Equity Fund, Class Y Shares | $42 | 0.84%Footnote Reference(1) |
|---|
| Footnote | Description | Footnote(1) | The expense ratio includes a proxy fee expense. Had this expense been excluded the ratio would have been 0.82%. |
|
|
| Expenses Paid, Amount |
$ 42
|
|
| Expense Ratio, Percent |
0.84%
|
[3] |
| AssetsNet |
$ 3,445,653,000
|
|
| Holdings Count | Holding |
744
|
|
| Advisory Fees Paid, Amount |
$ 8,828
|
|
| InvestmentCompanyPortfolioTurnover |
45.00%
|
|
| Additional Fund Statistics [Text Block] |
Key Fund Statistics as of March 31, 2025 | Total Net Assets (000's) | Number of Holdings | Total Advisory Fees Paid (000's) | Portfolio Turnover Rate |
|---|
| $3,445,653 | 744 | $8,828 | 45% |
|---|
|
|
| Holdings [Text Block] |
Country WeightingsFootnote Reference*Value | Value |
|---|
Futures Contracts | 0.0% | Total Return Swaps | 0.2% | Other Countries | 17.8% | Sweden | 2.3% | Denmark | 2.8% | China | 3.4% | Italy | 3.5% | Switzerland | 4.0% | Australia | 4.1% | Netherlands | 4.6% | France | 6.7% | United Kingdom | 11.1% | Germany | 11.6% | Japan | 12.6% | United States | 13.1% |
| Footnote | Description | Footnote* | Percentages are calculated based on total net assets. |
|
|
| Largest Holdings [Text Block] |
Holding Name | | | Percentage of
Total Net AssetsFootnote Reference(A) |
|---|
U.S. Treasury Bill, 4.26%, 8/28/2025 | | | 3.0% | Roche Holding AG | | | 2.4% | SAP SE | | | 1.8% | Alibaba Group Holding Ltd | | | 0.9% | Equinor ASA | | | 0.9% | ING Groep NV | | | 0.9% | Sea Ltd ADR | | | 0.9% | Daimler Truck Holding AG | | | 0.9% | Novartis AG | | | 0.9% | GSK PLC | | | 0.9% |
| Footnote | Description | Footnote(A) | Short-Term Investments are not shown in the top ten chart. |
|
|
| C000017609 |
|
|
| Shareholder Report [Line Items] |
|
|
| Fund Name |
Emerging Markets Equity Fund
|
|
| Class Name |
Class F
|
|
| Trading Symbol |
SIEMX
|
|
| Annual or Semi-Annual Statement [Text Block] |
This semi-annual shareholder report contains important information about Class F Shares of the Emerging Markets Equity Fund (the "Fund") for the period from October 1, 2024 to March 31, 2025.
|
|
| Shareholder Report Annual or Semi-Annual |
Semi-Annual Shareholder Report
|
|
| Additional Information [Text Block] |
You can find additional information about the Fund at https://www.seic.com/mutual-fund-documentation/prospectuses-and-reports. You can also request this information by contacting us at 610-676-1000.
|
|
| Additional Information Phone Number |
610-676-1000
|
|
| Additional Information Website |
https://www.seic.com/mutual-fund-documentation/prospectuses-and-reports
|
|
| Expenses [Text Block] |
What were the Fund costs for the last six months?(based on a hypothetical $10,000 investment) Fund Name | Costs of a $10,000 investment | Costs paid as a percentage of a $10,000 investment |
|---|
Emerging Markets Equity Fund, Class F Shares | $62 | 1.28%Footnote Reference(1) |
|---|
| Footnote | Description | Footnote(1) | The expense ratio includes a proxy fee expense. Had this expense been excluded the ratio would have been 1.26%. |
|
|
| Expenses Paid, Amount |
$ 62
|
|
| Expense Ratio, Percent |
1.28%
|
[4] |
| AssetsNet |
$ 1,399,874,000
|
|
| Holdings Count | Holding |
479
|
|
| Advisory Fees Paid, Amount |
$ 5,043
|
|
| InvestmentCompanyPortfolioTurnover |
30.00%
|
|
| Additional Fund Statistics [Text Block] |
Key Fund Statistics as of March 31, 2025 | Total Net Assets (000's) | Number of Holdings | Total Advisory Fees Paid (000's) | Portfolio Turnover Rate |
|---|
| $1,399,874 | 479 | $5,043 | 30% |
|---|
|
|
| Holdings [Text Block] |
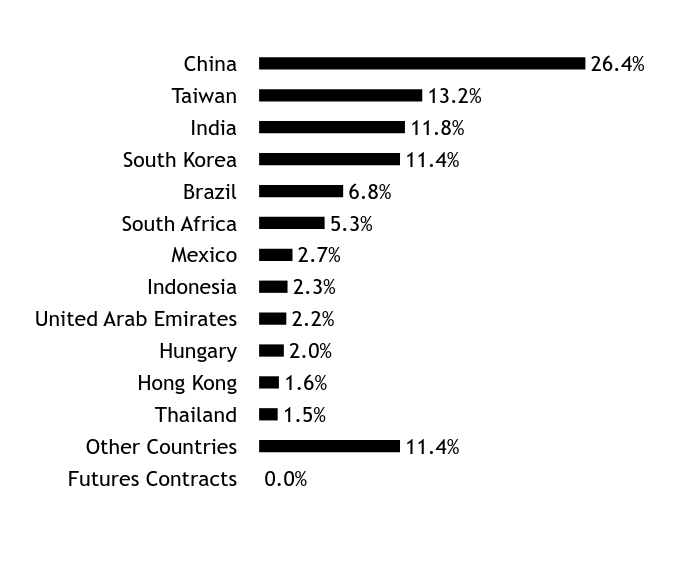
Country WeightingsFootnote Reference*Value | Value |
|---|
Futures Contracts | 0.0% | Other Countries | 11.4% | Thailand | 1.5% | Hong Kong | 1.6% | Hungary | 2.0% | United Arab Emirates | 2.2% | Indonesia | 2.3% | Mexico | 2.7% | South Africa | 5.3% | Brazil | 6.8% | South Korea | 11.4% | India | 11.8% | Taiwan | 13.2% | China | 26.4% |
| Footnote | Description | Footnote* | Percentages are calculated based on total net assets. |
|
|
| Largest Holdings [Text Block] |
Holding Name | | | Percentage of
Total Net AssetsFootnote Reference(A) |
|---|
Taiwan Semiconductor Manufacturing Co Ltd | | | 6.3% | Alibaba Group Holding Ltd | | | 3.8% | Tencent Holdings Ltd | | | 2.9% | Samsung Electronics Co Ltd | | | 2.0% | Naspers Ltd, Cl N | | | 2.0% | Meituan, Cl B | | | 1.5% | HDFC Bank Ltd ADR | | | 1.5% | Emaar Properties PJSC | | | 1.4% | Kia Corp | | | 1.3% | Itau Unibanco Holding SA ADR | | | 1.3% |
| Footnote | Description | Footnote(A) | Cash Equivalents are not shown in the top ten chart. |
|
|
| C000147409 |
|
|
| Shareholder Report [Line Items] |
|
|
| Fund Name |
Emerging Markets Equity Fund
|
|
| Class Name |
Class Y
|
|
| Trading Symbol |
SEQFX
|
|
| Annual or Semi-Annual Statement [Text Block] |
This semi-annual shareholder report contains important information about Class Y Shares of the Emerging Markets Equity Fund (the "Fund") for the period from October 1, 2024 to March 31, 2025.
|
|
| Shareholder Report Annual or Semi-Annual |
Semi-Annual Shareholder Report
|
|
| Additional Information [Text Block] |
You can find additional information about the Fund at https://www.seic.com/mutual-fund-documentation/prospectuses-and-reports. You can also request this information by contacting us at 610-676-1000.
|
|
| Additional Information Phone Number |
610-676-1000
|
|
| Additional Information Website |
https://www.seic.com/mutual-fund-documentation/prospectuses-and-reports
|
|
| Expenses [Text Block] |
What were the Fund costs for the last six months?(based on a hypothetical $10,000 investment) Fund Name | Costs of a $10,000 investment | Costs paid as a percentage of a $10,000 investment |
|---|
Emerging Markets Equity Fund, Class Y Shares | $50 | 1.03%Footnote Reference(1) |
|---|
| Footnote | Description | Footnote(1) | The expense ratio includes a proxy fee expense. Had this expense been excluded the ratio would have been 1.01%. |
|
|
| Expenses Paid, Amount |
$ 50
|
|
| Expense Ratio, Percent |
1.03%
|
[5] |
| AssetsNet |
$ 1,399,874,000
|
|
| Holdings Count | Holding |
479
|
|
| Advisory Fees Paid, Amount |
$ 5,043
|
|
| InvestmentCompanyPortfolioTurnover |
30.00%
|
|
| Additional Fund Statistics [Text Block] |
Key Fund Statistics as of March 31, 2025 | Total Net Assets (000's) | Number of Holdings | Total Advisory Fees Paid (000's) | Portfolio Turnover Rate |
|---|
| $1,399,874 | 479 | $5,043 | 30% |
|---|
|
|
| Holdings [Text Block] |
Country WeightingsFootnote Reference*Value | Value |
|---|
Futures Contracts | 0.0% | Other Countries | 11.4% | Thailand | 1.5% | Hong Kong | 1.6% | Hungary | 2.0% | United Arab Emirates | 2.2% | Indonesia | 2.3% | Mexico | 2.7% | South Africa | 5.3% | Brazil | 6.8% | South Korea | 11.4% | India | 11.8% | Taiwan | 13.2% | China | 26.4% |
| Footnote | Description | Footnote* | Percentages are calculated based on total net assets. |
|
|
| Largest Holdings [Text Block] |
Holding Name | | | Percentage of
Total Net AssetsFootnote Reference(A) |
|---|
Taiwan Semiconductor Manufacturing Co Ltd | | | 6.3% | Alibaba Group Holding Ltd | | | 3.8% | Tencent Holdings Ltd | | | 2.9% | Samsung Electronics Co Ltd | | | 2.0% | Naspers Ltd, Cl N | | | 2.0% | Meituan, Cl B | | | 1.5% | HDFC Bank Ltd ADR | | | 1.5% | Emaar Properties PJSC | | | 1.4% | Kia Corp | | | 1.3% | Itau Unibanco Holding SA ADR | | | 1.3% |
| Footnote | Description | Footnote(A) | Cash Equivalents are not shown in the top ten chart. |
|
|
| C000017608 |
|
|
| Shareholder Report [Line Items] |
|
|
| Fund Name |
International Fixed Income Fund
|
|
| Class Name |
Class F
|
|
| Trading Symbol |
SEFIX
|
|
| Annual or Semi-Annual Statement [Text Block] |
This semi-annual shareholder report contains important information about Class F Shares of the International Fixed Income Fund (the "Fund") for the period from October 1, 2024 to March 31, 2025.
|
|
| Shareholder Report Annual or Semi-Annual |
Semi-Annual Shareholder Report
|
|
| Additional Information [Text Block] |
You can find additional information about the Fund at https://www.seic.com/mutual-fund-documentation/prospectuses-and-reports. You can also request this information by contacting us at 610-676-1000.
|
|
| Additional Information Phone Number |
610-676-1000
|
|
| Additional Information Website |
https://www.seic.com/mutual-fund-documentation/prospectuses-and-reports
|
|
| Expenses [Text Block] |
What were the Fund costs for the last six months?(based on a hypothetical $10,000 investment) Fund Name | Costs of a $10,000 investment | Costs paid as a percentage of a $10,000 investment |
|---|
International Fixed Income Fund, Class F Shares | $51 | 0.98%Footnote Reference(1) |
|---|
| Footnote | Description | Footnote(1) | The expense ratio includes a proxy fee expense. Had this expense been excluded the ratio would have been 0.96%. |
|
|
| Expenses Paid, Amount |
$ 51
|
|
| Expense Ratio, Percent |
0.98%
|
[6] |
| AssetsNet |
$ 357,360,000
|
|
| Holdings Count | Holding |
1,237
|
|
| Advisory Fees Paid, Amount |
$ 552
|
|
| InvestmentCompanyPortfolioTurnover |
50.00%
|
|
| Additional Fund Statistics [Text Block] |
Key Fund Statistics as of March 31, 2025 | Total Net Assets (000's) | Number of Holdings | Total Advisory Fees Paid (000's) | Portfolio Turnover Rate |
|---|
| $357,360 | 1,237 | $552 | 50% |
|---|
|
|
| Holdings [Text Block] |
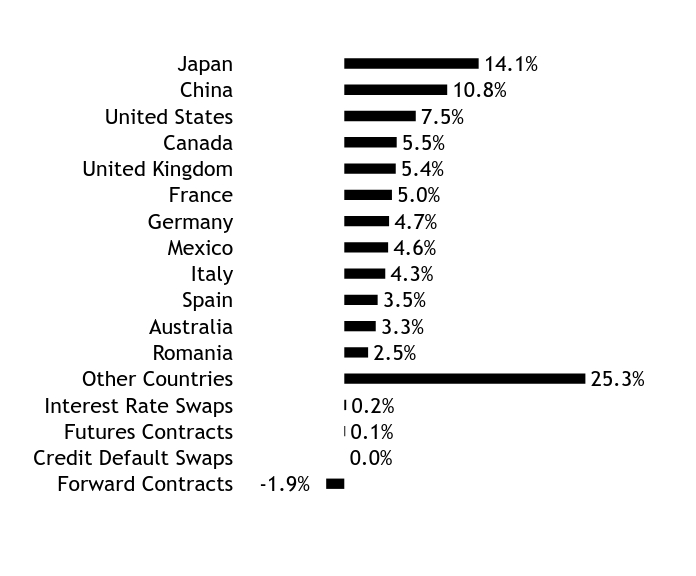
Country WeightingsFootnote Reference*Value | Value |
|---|
Forward Contracts | -1.9% | Credit Default Swaps | 0.0% | Futures Contracts | 0.1% | Interest Rate Swaps | 0.2% | Other Countries | 25.3% | Romania | 2.5% | Australia | 3.3% | Spain | 3.5% | Italy | 4.3% | Mexico | 4.6% | Germany | 4.7% | France | 5.0% | United Kingdom | 5.4% | Canada | 5.5% | United States | 7.5% | China | 10.8% | Japan | 14.1% |
| Footnote | Description | Footnote* | Percentages are calculated based on total net assets. |
|
|
| Largest Holdings [Text Block] |
Holding Name | Coupon Rate | Maturity Date | Percentage of Total
Net AssetsFootnote Reference(A) |
|---|
U.S. Treasury Bill | 4.236%
| 06/26/25
| 2.1% | Bank of China | 3.200%
| 10/18/25
| 1.7% | Japan Government Thirty Year Bond | 2.300%
| 03/20/40
| 1.5% | Kingdom of Belgium Government Bond | 3.100%
| 06/22/35
| 1.4% | Colombian TES | 6.000%
| 04/28/28
| 1.4% | China Government Bond | 2.550%
| 10/15/28
| 1.4% | Industrial & Commercial Bank of China | 3.200%
| 10/25/25
| 1.3% | European Union Bill | 0.000%
| 05/09/25
| 1.2% | Italy Buoni Poliennali Del Tesoro | 3.350%
| 07/01/29
| 1.2% | Japan Treasury Discount Bill | 0.000%
| 05/12/25
| 1.2% |
| Footnote | Description | Footnote(A) | Short-Term Investments are not shown in the top ten chart. |
|
|
| C000147408 |
|
|
| Shareholder Report [Line Items] |
|
|
| Fund Name |
International Fixed Income Fund
|
|
| Class Name |
Class Y
|
|
| Trading Symbol |
SIFIX
|
|
| Annual or Semi-Annual Statement [Text Block] |
This semi-annual shareholder report contains important information about Class Y Shares of the International Fixed Income Fund (the "Fund") for the period from October 1, 2024 to March 31, 2025.
|
|
| Shareholder Report Annual or Semi-Annual |
Semi-Annual Shareholder Report
|
|
| Additional Information [Text Block] |
You can find additional information about the Fund at https://www.seic.com/mutual-fund-documentation/prospectuses-and-reports. You can also request this information by contacting us at 610-676-1000.
|
|
| Additional Information Phone Number |
610-676-1000
|
|
| Additional Information Website |
https://www.seic.com/mutual-fund-documentation/prospectuses-and-reports
|
|
| Expenses [Text Block] |
What were the Fund costs for the last six months?(based on a hypothetical $10,000 investment) Fund Name | Costs of a $10,000 investment | Costs paid as a percentage of a $10,000 investment |
|---|
International Fixed Income Fund, Class Y Shares | $38 | 0.73%Footnote Reference(1) |
|---|
| Footnote | Description | Footnote(1) | The expense ratio includes a proxy fee expense. Had this expense been excluded the ratio would have been 0.71%. |
|
|
| Expenses Paid, Amount |
$ 38
|
|
| Expense Ratio, Percent |
0.73%
|
[7] |
| AssetsNet |
$ 357,360,000
|
|
| Holdings Count | Holding |
1,237
|
|
| Advisory Fees Paid, Amount |
$ 552
|
|
| InvestmentCompanyPortfolioTurnover |
50.00%
|
|
| Additional Fund Statistics [Text Block] |
Key Fund Statistics as of March 31, 2025 | Total Net Assets (000's) | Number of Holdings | Total Advisory Fees Paid (000's) | Portfolio Turnover Rate |
|---|
| $357,360 | 1,237 | $552 | 50% |
|---|
|
|
| Holdings [Text Block] |
Country WeightingsFootnote Reference*Value | Value |
|---|
Forward Contracts | -1.9% | Credit Default Swaps | 0.0% | Futures Contracts | 0.1% | Interest Rate Swaps | 0.2% | Other Countries | 25.3% | Romania | 2.5% | Australia | 3.3% | Spain | 3.5% | Italy | 4.3% | Mexico | 4.6% | Germany | 4.7% | France | 5.0% | United Kingdom | 5.4% | Canada | 5.5% | United States | 7.5% | China | 10.8% | Japan | 14.1% |
| Footnote | Description | Footnote* | Percentages are calculated based on total net assets. |
|
|
| Largest Holdings [Text Block] |
Holding Name | Coupon Rate | Maturity Date | Percentage of Total
Net AssetsFootnote Reference(A) |
|---|
U.S. Treasury Bill | 4.236%
| 06/26/25
| 2.1% | Bank of China | 3.200%
| 10/18/25
| 1.7% | Japan Government Thirty Year Bond | 2.300%
| 03/20/40
| 1.5% | Kingdom of Belgium Government Bond | 3.100%
| 06/22/35
| 1.4% | Colombian TES | 6.000%
| 04/28/28
| 1.4% | China Government Bond | 2.550%
| 10/15/28
| 1.4% | Industrial & Commercial Bank of China | 3.200%
| 10/25/25
| 1.3% | European Union Bill | 0.000%
| 05/09/25
| 1.2% | Italy Buoni Poliennali Del Tesoro | 3.350%
| 07/01/29
| 1.2% | Japan Treasury Discount Bill | 0.000%
| 05/12/25
| 1.2% |
| Footnote | Description | Footnote(A) | Short-Term Investments are not shown in the top ten chart. |
|
|
| C000017610 |
|
|
| Shareholder Report [Line Items] |
|
|
| Fund Name |
Emerging Markets Debt Fund
|
|
| Class Name |
Class F
|
|
| Trading Symbol |
SITEX
|
|
| Annual or Semi-Annual Statement [Text Block] |
This semi-annual shareholder report contains important information about Class F Shares of the Emerging Markets Debt Fund (the "Fund") for the period from October 1, 2024 to March 31, 2025.
|
|
| Shareholder Report Annual or Semi-Annual |
Semi-Annual Shareholder Report
|
|
| Additional Information [Text Block] |
You can find additional information about the Fund at https://www.seic.com/mutual-fund-documentation/prospectuses-and-reports. You can also request this information by contacting us at 610-676-1000.
|
|
| Additional Information Phone Number |
610-676-1000
|
|
| Additional Information Website |
https://www.seic.com/mutual-fund-documentation/prospectuses-and-reports
|
|
| Expenses [Text Block] |
What were the Fund costs for the last six months?(based on a hypothetical $10,000 investment) Fund Name | Costs of a $10,000 investment | Costs paid as a percentage of a $10,000 investment |
|---|
Emerging Markets Debt Fund, Class F Shares | $54 | 1.08%Footnote Reference(1) |
|---|
| Footnote | Description | Footnote(1) | The expense ratio includes a proxy fee expense. Had this expense been excluded the ratio would have been 1.06%. |
|
|
| Expenses Paid, Amount |
$ 54
|
|
| Expense Ratio, Percent |
1.08%
|
[8] |
| AssetsNet |
$ 901,293,000
|
|
| Holdings Count | Holding |
893
|
|
| Advisory Fees Paid, Amount |
$ 1,736
|
|
| InvestmentCompanyPortfolioTurnover |
101.00%
|
|
| Additional Fund Statistics [Text Block] |
Key Fund Statistics as of March 31, 2025 | Total Net Assets (000's) | Number of Holdings | Total Advisory Fees Paid (000's) | Portfolio Turnover Rate |
|---|
| $901,293 | 893 | $1,736 | 101% |
|---|
|
|
| Holdings [Text Block] |
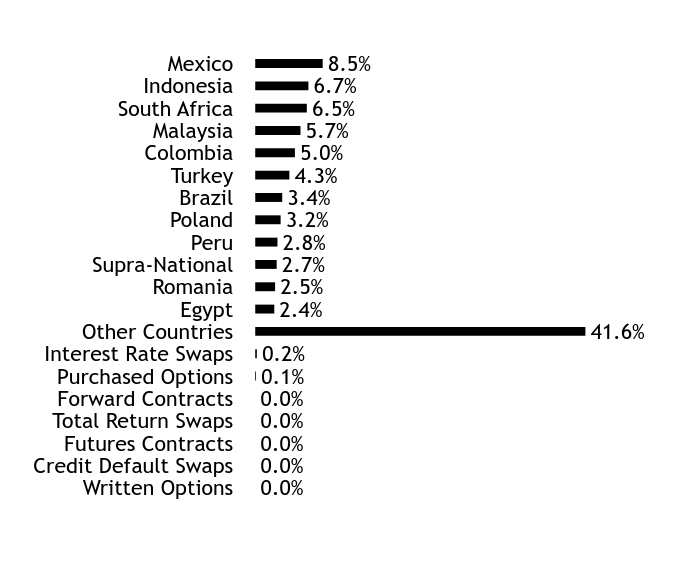
Country WeightingsFootnote Reference*Value | Value |
|---|
Written Options | 0.0% | Credit Default Swaps | 0.0% | Futures Contracts | 0.0% | Total Return Swaps | 0.0% | Forward Contracts | 0.0% | Purchased Options | 0.1% | Interest Rate Swaps | 0.2% | Other Countries | 41.6% | Egypt | 2.4% | Romania | 2.5% | Supra-National | 2.7% | Peru | 2.8% | Poland | 3.2% | Brazil | 3.4% | Turkey | 4.3% | Colombia | 5.0% | Malaysia | 5.7% | South Africa | 6.5% | Indonesia | 6.7% | Mexico | 8.5% |
| Footnote | Description | Footnote* | Percentages are calculated based on total net assets. |
|
|
| Largest Holdings [Text Block] |
Holding Name | Coupon Rate | Maturity Date | Percentage of Total
Net AssetsFootnote Reference(A) |
|---|
Indonesia Treasury Bond | 6.750%
| 07/15/35
| 1.0% | Mexican Bonos | 8.500%
| 03/02/28
| 0.9% | Republic of South Africa Government Bond, ZAR | 8.750%
| 01/31/44
| 0.9% | Malaysia Government Bond, MYR | 3.955%
| 09/15/25
| 0.9% | Peru Government Bond | 5.400%
| 08/12/34
| 0.8% | Petroleos Mexicanos | 7.690%
| 01/23/50
| 0.8% | Mexican Bonos, MXN | 7.750%
| 11/13/42
| 0.8% | Republic of South Africa Government Bond, ZAR | 8.000%
| 01/31/30
| 0.8% | Republic of South Africa Government Bond, ZAR | 8.750%
| 02/28/48
| 0.8% | Petroleos Mexicanos | 6.750%
| 09/21/47
| 0.8% |
| Footnote | Description | Footnote(A) | Short-Term Investments are not shown in the top ten chart. |
|
|
| C000147410 |
|
|
| Shareholder Report [Line Items] |
|
|
| Fund Name |
Emerging Markets Debt Fund
|
|
| Class Name |
Class Y
|
|
| Trading Symbol |
SIEDX
|
|
| Annual or Semi-Annual Statement [Text Block] |
This semi-annual shareholder report contains important information about Class Y Shares of the Emerging Markets Debt Fund (the "Fund") for the period from October 1, 2024 to March 31, 2025.
|
|
| Shareholder Report Annual or Semi-Annual |
Semi-Annual Shareholder Report
|
|
| Additional Information [Text Block] |
You can find additional information about the Fund at https://www.seic.com/mutual-fund-documentation/prospectuses-and-reports. You can also request this information by contacting us at 610-676-1000.
|
|
| Additional Information Phone Number |
610-676-1000
|
|
| Additional Information Website |
https://www.seic.com/mutual-fund-documentation/prospectuses-and-reports
|
|
| Expenses [Text Block] |
What were the Fund costs for the last six months?(based on a hypothetical $10,000 investment) Fund Name | Costs of a $10,000 investment | Costs paid as a percentage of a $10,000 investment |
|---|
Emerging Markets Debt Fund, Class Y Shares | $41 | 0.83%Footnote Reference(1) |
|---|
| Footnote | Description | Footnote(1) | The expense ratio includes a proxy fee expense. Had this expense been excluded the ratio would have been 0.81%. |
|
|
| Expenses Paid, Amount |
$ 41
|
|
| Expense Ratio, Percent |
0.83%
|
[9] |
| AssetsNet |
$ 901,293,000
|
|
| Holdings Count | Holding |
893
|
|
| Advisory Fees Paid, Amount |
$ 1,736
|
|
| InvestmentCompanyPortfolioTurnover |
101.00%
|
|
| Additional Fund Statistics [Text Block] |
Key Fund Statistics as of March 31, 2025 | Total Net Assets (000's) | Number of Holdings | Total Advisory Fees Paid (000's) | Portfolio Turnover Rate |
|---|
| $901,293 | 893 | $1,736 | 101% |
|---|
|
|
| Holdings [Text Block] |
Country WeightingsFootnote Reference*Value | Value |
|---|
Written Options | 0.0% | Credit Default Swaps | 0.0% | Futures Contracts | 0.0% | Total Return Swaps | 0.0% | Forward Contracts | 0.0% | Purchased Options | 0.1% | Interest Rate Swaps | 0.2% | Other Countries | 41.6% | Egypt | 2.4% | Romania | 2.5% | Supra-National | 2.7% | Peru | 2.8% | Poland | 3.2% | Brazil | 3.4% | Turkey | 4.3% | Colombia | 5.0% | Malaysia | 5.7% | South Africa | 6.5% | Indonesia | 6.7% | Mexico | 8.5% |
| Footnote | Description | Footnote* | Percentages are calculated based on total net assets. |
|
|
| Largest Holdings [Text Block] |
Holding Name | Coupon Rate | Maturity Date | Percentage of Total
Net AssetsFootnote Reference(A) |
|---|
Indonesia Treasury Bond | 6.750%
| 07/15/35
| 1.0% | Mexican Bonos | 8.500%
| 03/02/28
| 0.9% | Republic of South Africa Government Bond, ZAR | 8.750%
| 01/31/44
| 0.9% | Malaysia Government Bond, MYR | 3.955%
| 09/15/25
| 0.9% | Peru Government Bond | 5.400%
| 08/12/34
| 0.8% | Petroleos Mexicanos | 7.690%
| 01/23/50
| 0.8% | Mexican Bonos, MXN | 7.750%
| 11/13/42
| 0.8% | Republic of South Africa Government Bond, ZAR | 8.000%
| 01/31/30
| 0.8% | Republic of South Africa Government Bond, ZAR | 8.750%
| 02/28/48
| 0.8% | Petroleos Mexicanos | 6.750%
| 09/21/47
| 0.8% |
| Footnote | Description | Footnote(A) | Short-Term Investments are not shown in the top ten chart. |
|
|
|
|