Shareholder Report
Mar. 31, 2025
USD ($)
Holding
This report describes changes to the Fund that occurred during the reporting period.
Fund Expenses
(Based on a hypothetical $10,000 investment)
| Fund (Class) | Costs of a $10,000 investment | Costs paid as a percentage of a $10,000 investment |
| Aspiriant Risk-Managed Equity Allocation Fund (Advisor class/RMEAX) |
$30 | 0.29% |
Management’s Discussion of Fund Performance
SUMMARY OF RESULTS
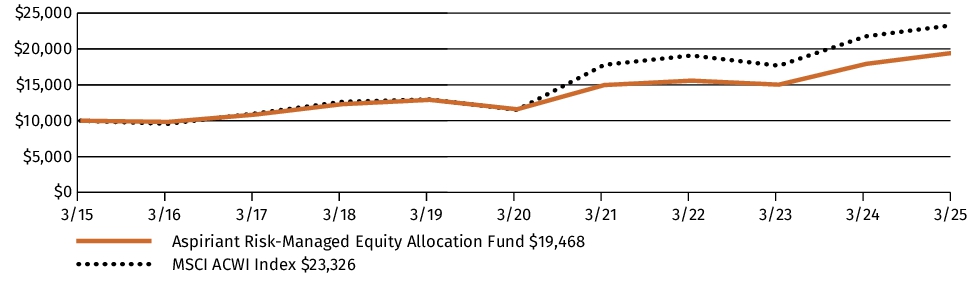
The Aspiriant Risk-Managed Equity Allocation Fund ("Equity Allocation Fund" or the "Fund") returned 8.63% for the fiscal year ended March 31, 2025. Over the same period, Equity Allocation Fund's benchmark, the MSCI ACWI Index, returned 7.15% and MSCI ACWI Minimum Volatility Index returned 12.95%.
TOP PERFORMANCE CONTRIBUTORS
The Fund's sub-advisers and underlying funds that have a low volatility mandate returned approximately 12.88% for the one-year period ended March 31, 2025, as low volatility and value stocks outperformed growth stocks for the first time in years.
The Fund's investments in private funds, RIEF Strategic Partners Fund LLC and Viking Global Equities LP, returned 21.43% for the one-year period ended March 31, 2025. The increase in volatility and a pull back by the U.S. Large Cap Growth stocks that have been leading indexes higher benefited these funds.
TOP PERFORMANCE DETRACTORS
The underlying funds and sub-advisers who used quality strategies returned 6.98%, as growth stocks that make up a larger portion of the securities in these strategies did not do as well as value stocks over the past twelve months.
GMO Equity Dislocation Investment Fund returned -1.96%.
The below referenced unmanaged indices do not reflect the deduction of fees and taxes associated with a mutual fund, such as investment management and fund accounting fees. Investors cannot invest directly in an index, although they can invest in their underlying securities.
The MSCI ACWI Index is a free float-adjusted market capitalization weighted index that is designed to measure the equity performance of developed and emerging markets.
MSCI ACWI Minimum Volatility Index is composed of developed and emerging market equities that, in the aggregate, have lower volatility characteristics relative to the broader developed and emerging equity markets.
Fund Performance
The following graph and chart compare the initial and subsequent account values at the end of each of the most recently completed 10 fiscal years of the Fund, or for the life of the Fund, if shorter. It assumes a $10,000 initial investment at the beginning of the first fiscal year in an appropriate, broad-based securities market index for the same period.
GROWTH OF $10,000
| AVERAGE ANNUAL TOTAL RETURN | 1 Year | 5 Years | 10 Years |
| Aspiriant Risk-Managed Equity Allocation Fund (Advisor class/RMEAX) | 8.63% | 10.92% | 6.89% |
| MSCI ACWI Index | 7.15% | 15.18% | 8.84% |
The graph and table do not reflect the deduction of taxes that a shareholder would pay on Fund distributions or redemption of Fund shares.
Visit https://aspiriantfunds.com/aspiriant-risk-managed-equity-allocation-fund/fund-performance/ for the most recent performance information.
Key Fund Statistics
The following table outlines key fund statistics that you should pay attention to.
| Fund net assets | $1,296,717,774 |
| Total number of portfolio holdings | 190 |
| Total advisory fees paid (net) | $2,195,917 |
| Portfolio turnover rate as of the end of the reporting period | 19% |
Graphical Representation of Holdings
The tables below show the investment makeup of the Fund, representing percentage of the total net assets of the Fund. The Top Ten Holdings exclude short-term holdings, if any. The Top Ten Holdings table may not reflect the total exposure to an issuer.
Top Ten Holdings
| GMO Quality Fund - Class VI | 31.9% |
| RIEF Strategic Partners Fund LLC | 9.5% |
| Schwab Fundamental Emerging Markets Equity ETF | 6.1% |
| iShares MSCI Global Min Vol Factor ETF | 5.5% |
| AQR Large Cap Defensive Style Fund - Class R6 | 4.7% |
| GMO Equity Dislocation Investment Fund - Class A | 4.4% |
| Viking Global Equities LP | 4.3% |
| Baillie Gifford Emerging Markets Equities Fund - Class K | 4.0% |
| iShares MSCI ACWI ETF | 3.2% |
| Apple, Inc. | 1.2% |
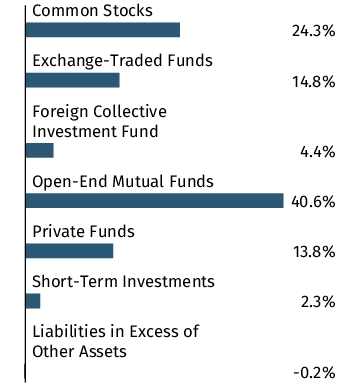
Asset Allocation
Top Ten Holdings
| GMO Quality Fund - Class VI | 31.9% |
| RIEF Strategic Partners Fund LLC | 9.5% |
| Schwab Fundamental Emerging Markets Equity ETF | 6.1% |
| iShares MSCI Global Min Vol Factor ETF | 5.5% |
| AQR Large Cap Defensive Style Fund - Class R6 | 4.7% |
| GMO Equity Dislocation Investment Fund - Class A | 4.4% |
| Viking Global Equities LP | 4.3% |
| Baillie Gifford Emerging Markets Equities Fund - Class K | 4.0% |
| iShares MSCI ACWI ETF | 3.2% |
| Apple, Inc. | 1.2% |
Material Fund Changes
On December 6, 2024 (the "Effective Date"), Foreside Financial Group, LLC completed its acquisition of UMB Distribution Services, LLC, the Funds's distributor. In connection with the acquisition, as of the Effective Date, the Fund's distributor changed its name to Distribution Services, LLC.
Under the Administration Agreement, the Equity Allocation Fund agreed to pay the Adviser at an annual rate of 0.10% of average daily net assets. Prior to August 1, 2024, the Adviser has contractually agreed to waive expenses at a rate of 0.06% of average daily net assets such that the Fund was incurring a net administrative services fee at an annual rate of 0.04% of average daily net assets. Effective August 1, 2024, the contractual waiver was adjusted to 0.05% of average daily net assets resulting in a net administrative services fee of 0.05% of average daily net assets.
This is a summary of certain changes to the Fund since April 1, 2024. For more complete information, you may review the Fund's prospectus, which is dated August 1, 2024 at https://aspiriantfunds.com/aspiriant-risk-managed-equity-allocation-fund/
Changes in and Disagreements with Accountants
There were no changes in or disagreements with the Fund's accountants during the reporting period.
This report describes changes to the Fund that occurred during the reporting period.
Fund Expenses
(Based on a hypothetical $10,000 investment)
| Fund (Class) | Costs of a $10,000 investment | Costs paid as a percentage of a $10,000 investment |
| Aspiriant Risk-Managed Municipal Bond Fund (RMMBX) |
$34 | 0.34% |
Management’s Discussion of Fund Performance
SUMMARY OF RESULTS
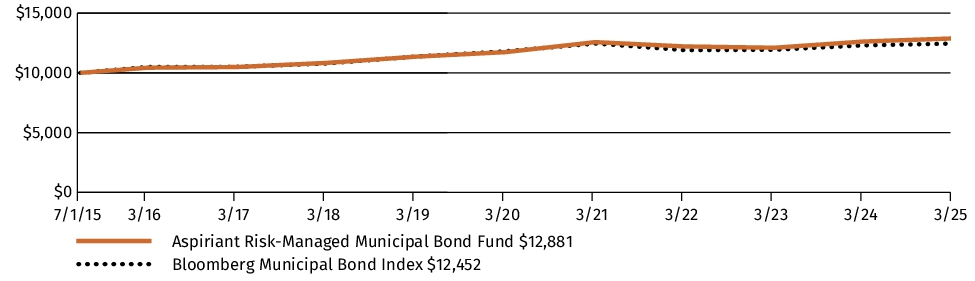
The Aspiriant Risk-Managed Municipal Bond Fund ("Municipal Bond Fund" or the "Fund") returned 2.05% for the fiscal year ended March 31, 2025. Over the same period, the Municipal Bond Fund's benchmark, the Bloomberg Municipal Bond Index (the "Benchmark"), returned 1.22%. High yield municipal bonds, as measured by the Bloomberg High Yield Municipal Bond Index, returned 5.59% for the one-year period ended March 31, 2025, outperforming investment grade bonds, as measured by the Benchmark, for the second straight year.
TOP PERFORMANCE CONTRIBUTORS
The Fund's sub-advisers, with higher portions of their portfolios in high yield investments, were the top performers with Nuveen Asset Management, LLC and MacKay Shields, LLC returning approximately 3.13% and 2.14%, respectively.
TOP PERFORMANCE DETRACTORS
The only underlying fund to underperform the Benchmark was the iShares National Muni Bond ETF with an approximate return of 1.01% for the fiscal year ended March 31, 2025.
The below referenced unmanaged indices do not reflect the deduction of fees and taxes associated with a mutual fund, such as investment management and fund accounting fees. Investors cannot invest directly in an index, although they can invest in their underlying securities.
The Bloomberg Municipal Bond Index is considered representative of the tax-exempt bond market. It includes most investment-grade tax-exempt bonds that are issued by state and local governments.
The Bloomberg High Yield Municipal Index measures the non-investment-grade and nonrated U.S. dollar-denominated, fixed-rate, tax-exempt bond market within the 50 United States and four other qualifying regions (Washington, D.C.; Puerto Rico; Guam; and the Virgin Islands). The index allows state and local general obligation, revenue, insured, and prerefunded bonds; however, historically the index has been composed of mostly revenue bonds.
Fund Performance
The following graph and chart compare the initial and subsequent account values at the end of each of the most recently completed 10 fiscal years of the Fund, or for the life of the Fund, if shorter. It assumes a $10,000 initial investment at the beginning of the first fiscal year in an appropriate, broad-based securities market index for the same period.
GROWTH OF $10,000
| AVERAGE ANNUAL TOTAL RETURN | 1 Year | 5 Years | Since Inception* |
| Aspiriant Risk-Managed Municipal Bond Fund (RMMBX) | 2.05% | 1.88% | 2.63% |
| Bloomberg Municipal Bond Index | 1.22% | 1.07% | 2.27% |
|
*
|
Commenced operations as of the close of business on July 1, 2015.
|
The graph and table do not reflect the deduction of taxes that a shareholder would pay on Fund distributions or redemption of Fund shares.
Visit https://aspiriantfunds.com/aspiriant-risk-managed-municipal-bond-fund/fund-performance/ for the most recent performance information.
Key Fund Statistics
The following table outlines key fund statistics that you should pay attention to.
| Fund net assets | $1,223,780,058 |
| Total number of portfolio holdings | 930 |
| Total advisory fees paid (net) | $2,658,502 |
| Portfolio turnover rate as of the end of the reporting period | 23% |
Graphical Representation of Holdings
The tables below show the investment makeup of the Fund, representing percentage of the total net assets of the Fund. The Top Ten Holdings exclude short-term holdings, if any. The Top Ten Holdings table may not reflect the total exposure to an issuer. The interest rates presented in the Top Ten Holdings are as of the reporting period end.
Top Ten Holdings
| iShares National Muni Bond ETF | 11.3% |
| MacKay Municipal Opportunities Fund, LP | 8.1% |
| MacKay Municipal Credit Opportunities Fund, LP | 2.5% |
| City of New York, 5.25%, 03/1/2053, Call 03/1/2034 | 0.4% |
| Port Authority of New York & New Jersey, 5.00%, 10/15/2041, Call 10/15/2025 | 0.4% |
| Illinois Finance Authority, 5.25%, 05/15/2048, Call 05/15/2033 | 0.4% |
| New Jersey Transportation Trust Fund Authority, 5.00%, 06/15/2048, Call 12/15/2032 | 0.4% |
| Shelby County Health Educational & Housing Facilities Board, AGM, 3.55%, 06/1/2042, Call 05/1/2025 | 0.3% |
| Puerto Rico Sales Tax Financing Corp. Sales Tax Revenue, 5.00%, 07/1/2058, Call 07/1/2028 | 0.3% |
| Port of Portland Airport Revenue, 5.25%, 07/1/2049, Call 07/1/2034 | 0.3% |
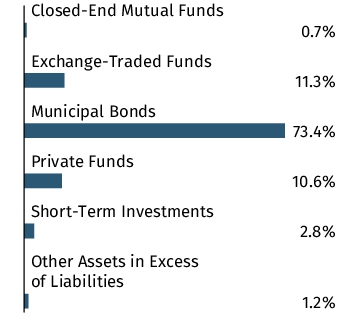
Asset Allocation
Top Ten Holdings
| iShares National Muni Bond ETF | 11.3% |
| MacKay Municipal Opportunities Fund, LP | 8.1% |
| MacKay Municipal Credit Opportunities Fund, LP | 2.5% |
| City of New York, 5.25%, 03/1/2053, Call 03/1/2034 | 0.4% |
| Port Authority of New York & New Jersey, 5.00%, 10/15/2041, Call 10/15/2025 | 0.4% |
| Illinois Finance Authority, 5.25%, 05/15/2048, Call 05/15/2033 | 0.4% |
| New Jersey Transportation Trust Fund Authority, 5.00%, 06/15/2048, Call 12/15/2032 | 0.4% |
| Shelby County Health Educational & Housing Facilities Board, AGM, 3.55%, 06/1/2042, Call 05/1/2025 | 0.3% |
| Puerto Rico Sales Tax Financing Corp. Sales Tax Revenue, 5.00%, 07/1/2058, Call 07/1/2028 | 0.3% |
| Port of Portland Airport Revenue, 5.25%, 07/1/2049, Call 07/1/2034 | 0.3% |
Material Fund Changes
On December 6, 2024 (the "Effective Date"), Foreside Financial Group, LLC completed its acquisition of UMB Distribution Services, LLC, the Fund's distributor. In connection with the acquisition, as of the Effective Date, the Fund's distributor changed its name to Distribution Services, LLC.
Under the Administration Agreement, the Municipal Bond Fund agreed to pay the Adviser at an annual rate of 0.10% of average daily net assets. Prior to August 1, 2024, the Adviser had contractually agreed to waive expenses at a rate of 0.07% of average daily net assets such that the Fund was incurring a net administrative services fee at an annual rate of 0.03% of average daily net assets. Effective August 1, 2024, the contractual waiver was adjusted to 0.06% of average daily net assets resulting in a net administrative services fee of 0.04% of daily net assets.
This is a summary of certain changes to the Fund since April 1, 2024. For more complete information, you may review the Fund's prospectus, which is dated August 1, 2024 at https://aspiriantfunds.com/
Changes in and Disagreements with Accountants
There were no changes in or disagreements with the Fund's accountants during the reporting period.
This report describes changes to the Fund that occurred during the reporting period.
Fund Expenses
(Based on a hypothetical $10,000 investment)
| Fund (Class) | Costs of a $10,000 investment | Costs paid as a percentage of a $10,000 investment |
| Aspiriant Defensive Allocation Fund (RMDFX) |
$20 | 0.19% |
Management’s Discussion of Fund Performance
SUMMARY OF RESULTS
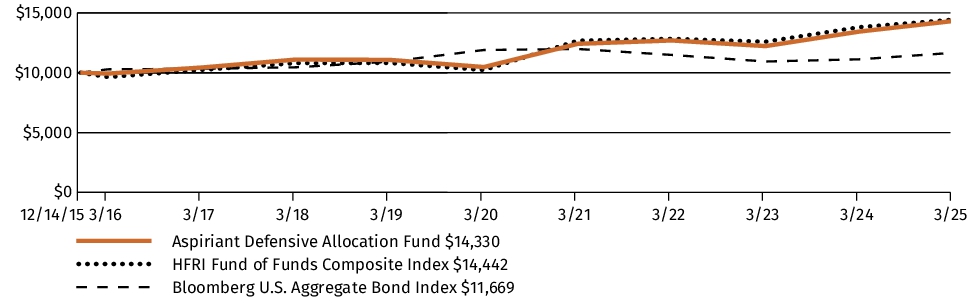
The Aspiriant Defensive Allocation Fund ("Defensive Allocation Fund" or the "Fund") returned 6.55% for the one-year period ended March 31, 2025. Over the same period, the Fund's primary benchmark, the HFRI Fund of Funds Composite Index (the "Benchmark"), returned 4.56%. Over the same period, the Bloomberg U.S. Aggregate Bond Index returned 4.88%.
TOP PERFORMANCE CONTRIBUTORS
Alternative Diversifiers, investments in strategies with return patterns that are less sensitive to movements in traditional markets, provided an approximate return of 8.43% for the one-year period ended March 31, 2025. This category benefited from Eaton Vance Global Macro Absolute Return Advantage Fund and the iShares Gold Trust returning 9.35% and 40.14%, respectively.
Within Alternative Diversifiers, the Fund's allocations to private funds (Millennium International, Ltd. and Elliott Associates, L.P.) performed well with a blended return of 10.06% for the one-year period ended March 31, 2025.
TOP PERFORMANCE DETRACTORS
Core Diversifiers, global asset allocation strategies that invest across a wide range of financial markets and geographies, returned approximately 5.25% for the one-year period ended March 31, 2025. The performance of the Core Diversifiers was mixed as increased volatility brought on by economic uncertainty and the slower than expected pace of stimulus being provided by the U.S. Federal Reserve. Core Diversifiers' performance varied as demonstrated by GMO Benchmark-Free Allocation Fund and JPMorgan Global Allocation Fund, returning 6.04% and 3.62%, respectively.
The Alternative Diversifiers saw performance below the Benchmark from a few underlying funds, including the GMO Equity Dislocation Investment Fund and the BlackRock Event Driven Equity Fund, returning -1.94% and 3.00%, respectively.
The below referenced unmanaged indices do not reflect the deduction of fees and taxes associated with a mutual fund, such as investment management and fund accounting fees. Investors cannot invest directly in an index, although they can invest in their underlying securities.
The HFRI Fund of Funds Composite Index is an index that is a global, equal-weighted index of Fund of Funds that report to HFR Database.
The Bloomberg U.S. Aggregate Bond Index is a broad fixed income, market-value-weighted index generally representative of investment grade fixed-rate debt issues, including government, corporate, asset-backed, and mortgage-backed securities with maturities of at least one year.
Fund Performance
The following graph and chart compare the initial and subsequent account values at the end of each of the most recently completed 10 fiscal years of the Fund, or for the life of the Fund, if shorter. It assumes a $10,000 initial investment at the beginning of the first fiscal year in an appropriate, broad-based securities market index for the same period.
GROWTH OF $10,000
| AVERAGE ANNUAL TOTAL RETURN | 1 Year | 5 Years | Since Inception* |
| Aspiriant Defensive Allocation Fund (RMDFX) | 6.55% | 6.46% | 3.95% |
| HFRI Fund of Funds Composite Index | 4.56% | 7.15% | 4.03% |
| Bloomberg U.S. Aggregate Bond Index | 4.88% | -0.40% | 1.67% |
|
*
|
Commenced operations as of the close of business on December 14, 2015.
|
The graph and table do not reflect the deduction of taxes that a shareholder would pay on Fund distributions or redemption of Fund shares.
Visit https://aspiriantfunds.com/aspiriant-defensive-allocation-fund/fund-performance-2/ for the most recent performance information.
Key Fund Statistics
The following table outlines key fund statistics that you should pay attention to.
| Fund net assets | $971,616,092 |
| Total number of portfolio holdings | 12 |
| Total advisory fees paid (net) | $1,084,492 |
| Portfolio turnover rate as of the end of the reporting period | 5% |
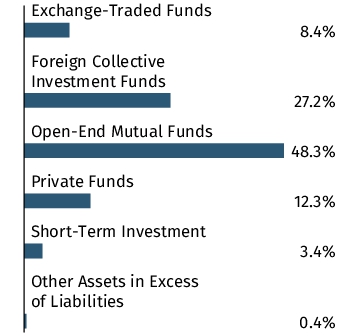
Graphical Representation of Holdings
The tables below show the investment makeup of the Fund, representing percentage of the total net assets of the Fund. The Top Ten Holdings exclude short-term holdings, if any. The Top Ten Holdings table may not reflect the total exposure to an issuer.
Top Ten Holdings
| GMO Benchmark-Free Allocation Fund - Class IV | 25.1% |
| Wilshire Bridgewater Managed Alpha (Ireland) Fund | 13.5% |
| JPMorgan Global Allocation Fund - Class R6 | 11.9% |
| Lazard Rathmore Alternative Fund - Class E | 8.5% |
| Eaton Vance Global Macro Absolute Return Advantage Fund - Class R6 | 7.2% |
| iShares Gold Trust | 6.9% |
| Millennium International, Ltd. - Class GG | 6.7% |
| Elliott Associates, LP | 5.6% |
| GMO Equity Dislocation Investment Fund - Class A | 5.2% |
| BlackRock Event Driven Equity Fund - Institutional Shares | 4.1% |
Asset Allocation
Top Ten Holdings
| GMO Benchmark-Free Allocation Fund - Class IV | 25.1% |
| Wilshire Bridgewater Managed Alpha (Ireland) Fund | 13.5% |
| JPMorgan Global Allocation Fund - Class R6 | 11.9% |
| Lazard Rathmore Alternative Fund - Class E | 8.5% |
| Eaton Vance Global Macro Absolute Return Advantage Fund - Class R6 | 7.2% |
| iShares Gold Trust | 6.9% |
| Millennium International, Ltd. - Class GG | 6.7% |
| Elliott Associates, LP | 5.6% |
| GMO Equity Dislocation Investment Fund - Class A | 5.2% |
| BlackRock Event Driven Equity Fund - Institutional Shares | 4.1% |
Material Fund Changes
On December 6, 2024 (the "Effective Date"), Foreside Financial Group, LLC completed its acquisition of UMB Distribution Services, LLC, the Fund's distributor. In connection with the acquisition, as of the Effective Date, the Fund's distributor changed its name to Distribution Services, LLC.
Under the Administration Agreement, the Defensive Allocation Fund agreed to pay the Adviser at an annual rate of 0.10% of average daily net assets. Prior to August 1, 2024, the Adviser had contractually agreed to waive expenses at a rate of 0.09% of average daily net assets such that the Fund was incurring a net administrative services fee at an annual rate of 0.01% of average daily net assets. Effective August 1, 2024, the contractual waiver was adjusted to 0.08% of average net assets resulting in a net administrative services fee of 0.02% of average daily net assets.
This is a summary of certain changes to the Fund since April 1, 2024. For more complete information, you may review the Fund's prospectus, which is dated August 1, 2024 at https://aspiriantfunds.com/aspiriant-defensive-allocation-fund/
Changes in and Disagreements with Accountants
There were no changes in or disagreements with the Fund's accountants during the reporting period.
This report describes changes to the Fund that occurred during the reporting period.
Fund Expenses
(Based on a hypothetical $10,000 investment)
| Fund (Class) | Costs of a $10,000 investment | Costs paid as a percentage of a $10,000 investment |
| Aspiriant Risk-Managed Taxable Bond Fund (RMTBX) |
$28 | 0.27% |
Management’s Discussion of Fund Performance
SUMMARY OF RESULTS
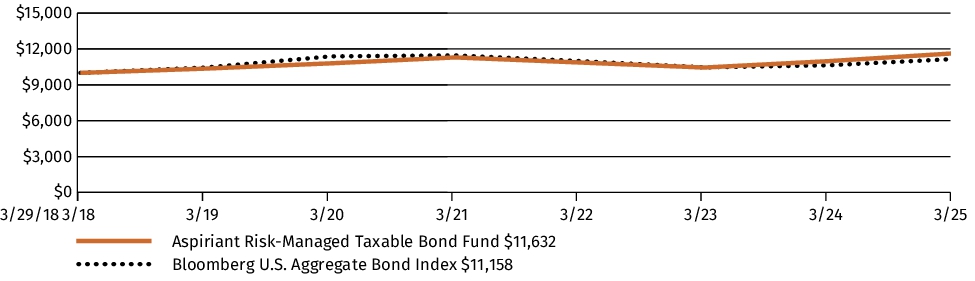
The Aspiriant Risk-Managed Taxable Bond Fund ("Taxable Bond Fund" or the "Fund") returned 5.91% for the fiscal year ended March 31, 2025. Over the same period, Taxable Bond Fund's benchmark, the Bloomberg U.S. Aggregate Bond Index (the "Benchmark"), returned 4.88%. Corporate high yield issues, represented by the Bloomberg U.S. Corporate High Yield Index, once again outperformed investment grade bonds with a return of 7.69% for the fiscal year ended March 31, 2025.
TOP PERFORMANCE CONTRIBUTORS
Active management proved to be beneficial in the volatility that emerged over the course of the year. Funds like the PIMCO Income Fund and River Canyon Total Return Bond Fund each outperformed the Benchmark with approximate returns of 7.43% and 8.13%, respectively.
Investments that generally held higher yielding investments performed even better as they benefited from U.S. continued growth. The Vanguard High-Yield Corporate Fund returned 7.20% for the fiscal year ended March 31, 2025. The Fund's exposure to emerging market debt was also beneficial as the GMO Emerging Country Debt Fund returned approximately 10.98% for the fiscal year ended March 31, 2025.
TOP PERFORMANCE DETRACTORS
The long end of the yield curve underperformed during the year. This was exemplified by the Vanguard Total Bond Market Index Fund which returned approximately 4.87% and the Vanguard Long-Term Treasury ETF which returned approximately 1.32%, both underperforming the Benchmark, for the one-year period ended March 31, 2025.
The below referenced unmanaged indices do not reflect the deduction of fees and taxes associated with a mutual fund, such as investment management and fund accounting fees. Investors cannot invest directly in an index, although they can invest in their underlying securities.
The Bloomberg U.S. Aggregate Bond Index is a broad fixed income, market-value-weighted index generally representative of investment grade fixed-rate debt issues, including government, corporate, asset-backed, and mortgage-backed securities with maturities of at least one year.
The Bloomberg U.S. Corporate High Yield Bond Index is an index that measures the USD-denominated, high yield, fixed-rate corporate bond market. Securities are classified as high yield if the middle rating of Moody's, Fitch and S&P is Ba1/BB+/BB+ or below.
Fund Performance
The following graph and chart compare the initial and subsequent account values at the end of each of the most recently completed 10 fiscal years of the Fund, or for the life of the Fund, if shorter. It assumes a $10,000 initial investment at the beginning of the first fiscal year in an appropriate, broad-based securities market index for the same period.
GROWTH OF $10,000
| AVERAGE ANNUAL TOTAL RETURN | 1 Year | 5 Years | Since Inception* |
| Aspiriant Risk-Managed Taxable Bond Fund (RMTBX) | 5.91% | 1.50% | 2.18% |
| Bloomberg U.S. Aggregate Bond Index | 4.88% | -0.40% | 1.58% |
|
*
|
Commenced operations as of the close of business on March 29, 2018.
|
The graph and table do not reflect the deduction of taxes that a shareholder would pay on Fund distributions or redemption of Fund shares.
Visit https://aspiriantfunds.com/aspiriant-risk-managed-taxable-bond-fund-2/fund-performance/ for the most recent performance information.
Key Fund Statistics
The following table outlines key fund statistics that you should pay attention to.
| Fund net assets | $283,466,692 |
| Total number of portfolio holdings | 11 |
| Total advisory fees paid (net) | $235,556 |
| Portfolio turnover rate as of the end of the reporting period | 15% |
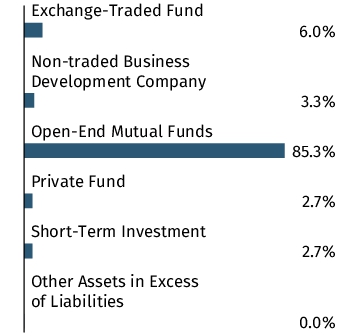
Graphical Representation of Holdings
The tables below show the investment makeup of the Fund, representing percentage of the total net assets of the Fund. The Top Ten Holdings exclude short-term holdings, if any. The Top Ten Holdings table may not reflect the total exposure to an issuer.
Top Ten Holdings
| Vanguard Total Bond Market Index Fund - Institutional Class | 30.5% |
| PIMCO Income Fund - Institutional Class | 15.6% |
| DoubleLine Total Return Bond Fund - I Class | 13.4% |
| Metropolitan West Total Return Bond Fund - Plan Class | 10.1% |
| River Canyon Total Return Bond Fund - Institutional Class | 8.9% |
| Vanguard Long-Term Treasury ETF | 6.0% |
| GMO Emerging Country Debt Fund, Class VI | 6.0% |
| TPG Twin Brook Capital Income Fund - I Class | 3.3% |
| AG Direct Lending Fund IV Annex, LP | 2.7% |
| Vanguard High-Yield Corporate Fund - Admiral Shares | 0.8% |
Asset Allocation
Top Ten Holdings
| Vanguard Total Bond Market Index Fund - Institutional Class | 30.5% |
| PIMCO Income Fund - Institutional Class | 15.6% |
| DoubleLine Total Return Bond Fund - I Class | 13.4% |
| Metropolitan West Total Return Bond Fund - Plan Class | 10.1% |
| River Canyon Total Return Bond Fund - Institutional Class | 8.9% |
| Vanguard Long-Term Treasury ETF | 6.0% |
| GMO Emerging Country Debt Fund, Class VI | 6.0% |
| TPG Twin Brook Capital Income Fund - I Class | 3.3% |
| AG Direct Lending Fund IV Annex, LP | 2.7% |
| Vanguard High-Yield Corporate Fund - Admiral Shares | 0.8% |
Material Fund Changes
On December 6, 2024 (the "Effective Date"), Foreside Financial Group, LLC completed its acquisition of UMB Distribution Services, LLC, the Fund's distributor. In connection with the acquisition, as of the Effective Date, the Fund's distributor changed its name to Distribution Services, LLC.
Under the Administration Agreement, the Taxable Bond Fund agreed to pay the Adviser at an annual rate of 0.10% of average daily net assets. Prior to August 1, 2024, the Adviser had contractually agreed to waive expenses at a rate of 0.07% of average daily net assets such that the Fund was incurring a net administrative services fee at an annual rate of 0.03% of average daily net assets. Effective August 1, 2024, the contractual waiver was adjusted to 0.06% of average daily net assets resulting in a net administrative services fee of 0.04% of daily net assets.
This is a summary of certain changes to the Fund since April 1, 2024. For more complete information, you may review the Fund's prospectus, which is dated August 1, 2024 at https://aspiriantfunds.com/aspiriant-risk-managed-taxable-bond-fund-2/
Changes in and Disagreements with Accountants
There were no changes in or disagreements with the Fund's accountants during the reporting period.