Pay vs Performance Disclosure
Jul. 16, 2023
Apr. 01, 2023
Mar. 30, 2024
Dec. 01, 2022
Mar. 29, 2025
USD ($)
Percentile
Mar. 30, 2024
USD ($)
Percentile
Apr. 01, 2023
USD ($)
Percentile
Apr. 02, 2022
USD ($)
Percentile
Apr. 03, 2021
USD ($)
Percentile
PAY VERSUS PERFORMANCE
As required by Section 953(a) of the Dodd-Frank Act, and Item 402(v) of Regulation
S-K,
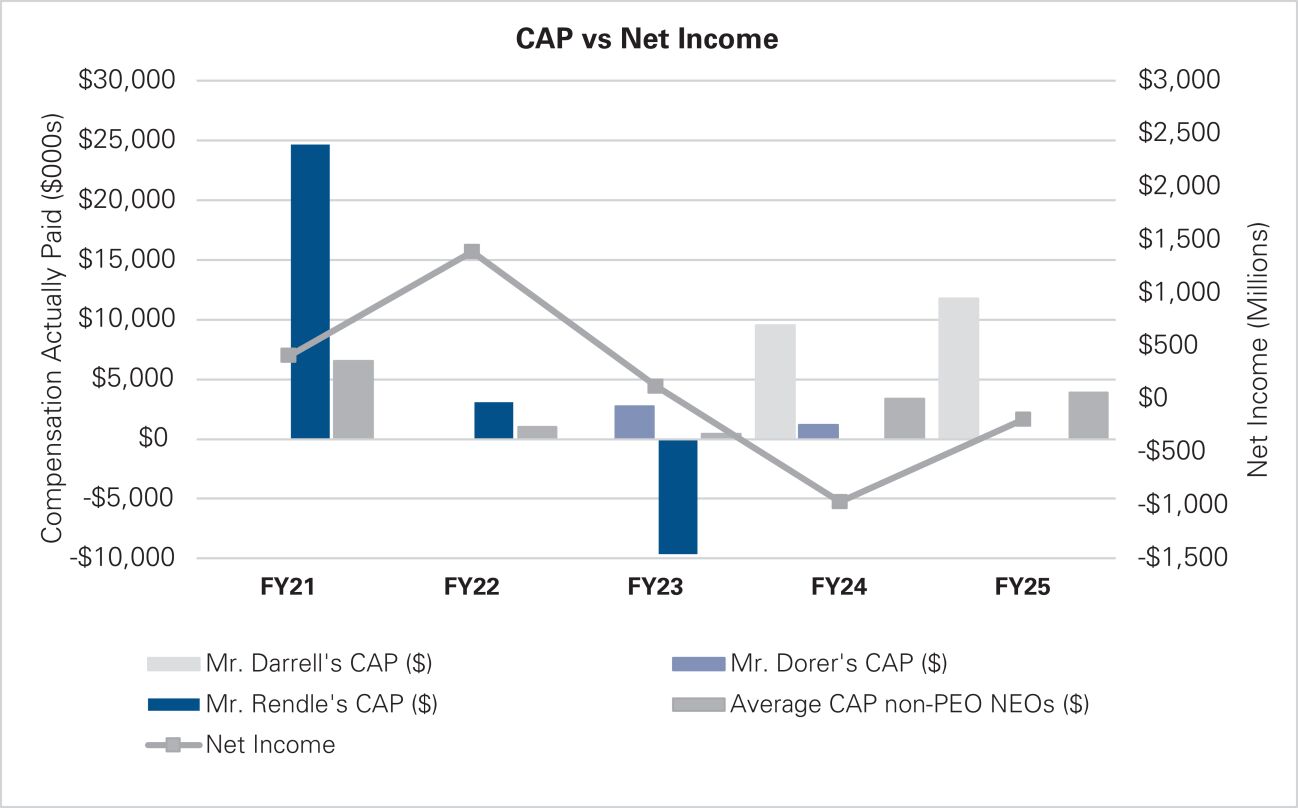
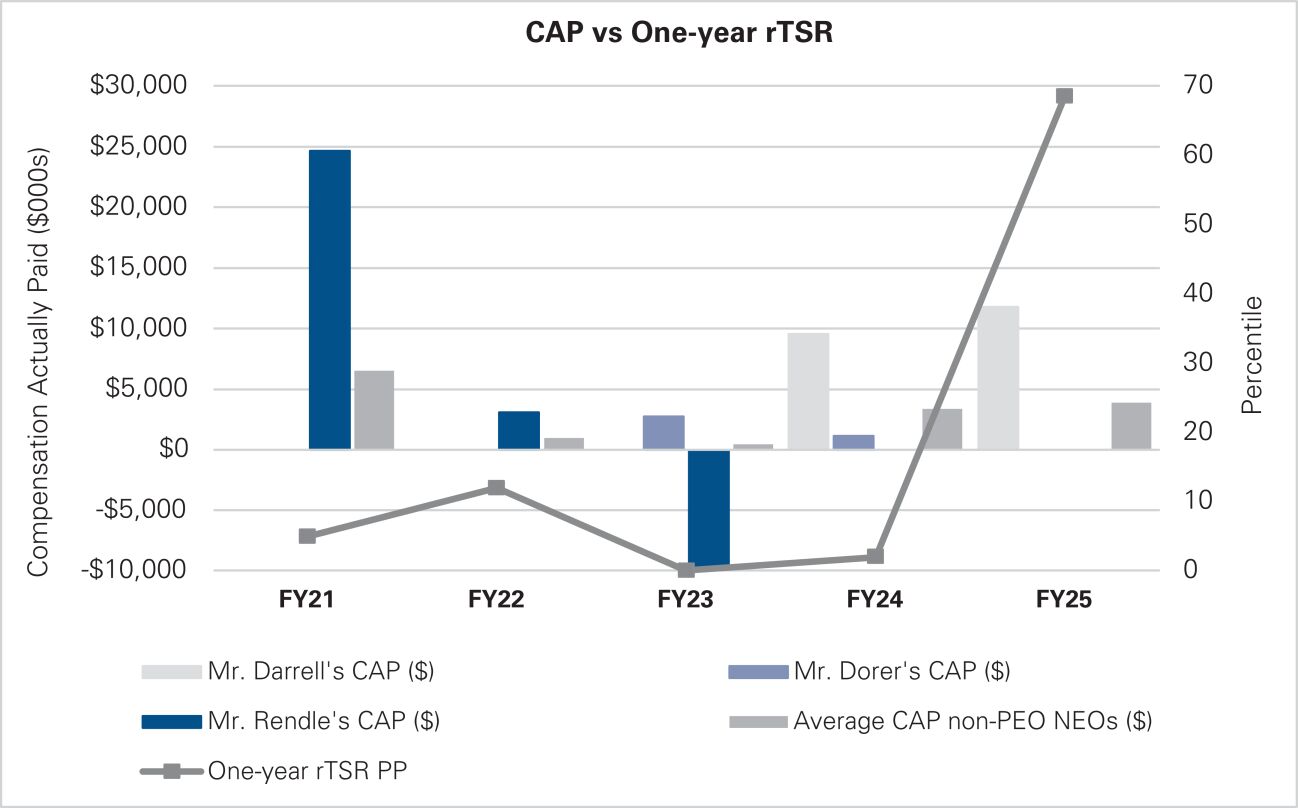
we are providing the following information about the relationship between “compensation actually paid” to our NEOs and certain financial performance of VF. Compensation actually paid, as determined under SEC requirements, does not necessarily reflect the actual amount of compensation earned by or paid to our NEOs. The Committee evaluates compensation decisions in light of VF or individual performance and does not use “compensation actually paid” as a basis for making compensation decisions. For information concerning our compensation philosophy and how we align executive compensation with our performance, see the CD&A above. Value of Initial Fixed $100 Investment Based on |
||||||||||||||||||||||||||||||||||||||||||||||||||||||||||||
Year |
Summary Compensation Table (SCT) Total for Mr. Darrell ($) (1) |
Compensation Actually Paid (CAP) to Mr. Darrell ($) (2) |
Summary Compensation Table (SCT) Total for Mr. Dorer ($) (1) |
Compensation Actually Paid (CAP) to Mr. Dorer ($) (2) |
Summary Compensation Table (SCT) Total for Mr. Rendle ($) (1) |
Compensation Actually Paid (CAP) to Mr. Rendle ($) (2) |
Average SCT Total for Non-PEO NEOs ($) (3) |
Average CAP to Non-PEO NEOs ($) (4) |
TSR ($) (5) |
S&P 1500 Apparel, Accessories & Luxury Goods Subindustry Index TSR ($) (6) |
Net Income (In Millions) ($) (7) |
One-Year rTSR Percentile Rank (8) | ||||||||||||||||||||||||||||||||||||||||||||||||
2025 |
$10,729,899 | $11,786,745 | N/A | N/A | N/A | N/A | $ | 3,585,721 | $3,896,671 | $32.17 | $110.02 | $(189.72 | ) | 69th percentile |
||||||||||||||||||||||||||||||||||||||||||||||
2024 |
13,535,399 | 9,552,700 | 1,971,941 | 1,155,850 | N/A | N/A | 4,630,927 | 3,345,820 | 30.81 | 128.20 | (968.88 | ) | 2nd percentile |
|||||||||||||||||||||||||||||||||||||||||||||||
2023 |
N/A | N/A | 3,037,566 | 2,725,023 | $ | 11,485,534 | $ | (9,632,882 | ) | 4,588,662 | 428,117 | 44.13 | 131.21 | 118.59 | 0th percentile |
|||||||||||||||||||||||||||||||||||||||||||||
2022 |
N/A | N//A | N/A | N/A | 15,423,153 | 3,060,425 | 5,284,304 | 988,855 | 103.36 | 166.43 | 1,386.94 | 12th percentile |
||||||||||||||||||||||||||||||||||||||||||||||||
2021 |
N/A | N//A | N/A | N/A | 15,782,405 | 24,664,101 | 4,244,022 | 6,511,273 | 141.12 | 197.11 | 407.9 | 5th percentile |
||||||||||||||||||||||||||||||||||||||||||||||||
| (1) | The dollar amounts in these columns show the amount of total compensation reported for Messrs. Darrell, Dorer and Rendle in the “Total” column of the Summary Compensation Table in each applicable year. Mr. Darrell was appointed our President and Chief Executive Officer effective July 17, 2023. Mr. Dorer served as our Interim President and Chief Executive Officer from December 2, 2022 to July 16, 2023. Mr. Rendle retired as our Chair, President and Chief Executive Officer effective December 2, 2022. |
| (2) | The dollar amounts reported in these columns represent the amount of “compensation actually paid” to Messrs. Darrell, Dorer and Rendle, as computed in accordance with Item 402(v) of Regulation S-K (“CAP”) in each applicable year. The valuation assumptions used to calculate fair values did not materially differ from those disclosed at the time of grant. In accordance with the requirements of Item 402(v) of Regulation S-K, the following adjustments were made to Messrs. Darrell, Dorer and Rendle’s total compensation for each applicable year to determine their respective CAP: |
Year |
2025 |
|||
PEO |
Mr. Darrell | |||
SCT Total compensation ($) |
10,729,899 | |||
Less: Stock and Option Award Values Reported in SCT for the Covered Year ($) |
(6,725,003 | ) | ||
Plus: Fair Value for Stock and Option Awards Granted in the Covered Year ($) |
9,256,279 | |||
Change in Fair Value of Outstanding Unvested Stock and Option Awards from Prior Years ($) |
(1,410,006 | ) | ||
Change in Fair Value of Stock and Option Awards from Prior Years that Vested in the Covered Year ($) |
(64,424 | ) | ||
Less: Fair Value of Stock and Option Awards Forfeited during the Covered Year ($) |
0 | |||
Less: Aggregate Change in Actuarial Present Value of Accumulated Benefit Under Pension Plans ($) |
0 | |||
Plus: Aggregate Service Cost and Prior Service Cost for Pension Plans ($) |
0 | |||
Compensation Actually Paid ($) |
11,786,745 | |||
| (3) | The dollar amounts in this column represent the average of the amounts of total compensation reported for our NEOs as a group (excluding, as applicable, Messrs. Darrell, Dorer, and Rendle) in the “Total” column of the Summary Compensation Table in each applicable year. NEOs included for purposes of calculating the average amounts in each applicable year are as follows: (i) for fiscal 2025, Messrs. Vogel, Scabbia Guerrini, Hyder, and Puckett and Ms. Sim; (ii) for fiscal 2024, Messrs. Puckett, Bailey, Scabbia Guerrini, and Hyder and Ms. Otto; (iii) for fiscal 2023, Messrs. Puckett, Bailey and Scabbia Guerrini and Ms. Otto; (iv) for fiscal 2022, Messrs. Puckett, Bailey, Scabbia Guerrini, Murray who served as our Global Brand President, The North Face until May 2022 and Roe who served as our Executive Vice President and Chief Financial Officer until May 2021; and (v) for fiscal 2021, Messrs. Roe, Bailey, Scabbia Guerrini and Murray. |
| (4) | The dollar amounts reported in this column represent the average amount of CAP to the NEOs as a group (excluding, as applicable, Messrs. Darrell, Dorer and Rendle) in each applicable year. The valuation assumptions used to calculate fair values did not materially differ from those disclosed at the time of grant. The following adjustments were made to the average total compensation of the NEOs as a group (other than the PEO) for fiscal 2025 to determine the average amount of CAP to the NEOs (excluding, as applicable, Messrs. Darrell, Dorer and Rendle) in fiscal 2025: |
Year |
2025 |
|||
Non-PEO NEOs |
See Note 3 | |||
SCT Total compensation ($) |
3,585,721 | |||
Less: Stock and Option Award Values Reported in SCT for the Covered Year ($) |
(1,971,037 | ) | ||
Plus: Fair Value for Stock and Option Awards Granted in the Covered Year ($) |
2,409,183 | |||
Change in Fair Value of Outstanding Unvested Stock and Option Awards from Prior Years ($) |
(92,540 | ) | ||
Change in Fair Value of Stock and Option Awards from Prior Years that Vested in the Covered Year ($) |
(19,241 | ) | ||
Less: Fair Value of Stock and Option Awards Forfeited during the Covered Year ($) |
(10,015 | ) | ||
Less: Aggregate Change in Actuarial Present Value of Accumulated Benefit Under Pension Plans ($) |
(37,031 | ) | ||
Plus: Aggregate Service Cost and Prior Service Cost for Pension Plans ($) |
31,631 | |||
Compensation Actually Paid ($) |
3,896,671 | |||
| (5) | For the relevant year, represents the cumulative TSR of VF for the 52-week measurement periods ended on March 29, 2025, March 30, 2024, April 1, 2023 and April 2, 2022, and the 53-week measurement period ended on April 3, 2021. |
| (6) | For the relevant year, represents the cumulative TSR of the S&P 1500 Apparel, Accessories & Luxury Goods Subindustry Index companies (“Peer Group TSR”) for the 52-week measurement periods ended on March 29, 2025, March 30, 2024, April 1, 2023 and April 2, 2022, and the 53-week measurement period ended on April 3, 2021. |
| (7) | Reflects “Net Income” in our Consolidated Income Statements included in VF’s Annual Reports on Form 10-K for each of the years ended March 29, 2025, March 30, 2024, April 1, 2023, April 2, 2022 and April 3, 2021. |
| (8) | Company-selected Measure is our one-year TSR relative to the TSR of the applicable S&P Index (the S&P 600 Consumer Discretionary Index for fiscal 2025 and the S&P 500 Consumer Discretionary Index for all other fiscal years) over the same period (“one-year rTSR”). One-year rTSR represents the most important financial measure (as determined by the Company) used to link CAP to our NEOs to Company performance for the most recently completed fiscal year. |
| (3) | The dollar amounts in this column represent the average of the amounts of total compensation reported for our NEOs as a group (excluding, as applicable, Messrs. Darrell, Dorer, and Rendle) in the “Total” column of the Summary Compensation Table in each applicable year. NEOs included for purposes of calculating the average amounts in each applicable year are as follows: (i) for fiscal 2025, Messrs. Vogel, Scabbia Guerrini, Hyder, and Puckett and Ms. Sim; (ii) for fiscal 2024, Messrs. Puckett, Bailey, Scabbia Guerrini, and Hyder and Ms. Otto; (iii) for fiscal 2023, Messrs. Puckett, Bailey and Scabbia Guerrini and Ms. Otto; (iv) for fiscal 2022, Messrs. Puckett, Bailey, Scabbia Guerrini, Murray who served as our Global Brand President, The North Face until May 2022 and Roe who served as our Executive Vice President and Chief Financial Officer until May 2021; and (v) for fiscal 2021, Messrs. Roe, Bailey, Scabbia Guerrini and Murray. |
| (6) | For the relevant year, represents the cumulative TSR of the S&P 1500 Apparel, Accessories & Luxury Goods Subindustry Index companies (“Peer Group TSR”) for the 52-week measurement periods ended on March 29, 2025, March 30, 2024, April 1, 2023 and April 2, 2022, and the 53-week measurement period ended on April 3, 2021. |
| (2) | The dollar amounts reported in these columns represent the amount of “compensation actually paid” to Messrs. Darrell, Dorer and Rendle, as computed in accordance with Item 402(v) of Regulation S-K (“CAP”) in each applicable year. The valuation assumptions used to calculate fair values did not materially differ from those disclosed at the time of grant. In accordance with the requirements of Item 402(v) of Regulation S-K, the following adjustments were made to Messrs. Darrell, Dorer and Rendle’s total compensation for each applicable year to determine their respective CAP: |
Year |
2025 |
|||
PEO |
Mr. Darrell | |||
SCT Total compensation ($) |
10,729,899 | |||
Less: Stock and Option Award Values Reported in SCT for the Covered Year ($) |
(6,725,003 | ) | ||
Plus: Fair Value for Stock and Option Awards Granted in the Covered Year ($) |
9,256,279 | |||
Change in Fair Value of Outstanding Unvested Stock and Option Awards from Prior Years ($) |
(1,410,006 | ) | ||
Change in Fair Value of Stock and Option Awards from Prior Years that Vested in the Covered Year ($) |
(64,424 | ) | ||
Less: Fair Value of Stock and Option Awards Forfeited during the Covered Year ($) |
0 | |||
Less: Aggregate Change in Actuarial Present Value of Accumulated Benefit Under Pension Plans ($) |
0 | |||
Plus: Aggregate Service Cost and Prior Service Cost for Pension Plans ($) |
0 | |||
Compensation Actually Paid ($) |
11,786,745 | |||
| (4) | The dollar amounts reported in this column represent the average amount of CAP to the NEOs as a group (excluding, as applicable, Messrs. Darrell, Dorer and Rendle) in each applicable year. The valuation assumptions used to calculate fair values did not materially differ from those disclosed at the time of grant. The following adjustments were made to the average total compensation of the NEOs as a group (other than the PEO) for fiscal 2025 to determine the average amount of CAP to the NEOs (excluding, as applicable, Messrs. Darrell, Dorer and Rendle) in fiscal 2025: |
Year |
2025 |
|||
Non-PEO NEOs |
See Note 3 | |||
SCT Total compensation ($) |
3,585,721 | |||
Less: Stock and Option Award Values Reported in SCT for the Covered Year ($) |
(1,971,037 | ) | ||
Plus: Fair Value for Stock and Option Awards Granted in the Covered Year ($) |
2,409,183 | |||
Change in Fair Value of Outstanding Unvested Stock and Option Awards from Prior Years ($) |
(92,540 | ) | ||
Change in Fair Value of Stock and Option Awards from Prior Years that Vested in the Covered Year ($) |
(19,241 | ) | ||
Less: Fair Value of Stock and Option Awards Forfeited during the Covered Year ($) |
(10,015 | ) | ||
Less: Aggregate Change in Actuarial Present Value of Accumulated Benefit Under Pension Plans ($) |
(37,031 | ) | ||
Plus: Aggregate Service Cost and Prior Service Cost for Pension Plans ($) |
31,631 | |||
Compensation Actually Paid ($) |
3,896,671 | |||

List of Financial Performance Measures Used to Link CAP for the Most Recently Completed Fiscal Year to Company Performance
The financial performance metrics that, in our assessment, represent the most important financial performance measures we use to link CAP to our NEOs for fiscal 2025 to VF’s performance are as follows:
• |
One-year rTSR; |
• |
Revenue; and |
• |
Operating Income. |