Shareholder Report
Mar. 31, 2025
USD ($)
Holding
This report describes changes to the Fund that occurred during the reporting period.
Fund Expenses
(Based on a hypothetical $10,000 investment)
| Fund (Class) | Costs of a $10,000 investment | Costs paid as a percentage of a $10,000 investment |
| Astoria Real Assets ETF (PPI) |
$68 | 0.71% |
Management's Discussion of Fund Performance
SUMMARY OF RESULTS
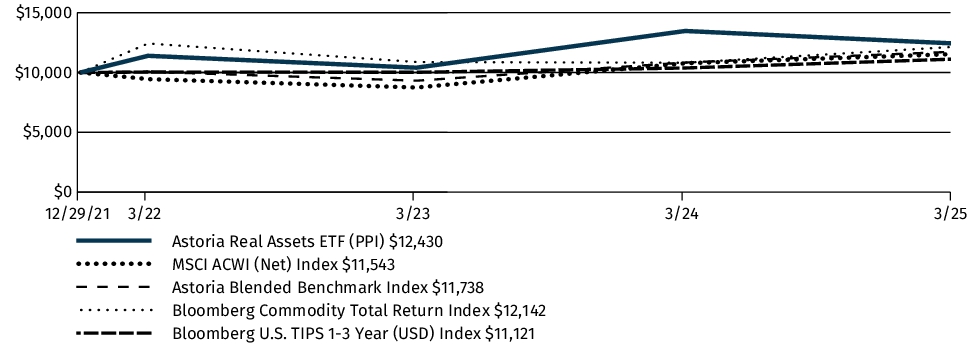
The Astoria Real Assets ETF (PPI) returned -7.74% during the 1-year period ending 3/31/2025, while its benchmark (70% MSCI All Country World Index, 20% Bloomberg Commodity Index, and 10% Bloomberg US TIPS 1-3 Year) Index returned 8.34%. The ETF was incepted on 12/29/2021 and is an actively managed strategy.
Equities negatively contributed to the lion’s share of the ETF’s return, while both commodities and our fixed income positions positively contributed to the ETF’s performance.
TOP PERFORMANCE CONTRIBUTORS
The largest contributors were Rolls-Royce Holdings plc, Rheinmetall AG, and CRH public limited company, which added 1.85%, 1.82%, and 0.94%, respectively, to the Fund’s performance.
The SPDR Gold MiniShares Trust (GLDM) contributed 1.83% to the Fund’s performance, while the Aberdeen Physical Precious Metals Basket Shares ETF (GLTR) and the WisdomTree Enhanced Commodity Strategy Fund (GCC) increased the ETF’s return by 0.40% and 0.03%, respectively.
TIPS (Treasury Inflation-Protected Securities) also positively contributed to the Fund’s performance as the iShares 0-5 Year TIPS Bond ETF (STIP), Schwab US TIPS ETF (SCHP), and the Vanguard Short-Term Inflation Protected Securities ETF (VTIP) added 0.26%, 0.16%, and 0.15%, respectively.
TOP PERFORMANCE DETRACTORS
The largest detractors were Tokyo Electron Ltd., Celanese Corporation, and Cleanspark, Inc., which subtracted 0.98%, 0.91%, and 0.81%, respectively, from the ETF’s return.
Fund Performance
The following graph and chart compare the initial and subsequent account values at the end of each of the most recently completed 10 fiscal years of the Fund or for the life of the Fund, if shorter. It assumes a $10,000 initial investment at the beginning of the first fiscal year in an appropriate, broad-based securities market index for the same period.
GROWTH OF $10,000
| AVERAGE ANNUAL TOTAL RETURN | 1 Year | Since Inception1 |
| Astoria Real Assets ETF (PPI) | -7.74% | 6.92% |
| MSCI ACWI (Net) Index | 7.15% | 4.51% |
| Astoria Blended Benchmark Index | 8.34% | 5.05% |
| Bloomberg Commodity Total Return Index | 12.28% | 6.15% |
| Bloomberg U.S. TIPS 1-3 Year (USD) Index | 7.15% | 3.32% |
|
1
|
The Fund commenced operations on December 29, 2021.
|
The graph and table do not reflect the deduction of taxes that a shareholder would pay on Fund distributions or redemption of Fund shares.
Visit www.axsinvestments.com/ppi/#performance-section for the most recent performance information.
Key Fund Statistics
The following table outlines key fund statistics that you should pay attention to.
| Fund net assets | $50,773,528 |
| Total number of portfolio holdings | 66 |
| Total advisory fees paid (net) | $439,059 |
| Portfolio turnover rate as of the end of the reporting period | 159% |
Graphical Representation of Holdings
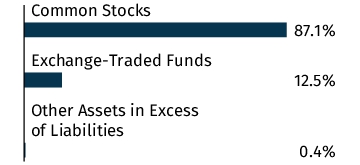
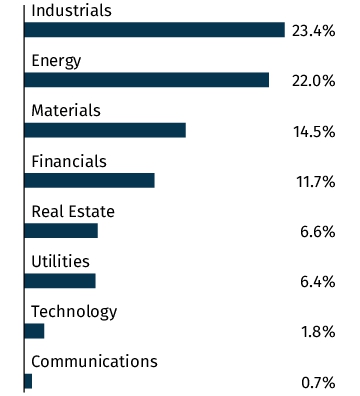
The tables below show the investment makeup of the Fund, representing percentage of the total net assets of the Fund. The Top Ten Holdings and Sector Allocation exclude short-term holdings, if any. The Sector Allocation chart represents Common Stocks of the Fund.
Top Ten Holdings
| SPDR Gold MiniShares Trust | 6.1% |
| Shell PLC | 4.6% |
| Rolls-Royce Holdings PLC | 4.0% |
| iShares 0-5 Year TIPS Bond ETF | 3.8% |
| JPMorgan Chase & Co. | 3.5% |
| Exxon Mobil Corp. | 3.4% |
| Rheinmetall A.G. | 2.9% |
| Simon Property Group, Inc. | 2.9% |
| Mitsubishi Heavy Industries Ltd. | 2.8% |
| United Rentals, Inc. | 2.6% |
Asset Allocation
Sector Allocation
Top Ten Holdings
| SPDR Gold MiniShares Trust | 6.1% |
| Shell PLC | 4.6% |
| Rolls-Royce Holdings PLC | 4.0% |
| iShares 0-5 Year TIPS Bond ETF | 3.8% |
| JPMorgan Chase & Co. | 3.5% |
| Exxon Mobil Corp. | 3.4% |
| Rheinmetall A.G. | 2.9% |
| Simon Property Group, Inc. | 2.9% |
| Mitsubishi Heavy Industries Ltd. | 2.8% |
| United Rentals, Inc. | 2.6% |
Material Fund Changes
On March 12, 2025, the Fund changed its name to Astoria Real Assets ETF. Prior to March 12, 2025, the Fund's name was AXS Astoria Real Assets ETF, which changed its name from AXS Astoria Inflation Sensitive ETF on October 15, 2024.
On October 15, 2024, the Fund also changed its principal investment strategy to invests at least 80% of its net assets in investments providing significant exposure to real assets (“real asset-related investments”). The Fund's real asset-related investments consist of securities across multiple asset classes that have the potential to benefit, either directly or indirectly, from increases in the rate of rising costs of goods and services (i.e., inflation). Real asset-related investments include (i) commodity/natural resource-related securities, such as equity securities of companies engaged in the energy, financials, industrial, and materials sectors, (ii) global inflation-protected debt securities, and (iii) global real estate-related securities. These investments may also include investments in other ETFs (“Underlying ETFs”) that directly or indirectly invest in commodities or fixed income securities. The Fund's investments in equity interests are generally expected to include common stock, general and limited partnership interests of publicly traded master limited partnerships (“MLPs”), and units of royalty trusts. The Fund may invest in non-U.S. securities, including depositary receipts. AXS Investments LLC serves as the Fund's investment advisor (the “Advisor”) and Astoria Portfolio Advisors LLC serves as the investment sub-advisor to the Fund (“Astoria”). Astoria manages the investment strategy and portfolio selection for the Fund.
At the close of business on June 7, 2024, KL Allocation Fund reorganized to the Fund. The reorganization provided for the transfer of assets and the assumption of the liabilities of the KL Allocation Fund to the Fund.
This is a summary of certain changes to the Fund since April 1, 2024. For more complete information, you may review the Fund's prospectus, which is dated July 31, 2024, as amended August 13, 2024 at https://www.axsinvestments.com/ppi/#literature.
On March 12, 2025, the Fund changed its name to Astoria Real Assets ETF. Prior to March 12, 2025, the Fund's name was AXS Astoria Real Assets ETF, which changed its name from AXS Astoria Inflation Sensitive ETF on October 15, 2024.
On October 15, 2024, the Fund also changed its principal investment strategy to invests at least 80% of its net assets in investments providing significant exposure to real assets (“real asset-related investments”). The Fund's real asset-related investments consist of securities across multiple asset classes that have the potential to benefit, either directly or indirectly, from increases in the rate of rising costs of goods and services (i.e., inflation). Real asset-related investments include (i) commodity/natural resource-related securities, such as equity securities of companies engaged in the energy, financials, industrial, and materials sectors, (ii) global inflation-protected debt securities, and (iii) global real estate-related securities. These investments may also include investments in other ETFs (“Underlying ETFs”) that directly or indirectly invest in commodities or fixed income securities. The Fund's investments in equity interests are generally expected to include common stock, general and limited partnership interests of publicly traded master limited partnerships (“MLPs”), and units of royalty trusts. The Fund may invest in non-U.S. securities, including depositary receipts. AXS Investments LLC serves as the Fund's investment advisor (the “Advisor”) and Astoria Portfolio Advisors LLC serves as the investment sub-advisor to the Fund (“Astoria”). Astoria manages the investment strategy and portfolio selection for the Fund.
This is a summary of certain changes to the Fund since April 1, 2024. For more complete information, you may review the Fund's prospectus, which is dated July 31, 2024, as amended August 13, 2024 at https://www.axsinvestments.com/ppi/#literature.
Changes in and Disagreements with Accountants
There were no changes in or disagreements with the Fund's accountants during the reporting period.
This report describes changes to the Fund that occurred during the reporting period.
Fund Expenses
(Based on a hypothetical $10,000 investment)
| Fund (Class) | Costs of a $10,000 investment | Costs paid as a percentage of a $10,000 investment |
| AXS Change Finance ESG ETF (CHGX) |
$49 | 0.49% |
Management's Discussion of Fund Performance
SUMMARY OF RESULTS
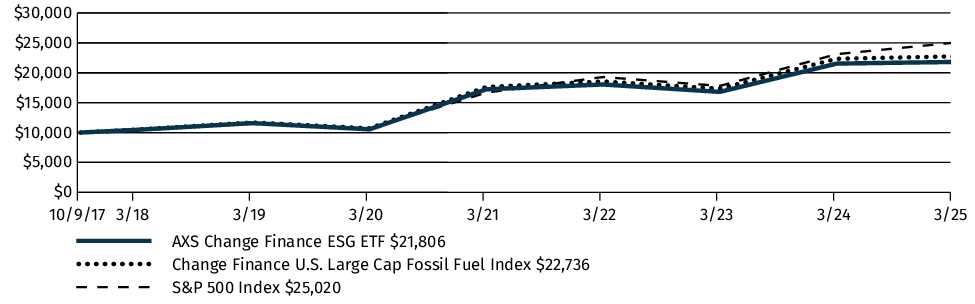
For the 12-month period ended March 31, 2025, the Fund returned +1.27%, underperforming its benchmark, the S&P 500 Index, which returned +8.25%. The Fund primarily invested in large- and mid-cap U.S. equities across various sectors, with a focus on companies that meet rigorous environmental, social, and governance (ESG) criteria.
The Fund’s performance improved notably in the final quarter of the period. Key drivers included the exclusion of Tesla Inc. due to ESG criteria and underweight exposure to NVIDIA Corp., both of which declined sharply. The Fund’s equal weight methodology also boosted results through overweights in strong performers like AutoZone and O’Reilly Automotive.
TOP PERFORMANCE CONTRIBUTORS
Energy | Contributed approximately +0.26% to relative performance. The Fund does not invest in fossil fuel companies and was therefore significantly underweight this sector, which declined over the period. This underweight exposure resulted in a positive allocation effect.
Information Technology | Detracted approximately –2.93% from relative performance, the Fund’s largest sector drag. CHGX’s equal weight exposure to mega caps like Apple Inc. and NVIDIA Corp. limited upside participation earlier in the year and contributed –1.26% and –0.72%, respectively, to underperformance. However, the strategy proved protective in Q1, when NVIDIA fell sharply and CHGX’s underweight contributed +0.36% to relative performance. Meanwhile, Microsoft Corp., removed mid-year for ESG reasons, contributed +1.25% to relative performance. Together, these positions illustrate how the Fund’s approach reduces concentration risk and can cushion downside, though it may lag when a few dominant stocks drive the benchmark.
TOP PERFORMANCE DETRACTORS
Consumer Staples | Detracted approximately –1.14%, largely due to poor stock selection. Estée Lauder significantly underperformed and contributed approximately –0.54% to relative returns. Nike Inc. also declined, further weighing on sector attribution.
Consumer Discretionary | Detracted approximately –1.08%, also driven by selection effect. A notable laggard was Lennar Corp., a homebuilder that underperformed its benchmark peers and contributed approximately –0.38% to relative results.
Utilities | Detracted approximately –0.16% from performance. Both allocation and selection effects were negative, with holdings underperforming benchmark peers and the Fund maintaining an unfavorable weighting.
Fund Performance
The following graph and chart compare the initial and subsequent account values at the end of each of the most recently completed 10 fiscal years of the Fund or for the life of the Fund, if shorter. It assumes a $10,000 initial investment at the beginning of the first fiscal year in an appropriate, broad-based securities market index for the same period.
GROWTH OF $10,000
| AVERAGE ANNUAL TOTAL RETURN | 1 Year | 5 Years | Since Inception1 |
| AXS Change Finance ESG ETF (CHGX) | 1.27% | 15.65% | 10.99% |
| Change Finance U.S. Large Cap Fossil Fuel Index | 1.77% | 16.25% | 11.62% |
| S&P 500 index | 8.25% | 18.59% | 13.05% |
|
1
|
The Fund commenced operations on October 9, 2017.
|
The graph and table do not reflect the deduction of taxes that a shareholder would pay on Fund distributions or redemption of Fund shares.
Visit https://stancefunds.com/chgx/ for the most recent performance information.
Key Fund Statistics
The following table outlines key fund statistics that you should pay attention to.
| Fund net assets | $125,287,163 |
| Total number of portfolio holdings | 100 |
| Total advisory fees paid (net) | $632,901 |
| Portfolio turnover rate as of the end of the reporting period | 45% |
Graphical Representation of Holdings
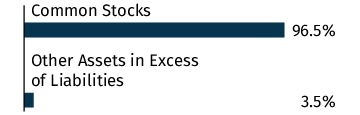
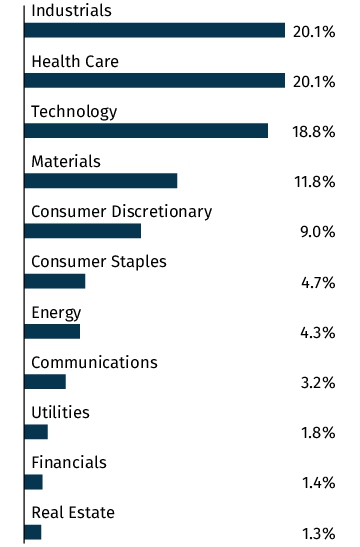
The tables below show the investment makeup of the Fund, representing percentage of the total net assets of the Fund. The Top Ten Holdings and Sector Allocation exclude short-term holdings, if any. The Sector Allocation chart represents Common Stocks of the Fund.
Top Ten Holdings
| HCA Healthcare, Inc. | 1.2% |
| Cencora, Inc. | 1.2% |
| AutoZone, Inc. | 1.2% |
| American Water Works Co., Inc. | 1.1% |
| Cardinal Health, Inc. | 1.1% |
| McKesson Corp. | 1.1% |
| Fidelity National Information Services, Inc. | 1.1% |
| CME Group, Inc. | 1.1% |
| O'Reilly Automotive, Inc. | 1.1% |
| Centene Corp. | 1.1% |
Asset Allocation
Sector Allocation
Top Ten Holdings
| HCA Healthcare, Inc. | 1.2% |
| Cencora, Inc. | 1.2% |
| AutoZone, Inc. | 1.2% |
| American Water Works Co., Inc. | 1.1% |
| Cardinal Health, Inc. | 1.1% |
| McKesson Corp. | 1.1% |
| Fidelity National Information Services, Inc. | 1.1% |
| CME Group, Inc. | 1.1% |
| O'Reilly Automotive, Inc. | 1.1% |
| Centene Corp. | 1.1% |
Material Fund Changes
At the close of business day on April 4, 2025, the Fund was reorganized into the Stance Sustainable Beta ETF, a series of EA Series Trust. The reorganization provided for the transfer of assets and the assumption of the liabilities of the Fund to Stance Sustainable Beta ETF.
This is a summary of certain changes to the Fund since April 1, 2024. For more complete information, you may review the Fund's prospectus, which is dated April 7, 2025 at https://stancefunds.com/chgx.
Changes in and Disagreements with Accountants
There were no changes in or disagreements with the Fund's accountants during the reporting period.
Fund Expenses
(Based on a hypothetical $10,000 investment)
| Fund (Class) | Costs of a $10,000 investment | Costs paid as a percentage of a $10,000 investment |
| AXS Green Alpha ETF (NXTE) |
$95 | 1.00% |
Management's Discussion of Fund Performance
SUMMARY OF RESULTS
For the 12-month period ended March 31, 2025, the AXS Green Alpha ETF (NXTE) generated a total return of -9.62%. The Fund primarily invested in common stocks and American Depository Receipts ("ADRs").
TOP PERFORMANCE CONTRIBUTORS
Consumer Staples | Although Consumer Staples companies experienced volatility during the period, the Fund's selections in this sector contributed positively with a 5.50% contribution to Fund returns. These holdings had a significant total return of 99.97%.
Consumer Discretionary | The Fund's holdings in the Consumer Discretionary sector were the top contributor to performance during the period, adding 2.05% to Fund returns. Companies in this sector demonstrated strong performance with a total return of 32.24%.
Sprouts Farmers Market | The Fund's position in Sprouts Farmers Market provided the best individual contribution to NXTE's performance over the 1-year period, contributing +3.17% contribution to Fund returns, on a total return of +136.72%.
TOP PERFORMANCE DETRACTORS
Health Care | The Fund's exposure to Health Care companies was the largest detractor from performance, negatively impacting Fund returns by -9.47%. Health Care holdings experienced significant challenges, resulting in a total return of -62.08%.
Energy | Investments in the Energy sector detracted -3.86% from the Fund's returns. These holdings faced headwinds from market volatility and sector-specific challenges, generating a total return of -38.98%.
CRISPR Therapeutics, AG | The Fund's position in CRISPR Therapeutics, AG, provided the worst individual contribution to NXTE's performance over the 1-year period detracting -2.59%, on a total return of -50.07%.
Data as of 3/31/2025, Bloomberg.
Fund Performance
The following graph and chart compare the initial and subsequent account values at the end of each of the most recently completed 10 fiscal years of the Fund or for the life of the Fund, if shorter. It assumes a $10,000 initial investment at the beginning of the first fiscal year in an appropriate, broad-based securities market index for the same period.
GROWTH OF $10,000
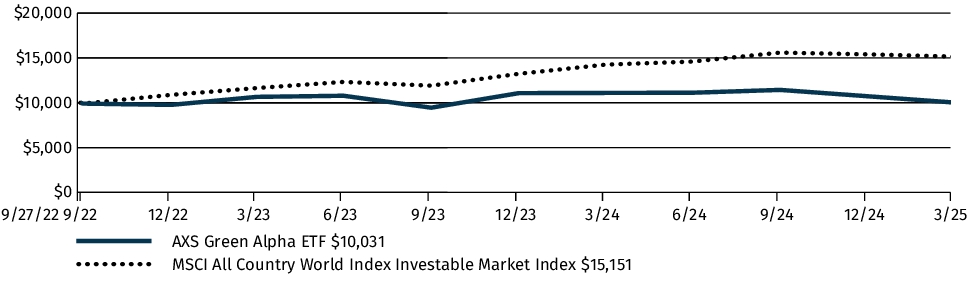
| AVERAGE ANNUAL TOTAL RETURN | 1 Year | Since Inception1 |
| AXS Green Alpha ETF (NXTE) | -9.62% | 0.13% |
| MSCI All Country World Index Investable Market Index | 6.30% | 18.03% |
|
1
|
The Fund commenced operations on September 27, 2022.
|
The graph and table do not reflect the deduction of taxes that a shareholder would pay on Fund distributions or redemption of Fund shares.
Visit www.axsinvestments.com/nxte-data/ for the most recent performance information.
Key Fund Statistics
The following table outlines key fund statistics that you should pay attention to.
| Fund net assets | $40,352,885 |
| Total number of portfolio holdings | 58 |
| Total advisory fees paid (net) | $490,608 |
| Portfolio turnover rate as of the end of the reporting period | 10% |
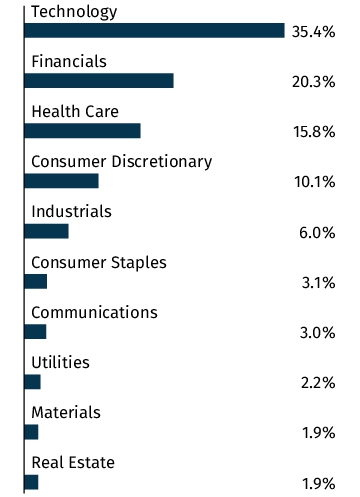
Graphical Representation of Holdings
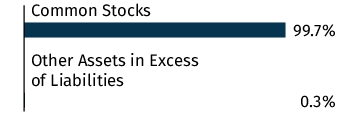
The tables below show the investment makeup of the Fund, representing percentage of the total net assets of the Fund. The Top Ten Holdings and Sector Allocation exclude short-term holdings, if any. The Sector Allocation chart represents Common Stocks or Preferred Stocks of the Fund.
Top Ten Holdings
| Taiwan Semiconductor Manufacturing Co., Ltd. - ADR | 7.3% |
| International Business Machines Corp. | 6.7% |
| Sprouts Farmers Market, Inc. | 5.0% |
| Applied Materials, Inc. | 4.2% |
| Natural Grocers by Vitamin Cottage, Inc. | 4.1% |
| ASML Holding N.V. | 3.9% |
| Lam Research Corp. | 3.9% |
| QUALCOMM, Inc. | 3.8% |
| Contemporary Amperex Technology Co., Ltd. - Class A | 3.0% |
| Digital Realty Trust, Inc. | 2.8% |
Asset Allocation
Sector Allocation
Top Ten Holdings
| Taiwan Semiconductor Manufacturing Co., Ltd. - ADR | 7.3% |
| International Business Machines Corp. | 6.7% |
| Sprouts Farmers Market, Inc. | 5.0% |
| Applied Materials, Inc. | 4.2% |
| Natural Grocers by Vitamin Cottage, Inc. | 4.1% |
| ASML Holding N.V. | 3.9% |
| Lam Research Corp. | 3.9% |
| QUALCOMM, Inc. | 3.8% |
| Contemporary Amperex Technology Co., Ltd. - Class A | 3.0% |
| Digital Realty Trust, Inc. | 2.8% |
Material Fund Changes
The Fund did not have any material changes that occurred since the beginning of the reporting period.
Changes in and Disagreements with Accountants
There were no changes in or disagreements with the Fund's accountants during the reporting period.
Fund Expenses
(Based on a hypothetical $10,000 investment)
| Fund (Class) | Costs of a $10,000 investment | Costs paid as a percentage of a $10,000 investment |
| AXS Esoterica NextG Economy ETF (WUGI) |
$79 | 0.75% |
Management's Discussion of Fund Performance
SUMMARY OF RESULTS
For the 12-month period ended March 31, 2025, the Fund had positive performance +10.09%. The Fund primarily invested in the technology sector such as semiconductors, software and Internet, etc.
TOP PERFORMANCE CONTRIBUTORS
Contributor #1: NVIDIA Corp, contributed 11.78%. The company benefited from strong demand of GPU as AI development has been taking shape globally.
Contributor #2: Meituan, contributed 1.06%. The recovery of China’s Internet sector lifted the business performance.
Contributor #3: KE Holdings, contributed 1.04%. The recovery of China’s Internet sector lifted the business performance.
TOP PERFORMANCE DETRACTORS
Detractor #1: ASML Holding, detracted 1.53%. Suffered from demand loss due to Intel’s restructuring.
Detractor #2: AMD, detracted 1.31%. The company failed to keep up with the competition in the GPU market.
Detractor #3: Synopsys Inc, detracted 1.22%. Suffered from demand loss due to Intel’s restructuring.
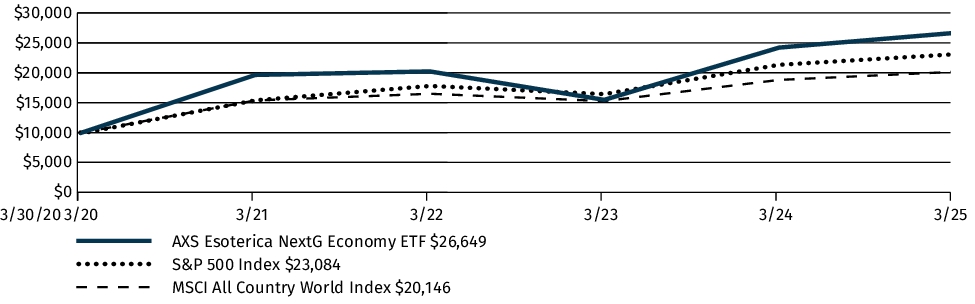
Fund Performance
The following graph and chart compare the initial and subsequent account values at the end of each of the most recently completed 10 fiscal years of the Fund or for the life of the Fund, if shorter. It assumes a $10,000 initial investment at the beginning of the first fiscal year in an appropriate, broad-based securities market index for the same period.
GROWTH OF $10,000
| AVERAGE ANNUAL TOTAL RETURN | 1 Year | 5 Years | Since Inception1 |
| AXS Esoterica NextG Economy ETF (WUGI) | 10.09% | 21.80% | 21.64% |
| 8.25% | 18.59% | 18.20% | |
| MSCI All Country World Index | 7.15% | 15.18% | 15.03% |
|
1
|
The Fund commenced operations on March 30, 2020.
|
The graph and table do not reflect the deduction of taxes that a shareholder would pay on Fund distributions or redemption of Fund shares.
Visit www.axsinvestments.com/wugi-data/ for the most recent performance information.
Key Fund Statistics
The following table outlines key fund statistics that you should pay attention to.
| Fund net assets | $31,211,587 |
| Total number of portfolio holdings | 31 |
| Total advisory fees paid (net) | $55,394 |
| Portfolio turnover rate as of the end of the reporting period | 98% |
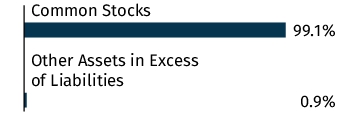
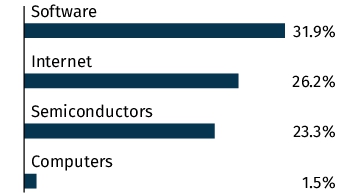
Graphical Representation of Holdings
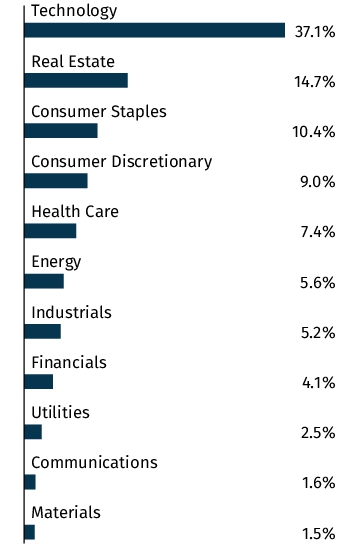
The tables below show the investment makeup of the Fund, representing percentage of the total net assets of the Fund. The Top Ten Holdings and Industry Allocation exclude short-term holdings, if any. The Industry Allocation chart represents Common Stocks of the Fund.
Top Ten Holdings
| Meta Platforms, Inc. - Class A | 12.7% |
| Taiwan Semiconductor Manufacturing Co., Ltd. - ADR | 8.6% |
| Amazon.com, Inc. | 8.5% |
| Broadcom, Inc. | 7.6% |
| Salesforce, Inc. | 5.8% |
| Synopsys, Inc. | 5.2% |
| NVIDIA Corp. | 4.4% |
| Snowflake, Inc. - Class A | 3.7% |
| Direxion Daily FTSE China Bull 3X Shares | 3.7% |
| KraneShares CSI China Internet ETF | 3.5% |
Asset Allocation

Industry Allocation
Top Ten Holdings
| Meta Platforms, Inc. - Class A | 12.7% |
| Taiwan Semiconductor Manufacturing Co., Ltd. - ADR | 8.6% |
| Amazon.com, Inc. | 8.5% |
| Broadcom, Inc. | 7.6% |
| Salesforce, Inc. | 5.8% |
| Synopsys, Inc. | 5.2% |
| NVIDIA Corp. | 4.4% |
| Snowflake, Inc. - Class A | 3.7% |
| Direxion Daily FTSE China Bull 3X Shares | 3.7% |
| KraneShares CSI China Internet ETF | 3.5% |
Material Fund Changes
The Fund did not have any material changes that occurred since the beginning of the reporting period.
Changes in and Disagreements with Accountants
There were no changes in or disagreements with the Fund's accountants during the reporting period.
This report describes changes to the Fund that occurred during the reporting period.
Fund Expenses
(Based on a hypothetical $10,000 investment)
| Fund (Class) | Costs of a $10,000 investment | Costs paid as a percentage of a $10,000 investment |
| AXS Knowledge Leaders ETF (KNO)1 |
$79 | 0.84%2 |
| 1 |
Fiscal year changed to March 31, effective August 1, 2024. Expenses would have been higher for a full fiscal year.
|
| 2 |
Annualized.
|
Management's Discussion of Fund Performance
SUMMARY OF RESULTS
Over the last year, the AXS Knowledge Leaders ETF was up 0.51% based on market return. The fund invests primarily in mid-large cap stocks in Developed World.
TOP PERFORMANCE CONTRIBUTORS
-Sanwa: contributed 1.00%
-Recruit Holdings: contributed 0.57%
-NS Solutions: contributed 0.47%
TOP PERFORMANCE DETRACTORS
-Dassault Systemes: subtracted 0.65%
-Scree Holdings: subtracted 0.53%
-Amazon: subtracted 0.46%
Asset Allocation Contributions
From an asset allocation perspective, the following sectors contributed the most positively to performance: 1) Consumer Discretionary (+0.87%), 2) Energy (+0.48%). The following two sectors contributed subtracted the most from performance: 1) Financials (-1.25%) and 2) Materials (-1.12%).
From a country perspective, the biggest contributors were: 1) France (0.22%) and 2) Denmark (0.21%). The biggest detractors were: 1) United States (-1.49%) and 2) Sweden (-0.33%).
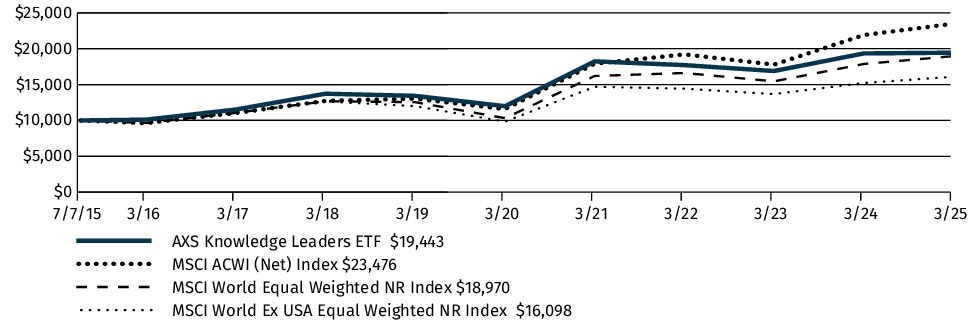
Fund Performance
The following graph and chart compare the initial and subsequent account values at the end of each of the most recently completed 10 fiscal years of the Fund or for the life of the Fund, if shorter. It assumes a $10,000 initial investment at the beginning of the first fiscal year in an appropriate, broad-based securities market index for the same period.
GROWTH OF $10,000
| AVERAGE ANNUAL TOTAL RETURN | 1 Year | 5 Years | Since Inception1 |
| AXS Knowledge Leaders ETF (KNO) | 0.51% | 10.15% | 7.07% |
| MSCI ACWI (Net) Index | 7.15% | 15.18% | 9.16% |
| MSCI World Equal Weighted NR Index | 5.30% | 12.76% | 6.71% |
| MSCI World Ex USA Equal Weighted NR Index | 5.74% | 10.35% | 5.01% |
|
1
|
The Fund commenced operations on July 7, 2015.
|
The graph and table do not reflect the deduction of taxes that a shareholder would pay on Fund distributions or redemption of Fund shares.
Visit https://www.axsinvestments.com/kno/#performance-section for the most recent performance information.
Key Fund Statistics
The following table outlines key fund statistics that you should pay attention to.
| Fund net assets | $53,116,125 |
| Total number of portfolio holdings | 73 |
| Total advisory fees paid (net) | $793,321 |
| Portfolio turnover rate as of the end of the reporting period | 159% |
Graphical Representation of Holdings
The tables below show the investment makeup of the Fund, representing percentage of the total net assets of the Fund. The Top Ten Holdings exclude short-term holdings, if any. The Sector Allocation chart represents Common Stocks of the Fund.
Top Ten Holdings
| Garmin Ltd. | 3.2% |
| Stryker Corp. | 3.0% |
| Boston Scientific Corp. | 3.0% |
| Constellation Software, Inc./Canada | 3.0% |
| TE Connectivity PLC | 3.0% |
| Trane Technologies PLC | 2.9% |
| Labcorp Holdings, Inc. | 2.7% |
| CNH Industrial N.V. | 2.6% |
| Micron Technology, Inc. | 2.6% |
| GE HealthCare Technologies, Inc. | 2.6% |
Asset Allocation
Sector Allocation
Top Ten Holdings
| Garmin Ltd. | 3.2% |
| Stryker Corp. | 3.0% |
| Boston Scientific Corp. | 3.0% |
| Constellation Software, Inc./Canada | 3.0% |
| TE Connectivity PLC | 3.0% |
| Trane Technologies PLC | 2.9% |
| Labcorp Holdings, Inc. | 2.7% |
| CNH Industrial N.V. | 2.6% |
| Micron Technology, Inc. | 2.6% |
| GE HealthCare Technologies, Inc. | 2.6% |
Material Fund Changes
At the close of business on July 19, 2024, the Knowledge Leaders Developed World ETF was reorganized into the AXS Knowledge Leaders ETF. The reorganization provided for the transfer of assets and the assumption of the liabilities of the Knowledge Leaders Developed World ETF to the Fund. Fiscal year end changed to March 31, effective August 1, 2024.
This is a summary of certain changes to the Fund since May 1, 2024.For more complete information, you may review the Fund's prospectus, which is dated July 31, 2024, as amended August 13, 2024 at www.axsinvestments.com/kno/#fundliterature.
Changes in and Disagreements with Accountants
There were no changes in or disagreements with the Fund's accountants during the reporting period.
| [1] | Fiscal year changed to March 31, effective August 1, 2024. Expenses would have been higher for a full fiscal year. |
| [2] | Annualized. |