Shareholder Report
Mar. 31, 2025
USD ($)
Holding
Fund Expenses
(Based on a hypothetical $10,000 investment)
| Fund (Ticker) | Costs of a $10,000 investment | Costs paid as a percentage of a $10,000 investment |
||
| AXS Chesapeake Strategy Fund (Class I/EQCHX) |
$88 | 1.85%1 |
|
1
|
Annualized.
|
Key Fund Statistics
The following table outlines key fund statistics that you should pay attention to.
| Fund net assets | $25,448,940 |
| Total number of portfolio holdings | 73 |
| Portfolio turnover rate as of the end of the reporting period | 0% |
Graphical Representation of Holdings
The tables below show the investment makeup of the Fund, representing percentage of the total net assets of the Fund.
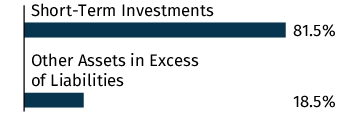
Asset Allocation
Changes in and Disagreements with Accountants
There were no changes in or disagreements with the Fund's accountants during the reporting period.
Fund Expenses
(Based on a hypothetical $10,000 investment)
| Fund (Ticker) | Costs of a $10,000 investment | Costs paid as a percentage of a $10,000 investment |
||
| AXS FTSE Venture Capital Return Tracker Fund (Class A/LDVAX) |
$87 | 1.77%1 |
|
1
|
Annualized.
|
Key Fund Statistics
The following table outlines key fund statistics that you should pay attention to.
| Fund net assets | $85,951,608 |
| Total number of portfolio holdings | 145 |
| Portfolio turnover rate as of the end of the reporting period | 13% |
Graphical Representation of Holdings
The tables below show the investment makeup of the Fund, representing percentage of the total net assets of the Fund. The Top Ten Holdings exclude short-term holdings, if any. The Sector Allocation chart represents Common Stocks of the Fund.
Top Ten Holdings
| Visa, Inc. - Class A | 4.9% |
| Netflix, Inc. | 4.8% |
| Mastercard, Inc. - Class A | 4.8% |
| Microsoft Corp. | 4.8% |
| Alphabet, Inc. - Class A | 4.6% |
| Meta Platforms, Inc. - Class A | 4.3% |
| Salesforce, Inc. | 3.8% |
| Berkshire Hathaway, Inc. - Class B | 3.8% |
| Oracle Corp. | 3.6% |
| International Business Machines Corp. | 3.4% |
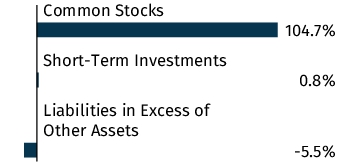
Asset Allocation
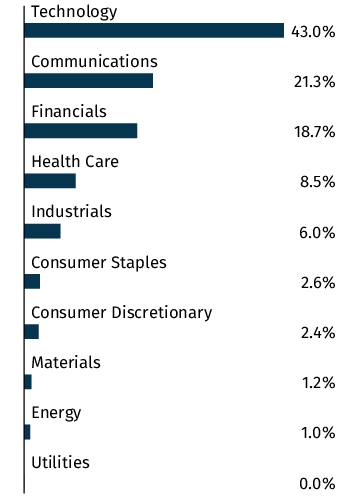
Sector Allocation

Top Ten Holdings
| Visa, Inc. - Class A | 4.9% |
| Netflix, Inc. | 4.8% |
| Mastercard, Inc. - Class A | 4.8% |
| Microsoft Corp. | 4.8% |
| Alphabet, Inc. - Class A | 4.6% |
| Meta Platforms, Inc. - Class A | 4.3% |
| Salesforce, Inc. | 3.8% |
| Berkshire Hathaway, Inc. - Class B | 3.8% |
| Oracle Corp. | 3.6% |
| International Business Machines Corp. | 3.4% |
Changes in and Disagreements with Accountants
There were no changes in or disagreements with the Fund's accountants during the reporting period.
Fund Expenses
(Based on a hypothetical $10,000 investment)
| Fund (Ticker) | Costs of a $10,000 investment | Costs paid as a percentage of a $10,000 investment |
||
| AXS FTSE Venture Capital Return Tracker Fund (Class C/LDVCX) |
$123 | 2.52%1 |
|
1
|
Annualized.
|
Key Fund Statistics
The following table outlines key fund statistics that you should pay attention to.
| Fund net assets | $85,951,608 |
| Total number of portfolio holdings | 145 |
| Portfolio turnover rate as of the end of the reporting period | 13% |
Graphical Representation of Holdings
The tables below show the investment makeup of the Fund, representing percentage of the total net assets of the Fund. The Top Ten Holdings exclude short-term holdings, if any. The Sector Allocation chart represents Common Stocks of the Fund.
Top Ten Holdings
| Visa, Inc. - Class A | 4.9% |
| Netflix, Inc. | 4.8% |
| Mastercard, Inc. - Class A | 4.8% |
| Microsoft Corp. | 4.8% |
| Alphabet, Inc. - Class A | 4.6% |
| Meta Platforms, Inc. - Class A | 4.3% |
| Salesforce, Inc. | 3.8% |
| Berkshire Hathaway, Inc. - Class B | 3.8% |
| Oracle Corp. | 3.6% |
| International Business Machines Corp. | 3.4% |
Asset Allocation

Sector Allocation
Top Ten Holdings
| Visa, Inc. - Class A | 4.9% |
| Netflix, Inc. | 4.8% |
| Mastercard, Inc. - Class A | 4.8% |
| Microsoft Corp. | 4.8% |
| Alphabet, Inc. - Class A | 4.6% |
| Meta Platforms, Inc. - Class A | 4.3% |
| Salesforce, Inc. | 3.8% |
| Berkshire Hathaway, Inc. - Class B | 3.8% |
| Oracle Corp. | 3.6% |
| International Business Machines Corp. | 3.4% |
Changes in and Disagreements with Accountants
There were no changes in or disagreements with the Fund's accountants during the reporting period.
Fund Expenses
(Based on a hypothetical $10,000 investment)
| Fund (Ticker) | Costs of a $10,000 investment | Costs paid as a percentage of a $10,000 investment |
||
| AXS FTSE Venture Capital Return Tracker Fund (Class I/LDVIX) |
$74 | 1.52%1 |
|
1
|
Annualized.
|
Key Fund Statistics
The following table outlines key fund statistics that you should pay attention to.
| Fund net assets | $85,951,608 |
| Total number of portfolio holdings | 145 |
| Portfolio turnover rate as of the end of the reporting period | 13% |
Graphical Representation of Holdings
The tables below show the investment makeup of the Fund, representing percentage of the total net assets of the Fund. The Top Ten Holdings exclude short-term holdings, if any. The Sector Allocation chart represents Common Stocks of the Fund.
Top Ten Holdings
| Visa, Inc. - Class A | 4.9% |
| Netflix, Inc. | 4.8% |
| Mastercard, Inc. - Class A | 4.8% |
| Microsoft Corp. | 4.8% |
| Alphabet, Inc. - Class A | 4.6% |
| Meta Platforms, Inc. - Class A | 4.3% |
| Salesforce, Inc. | 3.8% |
| Berkshire Hathaway, Inc. - Class B | 3.8% |
| Oracle Corp. | 3.6% |
| International Business Machines Corp. | 3.4% |
Asset Allocation

Sector Allocation

Top Ten Holdings
| Visa, Inc. - Class A | 4.9% |
| Netflix, Inc. | 4.8% |
| Mastercard, Inc. - Class A | 4.8% |
| Microsoft Corp. | 4.8% |
| Alphabet, Inc. - Class A | 4.6% |
| Meta Platforms, Inc. - Class A | 4.3% |
| Salesforce, Inc. | 3.8% |
| Berkshire Hathaway, Inc. - Class B | 3.8% |
| Oracle Corp. | 3.6% |
| International Business Machines Corp. | 3.4% |
Changes in and Disagreements with Accountants
There were no changes in or disagreements with the Fund's accountants during the reporting period.
Fund Expenses
(Based on a hypothetical $10,000 investment)
| Fund (Ticker) | Costs of a $10,000 investment | Costs paid as a percentage of a $10,000 investment |
||
| AXS Income Opportunities Fund (Class D/OIODX) |
$155 | 3.20%1 |
|
1
|
Annualized.
|
Key Fund Statistics
The following table outlines key fund statistics that you should pay attention to.
| Fund net assets | $41,648,986 |
| Total number of portfolio holdings | 8 |
| Portfolio turnover rate as of the end of the reporting period | 116% |
Graphical Representation of Holdings
The tables below show the investment makeup of the Fund, representing percentage of the total net assets of the Fund. The Top Ten Holdings exclude short-term holdings, if any.
Top Ten Holdings
| iShares Residential and Multisector Real Estate ETF | 22.2% |
| iShares Core U.S. REIT ETF | 21.9% |
| Global X Variable Rate Preferred ETF | 15.5% |
| VanEck Mortgage REIT Income ETF | 15.2% |
| Principal Spectrum Preferred Securities Active ETF | 13.2% |
| Janus Henderson AAA CLO ETF | 13.1% |
| Virtus InfraCap U.S. Preferred Stock ETF | 7.3% |
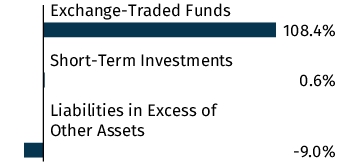
Asset Allocation

Top Ten Holdings
| iShares Residential and Multisector Real Estate ETF | 22.2% |
| iShares Core U.S. REIT ETF | 21.9% |
| Global X Variable Rate Preferred ETF | 15.5% |
| VanEck Mortgage REIT Income ETF | 15.2% |
| Principal Spectrum Preferred Securities Active ETF | 13.2% |
| Janus Henderson AAA CLO ETF | 13.1% |
| Virtus InfraCap U.S. Preferred Stock ETF | 7.3% |
Changes in and Disagreements with Accountants
There were no changes in or disagreements with the Fund's accountants during the reporting period.
Fund Expenses
(Based on a hypothetical $10,000 investment)
| Fund (Ticker) | Costs of a $10,000 investment | Costs paid as a percentage of a $10,000 investment |
||
| AXS Income Opportunities Fund (Class I/OIOIX) |
$107 | 2.20%1 |
|
1
|
Annualized.
|
Key Fund Statistics
The following table outlines key fund statistics that you should pay attention to.
| Fund net assets | $41,648,986 |
| Total number of portfolio holdings | 8 |
| Portfolio turnover rate as of the end of the reporting period | 116% |
Graphical Representation of Holdings
The tables below show the investment makeup of the Fund, representing percentage of the total net assets of the Fund. The Top Ten Holdings exclude short-term holdings, if any.
Top Ten Holdings
| iShares Residential and Multisector Real Estate ETF | 22.2% |
| iShares Core U.S. REIT ETF | 21.9% |
| Global X Variable Rate Preferred ETF | 15.5% |
| VanEck Mortgage REIT Income ETF | 15.2% |
| Principal Spectrum Preferred Securities Active ETF | 13.2% |
| Janus Henderson AAA CLO ETF | 13.1% |
| Virtus InfraCap U.S. Preferred Stock ETF | 7.3% |
Asset Allocation
Top Ten Holdings
| iShares Residential and Multisector Real Estate ETF | 22.2% |
| iShares Core U.S. REIT ETF | 21.9% |
| Global X Variable Rate Preferred ETF | 15.5% |
| VanEck Mortgage REIT Income ETF | 15.2% |
| Principal Spectrum Preferred Securities Active ETF | 13.2% |
| Janus Henderson AAA CLO ETF | 13.1% |
| Virtus InfraCap U.S. Preferred Stock ETF | 7.3% |
Changes in and Disagreements with Accountants
There were no changes in or disagreements with the Fund's accountants during the reporting period.
Fund Expenses
(Based on a hypothetical $10,000 investment)
| Fund (Ticker) | Costs of a $10,000 investment | Costs paid as a percentage of a $10,000 investment |
||
| AXS Adaptive Plus Fund (AXSPX) |
$92 | 1.99%1 |
|
1
|
Annualized.
|
Key Fund Statistics
The following table outlines key fund statistics that you should pay attention to.
| Fund net assets | $35,506,692 |
| Total number of portfolio holdings | 5 |
| Portfolio turnover rate as of the end of the reporting period | 0% |
Graphical Representation of Holdings
The tables below show the investment makeup of the Fund, representing percentage of the total net assets of the Fund. The Top Ten Holdings exclude short-term holdings, if any.
Top Ten Holdings
| United States Treasury Bill, 4/3/2025 | 28.2% |
| United States Treasury Bill, 6/12/2025 | 27.9% |
| United States Treasury Bill, 8/7/2025 | 22.2% |
| Nomura Galaxy Option -ProfitScore Regime-Adaptive Equity Index, 6/15/2025 | 21.0% |
Asset Allocation
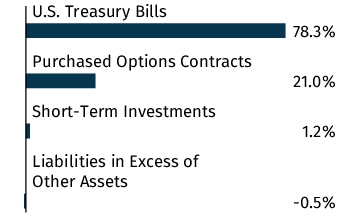
Top Ten Holdings
| United States Treasury Bill, 4/3/2025 | 28.2% |
| United States Treasury Bill, 6/12/2025 | 27.9% |
| United States Treasury Bill, 8/7/2025 | 22.2% |
| Nomura Galaxy Option -ProfitScore Regime-Adaptive Equity Index, 6/15/2025 | 21.0% |
Changes in and Disagreements with Accountants
There were no changes in or disagreements with the Fund's accountants during the reporting period.
Fund Expenses
(Based on a hypothetical $10,000 investment)
| Fund (Ticker) | Costs of a $10,000 investment | Costs paid as a percentage of a $10,000 investment |
||
| AXS Dynamic Opportunity Fund (Class I/ADOIX) |
$72 | 1.50%1 |
|
1
|
Annualized.
|
Key Fund Statistics
The following table outlines key fund statistics that you should pay attention to.
| Fund net assets | $49,237,975 |
| Total number of portfolio holdings | 33 |
| Portfolio turnover rate as of the end of the reporting period | 7% |
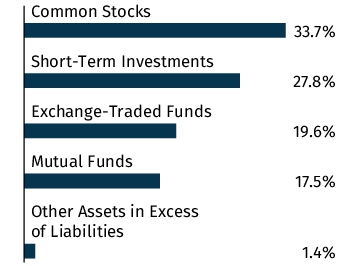
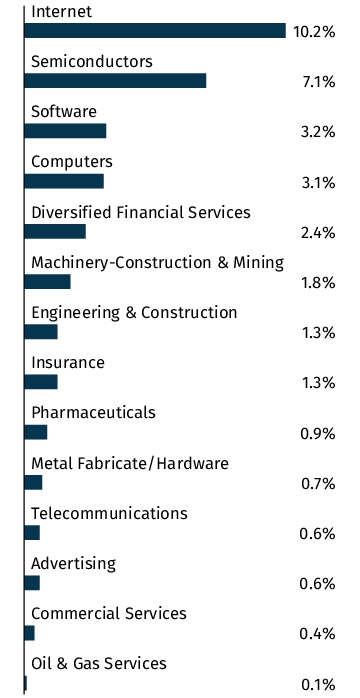
Graphical Representation of Holdings
The tables below show the investment makeup of the Fund, representing percentage of the total net assets of the Fund. The Top Ten Holdings and Industry Allocation exclude short-term holdings, if any. The Industry Allocation chart represents Common Stocks of the Fund.
Top Ten Holdings
| AXS Adaptive Plus Fund - Class I | 17.5% |
| ProShares Short S&P500 | 5.0% |
| Tradr 2X Long Triple Q Monthly ETF | 4.9% |
| Tradr 2X Long Triple Q Quarterly ETF | 4.9% |
| ProShares UltraShort S&P500 | 4.8% |
| NVIDIA Corp. | 4.4% |
| Amazon.com, Inc. | 3.3% |
| Meta Platforms, Inc. - Class A | 3.3% |
| Apple, Inc. | 2.8% |
| Microsoft Corp. | 2.7% |
Asset Allocation
Industry Allocation
Top Ten Holdings
| AXS Adaptive Plus Fund - Class I | 17.5% |
| ProShares Short S&P500 | 5.0% |
| Tradr 2X Long Triple Q Monthly ETF | 4.9% |
| Tradr 2X Long Triple Q Quarterly ETF | 4.9% |
| ProShares UltraShort S&P500 | 4.8% |
| NVIDIA Corp. | 4.4% |
| Amazon.com, Inc. | 3.3% |
| Meta Platforms, Inc. - Class A | 3.3% |
| Apple, Inc. | 2.8% |
| Microsoft Corp. | 2.7% |
Changes in and Disagreements with Accountants
There were no changes in or disagreements with the Fund's accountants during the reporting period.
Fund Expenses
(Based on a hypothetical $10,000 investment)
| Fund (Ticker) | Costs of a $10,000 investment | Costs paid as a percentage of a $10,000 investment |
||
| AXS Tactical Income Fund (Class I/TINIX) |
$84 | 1.68%1 |
|
1
|
Annualized.
|
Key Fund Statistics
The following table outlines key fund statistics that you should pay attention to.
| Fund net assets | $30,775,559 |
| Total number of portfolio holdings | 14 |
| Portfolio turnover rate as of the end of the reporting period | 116% |
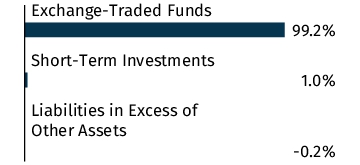
Graphical Representation of Holdings
The tables below show the investment makeup of the Fund, representing percentage of the total net assets of the Fund. The Top Ten Holdings exclude short-term holdings, if any.
Top Ten Holdings
| iShares Short Treasury Bond ETF | 22.3% |
| SPDR Bloomberg 1-3 Month T-Bill ETF | 22.3% |
| Vanguard Long-Term Corporate Bond ETF | 5.0% |
| Vanguard Emerging Markets Government Bond ETF | 5.0% |
| Vanguard Intermediate-Term Treasury ETF | 5.0% |
| Janus Henderson AAA CLO ETF | 5.0% |
| Vanguard Intermediate-Term Corporate Bond ETF | 5.0% |
| Vanguard Short-Term Inflation-Protected Securities ETF | 5.0% |
| Vanguard Mortgage-Backed Securities ETF | 5.0% |
| Vanguard Short-Term Treasury ETF | 4.9% |
Asset Allocation
Top Ten Holdings
| iShares Short Treasury Bond ETF | 22.3% |
| SPDR Bloomberg 1-3 Month T-Bill ETF | 22.3% |
| Vanguard Long-Term Corporate Bond ETF | 5.0% |
| Vanguard Emerging Markets Government Bond ETF | 5.0% |
| Vanguard Intermediate-Term Treasury ETF | 5.0% |
| Janus Henderson AAA CLO ETF | 5.0% |
| Vanguard Intermediate-Term Corporate Bond ETF | 5.0% |
| Vanguard Short-Term Inflation-Protected Securities ETF | 5.0% |
| Vanguard Mortgage-Backed Securities ETF | 5.0% |
| Vanguard Short-Term Treasury ETF | 4.9% |
Changes in and Disagreements with Accountants
There were no changes in or disagreements with the Fund's accountants during the reporting period.
| [1] | Annualized. |
| [2] | Annualized. |
| [3] | Annualized. |
| [4] | Annualized. |
| [5] | Annualized. |
| [6] | Annualized. |
| [7] | Annualized. |
| [8] | Annualized. |
| [9] | Annualized. |